Review of Intermediate Strain Rate Testing Devices
by
 , ,
, ,
Trunal Bhujangrao
1,2,* ,
,
Catherine Froustey
3, 
Edurne Iriondo
2,
Fernando Veiga
1,
Philippe Darnis
3 and
Franck Girot Mata
2,4
1
TECNALIA, Parque Científico y Tecnológico de Gipuzkoa, 20009 Donostia-San Sebastián, Spain
2
Department of Mechanical Engineering, University of the Basque Country (UPV/EHU), 48013 Bilbao, Spain
3
Institut de Mécanique et D’ngénierie (I2M), DuMAS, UMR 5295, CNRS, University of Bordeaux, F-33400 Talence, France
4
IKERBASQUE, Basque Foundation for Science, 48013 Bilbao, Spain
*
Author to whom correspondence should be addressed.
Metals 2020, 10(7), 894; https://doi.org/10.3390/met10070894
Submission received: 1 June 2020
/
Revised: 30 June 2020
/
Accepted: 2 July 2020
/
Published: 5 July 2020
(This article belongs to the Special Issue Metallic Materials and Their Applications in Aerospace and Advanced Technologies)
Abstract
:Materials undergo various loading conditions during different manufacturing processes, including varying strain rates and temperatures. Research has shown that the deformation of metals and alloys during manufacturing processes such as metal forming, machining, and friction stir welding (FSW), can reach a strain rate ranging from 10−1 to 106 s−1. Hence, studying the flow behavior of materials at different strain rates is important to understanding the material response during manufacturing processes. Experimental data for a low strain rate of <101 s−1 and a high strain rate of >103 s−1 are readily available by using traditional testing devices such as a servo-hydraulic testing machine and the split Hopkinson pressure bar method, respectively. However, for the intermediate strain rate (101 to 103 s−1), very few testing devices are available. Testing the intermediate strain rate requires a demanding test regime, in which researchers have expanded the use of special instruments. This review paper describes the development and evolution of the existing intermediate strain rate testing devices. They are divided based on the loading mechanism; it includes the high-speed servo-hydraulic testing machines, hybrid testing apparatus, the drop tower, and the flywheel machine. A general description of the testing device is systematically reviewed; which includes the working principles, some critical theories, technological innovation in load measurement techniques, components of the device, basic technical assumption, and measuring techniques. In addition, some research direction on future implementation and development of an intermediate strain rate apparatus is also discussed in detail.
1. Introduction
Studying the mechanical behavior of materials in manufacturing processes at different strain rates and temperatures is very important for researchers to develop predictive material behavior models. An overview of typical strains, strain rates, and temperatures found in manufacturing processes is given in Table 1. The table reveals that in commonly used manufacturing techniques, such as machining, forging, forming, and friction stir welding (FSW) [1,2,3], the materials are deformed differently under different conditions. In addition, the microstructure of the material is significantly affected by the thermomechanical constraints and is difficult to access experimentally. For example, during manufacturing processes, the strain rates are in the order of 10−1 to 106 s−1, while the those obtained in conventional testing machines are in the order of 10−3 to 101 s−1. Hence, the predictability of any material model largely depends on the accuracy of the material parameters obtained for the constitutive model from experimental tests [4].
Many different testing devices have been developed over the years, depending on the type of material and the property to be determined, some of which have become standards in industrial practice. The experimental procedure usually consists of submitting a specimen to different loading conditions and measuring the applied force and specimen deformation. Some examples of this type of experiment are tensile, compression, shear, punch, and bulge tests. When the material behavior is more complex, and several parameters (e.g., strain rate, temperature, and strain) must be identified for material modelling, the characterization becomes more difficult, and multiple tests have to be used.
Many researchers have carried out the experimental tests at various strain rate conditions and found that the material exhibits an increased yield strength and flow stress with increased strain rate [6,7,8,9,10,11,12], the existing material models developed by the researchers cannot predict, very accurately, the microstructure changes that are taking place during the manufacturing processes [13,14]. During heat deformation, the material undergoes dynamic strain-hardening and dynamic softening (consisting of dynamic recovery (DRV) and dynamic recrystallization (DRX)), resulting in the evolution of the complex microstructure of the deformed material which is directly reflected in the flow stress curves [15]. At the beginning of straining, there is an increase in the work hardening due to dislocation generation and accumulation. As the deformation continues, part of the stored energy is released with the dislocation annihilation, in which the microstructure and the properties of the material can be partially restored to their original values, called dynamic recovery. Further increase of strain leads to the formation of the new grains called dynamic recrystallization. This behavior of the material is greatly affected by the temperature and strain rate. The higher the temperature of deformation and the lower the strain rate, the larger the sub grains that are formed during high-temperature deformation. As they increase in size, the sub grains contain fewer dislocations and enters a steady-state given by the dynamic equilibrium of storage and recovery of defects. It means the material experiences a lesser strain hardening effect. At low strain rate domain (i.e., <0.1 s−1), DRX is mainly governed by the higher growth of DRX grains due to longer (deformation) time available for the grain boundary migration. As a result, a larger DRX grain size is obtained. At high strain rate domain (i.e., >1 s−1), DRX is mainly governed by the higher nucleation due to combining effects of higher stored energy, adiabatic heating, and limited (deformation) time for grain boundary migration. As a result, finer grain size is obtained. Hence it is important to study the behavior of material at different strain rates. The complete overview on the effect of the strain rate on the microstructure behavior of the material is given by the McQueen [16]. A complete description of all of these phenomena in a single constitutive model is an extremely difficult task. Thus, more experimental tests are required with different engineering parameters and test environments to study the behavior of materials over the wide range of strain rates, from quasi-static to high.
The existing commercial and traditional testing devices are mainly divided based on the speed of loading (or at various strain rates) from low to high. Table 2 provides a representation of the range of applicable strain rates covered by existing test machines, including types of loading, such as tension, compression, and shear.
Among the three strain rate divisions in Table 2, conventional load frame and standard servo-hydraulic testing machines [17,18,19,20] are generally used for quasi-static strain rates in the range of ≤101 s−1 with different load conditions. These tests are called quasi-static because the specimen and the test machine are in static equilibrium during the test. For high strain rate testing >103 s−1, the split Hopkinson pressure bar (SHPB) method [21,22] is often used. In the last decade, many proven experimental techniques have been developed for high strain rate testing, e.g., compression loading, drop weight [23], SHPB [24], and gas guns [25] are regularly used. For tensile loading, the split Hopkinson tension bar (SHTB) [26,27,28], flyer plate impact test [29], and the expansion ring [30] are used. For torsion experiments, the torsional split Hopkinson bar (TSHB) with different loading mechanisms such as pre-stored energy loading [31], explosive loading [32], direct impact loading [33], and electromagnetic loading [34] are generally used. However, tests at an intermediate strain rate in the range of 101 to 103 s−1 are not very common, and neither servo-hydraulic machines nor SHB techniques are suitable for testing with an intermediate strain rate regime.
Numerous methods have been introduced to bridge the gap between quasi-static and high strain rate testing in order to provide experimental data for engineering materials. Servo-hydraulic machines were considered as a solution to perform tests with an intermediate strain rate regime. The results of such tests, however, are not very accurate. The problem is that during the experiment, stress–strain data are influenced by the effect of high inertia, and records obtained from such machines are often noisy with large oscillations. As a result, servo-hydraulic machines only give reliable measurements at strain rates below 10 s−1.
After the development of the split Hopkinson bar technique [22] in 1949, a few researchers tried to modify classical dynamic split Hopkinson pressure bar device to achieve a deformation rate in the intermediate rate regime by increasing the loading time [35]. However, the main drawback of the modified device is that the duration of the test is limited to the length of the bars [36]. Such a duration does not allow the significant strain to be accumulated in the specimen at medium strain rates. Therefore, an alternative loading technique is required. Over the last decade, some researchers have developed specialized test machines capable of performing intermediate strain rate tests to study material characterization, such as special commercial machines designed by Instron, Shimadzu, etc. [37,38]; elastic-bar-type systems (ISO 26203-1: 2018) [39], modified servo-hydraulic load frames (ISO 26203-2:2011) [40], hybrid testing apparatus [41], drop tower [42], flywheel device [43], and flywheel wedge [44].
The material response at intermediate strain rates is of great interest to the automotive industry and producers of electronic packaging [45,46]. Additionally, intermediate strain rates have been recognized as being important in the transitioning of material response and changing of the material deformation mechanism from low to high strain rates [47,48]. Therefore, in the past decade, the material response at intermediate strain rates has attracted more attention. In addition, material properties at intermediate strain rates are rarely characterized due to experimental difficulties, leaving a significant gap in the experimental data between low and high strain rates for high-fidelity strain rate dependent material model development. Therefore, a comprehensive review is required for research leading to a better understanding of the intermediate strain rate test device.
This review paper is organized into six sections, the first being the introduction. Section 2 briefly discusses the development of the existing intermediate strain rate testing devices based on the loading mechanism; it includes the high-speed servo-hydraulic testing machines, hybrid testing apparatus, the drop tower, and the flywheel device in conjunction with various load measurement techniques such as piezoelectric load cell and the Hopkinson bar technique. Section 3 describes the improvement in the existing testing device based on a modification in the Hopkinson bar system and load measuring techniques. Section 4 provides a general description of the test device, comprising the requirements for its components, the basic technical assumption, and the specimen geometry. Section 5 deals with the shortcomings of existing machines, for example, in high-temperature and shear load testing. Finally, conclusions are given in Section 6.
2. Existing Intermediate Strain Rate Testing Devices
2.1. High Speed Servo-Hydraulic Machines
Over the past decade, the experts from various industries such as Instron, MTS, Shimadzu, and Zwick/Roell have developed a new family of high-speed servo hydraulic testing machines specifically designed to cope with the dynamics of intermediate strain rate testing [37,38,49,50], and after these devices are used in a number of applications to predict material behavior, for instance; in the landing gear on aircraft or the crash impact of a road vehicle, all of these examples involve one or more components of a product that are subjected to intermediate strain rate impact <103 s−1.
High-speed servo hydraulic machines are used for all kinds of impact loadings like dynamic tension, compression, bending, and shear loading. The most important high-speed test mode is the tension test. For example, Figure 1 shows the schematic diagram of the high-speed testing machine [51]. The stroke speed is controlled by the opening and closing of the servo-valve of hydraulic supply. The test machine can deliver a speed range from 1 mm/s to 20 m/s.
The strain rate data obtained from this machine is from quasi-static to intermediate strain rates. Dynamic load is introduced to the lower grip through a slack adaptor that consists of a hollow tube and a sliding bar with a conical tip. When the machine is actuated, the hollow tube travels freely with the actuator over a distance to reach a specified velocity before making contact with the cone-shaped end of the sliding bar that is connected to the lower grip. The slack adaptor eliminates the inertia effect of the lower grip and actuator in its acceleration stage. However, the sudden engagement with the upper portion of the setup generates a high amplitude stress wave, causing oscillations at the system’s natural frequency, i.e., system ringing [52]. A conventional piezoelectric load cell installed in the machine shows the vibration and oscillating signals. See Figure 1. At strain rates above 50 s−1 these systems become unreasonably difficult to acquire load data. Therefore, experimentalists are forced to use smoothing or filtering the load test data by using low-pass filters, averaging or other algorithms (e.g., power-law function) [53,54], or the single degree of freedom (SDOF) model (spring mass damping model) [51]. However, the accuracy of such filtering procedures, to a great extent, depends on the user’s choice of the filtering algorithm. It also includes a risk of losing some important characteristics with respect to the hardening behavior of the tested material.
2.2. Hybrid Testing Apparatus
In 1996, LeBlanc et al. [41] designed and introduced a unique hybrid testing apparatus to perform intermediate strain rate tests in order to improve the load measuring data that observed in the high-speed servo hydraulic machines. This device was developed by combining a servo-hydraulic machine with the split Hopkinson bar technique. The apparatus combines the loading capabilities of a servo-hydraulic testing machine and the load measuring technique of a Hopkinson bar. The bar is freely suspended against the specimen. When the specimen is compressed or elongated against the bar, the loading of the specimen is transmitted to the bar at the elastic wave velocity. The load in the bar is determined from strain gauges located close to the loading end; the measurement is free of disturbance until the reflected wave reaches the gage and interferes with the loading wave. The stress in the test specimen is assumed to be uniaxial and can be calculated using the elastic wave analysis of the Hopkinson bar.
The experimental test was carried out by Othman [55], using a standard servo-hydraulic machine MTS 819 (MTS Systems Corporation, Eden Prairie, MN, USA) with a maximum speed of 16 m/s, and the sample was loaded in tension as shown in Figure 2a. A long steel bar with a length of 820 mm is attached to the upper crosshead of the machine. The strain gages are connected to the bar. These gage positions allow a good deconvolution of the signals. The specimen is attached to the bar and to the lower crosshead. The high-speed video camera is fixed in order to capture the displacement field using the digital image correlation (DIC) technique [56,57].
The load records are captured by using piezoelectric load sensor (PCB Piezotronics, Depew, NY, USA) and Hopkinson bar technique and the stress–strain curves are compared from both techniques shown in Figure 2b. The stress curve recorded by using a piezoelectric load sensor shows large oscillations compared to the Hopkinson bar technique. The oscillations are caused by stress waves propagating through the piezoelectric load sensor including reflected waves. The stress waves also impinge upon the test specimen, as evidenced by the very small magnitude oscillations in the Hopkinson bar output shown in Figure 2b. Therefore, it is apparent from these tests that the hybrid test technique significantly improves the quality of stress–strain test data in comparison with the traditional piezoelectric load cell. This new Hopkinson bar technique to measure the load shows a less oscillating behavior at an intermediate strain rate around 102 s−1.
The advantage of a hybrid testing apparatus is that it applies a continuous loading during the test, which gives more reliable stress–strain data. The load is directly derived from using the strain gage attached to the bar. However, the loading time of the test was only 1ms due to the specific length of the bar, and this time duration does not allow enough strain in specimen. Furthermore, Othman et al. [55] modified the hybrid testing apparatus to improve the load measuring technique, by increasing longer time duration and to perform test at various strain rate regime by using the “wave separation method” [58,59]. A detailed explanation of this method is given in Section 3.2.
2.3. Drop Tower
A drop tower apparatus [60,61] is typically used to study the crushing and collapsing behavior of the material by dropping a mass on a structural component. It is mainly used to perform the test at medium strain rates. In recent years, very little effort has been made to develop special apparatus and devices that will allow drop towers to perform tests under various loads using accurate load measurement techniques such as the special piezoelectric load cell and Hopkinson bar technique [62,63]. In 2018, a new tensile testing device, the “Dropkinson” bar, inspired by the drop tower, was developed by Bo Song and his collaborators [42], which is capable of testing at an intermediate strain rate shown in Figure 3. Unlike the other devices explained above, the Dropkinson bar system is the same hybrid test rig.
The loading mechanism of the Dropkinson bar combines a drop table and a Hopkinson bar; it generates stable and durable impact velocity and facilitates deformation in the specimen at a constant strain rate. A long Hopkinson bar system was used to measure the load history to reduce the effect of inertia in the system. The Hopkinson bar is fixed parallel to the drop table. The drop table is used to generate a free fall impact of the trolley, as shown in Figure 3. A cylindrical steel impactor attached to the bottom of a carriage strikes the center of the impact plate during the test.
The guided rods are situated in the impact plate to ensure uniaxial travel of the drop table. A plastic bumper is installed on the bottom of the impact plate to absorb the momentum. One end of the specimen is fixed to the impact plate adapter, and the other to the Hopkinson bar, as shown in Figure 3. Two strain gauges are attached to the bar to measure the load history. After the free fall of the carriage, the impactor attached to the bottom of the carriage hits the impact plate at the center. The impact plate transfers the impact load to the tensile specimen in dynamic tension. The tensile stress wave transmits into the vertical bar through the specimen and bar end. The strain gauges attached to the bar, record the load history of the specimen. Furthermore, a custom laser extensometer is used to calculate the specimen strain. The strain rate obtained using the Dropkinson bar is up to 600 s−1 with a loading time of 0.5 ms, producing a strain of 0.27. A newly developed Dropkinson bar has shown reliable results. However, there is a significant amount of ringing noise; it may alter the force and strain signals due to the impact between the impactor and the moving metallic carriage.
2.4. Flywheel Device
The flywheel device is a dynamic testing apparatus designed by researchers to perform the test at intermediate and higher strain rates. In this rotary type of testing machine, the kinetic energy of the rotating flywheel is used to fracture specimens at different strain rates. The loading speed (mean strain rate) depends on the speed of the flywheel. The machine uses the kinetic energy stored in the flywheel to deform the specimen rapidly.
Manjoine et al. [64] and Quinlan et al. [65] carried out dynamic tensile tests on various metallic materials using a flywheel device at strain rates up to 1000 s−1. Load and deformation were measured using optical technologies, incorporating a piezoelectric load sensor. This apparatus is designed to perform tests at elevated temperatures. A new flywheel tensile testing device was developed at the Institute of Mechanics and Engineering, Bordeaux, derived from the Charpy pendulum system; its working principle was well described by Froustey [43]. This dynamic device allows the test to be performed at medium strain rates in the range of ε̇ ∈ [102, 103] s−1, which lies between the values obtained with servo-hydraulic machines and SHPB. The flywheel is a shock generator machine. The wheel has a large dimension (1 m diameter) and mass (620 kg) and is equipped with a hammer on its circumference, as shown in Figure 4.
The flywheel rotates freely until it reaches the selected speed, ranging from 1 to 40 m/s. The specimen is connected to the long Hopkinson bar pendulum system with an anvil fixed to one end. Once the required speed of the flywheel device is reached, the pendulum system is lowered. The hammer comes to strike the anvil, and the specimen is then strained, as shown in Figure 5.
The load is measured by using Hopkinson bar techniques. With eight strain gauges attached to the bar and mounted in a full Wheatstone bridge. The impact wave is completely transmitted from the specimen to the bar without any reflected pulse reloading. The time duration of the test is less than 1.3 ms. A high-speed camera is also attached to the flywheel device to measure the displacement field of the specimen. The strain rate achieved in this testing is around 300 s−1. This technique is very reliable in that the loading mechanism is able to perform a constant rate of deformation.
In 2007, Viot [66,67] designed a new compression module on the same flywheel device as explained above in order to provide mechanical data under compression loading. The compression setup is shown in Figure 6. This device was specially designed to perform tests on foam material. The working principle is explained in [66]. When the required flywheel velocity is reached, the pneumatic jack is triggered, which pushes the anvil against the wheel. The anvil is then struck by the hammer (see point A, Figure 6). The impact rotates the lever and moves the bar BC (length of buckling bar); hence, the lower punch, moving upward vertically, compresses the specimen.
The force sensor is placed above the upper punch to measure the compressive force. The deformation of the specimen is derived from a laser displacement sensor. This compressive module is designed to perform tests up to 102 s−1. However, the flywheel compressive apparatus has some disadvantages. The loading method used in this setup generates a shock wave, which has a significant effect on the load measurements. In addition, the compression module is not suitable for high-strength metals and alloys.
3. Technological Improvements in Existing Testing Devices
The existing test devices explained in Section 2 combine the load capacities of a servo-hydraulic actuator, a drop tower, and a flywheel machine in conjunction with a load measurement technique, such as the piezoelectric load cell and Hopkinson bar technique. However, the piezoelectric load cell shows the greatest vibration and oscillation of the load data compared to the Hopkinson bar technique due to high inertial effect during impact loading. In addition, the test time obtained by these devices is very short, which is insufficient to deform the specimen to a relatively large strain at intermediate strain rates. Moreover, it is difficult to perform test at different strain rate regimes due to restriction in the load cell capacity and bar length. For this reason, some researchers have tried to improve the existing intermediate strain rate test device to obtain a longer test duration and good quality measurement data. Two different strategies are presented in this section, such as modifying the bar system and improving the load measurement technique.
3.1. Modifying the Hopkinson Bar System
Gilat et al. [68] developed a unique device for compression testing at intermediate strain rates. The device is based on the same principle as the hybrid test device, as explained in Section 2.2, and provides mechanical data at a wide range of strain and strain rates. It is composed of a hydraulic actuator and a long transmission bar, approximately 40 m long, as shown in Figure 7. The apparatus consists of a custom hydraulic actuator capable of producing a force of 22,000 N and speed of up to 2 m/s. The test specimen is placed on the long bar with the other end free. The spring and damper are attached at the end of the transmitted bar, which bring the bar to rest after the test.
As the specimen is loaded, the compressive wave propagates through the Hopkinson (transmitted) bar without any reflection. The wave is measured by using strain gauges, which are attached near the specimen on the bar. The wave reflects and reaches the strain gauges again after 16 ms; this is enough loading time to accumulate the maximum strain in the specimen. The DIC technique is used to calculate the strain of the specimen.
This apparatus can be operated at various strain rates between 10 s−1 and 200 s−1. Overlapping of the waves is significantly reduced due to the length of the bar. The test can be conducted for a long duration. The load measurement by the long bar can be used to determine the response of the material without complex numerical calculations, as given by Othman [55]. Further refinement of the test technique could allow a more constant strain rate to be achieved. However, this testing apparatus is too large to fit in laboratories.
In 2014, Whittington [69] proposed a design of a serpentine bar for intermediate strain rate tests in laboratories that cannot house a long bar system, as shown in Figure 8. A serpentine bar is a series of a tubes connected like a snake. Its advantage over a conventional long bar is that it can transfer the stress wave propagating from the sample into a series of tubes. These tubes are designed in such a way as to eliminate reflection due to the joints. This setup is inspired by the “recovery” Hopkinson bar setup [70], in which the heavy mass is used to trap the stress wave energy. This process allows a precise amount of strain to be applied to the specimen without repeated loading from the reflected waves. The concept here is to increase the duration of the stress wave in a given bar length, rather than trapping a shorter stress wave inside a detachable tube. The main difference with the serpentine bar setup is that series of tubes are rigidly connected at alternating ends of the bar. Figure 8 shows a serpentine bar with two attached tubes; the specimen is under compression load.
This technique allows longer recording times than conventional bars of the same effective length. Experimental results also show that the operating strain rate is up to 300 s−1. The main advantage of this technique is that it eliminates the wave dispersion observed when using the long Hopkinson bar technique. Although the new serpentine bar can be used for several applications, manufacturing it is very complicated because of its complex snakelike structure.
Tateyama et al. and Koboyashi [71,72] used a special universal rate range (URR) load cell to evaluate the load without the influence of the reflected stress wave. A schematic view of the load cell is given in Figure 9a. It is composed of a small stress detection part (A1), compared to the stress transmission part (A2). The stress waves are measured using a semiconductor strain gage (KSP-1-350-E4, Kyowa Electronic Instruments Co., Ltd., Chofu, Tokyo, Japan) attached to the center of the stress detection part.
As shown in Figure 9b, the load cells are attached on the top and bottom of the drop weight testing machine to evaluate the stress equilibrium of the specimen by measuring the upper and lower load histories. Where, σ11 and σ21 are two different stress waves (the incident and transmitted stress waves) observed at the detection part and stress-transmitted bar, respectively. Furthermore, the relation between the stress waves can be given by using simple equation based on the load equilibrium and the continuity of particle velocity at the interface [70].
A1 is the cross-sectional area of the detection part, and A2 is the cross-sectional area of the stress-transmitted bar. If A2 > A1, then σ21 ≪ σ11. Thus, the effect of the stress wave reflected from the bottom of the transmitted bar is very small. This means that compressive stress deformation can be detected for a long time without any disturbance because of the reflected stress wave. The dynamic compressive test confirmed that stress equilibrium was achieved within a strain rate of 100 to 101 s−1.
3.2. Load Measuring Technique
Load measurement is always the main concern with an intermediate strain rate device due to the effects of inertia and high vibration on the load signals. Traditionally there are two types of load measurement techniques: Piezoelectric sensor (load cell) and Hopkinson bar (by strain gauging the bar).
Very few dynamic testing devices are equipped with the piezoelectric load cell. Although load cells have an adequate dynamic range [73], the load measurements are still problematic. Oscillation and vibration noise occur due to high inertia effects in the output signals of the load cell, and in addition, the impedance change (due to joints with different mechanical connections) between the components in the load train generates a wave reflection that causes further degradation of the load measurement.
Various techniques have been developed to improve the quality of load cell data. Xia et al. [74] performed the tests by customizing the existing load cell to investigate the vibration and oscillation effect, the tests were conducted by using a high speed servo hydraulic machine under three different strain-rates, 10, 100, and 200 s−1 plotted in Figure 10, clearly supportive to the advantage of the customized sensor. Neither the customized sensor nor the commercial built-in load cell suffers from oscillation under 10 s−1. Moreover, their test results superimpose upon each other very well, indicating the good reliability of the two sensor systems under this strain-rate. However, when the strain-rate increases to 100 s−1, oscillation effect becomes evident for the commercial load cell. On the contrary, the customized load sensor is much more robust in the load measurement, which verifies the methodology and design procedure proposed in previous sections. As the strain-rate increases to 200 s−1, even the customized load sensor undergoes a small degree of system oscillation see Figure 10c. The authors are still working on how to improve the situation, but it seems that the current level of data quality is already acceptable for characterization use [40].
Several other techniques were also used to improve the load measurement data. For example, Groves et al. [75] used a laminate of impedance-mismatched materials to damp wave reflections on a drop-tower base, Kussmal et al. [76] used plastic deformation of an aluminum damper to reduce load oscillations, and Follansbee’ [77] used a ring of soft solder to lessen the shock (i.e., increase the loading wave rise time) of a hydraulic actuator contacting a compression fixture. The addition of damping material in the load train can lessen the strain rate, however, and may make sample deformation measurement more difficult. The influence of damping materials on the load cells is investigated at different strain rate levels [78]. The experimental results show that different damping levels show unacceptable oscillations from measured force signals at intermediate strain rates in comparison to undamped testing. However, it is still difficult to draw conclusions about which types of damping materials are the most effective.
The conventional split Hopkinson bar (SHB) technique is an attractive alternative to the load sensor; it measures only the load transmitted through the specimen. The theory of stress wave propagation in a Hopkinson bar is well documented in the literature [22]. The Hopkinson bar is defined as a perfectly elastic, homogeneous bar with a constant cross-section. A stress wave propagates in a Hopkinson bar as a one-dimensional elastic wave without attenuation or distortion. The specimen is attached to the bar on one end, and other end of the bar is free/fixed. The Hopkinson bar configuration is shown in Figure 11. When the specimen is loaded; the inertia of the bar provides a reaction to the specimen. When the specimen is compressed or elongated against the bar, the loading of the specimen is transmitted down the bar at the elastic wave velocity. At the other end of the bar, the elastic wave reflects back toward the loading end. The load in the bar is determined from a strain gage located close to the loading end. The strain gage is attached in the Wheatstone bridge, which leads to the separation of different stress waves (incident, reflected, and bending) [79]. The strain can then be translated into stress by Hooke’s uniaxial law.
Stress–strain measurement:
The stress in the test specimen is assumed to be uniaxial and can be calculated using the elastic wave analysis of the Hopkinson bar. Specimen stress as a function of time σ(t) is
where E is the modulus of elasticity of the Hopkinson bar, ε(t) is the bar strain as a function of time, Ab is the bar cross-section area, As is the cross-sectional area of the specimen, and Ls is the length of the specimen. The velocity of a wave (C) propagating in the bar is an intrinsic characteristic directly related to the material properties and type of loading. In compression and tensile loading, elastic waves are propagated into the bar, whereas in shear loading, torsion waves are propagated. The velocity of the waves in the bar is directly linked with Young’s modulus (E) (for tensile and compression) or shear modulus (G) (for shear loading) and the density (ρ) of the material.
For traction or compression elastic wave,
For torsion wave,
Isotropic materials such as steel and aluminum are usually used to manufacture the bar. Recently, brass material was used for a Hopkinson bar [24], showing very good results in intermediate strain rate testing. The wave velocity in the brass material is very slow, and it maximizes the test duration, making the bar more economical than other materials.
The minimum length of the Hopkinson bar is mainly dictated by the desired duration of the specimen deformation. This duration is equal to the duration of the wave propagation, i.e., the length of the bar depends on the specimen deformation time and the velocity of the wave inside the bar.
However, the Hopkinson bar technique is limited to high strain rates due to the limited duration of the test. Assuming that the sample is deformed at a constant strain rate, the maximum strain recorded is therefore εmax= ε̇ Δt, whereas Δt is the test duration and ε̇ is the strain rate. The test duration is rarely longer than 1 ms in conventional SHB. Therefore, at an average deformation rate of 100 s−1, the maximum strain measured is 10%. The existing testing devices explained in the Section 2 combines measurement technique of a Hopkinson bar shows very low strain. However, in this work, only one strain gage is used on the bar (regarded as an output bar in a SHB technique). The strain gage is not far from the specimen bar interface. Therefore, the test duration is approximately twice the duration of a conventional SHB, i.e., no more than 2 ms, which is not enough to accumulate higher strain. This led many authors [80,81,82,83,84] to develop wave separation techniques to increase the test duration.
Wave separation method:
The wave separation method uses mathematical tools to process at least two measurements from two strain gages attached to the bar in order to separate the effect of two or more different types of waves such as forward and downward waves on the load signals [85]. It is first introduced by Lundberg [86] and Yanagihara [87] for the Hopkinson bar testing machine. The use of wave separation methods eliminates the test time limitation caused by overlapping waves in the strain gages, which often occurred in the hybrid testing device.
The wave separation method measures the load in the Hopkinson bar, captures the signals from strain gauges attached to the bar, and gives the mathematical relation between the waves passing through the strain gauges. This method is either time dependent or frequency dependent. The frequency dependent method is more reliable and easier, and it takes into account the wave dispersion in the bar [58].
Let us consider a straight uniform viscoelastic bar. The strain ε(x, ω), particle velocity v(x, ω), and force F(x, ω) are determined by a strain gauge attached to the bar at any cross-section distance x from the loading end, and ω is the one-dimension wave velocity. The wave dispersion is also considered in this method. The Fourier transform for strain is given by
where F(ω) and D(ω) are waves propagating in opposite directions (forward and backward) and ξ(ω) is the wave dispersion relation that can account for both material and geometrical effects. The objective of the wave separation method is to recover waves F(ω) and D(ω), knowing some strain and/or velocity measurements on some cross-sections of the bar. Knowing the expression of the Fourier transform of the strain at one cross-section, it is possible to derive the Fourier transform of particle velocity and normal force at the same cross-section, as follows:
where A and E(ω) is the cross-sectional area and the young’s modulus of the bar, respectively. That accounts for the possible viscoelastic behavior of the bar. Equations (8) and (9) represent the particle velocity and the force and it can be recovered at cross-section of the bar if the four-following frequency-dependent functions are known: E(ω), ξ(ω), F(ω), and D(ω). The two first functions are characteristics of the bar. Thus, they can be independently determined. Hence, the wave separation methods assume that E(ω) and ξ(ω) are known. Now the main objective is to determine F(ω) and D(ω), the two waves propagating in opposite directions, from a reduced number of measurements on the bar.
Since it has two unknowns F(ω) and D(ω), for each frequency, the establishment of two equations should be sufficient to solve the problem. This is done by using two strain measurements, which are recorded in two different sections of the bar [81,85] shown in Figure 12. Then, two equations can be derived from Equation (6).
And
where ε1(x1, ω) and ε2(x2, ω) are the Fourier transforms of the measured strain at the two cross-sections x1 and x2. If these two equations are independent, we can simply calculate the two waves, as first suggested by Zhao and Gary [17].
The full development of this technique is explained in [58,85]. It is the most noise-insensitive wave separation method; the wave dispersion effects are also considered in this method. The test duration is increased to few seconds, which is some thousand times more than the duration of a conventional SHB, therefore intermediate strain rate tests can be carried out without any limitation on the test duration.
4. General Description of Intermediate Strain Rate Testing Device
There is no universal standard for the design of an intermediate strain rate device; researchers have designed, and developed test devices based on necessity. In this section, the general requirements for an intermediate strain rate testing device are given.
4.1. Components of Intermediate Strain Rate Testing Device
- The loading system must be capable of generating a dynamic load in traction, compression, and shear (e.g., high-speed servo-hydraulic actuator, drop weight tower, and flywheel device, as explained in Section 2).
- The components of the testing machine, such as clamps, fasteners, fixtures, handles, adapters, and bar alignment system, are designed and assembled in such a way that the effect of inertia is eliminated.
- The load applied to the specimen is usually measured by using a Hopkinson bar, which acts as a load sensor. The working principle of the load sensor is explained in Section 3.2. It is one of the most widely used load sensors in dynamic testing. The load is measured based on wave propagation theory. Hence, the dimension and selection of the material for the bar are very important.
- To measure the strain of the specimen, noncontact techniques are often used for dynamic measurement. There is a wide range of methods for displacement measurement, e.g., DIC, laser displacement sensor, and customized extensometer.
- A strain amplifier and an oscilloscope are necessary to magnify, transfer, and record the strain history of the bar.
4.2. Basic Technical Assumption
The design of an intermediate strain rate testing apparatus must meet some basic assumptions to provide the expected experimental results:
- The loading system must generate constant intermediate impact speed without any vibration, noise, or oscillation.
- Due to the length of the Hopkinson bar, bar supports are required at regular distances. In order to not disturb the wave propagation in the bar, the supports must allow free movement of the bar. Hence, the bar is supported by low-friction material enclosed around the bar.
- To obtain accurate load data, a different load measuring technique must be adopted, such as Hopkinson bar using wave separation, serpentine bar, long Hopkinson bar, and wave trap system. These techniques help to avoid reloading of the specimen and the inertial effect in the load measurement.
- The strain gauges are attached to the surface of the Hopkinson bar to measure the stress wave history; the position of the strain gauges must be defined properly. In many research articles, the strain gauges are usually connected in a Wheatstone bridge pattern. This pattern helps to eliminate unnecessary bending wave signals during load measurement.
4.3. Specimen Geometry
The specimen geometry (including the diameter, length, width, and thickness) is very important in dynamic testing. It is designed to achieve uniform stress in the gage section of the specimen and to minimize the effect of inertia. The strain rate is also influenced by the specimen geometry.
For tensile testing, a dog-bone shaped specimen is generally used. The strain rate that develops in the gauge length of the specimen is proportional to the velocity difference across the gauge length [88]. The starting point for the design of the specimen is to calculate the strain rate using a theoretical prediction:
For a fixed loading velocity (V), the prediction suggests that the engineering strain rate is dependent on the initial length of the specimen (Li); the smaller the gauge length, the higher the engineering strain rate. The simple prediction suggests that merely changing the gauge length will offers wide flexibility in various strain rates ranges of interest. In addition, the width and thickness of the specimen must be determined by keeping the length to the cross-section area of specimen constant.
For compression testing, a cylindrical or cube-shaped specimen can be used; the strain rate is influenced by the length of the specimen similar to the tensile specimen as explained above. However, the thickness of the specimen under compression should not be small; it may undergo buckling. Moreover, it should not be very large; it may undergo barreling. Hence, the suitable dimension of the specimen must be chosen for the compression specimen.
For shear tests, the typical specimen geometry is of two types: Solid and tubular. Solid bar specimens are the easiest to fabricate and test; they are preferred for high stresses because tubular specimens tend to deform in this regime. Tubular specimens, on the other hand, are particularly suitable for stress and strain analysis of work hardening at low strain. The latter are manufactured with a thin wall such that shear stress gradients and shear stress rate gradients are eliminated in the radial direction and the temperature variation across section [89]. The main elements of the design are the gauge cross section, fillet radius, shoulder length, and handle design. The geometry of the gauge section is very important as it determines the level and rate of strain, and these are studied to calculate the flow stress and strain. In addition, there are many researchers performing shear tests by using tensile and compression tests and modifying the specimen geometry to convert the tensile and compression load into shear load. It is well explained in Section 5.2. However, there is not much information available on the specimen size for intermediate strain rate tests.
5. Future Development in the Existing Testing Device
5.1. Experimental Test at High-Temperature
In recent years, there has been increasing interest in characterizing materials at low to high strain rates while varying temperature. Consequently, studying and modelling of the behavior of materials under such conditions has been encouraged. In many applications, such as metal forming, machining, FSW, high-speed impact or high-energy metal deposition, and car accidents, materials are deformed at medium to high strain rates. This produces self-heating at high temperatures due to adiabatic processes. The stress–strain response in this case will be a balance between the effects of hardening (due to strain and strain rate) and thermal relaxation. In other cases, the working temperature may be different from the ambient temperature. Therefore, the mechanical response of the material and the effect of strain rate must be investigated in the area of interest. At high temperatures, materials generally become much more ductile and can also exhibit microstructural changes due to recrystallization phenomena [90,91,92,93]. At low temperatures, however, the strength of the material generally increases, and the mechanical behavior changes from ductile to brittle. Figure 13 shows the flow stress–strain curves are influenced by the strain rate and temperature. From these considerations, it can be seen that temperature and strain rate are variables of fundamental importance in predicting the mechanical response of materials and, play an important role in many deformation processes. The development of a temperature experiment has allowed researchers to study the combined effects of strain rate and temperature on the mechanical and microstructure behavior of materials.
The experimental data for high-temperature tests are mainly available for low strain rate and high strain rate testing devices. High-temperature intermediate strain rate experiments are not very popular. Some conventional test devices can provide high temperature test data, but at a very limited temperature [37,38]. However, it has been found that measuring the dynamic mechanical properties of materials at low temperatures using dynamic tests is not as difficult as that involving heating the specimen at high temperatures.
The possible heating methods to perform high-temperature dynamic tests includes: A resistance band heating, resistance heater or direct electric resistance heating, heating furnace, and an induction heating coil. In the resistance heater, a large amount of current is passed through the specimen, thereby heating it. However, the resistance is attached at the ends of the specimen, which would alter the test dynamics and experimental data. The existing experimental data for the high temperature intermediate strain rate is given by the flywheel device discussed in [65]. The test is performed by using a resistance band heater to heat the specimen up to 600 °C. However, the maximum temperature obtained in this method is very low and available only for few materials.
In heating furnace, the external parts attached to the specimen, remained in the furnace, are also heated and eventually influence the stress–strain data. Hence, heating furnaces are also not very consistent for very high-temperature tests. An induction heating device often used for dynamic testing. It does not contact the specimen, and the heat is only produced by the induced current transmitted through the workpiece. It is a fast, compact, and non-contact heating method; the temperature is easily controllable. A non-contact thermocouple (pyrometer) is also used to measure the temperature and helps to maintain the homogenous temperature throughout the test. The strain measurement is very straightforward using induction heating due to enough visible access to the surface of the specimen. Hence, it is suggested that the selection of the appropriate heating device is important to perform tests at high temperature in order to obtain appropriate stress strain data.
5.2. Shear Loading Test
The existing testing devices are mainly designed to perform tensile and compression tests, not shear tests. In a lot of manufacturing processes, the deformation within the material is generated by shear stress and not by tensile or compressive stresses: Turning, milling, drilling, and friction stir welding. In addition, under dynamic loads, in particular, such as forging, metal forming, collisions, and ballistic impacts, materials are more susceptible to shear failure. Hence, the understanding of the material behavior under shear loading has great importance for a researcher to develop a material model. For such material behavior analysis, shear tests provide a useful means to investigate the mechanisms leading to shear localization and evolution of the microstructure at a wide range of temperature, strain, and strain rates. It is therefore essential to test the material under stress conditions similar to those it will undergo during the manufacturing process.
Shear tests can be carried out by direct shear loading (e.g., a torsion test on thin-walled tubular specimens) or by a simple shear test (e.g., using a suitable sampling plan to convert tensile or compressive loading to shear). The torsion test is the simplest way to achieve a shear load and shear strain in the specimen. Dynamic loading conditions (high strain rate) are usually achieved by a split Hopkinson bar in a torsional configuration and quasi-static loading conditions (low strain rate) by the servo-hydraulic torsion machine. In the pioneering work of Marchand and Duffy [94], the phenomenon of shear localization in structural steels was studied extensively by Hopkinson torsion tests. Later, Hopkinson torsion tests were used by, among others, Gilat et al. [95], Klepaczko et al. [96], and Ramesh et al. [97]. However, all these dynamic torsion devices perform tests at very high strain rates > 103 s−1. Yet there is no experimental testing device available that can produce a state of large equivalent strain with dominant shear strain under the intermediate strain rate. The existing testing devices are mainly designed to perform under tensile and compressive loading. Therefore, there is an increasing need to develop a reliable experimental test bench to accurately determine the behavior of the material at intermediate strain rates under shear loading.
Some other testing methods are also available to performed tests under shear loading e.g., shear test can be performed by appropriate specimen geometry by using traditional tensile and compression apparatus in static and dynamic loading. It is also called a combined loading technique with dominate shear deformation. It has a several advantages such as the necking or barreling in the specimen can be eliminated, without the Poisson-ratio effect and large strain and strain rate can be obtained easily [98]. Dodd, and Bai [20] gave a detailed critical review on different kinds of shear specimens with their advantages and disadvantages. However, the design of specimen is very important, and it must satisfy the following requirements:
- The specimen must obtain the uniform shear strain along the shear region.
- There should be a simple relationship between the measured force and the shear stress.
- There is a negligible effect of boundary conditions on stress and strain in the shear region.
- The fabrication of the sample geometry should not be very complex.
- The specimen geometry must be used in both static and dynamic experiments.
- A suitable clamping device is used to hold the specimen.
Many research studies show various specimen geometries are used to characterize material behavior in shear. The first simple shear specimen was developed by Hundy and Green [99] under tensile loading to study the shear properties of the material. Meyer and Manwaring [100] designed the “Hat specimen” to study shear localization behavior under compression loading, and later this specimen was modified and used by many other researchers. Another group of a specimen such as double shear specimen [101], single or double edge [102], step or dumbbell [103], compact forced-simple-shear (CFSS) [104], truncated conic [105], indentation [106], and inclined flyer were designed to study the shear behavior of the various metals and alloys. Despite the fact that the majority of these combined loading specimens are designed to study only in static and high strain rate regime, the tests for intermediate strain rate are not easily available.
6. Conclusions
The understanding of the behavior of materials in manufacturing processes is important for the researchers to develop a material model. For such material behavior analysis, experimental tests provide a useful means to investigate the material behavior in a realistic manner. The existing testing devices are mainly divided in terms of strain rate, ranging from low to high. However, for intermediate strain rate testing, very few testing devices are available. In this paper, reviews on existing intermediate strain rate testing devices are given and following conclusion are made.
- The existing intermediate strain rate testing devices given in this paper are mainly divided based on the loading mechanisms, such as a servo-hydraulic actuator, drop tower, and flywheel machine with different load measurement technique. The assets of this testing machines are: (1) continuous loading during the test and (2) a reliable force and consequently stress measurement. However, the testing devices equipped with the piezoelectric load cell shows the larger vibration and oscillation in the load data due to high inertial effects during impact loading compare to the Hopkinson bar technique. In addition, the test duration obtained by these devices is very short, which is insufficient to deform the sample to a relatively large deformation at intermediate strain rates. Furthermore, it is difficult to performed tests at various strain rate regime.
- Some researchers have tried to improve the existing intermediate strain rate testing device in order to obtain a longer test duration and good quality measurement data by modifying the bar system (long Hopkinson bar, serpentine bar, URR load cell, etc.) and by improving the load measurement technique (piezoelectric load cell with damping material, wave separation method). Hence, using these techniques, one can avoid the reloading of the specimen and the inertial effect in the load measurement. In addition, it increases the loading time enough to accumulate large deformations under various strain rate regime.
- There is not enough work done on high-temperature experimental testing. The development of a temperature experiment allowed researchers to study the combined effects of strain rate and temperature on the mechanical and microstructural behavior of materials. Hence, an intermediate strain rate device must be equipped with heating device to study the behavior of the material over a wide range of temperatures
- The existing test devices focus only on the tensile and compressive behavior of the material. There is no intermediate strain rate testing device available to study the pure shear behavior. Shear test can reproduce the same response of the material behaviors encountered in processes such as machining, friction stir welding, and cutting. Therefore, there is an increasing need to develop reliable techniques to determine the shear characteristics of materials at intermediate strain rates and to provide experimental data to improve material model.
- The development of combined loading techniques, such as shear-tensile and shear-compression, for an intermediate strain rate device can also be very useful for material modelling, numerical simulation, engineering design, etc. The combined loading technique will help to understand the behavior of the material in complex stress states.
Author Contributions
Conceptualization, T.B.; investigation, T.B. and C.F.; methodology, T.B., E.I. and C.F.; project administration, F.V.; supervision, C.F., F.G.M. and P.D.; validation, T.B., F.V.; resources, F.V.; writing—original draft, T.B.; review & editing, C.F., E.I., F.G.M. and P.D. All authors have read and agreed to the published version of the manuscript.
Funding
This project received funding from the European Union’s Marie Skłodowska–Curie Actions (MSCA) Innovative Training Networks (ITN) H2020-MSCA-ITN-2017 under the grant agreement No. 764979.
Conflicts of Interest
The authors declare no conflict of interest.
References
- Kalpakjian, S. Manufacturing Processes for Engineering Materials, 3rd ed.; Addison-Wesley/Longman: Menlo Park, NJ, USA, 1997. [Google Scholar]
- Jomaa, W.; Mechri, O.; Levesque, J.; Songmene, V.; Bocher, P.; Gakwaya, A. Finite element simulation and analysis of serrated chip formation during high–speed machining of AA7075–T651 alloy. J. Manuf. Process. 2017, 26, 446–458. [Google Scholar] [CrossRef]
- Chen, Z.W.; Cui, S. Strain and strain rate during friction stir welding/processing of Al-7Si-0.3Mg alloy. IOP Conf. Ser. Mater. Sci. Eng. 2009, 4, 012026. [Google Scholar] [CrossRef]
- Guo, Y. An integral method to determine the mechanical behavior of materials in metal cutting. J. Mater. Process. Technol. 2003, 142, 72–81. [Google Scholar] [CrossRef]
- Jaspers, S.P.F.C.; Dautzenberg, J.H. Material behaviour in metal cutting: Strains, strain rates and temperatures in chip formation. J. Mater. Process. Technol. 2002, 121, 123–135. [Google Scholar] [CrossRef]
- Chalivendra, V.; Song, B.; Casem, D. Dynamic Behavior of Materials, Volume 1; Springer: New York, NY, USA, 2013. [Google Scholar]
- Srivatsan, T.S.; Hoff, T.; Sriram, S.; Prakash, A. The effect of strain rate on flow stress, strength and ductility of an Al-Li-Mg alloy. J. Mater. Sci. Lett. 1990, 9, 297–300. [Google Scholar] [CrossRef]
- Yoshino, M.; Shirakashi, T. Flow-stress equation including effects of strain-rate and temperature history. Int. J. Mech. Sci. 1997, 39, 1345–1362. [Google Scholar] [CrossRef]
- Yamada, H.; Kami, T.; Mori, R.; Kudo, T.; Okada, M. Strain rate dependence of material strength in aa5xxx series aluminum alloys and evaluation of their constitutive equation. Metals 2018, 8, 576. [Google Scholar] [CrossRef] [Green Version]
- Zaretsky, E.B.; Kanel, G.I. Effect of temperature, strain, and strain rate on the flow stress of aluminum under shock-wave compression. J. Appl. Phys. 2012, 112, 1–9. [Google Scholar] [CrossRef]
- Senkov, O.N.; Jonas, J.J. Effect of strain rate and temperature on the flow stress of β-phase titanium-hydrogen alloys. Metall. Mater. Trans. A Phys. Metall. Mater. Sci. 1996, 27, 1303–1312. [Google Scholar] [CrossRef]
- Frost, H.J.; Ashby, M.F. Deformation-mechanism Maps: The Plasticity and Creep of Metals and Ceramic; Elsevier Science Limited: Grand Rapids, MI, USA, 1982. [Google Scholar]
- Lindgren, L.E.; Domkin, K.; Hansson, S. Dislocations, vacancies and solute diffusion in physical based plasticity model for AISI 316L. Mech. Mater. 2008, 40, 907–919. [Google Scholar] [CrossRef]
- Liu, J.; Edberg, J.; Tan, M.J.; Lindgren, L.E.; Castagne, S.; Jarfors, A.E. Finite element modelling of superplastic-like forming using a dislocation density-based model for AA5083. Model. Simul. Mater. Sci. Eng. 2013, 21, 025006. [Google Scholar] [CrossRef]
- Zhang, H.; Zhang, K.; Zhou, H.; Lu, Z.; Zhao, C.; Yang, X. Effect of strain rate on microstructure evolution of a nickel-based superalloy during hot deformation. Mater. Des. 2015, 80, 51–62. [Google Scholar] [CrossRef]
- McQueen, H.J.; Jonas, J.J. Recovery and Recrystallization during High Temperature Deformation, Vol. 6; Academic Press, Inc.: Montreal, QC, Canada, 1975. [Google Scholar]
- Huh, H.; Ahn, K.; Lim, J.H.; Kim, H.W.; Park, L.J. Evaluation of dynamic hardening models for BCC, FCC, and HCP metals at a wide range of strain rates. J. Mater. Process. Technol. 2014, 214, 1326–1340. [Google Scholar] [CrossRef]
- Zhu, J.; Xia, Y.; Gu, G.; Zhou, Q. Extension of Non-Associated Hill48 Model for Characterizing Dynamic Mechanical Behavior of a Typical High-Strength Steel Sheet. In Proceedings of the ASME 2014 International Mechanical Engineering Congress and Exposition IMECE2014, Montreal, QC, Canada, 14–20 November 2014. [Google Scholar]
- Xiao, X. Dynamic tensile testing of plastic materials. Polym. Test. 2008, 27, 164–178. [Google Scholar] [CrossRef]
- Dodd, B.; Bai, Y. Adiabatic Shear Localization Frontiers and Advances, 2nd ed.; Elsevier: London, UK, 2012. [Google Scholar]
- Hopkinson, B. A method of measuring the pressure produced in the detonation of high, explosives or by the impact of bullets. Philos. Trans. R. Soc. Lond. Ser. A Contain. Pap. Math. Phys. Character 1914, 213, 437–456. [Google Scholar] [CrossRef]
- Kolsky, H. An Investigation of the Mechanical Properties of Materials at very High Rates of Loading. Proc. Phys. Soc. Sect. B 1949, 62, 676. [Google Scholar] [CrossRef]
- Taheri-Behrooz, F.; Shokrieh, M.M.; Abdolvand, H.R. Designing and manufacturing of a drop weight impact test machine. Eng. Solid Mech. 2013, 1, 69–76. [Google Scholar] [CrossRef]
- Song, B.; Weinong, C. Split Hopkinson pressure bar techniques for characterizing soft materials. J. Solids Struct. 2005, 2, 113–152. [Google Scholar]
- Zhang, T. Progress and application of combined compression and shear wave loading technique. Adv. Mech. 2007, 37, 398–408. [Google Scholar]
- Rogers, W.P.; Nemat-Nasser, S. Transformation Plasticity at High Strain Rate in Magnesia-Partially-Stabilized Zirconia. J. Am.Ceram Soc. 1990, 73, 136–139. [Google Scholar] [CrossRef]
- Staab, G.H.; Gilat, A. A Direct-tension Split Hopkinson Bar for High Strain-rate Testing. Exp. Mech. 1991, 31, 232–235. [Google Scholar] [CrossRef]
- Niordson, F. A Unit for Testing Materials at High Strain Rates. Exp. Mech. 1965, 5, 29–32. [Google Scholar] [CrossRef]
- Gebbeken, N.; Greulic, S.; Pietzsch, A. Hugoniot properties for concrete determined by full-scale detonation experiments and flyer-plate-impact tests. Int. J. Impact Eng. 2006, 32, 2017–2031. [Google Scholar] [CrossRef]
- Hoggatt, C.R.; Recht, R.F. Stress-strain data obtained at high rates using an expanding ring. Exp. Mech. 1969, 9, 441–448. [Google Scholar] [CrossRef]
- Baker, W.E.; Yew, C. Strain-rate effects in the propagation of torsional plastic waves. J. Appl. Mech. 1966, 33, 917. [Google Scholar] [CrossRef]
- Duffy, J.; Campbell, J.; Hawley, R. On the Use of a Torsional Split Hopkinson Bar to Study Rate Effects in 1100-0 Aluminum. J. Appl. Mech. 1971, 38, 83–91. [Google Scholar] [CrossRef]
- Nie, X.; Prabhu, R.; Chen, W.W.; Caruthers, J.M.; Weerasooriya, T. A Kolsky Torsion Bar Technique for Characterization of Dynamic Shear Response of Soft Materials. Exp. Mech. 2011, 51, 1527–1534. [Google Scholar] [CrossRef]
- Yu, X.; Chen, L.; Fang, Q.; Jiang, X.; Zhou, Y. An Electromagnetic driven Torsional Split Hopkinson Bar. In Proceedings of the ICILSM 2018, Xi’an, China, 7–11 May 2018. [Google Scholar]
- Cloete, T.J.; Paul, G.; Ismail, E.B. Hopkinson bar techniques for the intermediate strain rate testing of bovine cortical bone. Philos. Trans. R. Soc. A Math. Phys. Eng. Sci. 2014, 372, 20130210. [Google Scholar] [CrossRef]
- Song, B.; Syn, C.; Grupido, C.; Chen, W.; Lu, W.Y. A Long Split Hopkinson Pressure Bar (LSHPB). Exp. Mech. 2008, 48, 809–815. [Google Scholar] [CrossRef]
- Instron. High Strain Rate VHS System. Data Sheet. 2016, pp. 1–4. Available online: https://www.instron.us/-/media/literature-library/products/2019/05/vhs-high-strain-rate-system-pod.pdf?la=en (accessed on 13 June 2019).
- Shimadzu. Impact Testing. Available online: https://www.shimadzu.com/an/pdf/388_c225e037a.pdf (accessed on 1 November 2017).
- ISO 26203-1:2018. Metallic Materials—Tensile Testing at High Strain Rates—Part 1: Elastic-Bar-Type Systems. Available online: https://www.iso.org/standard/72573.html (accessed on 1 February 2010).
- ISO 26203-2:2011. Metallic Materials—Tensile Testing at High Strain Rates—Part 2: Servo-Hydraulic and Other Test Systems. Available online: https://www.iso.org/standard/46275.html (accessed on 1 October 2011).
- Leblanc, M.M.; Lassila, D.H. A hybrid technique for compression testing at intermediate strain rates. Exp. Tech. 1996, 20, 21–24. [Google Scholar] [CrossRef]
- Song, B.; Sanborn, B.; Heister, J.; Everett, R.; Martinez, T.; Groves, G.; Johnson, E.; Kenney, D.; Knight, M.; Spletzer, M. Development of “dropkinson” Bar for Intermediate Strain-rate Testing. EPJ Web Conf. 2018, 183, 02004. [Google Scholar] [CrossRef]
- Froustey, C.; Lambert, M.; Charles, J.L.; Lataillade, J.L. Design of an impact loading machine based on a flywheel device: Application to the fatigue resistance of the high rate pre-straining sensitivity of aluminium alloys. Exp. Mech. 2007, 47, 709–721. [Google Scholar] [CrossRef]
- Sturges, J.L.; Coler, B.N. The flying wedge: A method for high-strain-rate tensile testing. Part 2. Reasons for its development and general description. Int. J. Impact Eng. 2003, 28, 891–908. [Google Scholar] [CrossRef]
- Paul, S.K.; Raj, A.; Biswas, P.; Manikandan, G.; Verma, R.K. Tensile flow behavior of ultra low carbon, low carbon and micro alloyed steel sheets for auto application under low to intermediate strain rate. Mater. Des. 2014, 57, 211–217. [Google Scholar] [CrossRef]
- Jing, J.; Gao, F.; Johnson, J.; Liang, F.Z.; Williams, R.L.; Qu, J. Brittle versus ductile failure of a lead-free single solder joint specimen under intermediate strain rate. IEEE Trans. Compon. Packag. Manuf. Technol. 2011, 1, 1456–1464. [Google Scholar] [CrossRef]
- Mandal, S.; Jayalakshmi, M.; Bhaduri, A.K.; Sarma, V.S. Effect of Strain Rate on the Dynamic Recrystallization Behavior in a Nitrogen-Enhanced 316L(N). Metall. Mater. Trans. A Phys. Metall. Mater. Sci. 2014, 45, 5645–5656. [Google Scholar] [CrossRef]
- Liu, Z.Y.; Huang, T.T.; Liu, W.J.; Kang, S. Dislocation mechanism for dynamic recrystallization in twin-roll casting Mg-5.51Zn-0.49Zr magnesium alloy during hot compression at different strain rates. Trans. Nonferrous Metals Soc. China 2016, 26, 378–389. [Google Scholar] [CrossRef]
- Zwick/Roell Materials Testing. Available online: https://www.zwickroell.com/en/servohydraulic-testing-machines/high-speed-testing-machine (accessed on 1 November 2008).
- Bardenheier, R.; Rogers, G. Dynamic impact testing with servohydraulic testing machines. J. Phys. IV 2006, 134, 693–699. [Google Scholar] [CrossRef]
- Zhu, D.; Rajan, S.D.; Mobasher, B.; Peled, A.; Mignolet, M. Modal Analysis of a Servo-Hydraulic High Speed Machine and its Application to Dynamic Tensile Testing at an Intermediate Strain Rate. Exp. Mech. 2011, 51, 1347–1363. [Google Scholar] [CrossRef]
- Sahraoui, S.; Lataillade, J.L. Analysis of load oscillations in instrumented impact testing. Eng. Fract. Mech. 1998, 60, 437–446. [Google Scholar] [CrossRef]
- Found, M.S.; Howard, I.C.; Paran, A.P. Interpretation of signals from dropweight impact tests. Compos. Struct. 1998, 42, 353–363. [Google Scholar] [CrossRef]
- Rusinek, A.; Cheriguene, R.; Bäumer, A.; Klepaczko, J.R.; Larour, P. Dynamic behaviour of high-strength sheet steel in dynamic tension: Experimental and numerical analyses. J. Strain Anal. Eng. Des. 2008, 43, 37–53. [Google Scholar] [CrossRef]
- Othman, R.; Guégan, P.; Challita, G.; Pasco, F.; LeBreton, D. A modified servo-hydraulic machine for testing at intermediate strain rates. Int. J. Impact Eng. 2009, 36, 460–467. [Google Scholar] [CrossRef] [Green Version]
- Sutton, M.A.; Orteu, J.J.; Schreier, H. Image Correlation for Shape, Motion and Deformation Measurements: Basic Concepts, Theory and Applications; Springer Science & Business Media: Berlin, Germany, 2009. [Google Scholar]
- Chu, T.C.; Ranson, W.F.; Sutton, M.A. Applications of digital-image-correlation techniques to experimental mechanics. Exp. Mech. 1985, 25, 232–244. [Google Scholar] [CrossRef]
- Othman, R. The Kolsky-Hopkinson bar machine: Selected topics. In The Kolsky-Hopkinson Bar Machine; Springer International Publishing: Jeddah, Saudi Arabia, 2018; pp. 1–282. [Google Scholar]
- Othman, R. Wave separation techniques. In The Kolsky-Hopkinson Bar Machine: Selected Topics; Springer International Publishing: Cham, Switzerland, 2018; pp. 183–203. [Google Scholar]
- Perogamvros, N.; Mitropoulos, T.; Lampeas, G. Drop Tower Adaptation for Medium Strain Rate Tensile Testing. Exp. Mech. 2016, 56, 419–436. [Google Scholar] [CrossRef]
- Tulke, M.; Scheffler, C.; Psyk, V.; Landgrebe, D.; Brosius, A. Principle and setup for characterization of material parameters for high speed forming and cutting. Procedia Eng. 2017, 207, 2000–2005. [Google Scholar] [CrossRef]
- Lawrence, J. Impact Strength and Toughness of Fiber Composite Materials; NTIS: Chicago, IL, USA, 1972. [Google Scholar]
- Daniel, I.M.; Abot, J.L.; Schubel, P.M.; Luo, J.J. Response and Damage Tolerance of Composite Sandwich Structures under Low Velocity Impact. Exp. Mech. 2012, 52, 37–47. [Google Scholar] [CrossRef]
- Manjoine, M.; Nadai, A. High-speed tension tests at elevated temperatures. Proc. ASTM 1940, 40, 822–837. [Google Scholar]
- Quinlan, M.F.; Hillery, M.T. High-strain-rate testing of beryllium copper at elevated temperatures. J. Mater. Process. Technol. 2004, 153–154, 1051–1057. [Google Scholar] [CrossRef]
- Viot, P. Hydrostatic compression on polypropylene foam. Int. J. Impact Eng. 2009, 36, 975–989. [Google Scholar] [CrossRef] [Green Version]
- Bouix, R.; Viot, P.; Lataillade, J.-L. Polypropylene foam behaviour under dynamic loadings: Strain rate, density and microstructure effects. Int. J. Impact Eng. 2009, 36, 329–342. [Google Scholar] [CrossRef] [Green Version]
- Gilat, A.; Matrka, T.A. A new compression intermediate strain rate testing apparatus. EPJ Web Conf. 2010, 6. [Google Scholar] [CrossRef] [Green Version]
- Whittington, W.R.; Oppedal, A.L.; Francis, D.K.; Horstemeyer, M.F. A novel intermediate strain rate testing device: The serpentine transmitted bar. Int. J. Impact Eng. 2015, 81, 1–7. [Google Scholar] [CrossRef]
- Nemat-Nasser, S.; Isaacs, J.B.; Starre, J.E. Hopkinson techniques for dynamic recovery experiments. Proc. R. Soc. Lond. Ser. A Math. Phys. Sci. 1991, 435, 371–391. [Google Scholar]
- Tateyama, K.; Yamada, H.; Ogasawara, N. Effect of strain rate on compressive properties of foamed polyethylene film. Polym. Test. 2016, 52, 54–62. [Google Scholar] [CrossRef]
- Kobayashi, H.; Horikawa, K.; Ogawa, K.; Hori, M. Impact Deformation of Thin-Walled Circular Tube Filled with Aluminum Foam in Lateral Compression. J. Solid Mech. Mater. Eng. 2009, 3, 64–71. [Google Scholar] [CrossRef] [Green Version]
- Soboyejo, W.O.; Srivatsan, T.S. Advanced Structural Materials: Properties, Design Optimization, and Applications, Illustrate; CRC Press: Boca Raton, FL, USA, 2006. [Google Scholar]
- Xia, Y.; Zhu, J.; Wang, K.; Zhou, Q. Design and verification of a strain gauge based load sensor for medium-speed dynamic tests with a hydraulic test machine. Int. J. Impact Eng. 2016, 88, 139–152. [Google Scholar] [CrossRef]
- Groves, S.E.; Sanchez, R.J.; Lyon, R.E.; Brown, A.E. High Strain Rate Effects for Composite Materials. In Eleventh Volume: Composite Materials—Testing and Design; Camponeschi, E., Ed.; ASTM: West Conshohocken, PA, USA, 1993; pp. 162–176. [Google Scholar]
- Kussmal, K.; Demler, T.; Klenk, A. Advanced Testing Methods for Rotating Disk Impact Machines, Mechanical Properties of Materials at High Rates of Strain. In Conference Series-Institute of Physics; Institute of Physics: Oxford, UK, 1989; pp. 157–164. [Google Scholar]
- Follansbee, P. Compression Testing by Conventional Load Frames. In Metals Handbook, 9th ed.; American Society for Metals, ASM International: Cleveland, OH, USA, 1985; pp. 192–193. [Google Scholar]
- Malvern, J.; Chiddister, L. Compression-impact Testing of Aluminum at elevated temperatures. Exp. Mech. 1963, 3, 81–90. [Google Scholar]
- Lataillade, J.; Bacon, C.; Collombet, F.; Delaet, M. The benefit of Hopkinson bar techniques for the investigation of composite and ceramic materials. In Wave Propagation and Emerging Technologies; ASME: New York, NY, USA, 1994. [Google Scholar]
- Bacon, C. Separation of waves propagating in an elastic or viscoelastic Hopkinson pressure bar with three-dimensional effects. Int. J. Impact Eng. 1999, 22, 55–69. [Google Scholar] [CrossRef]
- Zhao, H.; Gary, G. A new method for the separation of waves. Application to the SHPB technique for an unlimited measuring duration. J. Mech. Phys. Solids 1997, 45, 1185–1202. [Google Scholar] [CrossRef]
- Bussac, M.N.; Collet, P.; Gary, G.; Othman, R. An optimization method for separating and rebuilding one-dimensional dispersive waves from multi-point measurements. Application to elastic or viscoelastic bars. J. Mech. Phys. Solids 2002, 50, 321–350. [Google Scholar] [CrossRef] [Green Version]
- Casem, D.T.; Fourney, W.; Chang, P. Wave separation in viscoelastic pressure bar using single point measurements of strain and velocity. Polym. Test. 2003, 22, 155–164. [Google Scholar] [CrossRef]
- Zhao, H.; Abdennadher, S.; Othman, R. An experimental study of square tube crushing under impact loading using a modified large scale SHPB. Int. J. Impact Eng. 2006, 32, 1174–1189. [Google Scholar] [CrossRef] [Green Version]
- Zhao, P.J.; Lok, T.S. A new method for separating longitudinal waves in a large diameter Hopkinson bar. J. Sound Vib. 2002, 257, 119–130. [Google Scholar] [CrossRef]
- Lundberg, B.; Henchoz, A. Analysis of Elastic Waves from Two-point Strain measurement. Exp. Mech. 1977, 17, 213–218. [Google Scholar] [CrossRef]
- Yanagihara, N. New Measuring Method of Impact Force. Bull. JSME 1978, 21, 1085–1088. [Google Scholar] [CrossRef]
- Wood, P.K.C.; Schley, C.A. Strain Rate Testing of Metallic Materials and Their Modelling for Use in CAE Based Automotive Crash Simulation Tools:(Recommendations and Procedures); Shrewsbury: Shropshire, UK, 2009. [Google Scholar]
- Dieter, G.E.; Kuhn, H.A.; Semiatin, S.L. Torsion Testing to Assess Bulk Workability. In Handbook of Workability and Process Design; ASM International: Cleveland, Ohio, USA, 2003; pp. 86–121. [Google Scholar]
- Chwalik, P.; Klepaczko, J.; Rusinek, A. Impact shear-numerical analyses of ASB evolution and failure for. In Proceedings of the 7th International Conference on Mechanical and Physical Behaviour of Materials, Porto, Portugal, 8–12 September 2003; pp. 257–262. [Google Scholar] [CrossRef]
- Rokni, M.R.; Zarei-Hanzaki, A.; Roostaei, A.A.; Abedi, H.R. An investigation into the hot deformation characteristics of 7075 aluminum alloy. Mater. Des. 2011, 32, 2339–2344. [Google Scholar] [CrossRef]
- Joshi, T.; Prakash, U.; Dabhade, V.V. Microstructural development during hot forging of Al 7075 powder. J. Alloys Compd. 2015, 639, 123–130. [Google Scholar] [CrossRef]
- Xiao, W.; Wang, B.; Wu, Y.; Yang, X. Constitutive modeling of flow behavior and microstructure evolution of AA7075 in hot tensile deformation. Mater. Sci. Eng. A 2018, 712, 704–713. [Google Scholar] [CrossRef]
- Marchand, A.; Duffy, J. An experimental study of the formation process of adiabatic shear bands in a structural steel. J. Mech. Phys. Solids 1988, 36, 251–283. [Google Scholar] [CrossRef]
- Gilat, A.; Wu, X. Elevated Temperature Testing with the Torsional Split Hopkinson Bar. Exp. Mech. 1994, 34, 166–170. [Google Scholar] [CrossRef]
- Klepaczko, J. The strain rate behavior of iron in pure shear. Int. J. Solids Struct. 1969, 5, 533–548. [Google Scholar] [CrossRef]
- Ramesh, K.T.; Chichili, D.R. Recovery Experiments for Adiabatic Shear Localization: A Novel Experimental Technique. J. Appl. Mech. 1999, 66, 10–20. [Google Scholar]
- Tarigopula, V.; Hopperstad, O.S.; Langseth, M.; Clausen, A.H.; Hild, F.; Lademo, O.G.; Eriksson, M. A study of large plastic deformations in dual phase steel using digital image correlation and FE analysis. Proc. Soc. Exp. Mech. 2008, 48, 181–196. [Google Scholar] [CrossRef] [Green Version]
- Hundy, B.; Green, A. A determination of plastic stress-strain relations. J. Mech. Phys. Solids 1954, 3, 16–21. [Google Scholar] [CrossRef]
- Murr, L.; Staudhammer, K.; Meyers, M. Metallurgical applications of shock wave and high strain rate phenomena. In Proceedings of the EXPLOMET’85—International Conference on Metallurgical Applications of Shock Wave and High Strain-Rate Phenomena, Portland, OR, USA, 28 July 1985. [Google Scholar]
- Campbell, J.D.; Ferguson, W.G. The temperature and strain-rate dependence of the shear strength of mild steel. Philos. Mag. 1969, 21, 63–82. [Google Scholar] [CrossRef]
- Rusinek, A.; Klepaczko, J.R. Shear testing of sheet steel at wide range of strain rates and a constitutive relation with strain-rate and temperature dependence of the flow stress. Int. J. Plast. 2001, 17, 87–115. [Google Scholar] [CrossRef]
- Wei, Z.; Yu, J.; Li, J.; Li, Y.; Hu, S. Influence of stress condition on adiabatic shear localization of tungsten heavy alloys. Int. J. Impact Eng. 2001, 26, 843–852. [Google Scholar] [CrossRef]
- Gray, G.T.; Vecchio, K.S.; Livescu, V. Compact forced simple-shear sample for studying shear localization in materials. Acta Mater. 2016, 103, 12–22. [Google Scholar] [CrossRef] [Green Version]
- Klopp, R.; Clifton, R.; Shawki, T. Pressure shear impact and the dynamic viscoplastic of metals. Mech. Mater. 1985, 4, 375–385. [Google Scholar] [CrossRef]
- Murr, K.; Lawrence, M. Shock consolidation of aluminium lithium powder. In Metallurgical Applications of Shock Wave and High Strain Rate Phenomena; Marcel Dekker, INC: Pasadena, CA, USA, 1986; pp. 83–108. [Google Scholar]
Figure 1.
Schematic diagram of the high-speed testing machine.

Figure 2.
(a) Modified hybrid machine and (b) stress–strain relation for aluminum obtained by the piezoelectric load sensor method (P1 and P2) and by the Hopkinson bar technique (B3 and B4), (the figure is reproduced from [55], with permission from Elsevier, 2009).
Figure 2.
(a) Modified hybrid machine and (b) stress–strain relation for aluminum obtained by the piezoelectric load sensor method (P1 and P2) and by the Hopkinson bar technique (B3 and B4), (the figure is reproduced from [55], with permission from Elsevier, 2009).

Figure 3.
(a) Overall view of Dropkinson bar test and (b) illustration of specimen displacement measurements (the figure is reproduced from [42], with the permission from authors & EPJ Web of Conferences (open access), 2018).
Figure 3.
(a) Overall view of Dropkinson bar test and (b) illustration of specimen displacement measurements (the figure is reproduced from [42], with the permission from authors & EPJ Web of Conferences (open access), 2018).

Figure 4.
Flywheel and its long pendulum system (load sensor) (the figure is reproduced from [43], with the permission from authors (open access), 2007).
Figure 4.
Flywheel and its long pendulum system (load sensor) (the figure is reproduced from [43], with the permission from authors (open access), 2007).

Figure 5.
Schematic diagram of pendulum device before and after setting in position (the figure is reproduced from [43] with the permission from authors (open access), 2007).
Figure 5.
Schematic diagram of pendulum device before and after setting in position (the figure is reproduced from [43] with the permission from authors (open access), 2007).

Figure 6.
Scheme of compression module on flywheel (the figure is reproduced from [66], with permission from the Elsevier, 2009).
Figure 6.
Scheme of compression module on flywheel (the figure is reproduced from [66], with permission from the Elsevier, 2009).

Figure 7.
Schematic representation of intermediate strain rate compression test apparatus (Long Hopkinson bar setup).
Figure 7.
Schematic representation of intermediate strain rate compression test apparatus (Long Hopkinson bar setup).

Figure 8.
Serpentine transmitted bar loaded in compression, with two strain gauge stations (yellow), the specimen (white), and bushings (blue) (the figure is reproduced from [69], with permission from the Elsevier, 2015).
Figure 8.
Serpentine transmitted bar loaded in compression, with two strain gauge stations (yellow), the specimen (white), and bushings (blue) (the figure is reproduced from [69], with permission from the Elsevier, 2015).

Figure 9.
(a) schematic view of universal rate range (URR) load cell and stress wave propagation and (b) setup of drop-weight testing machine for dynamic compressive test (the figure is reproduced from [71], with permission from the Elsevier, 2016).
Figure 9.
(a) schematic view of universal rate range (URR) load cell and stress wave propagation and (b) setup of drop-weight testing machine for dynamic compressive test (the figure is reproduced from [71], with permission from the Elsevier, 2016).

Figure 10.
Load signals measured by the two different load sensors under (a) 10 s−1; (b) 100 s−1; and (c) 200 s−1 (DP780: An advanced high strength steel and 2024-T4an aluminum alloy) (the figure is reproduced from [74], with permission from the Elsevier, 2016).
Figure 10.
Load signals measured by the two different load sensors under (a) 10 s−1; (b) 100 s−1; and (c) 200 s−1 (DP780: An advanced high strength steel and 2024-T4an aluminum alloy) (the figure is reproduced from [74], with permission from the Elsevier, 2016).

Figure 11.
Configuration of split Hopkinson bar technique.

Figure 12.
Schematic of elastic bar with two strain gage stations.

Figure 13.
The true stress–true strain curves of the experimental alloy during hot compression at various temperatures and different strain rates of (a) 0.004 s−1; (b) 0.04 s−1 and (c) 0.4 s−1 (the figure is reproduced from [91], with permission from the Elsevier, 2016).
Figure 13.
The true stress–true strain curves of the experimental alloy during hot compression at various temperatures and different strain rates of (a) 0.004 s−1; (b) 0.04 s−1 and (c) 0.4 s−1 (the figure is reproduced from [91], with permission from the Elsevier, 2016).


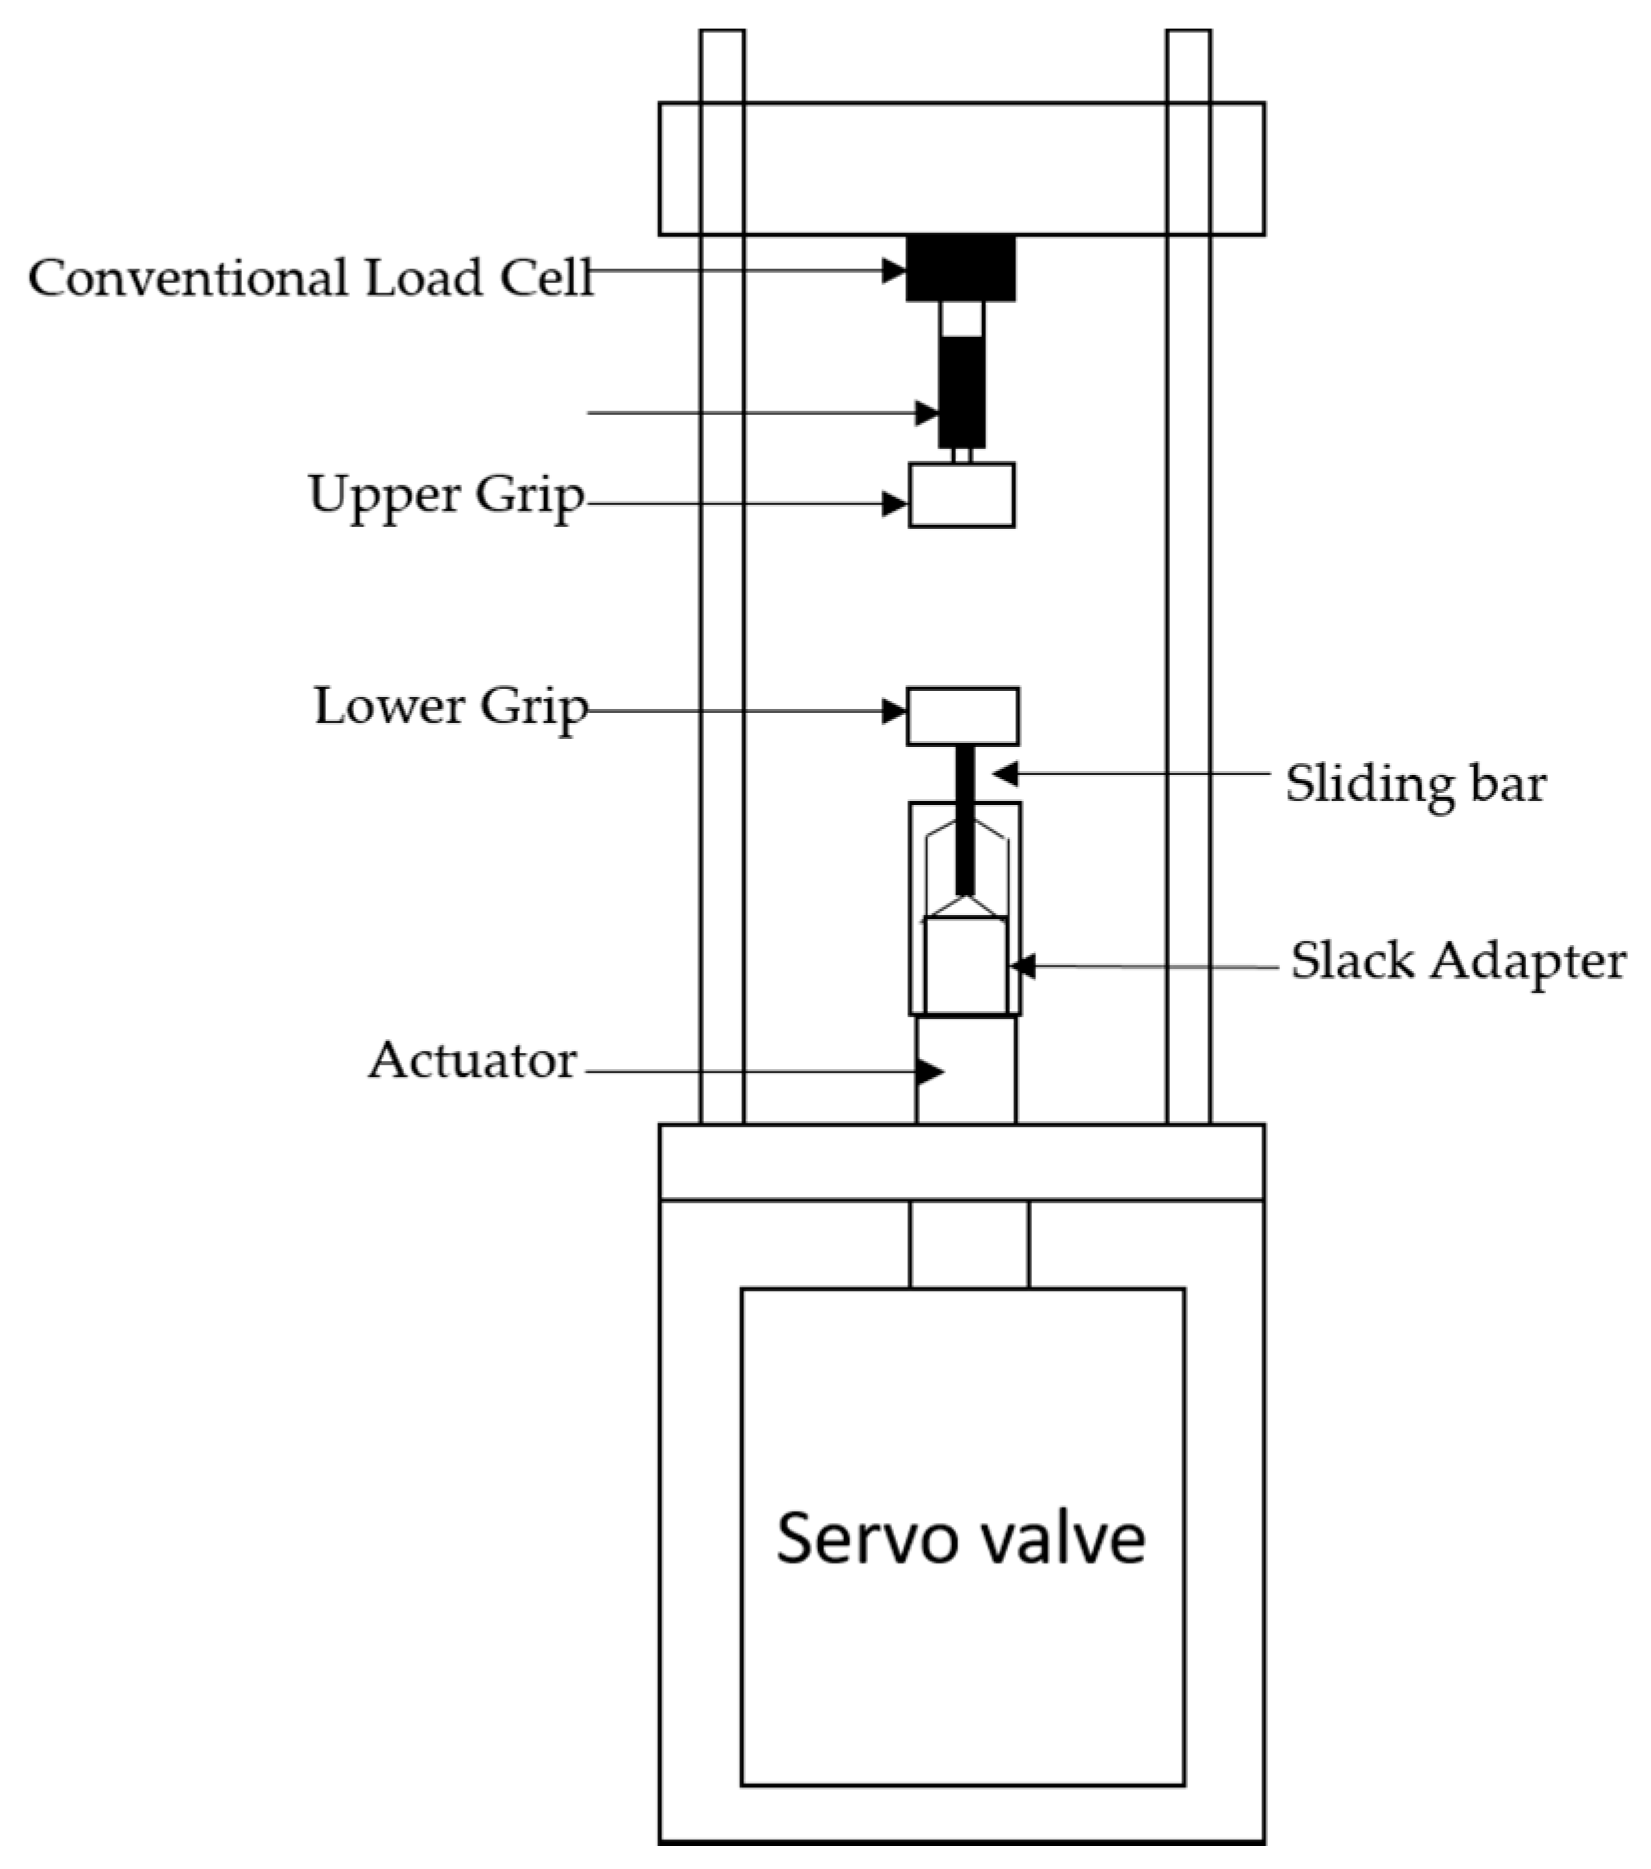
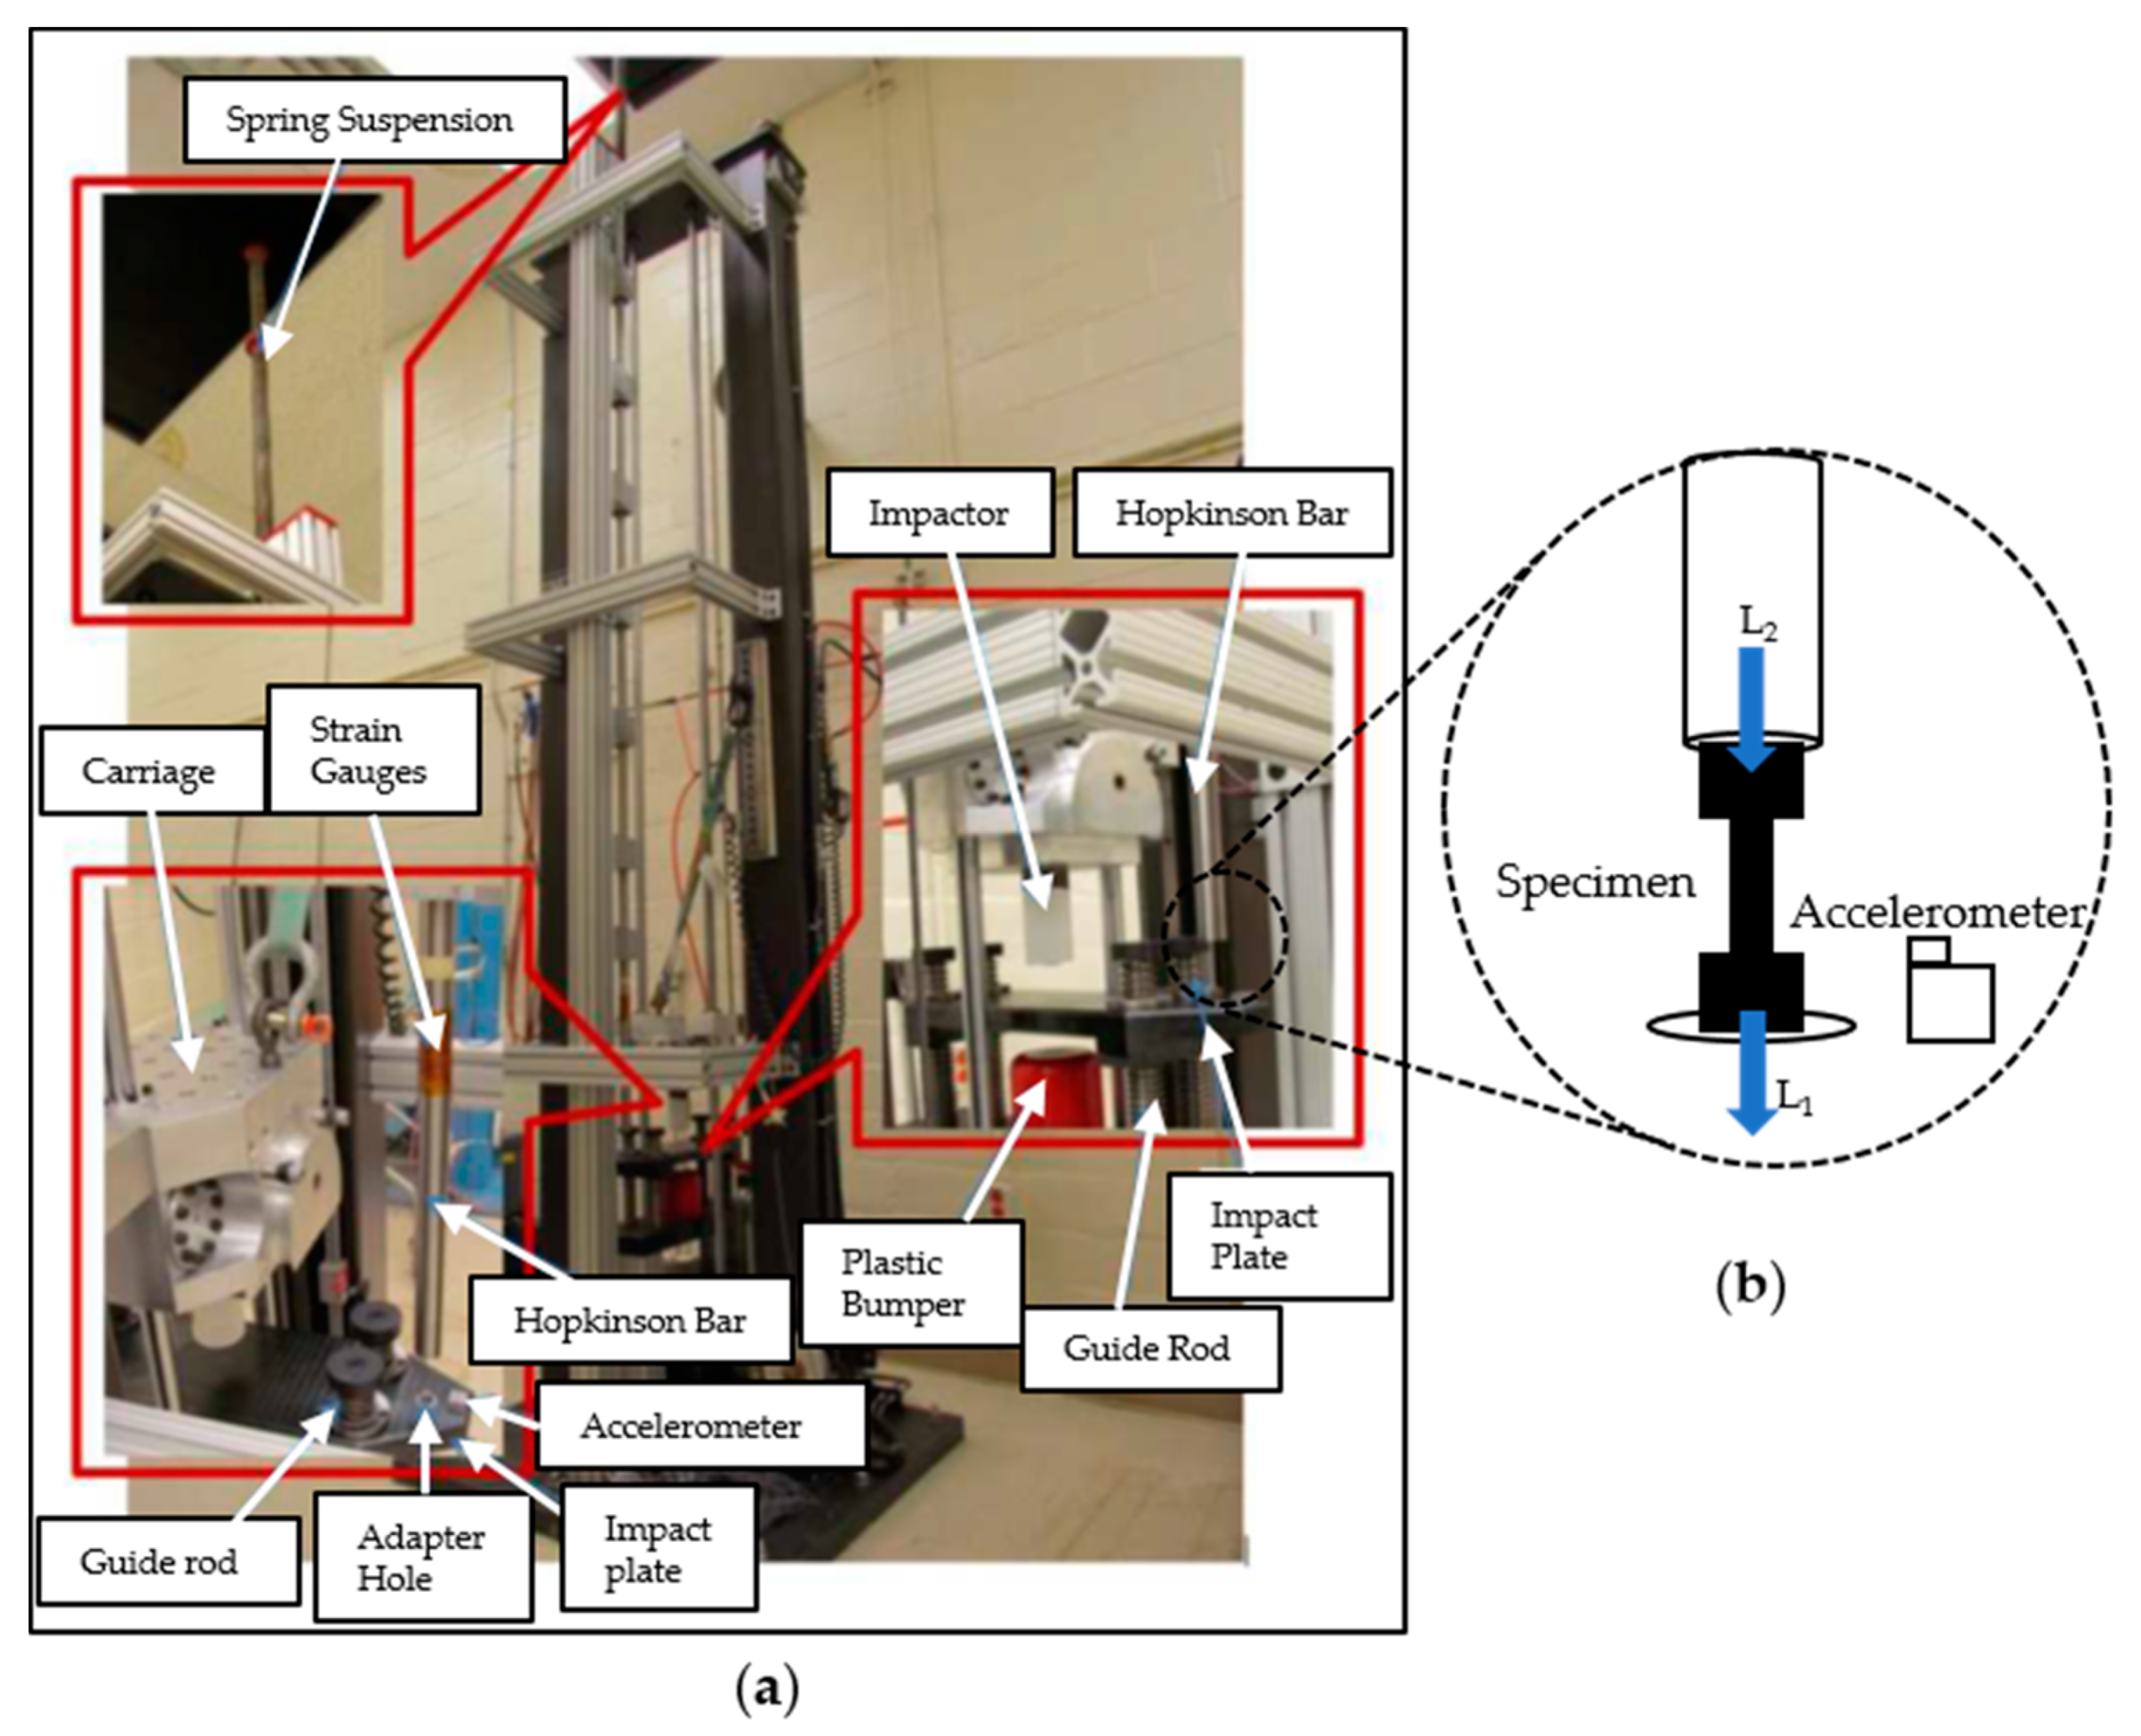
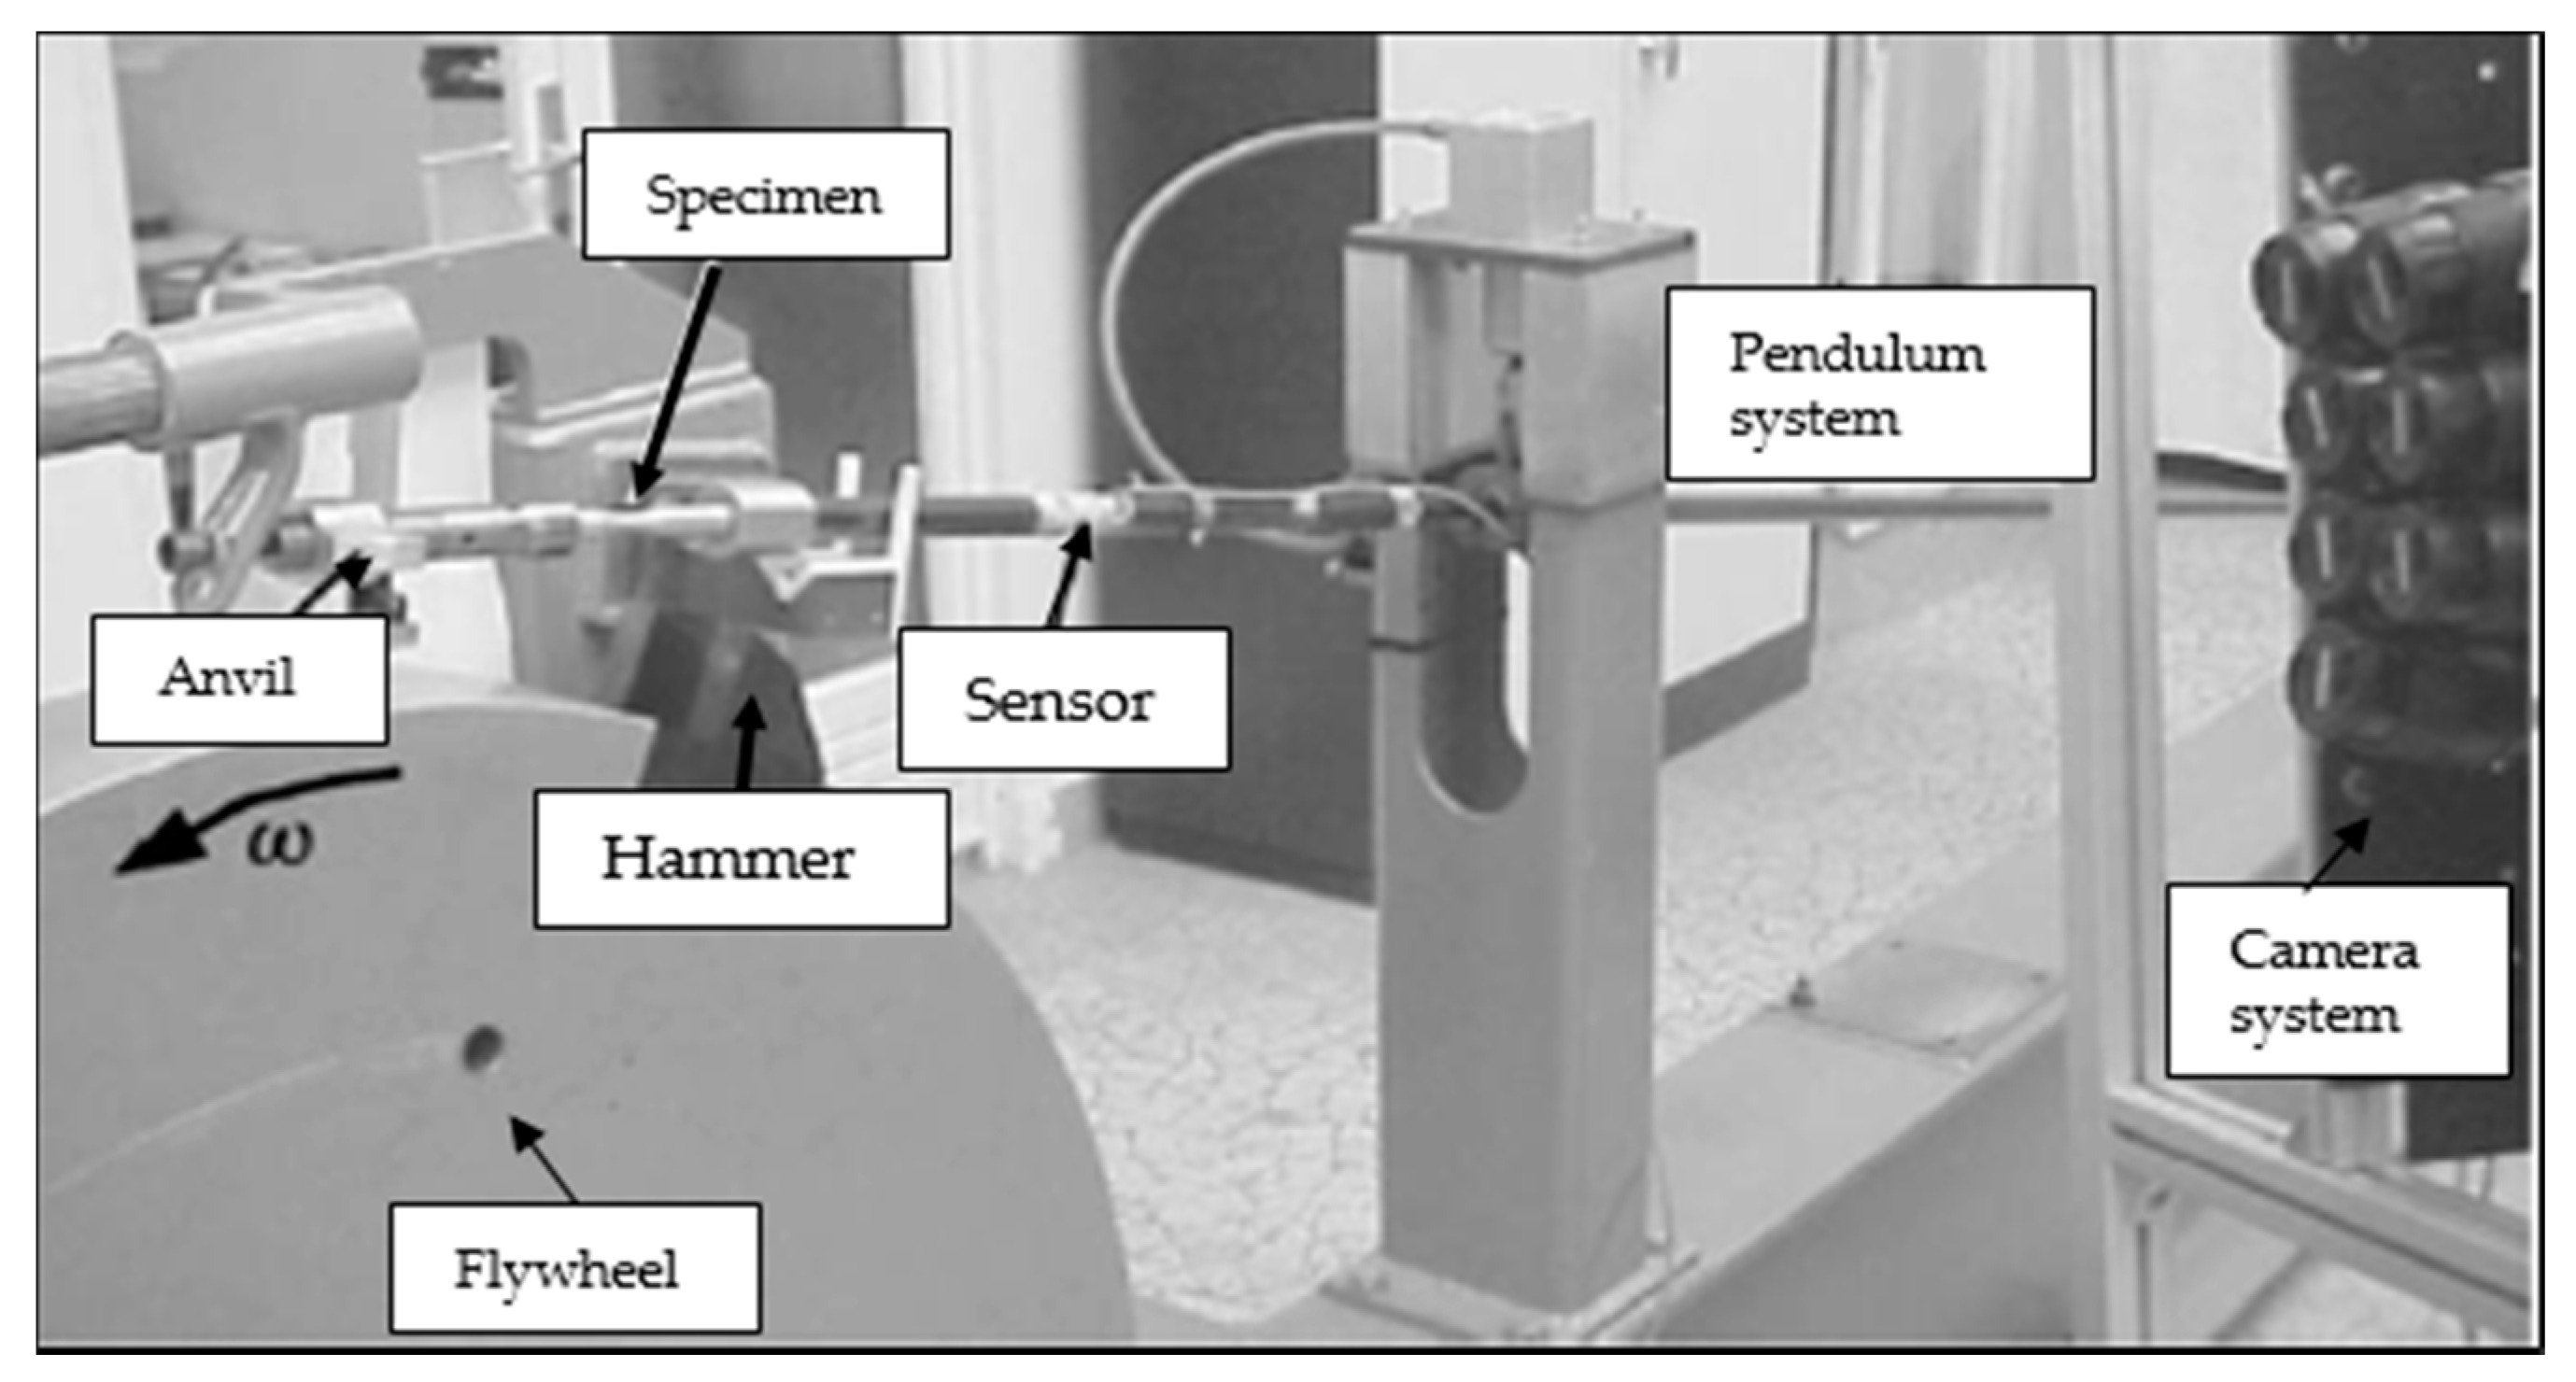
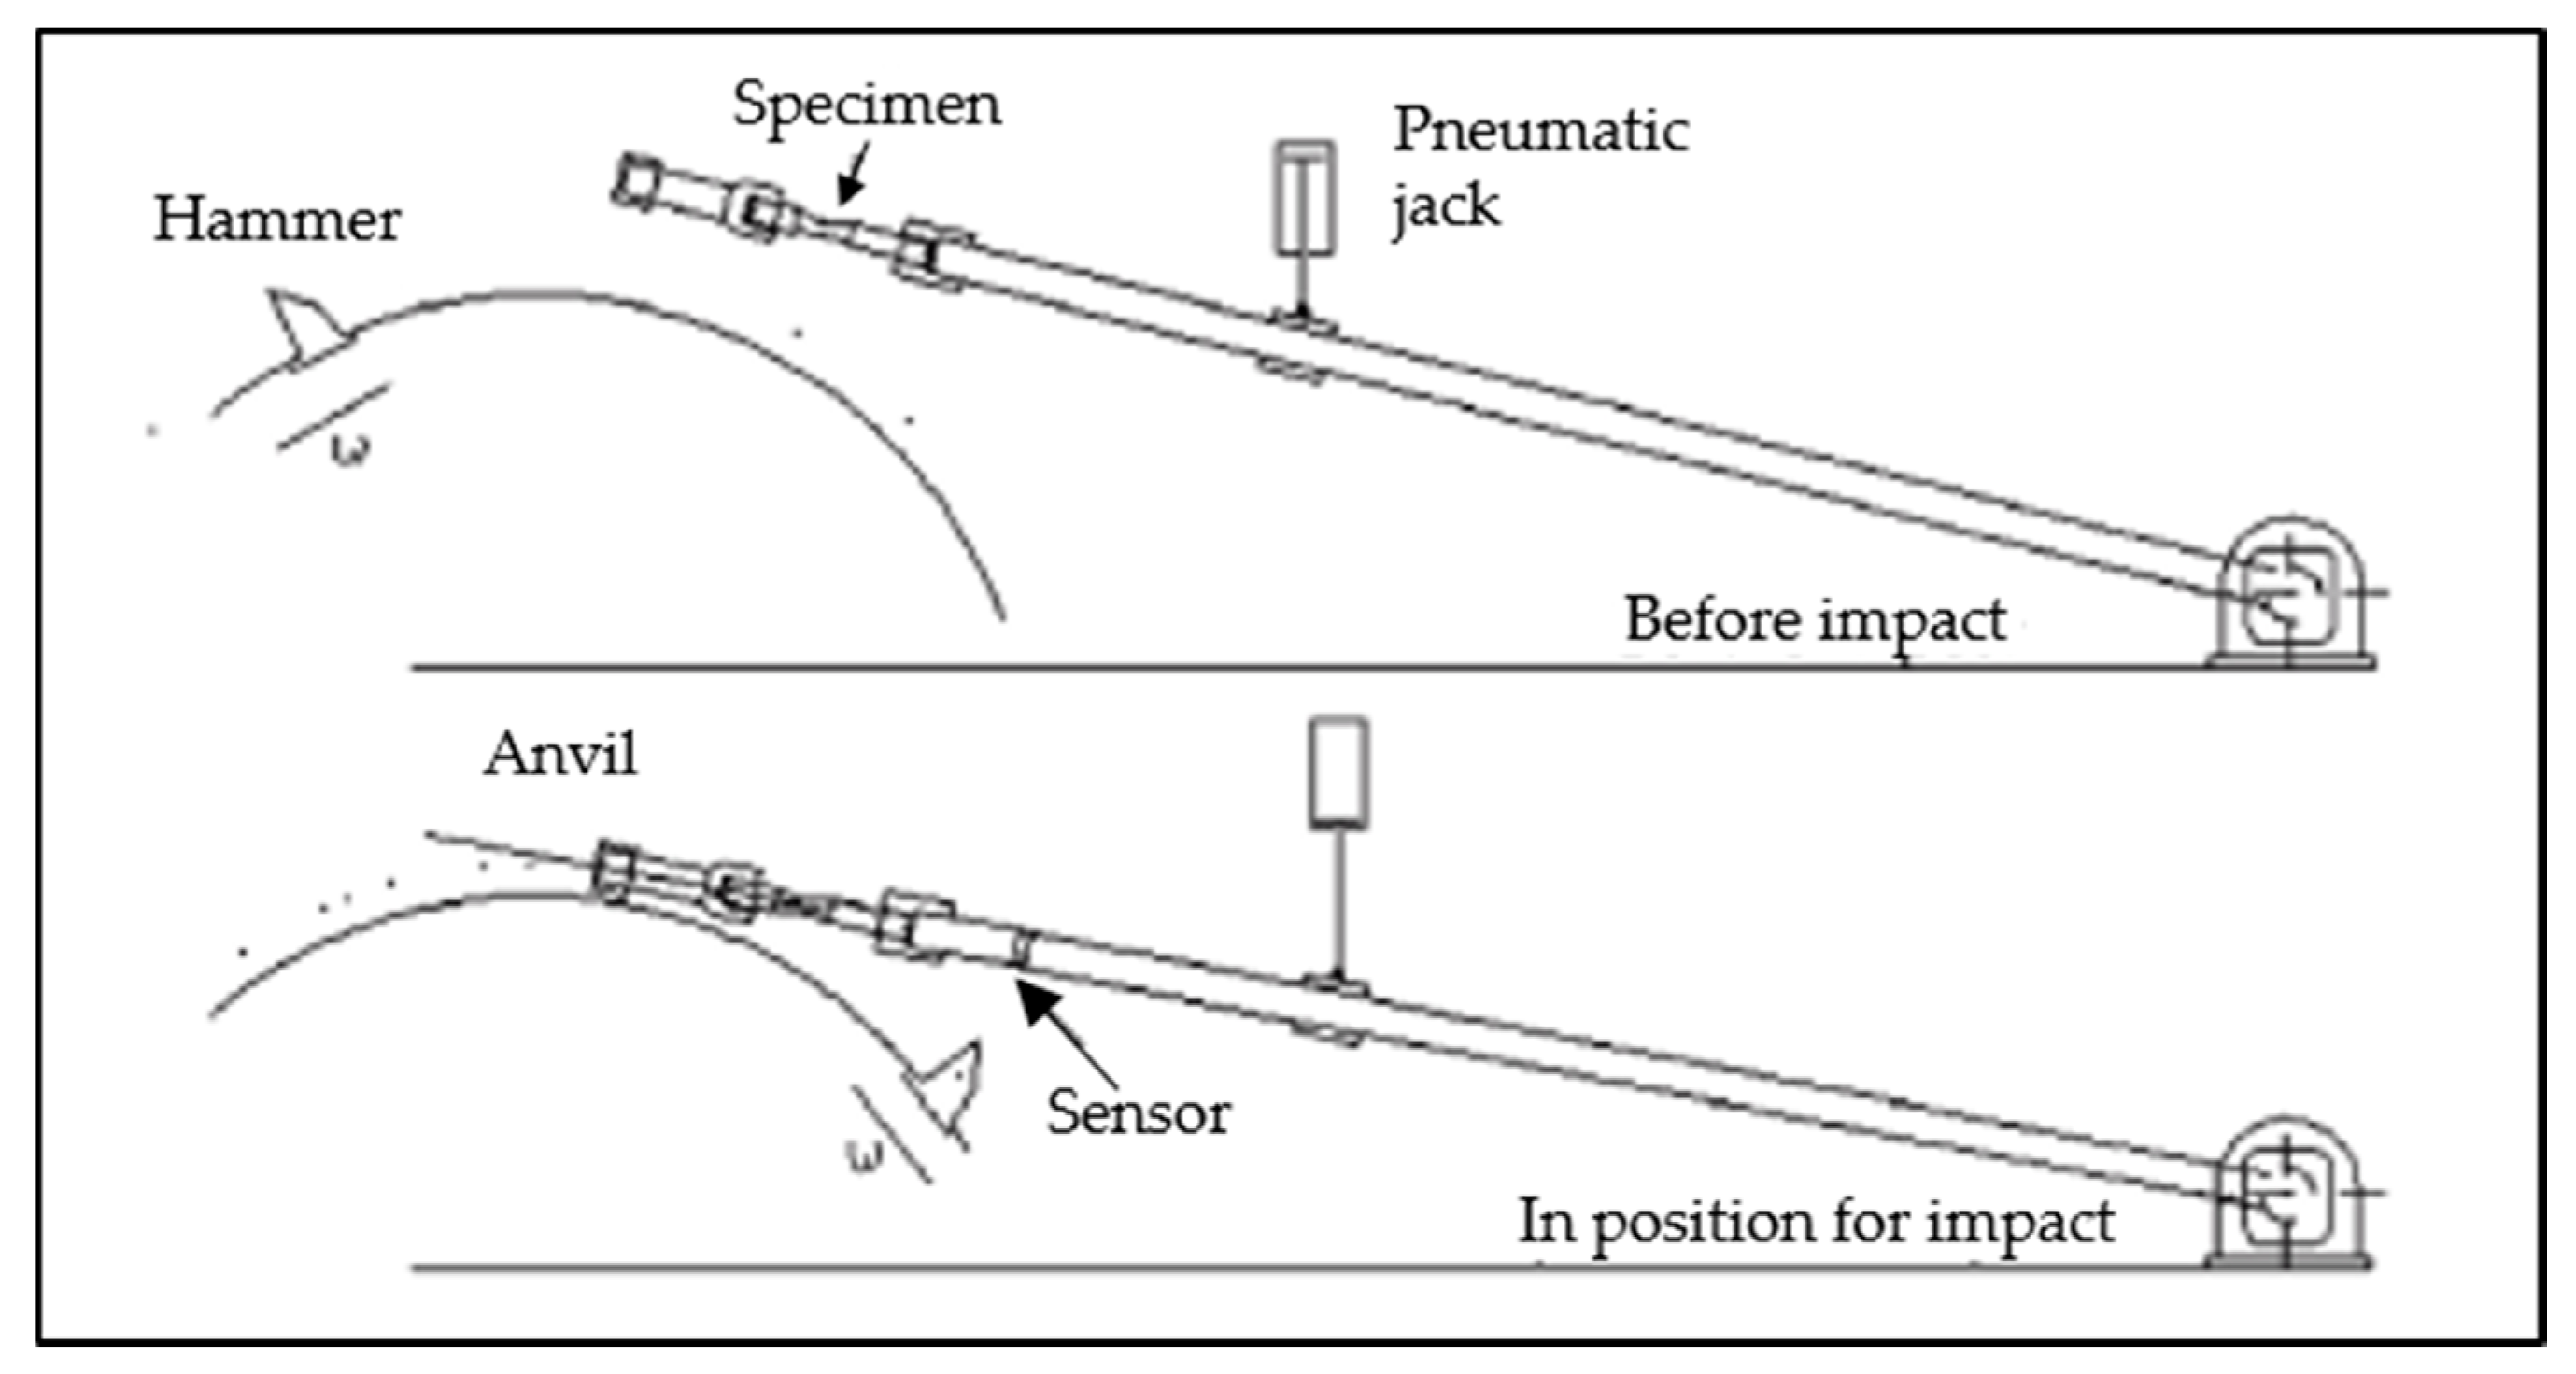
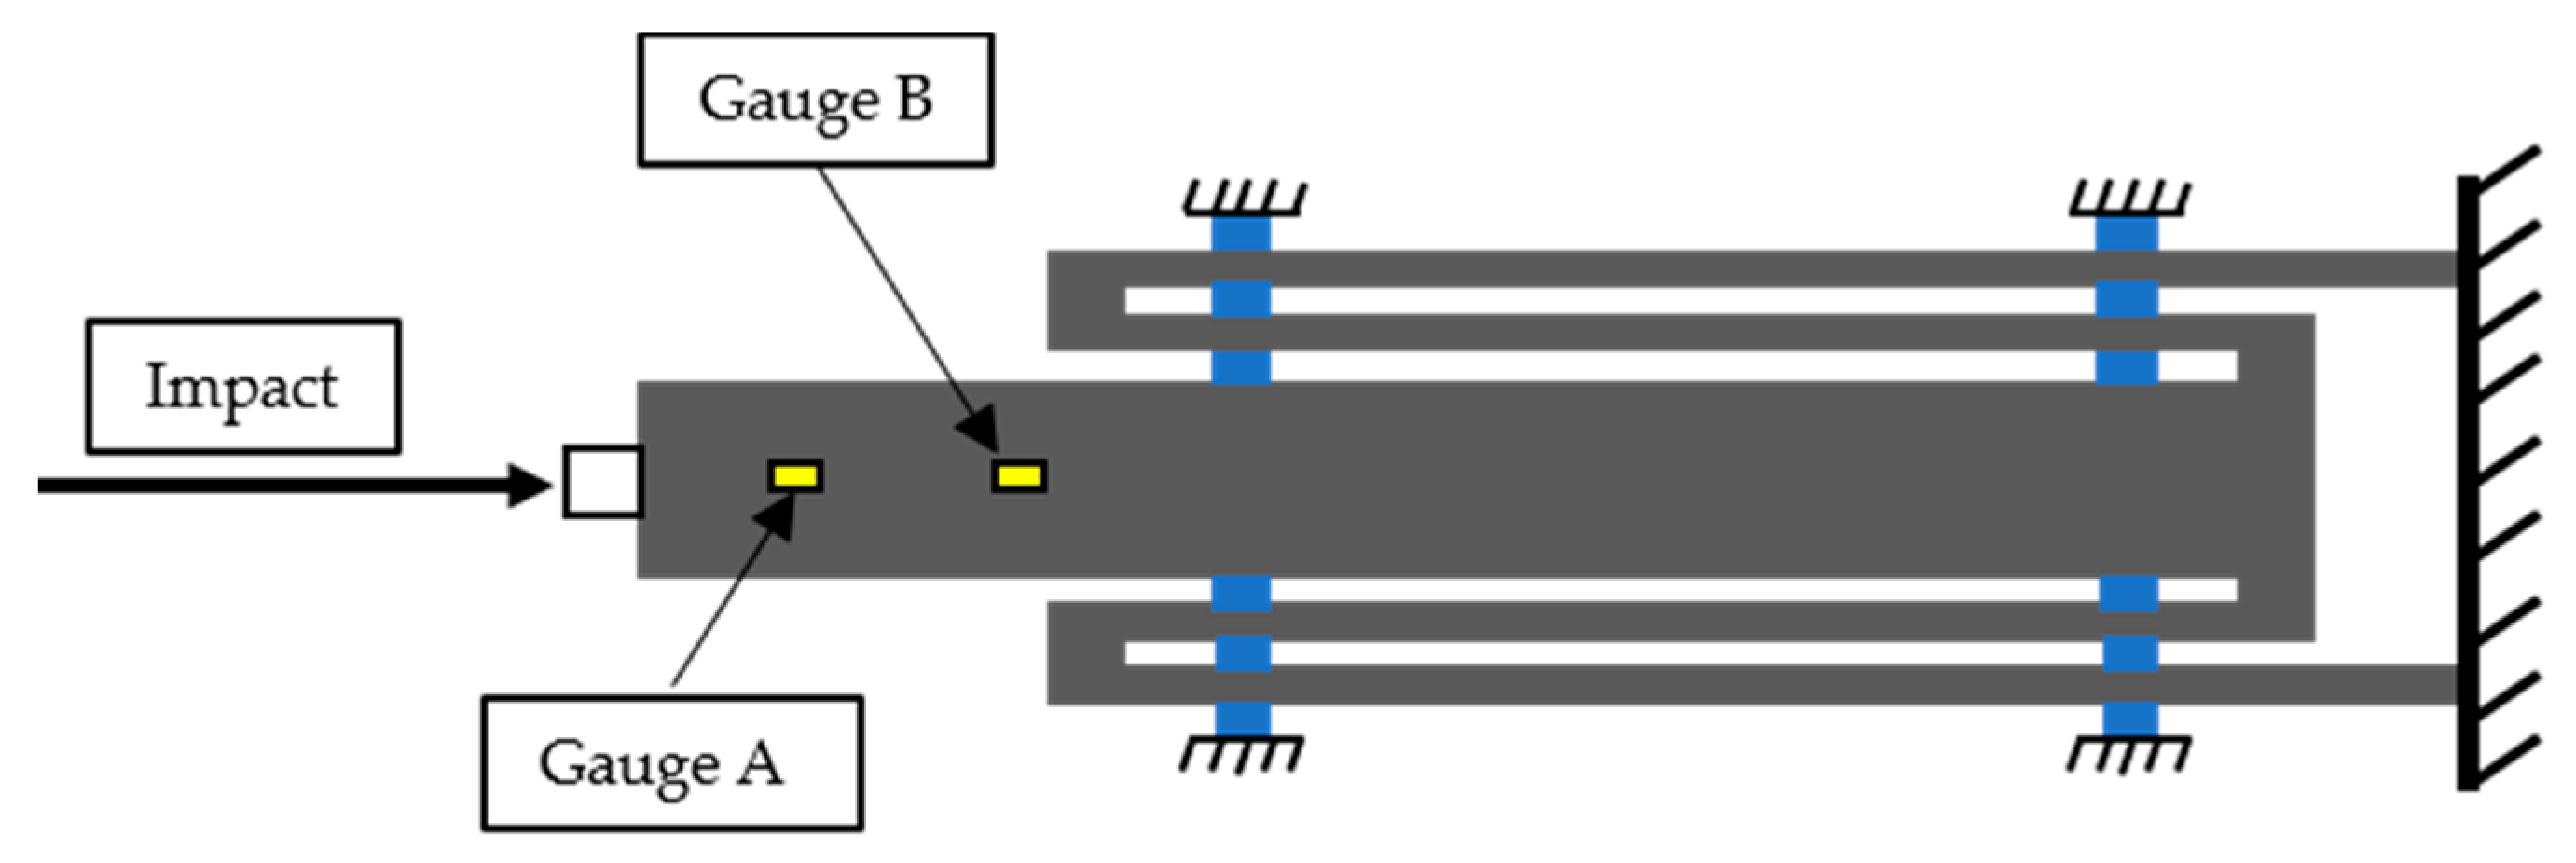
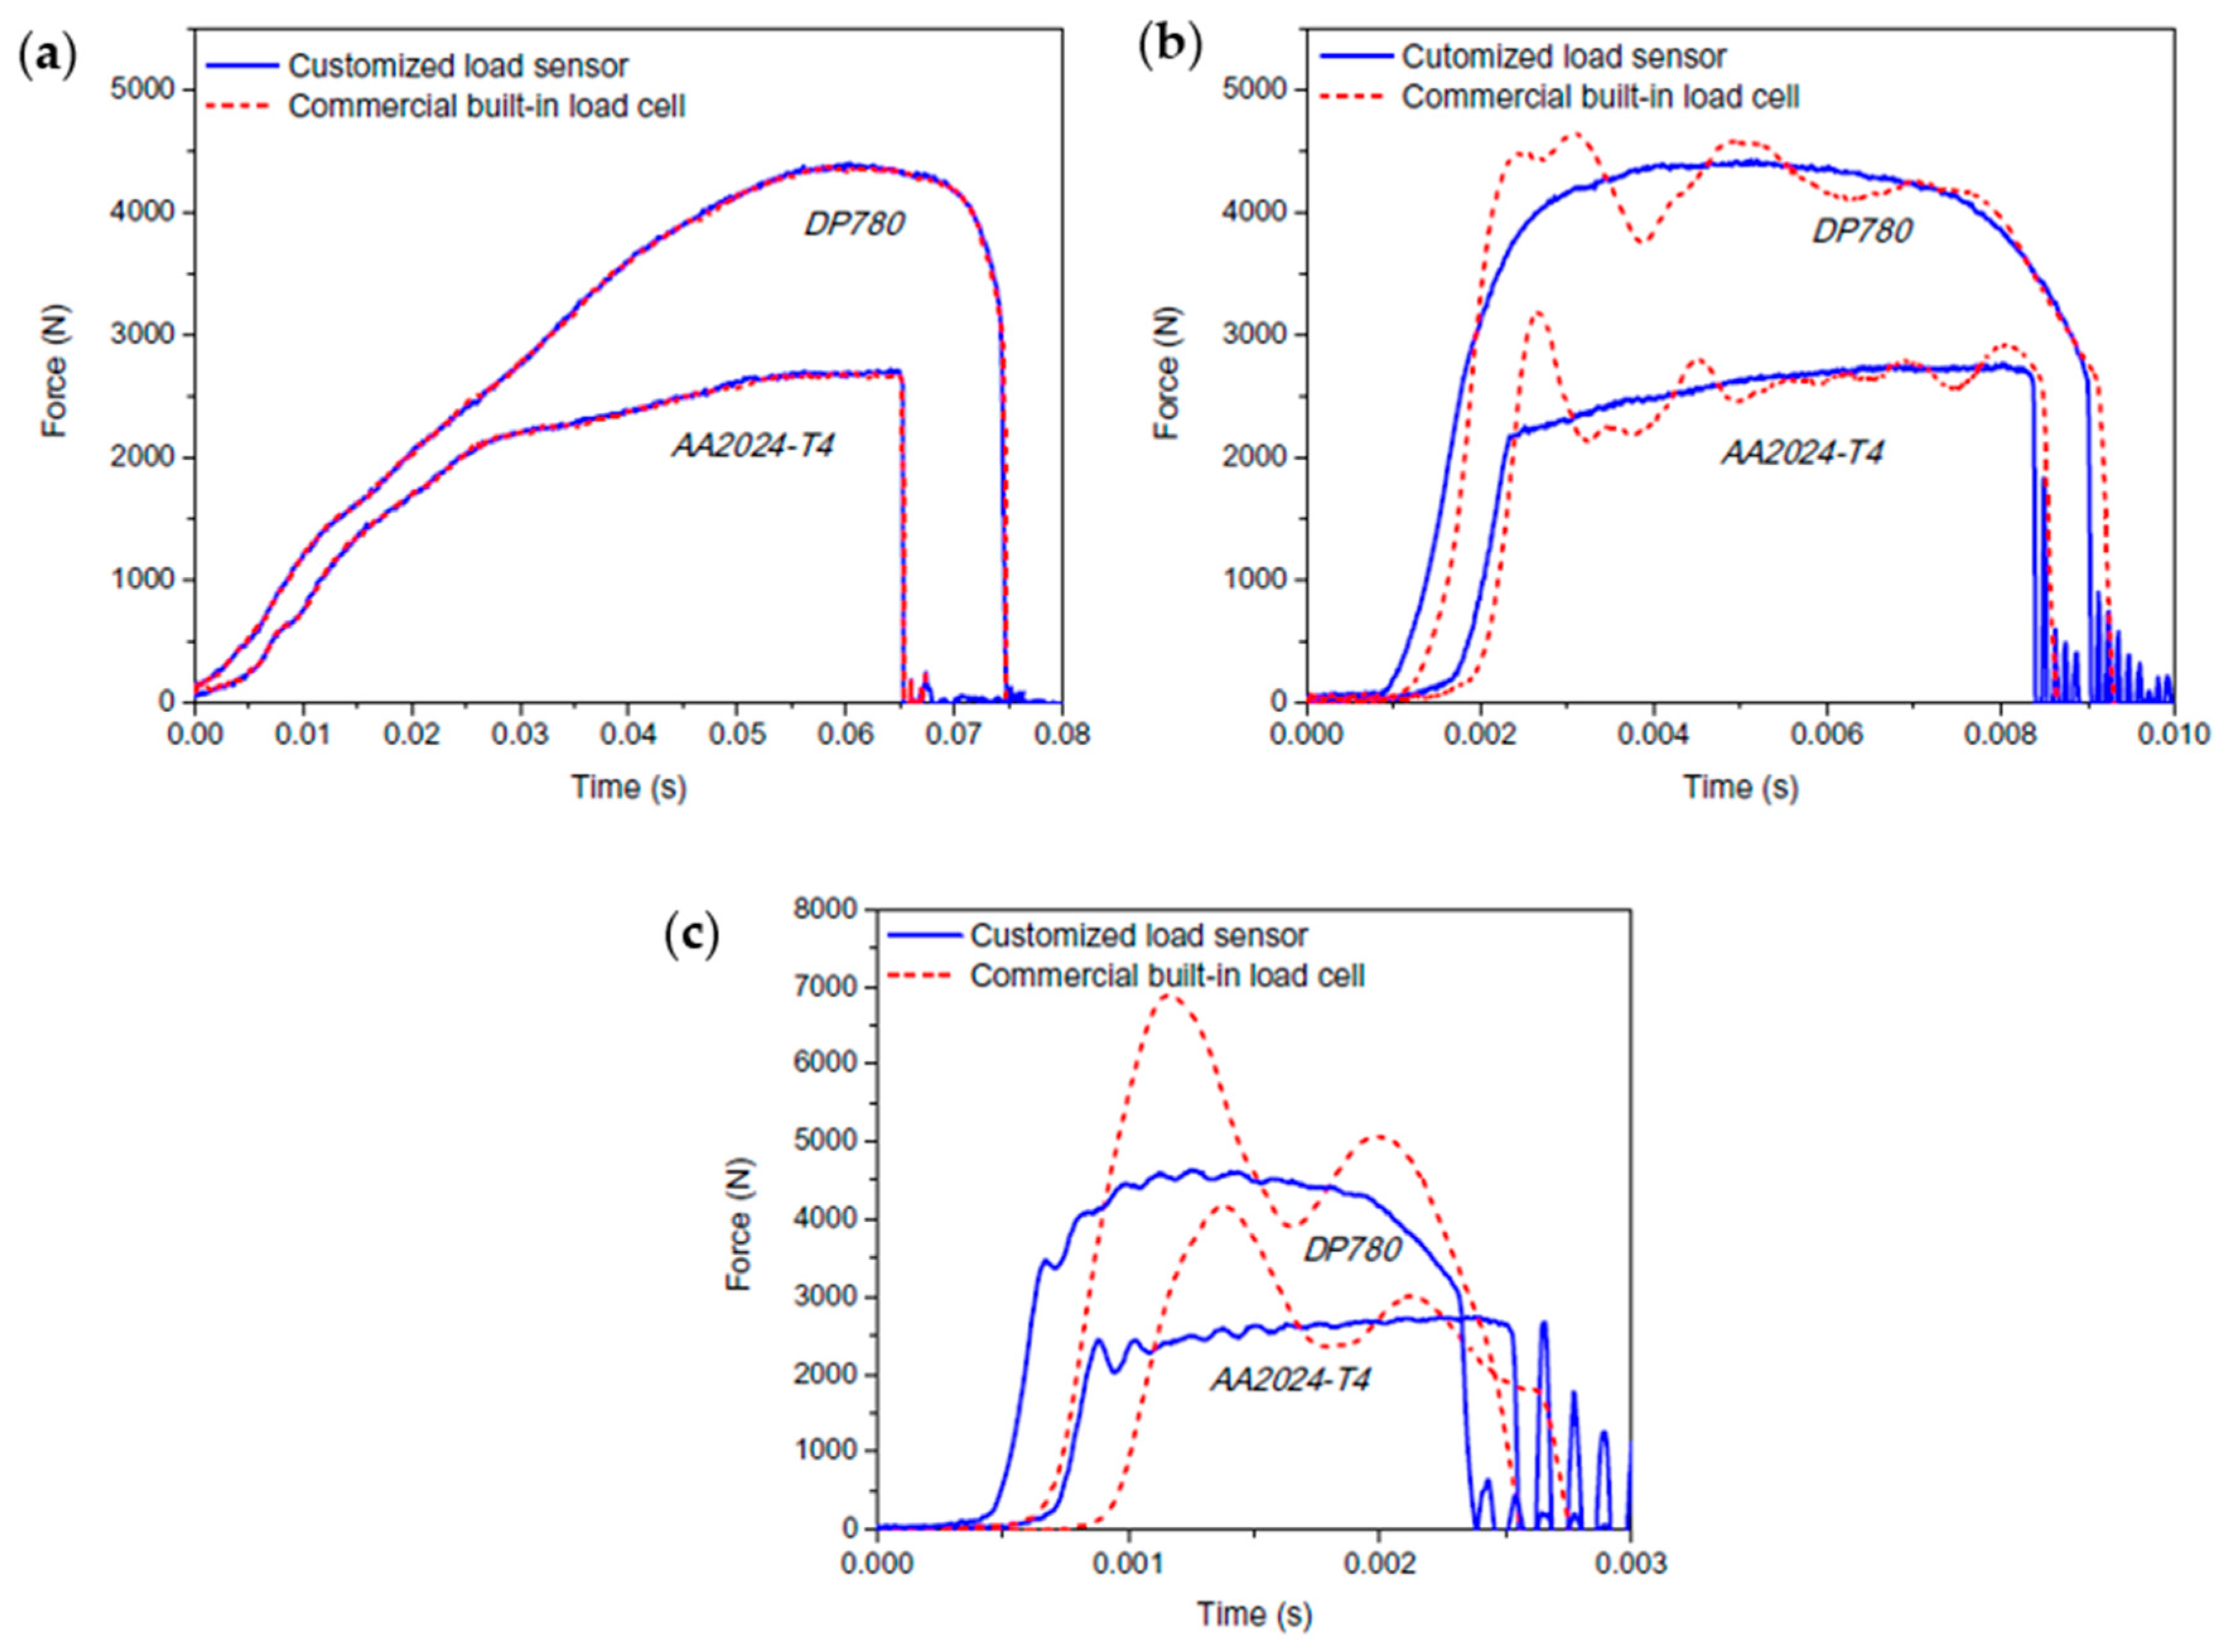
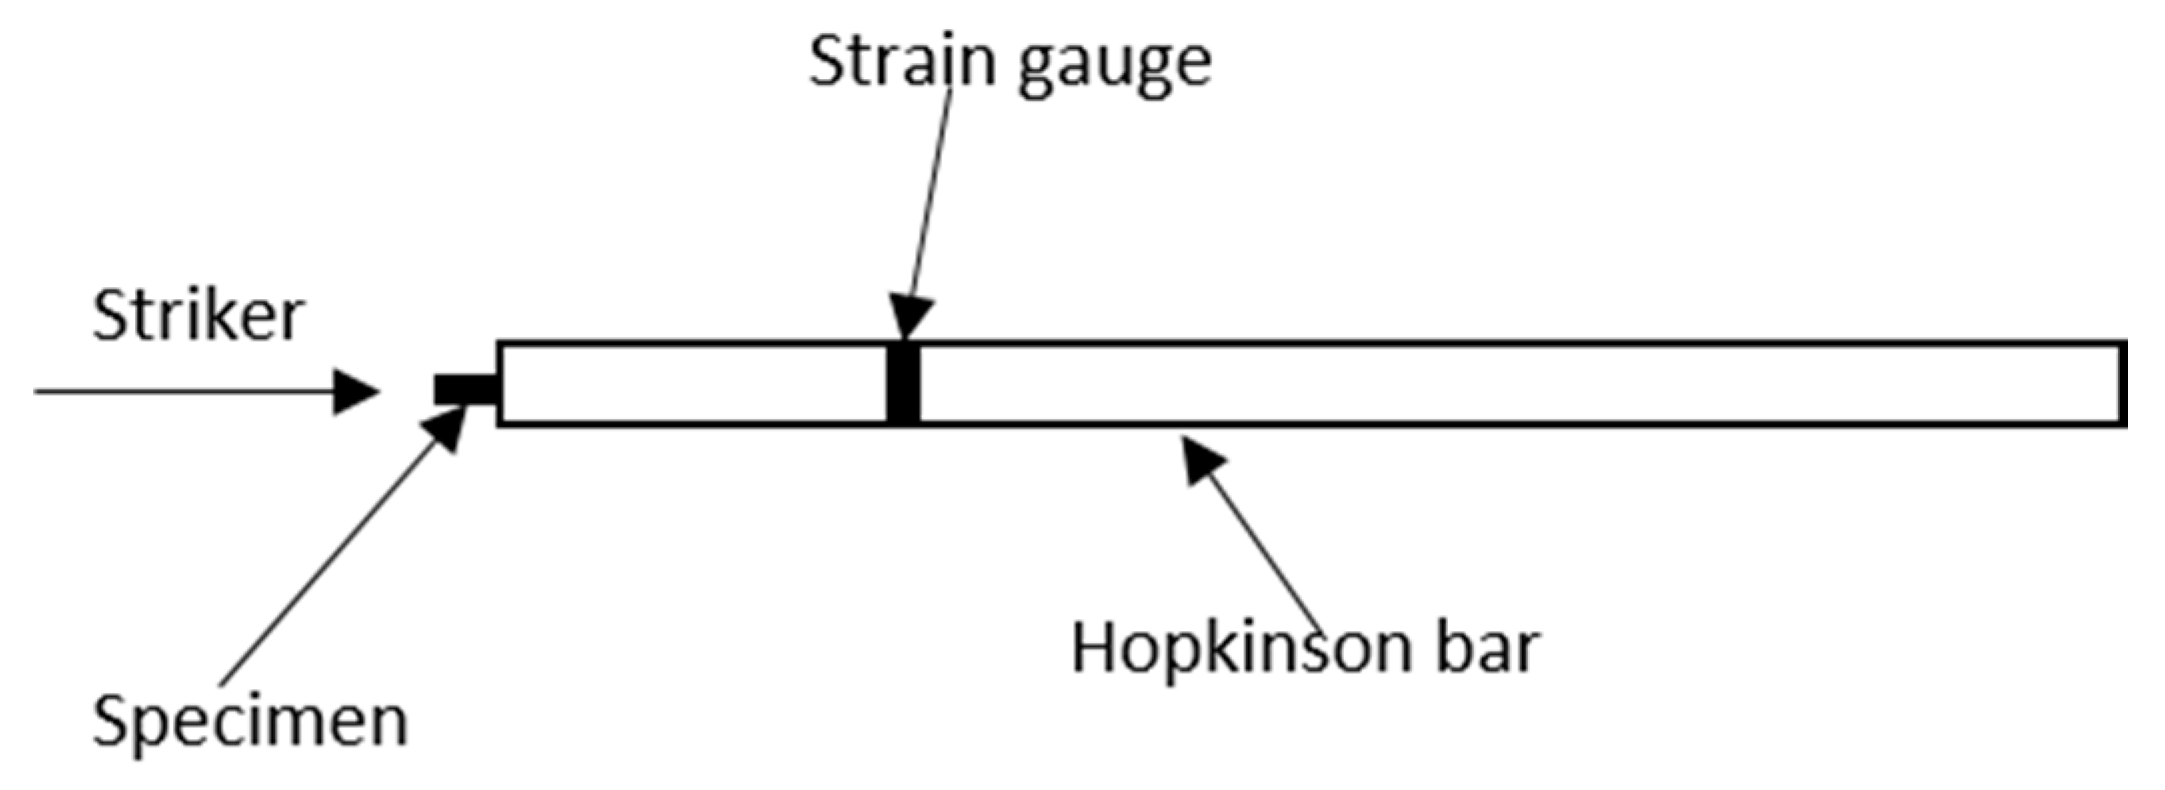
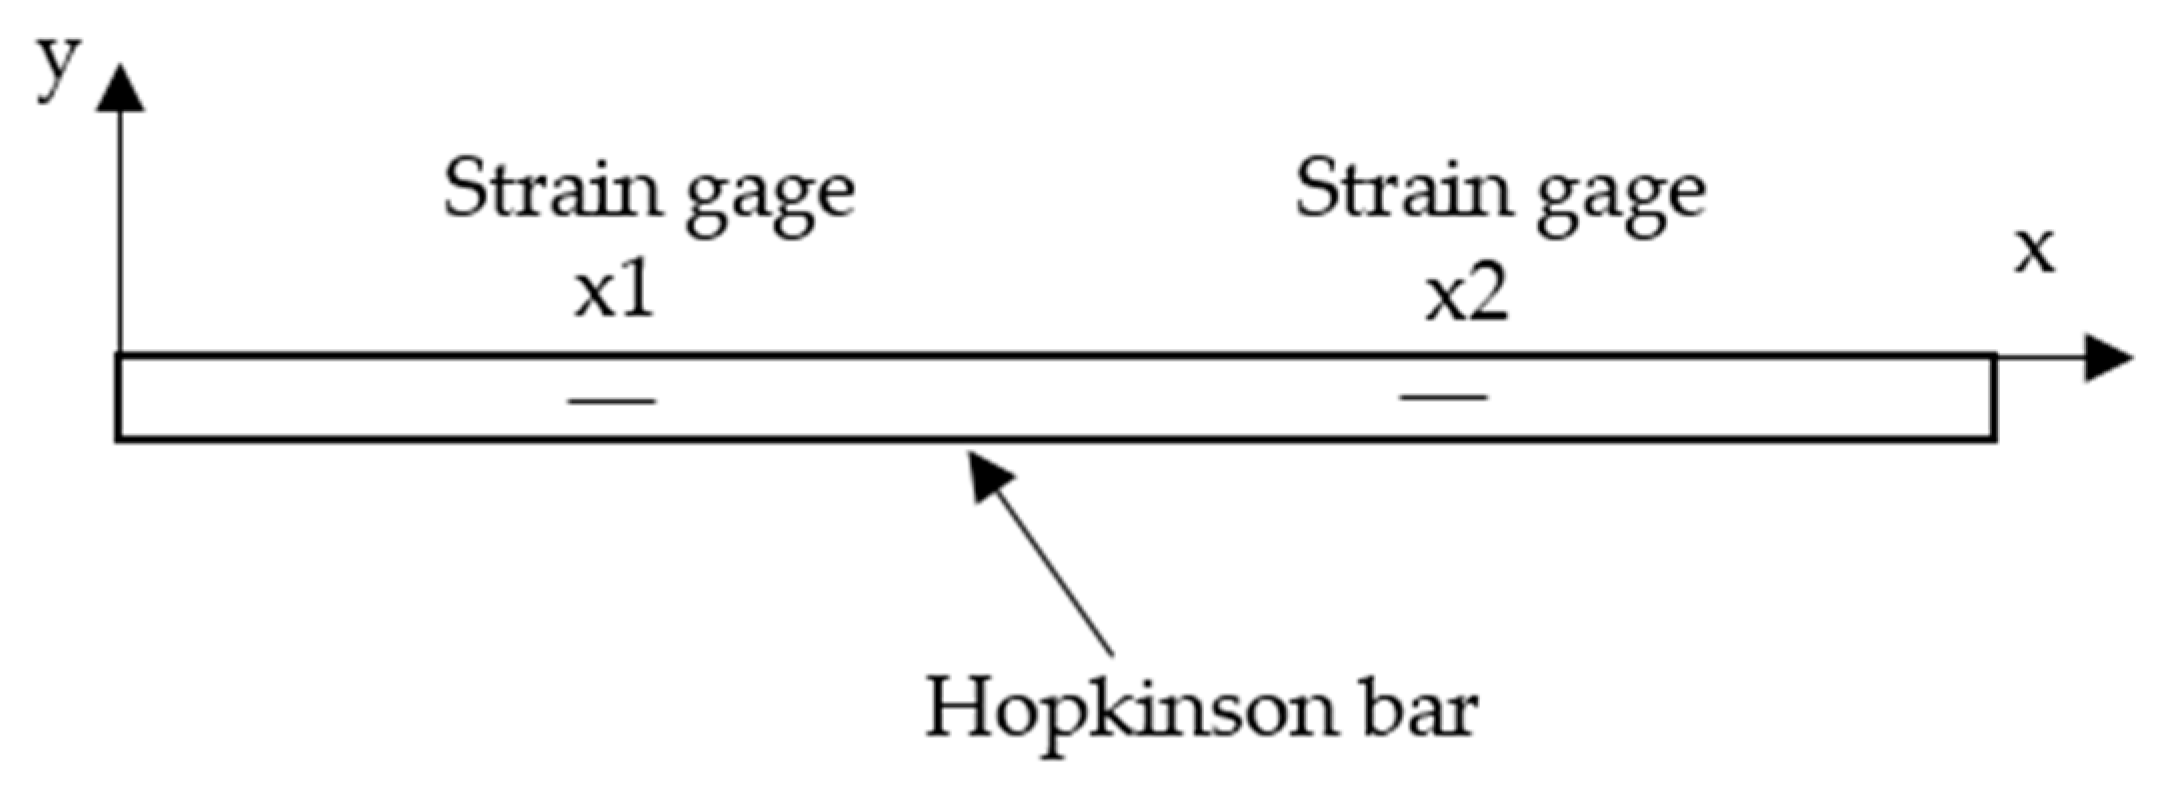
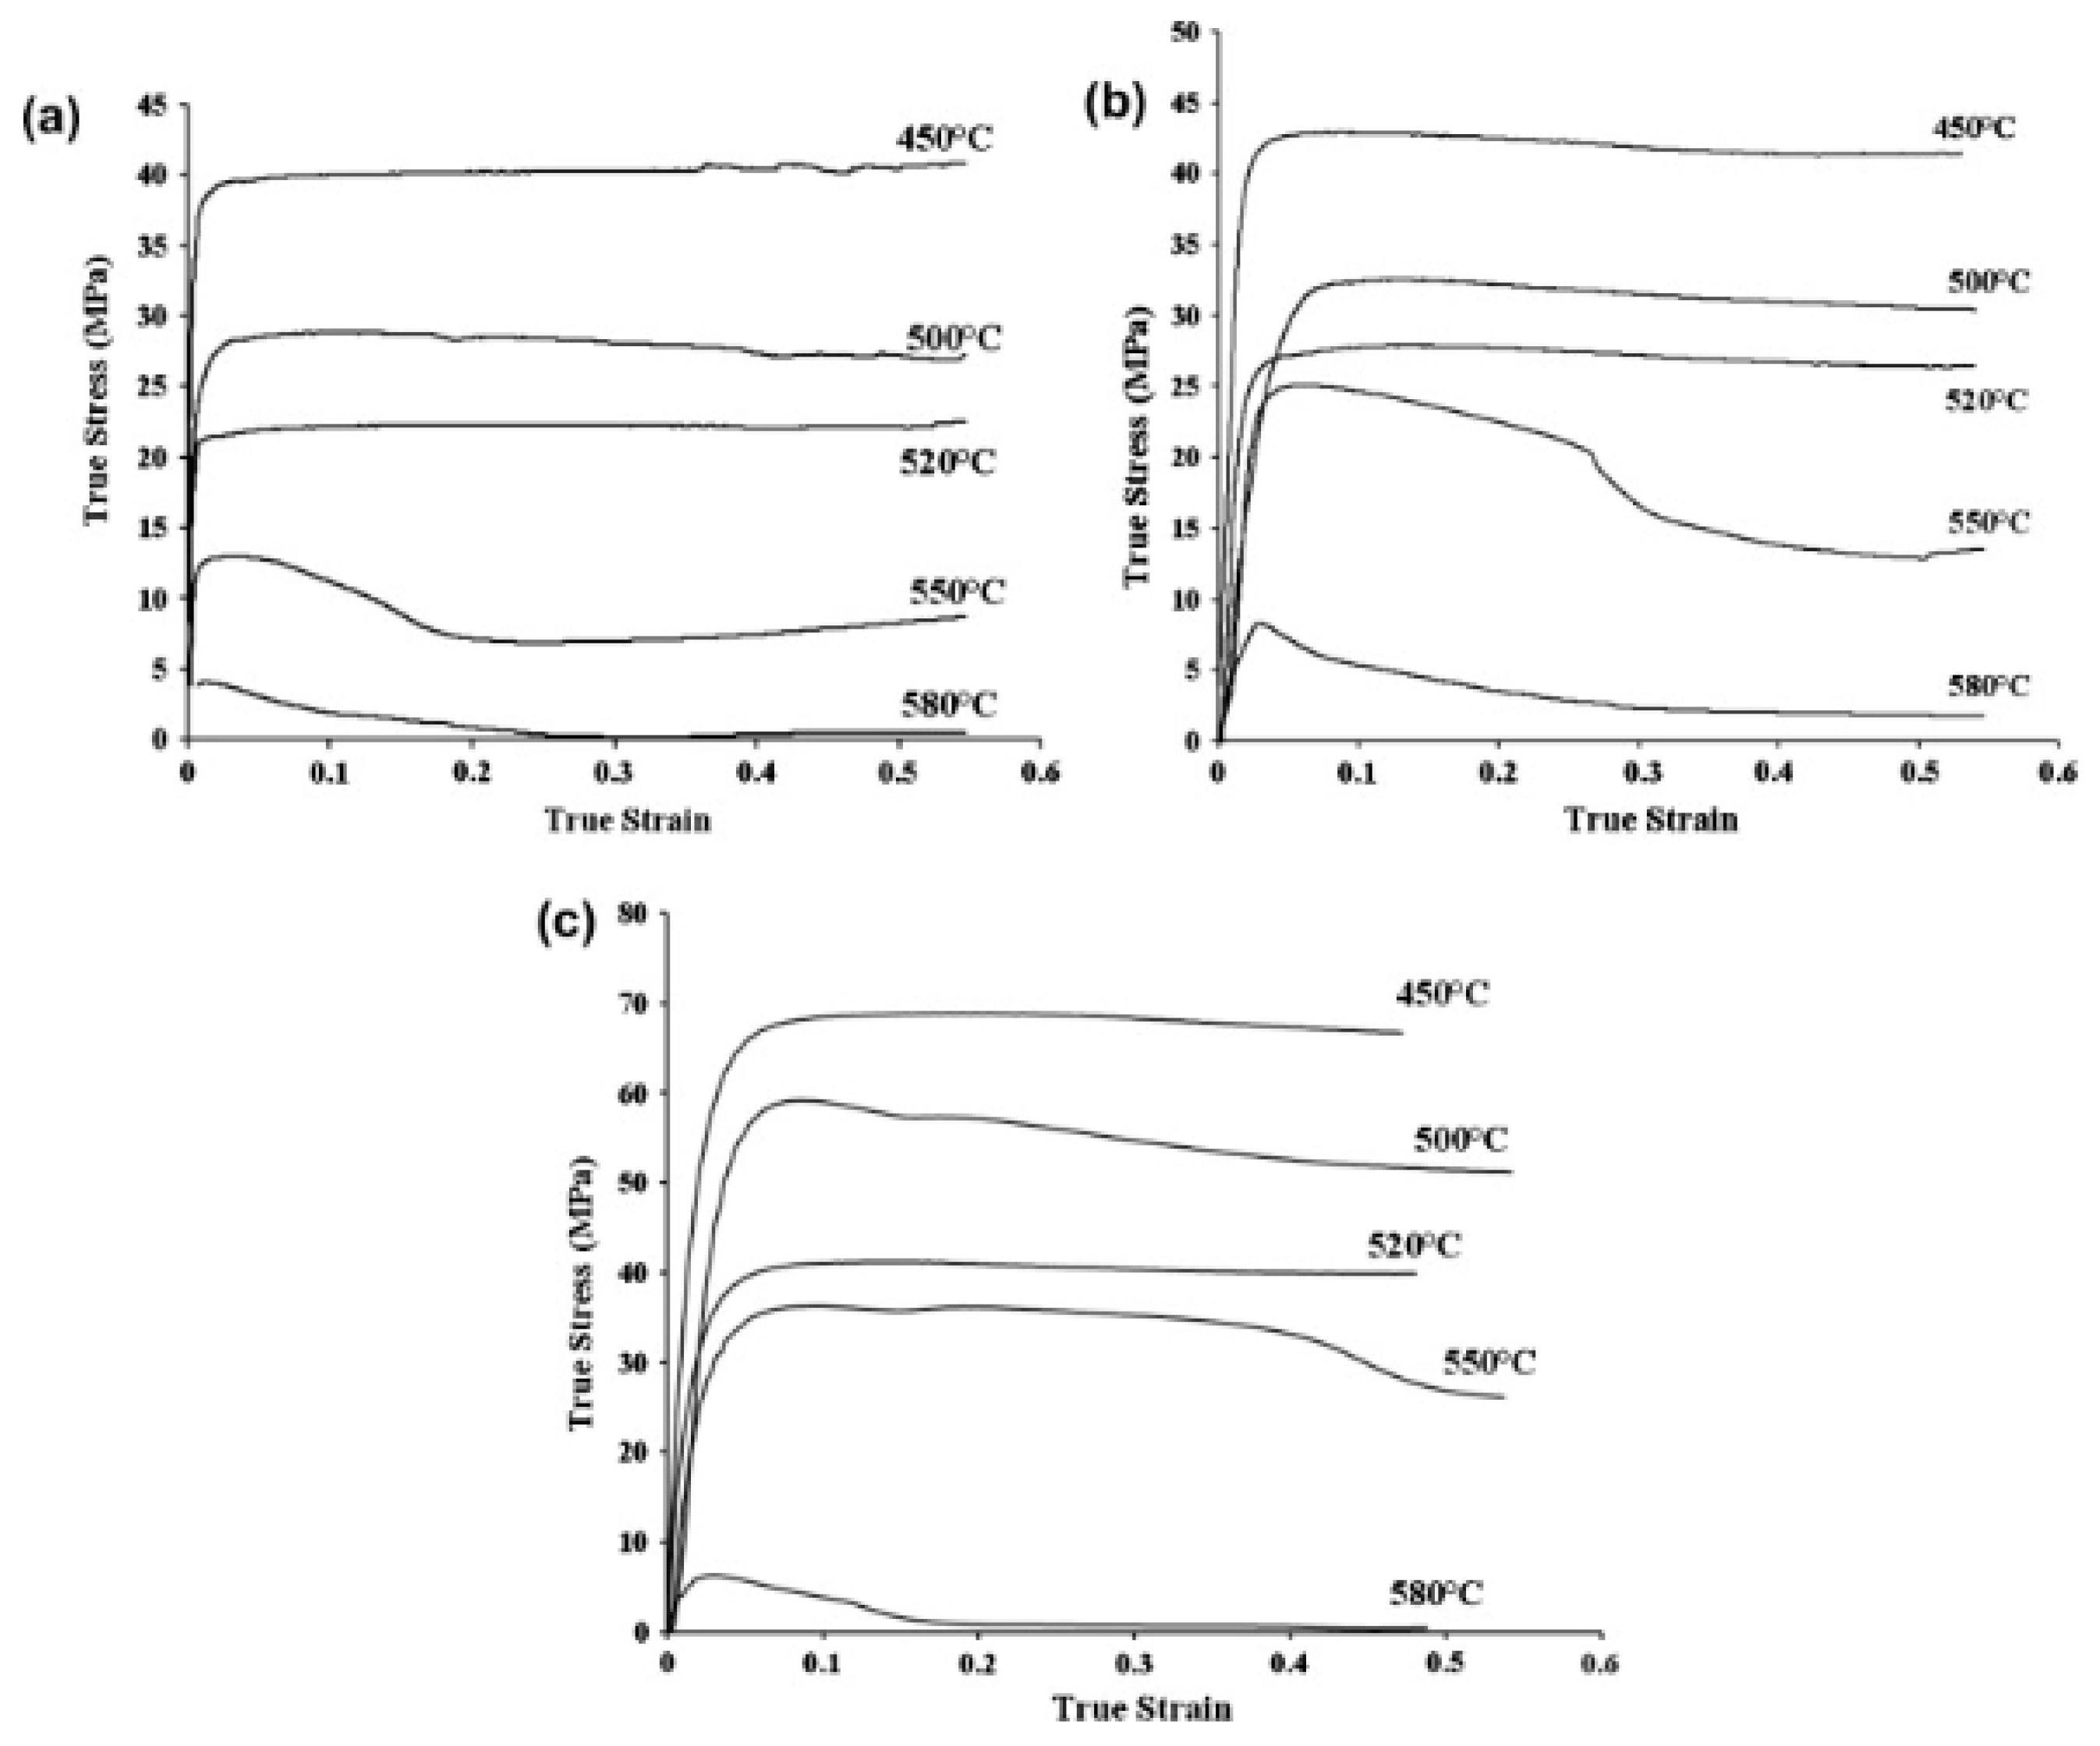
Table 1.
Typical strains, strain rates, and temperature ratio (T/Tm) of some manufacturing processes also given by [5]. (T = Temperature during the process, Tm = melting temperature of the material).
Table 1.
Typical strains, strain rates, and temperature ratio (T/Tm) of some manufacturing processes also given by [5]. (T = Temperature during the process, Tm = melting temperature of the material).
| Manufacturing Process | Strain | Strain Rate (s−1) | T/Tm |
|---|---|---|---|
| Extrusion | 2 to 5 | 10−1 to102 | 0.16–0.7 |
| Metal Forging | 0.1 to 0.5 | 100 to 103 | 0.16–0.7 |
| Machining | 1 to 10 | 103 to 106 | 0.16–0.9 |
| Sheet metal forming | 0.1 to 0.5 | 100 to 102 | 0.16–0.7 |
| Friction Stir Welding (FSW) | 0.1 to 5 | ≤102 | 0.16–0.9 |
Table 2.
Characterization of the machines based on the strain rate and type of loading.
| Testing Technique | Applied Strain Rate (s−1) | ||
|---|---|---|---|
| Low Strain Rate (≤101) | Intermediate Strain Rate (101–103) | High Strain Rate (>103) | |
| Compression Tests | Conventional load frame and servo-hydraulic machine | Commercial machines like MTS, Shimadzu, Instron, etc., Special Servo hydraulic load frames, drop tower, Flywheel device | Split Hopkinson pressure bar, Gas gun, Taylor impact test |
| Tensile Tests | Split Hopkinson bar in tension, Flyer plate, expanding ring | ||
| Shear tests | Conventional shear test, special servo-hydraulic frames, Torsion test | - | Compressive/tensile shear apparatus, Hopkinson Klosky bar in torsion |
© 2020 by the authors. Licensee MDPI, Basel, Switzerland. This article is an open access article distributed under the terms and conditions of the Creative Commons Attribution (CC BY) license (http://creativecommons.org/licenses/by/4.0/).
Share and Cite
MDPI and ACS Style
Bhujangrao, T.; Froustey, C.; Iriondo, E.; Veiga, F.; Darnis, P.; Mata, F.G. Review of Intermediate Strain Rate Testing Devices. Metals 2020, 10, 894. https://doi.org/10.3390/met10070894
AMA Style
Bhujangrao T, Froustey C, Iriondo E, Veiga F, Darnis P, Mata FG. Review of Intermediate Strain Rate Testing Devices. Metals. 2020; 10(7):894. https://doi.org/10.3390/met10070894
Chicago/Turabian StyleBhujangrao, Trunal, Catherine Froustey, Edurne Iriondo, Fernando Veiga, Philippe Darnis, and Franck Girot Mata. 2020. "Review of Intermediate Strain Rate Testing Devices" Metals 10, no. 7: 894. https://doi.org/10.3390/met10070894
Note that from the first issue of 2016, this journal uses article numbers instead of page numbers. See further details here.