Numerical Investigation into Gas-Particle Inter-Phase Combustion and Reduction in the Flash Ironmaking Process


School of Energy Science and Engineering, Central South University, Changsha 410083, China
*
Authors to whom correspondence should be addressed.
Metals 2020, 10(6), 711; https://doi.org/10.3390/met10060711
Submission received: 28 April 2020
/
Revised: 23 May 2020
/
Accepted: 24 May 2020
/
Published: 28 May 2020
Abstract
:Despite the dominance of the blast furnace ironmaking process, more attention is being paid to the new technologies with lower energy consumption and carbon dioxide emissions. A novel flash ironmaking technology using pulverized coals and iron concentrates as raw materials, which is different from flash ironmaking with the reductive gas as the reducing agent, is studied. In order to obtain the flow patterns, temperature, and gas composition distribution, as well as particle trajectories in the reaction shaft of the flash ironmaking furnace, the Euler–Lagrangian model with a custom user defined function (UDF) code is used to simulate the processes of the fluid flow, heat and mass transfer, and chemical reactions, including the combustion reaction of pulverized coals and reduction reaction of iron concentrates. The results indicate that the flow patterns, temperature, and gas composition distributions present symmetrical distribution characteristics. The central oxygen expands rapidly after entering the reaction shaft and its distribution is approximately bell-shaped. The temperature distribution in the reaction shaft is wing-shaped. The maximum temperature, 2615 K, is reached at 5 m below the roof of the reaction shaft. The O2 is quickly consumed after entering the reaction shaft. At 6 m below the roof of the reaction shaft, the oxygen concentration becomes almost zero, with the CO concentration reaching the highest. The Fe2O3 and FeO in the iron concentrates are mostly reduced to Fe at 9 m below the roof of the reaction shaft, and more than 95 wt% iron particles could be obtained within 1.2–7.7 s.
1. Introduction
Steel and iron products are currently the most important structural materials, and are the functional materials with the largest output and the widest coverage [1]. With the rapid growth of the Chinese economy, there has been unprecedented growth in the iron and steel industry. In 2018, China’s steel production was more than 1.1 billion tons, most of which came from the blast furnace process. However, long processes, high-energy consumption, poor adaptability to poor resources, and especially environmental pollution problems are becoming increasingly prominent in the blast furnace process. To tackle the environmental and resource issues, a series of alternative ironmaking processes have been rapidly developed in recent decades, such as COREX, Midrex, FINEX, HIsarna and flash ironmaking [2,3]. The flash ironmaking technology, known as suspension reduction technology, is an advanced technology that aims at producing iron directly from iron concentrates without requiring palletization or sintering and also avoids the need for coke. The characteristic of the large specific surface area of iron concentrates is utilized to complete the reduction reaction at a very fast speed in the furnace with high temperature and a carbon monoxide atmosphere [4,5]. The chemical kinetics are incomparable because of the short process, less equipment required, and small energy consumption [6,7]. In order to increase steel production, and to effectively get rid of the shortage of coke resources and to save energy, it is important to conduct in-depth theoretical research on the flash ironmaking process.
Flash ironmaking technology has been developed since 2007, generally using natural gas, CH4, CO, H2, and pulverized coal as reducing agents. The technology was first conceived by Sohn [8] at the University of Utah, with reductive gas as the reducing agent. In recent years, Sohn and co-workers have conducted many interesting studies about the flash ironmaking process. Wang et al. [9,10] performed a set of experiments where H2 was used to reduce the magnetite concentrate within different temperature ranges, obtaining nucleation and growth kinetics expression, which could be used to formulate the reduction rate of fine concentrate particles. A series of experiments were performed by Elzohiery et al. [11] where CH4 was partially oxidized by oxygen to form reducing H2 + CO gas mixtures. The experiment proved that the concentrate particles can be reduced directly in a flash reactor, and more than 80% reduction was achieved in the reactor. A computational fluid dynamics (CFD) model of a large-scale bench reactor for flash ironmaking was developed by Abdelghany et al. [5] to simulate the novel flash ironmaking process, which is based on the partial combustion of natural gas in the reactor. The reduction degrees and composition of the off-gas were obtained and compared with the experimental results, which is of great significance in the design and optimization of larger reactors. These works have given us certain insights into the flash ironmaking technology, but the reductive gases, such as natural gas, CH4, CO, and H2, are expensive, flammable, explosive, and not easy to store. As is well known, China is rich in coal resource. Gong and Wang et al. [12,13] used pulverized coals and iron concentrates as raw materials to carry out a lot of experiments in the flash ironmaking furnace, which is quite different from the studies by Sohn and co-workers. The prototype design of the key equipment and software package for the flash ironmaking furnace has almost been finished, which is a milestone of the development of the Chinese flash ironmaking furnace. However, the chemical reaction and physical field of the reaction shaft in the flash ironmaking furnace, with pulverized coals as the reducing agent, are obscure, whereas these are the core of the design of the reaction shaft. So, it is necessary to visualize the smelting process in the shaft through numerical simulation.
In this study, novel flash ironmaking technology using pulverized coals and iron concentrates as raw materials is studied. In order to obtain the flow patterns, temperature, and gas composition distribution, as well as the particle trajectories in the reaction shaft of the flash ironmaking furnace, a numerical model of the flash ironmaking process is established and calculated. The Euler method is used to solve the gas-phase governing equations and the Lagrangian method is used to solve the particle-phase governing equations. The ANSYS FLUENT software and custom user defined routine are employed to numerically simulate the smelting process of the flash ironmaking furnace, including the heat and mass transfer between the gas and particles phase, coal combustion, and reduction of iron concentrates. It can provide theoretical guidance for the structural design, optimizing operations, and feeding ratio of the flash ironmaking furnace.
2. Model Description
2.1. Physical Model
Flash ironmaking is an advanced technology that aims to reduce iron concentrates directly at a very fast speed in the furnace under high temperature and carbon monoxide atmosphere. Figure 1 shows the schematic of the flash ironmaking furnace, consisting of the reaction shaft, settler, and uptake. At the beginning of the smelting process, fine pulverized coal and 99% pure oxygen are injected from the nozzle and dispersed in the shaft to carry out a series of complex combustion reactions, releasing a lot of heat and creating a reducing atmosphere of carbon monoxide. Then, fine iron concentrates drop freely from the inlet, being reduced rapidly by high-temperature reducing gas during the falling process. Eventually, reduced metallic iron and off gas are separated through the settler and uptake. Due to the high temperature and violent redox process in the furnace, it is difficult to obtain the relative parameters through experiments. However, the flow patterns, temperature, and gas composition distribution, as well as particle trajectories, are very important for the safe operation of the flash ironmaking furnace. Therefore, in the present work, the numerical simulation method was used to visualize the distribution of the physical field in the furnace.
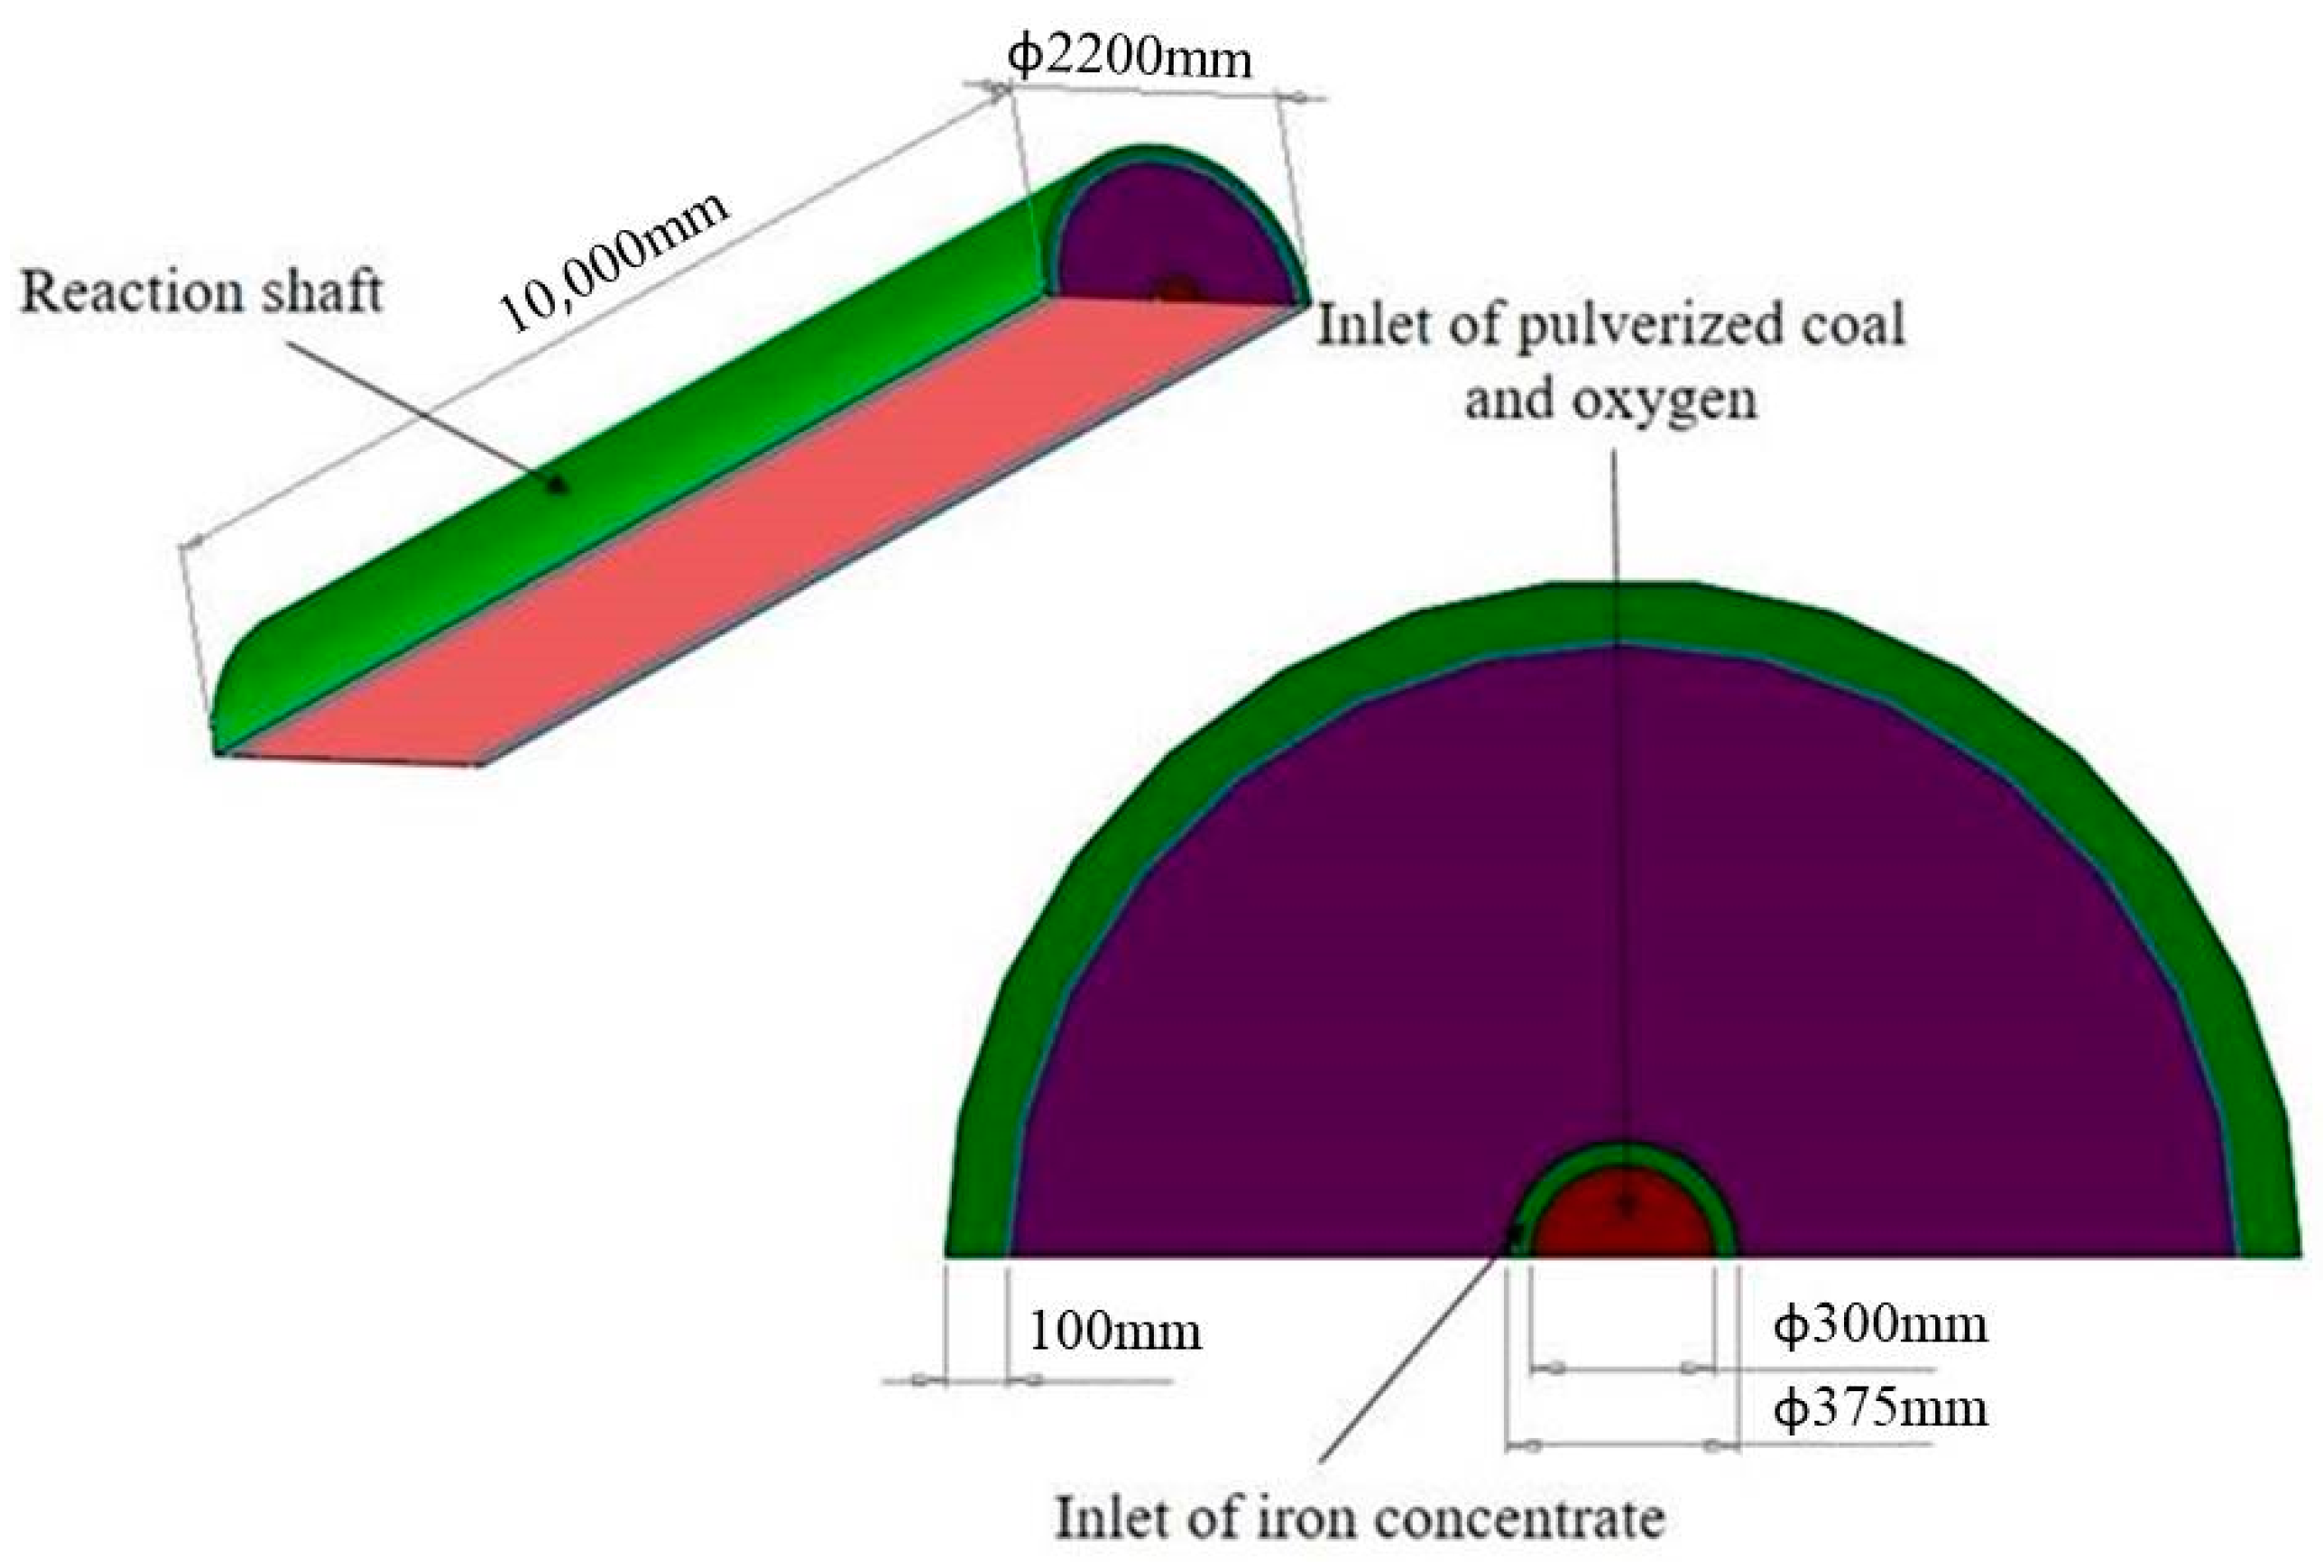
The smelting process of the flash ironmaking belongs to the gas-particle two-phase mixing flow. The processes of flow, mixing, pulverized coal combustion, and reduction of iron concentrates occur in the reaction shaft. The simulation study of the reaction shaft is very significant for the operation of the flash ironmaking furnace. The reaction shaft, with a height of 10 m, was taken as the research object. In order to effectively reduce the number of meshes and calculation time, only half of the reaction shaft was taken as the computational domain, because the reaction shaft is cylindrical and has good symmetry in structure. The physical model of the reaction shaft is shown in Figure 2.
The unstructured grid was adopted, and the total number of grids was 2,348,938. As the inlet of the central oxygen and pulverized coals is small and the thickness of the reaction shaft wall is thin, in order to improve the calculation accuracy, these computational domains were locally refined when the reaction shaft was meshed. Compared to the calculation results of the dense mesh size, the test of mesh independence showed that the relative error of temperature and concentration in the reaction shaft is less than 5%.
At boundaries, the inlet velocity of central oxygen was 12 m/s. The flow of pulverized coal and iron concentrate were 2.95 t/h and 6.48 t/h, respectively. The outlet of the reaction shaft was set as the free outflow, the symmetry plane of the reaction shaft was set as symmetric boundary, and the rest were set as constant temperatures based on the measurement of the spot.
2.2. Mathematical Model
The smelting process in the reaction shaft involves the exchange of momentum, heat, and mass between the gas and particles. In this study, the gaseous model was based on the Euler method, and the particle phase was based on the Lagrangian method. The standard k-ε model was used to describe the turbulence.
2.2.1. Basic Assumptions
For the smelting process in the reaction shaft, the following simplifications were put forward:
(1) Particles including pulverized coal and iron concentrate were assumed to be spherical with specific equivalent diameters, and the shape factor of the particle was 1;
(2) The solid phase included pulverized coal, Fe2O3, FeO, Fe3O4, and Fe. The gas phase was assumed to be a mixture of volatile, O2, CO, CO2, H2O, SO2, and N2;
(3) The influence of furnace slagging on the inner shape of the reaction shaft was ignored.
2.2.2. Gas-Phase Governing Equations
The governing equations include the continuity equation, momentum equation, energy equation, and species transport equation. These equations in steady state can be expressed in the following general form [14,15,16,17,18]:
where ρ is the gaseous density, v is the velocity, φ is the general dependent variable, Γφ is effective diffusion coefficient, Sφ is the source term of the gaseous phase, and Spφ is the source term generated from the interaction between gas and particles. When using Equation (1) to solve different equations, the specific forms of the variables are listed in Table 3.
In Table 3, μ0 is molecular viscosity, μT is the turbulence viscosity, h is the enthalpy, Yi is the mass fraction of species i, δh and δY are dimensionless numbers of the corresponding equation. μeff is the effective viscosity (the sum of molecular viscosity and turbulent viscosity), p is the static pressure, qr is the heat source due to the chemical reaction and radiation, and wi is the source terms of the gas species.
2.2.3. Particle-Phase Governing Equations
The particle trajectories of pulverized coals and iron concentrates were solved by the Lagrangian discrete phase model (DPM). The uniform distribution function was used to represent the particle size distribution, and the governing equation was given by [16,17,18,19]:
where mp is the mass of the particle, vp is the velocity vector of the particle, g is the gravity acceleration, ρp is the density of the particle, FD is the drag force, and F is the additional force born by the particles. The additional force here represents forces related to the velocity gradient, pressure gradient, and the temperature gradient where they exist.
The heat transfer between the particle phase and the continuous phase can be solved by the following equations [18,19]:
where Cp is the specific heat of the particles, and Tp is the temperature of a particle. Qr, Qc, and Qrad represent the heat caused by the reaction, convection, and radiation between the gas and particles, respectively. dp is the average diameter of the particles, λ is the thermal conductivity of the particles, Re is the Reynolds number, μ is the dynamic viscosity, and Tg and Tp are the temperatures of the gas phase and particles, respectively. ε’p is the emissivity of particle surface, εg is the emissivity of the gas phase, ag is the absorption rate of the gas phase, and σ is the Stefan–Boltzmann constant.
2.2.4. Combustion Modeling
The combustion process of pulverized coals is comprised of heating and evaporation, devolatilization, char oxidation, and gas phase reactions. The combustion process starts when the temperature of the coal particles is 100 °C, at which point the moisture evaporates and moves into gas phase [20]. Additionally, the devolatilization process begins at a particle temperature of 280 °C [21]. In the present study, the single rate equation was used to simulate the devolatilization process [21]. The change in the volatile mass of the coal particles was calculated by:
where mvol is the mass of the volatile released from the coal particles, and m0,vol is the initial volatile mass of the coal particles before combustion. R is the gas constant and T is the particle temperature. Avol is the pre-exponential factor and Ea,vol is the activation energy. The empirical constants [22] used in present work were:
After the volatiles are completely driven out from the coal particles, the char oxidations start. The diffusion kinetics limited char combustion is used in the CFD model [23]. The char oxidation is affected by the diffusion rate of O2 to the particle surface and the chemical reaction rate of the char oxidation process. Additionally, the char oxidation product is CO or CO2 in this model. The oxidation product was CO in the present work, so the reaction of the char oxidation and the rate of char oxidation are shown in Equations (9) and (10), respectively:
where AP is the particle surface area, Rdiff is the rate coefficient for the oxygen diffusion, Rc is the chemical reaction rate coefficient, and PO2 is the partial pressure of oxygen in the gas phase surrounding the fuel particle.
The kinetics rate parameters for char oxidation were taken from the work by Sheng et al. [22], and the empirical constants used in the present study were:
Once the volatiles from the devolatilization and CO from the char oxidation are released into the gas phase, they would react with oxygen. The rate at which these species are oxidized is a function of the Arrhenius rates of the chemical reactions and the turbulence interaction with the chemical reactions [20]. The gas phase reactions solved in the shaft are:
C1.45H2.88O0.55N0.0376S0.0091 is the pseudo volatile molecule. In our study, the eddy dissipation finite rate model was used [20,24]. The chemical Arrhenius rate of the reaction, the rate of the turbulent production eddies dissipation, and the rate of the dissipation of reaction eddies are shown in Equations (16)–(18). The gas combustion rate depends on the smallest of the three rates and the slowest step is the rate-controlling step.
where YR is the mass fraction of a particular reactant R and YP is the mass fractions of any product species P. Mw,j is the molecular weight of species j. vk,r is stoichiometric coefficient for reactant k in reaction r, [Cl,r]m,r is the molar concentration of species l in reaction r with a rate exponent of m.
Ar is the pre-exponential factor of the chemical reaction r, and Ea,r is the activation energy of reaction r. The constants for the reaction in Equation (14) are shown in Equation (19), and the constants of CO oxidation in Equation (15) are shown in Equation (20).
2.2.5. Reduction Reactions
The reduction reactions of the iron oxides considered in this model are listed in Equations (21)–(23) [27,28,29]. FeO is directly reduced to Fe at the appropriate temperature and carbon monoxide atmosphere. Fe2O3 is first reduced to Fe3O4, then to FeO, finally to Fe.
According to previous works [29,30,31], the general reaction rate expression was used to describe the reduction reactions by:
where Rn is the chemical reaction rate of reaction n (kmol·m−3·s−1), n = 1,2,3, corresponding to Equations (21)–(23), αs is the volume fraction of the solid phase in shaft furnace, fs is the volume fraction of the species, φs is the shape factor of the solid particles. ds is the diameter of solid particles; wco,g and wco2,g are the mass fractions of CO and CO2, and MCO and MCO2 are the mole masses of CO and CO2. W and an,m are grouped variables comprised of the parameters which characterize the reaction, including the equilibriums and rate constants, effective diffusivities, solid phase compositions, and radii of the unreacted cores from previous works [29,30,32]. In this study, the reduction reactions listed in Equations (21)–(23) were simulated with the shrink core model separately and the corresponding reduction reactions were assumed to be finished when their equivalent diameter was smaller than 0.74 μm.
2.3. Numerical Solution Technique
To solve the equations established and to obtain the flow field, temperature, species concentration distributions, and particle trajectories, the ANSYS FLUENT 18.0 software (Pittsburgh, PA, USA) with a custom UDF code was used. The PISO algorithm was used to couple the pressure and velocity. The first order upwind discretization scheme was chosen for the equations of species transport, and the second order upwind discretization scheme was chosen for other equations. During the solution, only the equations of flow and energy were initially solved to obtain a quasi-steady flow field in the reaction shaft of the ironmaking furnace. Then, the equation of species transport, radiation model, and discrete phase model was activated. The residuals for the conservation equations were set as 10−6.
2.4. Model Verification
Due to the exploration stage of the novel flash ironmaking furnace, as well as the high temperature in the shaft, it is difficult to measure the relative parameters in the shaft of the flash ironmaking furnace. In this paper, two thermocouples were used to measure the gas temperature in a test furnace. Table 4 shows the simulated and measured results of the gas temperature, which proves a good accuracy of the mathematical model for the flash ironmaking process. The vertical distance below the roof of the reaction shaft is referred to as the shaft height H, and r is the distance from the measuring point to the center axis.
3. Results and Discussion
3.1. Velocity Distribution
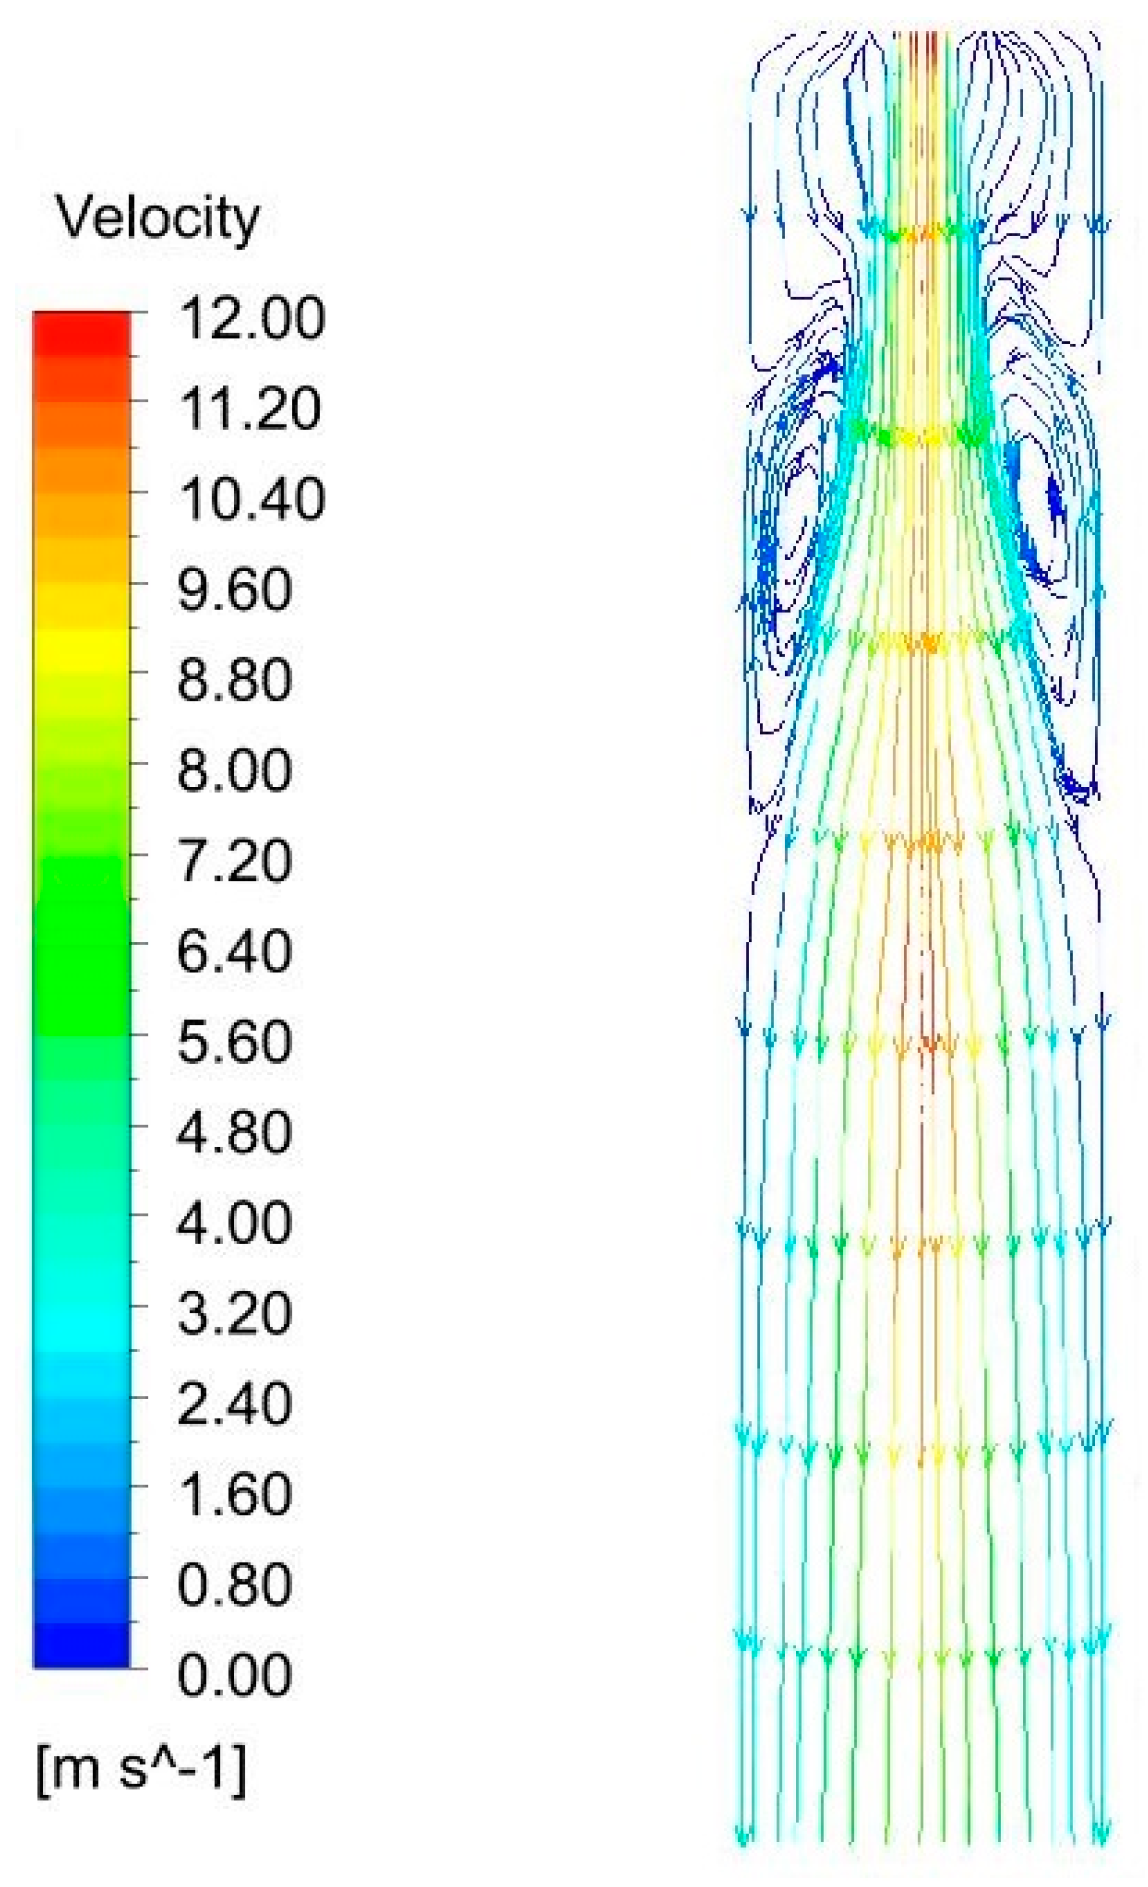
Figure 3 and Figure 4 show the velocity contour and streamline diagram on the symmetry plane, respectively. It can be seen from Figure 3 that the flow in the reaction shaft presented a symmetrical distribution, and the high-velocity region where the velocity reached 12 m/s was mainly located at the inlet of the shaft. After the central oxygen was fed into the reaction shaft, a bell-shaped gas column was formed in the center of the shaft, surrounded by recirculating flows in the upper section near the shaft wall, as shown in Figure 4. At the same time, the gas flow continuously attenuated and homogenized during the movement so that the speed dropped along the flow direction. As a positive aspect, the existence of the recirculating flows can suppress the expansion of the main gas column and provides protection to the shaft wall. The hot gas in the lower part can be brought up to the upper part and becomes an important heat source for heating cold gas and particles. As a negative fact, the presence of recirculating flows rolls up the particles in the lower part and increases the dust in the furnace, which will exacerbate the scour of the refractory material and put forward higher requirements for scour resistance of the refractory material [33].
3.2. Temperature Distribution
The gaseous temperature within the reaction shaft was also simulated to indicate the smelting performance. The temperature contour in the reaction shaft is illustrated in Figure 5. Pulverized coals, oxygen, and iron concentrates, which were mixed in a certain ratio, were injected into the shaft. When the temperature and gas concentration reached the ignition condition, pulverized coals ignited and underwent intense combustion chemical reactions [34]. As can be seen from Figure 5, except for an obvious low temperature zone below the inlet, the temperature distribution was wing-shaped with high temperatures. Normal temperature oxygen, pulverized coals, and iron concentrates were heated by the high temperature gas during the injection process. During the heating process, the combustion chemical reaction between O2 and pulverized coals took place violently, and produced CO and CO2 gases, and also emitted a lot of heat, making the gas-phase temperature in the reaction shaft rise significantly along the direction of the gas flow. The maximum temperature, 2615 K, was reached at approximately 5 m below the roof of the reaction shaft. The temperature in the lower part of the shaft was more uniform, and large gradients existed in the upper part, especially near the central line of the reaction shaft. Affected by recirculating flows near the wall, high-temperature gas in the lower part was transferred to the upper side of the shaft, so the temperature in the upper zone of the reaction shaft was also high.
Plots were made of gaseous average temperature along the height of the shaft, as shown in Figure 6. Due to the violent combustion and the recirculating flows, the average gas temperature increased within 0–5 m below the roof of the reaction shaft. With the injected O2 consumed, as shown in Figure 7a, the combustion reaction stopped gradually and the gas temperature decreased between 5–10 m below the roof of the reaction shaft. The average gas temperature along the height first increased and then reduced slowly, the maximum of which was located at 5 m below the roof of the reaction shaft, suggesting that the combustion between the pulverized coals and O2 mainly happened in the upper section of the shaft.
3.3. Concentration Distribution
The concentration distribution of O2, CO, and CO2 on the symmetry plane is a good indicator of the smelting performance (as shown in Figure 7). It can be seen from Figure 7a that the highest mass fraction of oxygen was 99 wt% and the lowest is almost 0. The oxygen injected was quickly consumed and the oxygen concentration decreased rapidly with the combustion reactions. At 6 m below the roof of the reaction shaft, the O2 concentration was almost 0, indicating that the combustion chemical reaction between O2 and pulverized coals had basically been completed, which is almost consistent with the above results.
It can be seen from Figure 7b that the highest mass fraction of CO was 34 wt%, and the lowest was almost 0. Except for a low CO concentration zone below the inlet, CO was basically present. After the pulverized coals were fed into the reaction shaft, CO was immediately generated because the temperature of the particles increased rapidly under high-temperature radiation and heat convection, as well as the violent reaction of coal particles with O2. From Figure 7b, the CO mass fraction in the down side of the reaction shaft was larger than that in the upper side, which may have been caused by the completion of the reduction reaction of most iron concentrates and the exhaustion of oxygen in the lower shaft.
It can be seen from Figure 7c that the highest mass fraction of CO2 was up to 62 wt%, and was located in the upper section near the wall. The reason is that the pulverized coal was fully burned due to sufficient O2 below the inlet, and there were many recirculating flows in the upper section near the wall. Comparing the CO2 in the upper side of the reaction shaft and in the down side, lower CO2 concentration was present in the down side, which was caused by the formation of massive CO because of the incomplete combustion of pulverized coal.
From the analysis above, at the inlet of pulverized coals and oxygen, the concentrations of CO and CO2 were almost zero, because the combustion reaction had not yet happened. With the reaction of pulverized coals with O2, the concentration of O2 decreased rapidly, and the concentrations of CO and CO2 increased quickly. At 6 m below the roof of the reaction shaft, the concentration of O2 was almost zero and the concentration of CO almost reached its highest. Because the reduction process of iron concentrates was virtually completed, the concentration of CO2 near the wall was about 50 wt%, which was much higher than that of CO. Except for the inlet of pulverized coals and oxygen, there was a reductive atmosphere in the other regions that guaranteed the basic conditions for the reduction of iron concentrates.
3.4. Particle Trajectory and Content Distribution
The particle trajectories could be obtained by the Lagrangian method. Figure 8 shows the particle trajectories and component contents of Fe2O3, FeO, Fe3O4, and Fe in the reaction shaft, and Figure 9 shows the mass fraction of Fe2O3, FeO, Fe3O4, and Fe at different heights of the reaction shaft. It can be seen from Figure 8a,b and Figure 9 that there were large amounts of Fe2O3 and FeO in iron concentrates under the inlet. With the reduction of Fe2O3 in Equation (21), the content of Fe2O3 decreased rapidly. The change in the FeO content was more complicated, which was caused by the existence of complex reactions, including the formation of FeO in Equation (22), and the reduction of FeO in Equation (23) at the same time. As shown in Figure 8c, the content of Fe3O4 first increased because of the reduction of Fe2O3 in Equation (21), then decreased because of the reduction of Fe3O4 in Equation (22). As shown in Figure 8 and Figure 9, the Fe2O3 and FeO were almost completely reduced at 9 m below the roof of the reaction shaft.
It can be seen from Figure 8d and Figure 9 that the mass fraction of Fe increased along the height when H was larger than 2 m. Between 3 and 7 m below the roof of the reaction shaft, the generation rate of Fe was significant, which may be related to the high temperature in this section, as shown in Figure 6. At 9 m below the roof of the reaction shaft, the Fe2O3 and FeO in iron concentrates were basically reduced to Fe, and the mass fraction of Fe reached more than 95%. According to statistical analysis of iron concentrate particles, the residence time of iron concentrates in the reaction shaft was within 1.2–7.7 s, which is consistent with Sohn’s results [10].
From the analysis above, the iron concentrates almost did not react with CO due to the low temperature and low CO content when they just entered the reaction shaft. The Fe2O3 and FeO in the iron concentrates were reduced to Fe between 2 and 9 m below the roof of the reaction shaft, and more than 95 wt% iron particles could be obtained, suggesting that the flash ironmaking process, using pulverized coals, oxygen, and iron concentrates as raw materials, is an alternative for ironmaking.
4. Conclusions
A novel flash ironmaking technology using pulverized coals and iron concentrates as raw materials was studied. This technology produces iron without requiring the palletization or sintering of iron and also avoids the need for coke. In the reaction shaft of the flash ironmaking furnace, the Euler–Lagrangian model with a custom UDF code was applied to conduct the simulation of the fluid flow, heat transfer, and chemical reactions, including the combustion of pulverized coals and the reduction of Fe2O3, Fe3O4, and FeO. The distribution characteristics of multi-physical fields such as velocity field, temperature field, concentration field, and particle trajectories, are studied. The main conclusions are as follows:
(1) The central oxygen expands rapidly after entering the reaction shaft and forms an approximately bell-shaped gas column. The temperature distribution in the reaction shaft is wing-shaped. The highest temperature, 2615 K, is reached at 5 m below the roof of the reaction shaft;
(2) The violent combustion of pulverized coals has basically been finished at 6 m below the roof of the reaction shaft. With the completion of the combustion chemical reaction and the generation of CO and CO2, CO and CO2 exist in most regions of the reaction shaft, except for the inlet of O2 and pulverized coals;
(3) The Fe2O3 and FeO in iron concentrates have been completely reduced at 9 m below the roof of the reaction shaft, and more than 95 wt% iron particles could be obtained within 1.2–7.7 s, suggesting that the flash ironmaking process, using pulverized coals, oxygen, and iron concentrates as raw materials could be an alternative method for ironmaking.
The models and methods presented in this study can be extended to investigate the structure and operating parameters of the reaction shaft for the design of the flash ironmaking furnace.
Author Contributions
Simulation and initial draft: J.X. and B.C.; Methodology, B.C.; Project administration, B.C. and M.L.; Resources, B.C.; Validation, W.H., H.L. and Y.F. All authors have read and agreed to the published version of the manuscript.
Funding
This research was funded by the National Key Research and Development Program of China during the 13th Five Year Plan Period (2016FYB0601304).
Acknowledgments
The authors thank ZHANG Wen-hai and GONG Shu-shan for their guidance.
Conflicts of Interest
The authors declare no conflict of interest.
References
- Bellevrat, E.; Menanteau, P. Introducing carbon constraint in the steel sector: ULCOS scenarios and economic modeling. Rev. Metall. 2009, 106, 318–324. [Google Scholar] [CrossRef]
- Anameric, B.; Kawatra, S. Direct iron smelting reduction processes. Miner. Process Extr. Metall. Rev. 2009, 30, 1–51. [Google Scholar] [CrossRef]
- Qu, Y.; Yang, Y.; Zou, Z.; Zeilstra, C.; Meijer, K.; Boom, R. Thermal decomposition behaviour of fine iron ore particles. ISIJ Int. 2014, 54, 2196–2205. [Google Scholar] [CrossRef] [Green Version]
- Meijer, K.; Zeilstra, C.; Teerhuis, C.; Ouwehand, M.; Stel, J.V.D. Developments in alternative ironmaking. Trans. Indian Inst. Met. 2013, 66, 475–481. [Google Scholar] [CrossRef]
- Amr, A.; Fan, D.; Mohamed, E.; Sohn, H.Y. Experimental investigation and computational fluid dynamics simulation of a novel flash ironmaking process based on partial combustion of natural gas in a reactor. Steel. Res. Int. 2019, 90, 1900126. [Google Scholar]
- Hwang, J.Y.; Jiang, T.; Kennedy, M.W.; Yucel, O.; Pistorius, P.; Seshadri, V.; Zhao, B.; Gregurek, D.; Keskinkilic, E. 8th International Symposium on High-Temperature Metallurgical Processing, 1st ed.; Springer International Publishing: Cham, Switzerland, 2016; pp. 3–49. [Google Scholar]
- Chen, H.; Mei, C.; Xie, K.; Li, X.; Zhou, J.; Wang, X.; Ge, Z. Operation optimization of concentrate burner in copper flash smelting furnace. Trans. Nonferrous Met. Soc. China. 2004, 14, 631–636. [Google Scholar]
- Sohn, H.Y. Suspension ironmaking technology with greatly reduced energy requirement and CO2 emissions. Steel Times Int. 2007, 31, 68–72. [Google Scholar]
- Wang, H.; Sohn, H.Y. Hydrogen reduction kinetics of magnetite concentrate particles relevant to a novel flash ironmaking process. Metall. Mater. Trans. B Proc. Metall. Mater. 2013, 44, 133–145. [Google Scholar] [CrossRef]
- Sohn, H.Y.; Mohassab, Y. Development of a novel flash ironmaking technology with greatly reduced energy consumption and CO2 emissions. J. Sustain. Metall. 2016, 2, 216–227. [Google Scholar] [CrossRef]
- Elzohiery, M.; Fan, D.; Mohassab, Y.; Sohn, H.Y. Experimental Investigation and Computational Fluid Dynamics Simulation of the Magnetite Concentrate Reduction Using Methane-OxygenFlame in a Laboratory Flash Reactor. Metall. Mater. Trans. B Proc. Metall. Mater. 2020, 3, 1–13. [Google Scholar]
- Gong, S.; Dai, X.; Zhang, W. Research on non-blast furnace flash iron-making engineering. Nonferrous. Met. Eng. Res. 2015, 36, 34–35. [Google Scholar]
- Wang, J.; Dai, X.; Zhang, W.; Gong, S.; Zhou, G.; Zhang, W. Advances of non-blast furnace flash iron-making researches. Iron Steel 2020, 55, 100–105. [Google Scholar] [CrossRef]
- Chen, Z.; Mao, Y.; Zhao, R.; Liu, A. Influences of reaction air parameters on smelting process in flash furnace. J. Cent. South Univ. 2012, 43, 733–737. [Google Scholar]
- Chen, Z.; Yin, S.; Zhou, J.; Wang, Y. Numerical simulation of copper flash smelting process with rotarily distributed air. Chin. J. Process. Eng. 2012, 12, 1–8. [Google Scholar]
- Chen, Z.; Wang, Y.; Song, X.; Zhao, R.; Yin, S. Numerical simulation of smelting process in copper flash smelters at high loading rate. Chin. J. Nonferrous. Met. 2011, 21, 2916–2921. [Google Scholar]
- Zhou, J.; Chen, Z.; Xie, D.; Mao, Y.; Zhou, J. Optimization of operational parameters for flash smelting process based on orthogonal experiment. Chin. J. Nonferrous Met. 2013, 23, 2977–2984. [Google Scholar]
- Zhou, J.; Zhou, J.; Chen, Z.; Mao, Y. Influence analysis of air flow momentum on concentrate dispersion and combustion in copper flash smelting furance by CFD simulation. JOM 2014, 66, 1629–1637. [Google Scholar] [CrossRef]
- Hou, W.; Li, H.; Li, M.; Zhang, B.; Wang, Y.; Gao, Y. Multi-physical field coupling numerical investigation of alumina dissolution. Appl. Math. Modell. 2019, 67, 588–604. [Google Scholar] [CrossRef]
- Laubscher, R.; Rousseau, P. Numerical investigation into the effect of burner swirl direction on furnace and superheater heat absorption for a 620 MWe opposing wall-fired pulverized coal boiler. Int. J. Heat Mass Transfer. 2019, 137, 506–522. [Google Scholar] [CrossRef]
- Ranade, V.V.; Gupta, D.F. Computational Modeling of Pulverized Coal Fired Boilers, 2nd ed.; CRC Press: Boca Raton, FL, USA, 2014; pp. 19–30. [Google Scholar]
- Sheng, C.; Moghtaderi, B.; Gupta, R.; Wall, T.F. A computational fluid dynamics based study of the combustion characteristics of coal blends in pulverised coal fired furnace. Fuel 2004, 83, 1543–1552. [Google Scholar] [CrossRef]
- Baum, M.M.; Street, P.J. Predicting the Combustion Behaviour of Coal Particles. Combust. Sci. Technol. 1971, 3, 231–243. [Google Scholar] [CrossRef]
- Chernetskiy, M.; Dekterev, A.; Cherneskaya, N.; Hanjalic, K. Effects of reburning mechanically activated micronized coal on reduction of NOX: Computational study of a real-scale tangentially-fired boiler. Fuel 2018, 214, 215–229. [Google Scholar] [CrossRef]
- Guo, Y.; Chan, C. A multi fluid model for simulating trrbulent gas particle flow and pulverized coal combustion. Fuel 2000, 79, 365–378. [Google Scholar] [CrossRef]
- Kim, Y.J.; Lee, J.M.; Kim, S.D. Modeling of coal gasification in an internally circulation fluidized bed reactor with draught tube. Fuel 2000, 79, 69–77. [Google Scholar] [CrossRef]
- Mirzajani, A.; Ale, E.H.; Nouri, S.M. Simulation of a direct reduction moving bed reactor using a three interface model. Braz. J. Chem. Eng. 2018, 35, 1019–1028. [Google Scholar] [CrossRef] [Green Version]
- Tsay, Q.T.; Ray, W.H.; Szekely, J. The modeling of hematite reduction with dydrogen plus carbon monoxide mixtrres: Part II. the direct reduction process in a shaft furnace arrangement. AICHE J. 1976, 22, 1072–1079. [Google Scholar] [CrossRef]
- Zhang, X.; Zou, Z.; Luo, Z. Numerical simulation on characteristics of COREX shaft furnace with central gas distribution. J. Iron Steel Res. Int. 2019, 26, 567–577. [Google Scholar] [CrossRef]
- Austin, P.R.; Nogami, H.; Yagi, J. A mathematical model for blast furnace reaction analysis based on the four fluid model. ISIJ Int. 1997, 37, 748–755. [Google Scholar] [CrossRef]
- Guo, X.; Wu, S.; Xu, J.; Du, K. Reducing gas composition optimization for COREX pre-reduction shaft furnace based on CO-H2 mixture. Procedia. Eng. 2011, 15, 4702–4706. [Google Scholar] [CrossRef] [Green Version]
- Takenaka, Y.; Kimura, Y.; Narita, K.; Kaneko, D. Mathematical model of direct reduction shaft furnace and its application to actual operations of a model plant. Comput. Chem. Eng. 1986, 10, 67–75. [Google Scholar] [CrossRef]
- Mei, C.; Xie, K.; Chen, H.; Li, X.; Chen, Z. Generating condition and applying results of high efficiency reaction core in cooper flash smelting. Nonferrous. Met. 2003, 55, 85–88. [Google Scholar]
- Jorgensen, F.R. The ignition of sulphide flotation concentrates in flash smelting. Sulfide Smelt. 2002, 49–60. [Google Scholar]
Figure 1.
Schematic of the flash ironmaking furnace.

Figure 2.
Geometric model of the reaction shaft.

Figure 3.
Velocity contour on the symmetry plane.

Figure 4.
Streamline diagram on the symmetry plane.

Figure 5.
Temperature contour on the symmetric surface.

Figure 6.
The average gas temperature versus the height of the reaction shaft.

Figure 7.
Gas concentration on the symmetry plane of the reaction shaft; (a) O2; (b) CO and (c) CO2.
Figure 7.
Gas concentration on the symmetry plane of the reaction shaft; (a) O2; (b) CO and (c) CO2.

Figure 8.
Particle trajectories and component contents in the reaction shaft; (a) Fe2O3; (b) FeO; (c) Fe3O4; and (d) Fe.
Figure 8.
Particle trajectories and component contents in the reaction shaft; (a) Fe2O3; (b) FeO; (c) Fe3O4; and (d) Fe.

Figure 9.
Mass fraction of Fe2O3, FeO, Fe3O4, and Fe at different heights of the reaction shaft.


Table 1.
The proximate and ultimate analyses of the coal.
| Proximate Analysis | Wt (%) | Ultimate Analysis | Wt (%) |
|---|---|---|---|
| Fixed carbon | 51.3% | C | 78.6% |
| Volatile matter | 43.2% | H | 4.96% |
| Ash | 3.2% | O | 15.04% |
| Moisture | 2.3% | N | 0.9% |
| S | 0.9% |
Table 2.
Concentrate compositions (mass fraction).
| Fe2O3 | FeO | CaO | MgO | Al2O3 | SiO2 | Others |
|---|---|---|---|---|---|---|
| 73.1% | 24.9% | 0.5% | 0.68% | 0.21% | 0.32% | 0.3% |
Table 3.
General forms of turbulent transport equations.
| Equation | φ | Γφ | Sφ |
|---|---|---|---|
| Continuity | 1 | 0 | 0 |
| Momentum | v | ||
| Energy | h | −qr | |
| Species | Yi | −wi |
Table 4.
Comparison between calculated and measured gas temperatures.
| Location (H, r) | Measuring Results/K | Simulation Results/K | Deviation/% |
|---|---|---|---|
| (1.6, 0.5) | 1813 | 1896 | 4.37 |
| (2, 0.9) | 1937 | 2005 | 3.39 |
© 2020 by the authors. Licensee MDPI, Basel, Switzerland. This article is an open access article distributed under the terms and conditions of the Creative Commons Attribution (CC BY) license (http://creativecommons.org/licenses/by/4.0/).
Share and Cite
MDPI and ACS Style
Cheng, B.; Xiong, J.; Li, M.; Feng, Y.; Hou, W.; Li, H. Numerical Investigation into Gas-Particle Inter-Phase Combustion and Reduction in the Flash Ironmaking Process. Metals 2020, 10, 711. https://doi.org/10.3390/met10060711
AMA Style
Cheng B, Xiong J, Li M, Feng Y, Hou W, Li H. Numerical Investigation into Gas-Particle Inter-Phase Combustion and Reduction in the Flash Ironmaking Process. Metals. 2020; 10(6):711. https://doi.org/10.3390/met10060711
Chicago/Turabian StyleCheng, Benjun, Jian Xiong, Mao Li, Yuan Feng, Wenyuan Hou, and Hesong Li. 2020. "Numerical Investigation into Gas-Particle Inter-Phase Combustion and Reduction in the Flash Ironmaking Process" Metals 10, no. 6: 711. https://doi.org/10.3390/met10060711
Note that from the first issue of 2016, this journal uses article numbers instead of page numbers. See further details here.