Article

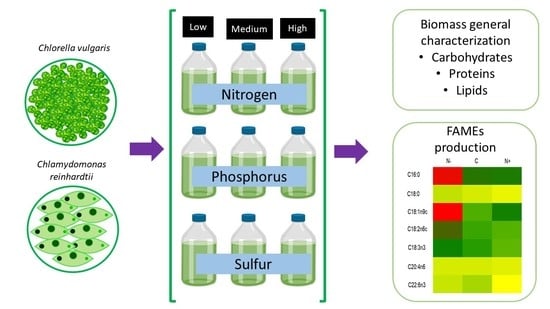
Growth Behavior, Biomass Composition and Fatty Acid Methyl Esters (FAMEs) Production Potential of Chlamydomonas reinhardtii, and Chlorella vulgaris Cultures

by
Itzel Y. López-Pacheco
1,2,
Victoria Guadalupe Ayala-Moreno
3,
Catherinne Arlette Mejia-Melara
3,
José Rodríguez-Rodríguez
1,
Sara P. Cuellar-Bermudez
1,2,
Reyna Berenice González-González
1,2,
Karina G. Coronado-Apodaca
1,2,
Leonardo I. Farfan-Cabrera
1,
Georgia María González-Meza
1,2,
Hafiz M. N. Iqbal
1,2,* and
Roberto Parra-Saldívar
1,2,*
1
Tecnologico de Monterrey, School of Engineering and Sciences, Monterrey 64849, Mexico
2
Tecnologico de Monterrey, Institute of Advanced Materials for Sustainable Manufacturing, Monterrey 64849, Mexico
3
Francisco Morazán Department, Escuela Agrícola Panamericana, Zamorano, Km 30 Carretera de Tegucigalpa a Danlí, Valle del Yeguare, Municipio de San Antonio de Oriente, Tegucigalpa 11101, Honduras
*
Authors to whom correspondence should be addressed.
Mar. Drugs 2023, 21(8), 450; https://doi.org/10.3390/md21080450
Submission received: 17 June 2023 / Revised: 2 August 2023 / Accepted: 8 August 2023 / Published: 15 August 2023
(This article belongs to the Special Issue Fatty Acids from Marine Organisms)

Abstract

:
The production of biomolecules by microalgae has a wide range of applications in the development of various materials and products, such as biodiesel, food supplements, and cosmetics. Microalgae biomass can be produced using waste and in a smaller space than other types of crops (e.g., soja, corn), which shows microalgae’s great potential as a source of biomass. Among the produced biomolecules of greatest interest are carbohydrates, proteins, lipids, and fatty acids. In this study, the production of these biomolecules was determined in two strains of microalgae (Chlamydomonas reinhardtii and Chlorella vulgaris) when exposed to different concentrations of nitrogen, phosphorus, and sulfur. Results show a significant microalgal growth (3.69 g L−1) and carbohydrates (163 mg g−1) increase in C. reinhardtii under low nitrogen concentration. Also, higher lipids content was produced under low sulfur concentration (246 mg g−1). It was observed that sulfur variation could affect in a negative way proteins production in C. reinhardtii culture. In the case of C. vulgaris, a higher biomass production was obtained in the standard culture medium (1.37 g L−1), and under a low-phosphorus condition, C. vulgaris produced a higher lipids concentration (248 mg g−1). It was observed that a low concentration of nitrogen had a better effect on the accumulation of fatty acid methyl esters (FAMEs) (C16-C18) in both microalgae. These results lead us to visualize the effects that the variation in macronutrients can have on the growth of microalgae and their possible utility for the production of microalgae-based subproducts.

Graphical Abstract

1. Introduction

Microalgae biomass can be useful for the production of many materials, including bioplastics, food supplements, biofuels, UV-blockers, antimicrobial bio-compounds, and animal feed, among others [1]. In general, microalgae biomass has been reported to produce and accumulate carbohydrates, proteins, lipids, and fatty acids (FAs) [2], which makes it an interesting source of renewable raw material for a wide range of applications. Moreover, microalgae are considered a sustainable source of materials, since these microorganisms can be applied in bioremediation processes and convert waste into value-added products in a circular economy scheme [3]. For example, microalgae have been employed to reduce CO2 emissions via bio-fixation processes because they can capture CO2 through the photosynthetic pathway. In this process, microalgae use CO2 from the atmosphere or other sources like flue gas streams for biomass production; it has been determined that producing 1 g of microalgae biomass represents the capture of 1.8 g of CO2 [4,5,6]. Thus, environmental benefits are also involved with the use of microalgae biomass as feedstock for some processes.
Another bioremediation application is the use of microalgae for wastewater treatment processes. In this respect, researchers have reported the removal of water pollutants, including up to 90% of COD, 100% nitrogen, and 50% phosphorous, producing not only good-quality effluents but also biomass that is able to be employed for the production of biofuels, bioplastic, and food sources, among other applications [7]. For example, Chlorella biomass from a swine wastewater phycoremediation process exhibited higher production of lipids—including triacylglycerol—in comparison to that obtained in the standard medium [8]; these lipids can be used in bioplastic production.
Microalgae use depends on its biomass composition in terms of macromolecules (proteins, lipids, and carbohydrates) and active compounds, which in turn depends on microalgae strains and microalgae culture conditions [9]. In the case of carbohydrate content, some microalgae strains can accumulate >25% dry wt of carbohydrates such as Scenedesmus, Dunaliella, and Chlorella (Chlorophyta) [10]. In the case of proteins, Galdieria sulphuraria (Rhodophyta, Cyanidiophyceae) can accumulate >60% dry wt [11], while Chlorella vulgaris can accumulate 48% dry wt [12]. Regarding lipids, microalgae can produce a yield per hectare that is at least 7 times higher than other oil crops (i.e., soybean, sunflower, corn) [13]. Chlorella sp. (Chlorophyta), Phaeodactylum tricornutum (Bacillariophyta), and Botryococcus braunii (Chlorophyta) can produce >20% dry wt of lipids [14,15].
Triacylglycerols are non-polar lipids formed by three fatty acids esterified with glycerol. They are common molecules for energy storage in microalgae cells and the most common dietary fat for some organisms, such as humans [16]. Different FAs in microalgae have been identified, such as short-chain fatty acids, medium-chain fatty acids, and long-chain fatty acids. Palmitic (C16:0), stearic (C18:0), palmitoleic (C16:1), oleic (C18:1), linoleic (C18:2), and linolenic (C18:3) acids are examples of long-chain fatty acids found in microalgae [17]. Also, polyunsaturated fatty acids (PUFAs) have been found, including docosapentaenoic acid (DPA), eicosapentaenoic acid (EPA), and docosahexaenoic acid (DHA), which are very important compounds in the food industry [18]. Microalgae biomass, especially its FAs content, has demonstrated potential for biodiesel production, and particular varieties can be useful in determining possible biodiesel characteristics [19] but also for bio-based lubricants [20], the latter being more sought and valued in recent decades.
In this manner, several applications exist for microalgae biomass and different biomolecules. For example, carbohydrates can be used to produce bioethanol, biobutanol, biomethane, bioplastics, food supplements, animal feed, and fertilizers [21,22,23]. Proteins can be used in human food, protein supplements [24], and stabilizers for food, cosmetic, and pharmaceutical products [25]. Lipids can be used for bioenergy, since the fatty acids in microalgal biomass produce high-quality biodiesel [26]. Also, lipids can act as surfactants or emulsifiers in cosmetics to provide additional properties. For example, adding PUFAs in cosmetic formulations provides anti-inflammatory and antioxidant properties [27]. Recently, the use of microalgae for the obtention of lubricant oils such as metalwork fluids has been explored. For this application, microalgae should produce long-carbon-chain (C > 16) FAs [28]. Moreover, microalgae cultures have been considered as a viable option for such macromolecules, since their production can be more sustainable [29].
In this context, microalgae biomass can be used to obtain specific compounds according to the desired application. Thus, different strategies have been investigated to obtain higher yields of certain biomolecules in microalgae biomass. For example, some researchers have evaluated pH variations [30], different carbon sources [31], variations in culture medium composition [32], and different photoperiods and light intensity modifications [33]. A simple technique consists of modifying the culture medium by reducing the supply of some macroelements; typically, nitrogen and phosphorus are the elements that are most commonly varied, causing an increment in carbohydrates, proteins, and lipids. This strategy has demonstrated good potential; thus, varying other elements like sulfur should be further investigated (as they are in this article). This study evaluated the growth and biomass composition of two microalgae strains under different macronutrient concentrations. It was desirable to carry out this experimentation because in most articles, these macroelements (nitrogen, phosphorus, and sulfur) do not vary in the same microalga. Therefore, this study shows that the variation in these macroelements can impact the production of macromolecules of interest, which could be interesting for the industrial sector. The total carbohydrate, protein, and lipid production from Chlamydomonas reinhardtii and Chlorella vulgaris (Chlorophyta) was determined in response to different nitrogen, phosphorus, and sulfur concentrations. Moreover, the FAMEs production of these two microalgae strains was evaluated, which makes this article novel, because there are very few that evaluate the specific production of fatty acids by increasing or reducing the concentration of macroelements in the culture medium. The effect of varying the nitrogen, phosphorus, and sulfur concentrations in the culture medium was analyzed in detail to maximize the biomolecules yield derived from microalgae biomass.

2. Results and Discussion

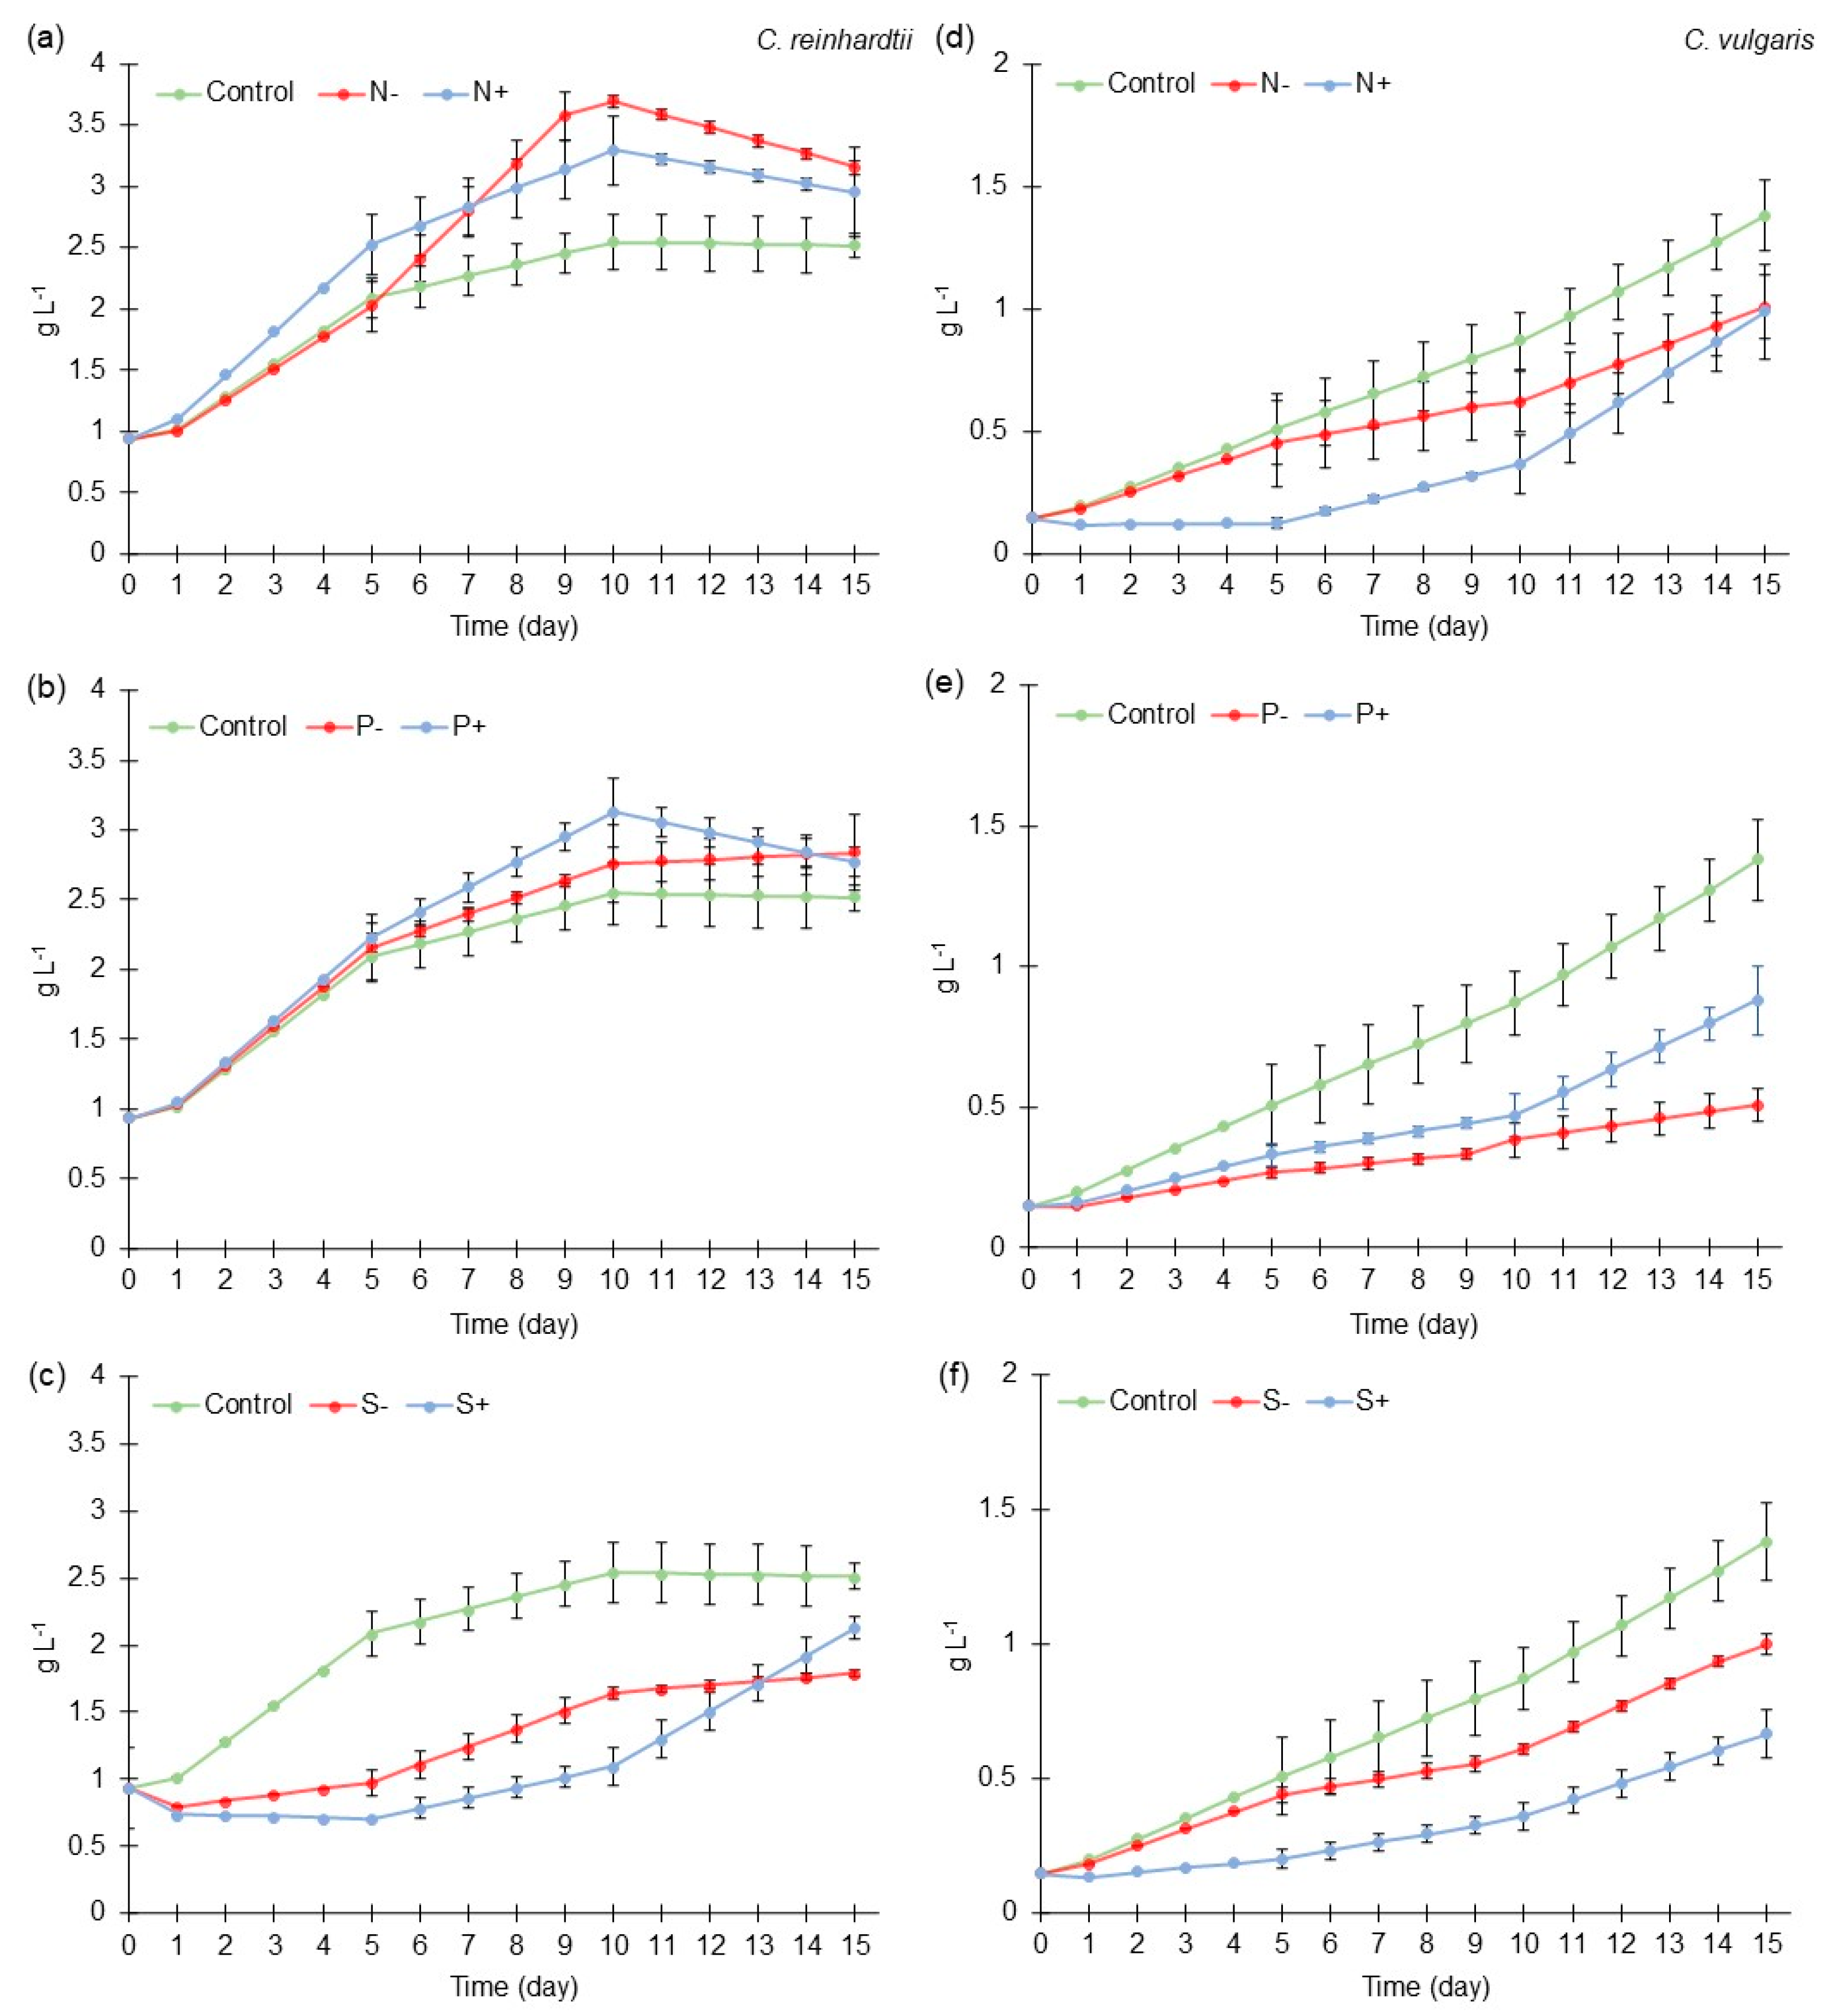
2.1. Growth Behavior of Chlamydomonas reinhardtii and Chlorella vulgaris with Different Nitrogen, Phosphorus, and Sulfur Concentrations

In standard medium concentration [Control], C. reinhardtii showed cell growths of 2.08 g L−1, 2.54 g L−1, and 2.51 g L−1 at the 5th, 10th, and 15th culture days, respectively (Figure 1a–c). These results are comparable to those obtained by Morales-Sánchez et al. (2020) [34], where Chlamydomonas malina FT89.6 PG5 (Roscoff Culture Collection No. 2488) (https://roscoff-culture-collection.org/rcc-strain-details/2488, accessed on 10 June 2023) reached approximately 4 g L−1 at the 10th culture day. C. vulgaris culture showed a better microalgae growth at medium concentration of all macroelements [Control]; it reached 0.86 g L−1 of biomass growth at the 10th and 1.37 g L−1 at the 15th culture day (Figure 1d–f). These results are similar to those found by Josephine et al. [35], where >1 g L−1 was obtained at the 15th culture day of C. vulgaris.
C. reinhardtii presented a better growth at low nitrogen concentration [N] (3.69 g L−1 at 10th day) and at high phosphorus concentration [P+] (3.12 g L−1 at 10th day) (Figure 1a,b). In this manner, an increment of at least 0.40 g L−1 can be obtained by modifying the concentration of nitrogen [N,N+] or phosphorous [P+] in comparison to the medium concentration [Control] after ten days of cultivation. It was shown that high concentration of nitrogen [N+] and sulfur [S+] had a noticeable negative effect on C. vulgaris growth, where 0.98 g L−1 and 0.66 g L−1 were obtained at the 15th culture day, respectively. However, at high nitrogen [N+] concentration, C. vulgaris showed the tendency to increase microalgae growth after the 10th culture day, similar to the low nitrogen [N] concentration curve. These results are related to those found with C. reinhardtii, since both microalgae had better growth in low-nitrogen treatments [N]. Also, the inhibition effect on microalgae growth caused by high nitrogen loads in culture medium has been demonstrated [36].
Other studies have reported that low-nitrogen conditions in the culture medium increased cell growth. For instance, Isochrysis galbana (Haptophyta, Coccolithophyceae) presented enhanced cell growth at the nitrogen concentration of 144 mg L−1 in comparison to the nitrogen concentration of 288 mg L−1 [36]. Similarly, Graesiella emersonii (formerly Chlorella emersonii) (Chlorophyta) microalgae reached a higher cell growth under low-nitrogen conditions than under nitrogen abundance [37].
The phosphorous concentration in the C. reinhardtii culture had a strong effect as well; optimal results were obtained under the high concentration [P+]. This result is in agreement with those reported by Lovio Fragoso et al. (2019) [38], who cultivated Chaetoceros muelleri (Bacillariophyta) under high-phosphorus conditions, showing a slight increase in cell growth. On the other hand, for C. vulgaris, it was shown that lower concentration [P] has a more negative effect on microalgae growth than the effect obtained with high concentration [P+]. The same effect was reported by Li et al. (2022) [39], who cultivated Tetradesmus obliquus (formerly Scenedesmus obliquus) (Chlorophyta) under low-phosphorus condition (0.02 mg L−1); experiments under low-concentration conditions showed lower values in terms of cell growth when compared to those obtained under high concentrations of phosphorus (2 mg L−1) [39]. In this experiment, an exponential phase was not shown in any culture, so they can be maintained for a longer number of days.
Regarding sulfur, C. reinhardtii growth was negatively affected by this macronutrient, since 1.79 g L−1 and 2.12 g L−1 of microalgae biomass were obtained under low [S] and high [S±] sulfur concentrations at the 15th day, respectively (Figure 1c). Also, it was shown that high concentration of sulfur [S+] had a noticeable negative effect on C. vulgaris growth, which was 0.66 g L−1 at the 15th culture day. Sulfur deprivation decreases photosynthetic activity in microalgae; thus, the low results for cell growth could be related to this phenomenon. In the case of high sulfur treatment, Mao et al. (2020) [40] reported a similar growth behavior, in which the variation in sulfur concentration affected microalgae growth during the first days of culture, subsequently increasing cell growth, until adapting a similar behavior to that presented by the control.
Also, it can be shown that at the 10th day of most microalgae cultures [Control, N, N+, P+, P, S], the exponential phase is reached in C. reinhardtii culture. The exponential phase of this microalgae can be reached usually at the 8th or 10th day of culture, even in light stress, salinity stress, or nutrient stress conditions. This behavior could be related to nutrients depletion and less light penetration because of its high cell density [34]. However, this behavior could imply that this microalga can be useful for obtaining large amounts of microalgae biomass in short times.
From ANOVA–Tukey pairwise analysis of C. reinhardtii growth, it was determined that at low nitrogen [N] concentration, a higher microalgae biomass was produced in all the experiments at the 10th day of culture (3.69 g L−1). In the case of C. vulgaris culture, it was determined by the ANOVA–Tukey pairwise analysis that at medium [Control] concentration of macroelements, a higher microalgae biomass was produced in all the experiments at the 15th day of culture (1.37 g L−1). These results demonstrate that the growth behavior of microalgae with different nitrogen, phosphorus, and sulfur concentrations depends on the microalgae strain; however, some similar trends were found. In the case of Chlorella vulgaris, it can be concluded that the variations made negatively affected cell growth, because the variation was excessive for the culture to adapt in such a short time. However, since the culture did not reach a stationary phase, it was not discarded that in later days the behavior would have changed.

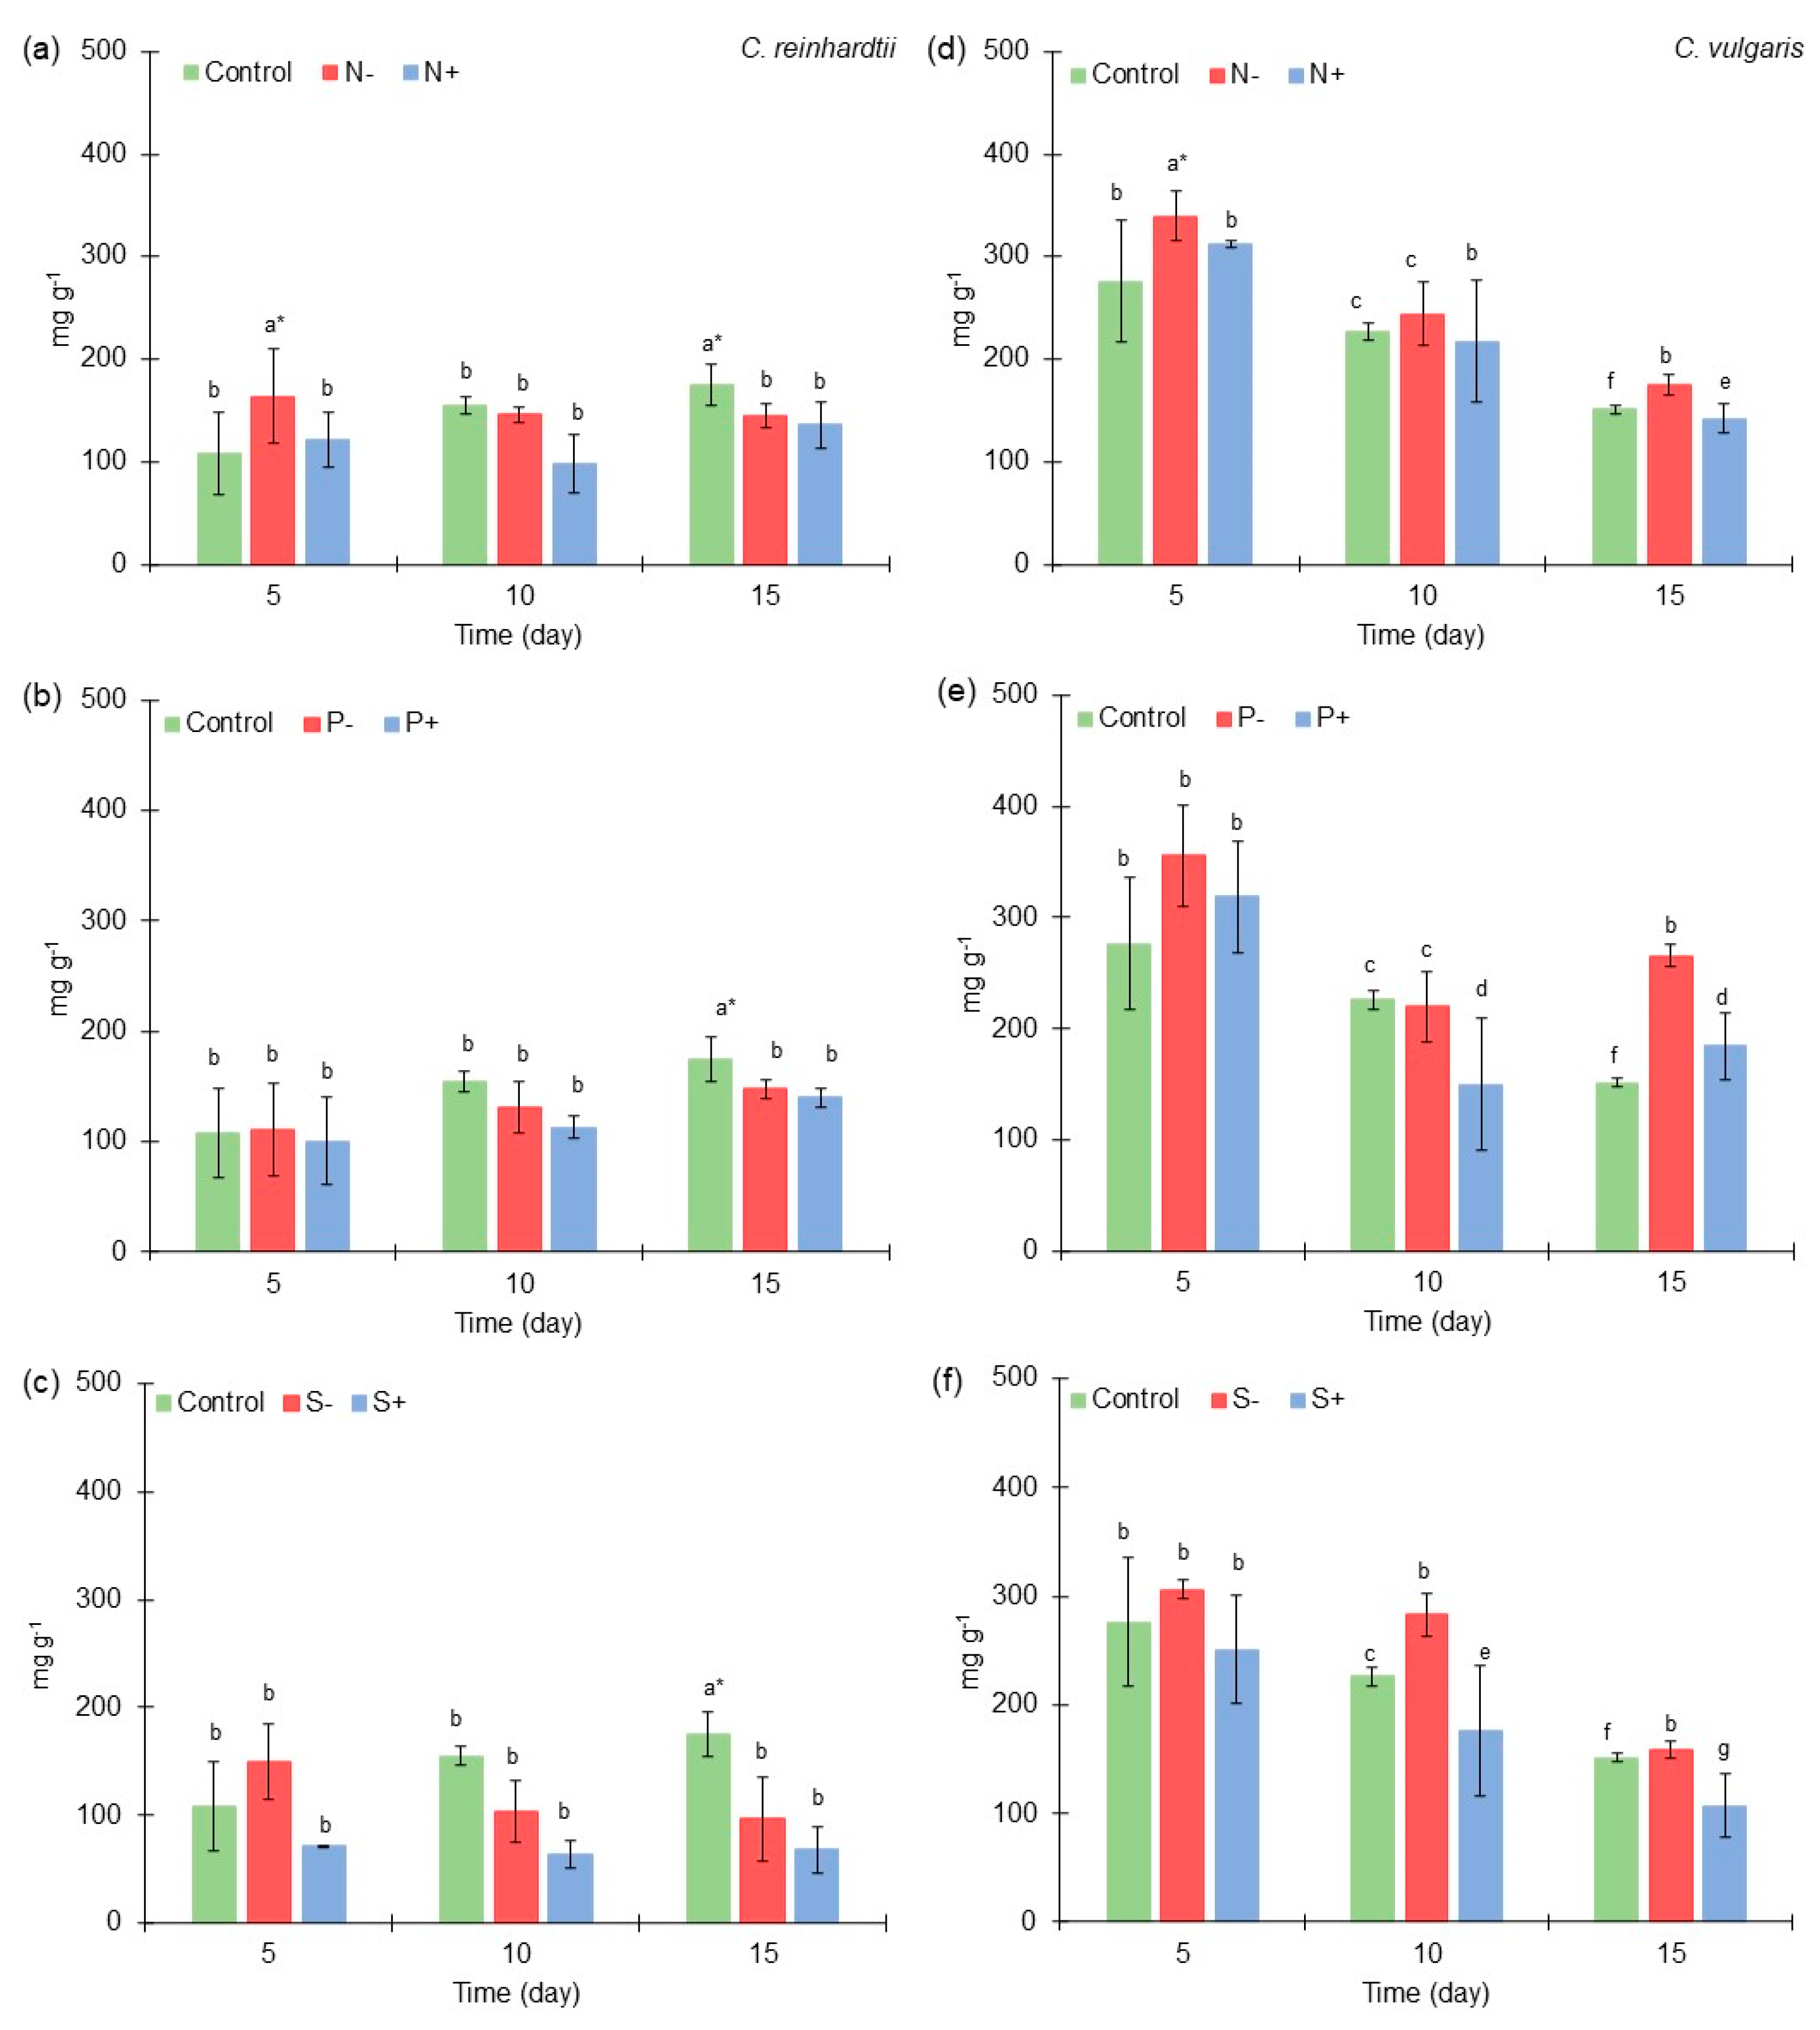
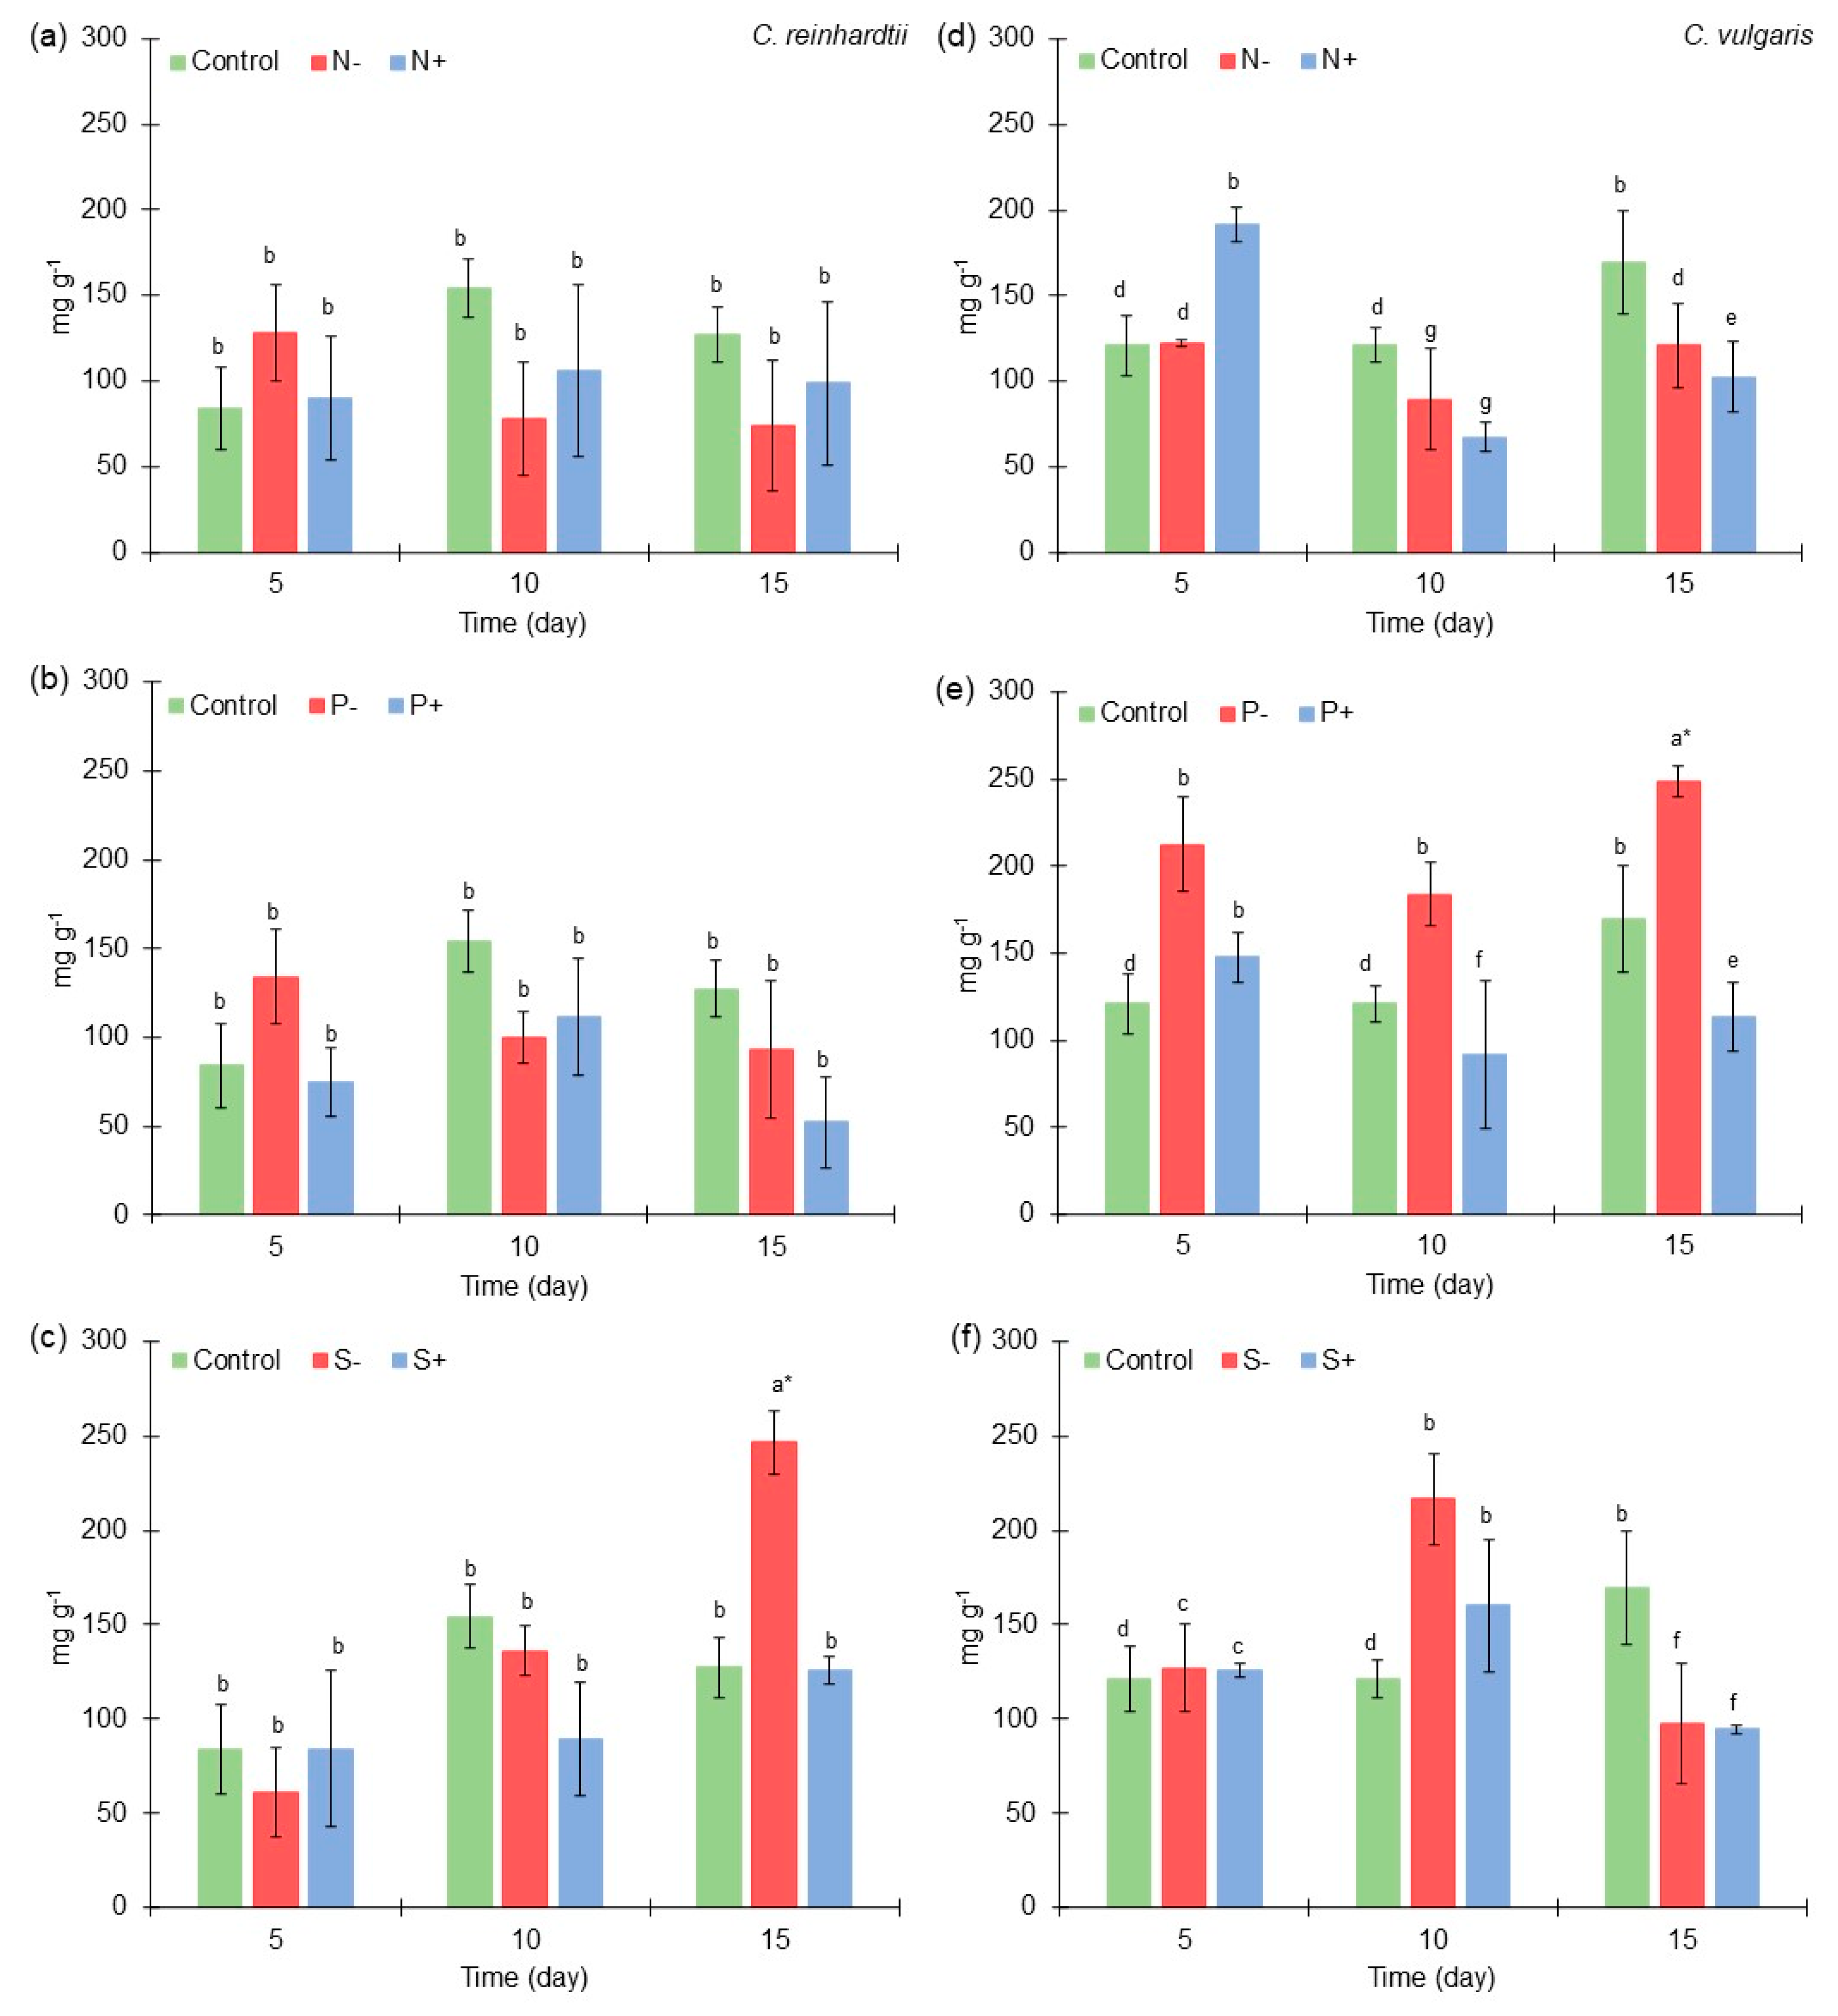
2.2. Carbohydrates Content of Chlamydomonas reinhardtii and Chlorella vulgaris Grown with Different Nitrogen, Phosphorus, and Sulfur Concentrations

C. reinhardtii produced a higher concentration of carbohydrates with medium macroelements concentration [Control] in most microalgae cultures (Figure 2a–c), except in the cases of low nitrogen [N] and sulfur [S] concentration at the 5th culture day. Regarding C. vulgaris, an improved production of carbohydrates was obtained with lower macroelements concentrations in most of the microalgae cultures (Figure 2d–f).
At medium macroelements concentration [Control], C. reinhardtii obtained 108 mg g−1, 155 mg g−1, and 175 mg g−1 of carbohydrates at the 5th, 10th, and 15th culture days, respectively. On the other hand, C. vulgaris at medium macroelements concentration obtained 276 mg g−1, 226 mg g−1, and 151 mg g−1 of carbohydrates at the 5th, 10th, and 15th culture days, respectively. These results can be compared to those obtained by Morales-Sánchez et al. (2020) [34], where Chlamydomonas malina (Chlorophyta) RCC2488 reached approximately 200 mg g−1 at the 10th culture day.
At low nitrogen [N] and sulfur [S] concentration at the 5th culture day in C. reinhardtii culture, 163 mg g−1 (50% greater than medium concentration) and 149 mg g−1 (37% greater than medium concentration) were obtained, respectively. The effect of nitrogen and sulfur deprivation in enhancing the carbohydrate content in microalgae biomass has been reported by different authors and using different microalgae strains. For example, in the case of C. reinhardtii CC-124, an increase of up to 4.3-fold was obtained [41], while Vischeria calaminaris (formerly Eustigmatos calaminaris) (Ochrophyta, Eustigmatophyceae) under nitrogen limitation conditions accumulated >80% of carbohydrates [42]. It is important to note, that the variation in some macroelements affects carbohydrates content in C. reinhardtii in a negative way, especially high concentrations of nitrogen, phosphorus, and sulfur.
In the experiments on nitrogen variations in C. vulgaris culture, a greater amount of carbohydrates was obtained at low nitrogen concentration [N], where 339 mg g−1 (22% greater than medium [Control] concentration), 244 mg g−1 (8% greater than control), and 174 mg g−1 of carbohydrates (15% greater than control) were obtained at the 5th, 10th, and 15th culture days, respectively. These results can be compared to those obtained by Cheng et al. (2017) [43], where Chlorella sp. growing in standard medium had an accumulation of 20–40% dry wt of carbohydrates. In their study, it was found that nitrogen limitation enhances carbohydrates accumulation in Chlorella sp. biomass, such as in Tetradesmus obliquus (formerly Scenedesmus obliquus) (Chlorophyta), where 43% dry wt of carbohydrates was obtained compared to the 25% dry wt reached under standard conditions.
Also, a greater amount of carbohydrates was obtained under low phosphorus concentration [P] in C. vulgaris culture, but only on days 5 and 15 of the microalgae culture, when 355 mg g−1 (28% greater than control) and 265 mg g−1 of carbohydrates (>50% greater than control) were obtained, respectively. It was shown in previous studies that low phosphorus concentrations could enhance the production of carbohydrate. For example, in Chlorella spp. culture, >50% of carbohydrates were obtained under phosphorus limitation [44]. Also, similar to this study, the limitation of phosphorus caused a greater accumulation of carbohydrates compared to results obtained under nitrogen limitation conditions [44]. Also, in Scenedesmus. LX1 culture, the carbohydrates production increased at least 20% under low-nutrient conditions (nitrogen/phosphorus) compared to that obtained in high-nutrient conditions [45].
At low sulfur concentrations [S] in C. vulgaris culture, the same behavior was observed that was obtained with low nitrogen and phosphorus concentration, since 306 mg g−1 (10% greater than control) and 282 mg g−1 of carbohydrates (25% greater than control) were reached at the 5th and 10th culture days, respectively. These results are similar to those found by Wang et al. (2022) [46], where Chlorella sorokiniana (Chlorophyta) grow under sulfur limitation conditions by obtaining >50% of carbohydrates compared to control conditions. Another microalga, Chlorococcum infusionum (Chlorococcum humicola) (Chlorophyta), reached a higher concentration of carbohydrates when grown in low-sulfur conditions, up to 10%, in comparison to standard conditions [47].
According to the ANOVA–Tukey pairwise analysis results of carbohydrates in C. reinhardtii culture, it was determined that the control [Medium] and low nitrogen [N] concentration conditions produced a higher carbohydrates content in all the experiments at the 15th day of culture (175 mg g−1) and at the 5th day of culture (163 mg g−1), respectively. In the case of the ANOVA–Tukey pairwise analysis of carbohydrates in C. vulgaris culture, it was determined that at low phosphorus [P] concentration, a higher carbohydrates content was produced in all the experiments at the 5th day of culture (355 mg g−1). As it was possible to observe in the case of C. reinhardtii, a higher concentration was obtained in the control, a result which is given at the 15th day of culture, which leads us to consider that this microalga tends to accumulate a greater amount of carbohydrates over time. However, in the case of low nitrogen concentration [N], a greater amount of carbohydrates can be obtained on the 5th day of culture. Therefore, if its production is sought, its harvest can be considered at this time.
In this way, it can be shown that the deprivation of these macroelements could enhance the production of carbohydrates in both microalgae; however, it is important to remark that each strain has a different behavior under these conditions. The increase in carbohydrates in microalgae biomass due to nutrients limitation conditions could be related to the fact that cells storing energy in the form of carbohydrates use less energy than they do by storing it in lipids (50% less ATP and 45% less NADPH in TAG synthesis process) [48]. Nitrogen and phosphorus limitation affects photosynthetic activity in microalgae by reducing the chlorophyll content and using absorbed energy capacity [49]. The accumulation of energy as carbohydrates guarantees the availability of energy for DNA replication and general cell metabolism [50], which is confirmed because under nitrogen limitations, microalgae increase their gene expression of starch-degrading enzymes [51].
Under phosphorus limitation conditions, the exchange of triose phosphate (glyceraldehyde-3-phosphate; product of photosynthetic pathway) could be reduced by the lack of cytoplasmic orthophosphate, generating an accumulation of precursors (e.g., glucose-6-phosphate) of carbohydrates production such as starch biosynthesis [52,53]. The sulfur deprivation in microalgae culture also could enhance carbohydrates biosynthesis by redirecting metabolic carbon flux to increase energy storage biomolecules production. Some enzymes (starch synthase and glycogen branching enzyme) related to carbohydrates synthesis could be significantly up-regulated under sulfur deprivation conditions, enhancing in this way the formation of amylose and amylopectin in microalgae cells [54].

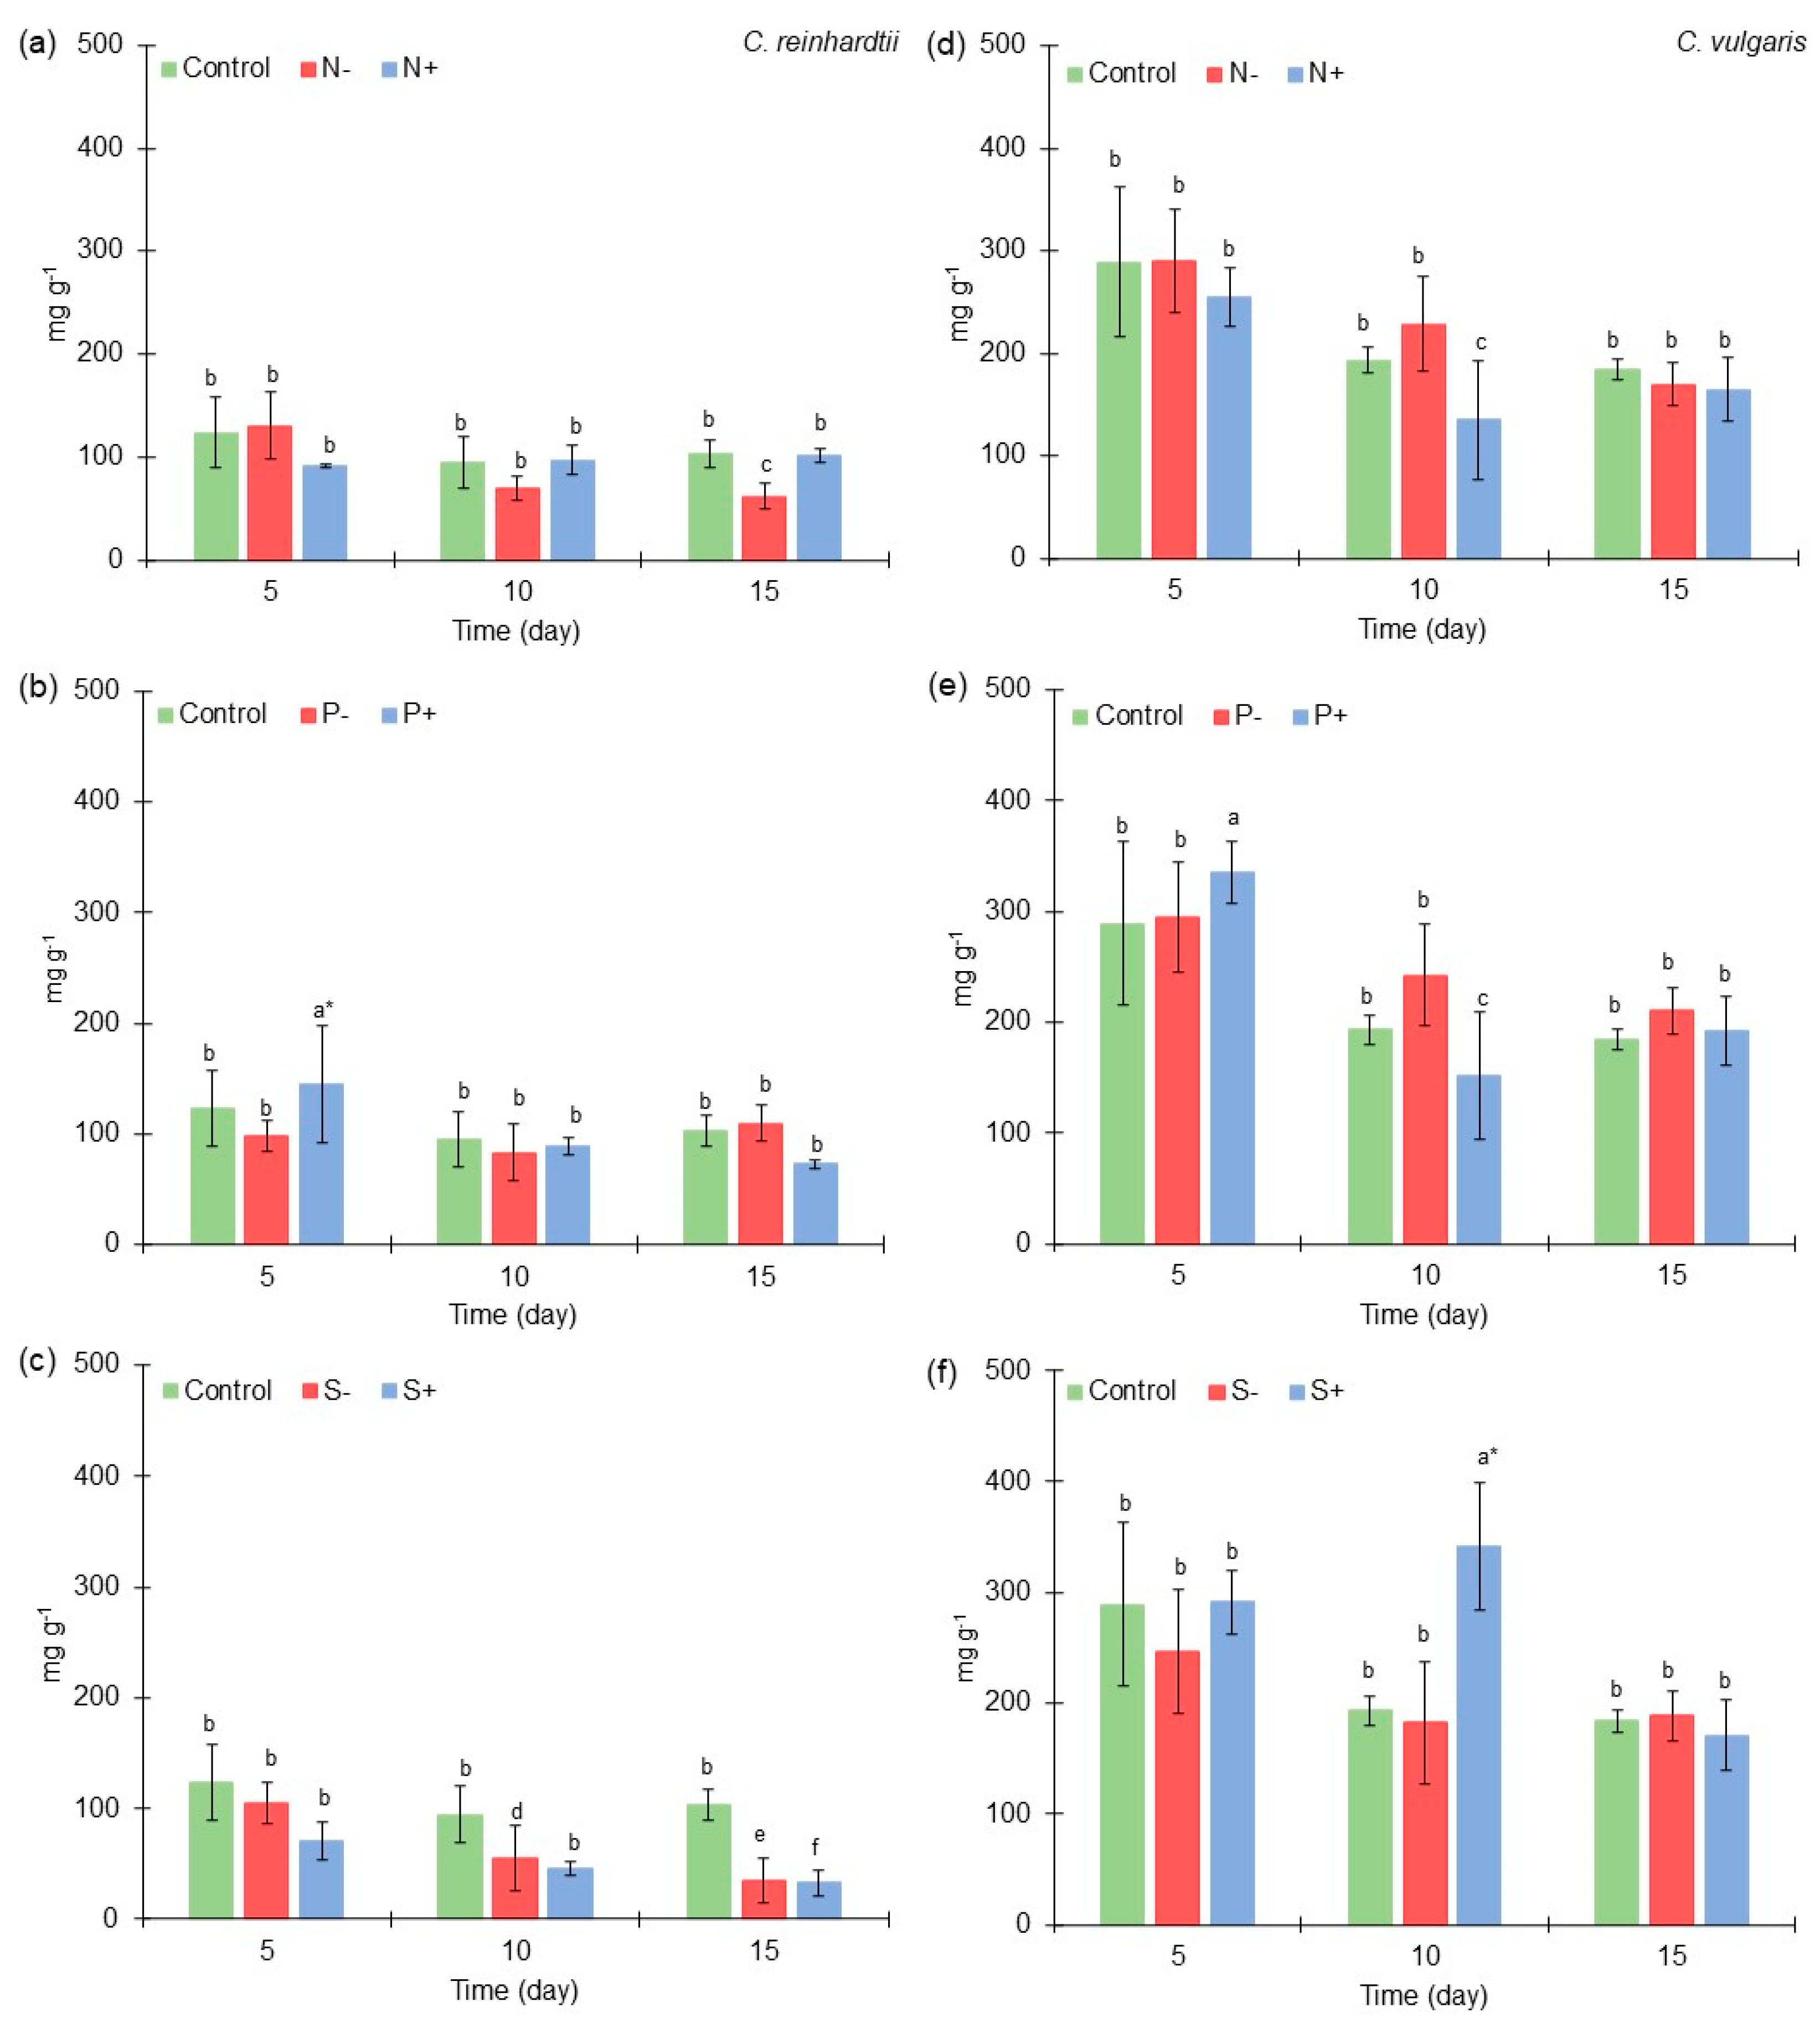
2.3. Protein Content of Chlamydomonas reinhardtii and Chlorella vulgaris Grown with Different Nitrogen, Phosphorus, and Sulfur Concentrations

C. reinhardtii produced a higher concentration of proteins with medium macroelements concentration [Control] in most microalgae cultures, except in the cases of low nitrogen [N] and high phosphorus [P+] concentration at the 5th culture day and low phosphorus [P] concentration at the 15th culture day (Figure 3a–c). On the other hand, C. vulgaris exhibited an improved production of proteins under high macroelements concentrations in some microalgae cultures (Figure 3d–f).
At medium macroelements concentration [Control] in C. reinhardtii, 123 mg g−1, 94 mg g−1, and 103 mg g−1 were obtained at the 5th, 10th, and 15th culture days, respectively. These results are similar to those reported by Rosa et al. (2023) [55], where C. reinhardtii obtained approximately 50 mg g−1 to 150 mg g−1 of proteins under standard conditions. In a medium-concentration treatment, C. vulgaris obtained 289 mg g−1, 193 mg g−1, and 184 mg g−1 of proteins at the 5th, 10th, and 15th culture days, respectively. These results are in agreement with those reported by Ma et al., 2021 [56], who cultivated C. sorokiniana FZU60 under batch conditions and produced 400 mg g−1 of proteins after three days of culture.
At low nitrogen [N] and high phosphorus [P+] concentration at the 5th culture day, C. reinhardtii obtained 130 mg g−1 (5% greater than medium concentration) and 145 mg g−1 (17% greater than medium concentration), respectively. These results are similar to those found by Kamalanathan et al. (2016) [57], where C. reinhardtii obtained a higher amount of protein in conditions without nitrogen in the first five days of culture. The increase in proteins at low nitrogen [N] concentration could be related to the use of intracellular nitrogen stored in macromolecules such as chlorophyll. Similar to these results, C. reinhardtii culture under nitrogen limitation for the first cycles of cell division used the nitrogen found in the cells, and therefore, a slight increase (≤13%) in the protein content was observed in the culture [58].
Other authors have reported that C. reinhardtii at high phosphorus [P+] concentrations increased protein accumulation, which is in agreement with the results found in our work. Particularly, higher accumulation was reported of proteins involved in ribosome structure and synthesis, as well as in DNA and RNA metabolism [59]. Moreover, it has been demonstrated that this type of treatment [P+] leads to a reduction in the production of carbohydrates in the cell [59]. Similar to our study, the microalgae culture with a high phosphorus concentration had a 26% lower carbohydrates content than the control condition.
In the experiments on nitrogen variations, C. vulgaris obtained a greater amount of proteins at low nitrogen concentration [N], where 228 mg g−1 (18% greater than medium [Control] concentration) was obtained at the 10th culture day. Under nitrogen limitation, microalgae can up-regulate proteins related to lipids (1-Acylglycerol-3-phosphate O-acyltransferase and Glycerol-3-phosphate O-acyltransferase) and carbohydrates (e.g., Citrate synthase, Aconitase, α-Ketoglutarate dehydrogenase, Succinic dehydrogenase, Fumarase) synthesis [60]. Also, at high phosphorus concentration [P+] of C. vulgaris culture, an increase in proteins content was observed, since it reached 335 mg g−1 (16% greater than medium concentration) at the 5th culture day. These results agree with those found in C. reinhardtii experiments.
Also, at low phosphorus concentration [P] of C. vulgaris culture, a greater amount of proteins was obtained, but only on days 10 and 15 of the microalgae culture, with 242 mg g−1 (25% greater than control) and 210 mg g−1 of proteins (14% greater than control), respectively. In Chlorella sp. culture, it was found that phosphorus limitation could enhance protein production more than high phosphorus concentration [61], and these results are similar to those found in this study. This behavior could be related to microalgae’s capacity to preserve high levels of proteins involved in P’s storage as intracellular polyphosphate and its assimilation [59].
It is important to note that the variation in sulfur affects proteins content in C. reinhardtii in a negative way, especially in the high-concentration [S+] condition, since 70 mg g−1 (43% less than medium concentration), 45 mg g−1 (51% less than medium concentration), and 32 mg g−1 of proteins (>60% less than medium concentration) were obtained at the 5th, 10th, and 15th culture days, respectively. In addition, high sulfur concentration [S+] resulted in 341 mg g−1 (>50% greater than control) at the 10th culture day of C. vulgaris culture. Contrarily, C. vulgaris at low sulfur [S] concentration produced a protein content decrease, which can be related to the affectation in biosynthesis of the sulfur amino acids such as cysteine and methionine [62]. Also, sulfur is a macronutrient related to nuclear transcripts encoding proteins involved in photosynthetic activity; therefore, its variation in culture medium has a negative impact on the protein content of the biomass [63].
From the ANOVA–Tukey pairwise analysis of protein content in C. reinhardtii culture, it was determined that at high phosphorus [P+] concentration, a higher protein content was produced in all the experiments at the 5th day of culture (145 mg g−1). On the other hand, from the ANOVA–Tukey pairwise analysis of protein in C. vulgaris culture, it was determined that at high sulfur [S+] and high phosphorus [P+] concentration was produced a higher protein content in all the experiments at the 10th day of culture (341 mg g−1) and at the 5th day of culture (335 mg g−1), respectively.

2.4. Lipid Content of Chlamydomonas reinhardtii and Chlorella vulgaris Grown with Different Nitrogen, Phosphorus, and Sulfur Concentrations

C. reinhardtii at medium macroelements concentration [Control] produced 84 mg g−1, 154 mg g−1, and 127 mg g−1 of lipids at the 5th, 10th, and 15th culture days (Figure 4a–c), respectively. These results are similar to those obtained with C. reinhardtii cc849, for which 150 mg g−1 of lipids was reached at control conditions. Also, it was observed that lipids increased in microalgae biomass at least 50% after nitrogen deprivation [64]. This behavior was also found in this study, since low nitrogen [N] concentration produced 128 mg g−1 (52% greater than medium [Control] concentration). On the other hand, C. vulgaris obtained an improved production of lipids with low macroelements concentrations in some microalgae cultures (Figure 4d–f). At medium macroelements concentration [Control], 121 mg g−1 and 169 mg g−1 were obtained at the 10th and 15th culture days, respectively. In other studies, C. vulgaris has had a lipid accumulation of 9 to 12% dry wt [65], which are similar results to those found here.
At low nitrogen concentration [N], a slightly higher amount of lipids was obtained in C. vulgaris, but only on day 5 of the microalgae culture, when122 mg g−1 was reached. Similarly, Graesiella emersonii (formerly Chlorella emersonii) produced more lipids under nitrogen limitation conditions; however, a complete nitrogen deprivation reduced lipid production [37]. Hence, it is important to determine the optimal level of nitrogen limitation to improve lipid production in microalgae biomass depending on the microalgae strain. In this case, it is possible that with a concentration slightly higher than that considered in the low range, an increase in lipids could be observed.
The response of lipid production in microalgae culture under low-nitrogen conditions is related to the overexpression of genes involved in the TAG pathway. In Tetradesmus bernardii (Chlorophyta), it was observed that genes encoding diacylglycerol acyltransferase (DGAT2 and DGAT1) were up-regulated under low nitrogen concentration, as well as acetyl-coenzyme A carboxylase [66]. Also, in this condition, an overexpression of genes related to the biosynthesis of palmitoyl-acyl carrier protein (β-ketoacyl-acyl-carrier-protein synthase [KASII]) could be observed in Scenedesmus acutus [67].
At low phosphorus [P] concentration at the 5th culture day in C. reinhardtii, a higher production of lipids (134 mg g−1) was obtained (37% greater than medium concentration). Similar to C. reinhardtii, in the experiments on phosphorus variations, C. vulgaris obtained a greater amount of lipids under low phosphorus concentration [P], reaching values of 212 mg g−1 (>50% greater than medium [Control] concentration), 183 mg g−1 (34% greater than medium concentration), and 248 mg g−1 (45% greater than medium concentration) at the 5th, 10th, and 15th culture days, respectively. This behavior is similar to that found in other microalgae such as Scenedesmus sp., which at lower phosphorus concentration produced an increase of approximately 50% in lipid content. The phosphorus limitation enhances the expression of genes related to fatty acid biosynthesis such as 3-ketoacyl-CoA synthase and 2-enoyl-CoA reductase [68]. In addition, lipids production could be associated with the low production of carbohydrates presented under the low phosphorus treatment [P], since a similar carbohydrate content to that obtained by the control was observed on certain sampling days (Figure 2); contrarily, the production of lipids showed an evident increase regardless of the sampling day.
In the case of low sulfur [S] concentration at the 15th culture day, 246 mg g−1 (>50% greater than control culture) was obtained in C. reinhardtii culture. C. reinhardtii CC-124 shows an increase in lipids during sulfur deprivation of approximately 35% [69]. These results are similar to those found by Gómez-De la Torre et al. (2023) [70], who reported a higher lipid content in sulfur and phosphorus limitation conditions, showing that the concentration of both macroelements in microalgae culture is highly relevant for the production of lipids. Also, 216 mg g−1 (>50% greater than control) was obtained under low concentration [S] conditions at the 10th culture day in C. vulgaris. This behavior could be related to the overexpression of genes encoding acyltransferases related to TAG production such as phospholipid diacylglycerol acyltransferase (PDAT1) and diacylglycerol acyltransferase (DGTT1) [71]. In addition, it was determined that sulfur limitation could affect acetyl-CoA metabolomics flow, which in turn may increase the production of fatty acids and genes related to fatty acid desaturase and phosphatidic acid phosphatase [54].
From the ANOVA–Tukey pairwise analysis of lipids production in C. reinhardtii culture, it was determined that at low sulfur [S] concentration, a higher lipids content was produced in all the experiments at the 15th day of culture (246 mg g−1). On the other hand, from the ANOVA–Tukey pairwise analysis of lipid production in C. vulgaris culture, it was determined that at low phosphorus [P] concentration, a higher lipids content was produced in all the experiments at the 15th day of culture (248 mg g−1).

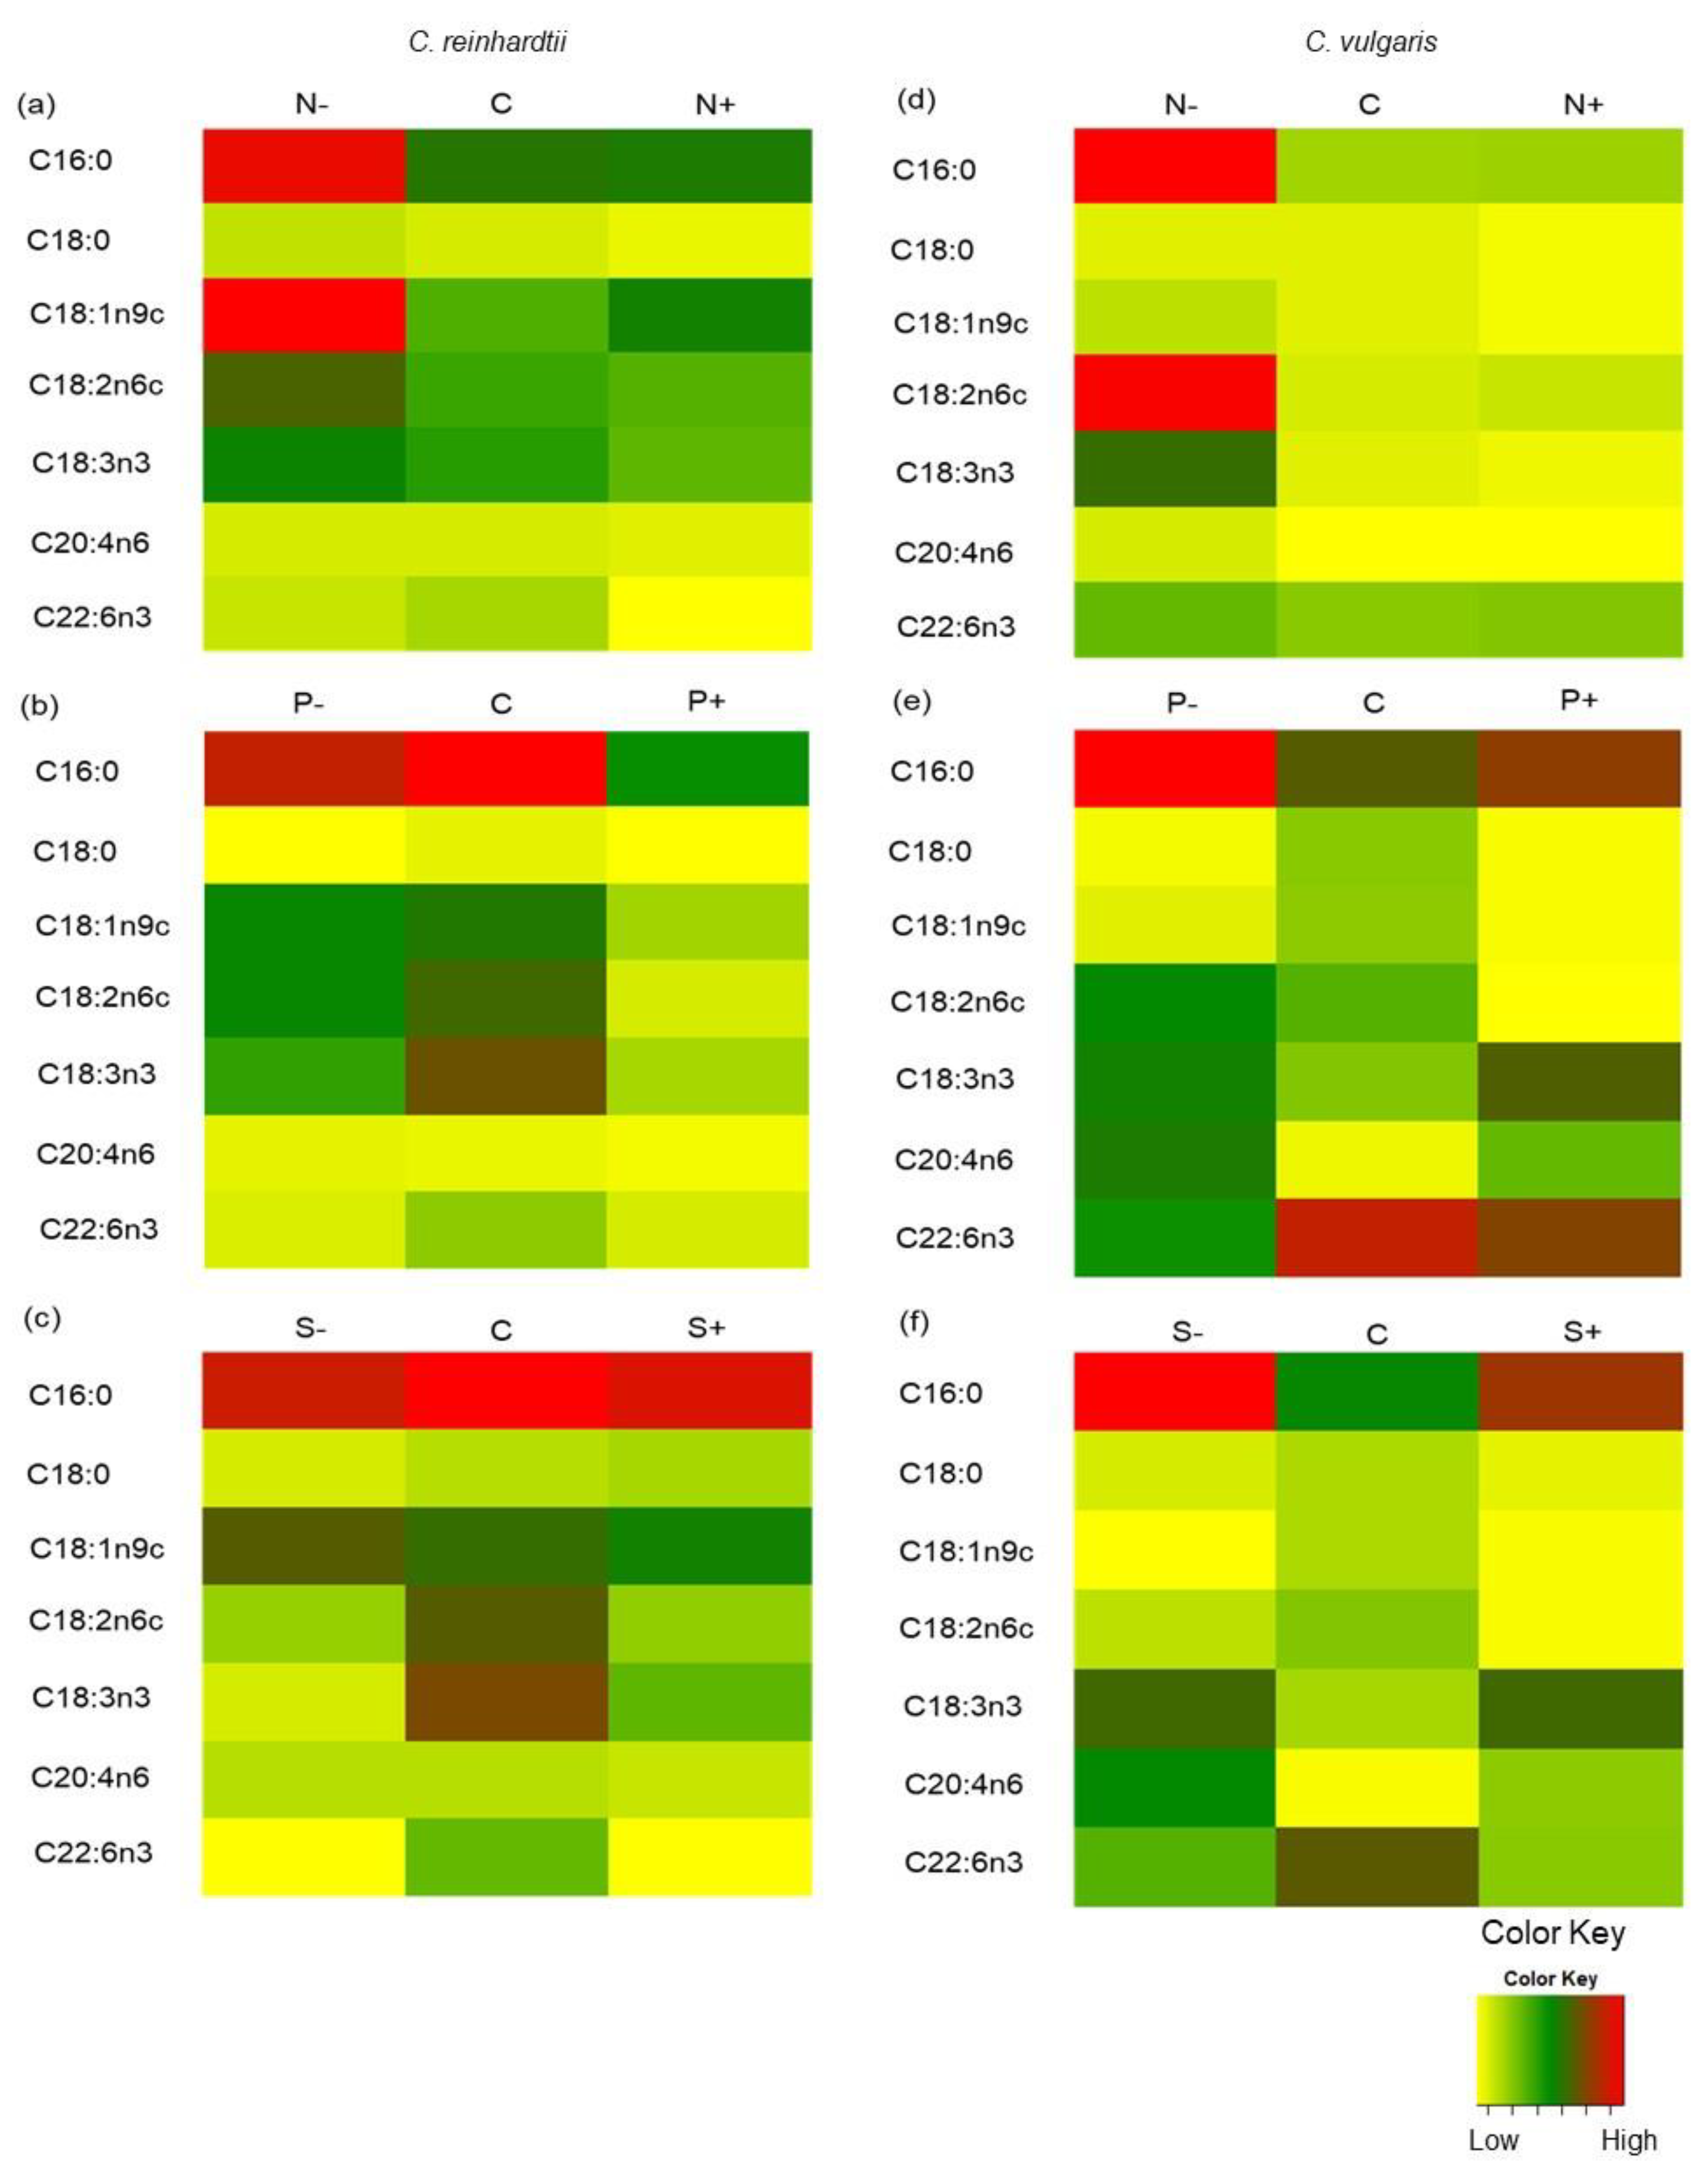
2.5. FAMEs Accumulation of Chlamydomonas reinhardtii and Chlorella vulgaris Grown with Different Nitrogen, Phosphorus, and Sulfur Concentrations

C. reinhardtii in medium concentration of macronutrients [Control] and after 15 days of cultivation produced 20 ± 3 mg g−1 (31% of total fatty acids) of palmitic acid (C16:0), 12 ± 1.5 mg g−1 (17%TFA) of oleic acid (C18:1n9c), 13 ± 2.5 mg g−1 (16%TFA) of linoleic acid (C18:2n6c), and 15 ± 2.5 mg g−1 (18%TFA) of α-linoleic acid (C18:3n3) (Figure 5a–c). These results are similar to those found by Zheng et al., 2022 [72], where C. reinhardtii obtained 21%TFA of palmitic acid, 9%TFA of oleic acid, and 17%TFA of linoleic acid.
At low nitrogen concentration [N] in C. reinhardtii culture, 34 ± 8 mg g−1 [28%TFA] of palmitic acid, 36 ± 10 mg g−1 [27%TFA] of oleic acid, 23 ± 5 mg g−1 [19%TFA] of linoleic acid, and 19 ± 3 mg g−1 [16%TFA] of α-linoleic acid were produced at the 15th culture day, the highest result in the whole experiment with this microalga strain. In the literature, similar results can be found. For example, Phaeodactylum tricornutum produced a higher percentage of α-linoleic acid and palmitic acid under a low-nitrogen condition [73]. Chlamydomonas malina FT89.6 PG5 (Roscoff Culture Collection No. 2488) also showed the same behavior under low-nitrogen condition, since it accumulated a slightly higher amount of FAMEs [34].
On the other hand, C. vulgaris under low nitrogen concentration [N] conditions produced 35 ± 12 mg g−1 of palmitic acid (5-fold greater than control), 6 ± 1.2 mg g−1 of oleic acid (2-fold greater than control), 34 ± 12 mg g−1 of linoleic acid (8-fold greater than control), 21 ± 8 mg g−1 of α-linoleic acid (6-fold greater than control), and 3.8 ± 0.75 mg g−1 of arachidonic acid (2-fold greater than control) at the 15th culture day (Figure 5d). Similar to C. reinhardtii, in this treatment, the highest result in the whole experiment was obtained. This behavior was observed in Vischeria calaminaris (formerly Eustigmatos calaminaris) culture, which, under low nitrogen concentration, produced higher C16 and C20 fatty acids [42]. These results suggest that decreasing the concentration of nitrogen might be a more feasible strategy to increase the percentage of fatty acids produced in microalgae, in comparison to strategies related to the concentration of phosphorus and sulfur.
In low phosphorus [P] conditions, C. reinhardtii produced 5% more arachidonic acid (C20:4n6) than control conditions. This result is in agreement with other studies performed with C. reinhardtii culture, in which phosphorus stress generated longer-chain fatty acids (C18:0, C18:1n9c, C:20) compared to control conditions [69]. Similarly, under low phosphorus [P] conditions in C. vulgaris culture (Figure 5e), higher concentrations of palmitic acid (44% greater), linoleic acid (42% greater), α-linoleic acid (>50% greater), and arachidonic acid (>50% greater) were observed in comparison to control. The increment can be related to the overexpression of genes involving in fatty acid biosynthesis (e.g., 3-oxoacyl-ACP reductase, 3-ketoacyl-CoA synthase), especially in the case of palmitic and arachidonic acid production [68]. C. vulgaris at high phosphorus concentration [P+], higher concentrations of palmitic (13% greater), α-linoleic acid (>50% greater), and arachidonic acid (>50% greater) were obtained compared to control.
Regarding sulfur treatments, low concentration [S] resulted in 23%TFA of oleic acid (10% more than control) in C. reinhardtii culture. Also, 2-fold greater control of arachidonic acid was obtained at low sulfur concentration. It has been demonstrated that high sulfur concentration causes negative effects on FAMEs production, except in the case of stearic acid, since it obtained >20% production compared to control. The increase in FAMEs concentration under low sulfur concentration could be related to the overexpression of genes related to acetyl-CoA carboxylase, 3-ketoacyl-ACP synthase, and 3-ketoacyl-ACP reductase production, which are involved in fatty acid synthesis [40].
C. vulgaris culture observed an increase in palmitic acid (>50% greater), linoleic acid (>50% greater), and arachidonic acid (>50% greater) compared to control at low sulfur concentration [S] (Figure 5e). These results are similar to those found with Chlorella vulgaris under sulfur-deprived medium, where an increase in palmitic, oleic, and linoleic acid were observed [70]. In addition, at high sulfur concentration [S+], higher concentrations of palmitic acid (49% greater) and α-linoleic acid (>50% greater) were determined compared to the control.

3. Materials and Methods

3.1. Reagents and Equipment

The reagents used for culture medium preparation and to perform the carbohydrates, lipids, and FAMEs analysis were purchased from Sigma-Aldrich (Saint Louis, MO, USA). Lowry Protein Assay Kit was purchased from Thermo Fisher Scientific (Rockford, IL, USA). The spectrophotometric measurements were taken with an absorbance microplate reader from BGM Labtech (Fluorstar omega, 415-0470, Ortenberg, Germany).

3.2. Inoculum Culture Conditions

The strains Chlamydomonas reinhardtii and Chlorella vulgaris were purchased from UTEX (UTEX, Austin, TX, USA). BG11 culture medium was used to perform the experiments with both microalgae strains. The BG11 culture medium composition was as follows: NaNO3 1.5 g L−1, K2HPO4 40 mg L−1, CaCl2·2H2O 36 mg L−1, MgSO4·7H2O 75 mg L−1, Citric Acid·H2O 6 mg L−1, C6H8FeNO7 6 mg L−1, Na2EDTA·2H2O 1 mg L−1, Na2CO3 20 mg L−1, H3BO3 2.86 mg L−1, MnCl2·4H2O 1.81 mg L−1, ZnSO4·7H2O 0.22 mg L−1, Na2MoO4·2H2O 0.39 mg L−1, CuSO4·5H2O 0.079 mg L−1, and Co(NO3)2·6H2O 0.04 mg L−1. The stock cultures were kept at 21 ± 1 °C with continuous light at 100 μmol photons m−2 s−1 and with 1.5 L m−2 min−1 of aeration (OPTIMA 4.5-Watt pump with an air filter of 0.20 µm).

3.3. Growth Measure of Chlamydomonas reinhardtii and Chlorella vulgaris with Different Nitrogen, Phosphorus, and Sulfur Concentrations

For each experiment, 100 mL Chlamydomonas reinhardtii and Chlorella vulgaris inocula, with an absorbance of 1 at the wavelength of 750 nm, were cultivated separately in lab glass bottles containing 900 mL of BG11. Before inoculation, the biomass was washed twice with bidistilled water. The cultures were maintained under the same conditions mentioned in the previous section. A factorial design was used for this research and applied to each experiment set (Table 1). Cell growth and biomass composition of Chlamydomonas reinhardtii and Chlorella vulgaris were evaluated under three different nitrogen, phosphorus, and sulfur concentrations. Nitrogen: low, 80 mg L−1 N; medium, 240 mg L−1 N; and high, 640 mg L−1 N. Phosphorus: low, 4 mg L−1 P; medium, 7 mg L−1 P; and high, 17 mg L−1 P. Sulfur: low, 8 mg L−1 S; medium, 20 mg L−1 S; and high 52 mg L−1 S. The foregoing values were obtained during 15 culture days. The medium concentration was taken as a control, since this is the standard concentration used in the BG11 medium.
Prior to the experiments, an equation of relationship between absorbance (750 nm) and dry weight (g L−1) of each strain was defined, as shown in Equations (1) and (2). Samples of 1 mL were obtained every day to assess the biomass growth curve by spectrophotometry. The dry weight was determined by filtering 10 mL of serial algal culture dilutions using pre-weighed Whatman GF/C glass microfiber filters. The filter holding the algal biomass was dried at 100 °C for 2 h. Then, filters with the algal biomass were cooled at room temperature inside a vacuum desiccator and weighed gravimetrically.
C . r e i n h a r d t i i   g   L 1 = 3.9218 A b s 750 0.2085   R 2 = 0.996
C . v u l g a r i s   g   L 1 = 1.0444 A b s 750 0.1672   R 2 = 0.991

3.4. Biomass Characterization of Chlamydomonas reinhardtii and Chlorella vulgaris Grown with Different Nitrogen, Phosphorus, and Sulfur Concentrations

The cultures of Chlamydomonas reinhardtii and Chlorella vulgaris were sampled by taking 15 mL of the culture on days 5, 10, and 15. Samples were stored at 4 °C until further analysis. To perform the carbohydrate, protein, and lipid assay, samples were centrifuged at 6000 rpm and 4 °C for 20 min. Then, the supernatant was discharged, and the biomass was washed twice and resuspended in distilled water.

3.5. Total Carbohydrates Content of Chlamydomonas reinhardtii and Chlorella vulgaris Grown with Different Nitrogen, Phosphorus, and Sulfur Concentrations

Carbohydrate content was quantified using the sulfuric acid–UV assay described by López-legarda et al. [74]. Briefly, 300 µL of the washed biomass was taken before adding 1 mL of concentrated sulfuric acid; then, the mixture was incubated in an ice bath for two minutes. Then, the absorbance was measured at 315 nm using a microplate reader from BGM Labtech. Finally, the absorbance readings were used to obtain the concentration of carbohydrates (mg L−1) by using a glucose standard curve.

3.6. Total Protein Content of Chlamydomonas reinhardtii and Chlorella vulgaris Grown with Different Nitrogen, Phosphorus, and Sulfur Concentrations

The Modified Lowry Protein Assay Kit was used to determine the total protein produced by Chlamydomonas reinhardtii and Chlorella vulgaris. Firstly, 1 mL of Lowry’s reagent was added to 200 µL of washed biomass solution. Secondly, the tube was vortexed. After 10 min, 100 µL of Folin reagent was added, and the mixture was vortexed again. After 30 min of reaction in the dark, the absorbance of the samples was measured at 750 nm in an absorbance microplate reader from BGM Labtech. Finally, the protein concentration was obtained using a BSA calibration curve.

3.7. Total Lipid Content of Chlamydomonas reinhardtii and Chlorella vulgaris Grown with Different Nitrogen, Phosphorus, and Sulfur Concentrations

The lipid content produced by Chlamydomonas reinhardtii and Chlorella vulgaris was quantified using the sulfo-phospho-vanillin assay described by Mishra et al. (2014) [75]. Briefly, 2 mL of sulfuric acid (98%) was added to 100 µL of the concentrated washed microalgae biomass (10:1). Then, it was heated for 10 min at 100 °C. Next, it was cooled in an ice bath for 5 min. After that, 5 mL of phospho-vanillin reagent was added, and the sample was incubated for 15 min at 37 °C. Finally, the absorbance was measured at 530 nm in an absorbance microplate reader from BGM Labtech. The lipid concentration was obtained using a canola oil calibration curve.

3.8. FAMEs of Chlamydomonas reinhardtii and Chlorella vulgaris Grown with Different Nitrogen, Phosphorus, and Sulfur Concentrations

Chloroform, methanol, and distilled water were added in ratios of 1:2:0.4 (v/v/v), respectively, into 150 mg of dried biomass. The resulting mixture was mixed for 30 s and then centrifuged at 4800 rpm for 10 min at 4 °C. After centrifugation, the lower layer was carefully recovered and filtered using a PTFE syringe filter (0.45 μm pore size, Thermo Fisher Scientific, Waltham, MA, USA). Then, it was transferred into a pre-weighed glass tube. The remaining chloroform was dried in a concentrator at 45 °C for 2 h at 15 mm Hg. The extracted lipids were gravimetrically weighted to estimate the total lipid content according to the Bligh and Dyer method with some modifications [76].
Fatty acids were determined through derivatization to fatty acid methyl esters (FAMEs) in closed vial by using (2 mL) of methanol at 7% with sulfuric acid using triundecanoin (C11:0) as internal standard. Mixture was heated at 80 °C for 1.5 h. Immediately after reaching room temperature, sample was extracted with 3 mL of hexane while manually shaking for 1 min. The upper phase formed was recovered, and the inferior phase was extracted again with 3 mL of hexane. Recovered phases were placed in a volumetric flask and brought to 10 mL with hexane.
Fatty acid profile was analyzed by a gas chromatograph with a mass spectrometer (Perkin Elmer, Clarus 600/560D, Bridgeport, CT, USA) by using an HP-88 capillary column (100 m, 0.25 mm × 0.20 µm). The carrier gas was helium at a constant flow of 1 mL/min. The initial oven temperature was 140 °C (held for 5 min), and it was increased by 4 °C/min until it reached the final temperature 240 °C (held for 15 min). Split ratio was 1:10, injector temperature was 265 °C, mass spectrometer analysis used EI ion source, electron energy was 70 eV, the temperature of source and interface were 210 °C, and range of m/z = 30–550. For FAMEs identification, the retention time of a typical chromatogram of the 37-component standard reference for FAME was used, and the quantification was realized used the standard internal method, using triundecanoin as the internal standard (AOAC Official Method 996.06).

3.9. Data Analysis

All data were analyzed by Minitab 21 (Minitab Inc., PA, USA). They were analyzed by an ANOVA with a Tukey pairwise comparison for each type of microalga (α = 0.05). The heatmaps for FAMEs expression were created with R-studio using ggplot2 package.

4. Conclusions

The results found in this study allow us to visualize the impact of three macronutrients’ (nitrogen, phosphorus, and sulfur) variation on the production of biomolecules of interest in the same microalgae strain (Chlamydomonas reinhardtii and Chlorella vulgaris). It was shown that some microalgae (C. reinhardtii) could produce more biomass under low nitrogen concentration (3.69 g L−1) than standard conditions. It was shown that low concentrations of nitrogen and phosphorus could enhance carbohydrates and lipids in microalgae culture. In addition, surprisingly, the impact that sulfur variation can have on the production of biomolecules in microalgae was found, especially in the case of lipids and proteins. Interestingly, it was determined that low concentration of nitrogen had a better effect on accumulation of some FAMEs (e.g., palmitic, oleic, and linoleic acid) in both microalgae. These results could be useful for increasing productivity of some biomolecules in large-scale microalgae cultures, especially in those intended for the production of FAMEs (C16-C:18).

Author Contributions

Conceptualization, I.Y.L.-P.; methodology, V.G.A.-M., C.A.M.-M. and I.Y.L.-P.; formal analysis, I.Y.L.-P. and J.R.-R.; investigation, I.Y.L.-P., J.R.-R. and S.P.C.-B.; data curation, I.Y.L.-P., S.P.C.-B. and R.B.G.-G.; writing—original draft preparation, I.Y.L.-P.; writing—review and editing, I.Y.L.-P., S.P.C.-B., R.B.G.-G., K.G.C.-A., L.I.F.-C., G.M.G.-M., H.M.N.I. and R.P.-S.; visualization, I.Y.L.-P., H.M.N.I. and R.P.-S.; supervision, H.M.N.I. and R.P.-S.; project administration, H.M.N.I. and R.P.-S.; funding acquisition, H.M.N.I. and R.P.-S. All authors have read and agreed to the published version of the manuscript.

Funding

This work was supported by the Consejo Nacional de Humanidades, Ciencias y Tecnologías (CONAHCYT). This research was funded by Tecnologico de Monterrey project entitled “Exploring and optimizing CO2 bio fixation process for microalgae lipids production to formulate green metalworking fluids—for cleaner manufacturing processes” (ID: I023—IAMSM002—C4-T2—E). Tec challenge-based projects call 2022.

Institutional Review Board Statement

Not applicable.

Informed Consent Statement

Not applicable.

Data Availability Statement

All data related to this work is given in this manuscript.

Acknowledgments

The authors would like to gratefully acknowledge the Latin American and Caribbean Water Center from Tecnológico de Monterrey for the laboratory facilities. The authors would like to acknowledge the funding provided by Tecnologico de Monterrey through the Bioprocess Research Chair [0020209I13]. This work was partially supported by Consejo Nacional de Humanidades, Ciencias y Tecnologías [CONAHCYT] Mexico under the Sistema Nacional de Investiga-dores [SNI] program awarded to Hafiz M.N. Iqbal [CVU: 735340], Roberto Parra–Saldivar [CVU: 35753], and Karina G. Coronado-Apodaca [CVU: 625883]. The Technology Scholarship to I. Lopez [CVU: 859227] from CONAHCYT is also thankfully acknowledged.

Conflicts of Interest

The authors declare no conflict of interest.

References

  1. Khan, M.I.; Shin, J.H.; Kim, J.D. The promising future of microalgae: Current status, challenges, and optimization of a sustainable and renewable industry for biofuels, feed, and other products. Microb. Cell Fact. 2018, 17, 36. [Google Scholar] [CrossRef] [PubMed]
  2. Hossain, S.M.Z. Biochemical Conversion of Microalgae Biomass into Biofuel. Chem. Eng. Technol. 2019, 42, 2594–2607. [Google Scholar] [CrossRef]
  3. López-Pacheco, I.Y.; Silva-Núñez, A.; García-Perez, J.S.; Carrillo-Nieves, D.; Salinas-Salazar, C.; Castillo-Zacarías, C.; Afewerki, S.; Barceló, D.; Iqbal, H.N.M.; Parra-Saldívar, R. Phyco-remediation of swine wastewater as a sustainable model based on circular economy. J. Environ. Manag. 2021, 278, 111534. [Google Scholar] [CrossRef] [PubMed]
  4. Adamczyk, M.; Lasek, J.; Skawińska, A. CO2 Biofixation and Growth Kinetics of Chlorella vulgaris and Nannochloropsis gaditana. Appl. Biochem. Biotechnol. 2016, 179, 1248–1261. [Google Scholar] [CrossRef]
  5. Dineshbabu, G.; Uma, V.S.; Mathimani, T.; Deviram, G.; Arul Ananth, D.; Prabaharan, D.; Uma, L. On-site concurrent carbon dioxide sequestration from flue gas and calcite formation in ossein effluent by a marine cyanobacterium Phormidium valderianum BDU 20041. Energy Convers. Manag. 2017, 141, 315–324. [Google Scholar] [CrossRef]
  6. Hariz, H.B.; Takriff, M.S.; Mohd Yasin, N.H.; Ba-Abbad, M.M.; Mohd Hakimi, N.I.N. Potential of the microalgae-based integrated wastewater treatment and CO2 fixation system to treat Palm Oil Mill Effluent (POME) by indigenous microalgae; Scenedesmus sp. and Chlorella sp. J. Water Process Eng. 2019, 32, 100907. [Google Scholar] [CrossRef]
  7. Srimongkol, P.; Sangtanoo, P.; Songserm, P.; Watsuntorn, W.; Karnchanatat, A. Microalgae-based wastewater treatment for developing economic and environmental sustainability: Current status and future prospects. Front. Bioeng. Biotechnol. 2022, 10, 1048819. [Google Scholar] [CrossRef]
  8. Kuo, C.M.; Chen, T.Y.; Lin, T.H.; Kao, C.Y.; Lai, J.T.; Chang, J.S.; Lin, C.S. Cultivation of Chlorella sp. GD using piggery wastewater for biomass and lipid production. Bioresour. Technol. 2015, 194, 326–333. [Google Scholar] [CrossRef]
  9. Ahmad, A.; Hassan, S.; Banat, F. An overview of microalgae biomass as a sustainable aquaculture feed ingredient: Food security and circular economy. Bioengineered 2022, 13, 9521–9547. [Google Scholar] [CrossRef]
  10. Gouda, M.; Tadda, M.A.; Zhao, Y.; Farmanullah, F.; Chu, B.; Li, X.; He, Y. Microalgae Bioactive Carbohydrates as a Novel Sustainable and Eco-Friendly Source of Prebiotics: Emerging Health Functionality and Recent Technologies for Extraction and Detection. Front. Nutr. 2022, 9, 806692. [Google Scholar] [CrossRef]
  11. Sui, Y.; Vlaeminck, S.E. Effects of salinity, pH and growth phase on the protein productivity by Dunaliella salina. J. Chem. Technol. Biotechnol. 2019, 94, 1032–1040. [Google Scholar] [CrossRef]
  12. Baldisserotto, C.; Sabia, A.; Giovanardi, M.; Ferroni, L.; Maglie, M.; Pancaldi, S. Chlorophyta microalgae as dietary protein supplement: A comparative analysis of productivity related to photosynthesis. J. Appl. Phycol. 2022, 34, 1323–1340. [Google Scholar] [CrossRef]
  13. Udayan, A.; Pandey, A.K.; Sirohi, R.; Sreekumar, N.; Sang, B.-I.; Sim, S.J.; Kim, S.H.; Pandey, A. Production of microalgae with high lipid content and their potential as sources of nutraceuticals. Phytochem. Rev. 2022. [Google Scholar] [CrossRef] [PubMed]
  14. Ferreira, G.F.; Ríos Pinto, L.F.; Maciel Filho, R.; Fregolente, L.V. A review on lipid production from microalgae: Association between cultivation using waste streams and fatty acid profiles. Renew. Sustain. Energy Rev. 2019, 109, 448–466. [Google Scholar] [CrossRef]
  15. Deshmukh, S.; Kumar, R.; Bala, K. Microalgae biodiesel: A review on oil extraction, fatty acid composition, properties and effect on engine performance and emissions. Fuel Process. Technol. 2019, 191, 232–247. [Google Scholar] [CrossRef]
  16. Bayly, G.R. Lipids and disorders of lipoprotein metabolism. In Clinical Biochemistry: Metabolic and Clinical Aspects; Elsevier: Amsterdam, The Netherlands, 2014; pp. 702–736. [Google Scholar]
  17. Maltsev, Y.; Maltseva, K. Fatty acids of microalgae: Diversity and applications. Rev. Environ. Sci. Bio/Technol. 2021, 20, 515–547. [Google Scholar] [CrossRef]
  18. Babu, S.S.; Gondi, R.; Vincent, G.S.; JohnSamuel, G.C.; Jeyakumar, R.B. Microalgae Biomass and Lipids as Feedstock for Biofuels: Sustainable Biotechnology Strategies. Sustainability 2022, 14, 15070. [Google Scholar] [CrossRef]
  19. Akubude, V.C.; Nwaigwe, K.N.; Dintwa, E. Production of biodiesel from microalgae via nanocatalyzed transesterification process: A review. Mater. Sci. Energy Technol. 2019, 2, 216–225. [Google Scholar] [CrossRef]
  20. Farfan-Cabrera, L.I.; Franco-Morgado, M.; González-Sánchez, A.; Pérez-González, J.; Marín-Santibáñez, B.M. Microalgae Biomass as a New Potential Source of Sustainable Green Lubricants. Molecules 2022, 27, 1205. [Google Scholar] [CrossRef]
  21. Moreira, J.B.; Vaz, B.d.S.; Cardias, B.B.; Cruz, C.G.; Almeida, A.C.A.d.; Costa, J.A.V.; Morais, M.G.d. Microalgae Polysaccharides: An Alternative Source for Food Production and Sustainable Agriculture. Polysaccharides 2022, 3, 441–457. [Google Scholar] [CrossRef]
  22. Lopez-Pacheco, I.Y.; Rodas-Zuluaga, L.I.; Cuellar-Bermudez, S.P.; Hidalgo-Vázquez, E.; Molina-Vazquez, A.; Araújo, R.G.; Martínez-Ruiz, M.; Varjani, S.; Barceló, D.; Iqbal, H.M.N.; et al. Revalorization of Microalgae Biomass for Synergistic Interaction and Sustainable Applications: Bioplastic Generation. Mar. Drugs 2022, 20, 601. [Google Scholar] [CrossRef]
  23. De Carvalho Silvello, M.A.; Severo Gonçalves, I.; Patrícia Held Azambuja, S.; Silva Costa, S.; Garcia Pereira Silva, P.; Oliveira Santos, L.; Goldbeck, R. Microalgae-based carbohydrates: A green innovative source of bioenergy. Bioresour. Technol. 2022, 344, 126304. [Google Scholar] [CrossRef] [PubMed]
  24. Amorim, M.L.; Soares, J.; Coimbra, J.S.D.R.; Leite, M.D.O.; Albino, L.F.T.; Martins, M.A. Microalgae proteins: Production, separation, isolation, quantification, and application in food and feed. Crit. Rev. Food Sci. Nutr. 2021, 61, 1976–2002. [Google Scholar] [CrossRef] [PubMed]
  25. Bertsch, P.; Böcker, L.; Mathys, A.; Fischer, P. Proteins from microalgae for the stabilization of fluid interfaces, emulsions, and foams. Trends Food Sci. Technol. 2021, 108, 326–342. [Google Scholar] [CrossRef]
  26. Morales, M.; Aflalo, C.; Bernard, O. Microalgal lipids: A review of lipids potential and quantification for 95 phytoplankton species. Biomass Bioenergy 2021, 150, 106108. [Google Scholar] [CrossRef]
  27. De Luca, M.; Pappalardo, I.; Limongi, A.R.; Viviano, E.; Radice, R.P.; Todisco, S.; Martelli, G.; Infantino, V.; Vassallo, A. Lipids from Microalgae for Cosmetic Applications. Cosmetics 2021, 8, 52. [Google Scholar] [CrossRef]
  28. Farfan-Cabrera, L.I.; Rojo-Valerio, A.; Calderon-Najera, J.D.D.; Coronado-Apodaca, K.G.; Iqbal, H.M.N.; Parra-Saldivar, R.; Franco-Morgado, M.; Elias-Zuñiga, A. Microalgae Oil-Based Metal Working Fluids for Sustainable Minimum Quantity Lubrication (MQL) Operations—A Perspective. Lubricants 2023, 11, 215. [Google Scholar] [CrossRef]
  29. Wang, Y.; Tibbetts, S.; McGinn, P. Microalgae as Sources of High-Quality Protein for Human Food and Protein Supplements. Foods 2021, 10, 3002. [Google Scholar] [CrossRef]
  30. Cheng, C.-L.; Lo, Y.-C.; Huang, K.-L.; Nagarajan, D.; Chen, C.-Y.; Lee, D.-J.; Chang, J.-S. Effect of pH on biomass production and carbohydrate accumulation of Chlorella vulgaris JSC-6 under autotrophic, mixotrophic, and photoheterotrophic cultivation. Bioresour. Technol. 2022, 351, 127021. [Google Scholar] [CrossRef]
  31. Cheirsilp, B.; Torpee, S. Enhanced growth and lipid production of microalgae under mixotrophic culture condition: Effect of light intensity, glucose concentration and fed-batch cultivation. Bioresour. Technol. 2012, 110, 510–516. [Google Scholar] [CrossRef]
  32. Salman, J.M.; Grmasha, R.A.; Stenger-Kovács, C.; Lengyel, E.; Al-sareji, O.J.; AL-Cheban, A.M.A.A.; Meiczinger, M. Influence of magnesium concentrations on the biomass and biochemical variations in the freshwater algae, Chlorella vulgaris. Heliyon 2023, 9, e13072. [Google Scholar] [CrossRef] [PubMed]
  33. Beigbeder, J.-B.; Lavoie, J.-M. Effect of photoperiods and CO2 concentrations on the cultivation of carbohydrate-rich P. kessleri microalgae for the sustainable production of bioethanol. J. CO2 Util. 2022, 58, 101934. [Google Scholar] [CrossRef]
  34. Morales-Sánchez, D.; Schulze, P.S.C.; Kiron, V.; Wijffels, R.H. Production of carbohydrates, lipids and polyunsaturated fatty acids (PUFA) by the polar marine microalga Chlamydomonas malina RCC2488. Algal Res. 2020, 50, 102016. [Google Scholar] [CrossRef]
  35. Josephine, A.; Kumar, T.S.; Surendran, B.; Rajakumar, S.; Kirubagaran, R.; Dharani, G. Evaluating the effect of various environmental factors on the growth of the marine microalgae, Chlorella vulgaris. Front. Mar. Sci. 2022, 9, 954622. [Google Scholar] [CrossRef]
  36. Zarrinmehr, M.J.; Farhadian, O.; Heyrati, F.P.; Keramat, J.; Koutra, E.; Kornaros, M.; Daneshvar, E. Effect of nitrogen concentration on the growth rate and biochemical composition of the microalga, Isochrysis galbana. Egypt. J. Aquat. Res. 2020, 46, 153–158. [Google Scholar] [CrossRef]
  37. Chin, G.J.W.L.; Andrew, A.R.; Abdul-Sani, E.R.; Yong, W.T.L.; Misson, M.; Anton, A. The effects of light intensity and nitrogen concentration to enhance lipid production in four tropical microalgae. Biocatal. Agric. Biotechnol. 2023, 48, 102660. [Google Scholar] [CrossRef]
  38. Lovio Fragoso, J.; Hayano Kanashiro, C.; Lopez Elias, J. Effect of different phosphorus concentrations on growth and biochemical composition of Chaetoceros muelleri. Lat. Am. J. Aquat. Res. 2019, 47, 361–366. [Google Scholar] [CrossRef] [Green Version]
  39. Li, M.; Li, Y.; Zhang, Y.; Xu, Q.; Iqbal, M.S.; Xi, Y.; Xiang, X. The significance of phosphorus in algae growth and the subsequent ecological response of consumers. J. Freshw. Ecol. 2022, 37, 57–69. [Google Scholar] [CrossRef]
  40. Mao, X.; Lao, Y.; Sun, H.; Li, X.; Yu, J.; Chen, F. Time-resolved transcriptome analysis during transitions of sulfur nutritional status provides insight into triacylglycerol (TAG) and astaxanthin accumulation in the green alga Chromochloris zofingiensis. Biotechnol. Biofuels 2020, 13, 128. [Google Scholar] [CrossRef]
  41. Cakmak, T.; Angun, P.; Ozkan, A.D.; Cakmak, Z.; Olmez, T.T.; Tekinay, T. Nitrogen and sulfur deprivation differentiate lipid accumulation targets of Chlamydomonas reinhardtii. Bioengineered 2012, 3, 343–346. [Google Scholar] [CrossRef] [Green Version]
  42. Krzemińska, I.; Szymańska, M.; Ciempiel, W.; Piasecka, A. Auxin supplementation under nitrogen limitation enhanced oleic acid and MUFA content in Eustigmatos calaminaris biomass with potential for biodiesel production. Sci. Rep. 2023, 13, 594. [Google Scholar] [CrossRef] [PubMed]
  43. Cheng, D.; Li, D.; Yuan, Y.; Zhou, L.; Li, X.; Wu, T.; Wang, L.; Zhao, Q.; Wei, W.; Sun, Y. Improving carbohydrate and starch accumulation in Chlorella sp. AE10 by a novel two-stage process with cell dilution. Biotechnol. Biofuels 2017, 10, 75. [Google Scholar] [CrossRef] [PubMed] [Green Version]
  44. Michelon, W.; Da Silva, M.L.B.; Mezzari, M.P.; Pirolli, M.; Prandini, J.M.; Soares, H.M. Effects of Nitrogen and Phosphorus on Biochemical Composition of Microalgae Polyculture Harvested from Phycoremediation of Piggery Wastewater Digestate. Appl. Biochem. Biotechnol. 2016, 178, 1407–1419. [Google Scholar] [CrossRef]
  45. Zhuang, L.-L.; Azimi, Y.; Yu, D.; Wu, Y.-H.; Hu, H.-Y. Effects of nitrogen and phosphorus concentrations on the growth of microalgae Scenedesmus. LX1 in suspended-solid phase photobioreactors (ssPBR). Biomass Bioenergy 2018, 109, 47–53. [Google Scholar] [CrossRef]
  46. Wang, Y.; Xu, H.; Yang, J.; Zhou, Y.; Wang, X.; Dou, S.; Li, L.; Liu, G.; Yang, M. Effect of sulfur limitation strategies on glucose-based carbohydrate production from Chlorella sorokiniana. Renew. Energy 2022, 200, 449–456. [Google Scholar] [CrossRef]
  47. Narchonai, G.; Arutselvan, C.; LewisOscar, F.; Thajuddin, N. Enhancing starch accumulation/production in Chlorococcum humicola through sulphur limitation and 2,4-D treatment for butanol production. Biotechnol. Rep. 2020, 28, e00528. [Google Scholar] [CrossRef]
  48. Subramanian, S.; Barry, A.N.; Pieris, S.; Sayre, R.T. Comparative energetics and kinetics of autotrophic lipid and starch metabolism in chlorophytic microalgae: Implications for biomass and biofuel production. Biotechnol. Biofuels 2013, 6, 150. [Google Scholar] [CrossRef] [Green Version]
  49. Fattore, N.; Bellan, A.; Pedroletti, L.; Vitulo, N.; Morosinotto, T. Acclimation of photosynthesis and lipids biosynthesis to prolonged nitrogen and phosphorus limitation in Nannochloropsis gaditana. Algal Res. 2021, 58, 102368. [Google Scholar] [CrossRef]
  50. Bišová, K.; Zachleder, V. Cell-cycle regulation in green algae dividing by multiple fission. J. Exp. Bot. 2014, 65, 2585–2602. [Google Scholar] [CrossRef] [Green Version]
  51. Tan, K.W.M.; Lin, H.; Shen, H.; Lee, Y.K. Nitrogen-induced metabolic changes and molecular determinants of carbon allocation in Dunaliella tertiolecta. Sci. Rep. 2016, 6, 37235. [Google Scholar] [CrossRef] [Green Version]
  52. Geigenberger, P. Regulation of Starch Biosynthesis in Response to a Fluctuating Environment. Plant Physiol. 2011, 155, 1566–1577. [Google Scholar] [CrossRef] [PubMed] [Green Version]
  53. Ran, W.; Wang, H.; Liu, Y.; Qi, M.; Xiang, Q.; Yao, C.; Zhang, Y.; Lan, X. Storage of starch and lipids in microalgae: Biosynthesis and manipulation by nutrients. Bioresour. Technol. 2019, 291, 121894. [Google Scholar] [CrossRef] [PubMed]
  54. Xu, H.; Yang, J.; Wang, X.; Peng, Q.; Han, Y.; Liu, X.; Liu, K.; Dou, S.; Li, L.; Liu, G.; et al. Starch accumulation dynamics and transcriptome analysis of Chlorella sorokiniana during transition of sulfur nutritional status. Front. Mar. Sci. 2022, 9, 986400. [Google Scholar] [CrossRef]
  55. Rosa, R.M.; Machado, M.; Vieira Vaz, M.G.M.; dos Santos, R.L.; do Nascimento, A.G.; Araújo, W.L.; Nunes-Nesi, A. Urea as a source of nitrogen and carbon leads to increased photosynthesis rates in Chlamydomonas reinhardtii under mixotrophy. J. Biotechnol. 2023, 367, 20–30. [Google Scholar] [CrossRef] [PubMed]
  56. Ma, R.; Zhang, Z.; Tang, Z.; Ho, S.-H.; Shi, X.; Liu, L.; Xie, Y.; Chen, J. Enhancement of co-production of lutein and protein in Chlorella sorokiniana FZU60 using different bioprocess operation strategies. Bioresour. Bioprocess. 2021, 8, 82. [Google Scholar] [CrossRef]
  57. Kamalanathan, M.; Pierangelini, M.; Shearman, L.A.; Gleadow, R.; Beardall, J. Impacts of nitrogen and phosphorus starvation on the physiology of Chlamydomonas reinhardtii. J. Appl. Phycol. 2016, 28, 1509–1520. [Google Scholar] [CrossRef]
  58. Schmollinger, S.; Mühlhaus, T.; Boyle, N.R.; Blaby, I.K.; Casero, D.; Mettler, T.; Moseley, J.L.; Kropat, J.; Sommer, F.; Strenkert, D.; et al. Nitrogen-Sparing Mechanisms in Chlamydomonas Affect the Transcriptome, the Proteome, and Photosynthetic Metabolism. Plant Cell 2014, 26, 1410–1435. [Google Scholar] [CrossRef] [Green Version]
  59. Plouviez, M.; Abyadeh, M.; Hasan, M.; Mirzaei, M.; Paulo, J.A.; Guieysse, B. The proteome of Chlamydomonas reinhardtii during phosphorus depletion and repletion. Algal Res. 2023, 71, 103037. [Google Scholar] [CrossRef]
  60. Shang, C.; Zhu, S.; Wang, Z.; Qin, L.; Alam, M.A.; Xie, J.; Yuan, Z. Proteome response of Dunaliella parva induced by nitrogen limitation. Algal Res. 2017, 23, 196–202. [Google Scholar] [CrossRef]
  61. Estevam, B.R.; Pinto, L.F.R.; Filho, R.M.; Fregolente, L.V. Growth and Metabolite Production in Chlorella sp.: Analysis of Cultivation System and Nutrient Reduction. BioEnergy Res. 2022. [Google Scholar] [CrossRef]
  62. Salbitani, G.; Perrone, A.; Rosati, L.; Laezza, C.; Carfagna, S. Sulfur Starvation in Extremophilic Microalga Galdieria sulphuraria: Can Glutathione Contribute to Stress Tolerance? Plants 2022, 11, 481. [Google Scholar] [CrossRef] [PubMed]
  63. Irihimovitch, V.; Yehudai-Resheff, S. Phosphate and sulfur limitation responses in the chloroplast of Chlamydomonas reinhardtii. FEMS Microbiol. Lett. 2008, 283, 1–8. [Google Scholar] [CrossRef]
  64. Xu, L.; Cheng, X.; Wang, Q. Enhanced Lipid Production in Chlamydomonas reinhardtii by Co-culturing with Azotobacter chroococcum. Front. Plant Sci. 2018, 9, 741. [Google Scholar] [CrossRef]
  65. Yadavalli, R.; Ratnapuram, H.; Motamarry, S.; Reddy, C.N.; Ashokkumar, V.; Kuppam, C. Simultaneous production of flavonoids and lipids from Chlorella vulgaris and Chlorella pyrenoidosa. Biomass Convers. Biorefinery 2022, 12, 683–691. [Google Scholar] [CrossRef]
  66. Gao, B.; Wang, F.; Huang, L.; Liu, H.; Zhong, Y.; Zhang, C. Biomass, lipid accumulation kinetics, and the transcriptome of heterotrophic oleaginous microalga Tetradesmus bernardii under different carbon and nitrogen sources. Biotechnol. Biofuels 2021, 14, 4. [Google Scholar] [CrossRef]
  67. Sirikhachornkit, A.; Suttangkakul, A.; Vuttipongchaikij, S.; Juntawong, P. De novo transcriptome analysis and gene expression profiling of an oleaginous microalga Scenedesmus acutus TISTR8540 during nitrogen deprivation-induced lipid accumulation. Sci. Rep. 2018, 8, 3668. [Google Scholar] [CrossRef] [PubMed] [Green Version]
  68. Yang, F.; Xiang, W.; Li, T.; Long, L. Transcriptome analysis for phosphorus starvation-induced lipid accumulation in Scenedesmus sp. Sci. Rep. 2018, 8, 16420. [Google Scholar] [CrossRef] [PubMed] [Green Version]
  69. Çakmak, Z.E.; Ölmez, T.T.; Çakmak, T.; Menemen, Y.; Tekinay, T. Induction of triacylglycerol production in Chlamydomonas reinhardtii: Comparative analysis of different element regimes. Bioresour. Technol. 2014, 155, 379–387. [Google Scholar] [CrossRef] [PubMed] [Green Version]
  70. Gómez-De la Torre, A.E.; Ochoa-Alfaro, A.E.; Rocha-Uribe, A.; Soria-Guerra, R.E. Effects of sulfur and phosphorus concentration on the lipid accumulation and fatty acid profile in Chlorella vulgaris (Chlorophyta). Folia Microbiol. 2023, 68, 453–463. [Google Scholar] [CrossRef]
  71. Boyle, N.R.; Page, M.D.; Liu, B.; Blaby, I.K.; Casero, D.; Kropat, J.; Cokus, S.J.; Hong-Hermesdorf, A.; Shaw, J.; Karpowicz, S.J.; et al. Three Acyltransferases and Nitrogen-responsive Regulator Are Implicated in Nitrogen Starvation-induced Triacylglycerol Accumulation in Chlamydomonas. J. Biol. Chem. 2012, 287, 15811–15825. [Google Scholar] [CrossRef] [Green Version]
  72. Zheng, S.; Zou, S.; Feng, T.; Sun, S.; Guo, X.; He, M.; Wang, C.; Chen, H.; Wang, Q. Low temperature combined with high inoculum density improves alpha-linolenic acid production and biochemical characteristics of Chlamydomonas reinhardtii. Bioresour. Technol. 2022, 348, 126746. [Google Scholar] [CrossRef] [PubMed]
  73. Wang, X.; Fosse, H.K.; Li, K.; Chauton, M.S.; Vadstein, O.; Reitan, K.I. Influence of Nitrogen Limitation on Lipid Accumulation and EPA and DHA Content in Four Marine Microalgae for Possible Use in Aquafeed. Front. Mar. Sci. 2019, 6, 95. [Google Scholar] [CrossRef]
  74. López-legarda, X.; Taramuel-gallardo, A.; Arboleda-, C. Comparison of methods using sulfuric acid for determination of total sugars. Rev. Cuba. Quím. 2017, 29, 180–198. [Google Scholar]
  75. Mishra, S.K.; Suh, W.I.; Farooq, W.; Moon, M.; Shrivastav, A.; Park, M.S.; Yang, J. Rapid quantification of microalgal lipids in aqueous medium by a simple colorimetric method. Bioresour. Technol. 2014, 155, 330–333. [Google Scholar] [CrossRef] [PubMed]
  76. Bligh, E.G.; Dyer, W.J. A rapid method of total lipid extraction and purification. Can. J. Biochem. Physiol. 1959, 37, 911–917. [Google Scholar] [CrossRef]
Figure 1. Growth behavior (g L−1) of Chlamydomonas reinhardtii and Chlorella vulgaris at different nitrogen, phosphorus, and sulfur concentrations. (a) Cell growth of Chlamydomonas reinhardtii grown at different nitrogen concentrations. (b) Cell growth of Chlamydomonas reinhardtii grown at different phosphorus concentrations. (c) Cell growth of Chlamydomonas reinhardtii grown at different sulfur concentrations. (d) Cell growth of Chlorella vulgaris grown at different nitrogen concentrations. (e) Cell growth of Chlorella vulgaris grown at different phosphorus concentrations. (f) Cell growth of Chlorella vulgaris grown at different sulfur concentrations. All points were sampled by triplicate. The samples were taken every day.
Marinedrugs 21 00450 g001
Figure 2. Carbohydrates content (mg g−1) of Chlamydomonas reinhardtii and Chlorella vulgaris grown at different nitrogen, phosphorus, and sulfur concentrations. (a) Carbohydrates content of Chlamydomonas reinhardtii grown at different nitrogen concentrations. (b) Carbohydrates content of Chlamydomonas reinhardtii grown at different phosphorus concentrations. (c) Carbohydrates content of Chlamydomonas reinhardtii grown at different sulfur concentrations. (d) Carbohydrates content of Chlorella vulgaris grown at different nitrogen concentrations. (e) Carbohydrates content of Chlorella vulgaris grown at different phosphorus concentrations. (f) Carbohydrates content of Chlorella vulgaris grown at different sulfur concentrations. The results of the ANOVA–Tukey pairwise analysis carried out for each microalga in all the variations in macroelements also could be observed by different groups expressed by letters (symbol * = express the treatment where a higher production was obtained throughout the experiment). All points were sampled by triplicate. The samples were taken every five days.
Marinedrugs 21 00450 g002
Figure 3. Protein content (mg g−1) of Chlamydomonas reinhardtii and Chlorella vulgaris grown at different nitrogen, phosphorus, and sulfur concentrations. (a) Protein content of Chlamydomonas reinhardtii grown at different nitrogen concentrations. (b) Protein content of Chlamydomonas reinhardtii grown at different phosphorus concentrations. (c) Protein content of Chlamydomonas reinhardtii grown at different sulfur concentrations. (d) Protein content of Chlorella vulgaris grown at different nitrogen concentrations. (e) Protein content of Chlorella vulgaris grown at different phosphorus concentrations. (f) Protein content of Chlorella vulgaris grown at different sulfur concentrations. The results of the ANOVA–Tukey pairwise analysis carried out for each microalga in all the variations in macroelements also could be observed by different groups expressed by letters (symbol * = express the treatment where a higher production was obtained throughout the experiment). All points were sampled by triplicate. The samples were taken every five days.
Marinedrugs 21 00450 g003
Figure 4. Lipid content (mg g−1) of Chlamydomonas reinhardtii and Chlorella vulgaris grown at different nitrogen, phosphorus, and sulfur concentrations. (a) Lipid content of Chlamydomonas reinhardtii grown at different nitrogen concentrations. (b) Lipid content of Chlamydomonas reinhardtii grown at different phosphorus concentrations. (c) Lipid content of Chlamydomonas reinhardtii grown at different sulfur concentrations. (d) Lipid content of Chlorella vulgaris grown at different nitrogen concentrations. (e) Lipid content of Chlorella vulgaris grown at different phosphorus concentrations. (f) Lipid content of Chlorella vulgaris grown at different sulfur concentrations. The results of the ANOVA–Tukey pairwise analysis carried out for each microalga in all the variations in macroelements also could be observed by different groups expressed by letters (symbol * = express the treatment where a higher production was obtained throughout the experiment). All points were sampled by triplicate. The samples were taken every five days.
Marinedrugs 21 00450 g004
Figure 5. Heatmap of FAMEs (mg g−1) in Chlamydomonas reinhardtii and Chlorella vulgaris grown at different nitrogen, phosphorus, and sulfur concentrations. (a) FAMEs production of Chlamydomonas reinhardtii grown at different nitrogen concentrations. (b) FAMEs production of Chlamydomonas reinhardtii grown at different phosphorus concentrations. (c) FAMEs production of Chlamydomonas reinhardtii grown at different sulfur concentrations. (d) FAMEs production of Chlorella vulgaris grown at different nitrogen concentrations. (e) FAMEs production of Chlorella vulgaris grown at different phosphorus concentrations. (f) FAMEs production of Chlorella vulgaris grown at different sulfur concentrations. All points were sampled by triplicate. The samples were taken at 15th culture day.
Marinedrugs 21 00450 g005
Table 1. Experimental design to evaluate the effect of the nutrient concentration (nitrogen, phosphorus, and sulfur) on growth behavior and biomass composition in Chlamydomonas reinhardtii and Chlorella vulgaris culture.
RunEstRunBlocksConcentrationNutrient
1112LowS
1722HighS
1832HighP
1242LowP
1552MedP
1662HighN
1372MedN
1082LowN
1492MedS
24103MedP
20113LowS
19123LowN
22133MedN
25143HighN
26153HighS
23163MedS
21173LowP
27183HighP
8191HighS
6201MedP
3211LowP
4221MedN
1231LowN
5241MedS
7251HighN
2261LowS
9271HighP
Nutrients: Nitrogen (Low [N]: 80 mg L−1 N; Med [Control]: 240 mg L−1 N; High [N+]: 640 mg L−1 N). Phosphorus (Low [P]: 4 mg L−1 P; Med [Control]: 7 mg L−1 P; High [P+]: 17 mg L−1 P). Sulfur (Low [S]: 8 mg L−1 S; Med [Control]: 20mg L−1 S; High [S+]: 52 mg L−1 S). Factorial design has been carried out for each type of microalgae strain (Chlamydomonas reinhardtii and Chlorella vulgaris).
Disclaimer/Publisher’s Note: The statements, opinions and data contained in all publications are solely those of the individual author(s) and contributor(s) and not of MDPI and/or the editor(s). MDPI and/or the editor(s) disclaim responsibility for any injury to people or property resulting from any ideas, methods, instructions or products referred to in the content.

