Factors Affecting the Behavioral Intention to Adopt Mobile Payment: An Empirical Study in Taiwan

Department of Banking & Finance, Chinese Culture University, Taipei 11114, Taiwan
*
Author to whom correspondence should be addressed.
Mathematics 2020, 8(10), 1851; https://doi.org/10.3390/math8101851
Submission received: 7 September 2020
/
Revised: 5 October 2020
/
Accepted: 13 October 2020
/
Published: 20 October 2020
(This article belongs to the Special Issue Mathematical Analysis in Economics and Management)
Abstract
:The convenience feature of mobile payment has replaced interactions with physical money and reduced transaction time, which better meets the demand of modern people for convenience in life. As mobile payments play an important role in mobile business, understanding the factors attracting consumers to mobile payment will bring mobile businesses more opportunities for development, and further significantly improve the output value of mobile businesses. This study discusses how to further influence consumer behavioral intention in Taiwan, as based on the main theoretical framework of the Extend Unified Theory of Acceptance and Use of Technology (UTAUT2) and Diffusion of Innovation (DOI). In this study, data analysis is implemented by Partial Least Squares (PLS) for the purpose of verifying the research model and hypotheses. The research results show that social influence, facilitating conditions, hedonic motivation, compatibility, innovation, relative advantage, and observability have positive influence on consumer intention to use mobile payment.
1. Introduction
As a part of the service sector, Fintech aims to improve the efficiency of financial systems by leveraging the operational centers of information technology. Fintech combines finance and technology, and is collectively referred to as an industry reform formed by the integration of financial services and information technology. It is an innovative service and provides differentiated financial services by leveraging new technologies, such as social media and the Internet of Things (IoT) [1]. The mobile payment market, meaning simple payment services, has experienced the fastest growth among the services of Fintech. Based on mobile finance, such services are spreading at an extremely fast pace, as they allow users to effortlessly address the security issue by entering a password and there is no need to install Active-X. In recent years, with the rapid development of information and communication technologies, the integration of financial information systems with emerging information technologies has driven changes in business operations. In modern society with its rapid technology changes, the number of mobile phones is surging, and the mobile phone industry is experiencing significant growth. With such development, mobile services are gradually becoming a part of our daily life [2]. Advances in technology have enabled extensive new functions for mobile devices, including the provision of various financial services, such as bill payments, account transfer, proximity payments, and remote payments, as well as other types of services, such as mobile positioning service, mobile marketing, ticketing, discounts, and coupons. The mobile payment system could change the existing consumption process of consumers and create new transaction models.
Mobile payment refers to a kind of transaction conducted by connecting to a server via mobile device, and executing authentication, authorization, subsequent payment, and ultimate confirmation of completion. Au and Kauffman [3] believed that mobile payment is a kind of payment behavior for initiating, authorizing, and confirming a business transaction via mobile device. Mobile payment is key to the development of mobile data services, as it has not only innovated the payment method, it could also facilitate the collection of mobile data, which would allow enterprises to analyze the consumption habits of consumers [4,5,6]. Extensive adoption of mobile payment by consumers and businesses is mainly motivated by its convenience and ease of use [7]. The most significant advantage of using mobile payment lies in that it is free from the limitations of time, place, and transaction condition, which further creates added value for consumers and businesses [8,9]. Despite the advantages brought by mobile payments, including convenience, fastness, ease of use, and freedom from space limitations, it may bring risks as well, such as personal data leaks, and stolen ID card numbers and cellphone numbers by hackers.
Yeow et al. [10] investigate the factors affecting consumers’ intention, especially among millennials, to use mobile payment services in Malaysia. The findings show a significant impact in affecting the consumers’ intention to use mobile payment services with perceived usefulness proved to be the strongest determinant. Francisco et al. [11] find that perceived usefulness, perceived satisfaction, perceived risk and perceived trust influence the intention to use mobile payment services in India. However, not all countries have a high adopt rate of mobile payment, and some countries still have a lot of room for growth. Russia has become one of the largest markets for contactless transactions via smartphone wallets; however, the share of smartphone payments is still much lower than that of plastic cards [12]. The Polish payment card market is important given the current position of Poland as the largest Central European country. However, in Poland, despite the development of innovative forms of payment, traditional forms, especially cash, still have a strong position [13].
Hirschman [14] and Soman [15] suggested that unlike cash or credit card payment, mobile payment does not trigger negative emotions in consumers when they overspend. Hence, mobile payment could reduce the pain of customers for payment [16]. When using mobile payment, consumers are likely to be concerned about the benefits brought by the product purchased rather than the purchase cost [17]. When mobile payments are extensively used, consumers no longer pay with physical currency [9,18,19]. Businesses and consumers experience significantly reduced transaction time and remarkably improved transaction efficiency attributable to convenience, and information security due to the fast settlement and transfer provided by mobile payment [20,21].
While the convenience of mobile payment is very attractive [22], its actual utilization is far below what is expected, meaning consumer use of mobile payment in Taiwan falls below the expected level, which is mainly attributed to a lack of personal value and trust with a new product; thus, its acceptance is also a major key [23]. The main research question of this study is to find out the factors that affect consumers’ adoption of mobile payment, and to verify which factors affect consumers’ behavioral intentions. In the past, there has been little research that combines UTAUT2 and DOI factors to discuss the use of mobile payment in Taiwan. Therefore, the contribution of this study is based on the UTAUT2 as proposed by Venkatesh et al. [24], and the DOI theory as proposed by Rogers [25], which are applied to discuss consumers’ behavioral intention to use mobile payment, and understand the key factors in the use of mobile payment.
2. Literature Review
2.1. Mobile Payment
The rapid growth of mobile devices is mainly reflected in the popularization of diversified mobile devices and the launch of the 4G network bandwidth by telecommunication operators. All payment behaviors via mobile networks, whether voice, message, or Near Field Communication (NFC), are called mobile payments. Mobile payments have turned mobile devices into digital wallets to replace other payment instruments, including cash, credit card, and bank accounts, and thus have started the digital wallet revolution. According to several studies, the two key factors in the definition of mobile payment are the mobile devices used for payment and the payment function, and the transfer of currency [3,26,27,28]. The most significant differences lie in the execution of mobile payment by leveraging wireless or other communication technologies, and the stages in the payment process: Initiation, authorization, and confirmation.
Mobile payment is an alternative payment method for goods, services, bills, and invoices. Mobile payment is defined as a payment model executing payment by electronic means [29]. Mobile payment is used globally, allowing consumers to conduct online transactions anytime and anywhere [30], which further increases interactions in domestic and international trade [31,32]. With the rapid development of technology, the popularity of mobile payment is mainly attributable to its flexibility and convenience [33]. Mobile payment is a special form of electronic payment, and enables mobile users to make payments by connecting their mobile devices using the Internet and leveraging communication technology [26]. Mobile payments improve the convenience of online transactions; according to prior studies, the time required for consumption and the independence of consumption places are key factors influencing the use of mobile technology and service [34,35,36,37]; thus, users will become more willing to use mobile payment due to its greater usefulness [38,39,40]. Ghezzi et al. [41] believed that mobile payment refers to a transaction being executed via a mobile device (such as a mobile phone, smartphone, PDA, or any device supported by a wireless network) in at least one stage, and where the financial transaction can be safely executed via a mobile network or various wireless technologies (such as NFC, Bluetooth, and RFID). In view of the above, all definitions of mobile payments relate to the transfer of monetary value.
2.2. Extend Unified Theory of Acceptance and Use of Technology
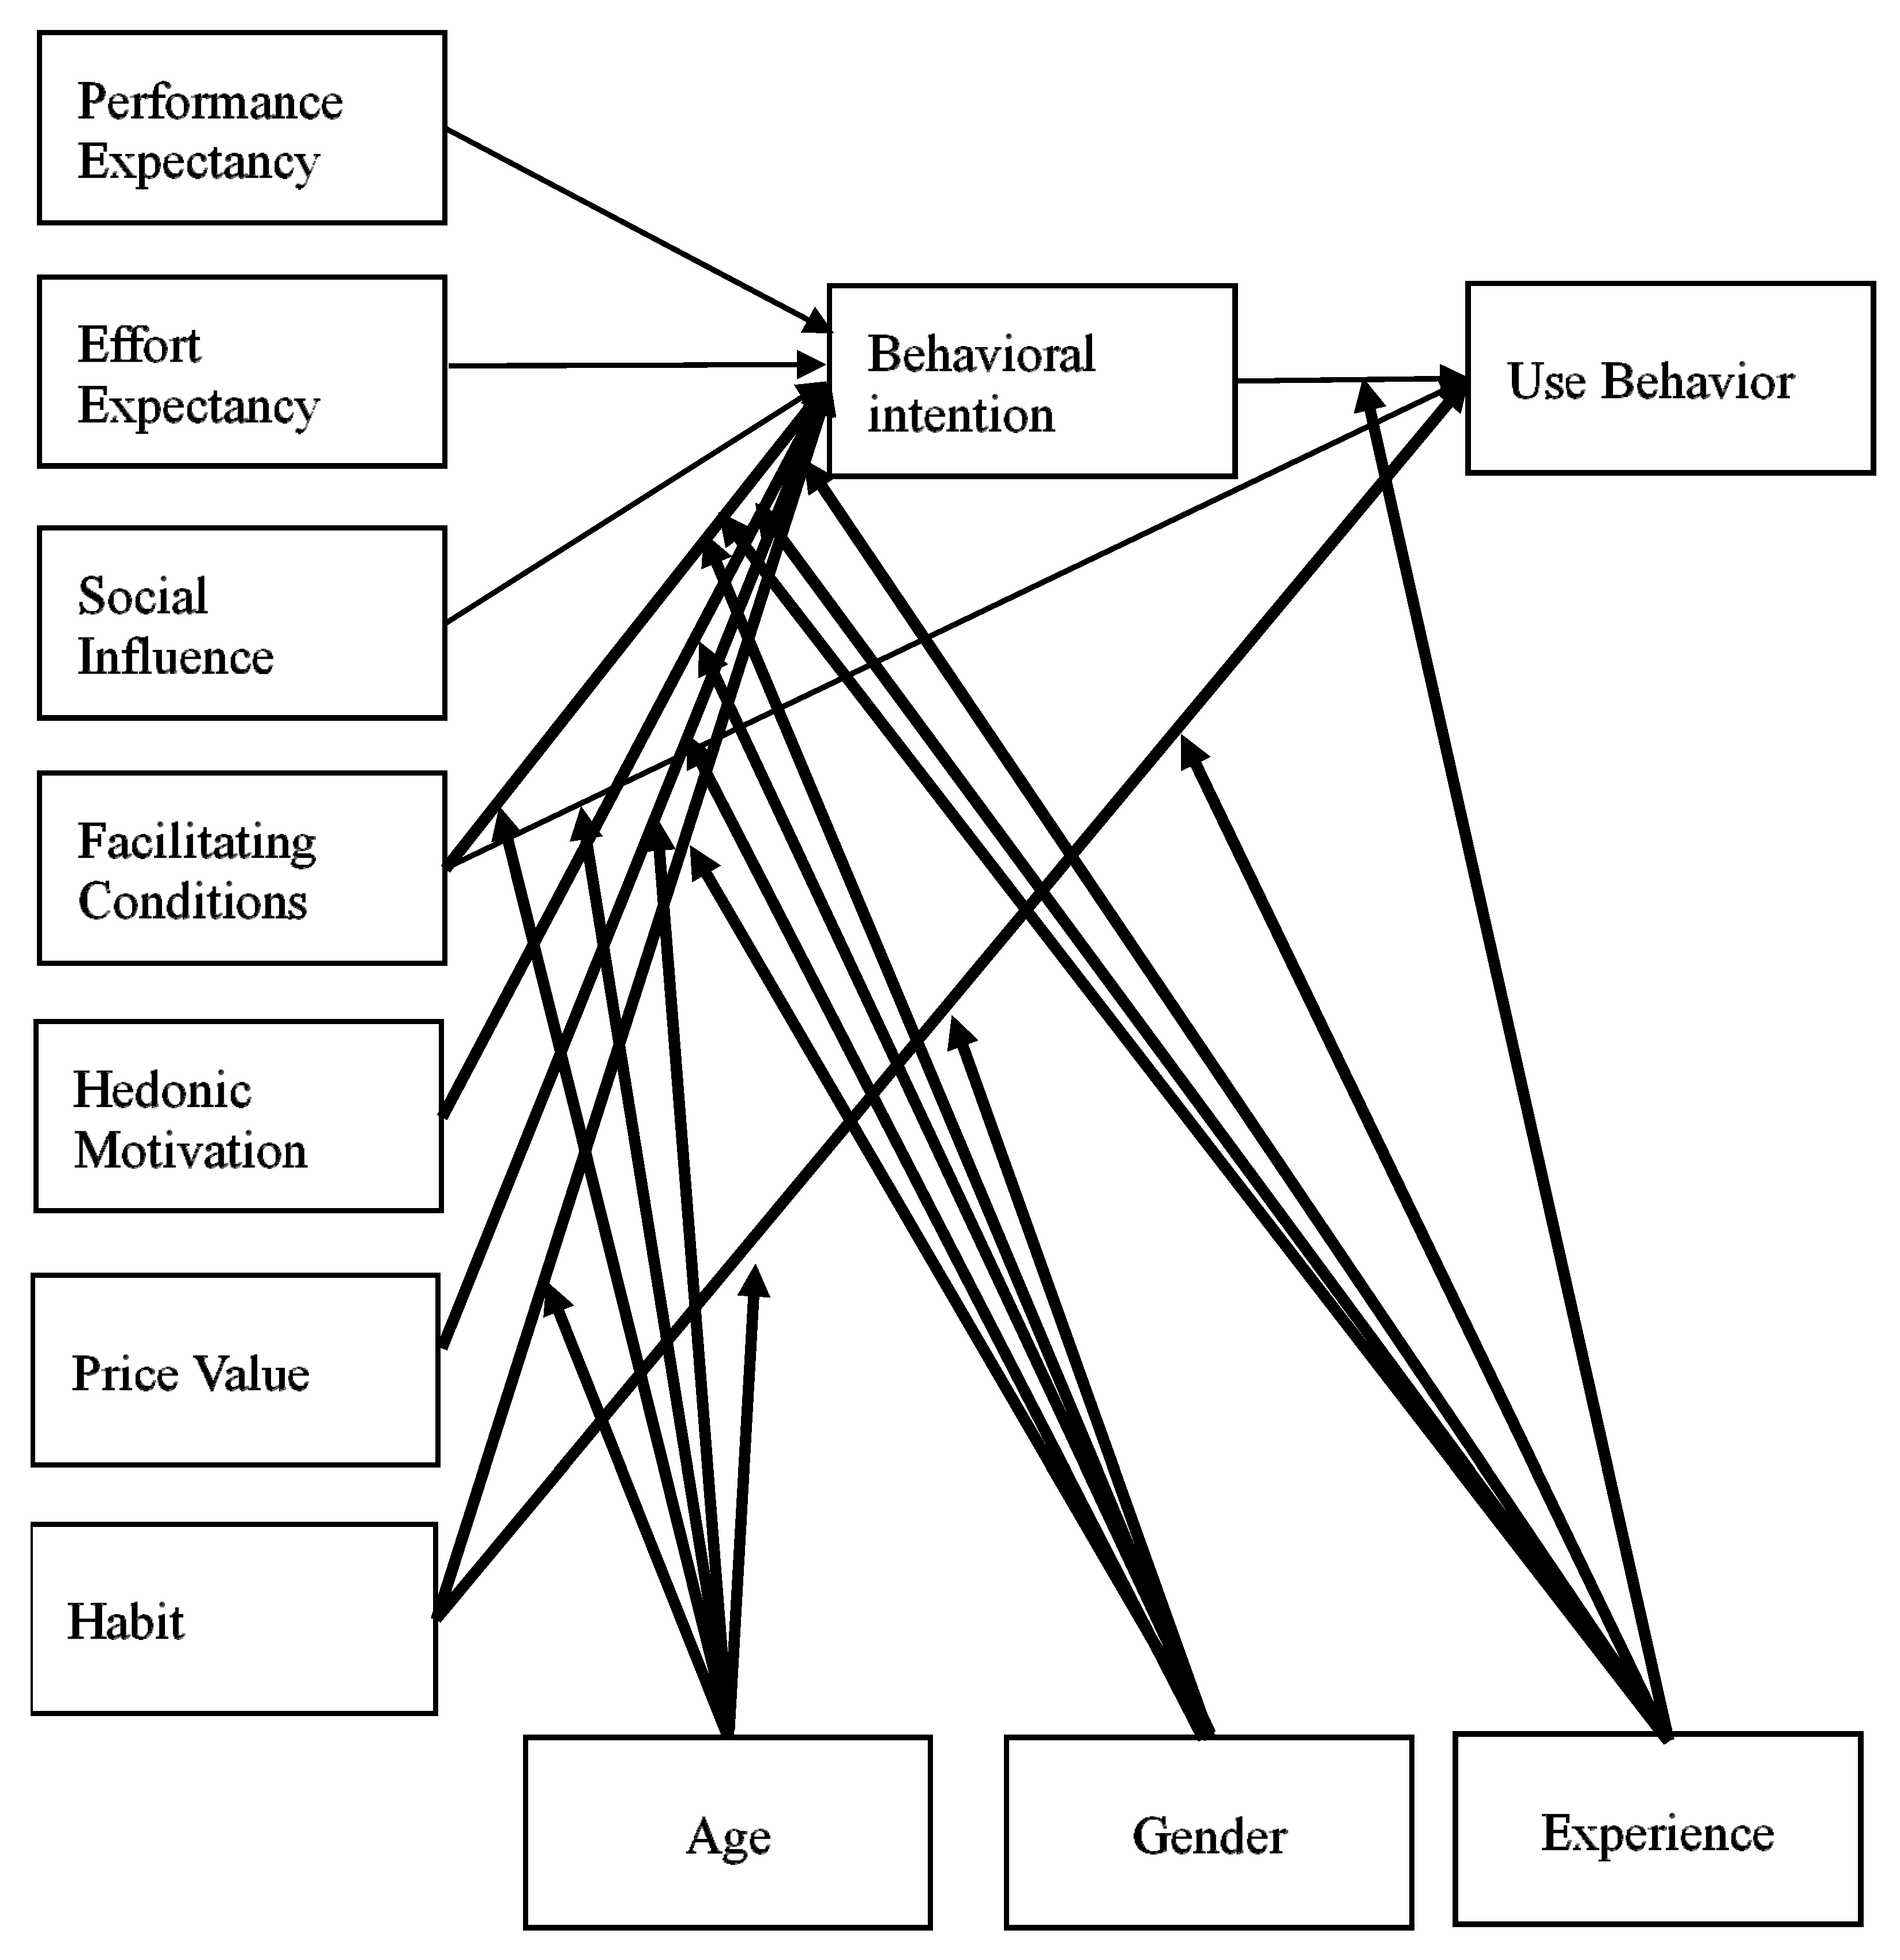
Venkatesh et al. [42] developed the Unified Theory of Acceptance and Use of Technology (UTAUT) by integrating eight technology acceptance and use models, namely, the Theory of Reasoned Action proposed by Fishbein and Ajzen [43], the Theory of Planned Behavior proposed by Ajzen [44], the Technology Acceptance Model proposed by Davis et al. [45] and Venkatesh and Davis [46], the Combined TAM and TPB proposed by Taylor and Todd [47], the Model of PC Utilization proposed by Thompson et al. [48], the Diffusion of Innovation theory proposed by Rogers [49], the Motivational Model proposed by Davis et al. [50], and the Social Cognitive Theory proposed by Bandura [51]. Venkatesh et al. [42] summarized four perspectives through empirical analysis, namely, performance expectancy, effort expectancy, social influence, and facilitating conditions, and four disturbance variables, namely, gender, age, experience, and voluntariness.
Based on UTAUT, Venkatesh et al. [24] developed the UTAUT2 theoretical framework, and incorporated three perspectives, hedonic motivation, price value, and habit, for the purpose of explaining the usage behaviors of the general consumers of technological products. In addition, the disturbance variable of voluntariness was removed to allow UTAUT2 to provide more accurate explanations. The UTAUT2 framework is shown in Figure 1.
Performance expectancy is defined as the degree to which an individual believes that using a technology will help him/her obtain work performance, such as saving time and improving efficiency and convenience [42]. Performance expectancy is considered as a behavioral intention to use and apply an information system or technology, as well as one of the most influential drivers [52,53,54,55,56]. When customers believe that such technology will be more useful in daily life, they seem to be more motivated to use and accept such new technology [42,45,57].
Effort expectancy is defined as the degree of ease associated with the use of a system [42]. Davis et al. [45] believed that an individual’s intention to accept a new system depends on the positive value of the system, as well as the ease and effortlessness of using the system. In studies of the acceptance of mobile network services, effort expectancy is proven to have material influence on behavioral intention [58].
Venkatesh et al. [42] defined social influence as the degree to which an individual perceives that important others believe he or she should use the new system. Social influence can be defined as the influence of the surrounding social environment on a customer’s intention to use a related system, such as family, leaders, friends, and colleagues [59]. Facilitating conditions are defined as the degree to which an individual believes that an organizational and technical infrastructure exists to support use of the system [42]. In other words, it represents the consumer’s viewpoints of the resources and behavior to support use [60].
Venkatesh et al. [24] presented an analysis of the research of customer behavior and the technology acceptance process in greater detail; for example, hedonic motivation is seen as fun, enjoyment, or happiness, resulting from using a technology, and plays a significant part in determining new technology acceptance [60,61]. Price value is defined as consumers’ cognitive trade-off between the perceived benefits of the applications and the monetary cost of using it [24]. Financial cost plays a crucial role in shaping customers’ willingness to use and acceptance of new technology [62].
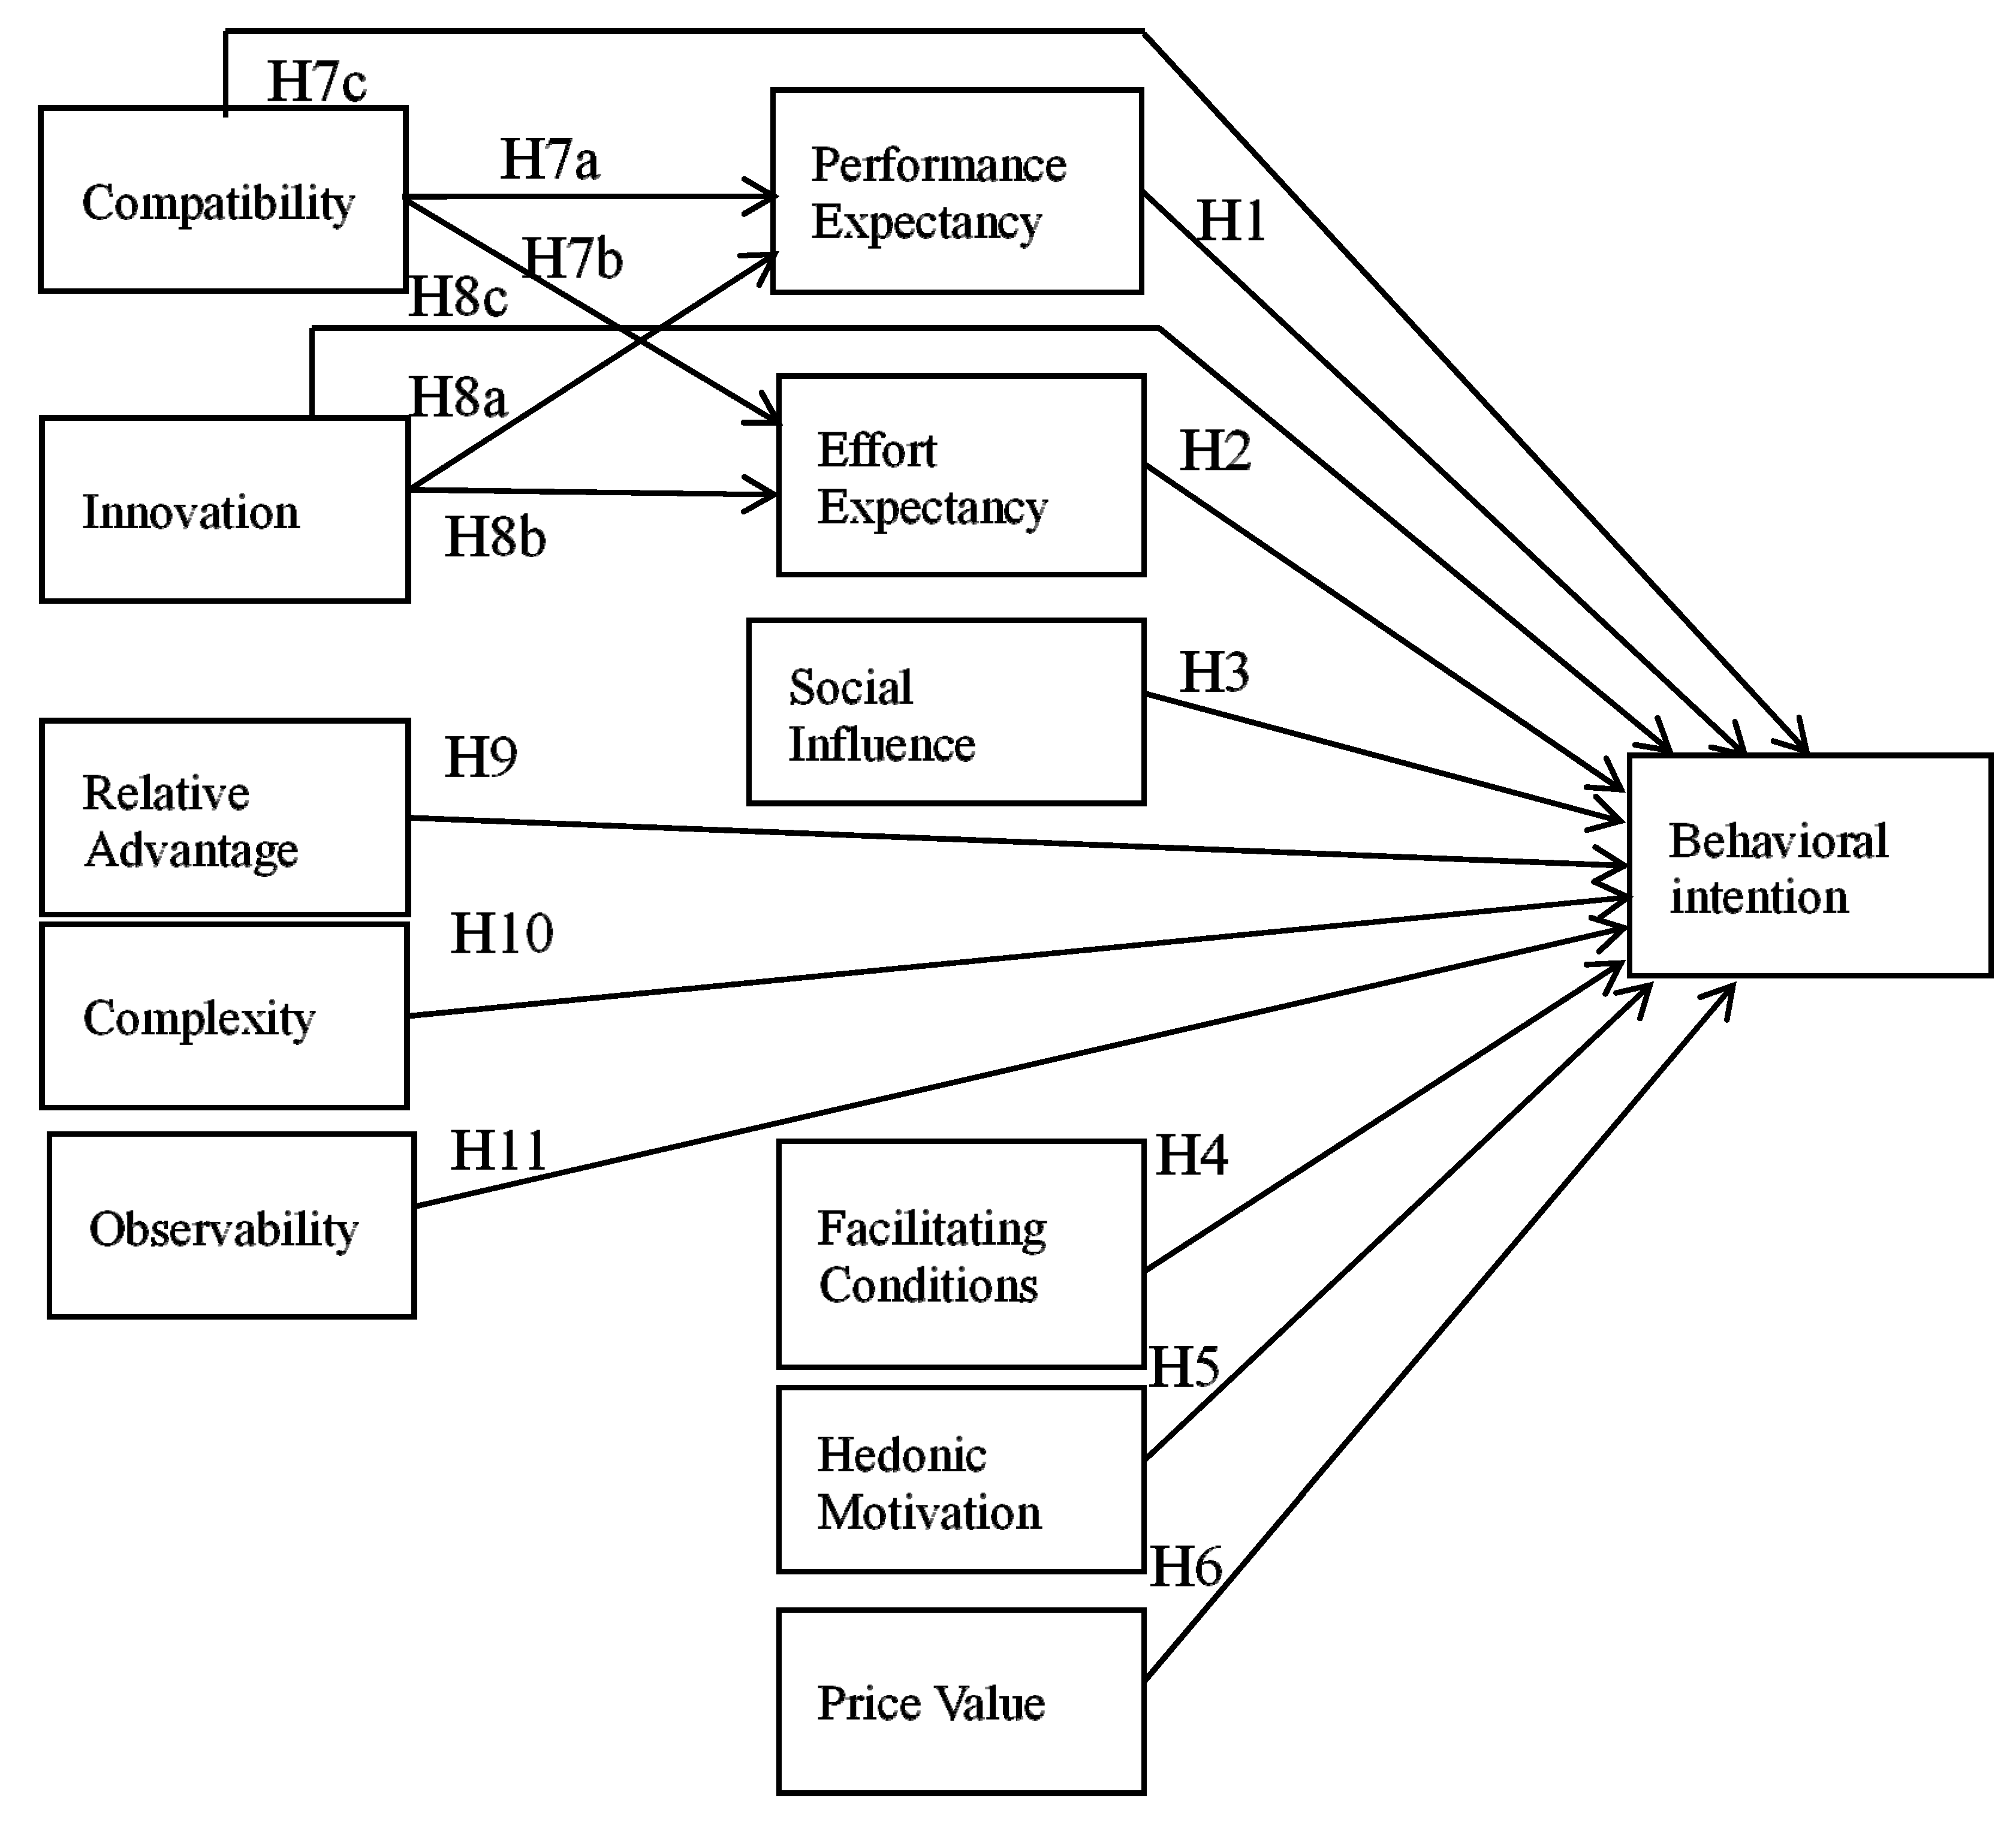
As mobile payment is a relatively new technology, and has not been extensively used by consumers in Taiwan to form a habit, habit was excluded from the research model of this study [63]. In view of the above literature review, Hypotheses H1 to H6 are proposed in this study.
Hypothesis 1 (H1).
Performance expectancy has significant positive influence on behavioral intention to use mobile payment.
Hypothesis 2 (H2).
Effort expectancy has significant positive influence on behavioral intention to use mobile payment.
Hypothesis 3 (H3).
Social influence has significant positive influence on behavioral intention to use mobile payment.
Hypothesis 4 (H4).
Facilitating conditions have significant positive influence on behavioral intention to use mobile payment.
Hypothesis 5 (H5).
Hedonic motivation has significant positive influence on behavioral intention to use mobile payment.
Hypothesis 6 (H6).
Price value has significant positive influence on behavioral intention to use mobile payment.
2.3. Diffusion of Innovation
Diffusion of innovation was proposed by Rogers in 1983. Rogers [25] stated that innovation is an idea or specific object perceived as new by an individual or other unit of adoption, and diffusion is formed by expanding and communicating an innovation through individuals or certain other channels among the members of an organization or group to further influence the willingness of individuals or a group to use the innovation. Thereafter, this theory has often been used for predicting and explaining the behavior of adoption and diffusion of a new technology [64]. Rogers and Shoemaker [65] believed that an innovation is an idea, practice, or object that is perceived to be new by an individual or other unit of adoption. Innovation may be an idea, technology, or knowledge, and has been proven to be an important tool for directly predicting behavioral intention to adopt a new technology. The research results of Zhao and de Pablos [66] on the diffusion of innovation show that innovation is considered as being in line with the existing personal values, demands, and past experiences of potential users; innovation is a crucial factor; thus, individual innovation ability is an important variable for determining the application of a technology [67]. Oliveira et al. [63] believed that a user is more likely to perceive the compatibility of technology, and recognize the benefits of the technology, if he/she has a higher acceptance of innovation.
Rogers [68] defined compatibility as the degree to which an innovation is in line with the existing personal values and experience of a potential user; when an innovation provides a product or service, the potential user may accept the product or service if the user can effortlessly learn or change existing use behavior. In using a mobile payment system, users only need to understand operating process and application blocks, while the payment methods used by users remain unchanged. Relative advantage is defined as the degree to which an innovation is believed to be better than existing products, meaning a potential user could obtain economic and social advantages if the innovation is undoubtedly favorable [68]. Potential users will realize that a new product or service is more favorable and useful than existing similar products or services, and they will expect themselves to accept the product or service provided by the innovation. Furthermore, relative advantage also refers to the degree to which an innovation provides more benefits, and improves efficiency, economic benefits, and status [25]. Complexity is defined as the degree to which an innovation is believed to be difficult to understand and use, and when an innovation is too complicated, potential users need more related knowledge and instructions to operate or understand the product or service. Observability is defined as the degree to which the results of an innovation can be observed by others [68]. Chakravarty and Dubinsky [69] believed that an innovation that is hard to observe is subject to potential diffusion and adoption issues; therefore, an innovation should attract the attention of target users for the purpose of allowing them to understand the service. In view of the above literature review, Hypotheses H7a to H11 are proposed.
Hypothesis 7a (H7a).
Compatibility has significant influence on behavioral intention to use mobile payment via the intervening variable of performance expectancy.
Hypothesis 7b (H7b).
Compatibility has significant influence on behavioral intention to use mobile payment via the intervening variable of effort expectancy.
Hypothesis 7c (H7c).
Compatibility has significant positive influence on behavioral intention to use mobile payment.
Hypothesis 8a (H8a).
Innovation has significant influence on behavioral intention to use mobile payment via the intervening variable of performance expectancy.
Hypothesis 8b (H8b).
Innovation has significant influence on behavioral intention to use mobile payment via the intervening variable of effort expectancy.
Hypothesis 8c (H8c).
Innovation has significant positive influence on behavioral intention to use mobile payment.
Hypothesis 9 (H9).
Relative advantage has significant positive influence on behavioral intention to use mobile payment.
Hypothesis 10 (H10).
Complexity has significant positive influence on behavioral intention to use mobile payment.
Hypothesis 11 (H11).
Observability has significant positive influence on behavioral intention to use mobile payment.
Shen et al. [70] argued that consumer acceptance of a new technology is a complicated phenomenon, and should be explained by applying more than one model. Jackson et al. [71] suggested that a special viewpoint cannot be obtained by just using a theory-driven model; instead, the mechanism behind the casual relationship can be described in greater detail from a comprehensive perspective. The research model proposed in this study integrates the innovation features of UTAUT2 and DOI in an effort to understand the degree of influence of the variables in UTAUT2 and DOI on behavioral intention. The research model proposed in this study is shown in Figure 2.
3. Research Design and Method
In this study, for the purpose of observing the structure and distribution of samples, a preliminary analysis of the basic information of samples was made using SPSS Statistics software; then, reliability and validity analyses were conducted, and empirical research results were obtained by applying Smart PLS 3.0 software. This study conducted an online questionnaire survey, and samples were taken by snowball sampling. Respondents enrolled to complete the questionnaires included people who had used and had never used mobile payment.
The questionnaire is distributed from July 2018 to October 2018 in Taiwan. Then, a total of 350 questionnaires were recovered, including eight invalid questionnaires and 342 valid questionnaires. The questionnaire used in this study consists of two parts. Part 1 contains the basic information of respondents. Part 2 presents the questions relating to the influence factors and factor designs, as based on prior literature (Appendix A). The scale used for the questionnaire is a five-point Likert scale, ranging from 1 (strongly disagree) to 5 (strongly agree).
3.1. Partial Least Squares (PLS)
Partial Least Squares (PLS), as proposed by Wold [72], has experienced rapid development in theory, method, and application over recent years. PLS is a computing method for Structural Equation Modeling (SEM). SEM can be classified into two types. First, covariance-based SEM; as the covariance structure of variables is observed through operational analysis and the covariance relationship between variables. Second, variance-based SEM, which is also known as PLS. For the purpose of variance-based SEM, the prediction and explanation relationship between the main components is explained and verified by regression theory after the main component structure is defined by observing the linear combination of variables.
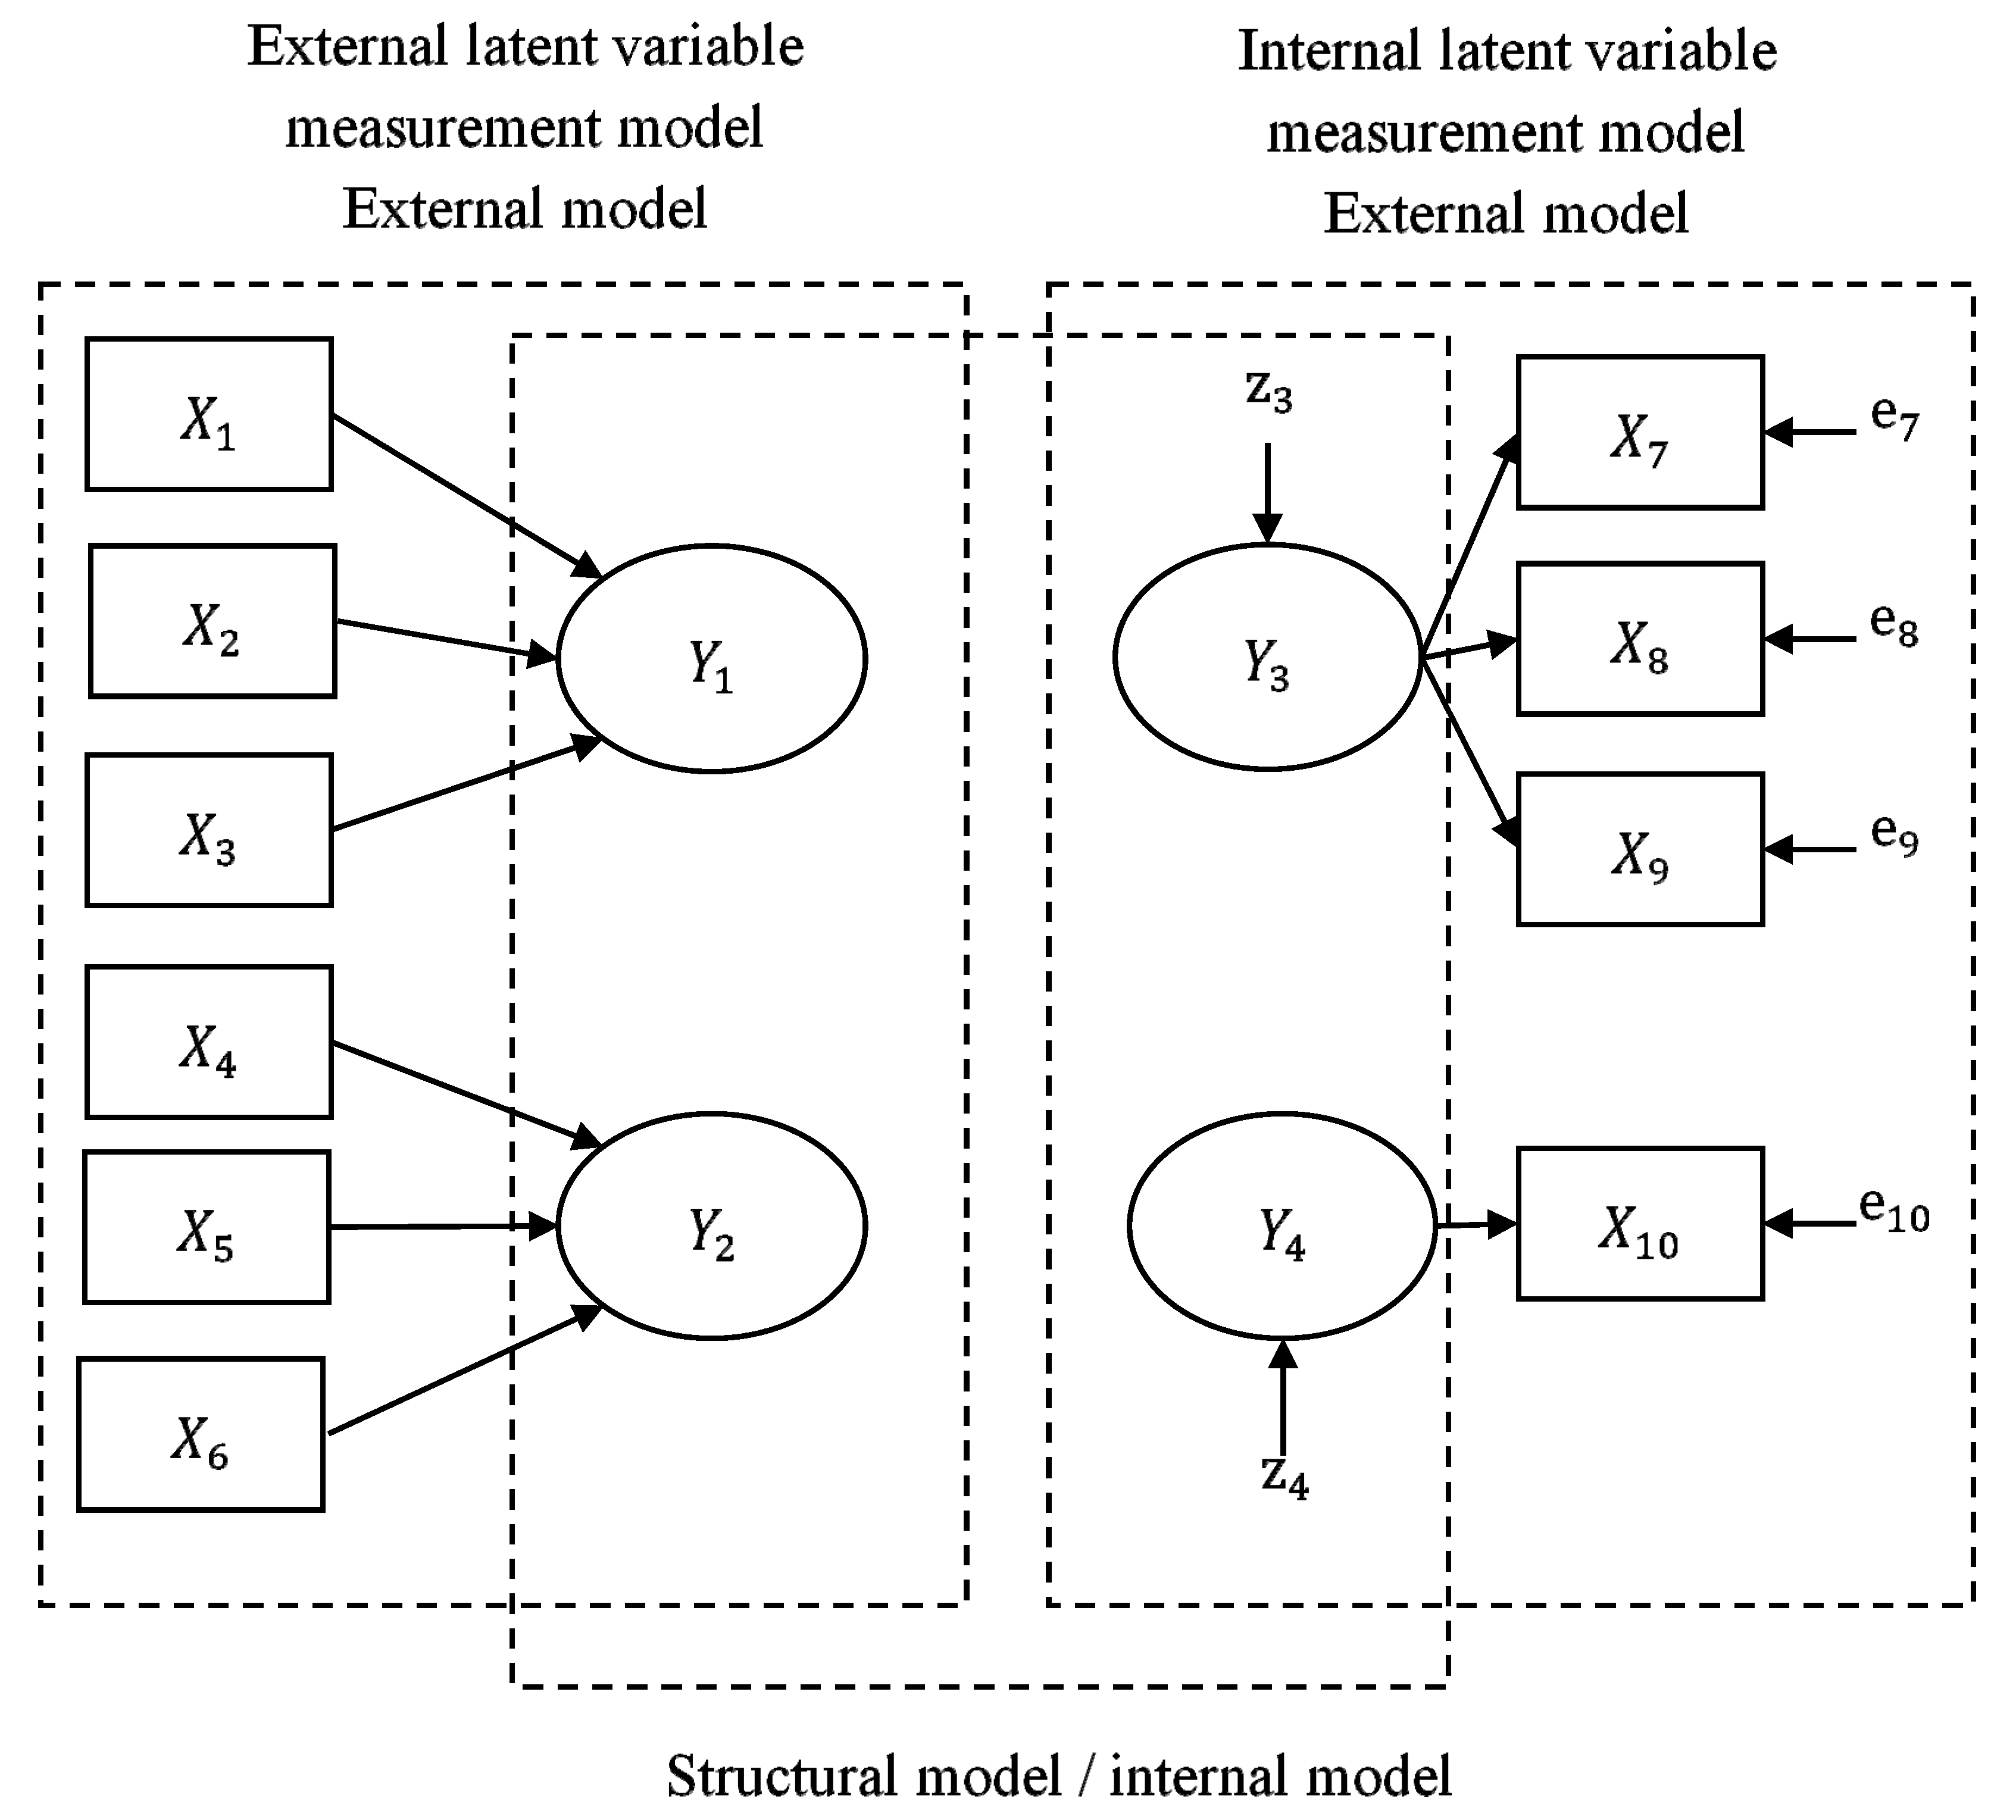
Much literature has shown that PLS-SEM is evolving into a statistical modeling technique [73,74,75,76,77,78]. In SEM analysis, the graph of the relationship between research hypotheses and variables is obtained through path models [77,79]. Figure 3 shows a schematic diagram of path models.
In path models, the constructs are the variables that cannot be directly predicted, and the circles represent Y1~Y4. Indicators, also known as manifest variables, are proxy variables that are obtained by directly measuring the original data, and the rectangles represent X1~X10. The relationship among the constructs and the relationship between the constructs and their indicators are represented by arrows. In PLS-SEM, the single-headed arrows represent a directional relationship, indicating that the predictive relationships among variables can be supported by sufficient theories and can be interpreted as causal relationships.
As a method to establish predictive regression models, the Partial Least Squares (PLS) can be applied to general multivariate regression and single variable regression. In addition, PLS can also be used for path analyses. PLS can be used to build new explanatory variables, known as latent variables, to establish regression models for identifying the relationship between the explanatory variable X and the response variable Y. Hence, PLS is a statistical method that is used to establish predictive models, with the purpose of finding a linear model with good predictability, namely, Ŷ = XBPLS.
Some advantages of the PLS are: The ability to address multiple dependent variables and independent variables and overcome multicollinearity issues; input response variables can present more accurate prediction of latent variables; it is applicable to a small sample size, and can address interference data and missing values in a stable manner; it can simultaneously address reflective indicators and formative indicators, and is free from the limitation of data distribution.
3.2. Bootstrapping
Bootstrapping, also known as the self-sampling method, is a computerized statistical analysis method proposed by Efron [80]. In the case of unknown data source distribution, bootstrapping can be used for estimations and statistical inferences. Bootstrapping is only applied to the sample data with an identical independent distribution (i.i.d), namely, to estimate the matrix distribution to overcome the shortcomings of a small size by re-sampling and to enlarge samples, and by simulation to estimate the confidence intervals. No preconceived assumption about the matrix is needed, and there is no complex derivation of statistical theory. By re-sampling and computer operation, fewer samples can be used to represent the distribution of the whole matrix, which is highly accurate in estimating the confidence intervals. While using the number of samples in the sampling and computer simulation cannot achieve the same effect as a large number of samplings, repeated simulations could close the gap as much as possible.
Bootstrapping is used to estimate the matrix, by the observed samples, and to make statistical inferences, by re-sampling the estimated matrix. The method is to take a sample from n samples and then put it back, and repeat this course for n samples, B times. The statistical values are then calculated, based on the new n samples, and ranked to obtain the bootstrapping distribution, so as to develop the required statistical verification or confidence intervals. There are two bootstrapping methods, the parametric bootstrap and the non-parametric bootstrap. If samples are from a known distribution, the distributed parameters are estimated, based on the samples, and then the estimated parameter distribution is used as the matrix for re-sampling, which is called the parametric bootstrap. If samples are from an unknown distribution, the empirical distribution function is used as the matrix for re-sampling, which is called the non-parametric bootstrap. Samples are taken from estimated parameters in the parametric bootstrap and directly taken from historical data in the non-parametric bootstrap, so the sampling error of the non-parametric bootstrap may be greater. The advantage of bootstrapping is that the matrix distribution under uncertain conditions is considered, so re-sampling can reduce the influence of input errors.
4. Empirical Analysis
4.1. Basic Information Analysis
A total of 342 valid questionnaires were recovered in this study. Verification was conducted on consumers who had used mobile payments and consumers who had never used mobile payments, separately. The descriptive statistics of samples are listed in Table 1.
4.2. Confirmatory Factor Analysis (CFA)
Reliability refers to the degree of error in a measured model, and represents that a model meets the requirements of stability and consistency. In this study, reliability of the model was tested by Cronbach’s alpha; as suggested by Hair et al. [81], Cronbach’s alpha should be at least 0.7. The perspective reliability analysis of all questionnaires, as completed by respondents who had used mobile payment and those completed by respondents who had never used mobile payment, are listed in Table 2.
Validity refers to the measurement of whether the model meets the questions proposed in a study. In this study, the validity of the model was tested with factor loading and Average Variance Extracted (AVE). Factor loading should be within 0.5 and 0.95; within this range, a higher value represents a better convergent validity. The factor loading of questions was conducted for all samples completed by all respondents, as listed in Table 3.
4.3. Verification of Hypotheses
Upon completion of the reliability and validity analysis in this study, 15 hypotheses were verified. Table 4 shows the research hypothesis verification results of this study. The results of the all sample show that all hypotheses, with the exception of H1, H2, and H10, are significant. The results of the samples who had used mobile payment show that all hypotheses, with the exception of H2, H3, H6, and H10, are significant. The results of the samples who had never used mobile payment show that all hypotheses, with the exception of H1, H2, H4, H6, H9, and H10, are significant.
From Table 4 it can be seen that, for consumers who have mobile payment experience, the willingness to continue using it in the future is obvious. Today’s mobile payment systems are very stable, and interface operations are not too difficult. In addition, consumers believe that using electronic payments can reduce transaction costs. Therefore, factors do not significantly affect consumers’ intentions such as effort expectations, social influence, price value, and complexity. On the other hand, consumers who have no mobile payment experience will not get any positive value because of no use experience. Therefore, factors do not significantly affect consumers’ intentions such as performance expectations, effort expectations, convenience conditions, price value, relative advantages and complexity.
5. Conclusions and Suggestions
As mentioned earlier, the actual adoption rate of mobile payment in Taiwan is below what was expected, meaning there is still a lot of room for growth in Taiwan. Most of the literature in the past discusses the behavioral intentions of consumers who have mobile payment experience. However, the research purpose of this paper is not only to understand the feedback of consumers with experience, but also to know the thoughts of inexperienced consumers and to get an improvement policy. Therefore, the samples were divided into three groups according to empirical analysis results, namely, the all-sample group, samples that had used mobile payment, and samples that had never used mobile payment, in order to summarize and explain the research findings, and to propose related suggestions for the purpose of providing a reference for the future promotion of mobile payment.
The research results of this paper can be seen from Table 4. In this study, the following research findings are summarized based on the all sample research results and according to the empirical results of the research hypotheses, in an effort to provide a reference for mobile payment service in practice.
- There is a significant positive influence relationship between “social onfluence”, “facilitating conditions”, “hedonic motivation”, “price value”, “compatibility”, “innovation”, “relative advantage”, and “observability” and “behavioral intention”, which illustrates that consumer intention to use mobile payment will be more positive with a higher degree of recognition by others, better resource adequacy, a higher degree of pleasure with technology, lower financial cost, greater ease of use of the operating process, more benefits brought by technology, and greater attraction to others’ attention.
- Upon incorporation of “performance expectancy” and “effort expectancy”, the positive influence of “compatibility” and “innovation” on consumer behavioral intention to use mobile payment will be more significant if consumers believe that using the technology will help save time, improve efficiency, increase convenience, and it will be effortless and non-time-consuming to operate the technology, which indicates that mobile payment is a kind of service involving various industry platforms and diversified systems. Therefore, consumer willingness to use will be increased when mobile payment provides more advantageous services.
- This study also shows that external environment is a key factor influencing consumer willingness to use, such as without support from financial institutions, no legal regulations, and noncooperation of retailers. Due to the slow development of mobile payment and undeveloped technology in Taiwan, many consumers still have security concerns about the use of mobile payment, and thus will not consider its use. Therefore, in order to provide adequate legal protection to consumers and owners during usage, the government must develop appropriate regulations to improve consumer satisfaction with and usage frequency of mobile payments as a whole; in addition, mobile payment can operate effectively only when consumers have all basic devices.
- Finally, as the number of consumers enrolled in this study who had actually used mobile payment was apparently inadequate, limited suggestions were reached. Furthermore, upon more stable development of the mobile payment market in the future, the factor of “habit” in UTAUT2 can be incorporated to enrich research connotations and enable more comprehensive discussions.
Author Contributions
Conceptualization, W.R.L.; methodology, C.-Y.L. and Y.-H.D.; writing—original draft, W.R.L. and Y.-H.D.; formal analysis, W.R.L.; investigation, Y.-H.D.; writing—review & editing, W.R.L. and C.-Y.L. All authors have read and agreed to the published version of the manuscript.
Funding
This research received no external funding.
Acknowledgments
The authors greatly appreciate the reviews’ suggestions, and the support of Ministry of Sciences and Technology of Taiwan.
Conflicts of Interest
The authors declare no conflict of interest.
Appendix A

Table A1.
Questionnaire.
| Constructs | Items |
|---|---|
| Performance expectancy | PE1: I think that using mobile payment allows me to complete financial transactions more quickly. PE2: I think that using mobile payment can save the payment time and allow me to focus on other things. PE3: I think that using mobile payment can increase the convenience of consumption. PE4: I think that using mobile payment can increase the efficiency of consumption. PE5: I think that using mobile payment would enable me to conduct tasks more quickly |
| Effort expectancy | EE1: I think that mobile payment is easy to use. EE2: I think that using mobile payment is clear and easy to understand. EE3: My interaction with mobile payment would be clear and understandable. EE4: I can easily use mobile payment to consume. |
| Social influence | SI1: I believe that using mobile payment can improve my social status. SI2: I think people who use mobile payment have higher reputation than those who do not use mobile payment. SI3: I think that people around me will encourage me to use mobile payment. SI4: When the mobile payment related industry supports and promotes mobile payment, I will try to use it. SI5: Friends’ suggestions and recommendations will affect my decision to use mobile payment. |
| Facilitating conditions | FC1: I have the resources that I need to use the mobile payment. (ex: mobile device, credit card, mobile payment app) FC2: Mobile payment is compatible with other systems that I have used. FC3: I think that mobile payment can be matched with other technologies I use. (ex: easy card) FC4: I have the necessary knowledge of mobile payment. FC5: When I encounter difficulties in using mobile payment, I can get help from my friends. |
| Hedonic motivation | HM1: I think that using mobile payment is fun. HM2: think that mobile payment is fast and worth to use. HM3: I think that using mobile payment is very entertaining. HM4: I think that using mobile payment is a special experience. HM5: I feel happy when I use mobile payment to consume. |
| Price value | PV1: Compared with the normal payment (cash, credit card), I think the price paid for using mobile payment is reasonable. PV2: Compared with the normal payment (cash, credit card), mobile payment has better value than money. PV3: Compared with the normal payment (cash, credit card), mobile payment provides a good economic value in terms of current market prices. PV4: To me, using mobile payment to pay for online shopping is worth more than it costs. (Ex: reward point) |
| Compatibility | C1: I think that using mobile payment is in line with my daily consumption patterns. C2- I think that using mobile payment is in line with my lifestyle. C3: I think that using mobile payment is in line with my workstyle.(ex: strive for efficiency) C4: Using mobile payment can be accepted by merchants as well as other payment methods. (Ex: pay cash, credit card) |
| Innovation | I1: Among people of the same age, I am usually the first to try new technology. I2- I am happy to try new technology. I3: Even if I don’t know if anyone else has had this experience before, I still use the mobile payment to consume. I4: I feel that I know more about mobile payment than my friends |
| Relative advantage | RA1: I think mobile payment is more convenient than general payment. (cash, credit card) RA2: I think that mobile payment is faster than general payment. (cash, credit card) RA3: I think that mobile payment is more advantageous than general payment. (cash, credit card) RA4: I think that mobile payment is more effective in managing payment accounts than general payment. (cash, credit card). RA5: I think that using mobile payment service can make shopping easier. |
| Complexity | CO1: I think it is easy to learn mobile payment. CO2: I can easily get the information I want from using mobile payment. CO3: I found that mobile payment is easy to use. CO4: I think the operational interface for mobile payment is clear and easy to understand. |
| Observability | O1: I am willing to share the experience of using mobile payment with others. O2: I am willing to share the advantages of mobile payment with others O3: I can observe the benefits and utility of using mobile payment. O4: In the environment which I live, mobile payment is often discussed. |
| Behavioral intention | BI1: I think I will use mobile payment to consume in the future. BI2: In my daily life, I will continue to use mobile payment. BI3: I am willing to bind my credit card or financial account to mobile payment. BI4: After most of my friends use mobile payment, I will consider to use it. BI5: I will use mobile payment more frequently in the future. |
References
- Kim, Y.; Park, Y.J.; Choi, J.; Yeon, J. The adoption of mobile payment services for “Fintech”. Int. J. Appl. Eng. Res. 2016, 11, 1058–1061. [Google Scholar]
- Hwang, R.-J.; Shiau, S.-H.; Jan, D.-F. A new mobile payment scheme for roaming services. Electron. Commer. Res. Appl. 2007, 6, 184–191. [Google Scholar] [CrossRef]
- Au, Y.A.; Kauffman, R.J. The economics of mobile payments: Understanding stakeholder issues for an emerging financial technology application. Electron. Commer. Res. Appl. 2008, 7, 141–164. [Google Scholar] [CrossRef]
- Barnes, S.J. The mobile commerce value chain: Analysis and future developments. Int. J. Inf. Manag. 2002, 22, 91–108. [Google Scholar] [CrossRef]
- Kristoffersen, S.; Synstad, A.; Sorli, K. Users’ perception of mobile payment. Int. J. Knowl. Manag. Stud. 2008, 2, 121. [Google Scholar] [CrossRef]
- Pousttchi, K. A modeling approach and reference models for the analysis of mobile payment use cases. Electron. Commer. Res. Appl. 2008, 7, 182–201. [Google Scholar] [CrossRef]
- Chang, Y.F.; Chen, C.; Zhou, H. Smart phone for mobile commerce. Comput. Stand. Interfaces 2009, 31, 740–747. [Google Scholar] [CrossRef]
- Gerpott, T.J.; Kornmeier, K. Determinants of customer acceptance of mobile payment systems. Int. J. Electron. Financ. 2009, 3, 1–30. [Google Scholar] [CrossRef] [Green Version]
- Mallat, N. Exploring consumer adoption of mobile payments—A qualitative study. J. Strat. Inf. Syst. 2007, 16, 413–432. [Google Scholar] [CrossRef]
- Yeow, P.M.; Haliyana, K.; Devika, N. Millennials’ Perception on Mobile Payment Services in Malaysia. Procedia Comput. Sci. 2017, 124, 397–404. [Google Scholar]
- Liébana-Cabanillas, F.; Japutra, A.; Molinillo, S.; Singh, N.; Sinha, N. Assessment of mobile technology use in the emerging market: Analyzing intention to use m-payment services in India. Telecommun. Policy 2020, 44, 102009. [Google Scholar] [CrossRef]
- Semerikova, E. What hinders the usage of smartphone payments in Russia? Perception of technological and security barriers. Technol. Forecast. Soc. Chang. 2020, 161, 120312. [Google Scholar] [CrossRef]
- Świecka, B.; Terefenko, P.; Paprotny, D. Transaction factors’ influence on the choice of payment by Polish consumers. J. Retail. Consum. Serv. 2020, 58, 102264. [Google Scholar] [CrossRef]
- Hirschman, E.C. Differences in Consumer Purchase Behavior by Credit Card Payment System. J. Consum. Res. 1979, 6, 58–66. [Google Scholar] [CrossRef]
- Soman, D. The Effect of Payment Transparency on Consumption: Quasi-Experiments from the Field. Mark. Lett. 2003, 14, 173–183. [Google Scholar] [CrossRef]
- Raghubir, P.; Srivastava, J. Monopoly money: The effect of payment coupling and form on spending behavior. J. Exp. Psychol. Appl. 2008, 14, 213–225. [Google Scholar] [CrossRef]
- Chatterjee, P.; Rose, R.L. Do Payment Mechanisms Change the Way Consumers Perceive Products? J. Consum. Res. 2012, 38, 1129–1139. [Google Scholar] [CrossRef]
- O’Reilly, P.; Duane, A.; Andreev, P. To M-Pay or not to M-Pay—Realising the potential of smart phones: Conceptual modeling and empirical validation. Electron. Mark. 2012, 22, 229–241. [Google Scholar] [CrossRef]
- Pham, T.-T.T.; Ho, J.C. The effects of product-related, personal-related factors and attractiveness of alternatives on consumer adoption of NFC-based mobile payments. Technol. Soc. 2015, 43, 159–172. [Google Scholar] [CrossRef]
- Leong, L.-Y.; Hew, J.-J.; Tan, G.W.-H.; Ooi, K.-B. Predicting the determinants of the NFC-enabled mobile credit card acceptance: A neural networks approach. Expert Syst. Appl. 2013, 40, 5604–5620. [Google Scholar] [CrossRef]
- Teo, A.-C.; Tan, G.W.-H.; Ooi, K.-B.; Hew, J.-J.; Yew, K.-T. The effects of convenience and speed in m-payment. Ind. Manag. Data Syst. 2015, 115, 311–331. [Google Scholar] [CrossRef]
- Gao, L.; Waechter, K.A.; Bai, X. Understanding consumers’ continuance intention towards mobile purchase: A theoretical framework and empirical study—A case of China. Comput. Hum. Behav. 2015, 53, 249–262. [Google Scholar] [CrossRef]
- Williams, M.D. Social commerce and the mobile platform: Payment and security perceptions of potential users. Comput. Hum. Behav. 2018, 83, 105557. [Google Scholar] [CrossRef] [Green Version]
- Venkatesh, V.; Thong, J.Y.L.; Xu, X. Consumer Acceptance and Use of Information Technology: Extending the Unified Theory of Acceptance and Use of Technology. MIS Q. 2012, 36, 157. [Google Scholar] [CrossRef] [Green Version]
- Rogers, E.M. Diffusion of Innovation, 5th ed.; Free Press: New York, NY, USA, 2003. [Google Scholar]
- Dahlberg, T.; Mallat, N.; Ondrus, J.; Zmijewska, A. Past, present and future of mobile payments research: A literature review. Electron. Commer. Res. Appl. 2008, 7, 165–181. [Google Scholar] [CrossRef] [Green Version]
- Dennehy, D.; Sammon, D. Trends in mobile payments research: A literature review. J. Innov. Manag. 2015, 3, 49–61. [Google Scholar] [CrossRef]
- Karnouskos, S. Mobile payment: A journey through existing procedures and standardization initiatives. IEEE Commun. Surv. Tutor. 2004, 6, 44–66. [Google Scholar] [CrossRef] [Green Version]
- Humphrey, D.B.; Pulley, L.B.; Vesala, J.M. Cash, Paper, and Electronic Payments: A Cross-Country Analysis. J. Money, Crédit. Bank. 1996, 28, 914. [Google Scholar] [CrossRef]
- Weir, C.S.; Anderson, J.N.; Jack, M.A. On the role of metaphor and language in design of third party payments in eBanking: Usability and quality. Int. J. Hum.-Comput. Stud. 2006, 64, 770–784. [Google Scholar] [CrossRef]
- He, Q.; Duan, Y.; Fu, Z.; Li, D. An Innovation Adoption Study of Online E-Payment in Chinese Companies. J. Electron. Commer. Organ. 2006, 4, 48–69. [Google Scholar] [CrossRef]
- Ho, C.-T.B.; Wu, D. Online banking performance evaluation using data envelopment analysis and principal component analysis. Comput. Oper. Res. 2009, 36, 1835–1842. [Google Scholar] [CrossRef]
- Lee, M.-C. Factors influencing the adoption of internet banking: An integration of TAM and TPB with perceived risk and perceived benefit. Electron. Commer. Res. Appl. 2009, 8, 130–141. [Google Scholar] [CrossRef]
- Carlsson, C.; Walden, P.; Bouwman, H. Adoption of 3G+ services in Finland. Int. J. Mob. Commun. 2006, 4, 369. [Google Scholar] [CrossRef]
- Jarvenpaa, S.L.; Lang, K.R. Managing the Paradoxes of Mobile Technology. Inf. Syst. Manag. 2005, 22, 7–23. [Google Scholar] [CrossRef]
- Kim, C.; Mirusmonov, M.; Lee, I. An empirical examination of factors influencing the intention to use mobile payment. Comput. Hum. Behav. 2010, 26, 310–322. [Google Scholar] [CrossRef]
- Zhou, T. An empirical examination of continuance intention of mobile payment services. Decis. Support Syst. 2013, 54, 1085–1091. [Google Scholar] [CrossRef]
- Dewan, S.G.; Chen, L.-D. Mobile Payment Adoption in the US: A Cross-industry, Crossplatform Solution. J. Inf. Priv. Secur. 2005, 1, 4–28. [Google Scholar] [CrossRef]
- Kuo, R.-Z. Why do people switch mobile payment service platforms? An empirical study in Taiwan. Technol. Soc. 2020, 62, 101312. [Google Scholar] [CrossRef]
- Shieh, L.-F.; Chang, T.-H.; Fu, H.-P.; Lin, S.-W.; Chen, Y.-Y. Analyzing the factors that affect the adoption of mobile services in Taiwan. Technol. Forecast. Soc. Chang. 2014, 87, 80–88. [Google Scholar] [CrossRef]
- Ghezzi, A.; Renga, F.; Balocco, R.; Pescetto, P. Mobile payment applications: Offer state of the art in the Italian market. Info 2010, 12, 3–22. [Google Scholar] [CrossRef]
- Venkatesh, V.; Morris, M.G.; Davis, G.B.; Davis, F.D. User acceptance of information technology: Toward a unified view. MIS Q. 2003, 27, 425–478. [Google Scholar] [CrossRef] [Green Version]
- Hill, R.J.; Fishbein, M.; Ajzen, I. Belief, Attitude, Intention and Behavior: An Introduction to Theory and Research. Contemp. Sociol. A J. Rev. 1977, 6, 244. [Google Scholar] [CrossRef]
- Ajzen, I. From Intentions to Actions: A Theory of Planned Behavior; Springer Science and Business Media LLC: Berlin/Heidelberg, Germany, 1985; pp. 11–39. [Google Scholar]
- Davis, F.D.; Bagozzi, R.P.; Warshaw, P.R. User acceptance of computer technology: A comparison of two theoretical models. Manag. Sci. 1989, 35, 982–1003. [Google Scholar] [CrossRef] [Green Version]
- Venkatesh, V.; Davis, F.D. A Theoretical Extension of the Technology Acceptance Model: Four Longitudinal Field Studies. Manag. Sci. 2000, 46, 186–204. [Google Scholar] [CrossRef] [Green Version]
- Taylor, S.; Todd, P.A. Understanding Information Technology Usage: A Test of Competing Models. Inf. Syst. Res. 1995, 6, 144–176. [Google Scholar] [CrossRef]
- Thompson, R.L.; Higgins, C.A.; Howell, J.M. Personal Computing: Toward a Conceptual Model of Utilization. MIS Q. 1991, 15, 125. [Google Scholar] [CrossRef]
- Rogers, E.M. Diffusion of Innovations, 3rd ed.; Free Press: New York, NY, USA, 1983; pp. 14–15. [Google Scholar]
- Davis, F.D.; Bagozzi, R.P.; Warshaw, P.R. Extrinsic and Intrinsic Motivation to Use Computers in the Workplace1. J. Appl. Soc. Psychol. 1992, 22, 1111–1132. [Google Scholar] [CrossRef]
- Bandura, A. Social Foundations of Thought and Action; SAGE Publications: Thousand Oaks, CA, USA, 2012; pp. 94–106. [Google Scholar]
- Dwivedi, Y.K.; Rana, N.P.; Janssen, M.; Lal, B.; Williams, M.D.; Clement, M. An empirical validation of a unified model of electronic government adoption (UMEGA). Gov. Inf. Q. 2017, 34, 211–230. [Google Scholar] [CrossRef] [Green Version]
- Dwivedi, Y.K.; Rana, N.P.; Jeyaraj, A.; Clement, M.; Williams, M.D. Re-examining the Unified Theory of Acceptance and Use of Technology (UTAUT): Towards a Revised Theoretical Model. Inf. Syst. Front. 2017, 21, 719–734. [Google Scholar] [CrossRef] [Green Version]
- Rana, N.P.; Dwivedi, Y.K.; Williams, M.D. A meta-analysis of existing research on citizen adoption of e-government. Inf. Syst. Front. 2013, 17, 547–563. [Google Scholar] [CrossRef] [Green Version]
- Rana, N.P.; Dwivedi, Y.K.; Williams, M.D.; Weerakkody, V. Adoption of online public grievance redressal system in India: Toward developing a unified view. Comput. Hum. Behav. 2016, 59, 265–282. [Google Scholar] [CrossRef]
- Rana, N.P.; Dwivedi, Y.K.; Lal, B.; Williams, M.D.; Clement, M. Citizens’ adoption of an electronic government system: Towards a unified view. Inf. Syst. Front. 2015, 19, 549–568. [Google Scholar] [CrossRef] [Green Version]
- Alalwan, A.A.; Dwivedi, Y.K.; Williams, M.D. Customers’ Intention and Adoption of Telebanking in Jordan. Inf. Syst. Manag. 2016, 33, 154–178. [Google Scholar] [CrossRef] [Green Version]
- Wang, H.-Y.; Wang, S.-H. User acceptance of mobile internet based on the Unified Theory of Acceptance and Use of Technology: Investigating the determinants and gender differences. Soc. Behav. Pers. Int. J. 2010, 38, 415–426. [Google Scholar] [CrossRef]
- Zhou, T.; Lu, Y.; Wang, B. Integrating TTF and UTAUT to explain mobile banking user adoption. Comput. Hum. Behav. 2010, 26, 760–767. [Google Scholar] [CrossRef]
- Brown, S.A.; Venkatesh, V. Model of Adoption of Technology in Households: A Baseline Model Test and Extension Incorporating Household Life Cycle. MIS Q. 2005, 29, 399. [Google Scholar] [CrossRef]
- Childers, T.L.; Carr, C.L.; Peck, J.; Carson, S. Hedonic and utilitarian motivations for online retail shopping behavior. J. Retail. 2001, 77, 511–535. [Google Scholar] [CrossRef]
- Mallat, N.; Rossi, M.; Tuunainen, V.K.; Öörni, A. An empirical investigation of mobile ticketing service adoption in public transportation. Pers. Ubiquitous Comput. 2006, 12, 57–65. [Google Scholar] [CrossRef]
- Oliveira, T.; Thomas, M.A.; Baptista, G.; Campos, F. Mobile payment: Understanding the determinants of customer adoption and intention to recommend the technology. Comput. Hum. Behav. 2016, 61, 404–414. [Google Scholar] [CrossRef]
- Karahanna, E.; Straub, D.W.; Chervany, N.L. Information Technology Adoption Across Time: A Cross-Sectional Comparison of Pre-Adoption and Post-Adoption Beliefs. MIS Q. 1999, 23, 183. [Google Scholar] [CrossRef]
- Bailey, F.G.; Rogers, E.M.; Shoemaker, F. Communication of Innovations: A Cross-Cultural Approach. Man 1974, 9, 331. [Google Scholar] [CrossRef]
- Zhao, J.; De Pablos, P.O. Regional knowledge management: The perspective of management theory. Behav. Inf. Technol. 2011, 30, 39–49. [Google Scholar] [CrossRef]
- Yi, M.Y.; Fiedler, K.D.; Park, J.S. Understanding the Role of Individual Innovativeness in the Acceptance of IT-Based Innovations: Comparative Analyses of Models and Measures. Decis. Sci. 2006, 37, 393–426. [Google Scholar] [CrossRef]
- Rogers, E.M. Diffusion of Innovations, 4th ed.; Free Press: New York, NY, USA, 1995. [Google Scholar]
- Chakravarty, S.; Dubinsky, A. Individual investors’ reactions to decimalization: Innovation diffusion in financial markets. J. Econ. Psychol. 2005, 26, 89–103. [Google Scholar] [CrossRef]
- Shen, Y.-C.; Huang, C.-Y.; Chu, C.-H.; Hsu, C.-T. A benefit–cost perspective of the consumer adoption of the mobile banking system. Behav. Inf. Technol. 2010, 29, 497–511. [Google Scholar] [CrossRef]
- Jackson, J.D.; Yi, M.Y.; Park, J.S. An empirical test of three mediation models for the relationship between personal innovativeness and user acceptance of technology. Inf. Manag. 2013, 50, 154–161. [Google Scholar] [CrossRef]
- Wold, H. Path Models with Latent Variables: The NIPALS Approach. Quant. Sociol. 1975, 3, 307–357. [Google Scholar] [CrossRef]
- Asghar, B.; Wasim, A.; Qazi, U.; Rasool, A. Financial and Non-Financial Practices Driving Sustainable Firm Performance: Evidence from Banking Sector of Developing Countries. Sustainability 2020, 12, 6164. [Google Scholar] [CrossRef]
- Bouraoui, K.; Bensemmane, S.; Ohana, M. Corporate Social Responsibility and Employees’ Affective Commitment: A Moderated Mediation Study. Sustainability 2020, 12, 5833. [Google Scholar] [CrossRef]
- Busu, M. Applications of TQM Processes to Increase the Management Performance of Enterprises in the Romanian Renewable Energy Sector. Processes 2019, 7, 685. [Google Scholar] [CrossRef] [Green Version]
- Chin, W.W. How to Write Up and Report PLS Analyses. In Handbook of Partial Least Squares; Springer Science and Business Media LLC: Berlin/Heidelberg, Germany, 2009; pp. 655–669. [Google Scholar]
- Hair, J.F., Jr.; Hult, G.T.M.; Ringle, C.; Sarstedt, M. A Primer on Partial Least Squares Structural Equation Modeling (PLS-SEM), 2nd ed.; Sage Publications: Thousand Oaks, CA, USA, 2017. [Google Scholar]
- Henseler, J.; Ringle, C.M.; Sarstedt, M. Using Partial Least Squares Path Modeling in Advertising Research: Basic Concepts and Recent Issues. In Handbook of Research on International Advertising; Edward Elgar Publishing: Cheltenham, UK, 2013; pp. 252–276. [Google Scholar]
- Hair, J.J.F. Essentials of Business Research Methods; Informa UK Limited: New York, NY, USA, 2015. [Google Scholar]
- Efron, B. Bootstrap Methods: Another Look at the Jackknife. Ann. Stat. 1979, 7, 1–26. [Google Scholar] [CrossRef]
- Hair, J.F., Jr.; Anderson, R.E.; Tatham, R.L.; Black, W. Multivariate Data Analysis: With Readings, 4th ed.; Prentice Hall: New Jersey, NJ, USA, 1998. [Google Scholar]
Figure 1.
Extend Unified Theory of Acceptance and Use of Technology (UTAUT2) framework [24].
Figure 1.
Extend Unified Theory of Acceptance and Use of Technology (UTAUT2) framework [24].

Figure 2.
Research framework.

Figure 3.
Simple path models [77].
Figure 3.
Simple path models [77].

Table 1.
Basic information.
| Characteristics | Consumers Who Had Used Mobile Payment | Consumers Who Had Never Used Mobile Payment | |||
|---|---|---|---|---|---|
| N | (%) | N | (%) | ||
| Age | Until 18 years old | 3 | 1% | 3 | 2% |
| 19–30 years old | 172 | 78% | 87 | 70% | |
| 31–40 years old | 23 | 10% | 23 | 10% | |
| 41–50 years old | 8 | 3% | 11 | 8% | |
| 51–60 years old | 10 | 4% | 10 | 8% | |
| Over 60 years old | 1 | 1% | 6 | 4% | |
| Career | Student | 101 | 46% | 60 | 47% |
| Information industry | 10 | 4% | 3 | 2% | |
| Soldier, civil servant and teacher | 16 | 7% | 8 | 6% | |
| Service industry | 23 | 10% | 15 | 12% | |
| Finance industry | 18 | 8% | 10 | 8% | |
| Others | 52 | 23% | 29 | 23% | |
| How long have you heard about or used mobile payment? | Less than half a year | 15 | 6% | 17 | 13% |
| Half a year–1 year | 65 | 29% | 40 | 32% | |
| 1–3 years | 108 | 49% | 59 | 47% | |
| 3–5 years | 17 | 7% | 3 | 2% | |
| More than 5 years | 14 | 6% | 4 | 3% | |
| How often do you use mobile payment each week on an average basis? | 0 time | 19 | 8% | ||
| 1–5 times | 150 | 68% | |||
| 6–10 times | 30 | 13% | |||
| 11–15 times | 9 | 4% | |||
| 16–20 times | 5 | 2% | |||
| More than 2 times | 20 | 6% | |||
| Which type of mobile payment is used by you most frequently? (multiple choice) | Apple Pay | 73 | 33% | ||
| Line Pay | 120 | 54% | |||
| Taiwan Pay | 64 | 29% | |||
| JKOPAY | 112 | 52% | |||
| All Pay | 34 | 15% | |||
| Others | 46 | 21% | |||
Table 2.
Perspective reliability analysis.
| Name of Perspective | Cronbach Alpha Value | ||
|---|---|---|---|
| All Samples (n = 342) | Used (n = 219) | Not Used (n = 123) | |
| Performance Expectancy | 0.924 | 0.842 | 0.907 |
| Effort Expectancy | 0.948 | 0.906 | 0.925 |
| Social Influence | 0.857 | 0.830 | 0.839 |
| Facilitating Conditions | 0.818 | 0.787 | 0.821 |
| Hedonic Motivation | 0.914 | 0.878 | 0.914 |
| Price Value | 0.947 | 0.877 | 0.921 |
| Compatibility | 0.939 | 0.872 | 0.901 |
| Innovation | 0.926 | 0.870 | 0.899 |
| Relative Advantage | 0.941 | 0.871 | 0.926 |
| Complexity | 0.919 | 0.891 | 0.940 |
| Observability | 0.936 | 0.823 | 0.902 |
| Behavioral intention | 0.870 | 0.780 | 0.868 |
Table 3.
Perspective validity analysis and descriptive statistics.
| Perspective | Items | Factor Loading | Descriptive Statistics | |||
|---|---|---|---|---|---|---|
| All Samples (n = 342) | Used (n = 219) | Not Used (n = 123) | Mean (n = 342) | S.D. (n = 342) | ||
| Performance Expectancy | PE1 | 0.833 | 0.644 | 0.800 | 4.22 | 0.896 |
| PE2 | 0.760 | 0.687 | 0.769 | 3.78 | 0.981 | |
| PE3 | 0.871 | 0.649 | 0.780 | 4.29 | 0.812 | |
| PE4 | 0.830 | 0.734 | 0.710 | 3.99 | 0.988 | |
| PE5 | 0.625 | 0.701 | 0.735 | 3.59 | 1.051 | |
| Effort Expectancy | EE1 | 0.890 | 0.824 | 0.815 | 4.04 | 0.942 |
| EE2 | 0.893 | 0.790 | 0.842 | 3.93 | 1.006 | |
| EE3 | 0.840 | 0.682 | 0.828 | 3.86 | 1.052 | |
| EE4 | 0.852 | 0.779 | 0.692 | 3.86 | 1.130 | |
| Social Influence | SI1 | 0.883 | 0.764 | 0.805 | 2.63 | 1.074 |
| SI2 | 0.805 | 0.745 | 0.823 | 2.42 | 1.183 | |
| SI3 | 0.747 | 0.958 | 0.736 | 3.05 | 1.086 | |
| SI4 | 0.844 | 0.674 | 0.755 | 3.74 | 1.002 | |
| SI5 | 0.834 | 0.637 | 0.753 | 3.58 | 1.060 | |
| Facilitating Conditions | FC1 | 0.827 | 0.762 | 0.818 | 4.13 | 1.122 |
| FC2 | 0.816 | 0.731 | 0.827 | 3.95 | 1.033 | |
| FC3 | 0.754 | 0.603 | 0.739 | 4.04 | 0.905 | |
| FC4 | 0.786 | 0.676 | 0.608 | 3.87 | 1.010 | |
| FC5 | 0.846 | 0.661 | 0.705 | 3.58 | 1.071 | |
| Hedonic Motivation | HM1 | 0.808 | 0.730 | 0.797 | 3.80 | 1.032 |
| HM2 | 0.835 | 0.761 | 0.764 | 4.05 | 0.913 | |
| HM3 | 0.845 | 0.761 | 0.748 | 3.39 | 1.064 | |
| HM4 | 0.794 | 0.784 | 0.796 | 3.82 | 0.992 | |
| HM5 | 0.852 | 0.799 | 0.818 | 3.55 | 1.100 | |
| Price Value | PV1 | 0.751 | 0.757 | 0.726 | 3.45 | 0.967 |
| PV2 | 0.834 | 0.786 | 0.751 | 3.37 | 1.067 | |
| PV3 | 0.914 | 0.783 | 0.791 | 3.62 | 0.988 | |
| PV4 | 0.862 | 0.684 | 0.781 | 3.65 | 1.042 | |
| Compatibility | C1 | 0.905 | 0.767 | 0.828 | 3.50 | 1.120 |
| C2 | 0.903 | 0.792 | 0.828 | 3.43 | 1.189 | |
| C3 | 0.893 | 0.690 | 0.802 | 3.49 | 1.146 | |
| C4 | 0.634 | 0.517 | 0.626 | 3.68 | 1.047 | |
| Innovation | I1 | 0.836 | 0.799 | 0.788 | 3.19 | 1.196 |
| I2 | 0.848 | 0.687 | 0.766 | 3.82 | 1.022 | |
| I3 | 0.863 | 0.717 | 0.773 | 3.61 | 1.128 | |
| I4 | 0.837 | 0.760 | 0.783 | 3.33 | 1.191 | |
| Relative Advantage | RA1 | 0.874 | 0.768 | 0.797 | 3.90 | 0.977 |
| RA2 | 0.821 | 0.690 | 0.752 | 3.93 | 0.975 | |
| RA3 | 0.844 | 0.640 | 0.685 | 3.64 | 1.093 | |
| RA4 | 0.881 | 0.684 | 0.727 | 3.69 | 1.044 | |
| RA5 | 0.811 | 0.740 | 0.787 | 3.87 | 0.998 | |
| Complexity | CC1 | 0.840 | 0.712 | 0.812 | 3.99 | 0.896 |
| CC2 | 0.809 | 0.655 | 0.775 | 3.77 | 0.968 | |
| CC3 | 0.827 | 0.744 | 0.854 | 3.91 | 0.949 | |
| CC4 | 0.857 | 0.787 | 0.834 | 3.85 | 1.009 | |
| Observability | O1 | 0.920 | 0.841 | 0.812 | 3.90 | 0.974 |
| O2 | 0.919 | 0.793 | 0.836 | 3.85 | 1.000 | |
| O3 | 0.865 | 0.701 | 0.833 | 3.97 | 0.926 | |
| O4 | 0.708 | 0.655 | 0.661 | 3.35 | 1.140 | |
| Behavioral intention | BI1 | 0.912 | 0.768 | 0.797 | 4.06 | 0.973 |
| BI2 | 0.948 | 0.690 | 0.752 | 3.93 | 1.046 | |
| BI3 | 0.823 | 0.640 | 0.685 | 3.72 | 1.205 | |
| BI4 | 0.796 | 0.684 | 0.727 | 3.22 | 1.161 | |
| BI5 | 0.849 | 0.740 | 0.787 | 3.72 | 1.076 | |
Table 4.
Research hypothesis verification.
| Hypothesis | All Samples (n = 342) | Used (n = 219) | Not Used (n = 123) | |||
|---|---|---|---|---|---|---|
| Result | T Value | Result | T Value | Result | T Value | |
| H1 | Not supported | 0.833 | Supported | 2.212 * | Not supported | 1.039 |
| H2 | Not supported | 1.678 | Not supported | 0.626 | Not supported | 0.594 |
| H3 | Supported | 2.386 * | Not supported | 1.301 | Supported | 2.264 ** |
| H4 | Supported | 2.908 ** | Supported | 3.670 *** | Not supported | 0.959 |
| H5 | Supported | 6.514 *** | Supported | 4.813 *** | Supported | 4.853 *** |
| H6 | Supported | 1.992 * | Not supported | 0.769 | Not supported | 1.817 |
| H7a | Supported | 13.075 *** | Supported | 7.785 *** | Supported | 9.101 *** |
| H7b | Supported | 14.294 *** | Supported | 9.760 *** | Supported | 9.651 *** |
| H7c | Supported | 3.449 *** | Supported | 2.086 * | Supported | 2.183 * |
| H8a | Supported | 11.780 *** | Supported | 9.334 *** | Supported | 6.959 *** |
| H8b | Supported | 11.480 *** | Supported | 9.873 *** | Supported | 6.135 *** |
| H8c | Supported | 5.031 *** | Supported | 3.277 ** | Supported | 2.446 * |
| H9 | Supported | 1.983 * | Supported | 2.157 * | Not supported | 0.616 |
| H10 | Not supported | 1.099 | Not supported | 1.723 | Not supported | 0.056 |
| H11 | Supported | 4.449 *** | Supported | 2.700 ** | Supported | 3.850 *** |
Note: *** p < 0.001, ** p < 0.01, * p < 0.05.
Publisher’s Note: MDPI stays neutral with regard to jurisdictional claims in published maps and institutional affiliations. |
© 2020 by the authors. Licensee MDPI, Basel, Switzerland. This article is an open access article distributed under the terms and conditions of the Creative Commons Attribution (CC BY) license (http://creativecommons.org/licenses/by/4.0/).
Share and Cite
MDPI and ACS Style
Lin, W.R.; Lin, C.-Y.; Ding, Y.-H. Factors Affecting the Behavioral Intention to Adopt Mobile Payment: An Empirical Study in Taiwan. Mathematics 2020, 8, 1851. https://doi.org/10.3390/math8101851
AMA Style
Lin WR, Lin C-Y, Ding Y-H. Factors Affecting the Behavioral Intention to Adopt Mobile Payment: An Empirical Study in Taiwan. Mathematics. 2020; 8(10):1851. https://doi.org/10.3390/math8101851
Chicago/Turabian StyleLin, Wan Rung, Chun-Yueh Lin, and Yu-Heng Ding. 2020. "Factors Affecting the Behavioral Intention to Adopt Mobile Payment: An Empirical Study in Taiwan" Mathematics 8, no. 10: 1851. https://doi.org/10.3390/math8101851
Note that from the first issue of 2016, this journal uses article numbers instead of page numbers. See further details here.