
Dynamic Connectedness among Vaccine Companies’ Stock Prices: Before and after Vaccines Released


1
Graduate School of Economics and Management, Ural Federal University, 620000 Yekaterinburg, Russia
2
LeBow College of Business, Drexel University, Philadelphia, PA 19104, USA
3
Bureau of Business Research, University of Economics Ho Chi Minh City, Ho Chi Minh City 70000, Vietnam
4
Newcastle Business School, Northumbria University, Newcastle upon Tyne NE1 8ST, UK
*
Author to whom correspondence should be addressed.
Mathematics 2022, 10(15), 2812; https://doi.org/10.3390/math10152812
Submission received: 15 July 2022
/
Revised: 30 July 2022
/
Accepted: 4 August 2022
/
Published: 8 August 2022
(This article belongs to the Special Issue Complex Network Analysis of Nonlinear Time Series)
Abstract
:This study investigates the interconnectedness among the stocks of the publicly listed vaccine-producing companies before and after vaccine releases in 2020/21. In doing so, the study utilizes the daily frequency equity returns of the major vaccine producers, including Moderna, Pfizer, Johnson & Johnson, Sinopharm and AstraZeneca. First, the investigation applies the TVP-VAR Dynamic Connectedness approach to explore the time–frequency connectedness between the stocks of those vaccine producers. The empirical findings demonstrate that Moderna performs as the most prominent net volatility contributor, whereas Sinopharm is the highest net volatility receiver. Interestingly, the vaccine release significantly increases the stock market connectedness among our sampled vaccine companies. Second, the cross-quantile dependency framework allows for the observation of the interconnectedness under the bearish and bullish stock market conditions by splitting any paired variables into 19 quantiles when considering short-, medium- and long-memories. The results also show that a high level of connectivity among the vaccine producers exists under bullish stock market conditions. Notably, Moderna transmits significant volatility spillovers to Sinopharm, Johnson & Johnson and AstraZeneca under both the bearish and bullish conditions, though the volatility transmission from Moderna to Pfizer is less pronounced. The policy implication proposes that the vaccine release allows companies to increase their stock returns and induce substantial volatility spillovers from company to company.
Keywords:
vaccine release; vaccine producer; stock market; connectedness; cross-quantilogram; TVP-VARMSC:
37M10; 82Cxx; 62Pxx1. Introduction
The spread of a novel coronavirus disease across the globe has considerably elevated the importance of the pharmaceutical industry, putting additional pressure on vaccine-producing companies to come forward with a protection, as vaccine inoculation appeared to be the most effective way to fight the pandemic. Therefore, the producing companies have strived to gain substantial knowledge of the virus’s biological features and achieve technological sophistication to successfully develop vaccine treatments and also acquire a competitive advantage over other companies [1,2]. Moreover, due to the COVID-19 pandemic and the lockdowns, many businesses had to suspend their activities, whereas the activities of the pharmaceutical companies, especially the vaccine producers, turned out to be more prominent. In this paper, it is argued that the vaccine release provides positive sentiments to investors to consider their respective companies’ stocks as safe and high yield investments. The news about vaccine releases against the COVID-19 disease is exceptional and expected to be a quality predictor since the impact of the COVID-19 pandemic is tremendous and global. Hence, the motivation of this study is to reveal whether the vaccine releases play a significant role in changing the pattern of total connectedness and the spillover effect among vaccine-producing companies.
Several studies [3,4,5,6,7,8] find strong evidence of increased market connectedness between the stocks of those vaccine companies due to the high level of uncertainty about infections and the promise of potential success during the pandemic. According to the findings of a few investigations [9,10,11,12,13,14,15], investors during crisis periods, including emergencies of uncertainty regarding infections, only consider risk seeking for safer assets, thus increasing the connectedness among relatively safer stocks. In particular, investors are likely to invest more in the vaccine-producing companies that are the most prosperous and safest during the pandemic. The companies used different vaccine processes and required different numbers of doses. Therefore, increased investments in the different vaccine companies could cause changes in the time-dynamic connectedness among them.
The literature primarily focuses on stock market connectedness under various external shocks. For example, the connectedness of major stock markets has increased after the global financial crisis in 2008 [16,17,18].
Stock market volatilities can be induced by such exogenous factors as critical political decisions, referendums, economic crises, stock and bond market uncertainty, high inflation, and crude oil and natural gas price fluctuations [19,20,21]. Developed stock markets transmit a spillover effect to emerging stock markets [22]. At the same time, emerging markets lack the power to transmit volatility to other markets. The interconnectedness between emerging and developed markets is also conditional on external shocks. For instance, during the global emerging market crisis, the U.S. stock market had less power to influence emerging African countries both in the short-run and long-run [23]. More recently, several studies have investigated the stock market connectedness in terms of the influence of the COVID-19 pandemic. The COVID-19 pandemic created a high level of uncertainty, leading to increased volatility and connectedness of various stock markets [24,25,26,27,28,29]. Moreover, the COVID-19 outbreak may change the direction of volatility spillovers from one stock market to another [30,31,32]. Interestingly, Chen [33] reveals that the stock market connectedness depends on markets’ economic integration. However, these studies utilize stock indices instead of particular companies’ equity returns in the same industry, as we do in this current study.
The literature suggests several channels for increasing stock market connectedness during crisis times. For example, Trevino [34] distinguishes between two informational channels of financial contagion: the fundamental and the social learning. The fundamental channel pertains to financial interaction among economic agents and economies. In contrast, the social learning channel means that economic agents make their decisions by observing the behaviour of other agents. Moreover, Trevino [34] documents that economic agents tend to underestimate the power of the fundamental channel and overvalue the social channel, thus weakening the fundamental correlation and enhancing the channel of social learning. Pritsker [35] describes several rational or fundamental channels of financial contagion, including financial market linkages, the real sector linkages, the interaction of financial institutions and markets, and financial institution linkages. When analyzing the financial contagion, US credit default swaps and TED spreads reduce the dynamic conditional correlation among the stock returns of emerging markets [17]. Baur [36] reveals that the main channels of financial contagion during the 2008 GFC include the contagion of aggregate stock market indices, the contagion of financial sector stocks across countries and the contagion of the real economy sectors. Notably, some sectors such as healthcare and technologies were least affected by the crisis. Horta et al. [37] argue that the behaviour of investors plays a crucial role in determining volatility transmission through wealth constraints [38,39] or portfolio rebalancing [40,41]. Portfolio rebalancing implies that investors reduce risks by switching to safer assets. Horta et al. [37] find that portfolio rebalancing was a more prominent factor during the GFC than wealth constraints.
Many studies emphasize that investors’ behavior is crucially important in determining stock market co-movements. The influence of irrational behavior is transmitted through different perspectives. For example, sentiment-based factors significantly influence co-movements, stock returns and volatility spillovers [11,42,43,44]. Interestingly, during crisis periods, investors only consider risk-seeking for safer assets. Lee [45] documents that investors’ expectations regarding future economic uncertainty intensify the stock and Treasury bond markets’ co-movement in Europe. Moreover, COVID-19 cases and stock returns of the G7 countries demonstrate a strong co-movement [14]. Moreover, their study argues that during COVID-19, the pandemic investors are especially inclined to be risk averse. López-Cabarcos et al. [46] find that sentimental factors highly influence Bitcoin volatility. Pasquariello [47], by using a model of multi-asset trading, finds that financial contagion can still be an equilibrium result if speculators receive heterogeneous private information. Veldkamp [48] documents that stocks demonstrate a high price covariance due to the high cost of information.
In comparison with the existing literature, this study provides several contributions. First, the existing literature on market connectedness primarily utilizes stock indices instead of the equity returns of a particular industry, whereas this study analyzes the dynamics of vaccine-producing companies, and their high importance during the COVID-19 virus. Second, most other studies argue that stock market connectedness is induced by various exogenous shocks such as a financial crisis or the COVID-19 outbreak. However, this study suggests a more novel idea since we aim to examine if the vaccine release has induced the stock market connectedness of vaccine-producing companies. Third, the application of sophisticated econometric techniques allows us to overcome the high frequency and extreme volatility of the data. For instance, the TVP-VAR dynamic connectedness allows for measuring the volatility transmission from one vaccine producer to another, thereby identifying net volatility contributors and receivers. Moreover, the cross-quantilogram is not sensitive to an abnormal distribution, and the problems of high-frequency series in the presence of outliers enable splitting the relations of both dependent and independent variables into quantile coefficients. In addition, the cross-quantilogram approach provides a statistical significance level under each quantile, apart from the advantages above.
Fourth, the unique findings of this study approve the hypothesis that the vaccine release significantly increases the stock market connectedness among the major vaccine-producing companies. For example, the increase in the total connectedness index (TCI) from the second quarter of 2021 is induced by the vaccine release at the end of 2020–the beginning of 2021. Interestingly, Moderna appears as the most prominent net volatility transmitter, whereas Sinopharm is the highest net volatility receiver, transmitting no net volatility. The cross-quantilogram analysis consistently shows that Moderna transmits significant volatility spillovers to all companies, except Pfizer. Moreover, the results demonstrate a high level of connectivity under bullish market conditions. Moreover, all short and long terms are considered by taking 1-day, 5-day, 22-day and 66-day lags.
2. Methodology and Data
2.1. TVP-VAR Dynamic Connectedness
To estimate the volatility spillover among the stock prices of Moderna, Pfizer, Johnson & Johnson, Sinopharm and AstraZeneca, this study applies the time–frequency connectedness namely the time-varying parameter vector autoregression (TVP-VAR) method proposed by Antonakakis and Gabauer [49]. The framework possesses a few advantages. First, it permits the variance to change over time horizon by using a stochastic volatility Kalman filter estimation as well as forgetting factors [50]. Therefore, this approach addresses the bias estimation problem by selecting the size of rolling window randomly. Second, the TVP-VAR dynamic connectedness is suitable for relatively less frequent series with small spans of time.
The TVP-VAR method is determined as follows:
where represents an conditional volatility vector, denotes the lagged conditional vector of with dimension. Further, signifies the time-varying parameters matrix with the order. Additionally, represents the vector of errors with an order along with the time-varying covariance matrix . The vector of the parameter matrix, , depends on the respective coefficient of following an error matrix along with an variance–covariance matrix. The TVP-VAR dynamic connectedness estimates the generalized connectedness [51] and incorporating the time-varying parameters and the error covariance. The current method allows one to estimate the volatility spillovers by utilizing the generalized impulse response functions (GIRF) [52] and the generalized forecast error variance decompositions (GFEVD) [53]. Therefore, the transformation of the VAR to a vector moving average (VMA) provides a representation for GIRF and GFEVD estimation based on the Wold theorem as follows:
where and , consequently, and are dimensional parameter matrices ordered as .
The GIRFs show the response of all respective variables to a shock in a variable, .
The approach implies testing the differences between a both when variable is under and out of a shock as the model employed does not follow a structural modelling.
Equation (7) below shows the estimation of the difference to the shock in variable .
where is the forecast value of the time horizon , and one standard error shock. In our study, we consider the stock returns of the major vaccine producing companies including Moderna, Pfizer, Johnson & Johnson, Sinopharm and AstraZeneca in rotation as variables and . Note that indicates the vector of selection and characterizes the set of information until . After that, the GFEVD is calculated, namely by dividing one variable’s variance share on the sum of other variables. Further, merging rows into one provides a normalization of the examined variances, and represents that the variable’s forecast error is described by all variables. Consequently, the abovementioned estimation is defined as follows:
where, is the summation of total variance share of all variables or total connectedness, is variance with and Equations (11) and (12) represent the calculation of the total connectedness index (TCI) considering GFEVD:
First, the TVP-VAR measures the influence of a shock in a variable spillover on other variables. Equation (13) demonstrates how the shock variable influences other variables :
Second, Equation (14) shows the calculation of the total directional connectedness from others, demonstrating a spillover effect received from other variables:
Eventually, the total directional connectedness to others is subtracted from the total directional connectedness from others. Consequently, the net total directional connectedness is calculated, measuring the magnitude of the impact of variable on the variables’ network. Equation (15) demonstrates the estimation of the net total directional connectedness
In the case when is positive, the magnitude of the impact of variable is more pronounced than the impact of another variable on variable , implying that variable affects all other variables. On the contrary, if is negative, the impact of variable on variable is more pronounced than the impact of variable on variable or all the other variables.
2.2. Cross-Quantilogram
To estimate a bivariate co-movement between two time-series, this study applies the cross-quantilogram (CQ) method proposed by Han et al. [54]. CQ is applied due to a few distinct features of this approach. First, this approach is appropriate to measure the bivariate implied volatility between two series in the case of non-normal distribution and outliers [55]. Second, the CQ approach measures the strength of the volatility spillover shock transmitted from one market to another when considering various quantiles. Third, the CQ approach allows the assumption of moment conditions. Therefore, this approach is appropriate when considering distributions with fat tails. In addition, this technique permits the use of longer lags, allowing estimation of how strongly two variables are interconnected when considering duration and direction concurrently.
Equation (16), below, demonstrates the cross-quantilogram between two return series comprising and , where with . The function is followed by the conditional distribution implying the stock return of a vaccine producer given the stock return of another vaccine producer, corresponding to for This approach uses in the form of a Cartesian product of two closed intervals within (0, 1), where, , where . The CQ framework incorporates serial dependence between two shocks, and , for a particular pair of when considering a lag order equal to . Equation (16) shows the estimation of cross-quantilogram:
where denotes the return series, i is represented as 1, 2, 3, 4 or 5 and demonstrates the stock returns of Moderna, Pfizer, Johnson & Johnson, Sinopharm and AstraZeneca. Moreover, t indicates time (t = 1, 2, …, T), whereas the functions (⋅) and (⋅) consider the distribution and density functions of , i = 1, 2, accordingly. Besides, denotes the respective quantile function for , whereas represents the quantile-hit process.
The estimation process of variation with a lag length equal to k allows the identification of cross-quantile dependency’s variation between the variables over time, thus calculating the dependence strength and duration. The length of the considered lags is as follows: k is equal to 1, 5, 22 and 66 indicating daily, weekly, monthly and quarterly lags, accordingly.
Subsequently, by employing the Ljung–Box type test the statistical significance of is considered, so that the test statistic is computed in accordance with Equation (17):
where represents the cross-quantilogram calculated as follows:
where represents the measured partial cross-quantilogram.
Afterwards, stationary bootstrap allows approximation of the cross-quantilogram’s null distribution, which is reflected in Equation (18) as well as the Q-statistics in Equation (17).
The approach further implies the calculation of the partial cross-quantilogram (PCQ) between the variables in order to consider the effect of uncertainties. Precisely, = [] is the following vector for of the control variables. Hence, Equation (19) represents the quantile-hit process, and its inverse matrix correlation matrix as follows:
where is the vector of the quantile hit process with matrix order . Besides, and represent the i-th element of (which is the quantile-hit correlation matrix) and for . The cross-quantilogram is defined as Then the partial cross-quantilogram is represented as follows:
where is the cross-quantilogram between two variables, and can be regarded as the cross-quantilogram between and dependent on the control variable z.
2.3. Quantile-on-Quantile
The study applies the quantile-on-quantile (QQ) approach for the robustness check of the results obtained from the TVP-VAR and CQ techniques. This framework has several distinct features. Firstly, the QQ framework combines two approaches, namely, the standard quantile regression and the local linear regression which were proposed by Sim and Zhou [56]. The QQ technique considers the flaws of the aforementioned methods by splitting both variables into different quantiles [57,58]. Secondly, the framework overcomes the issue of reverse causality by providing the quantiles’ slope coefficients of the various quantiles of independent variables on different quantiles of dependent variables. Moreover, this method allows the abnormal distribution of the high-frequency data. denotes the stock returns of one of the vaccine-producing companies’ returns, whereas signifies the stock price of another vaccine-producing company. signifies the dependent variable, whereas indicates the independent variable. We take the equity returns of the different vaccine companies one by one as functions of each other.
Therefore, we introduce our empirical model as follows:
The slope, , which captures the relationship between the stock returns of two different vaccine-producing companies is thus unknown. Additionally, represents the error term when is zero. Afterwards, the first order Taylor expansion is defined by transforming Equation (10), namely by considering the first-order Taylor expansion of around :
The double indexing of and in and means that both and denote the functions of as well as . Equation (22) is represented as follows:
Substituting Equation (23) into the original QQ equation provides the following equation:
Subsequently, the stock returns of the respective vaccine-producing companies are substituted as dependent and independent variables in order to confirm the interconnectedness among those companies.
2.4. Data and Sources
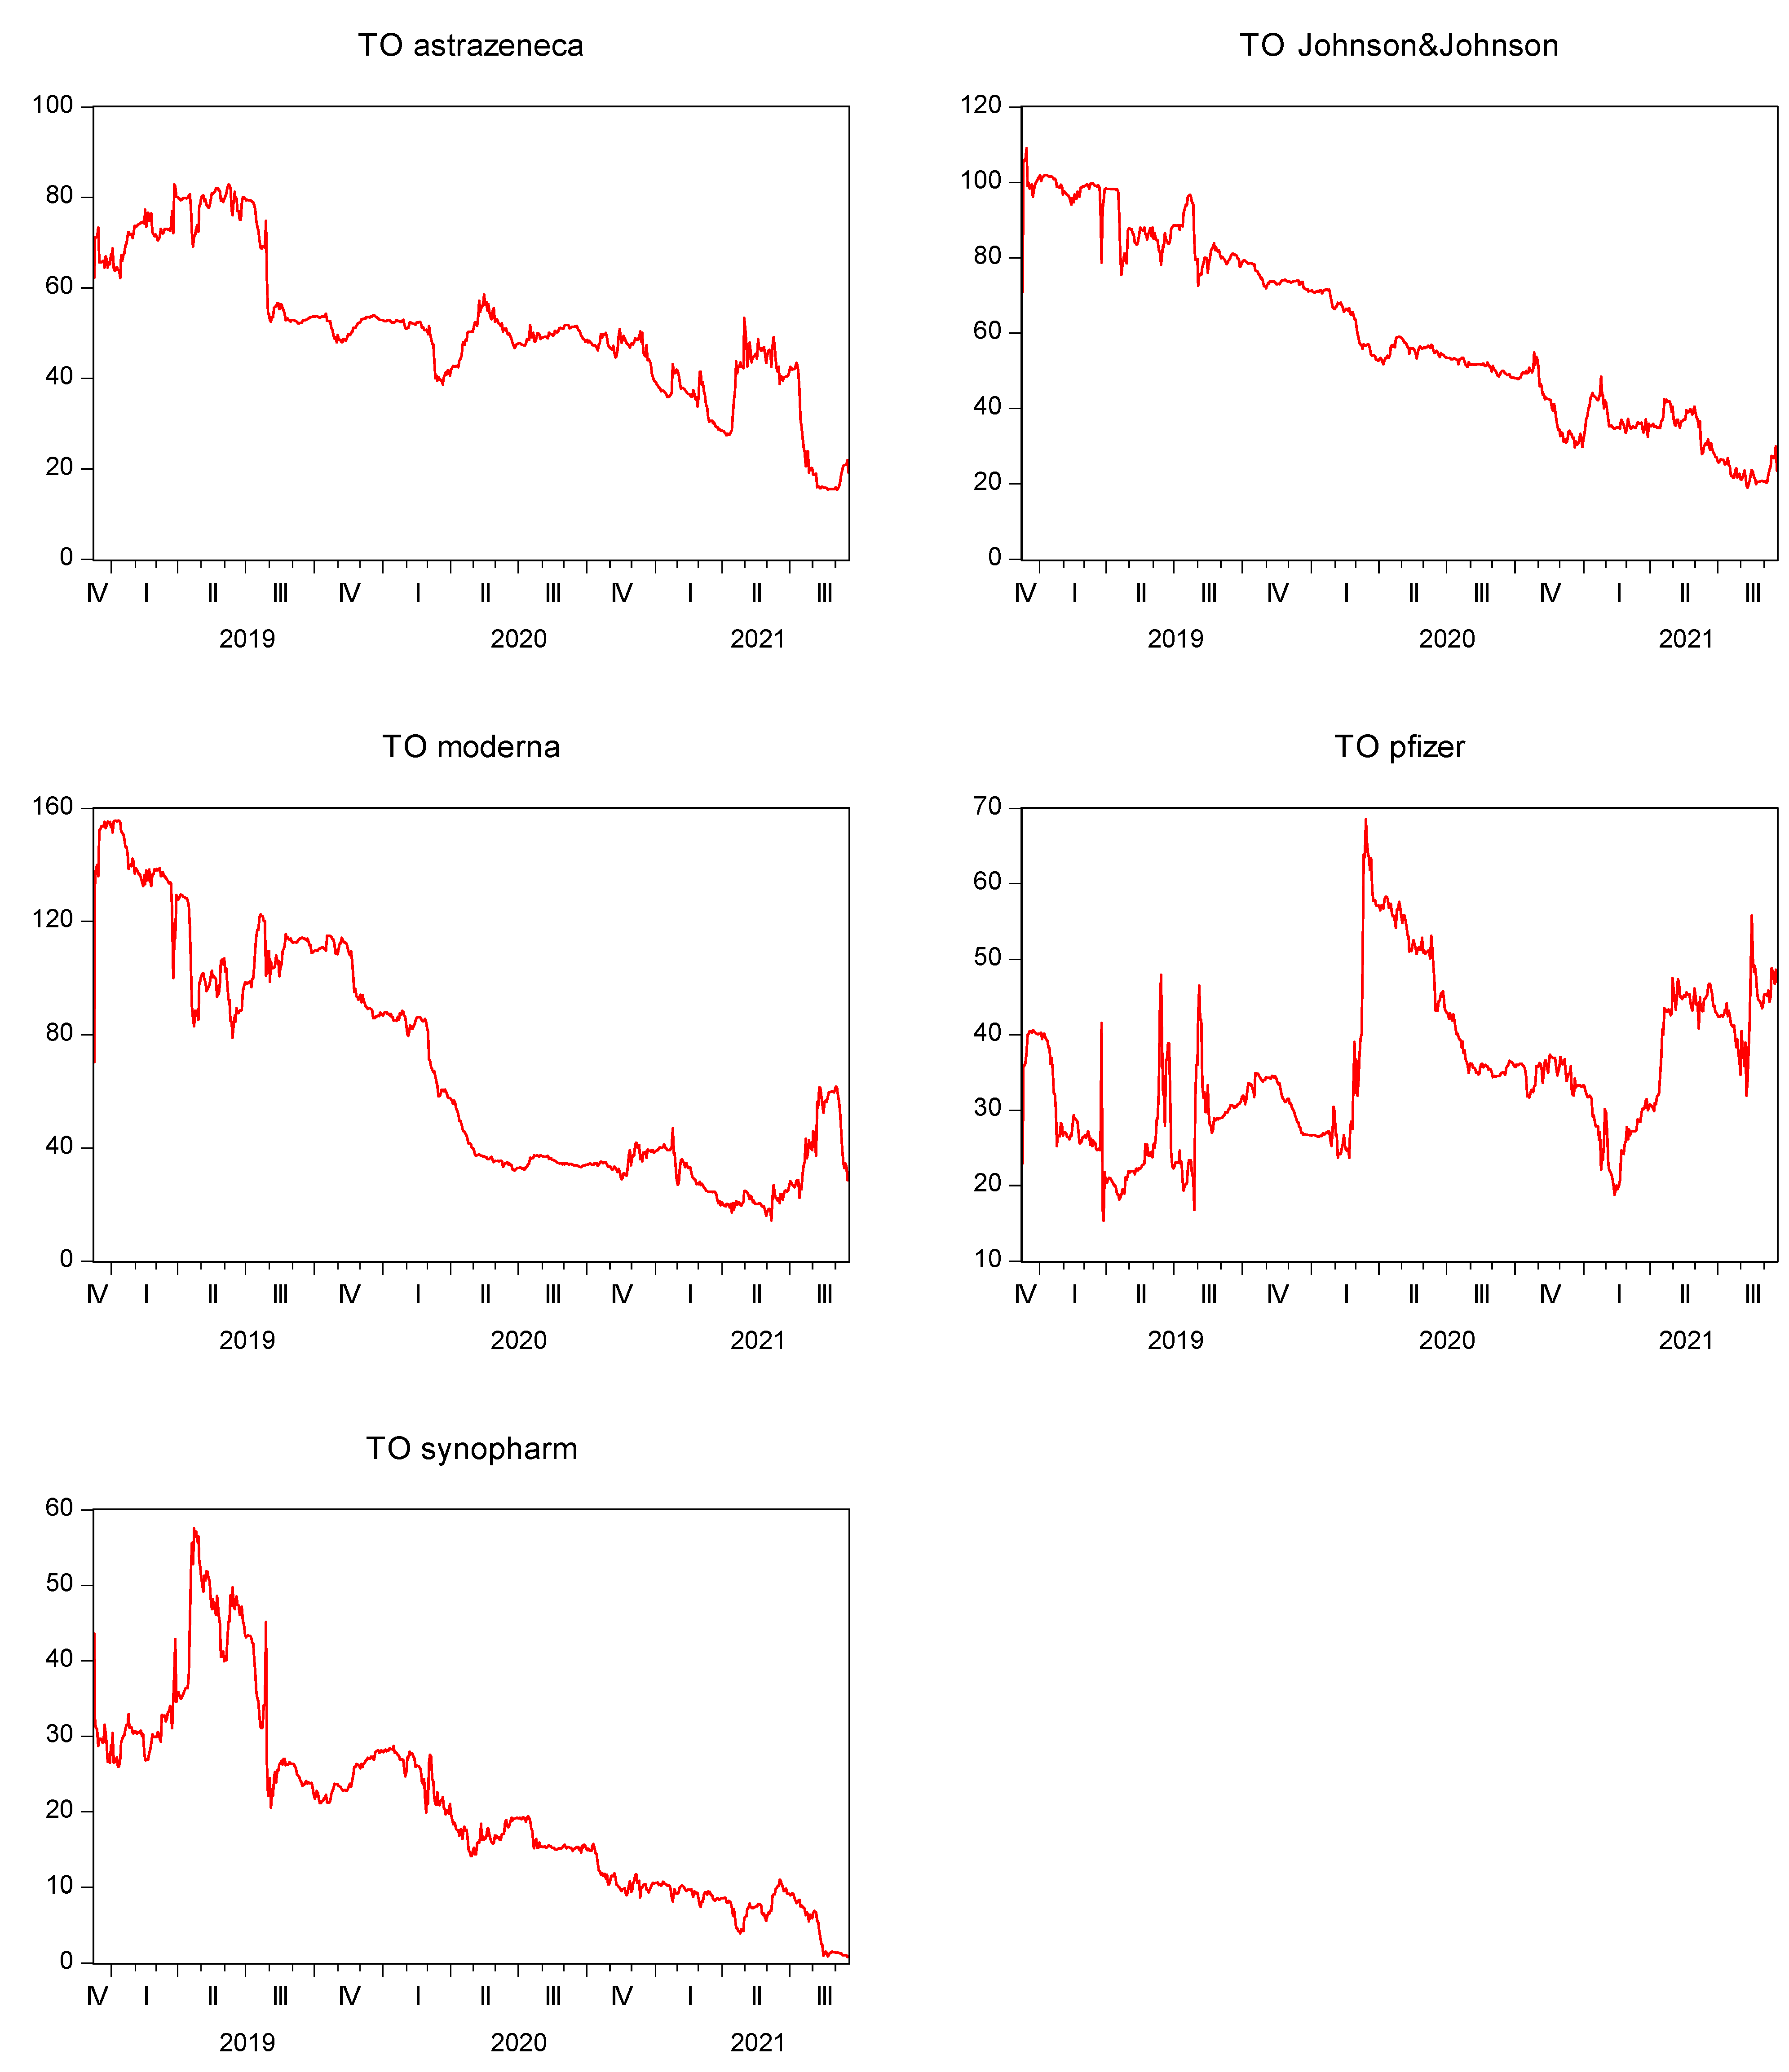
In this study the equity prices of several vaccine-producing companies are considered, including Moderna, Pfizer, Johnson & Johnson, Sinopharm and AstraZeneca. The sample time frame ranges from 7 December 2018 to 20 September 2021 due to the maximum data availability and by determining a common starting date for all considered companies. The data frequency is daily, precisely 5 days in a week. Table 1 provides the variable names, descriptions, units and respective sources.
3. Results
3.1. Dynamic Connectedness among the Vaccine-Producing Companies
In order to measure the dynamic connectedness among the vaccine-producing companies, TVP-VAR dynamic connectedness was conducted in the R software. Table 2 represents the results of the TVP-VAR dynamic connectedness, which is the first step to analyze the frequency connectedness among the companies’ stocks. The total connectivity index (TCI) demonstrates a relatively high degree of total market connectivity, in the magnitude of 47.32%. The rows of Table 2 stands for the volatility receivers, whereas the columns stand for the contributors. AstraZeneca receives 51.00% from the other markets. On the other hand, AstraZeneca overall transmits 51.53% to the other markets, specifically a 13.01% spillover to Sinopharm, 12.11% to Moderna, 7.75% to Pfizer and 18.66% to Johnson & Johnson. AstraZeneca is marginally a net volatility contributor in the magnitude of 0.53%. Besides, Johnson & Johnson receives a volatility spillover of 55.64%, whereas it contributes 60.56% to other companies. Therefore, Johnson & Johnson is a net volatility transmitter, overall contributing net 4.92% to other respective markets.
Regarding Moderna, its stock return receives 41.68% volatility from the other markets. Interestingly, Moderna contributes the highest volatility spillovers as compared with the other companies. In doing so, Moderna transmits 12.26% to Sinopharm, 16.60% to AstraZeneca, 20.74% to Pfizer and 19.33% to Johnson & Johnson, thus contributing 68.93% in total volatility spillover. Moreover, Moderna appears as the highest net volatility contributor, contributing 27.25%. Pfizer’s stock return receives 49.22%, whereas it contributes 35.11% of the volatility spillover to other respective markets, turning it into a net receiver of −14.11%. Finally, Sinopharm receives a volatility spillover of 39.07% from the other vaccine-producing companies. The second column indicates the magnitude of spillover from Sinopharm to the other respective companies.
Interestingly, the results represent Sinopharm as a weak spillover transmitter. Table 2 shows that Sinopharm is the least volatility contributor, at a total of 20.48% to the other markets. Therefore, Sinopharm turns into a net volatility receiver (−18.59%) from the stock returns of the other vaccine producers.
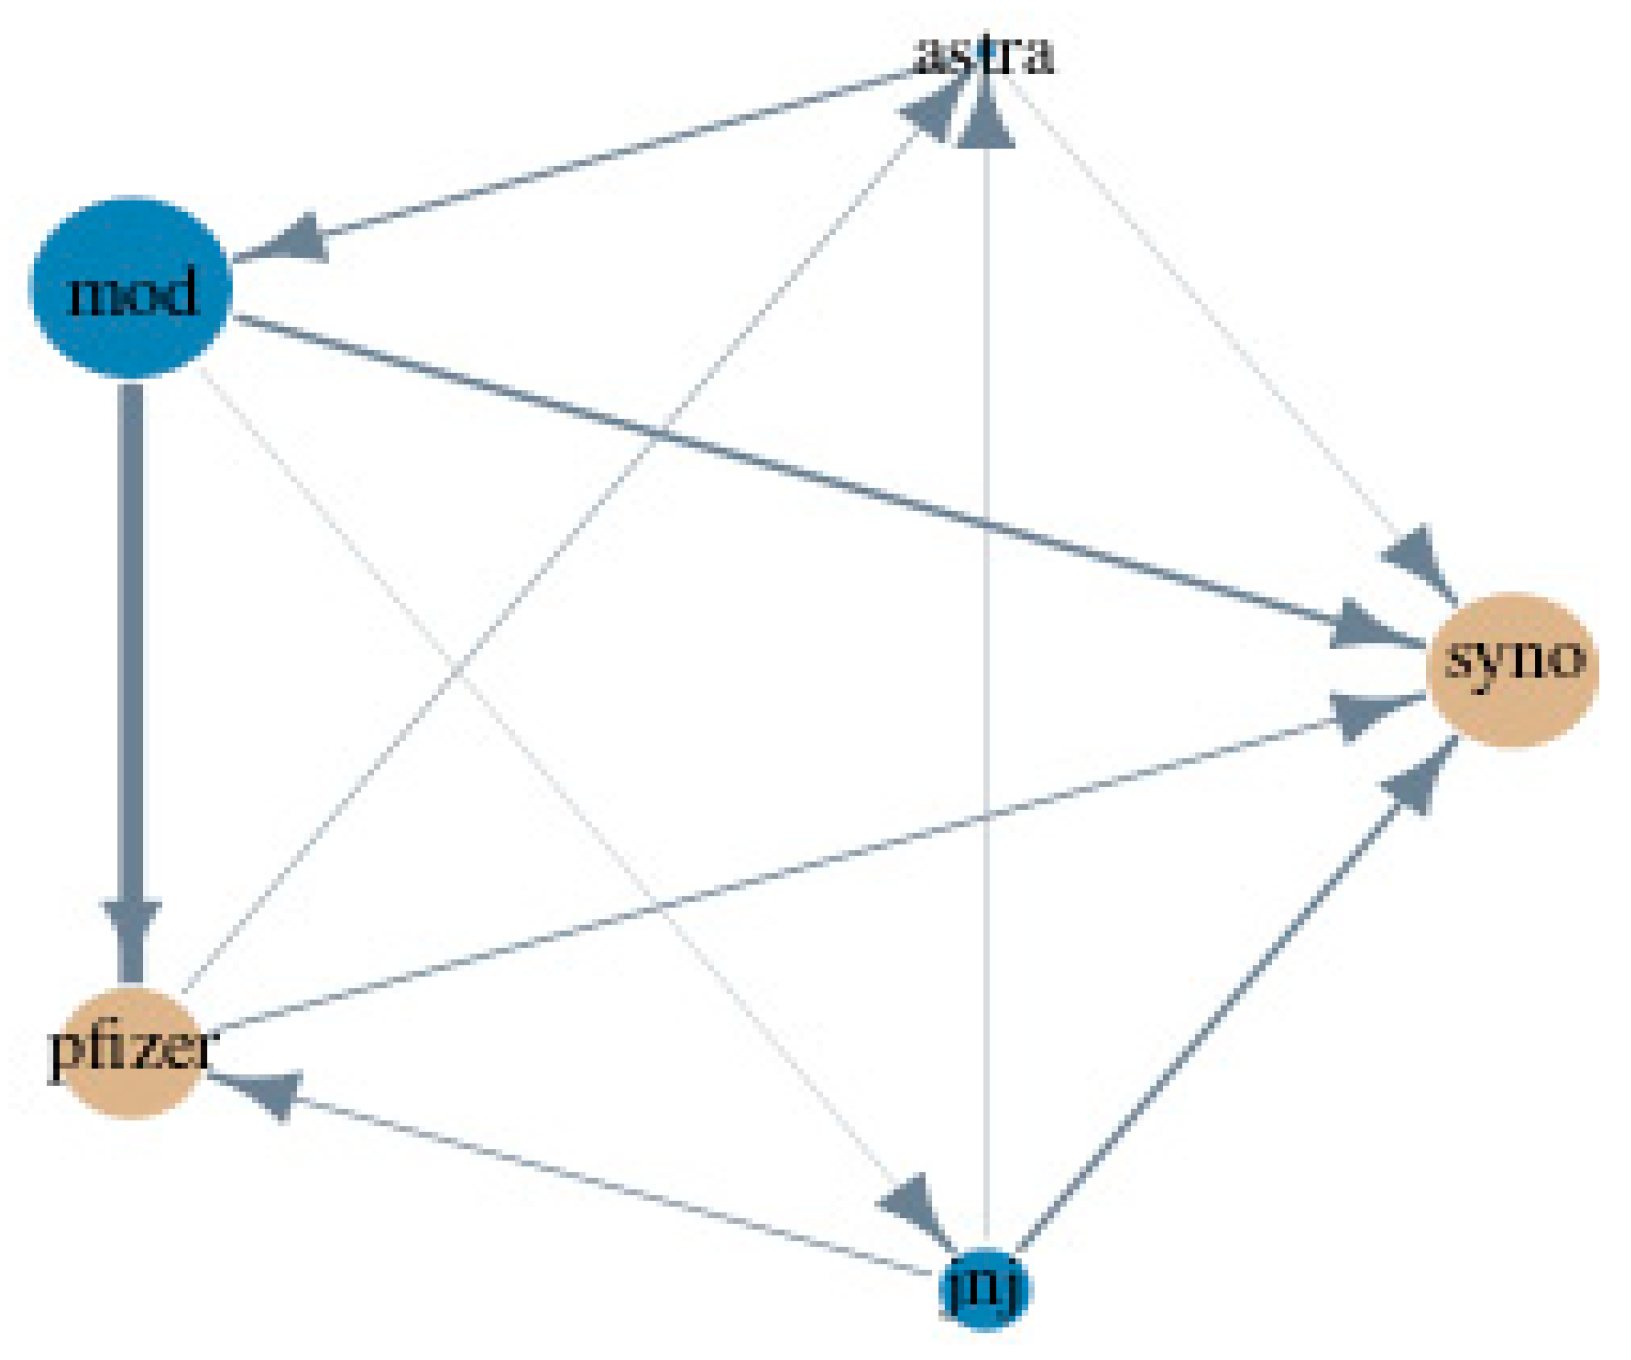
Figure 1 is a volatility transmission diagram, representing our previous findings in an illustrative graph. For example, the graph affirms that Moderna is the most powerful transmitter. In particular, Moderna transmits the highest volatility spillover to Pfizer, a slightly lower volatility spillover to Sinopharm and has the smallest spillover to Johnson & Johnson. Interestingly, the only company that manages to transmit volatility spillover to Moderna is AstraZeneca. At the same time, AstraZeneca transmits a small volatility spillover to Sinopharm and receives volatility spillover from Pfizer and Johnson & Johnson. Notably, Sinopharm receives volatility spillover from Moderna, Pfizer, AstraZeneca, and Johnson & Johnson, while transmitting no volatility to other markets. Hence, Sinopharm is the highest volatility receiver. Pfizer transmits volatility to AstraZeneca and Sinopharm, while receiving volatility from Moderna and Johnson & Johnson. Finally, Johnson & Johnson contributes to Sinopharm, Pfizer and AstraZeneca’s stock volatilities and receives volatility from Moderna.
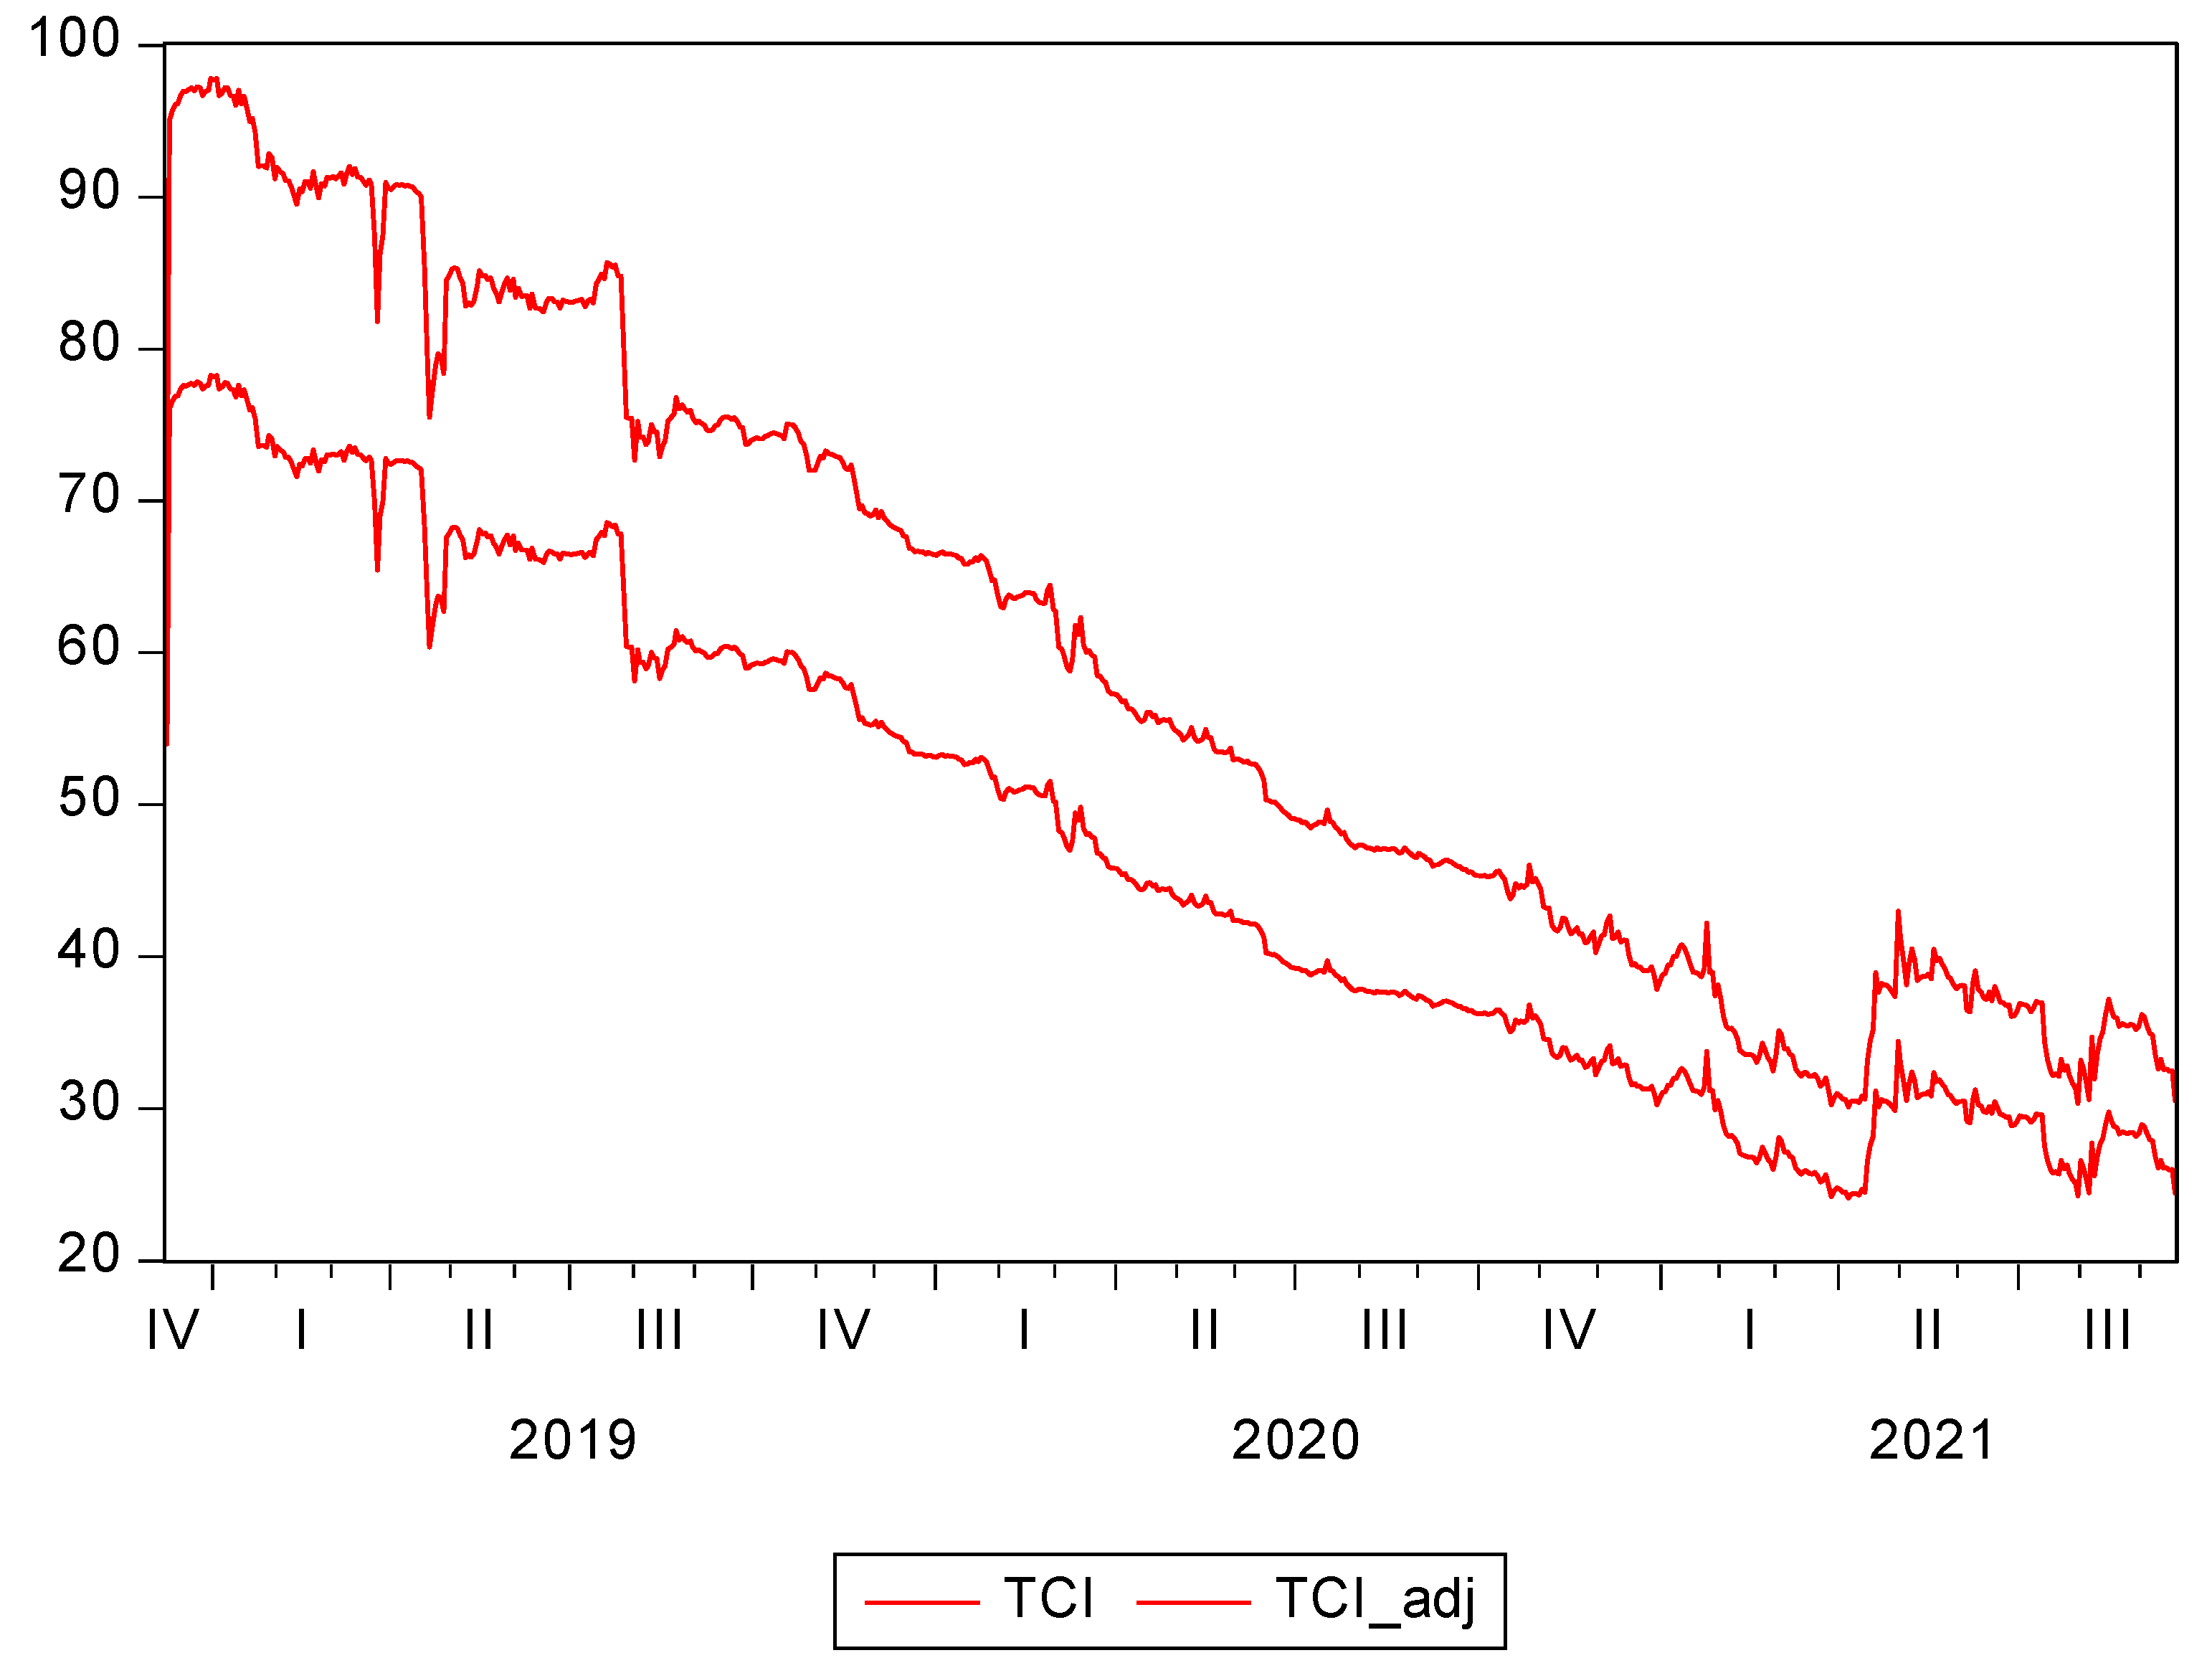
Figure 2 represents the dynamic total connectivity index. The degree of connectivity was the highest during the fourth quarter of 2018 and the third quarter of 2019. Afterwards, a significant decline in total connectivity is observed. Nevertheless, the TCI rises in the second and third quarters of 2021 due to the COVID-19 pandemic. More particularly, the increased connectedness is likely to be induced by the vaccine release. For example, Pfizer and AstraZeneca released their vaccines in December 2020, whereas Johnson & Johnson, Moderna and Sinopharm achieved first authorization in the first quarter of 2021. This study argues that the stock market connectedness increased through the fundamental channel of foreign investment, for example, via foreign purchases of vaccines by other countries, which is also in line with Hwang et al. [17]. Moreover, investors’ behaviour can induce an increase in the stock market connectedness. Due to the COVID-19 pandemic, the vaccine-producing companies are thriving. In addition, the pandemic has created a high level of uncertainty.
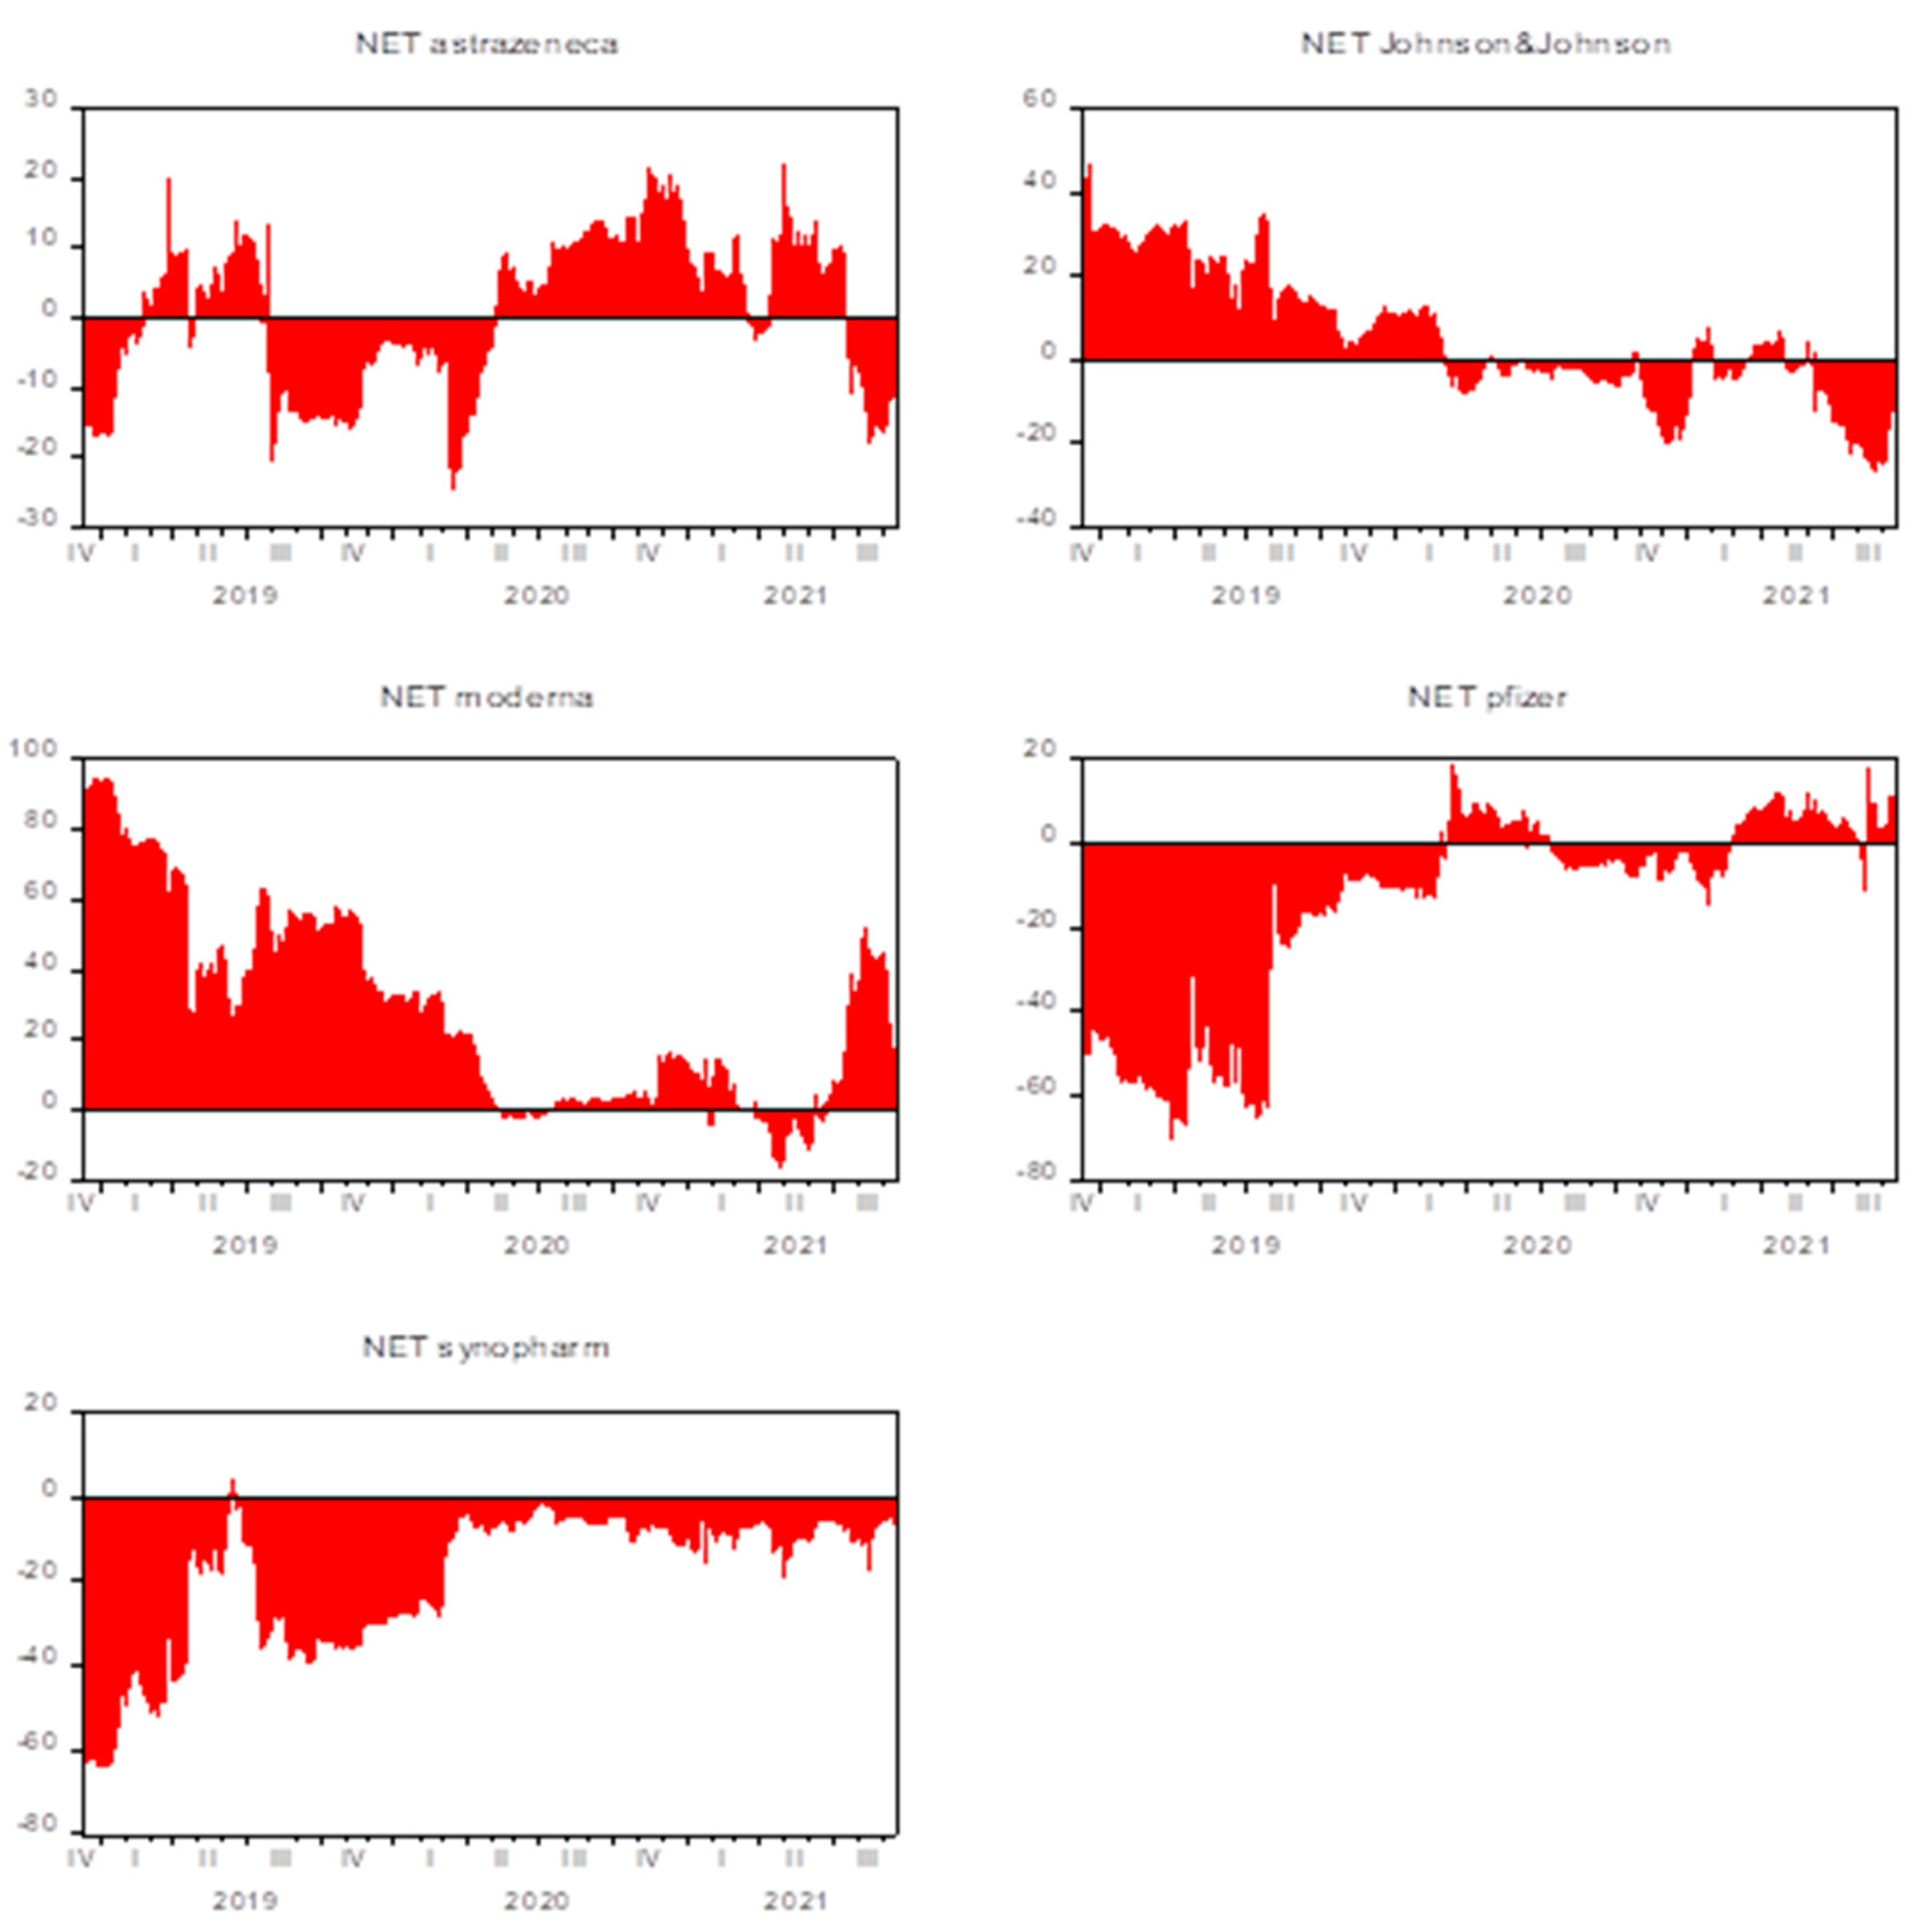
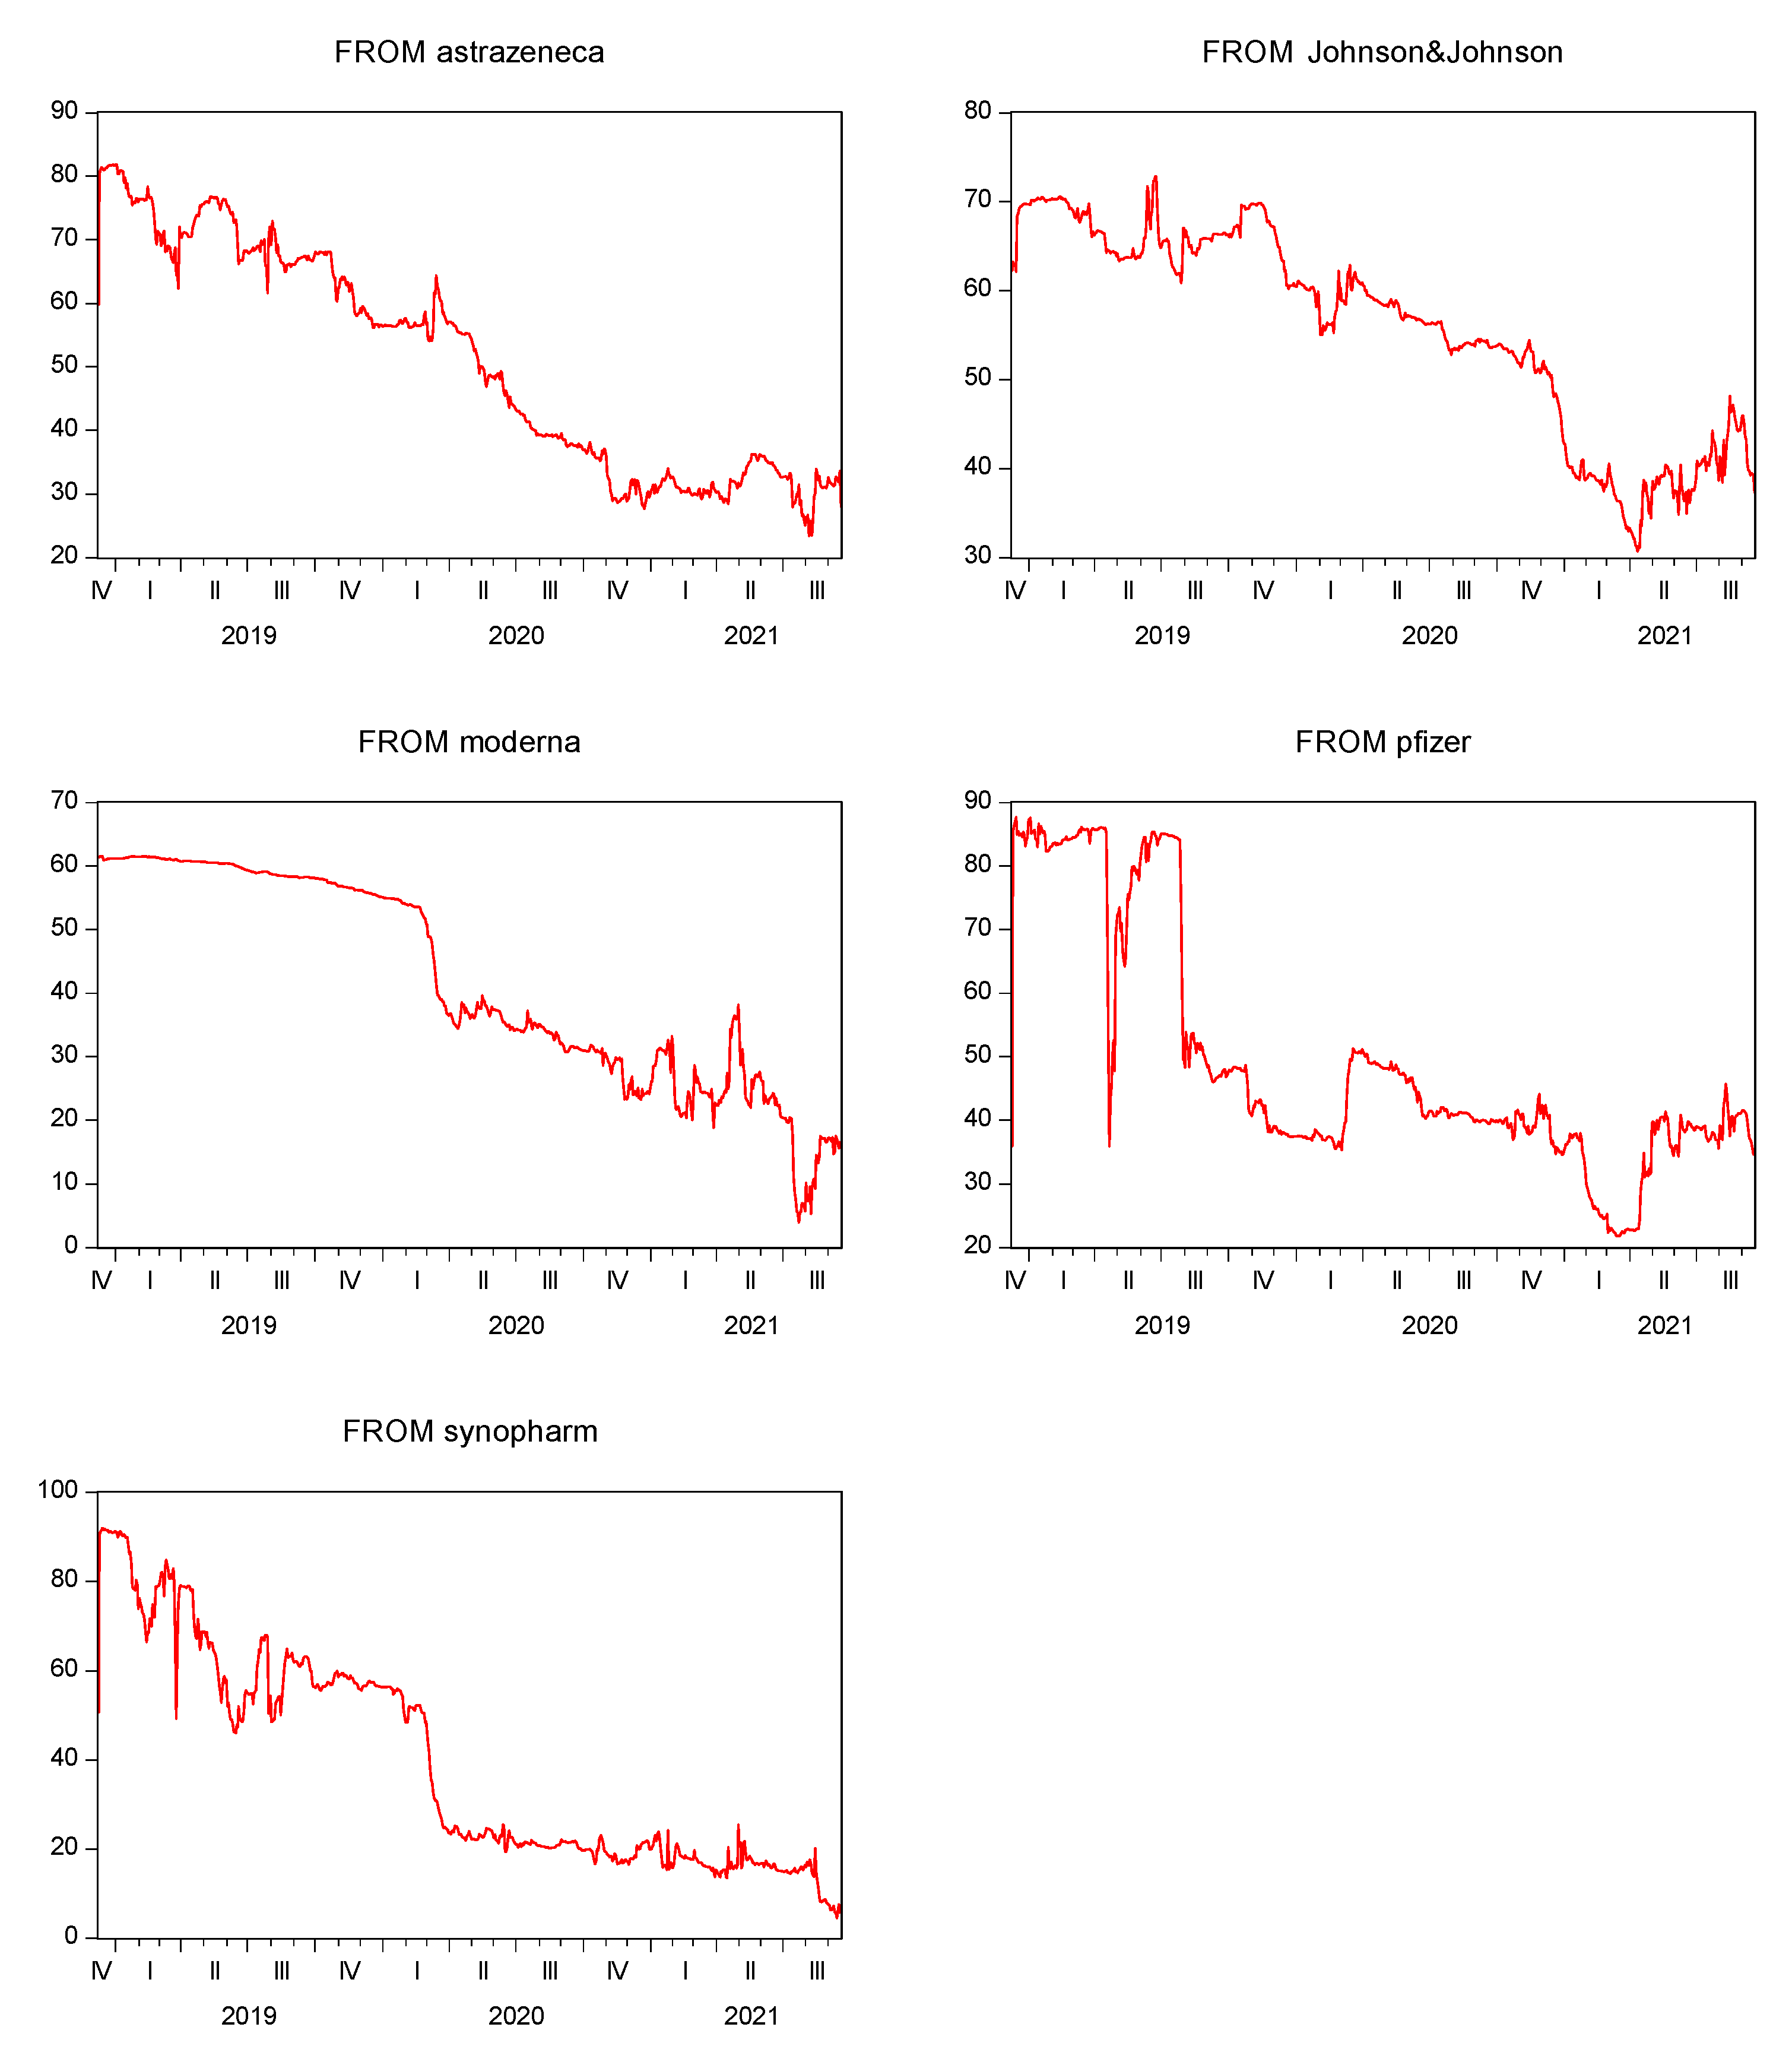
Figure 3 demonstrates the bi-directional volatility spillover between one stock return against the sum of other return series. The volatility transmission of AstraZeneca oscillates from the receiver to the contributor over the whole period. Specifically, AstraZeneca was a net volatility contributor during the February–June 2019 and February 2020–May 2021 periods. Johnson & Johnson was a profound net volatility transmitter during the period December 2018–February 2019. Notably, Moderna appears to be the most prominent net volatility contributor over time. Moderna receives a minor magnitude of spillover in the second quarter of 2020 and the second quarter of 2021. Conceivably, Moderna turns into a net volatility receiver due to the influence of AstraZeneca. Figure 3 shows that AstraZeneca is the only company that transmits volatility to Moderna.
Pfizer received a large spillover effect during the period from December 2018 to February 2020. Notably, in February 2021 Pfizer turns into a net volatility contributor, though the magnitude of spillover is minor. Moreover, AstraZeneca released the vaccine in February 2021; therefore, the transmission effect is likely to be conditional on the AstraZeneca vaccine authorization. Interestingly, Sinopharm is consistently a net volatility receiver over the sample period. Thus, Figure 3 affirms the previous findings that Sinopharm is the highest net volatility receiver, whereas Moderna is the most prominent net volatility transmitter.
Figure 3 demonstrates the volatility transmission from one company to another company.
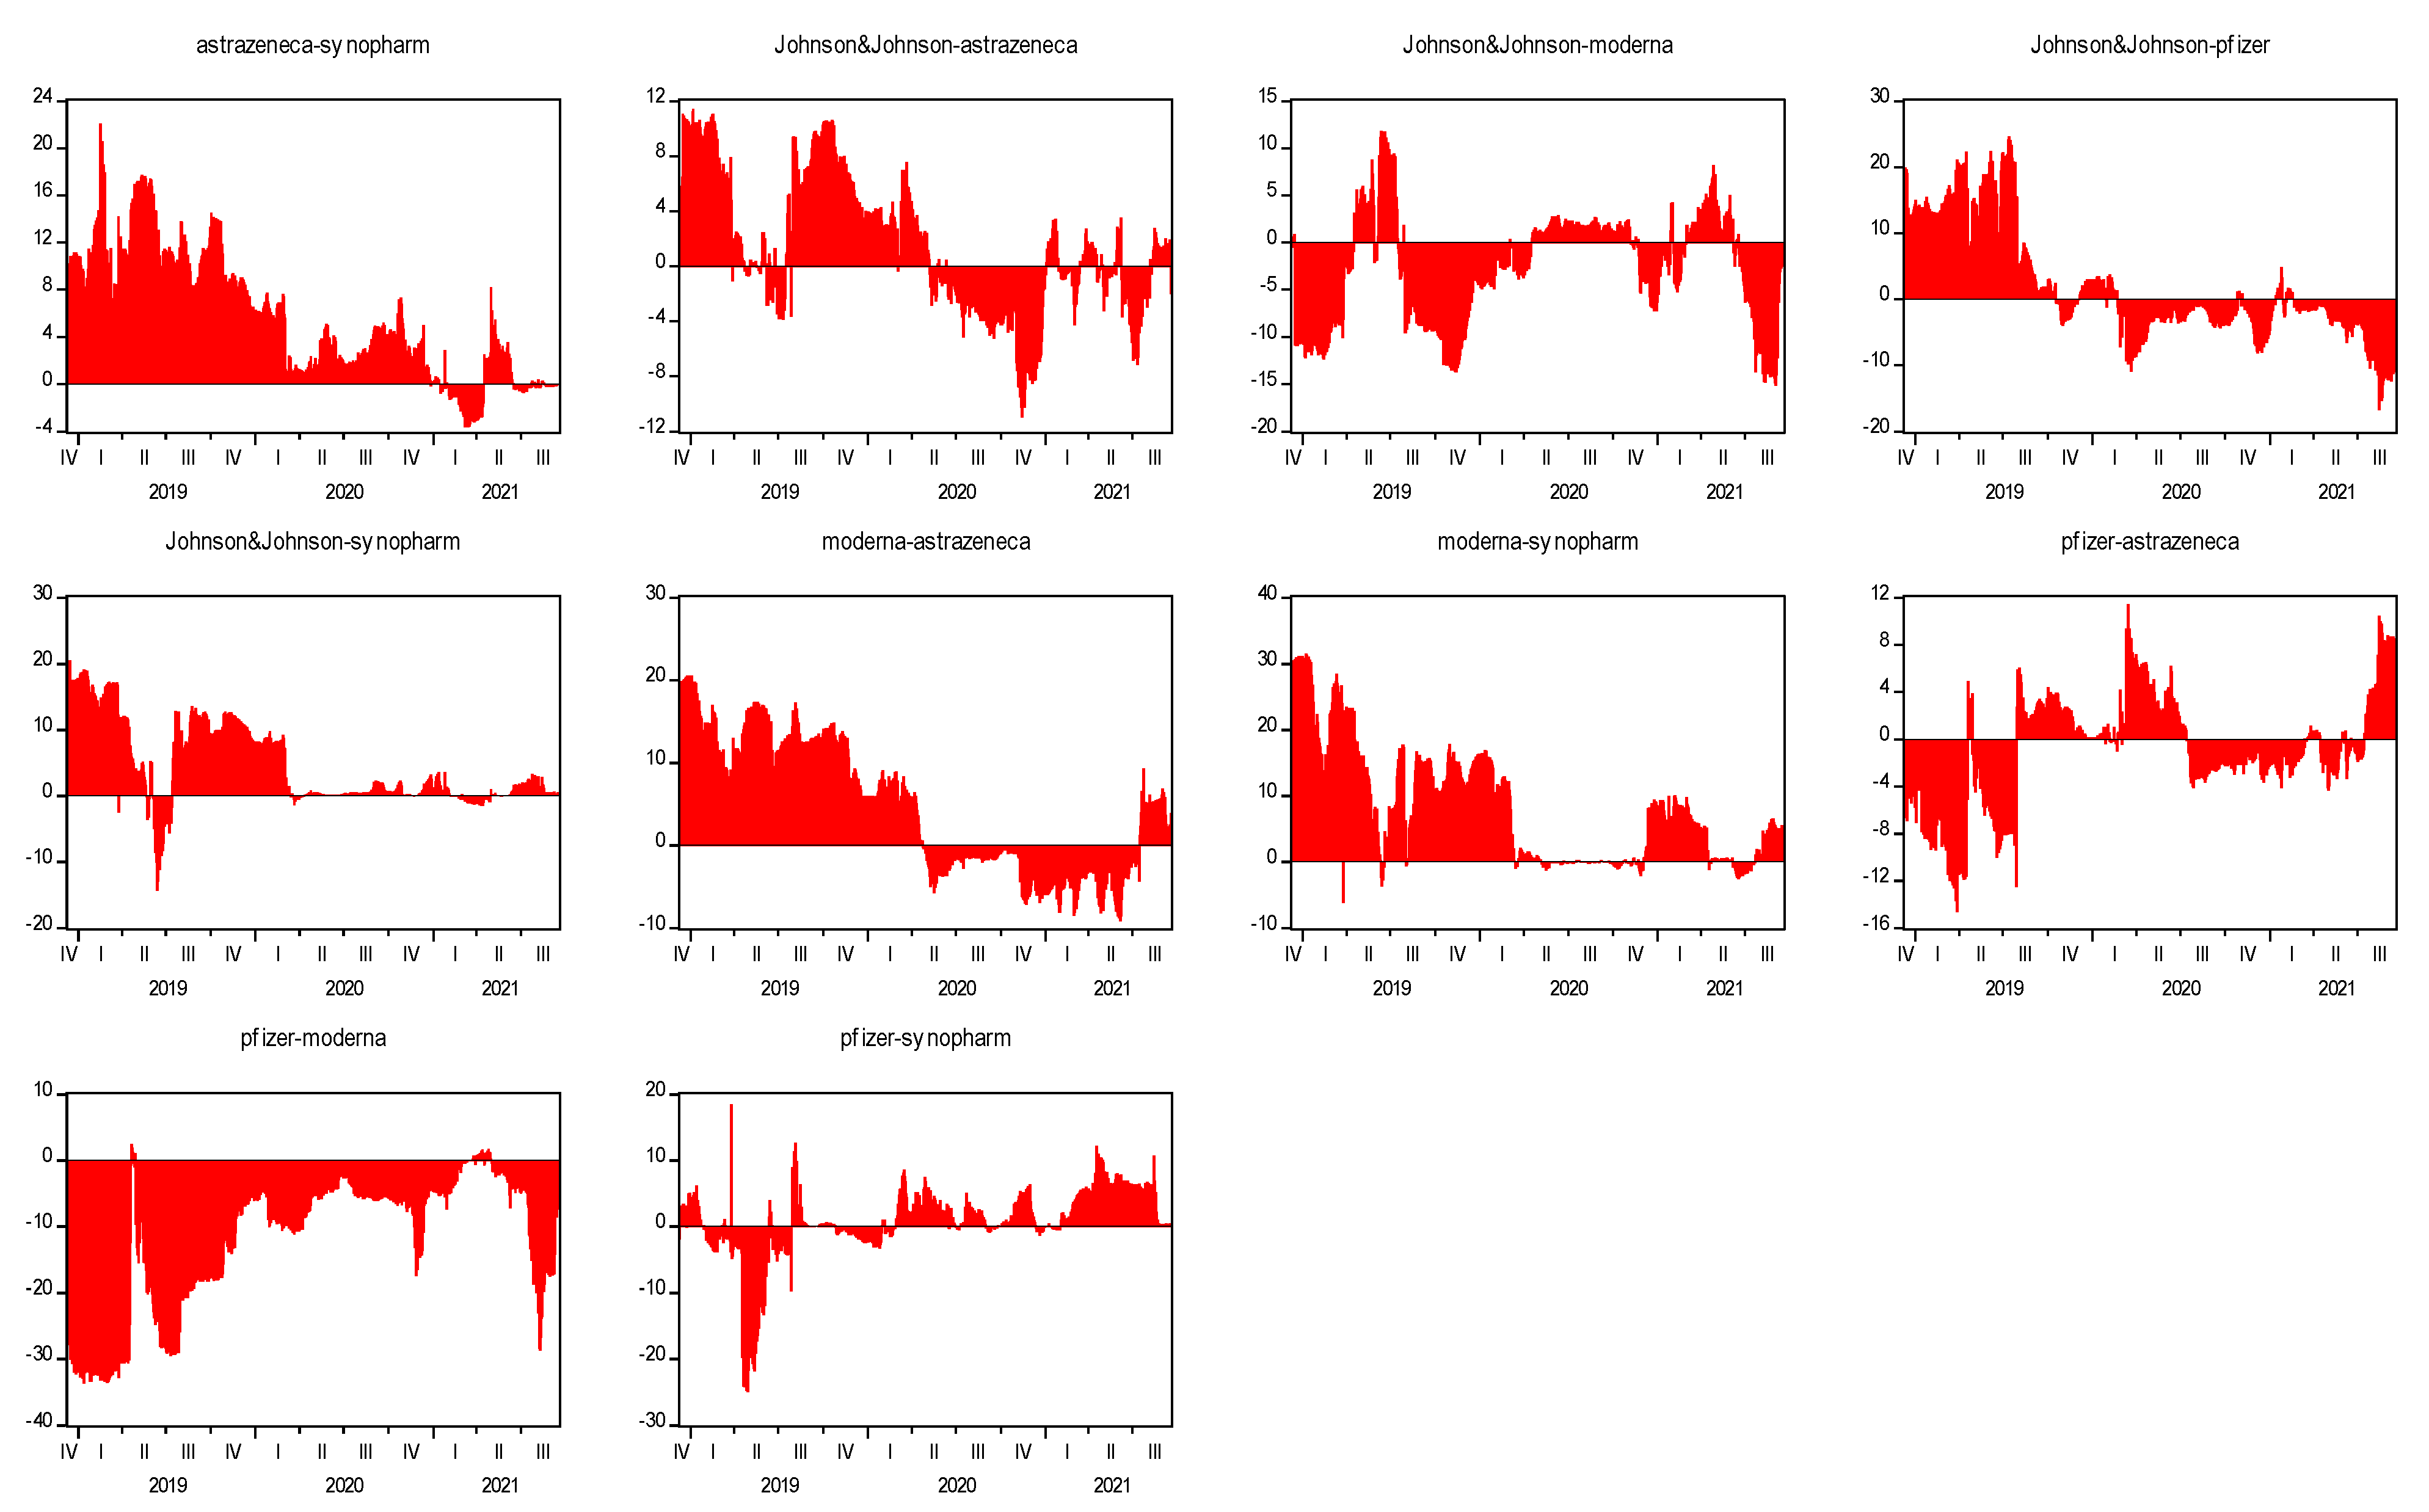
Figure 4 shows the bi-directional frequency connectedness between two stock returns. AstraZeneca appears as a net volatility transmitter to Sinopharm. Expectedly, most of the time Moderna significantly contributes to the volatility of AstraZeneca and Sinopharm. However, Moderna turns into a net volatility receiver from AstraZeneca in the period from the second quarter of 2020 to the second of quarter 2021. Notably, Pfizer is highly influenced by Moderna over the whole sample period. Additionally, Appendix A confirms these findings by demonstrating volatility spillovers transmission from and to every vaccine-producing company.
3.2. Cross-Quantile Dependence
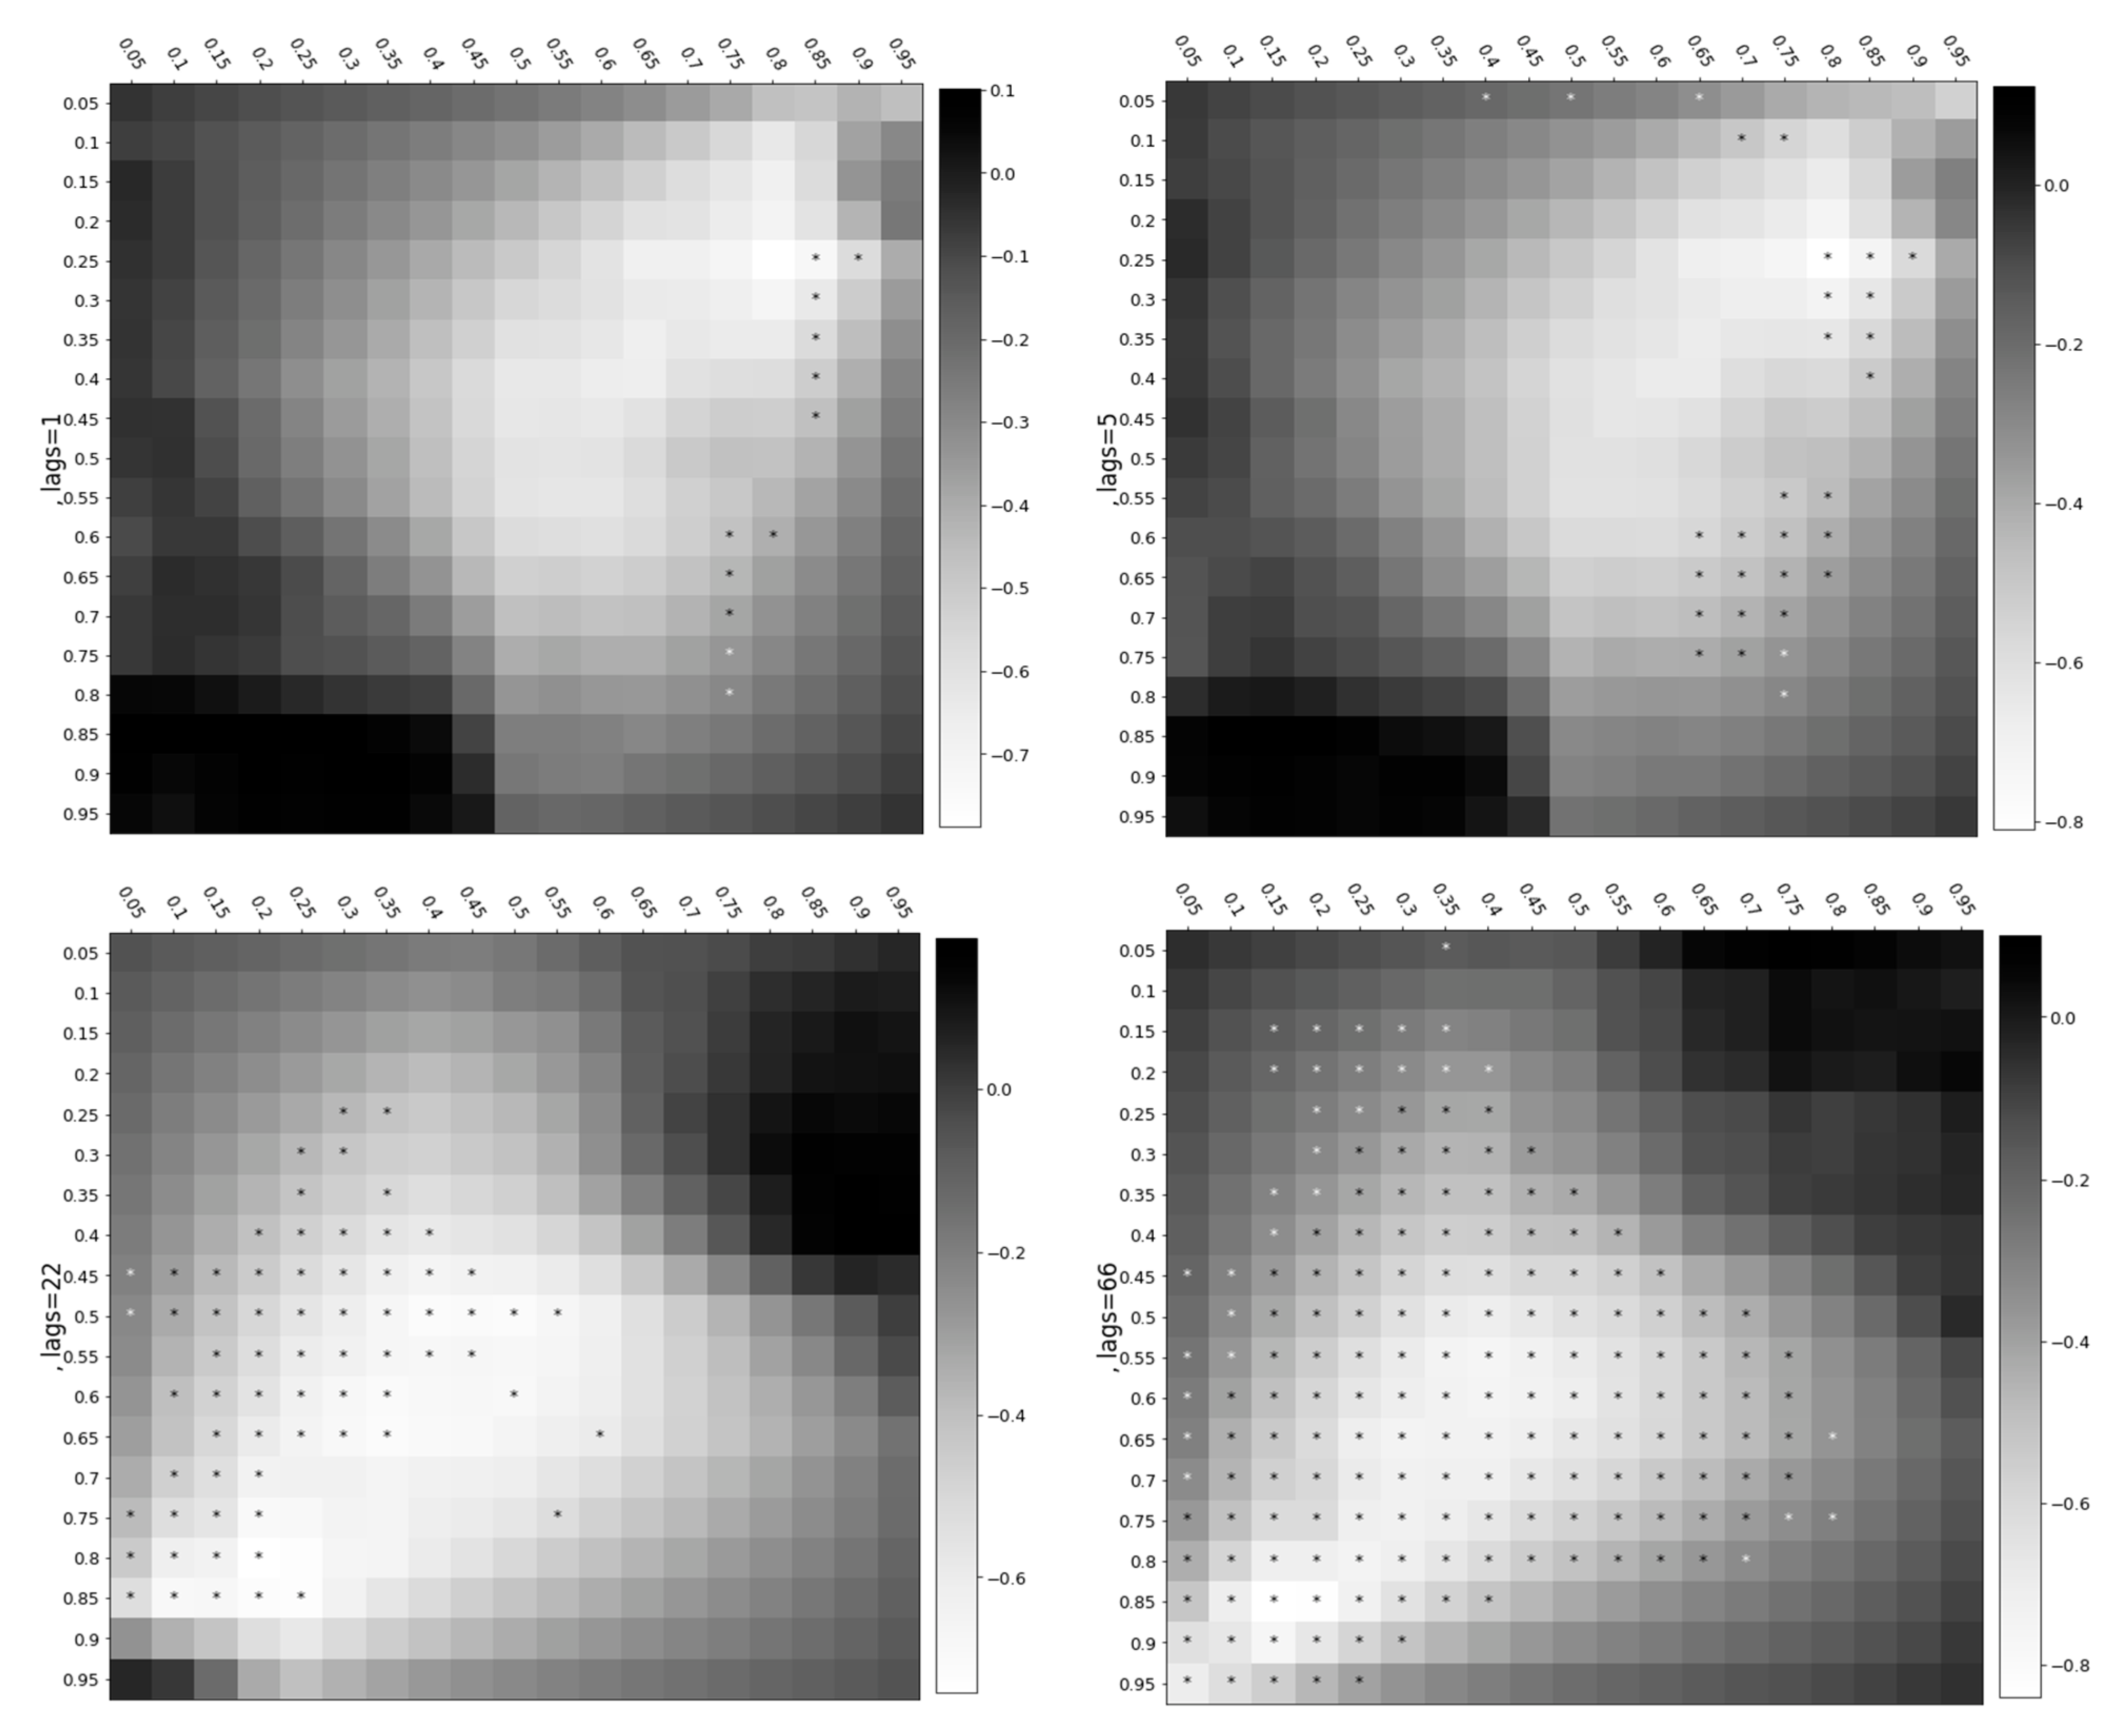
This section represents the results of the cross-quantile dependence conducted in the Python software in the form of a heatmap matrix, considering the short and long term. Due to the long period of high-frequency and highly volatile observation, a 5% quantile is considered. The heatmap consists of white and black squares as shown in the cross-dependence figures, where the white squares indicate lower or negative degrees, whereas the black squares signify the highest degrees of dependence or positive correlation. In addition, the star sign indicates a 10% significance level.
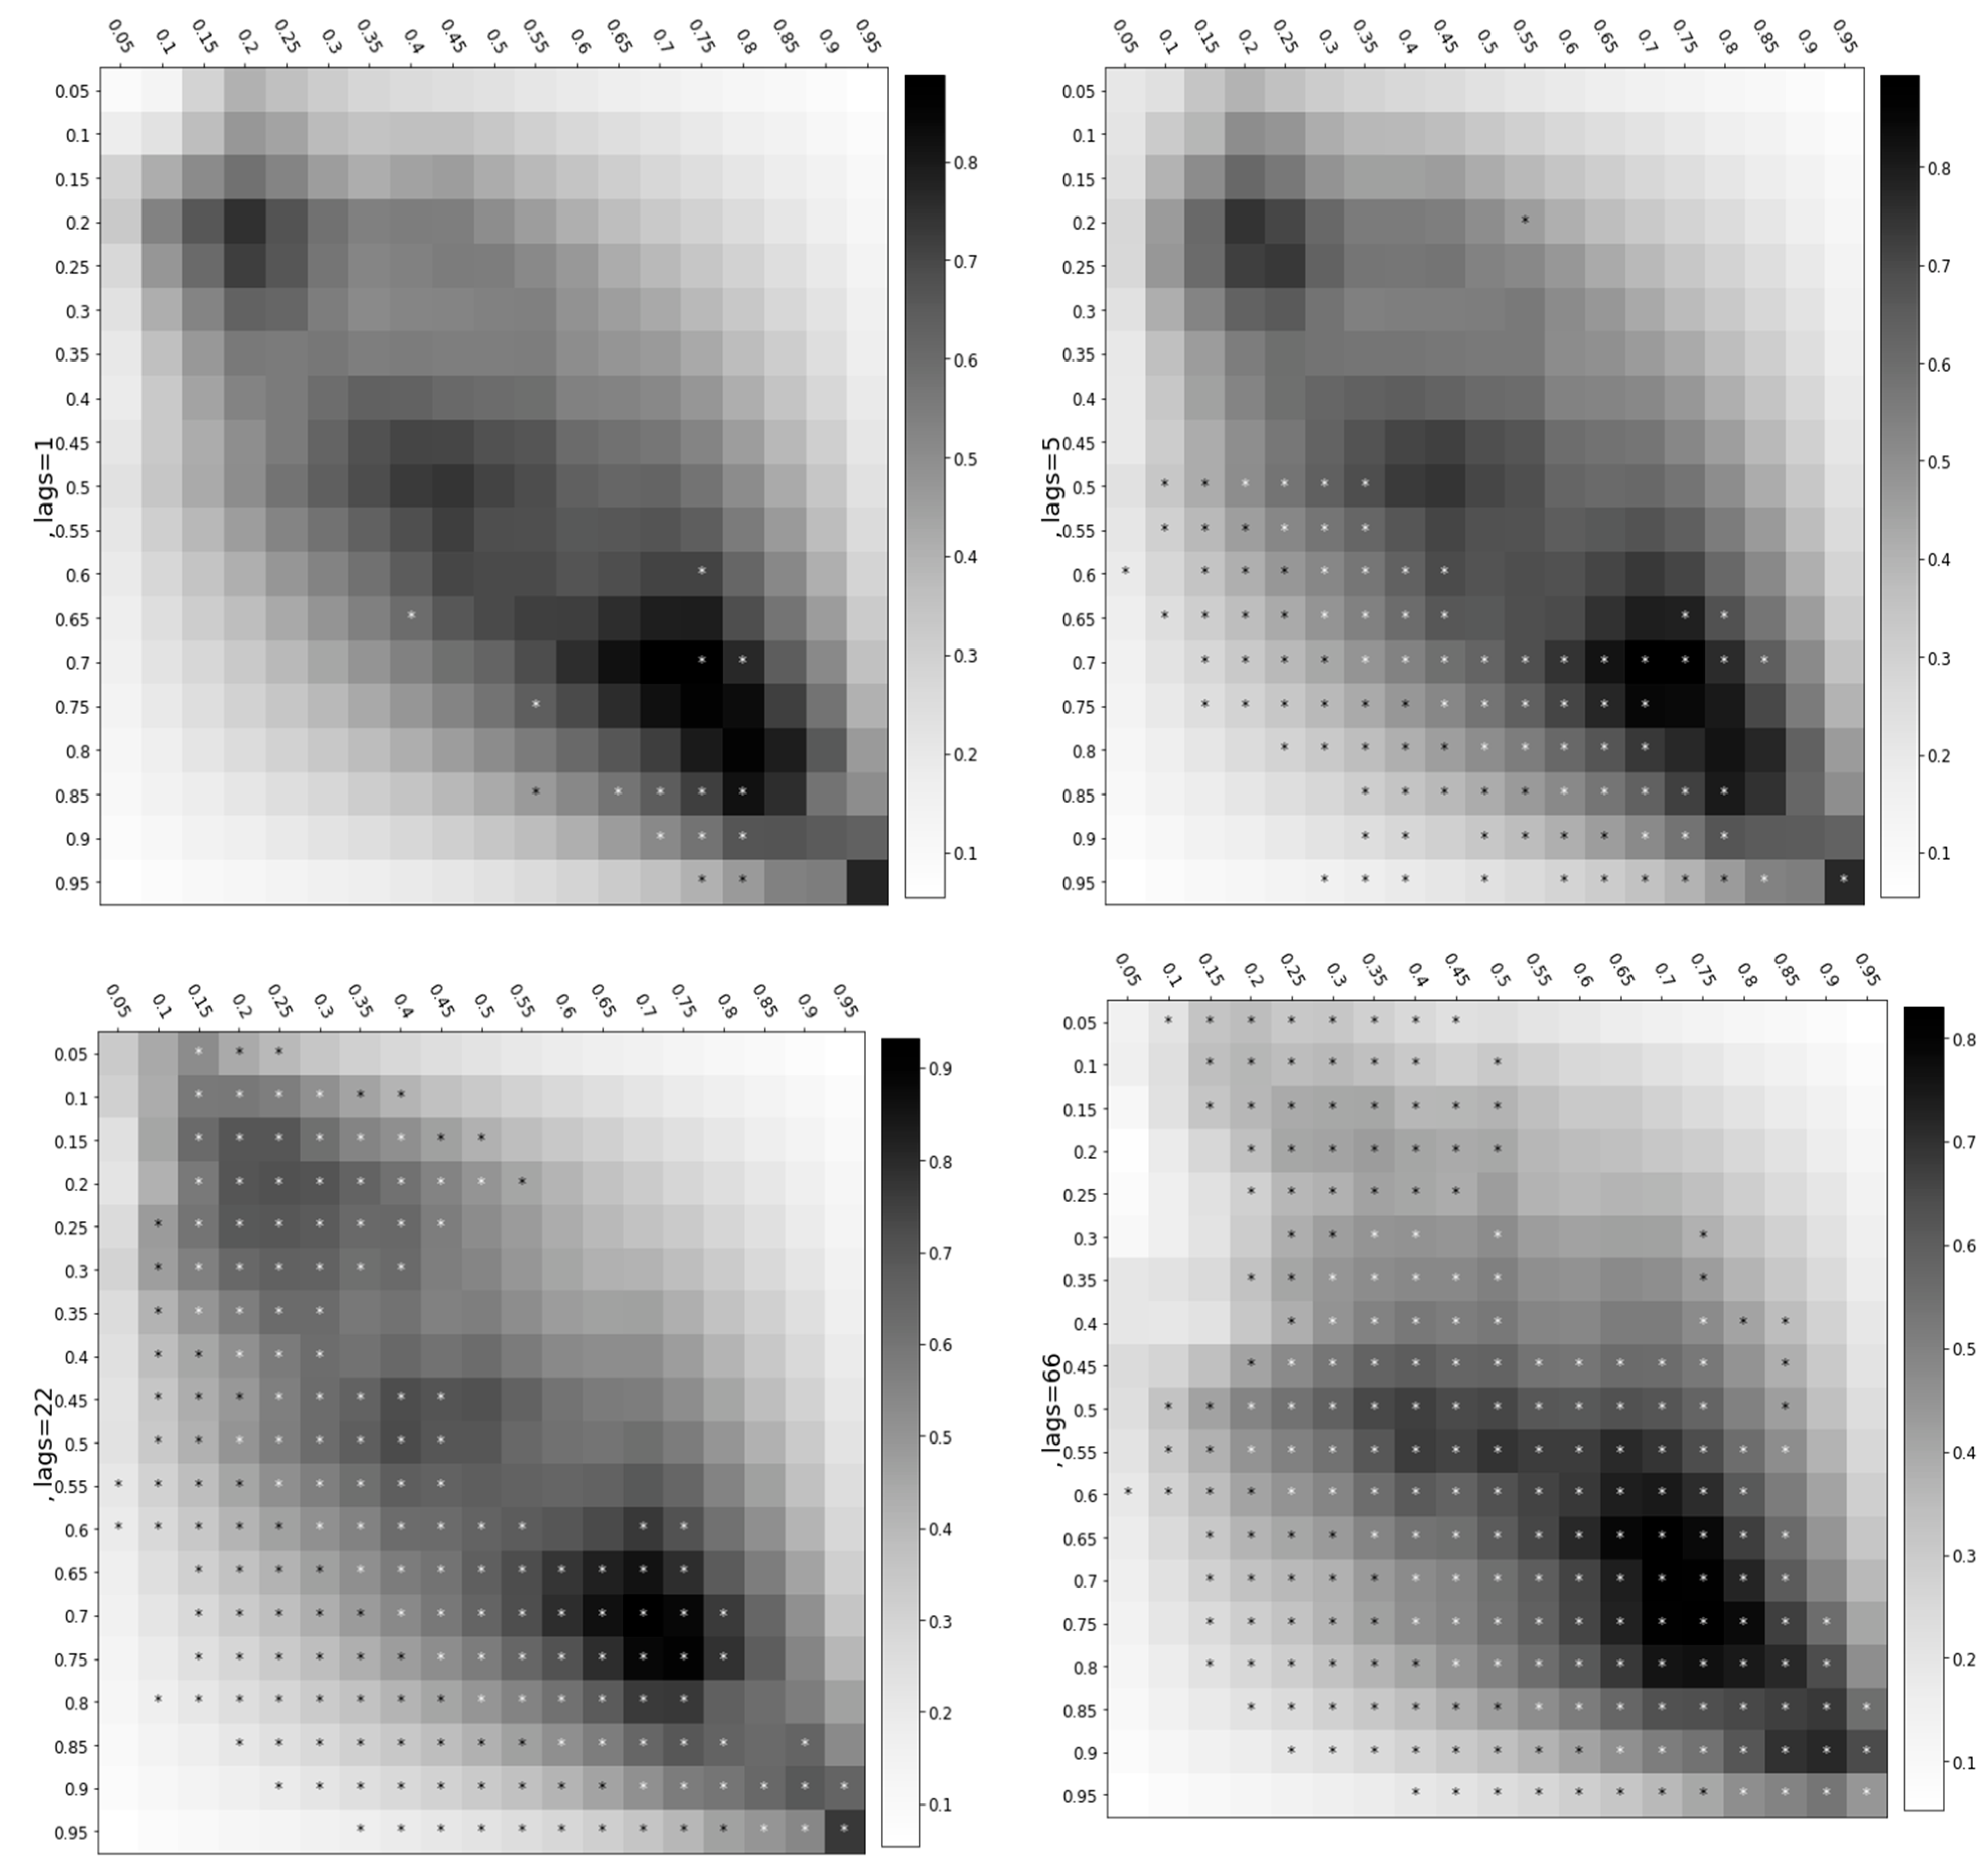
Figure 5 demonstrates the cross-quantilogram dependence from AstraZeneca to Sinopharm. The lower quantiles are interpreted as bearish conditions and the higher quantiles as bullish conditions. As for the heatmap matrix with a 1-day lag, the results show a few significant squares under the higher quantiles of AstraZeneca and middle quantiles of Sinopharm. As per the heatmap matrix with a 5-day lag, more significant squares are observed compared with the one-day lag heatmap matrix. The volatility spillover from AstraZeneca to Sinopharm is pronounced under the bullish market conditions. AstraZeneca under the lower quantiles transmits a strong negative spillover to Sinopharm under the highest quantiles. In both the 1-day and 5-day lags, we observe a negative association, thus implying that AstraZeneca transmits a negative spillover to Sinopharm.
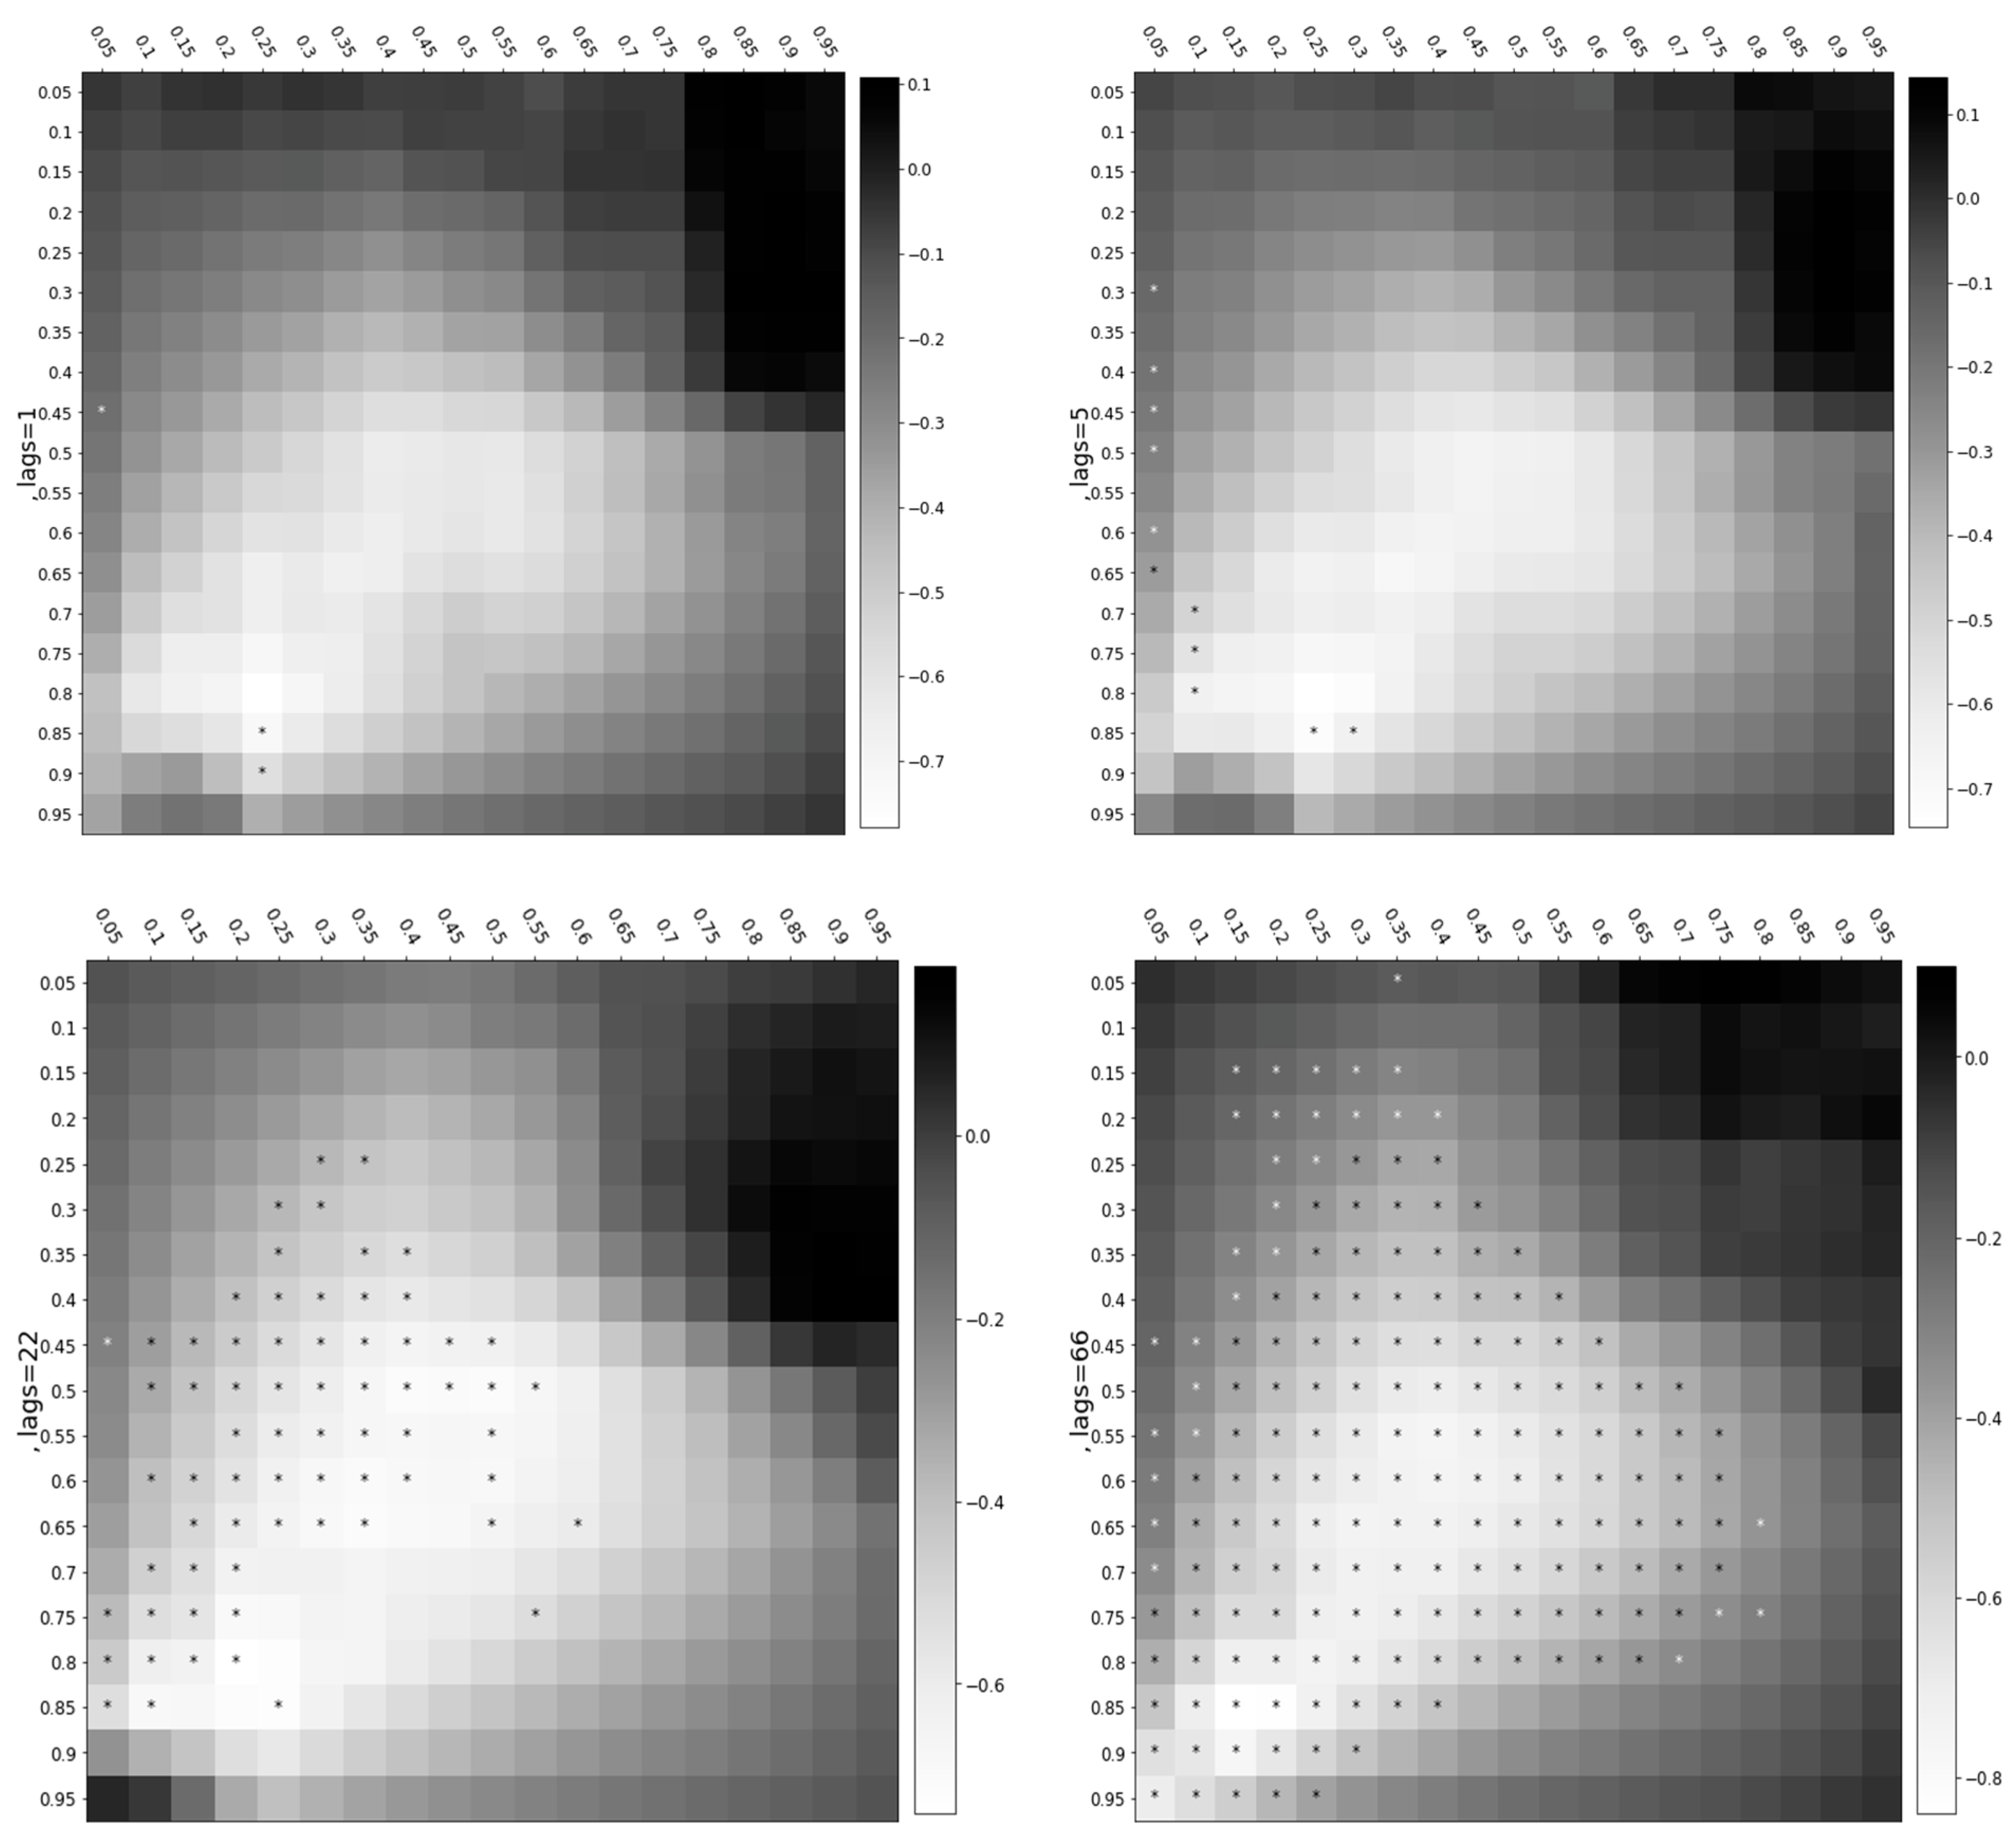
Figure 6 demonstrate the cross-quantile dependence from Sinopharm to AstraZeneca. The heatmap matrix demonstrates that Sinopharm under the middle and higher quantiles transmits a negative volatility spillover to AstraZeneca under the lower quantiles. It is also noteworthy that Sinopharm under the lowest and middle quantiles transmits a significant negative volatility spillover to AstraZeneca under the middle and higher quantiles. The impact turns out to be more pronounced when longer lags are considered.
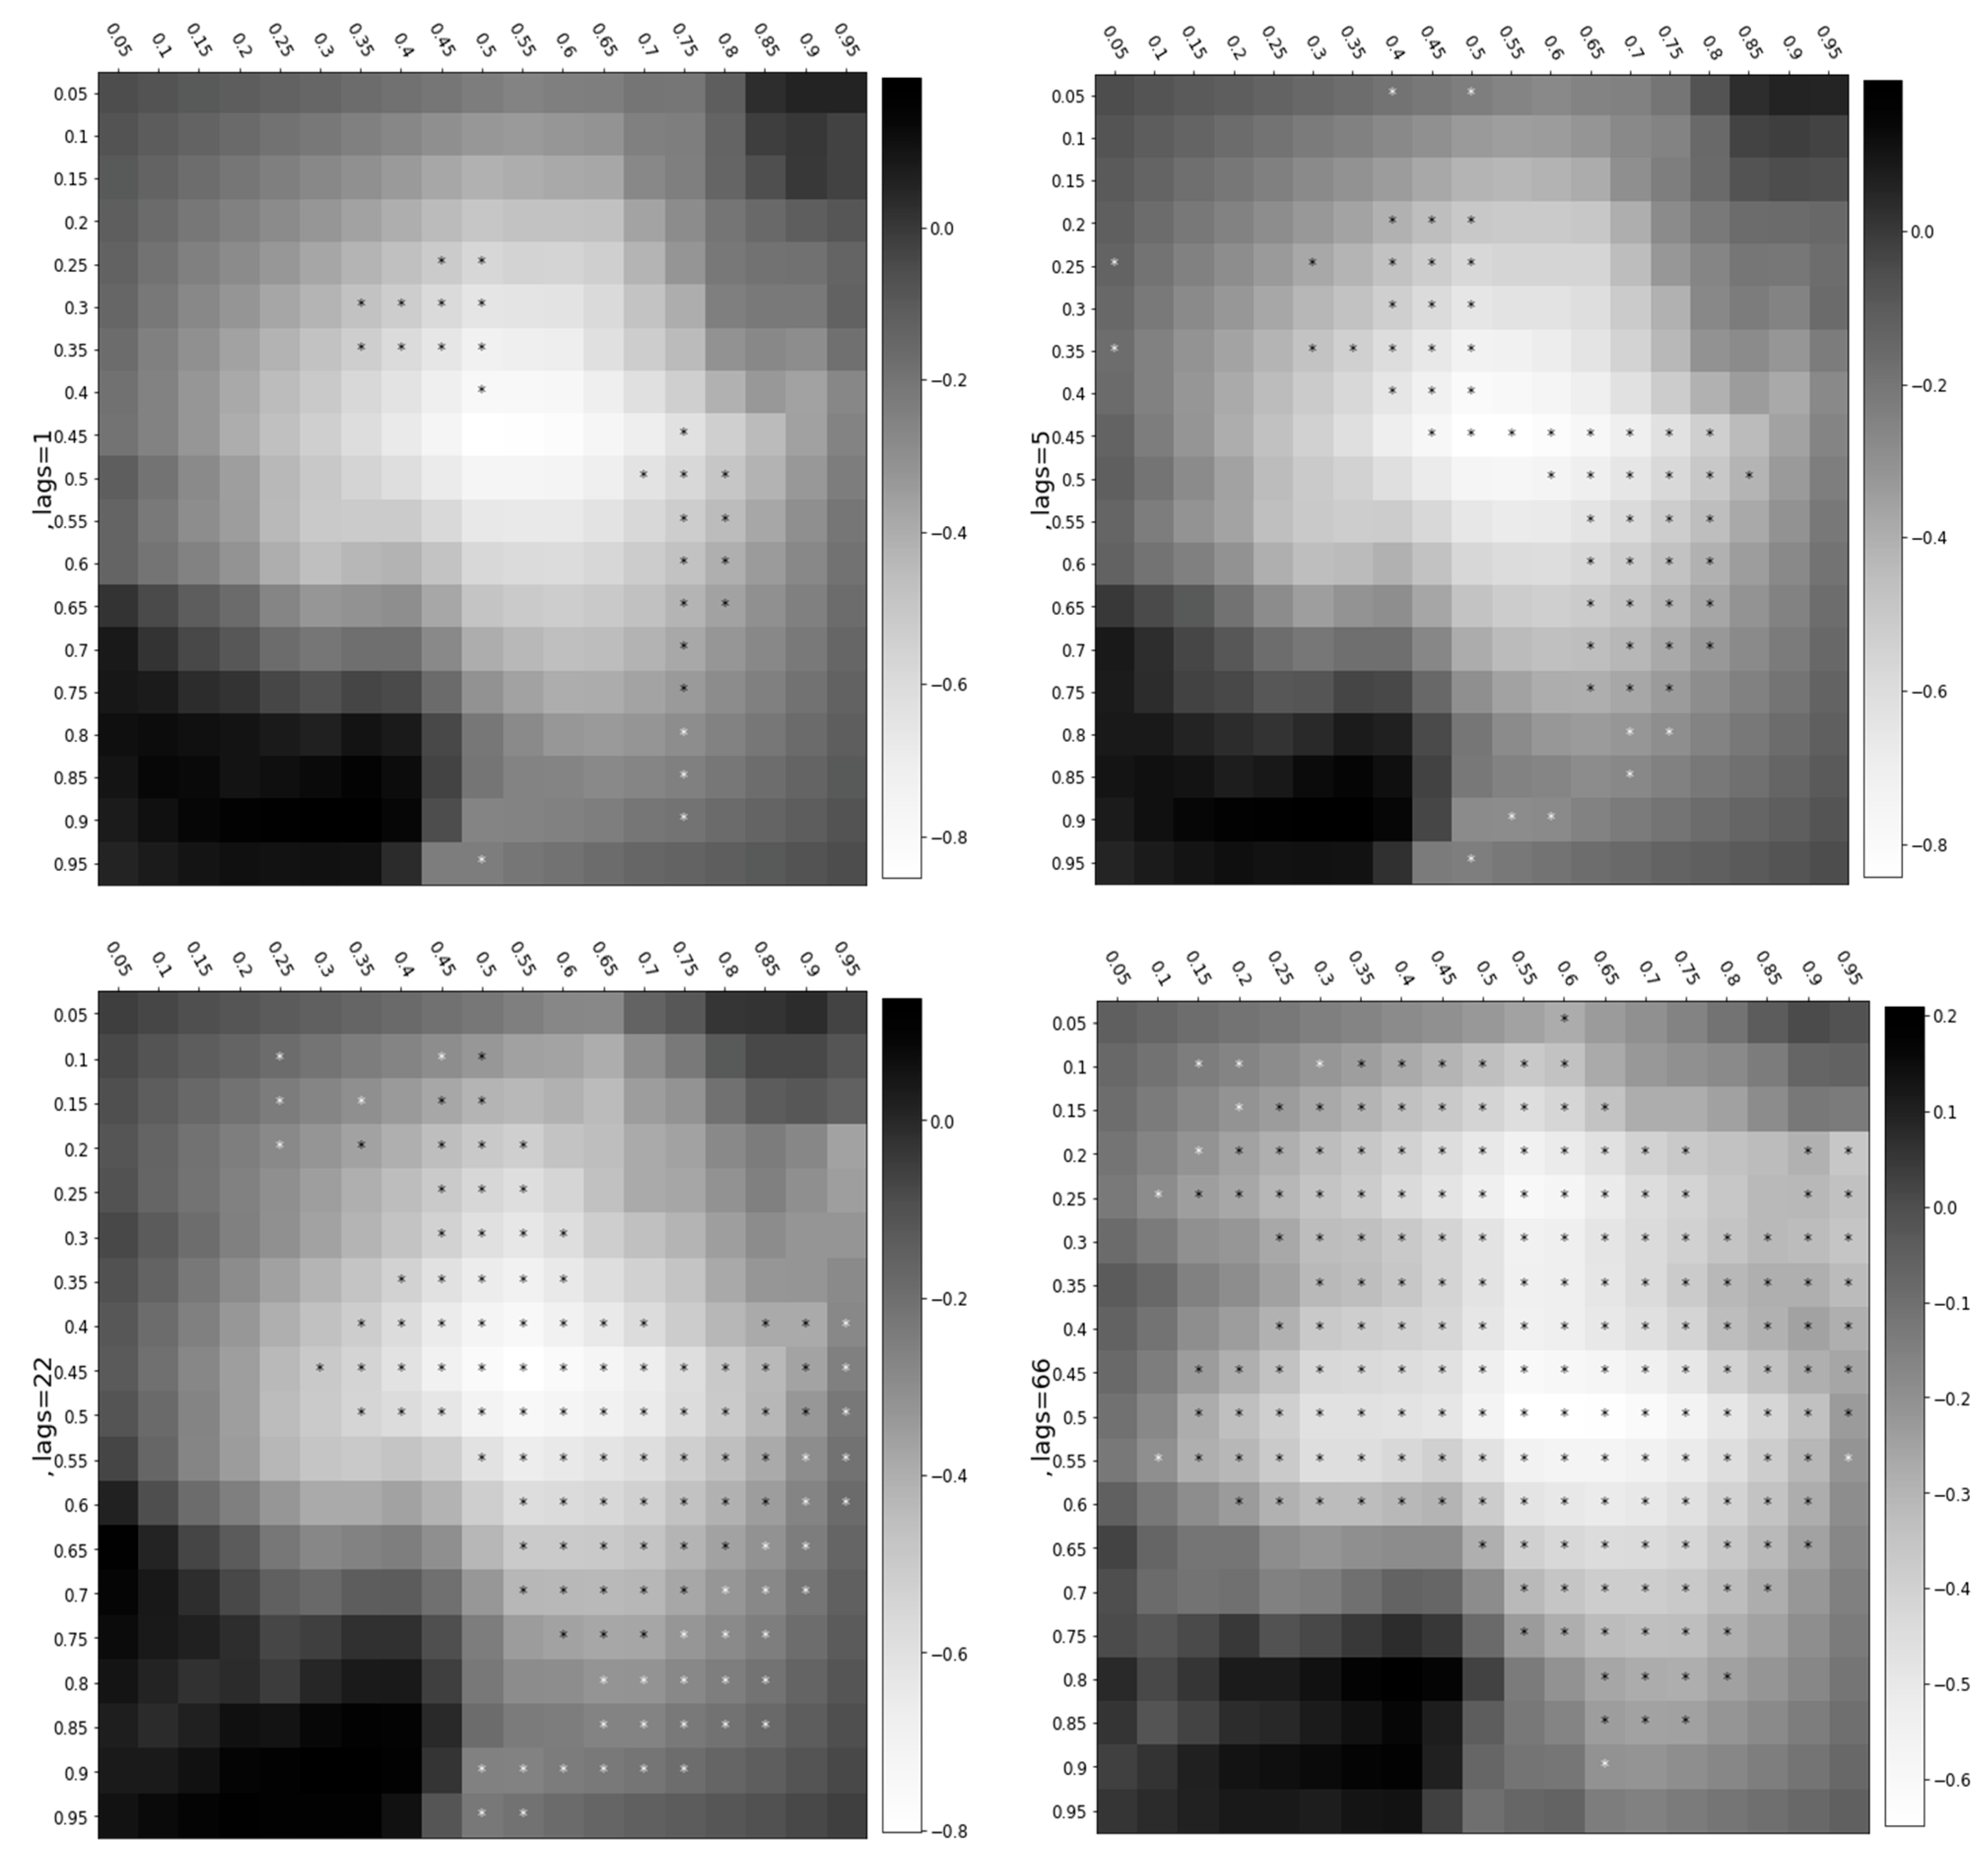
Figure 7 demonstrates the cross-quantile dependence from Johnson & Johnson to Pfizer. Mainly a positive correlation between these two companies is observed. The heatmap matrix with a 1-day lag has no significant squares, whereas the 5-day lag heatmap matrix shows one significant square under bullish market conditions and indicates a substantial positive spillover. Figure 7 shows a larger number of significant squares under the highest quantiles when considering the longer term.
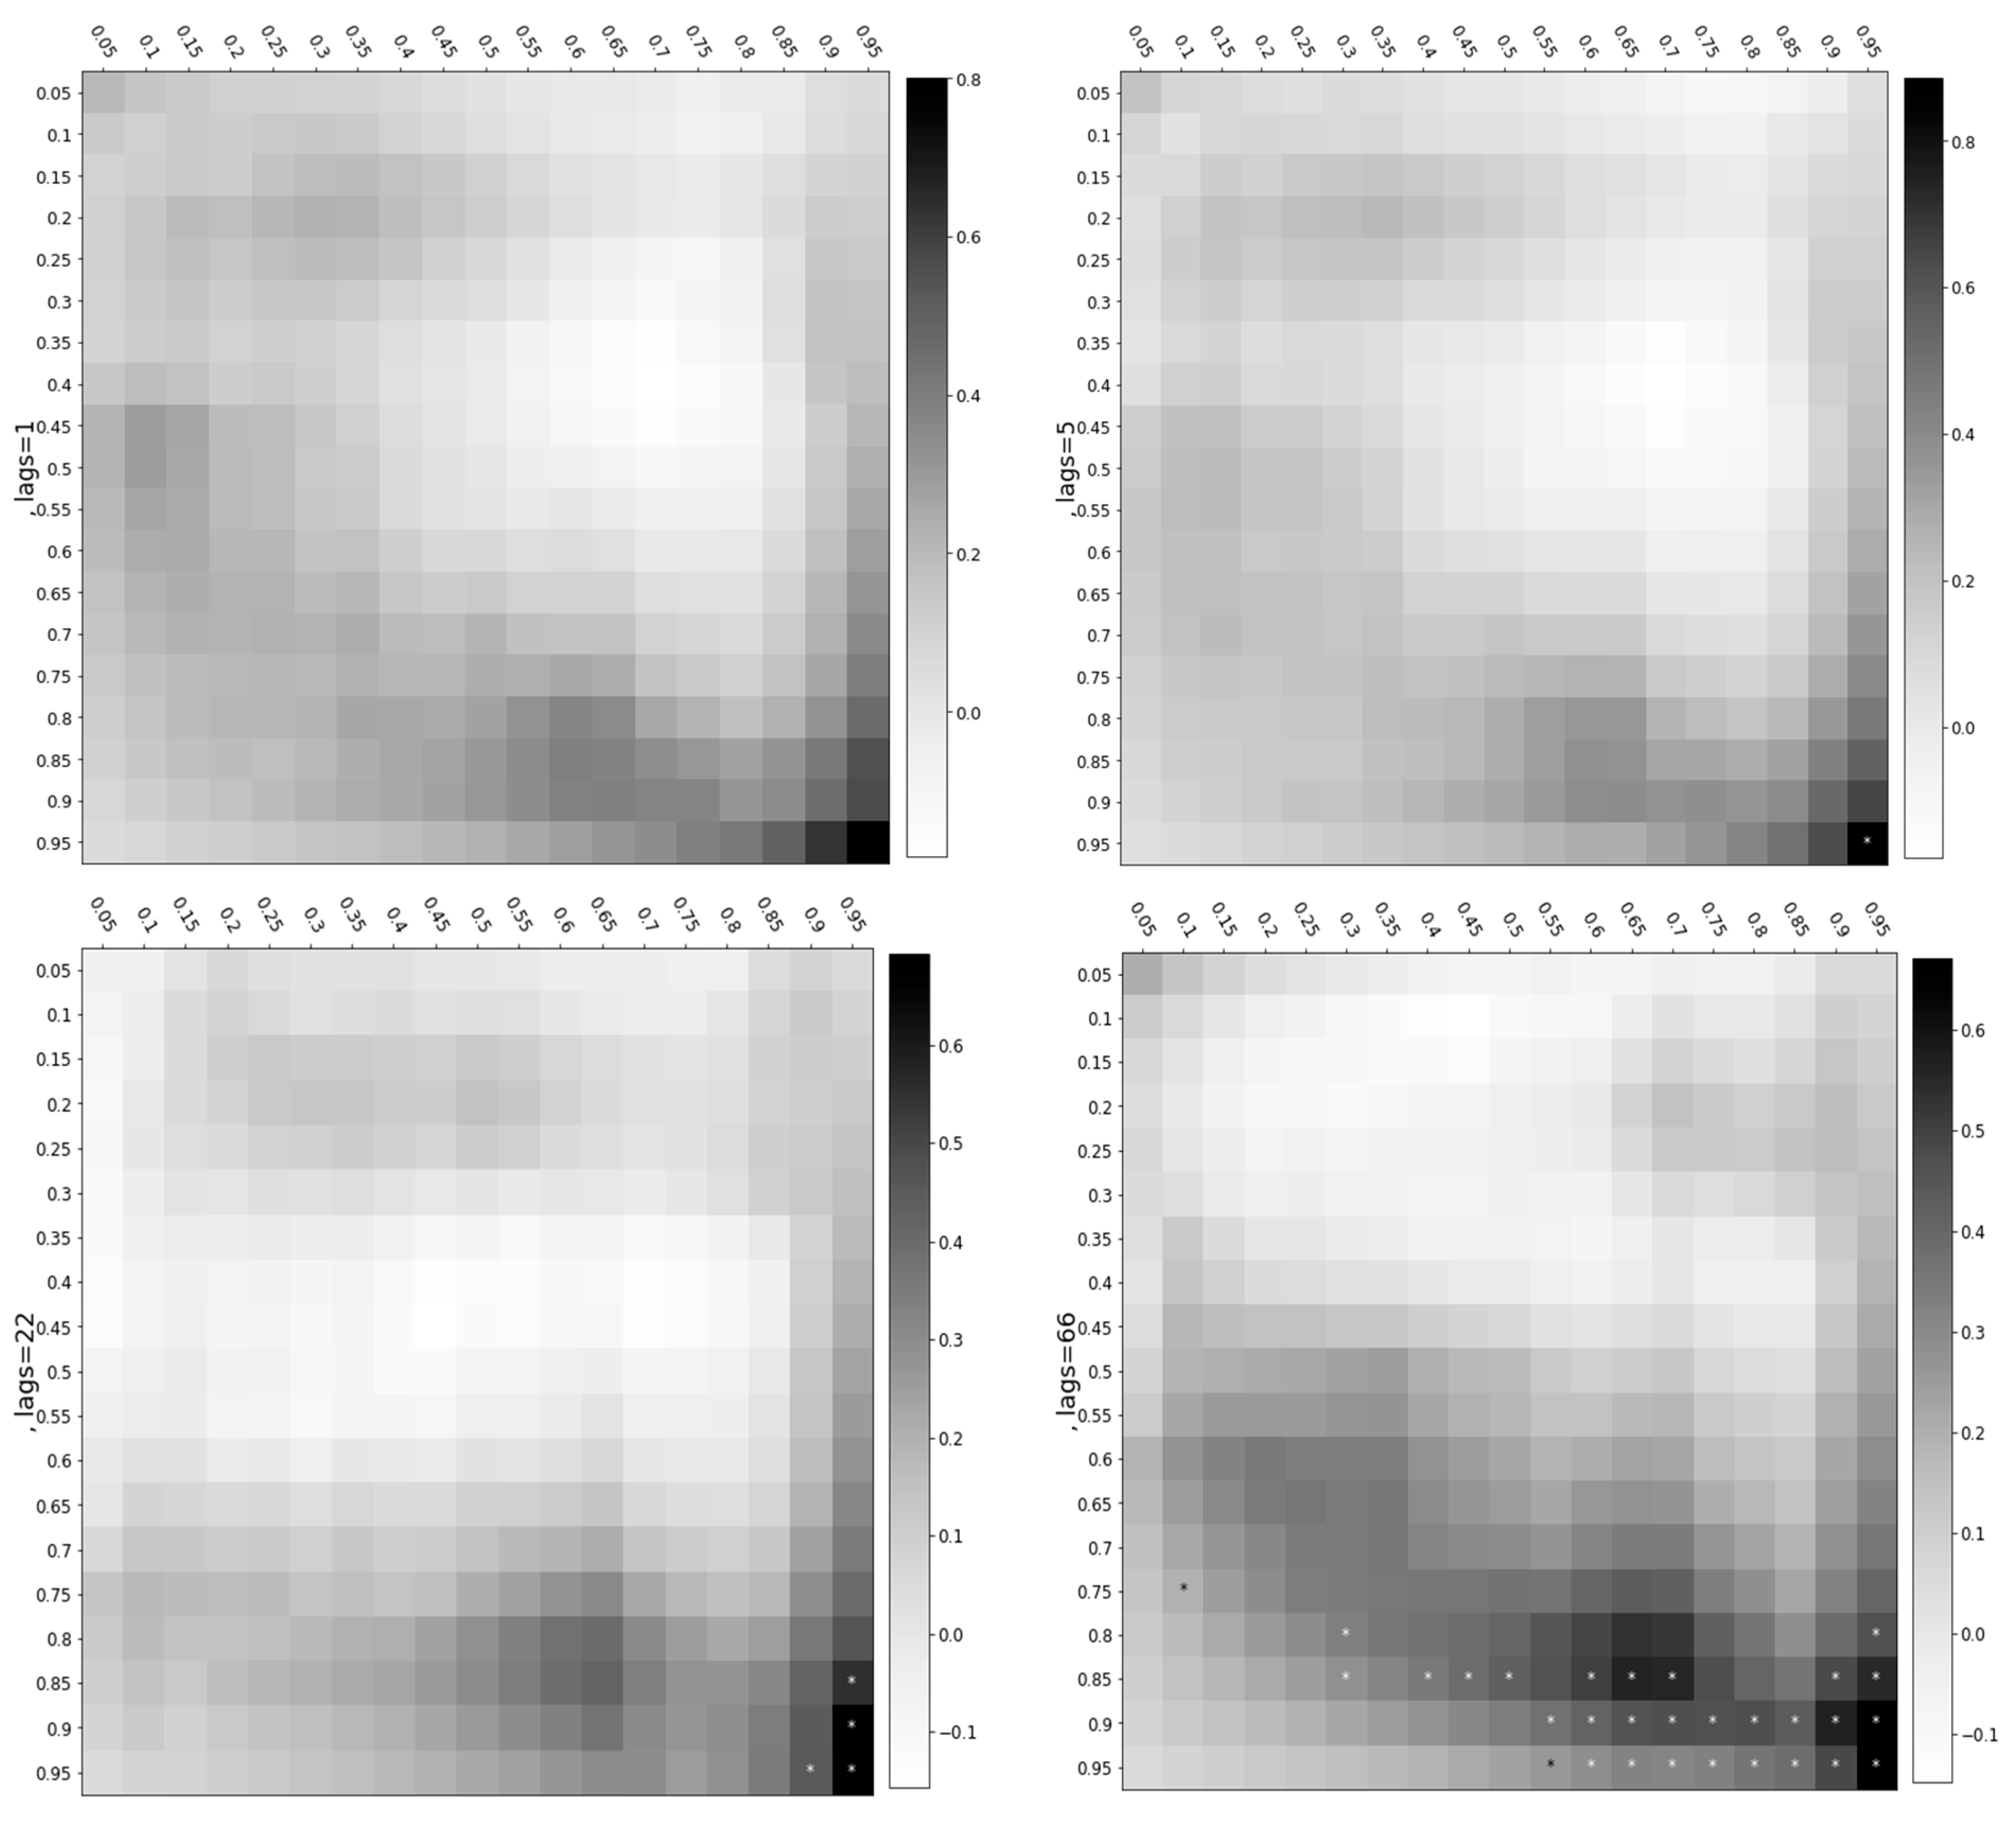
Figure 8 demonstrates the volatility spillover from Moderna to Pfizer. The volatility of this spillover is only significant under the highest quantiles of both variables, underscoring the significance during bullish market conditions. Moreover, the significant squares mostly indicate a strong positive correlation, thus implying that the magnitude of the positive spillover from Moderna to Pfizer is substantial. The number of significant squares increases when considering longer lags.
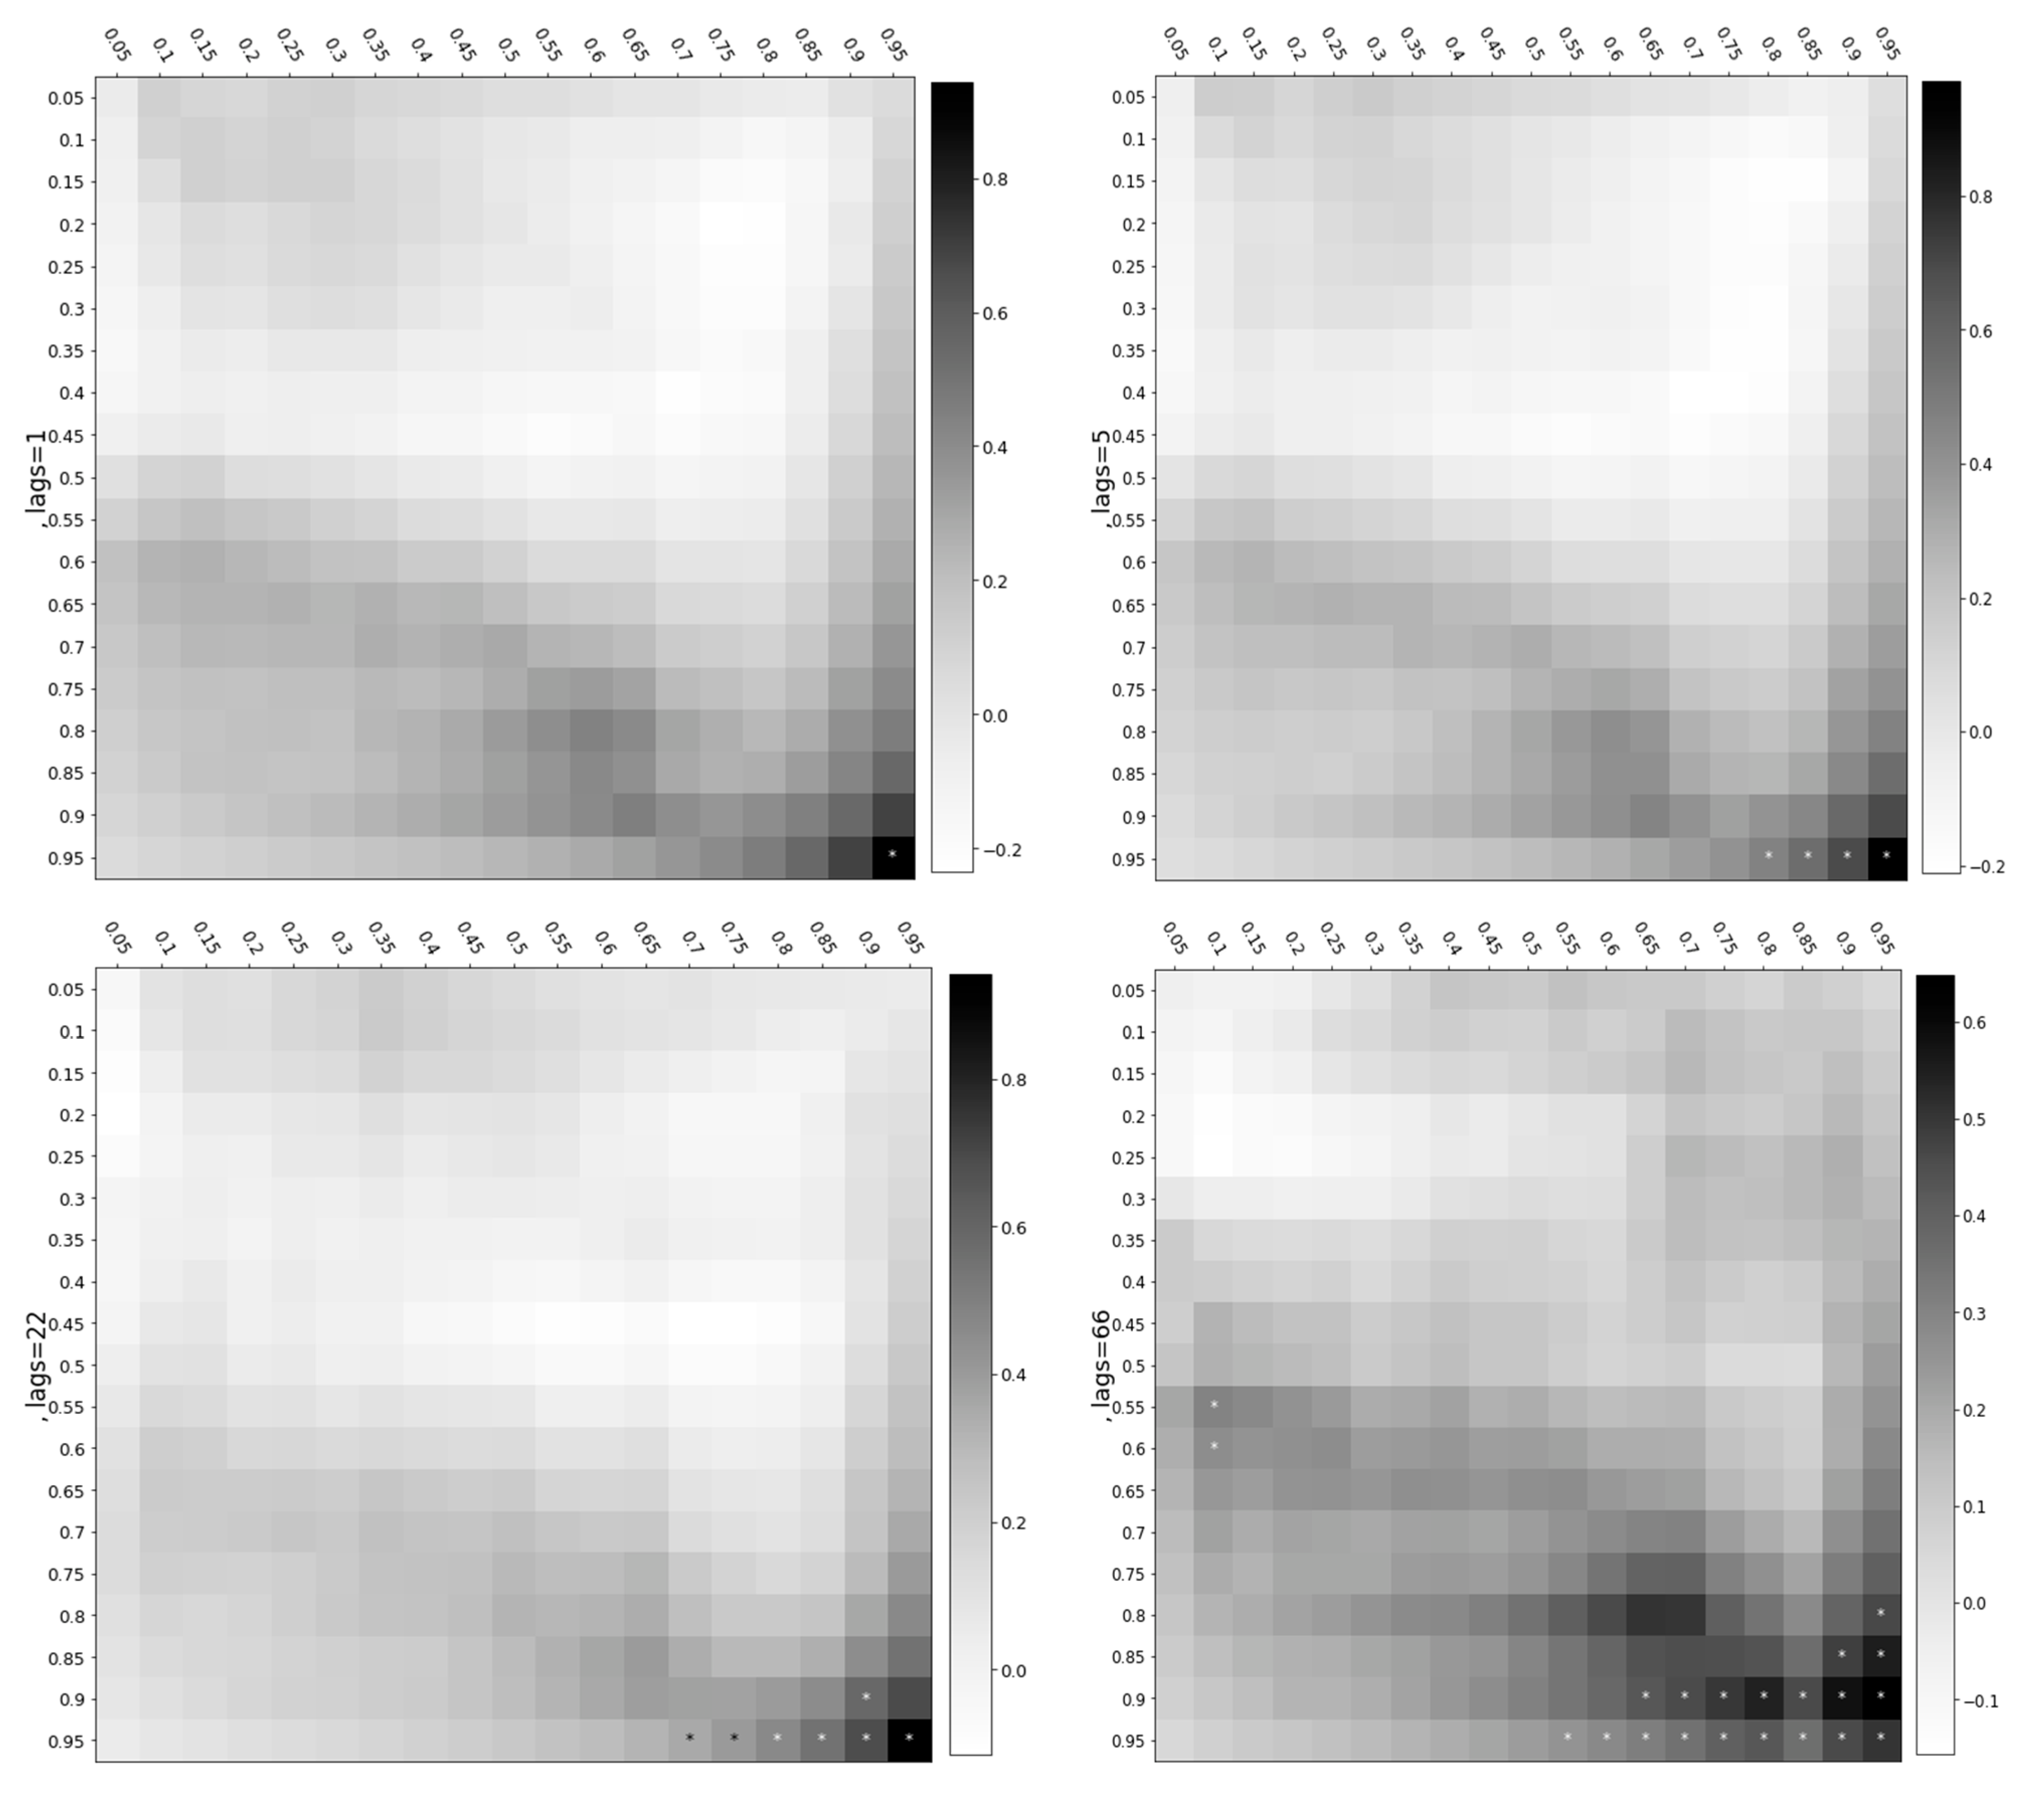
Figure 9 shows the cross-quantile dependence from Moderna to AstraZeneca. This spillover becomes more profound when considering longer memories. In the short term (the 1-day and 5-day lags), Figure 9 demonstrates that Moderna under the middle and higher quantiles transmits volatility spillover to AstraZeneca under almost all quantiles. In the long term, a larger number of significant squares with a positive correlation is observed.
Figure 10 demonstrates the volatility spillover transmission from Moderna to Johnson & Johnson. When considering longer memories, more significant squares are observed. The results for the short term (the 1 day and 5 days) show a positive correlation under bullish market conditions, whereas the results for the long term show a positive correlation under both the bullish and bearish market conditions. Moderna transmits the most profound effect in the long term.
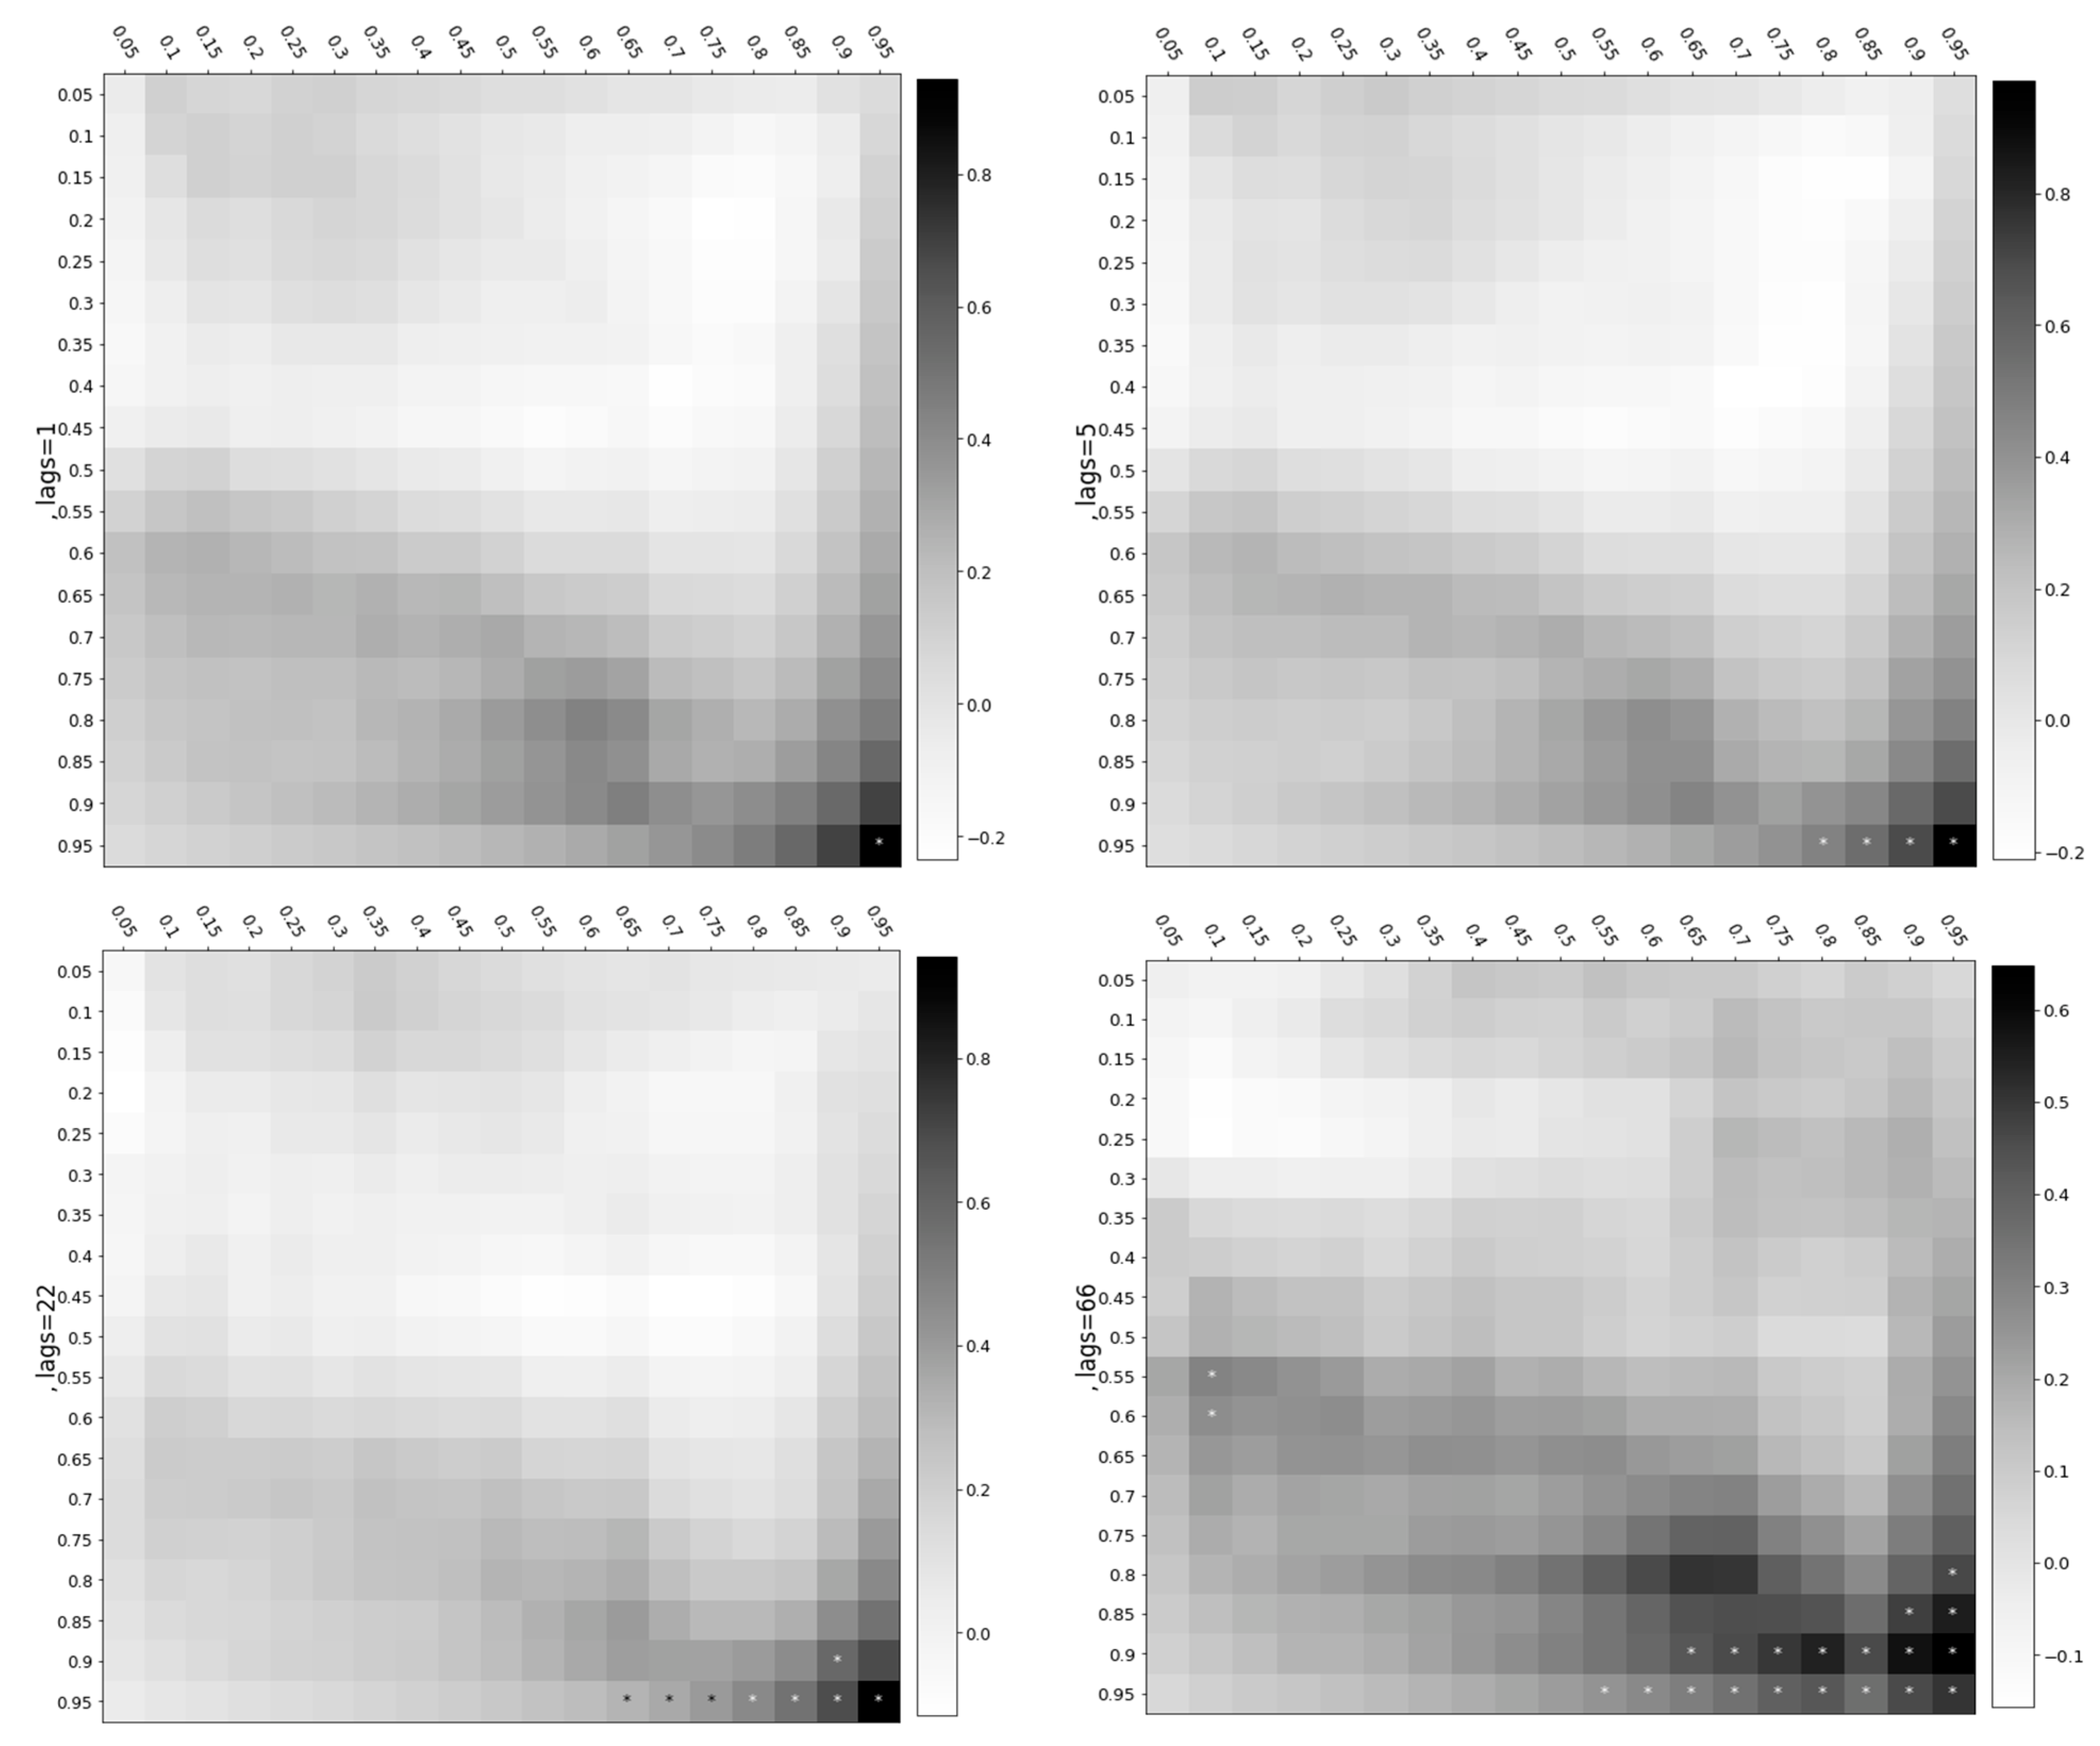
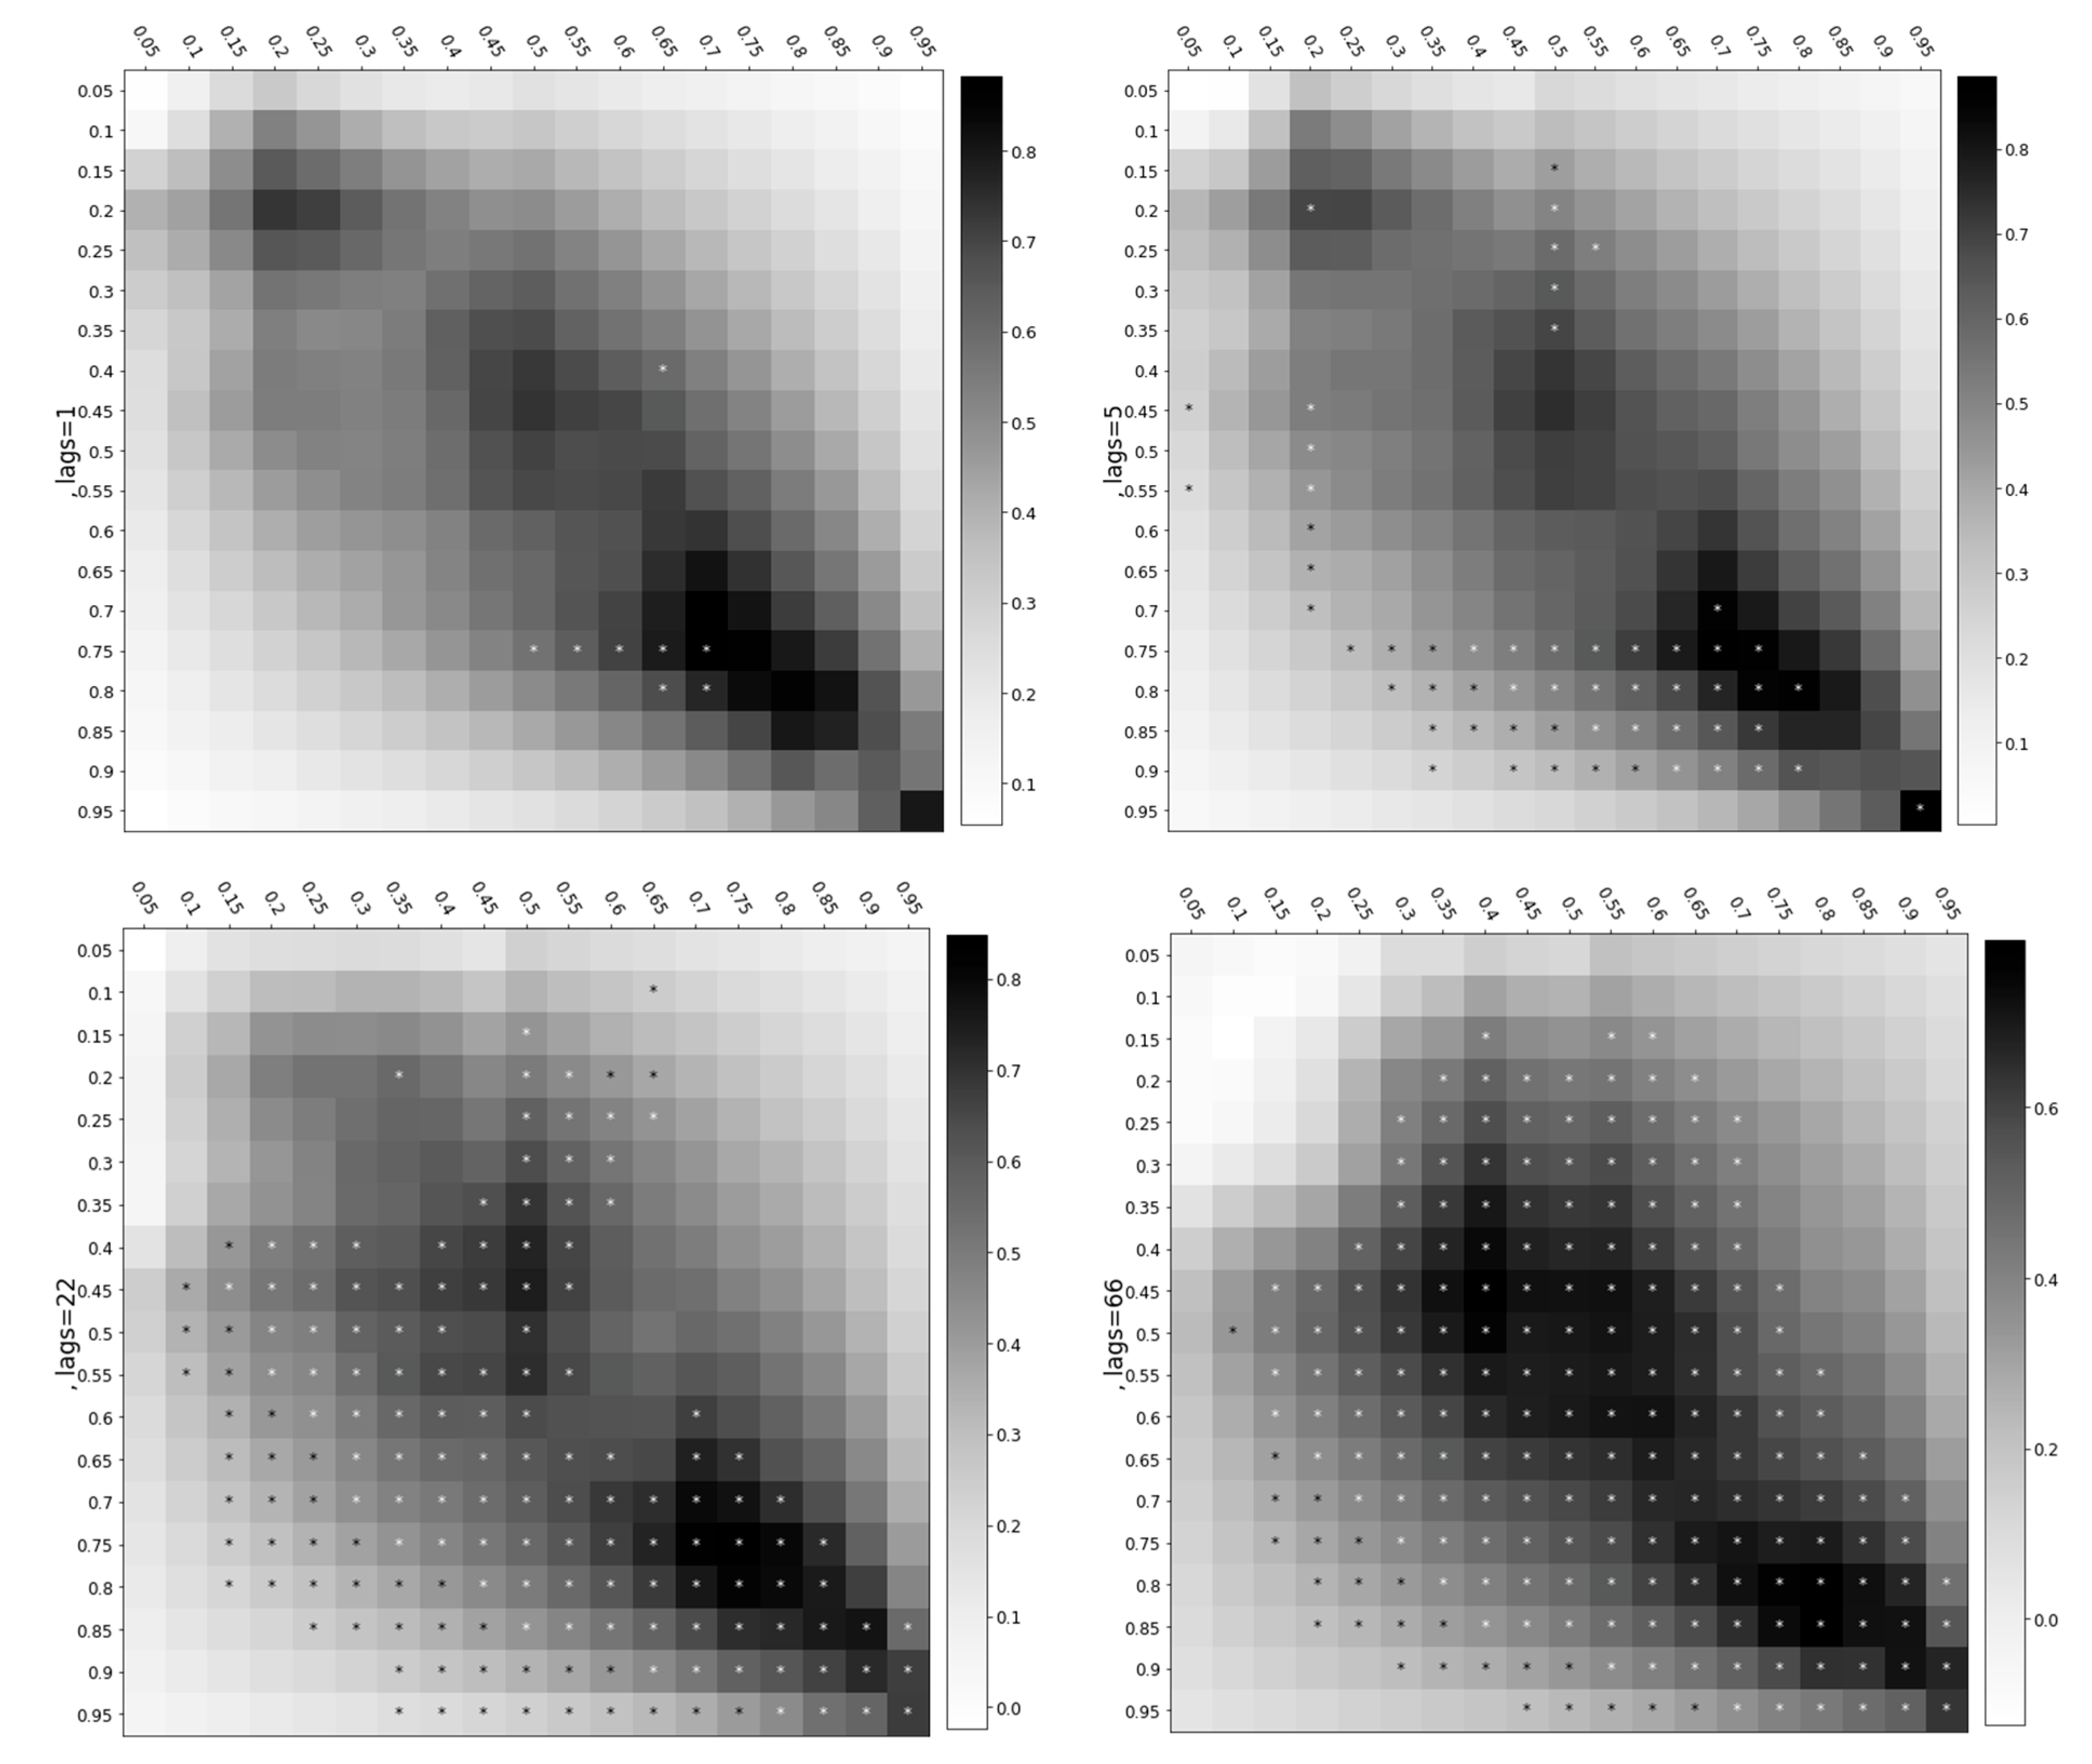
Figure 11 underscores the volatility transmission from Moderna to Sinopharm. The heatmap matrix in the short term (1 day and 5 days) reveals a negative volatility spillover transmitting from Moderna to Sinopharm under the middle quantiles. In the long term (the 22- and 66-day lags), the influence of Moderna is highly profound. Interestingly, we observe a few positive correlations in the long term, whereas only a negative correlation exists in the short term.
Figure 12 demonstrates the volatility spillover from Pfizer to Moderna. All the heatmap matrices indicate a significant linkage of Pfizer and Moderna under bullish market conditions. Pfizer consistently transmits a positive volatility spillover to Moderna in both the short and long term. The influence of Pfizer is also more pronounced in the long term.
Figure 13 demonstrates the cross-quantile dependency from Johnson & Johnson to Moderna. Johnson & Johnson under the higher quantiles transmits positive volatility spillovers to Moderna under the middle quantiles in the short term. In the long term, a pronounced impact of Johnson & Johnson is observed under bullish conditions.
3.3. Quantile-on-Quantile
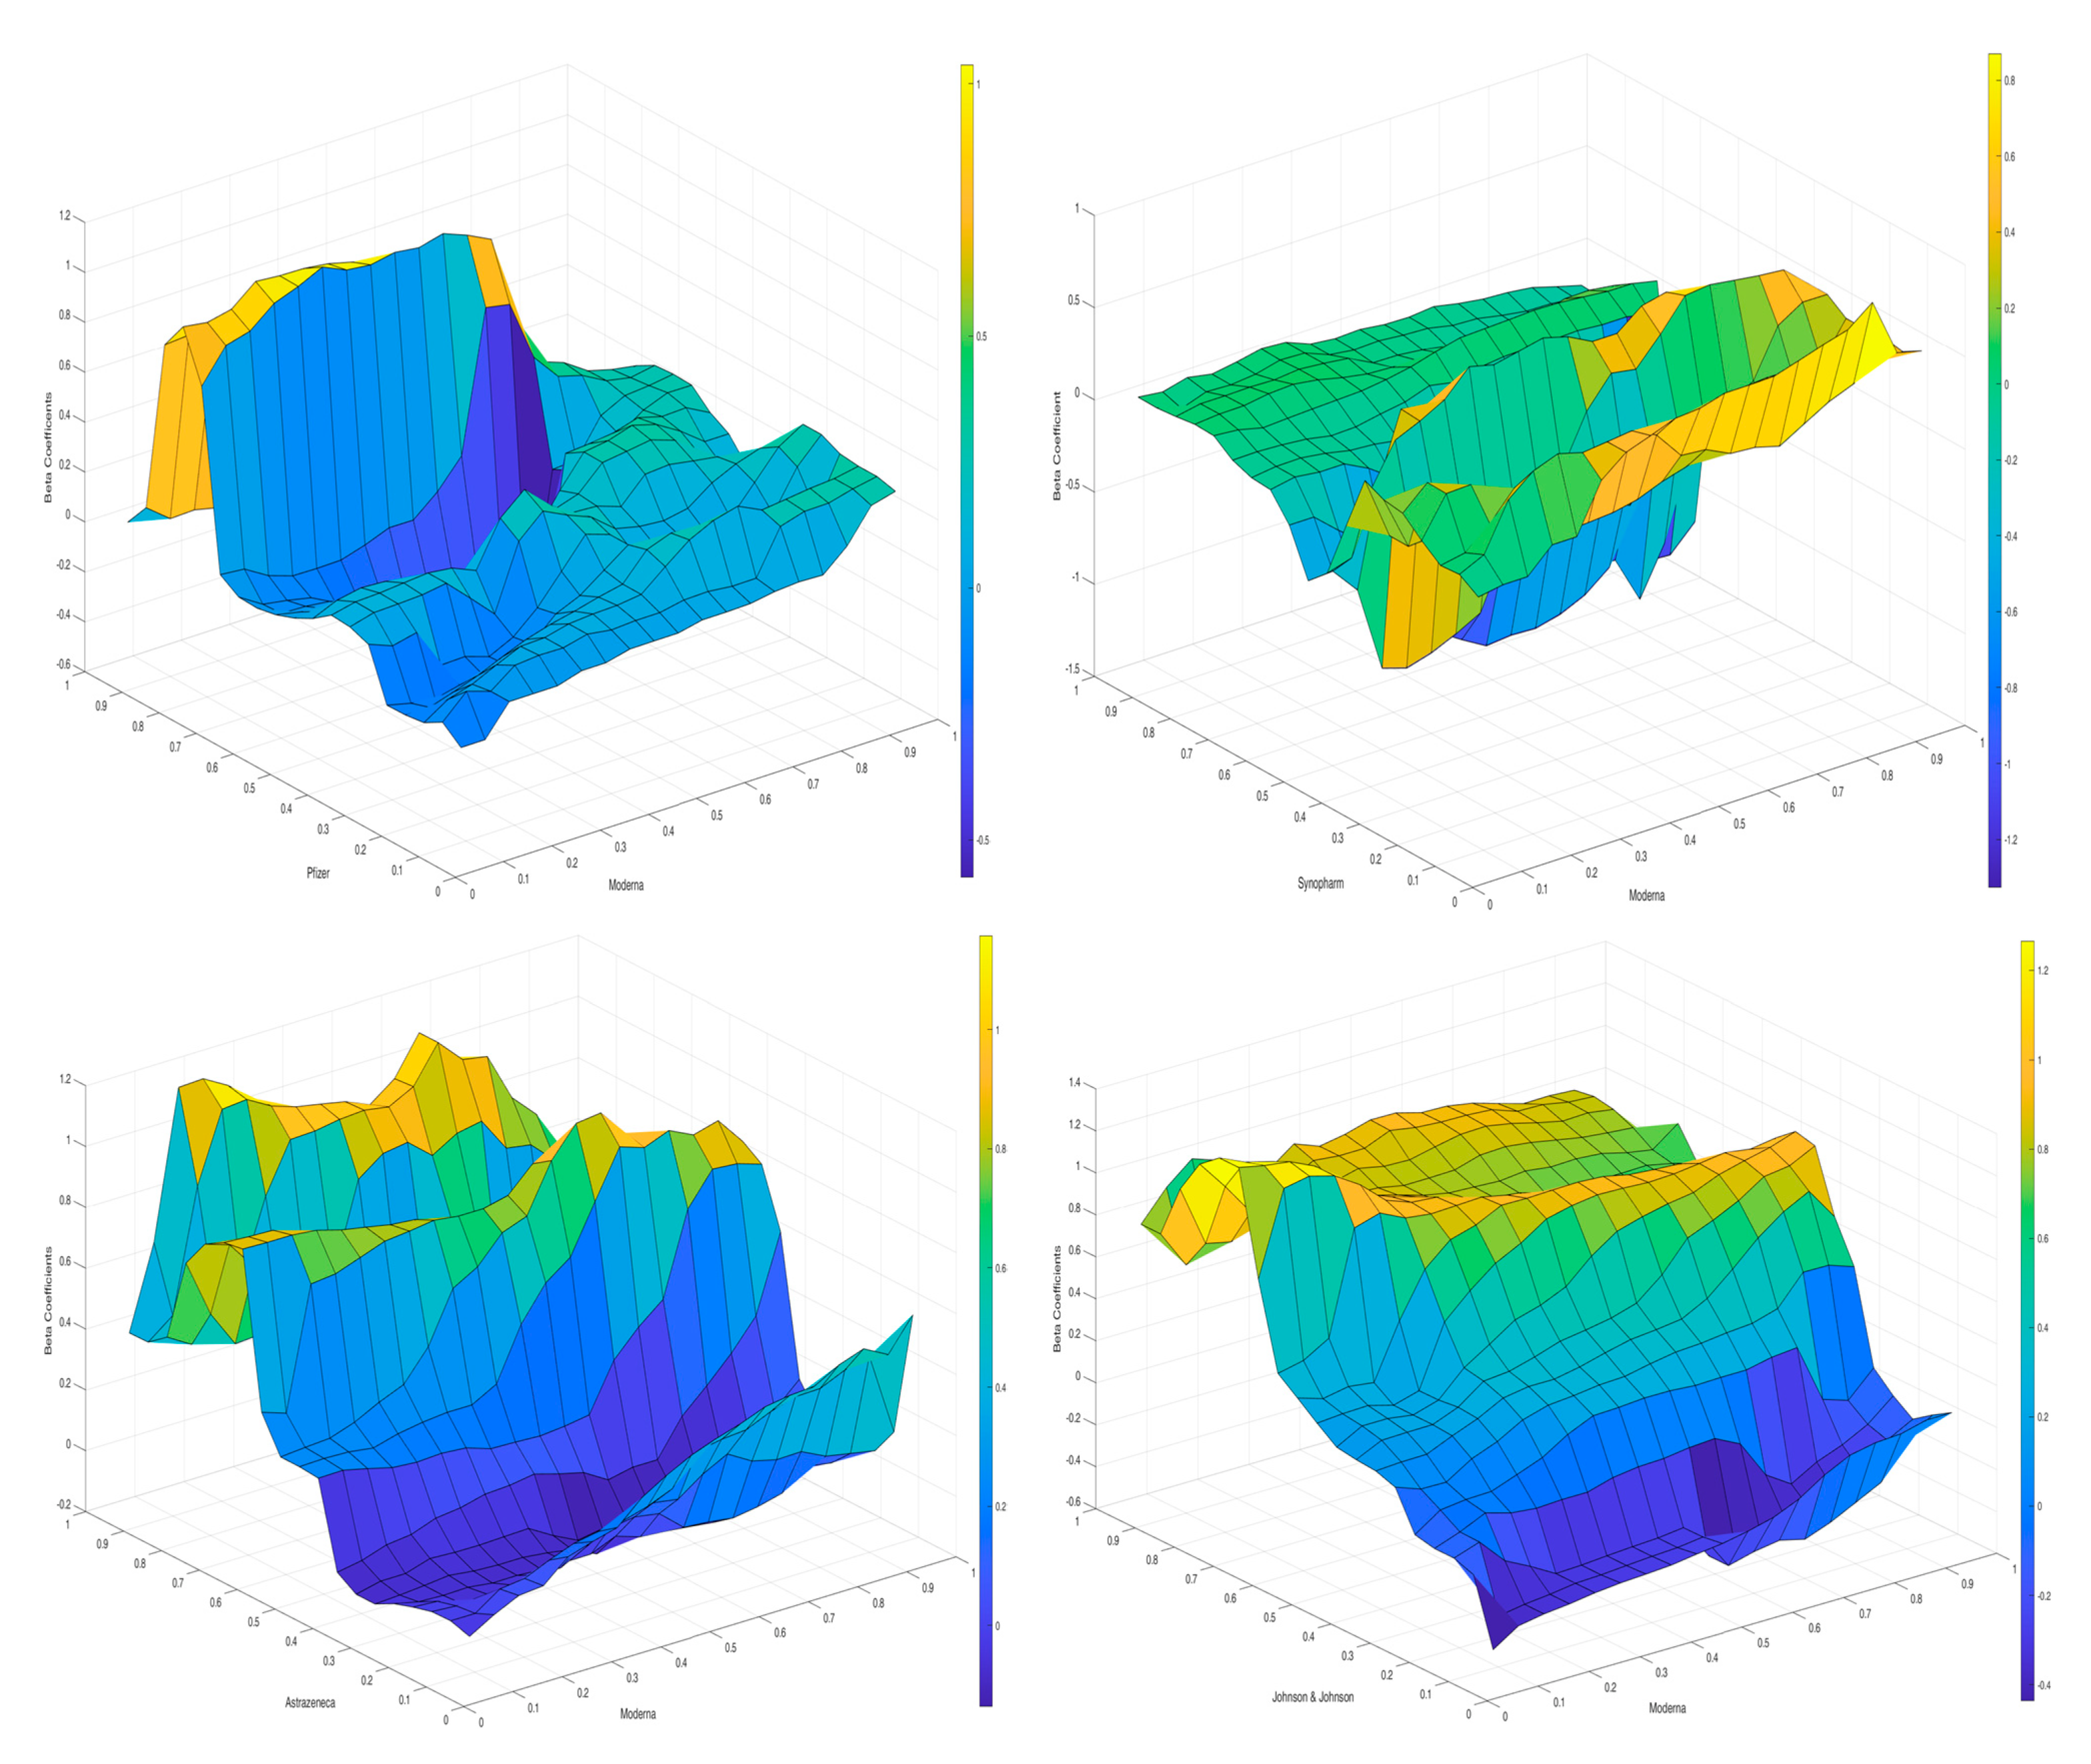
This subsection describes the results of the quantile-on-quantile approach, which was conducted in the R and MatLab softwares. For example, Figure 14 demonstrates the influence of Moderna on the other respective markets, including Pfizer, Sinopharm, AstraZeneca and Johnson & Johnson. Our series are split into nine quantiles by a size of 10%. Yellow refers to a positive relationship, blue stands for negative and the green represents zero correlation between the markets. Moderna, under all quantiles, has a negative or almost a neutral impact on Pfizer under the lower and middle quantiles. Interestingly, Moderna transmits a positive volatility spillover to Pfizer under the highest quantiles, which corresponds to bullish market conditions. Considering the influence of Moderna on Sinopharm, the diagram shows that Moderna under all quantiles transmits a positive volatility spillover to Sinopharm under the quantiles 0.1 and 0.3. At the same time, Moderna under all quintiles transmits a negative volatility spillover to Sinopharm under the 0.4 quantiles. Moderna influences AstraZeneca negatively under the quantiles 0.1–0.5 and 0.8. At the same time a strong positive association is observed under bullish market conditions, namely all quantiles of Moderna and the 0.6, 0.7 and 0.9 quantiles of AstraZeneca. Finally, Moderna, under all quantiles, negatively influences Johnson & Johnson under the 0.1–0.5 quantiles. At the same time, it has a positive impact on Johnson & Johnson under the higher quantiles, indicating that the stock market connectedness rises under bullish market conditions.
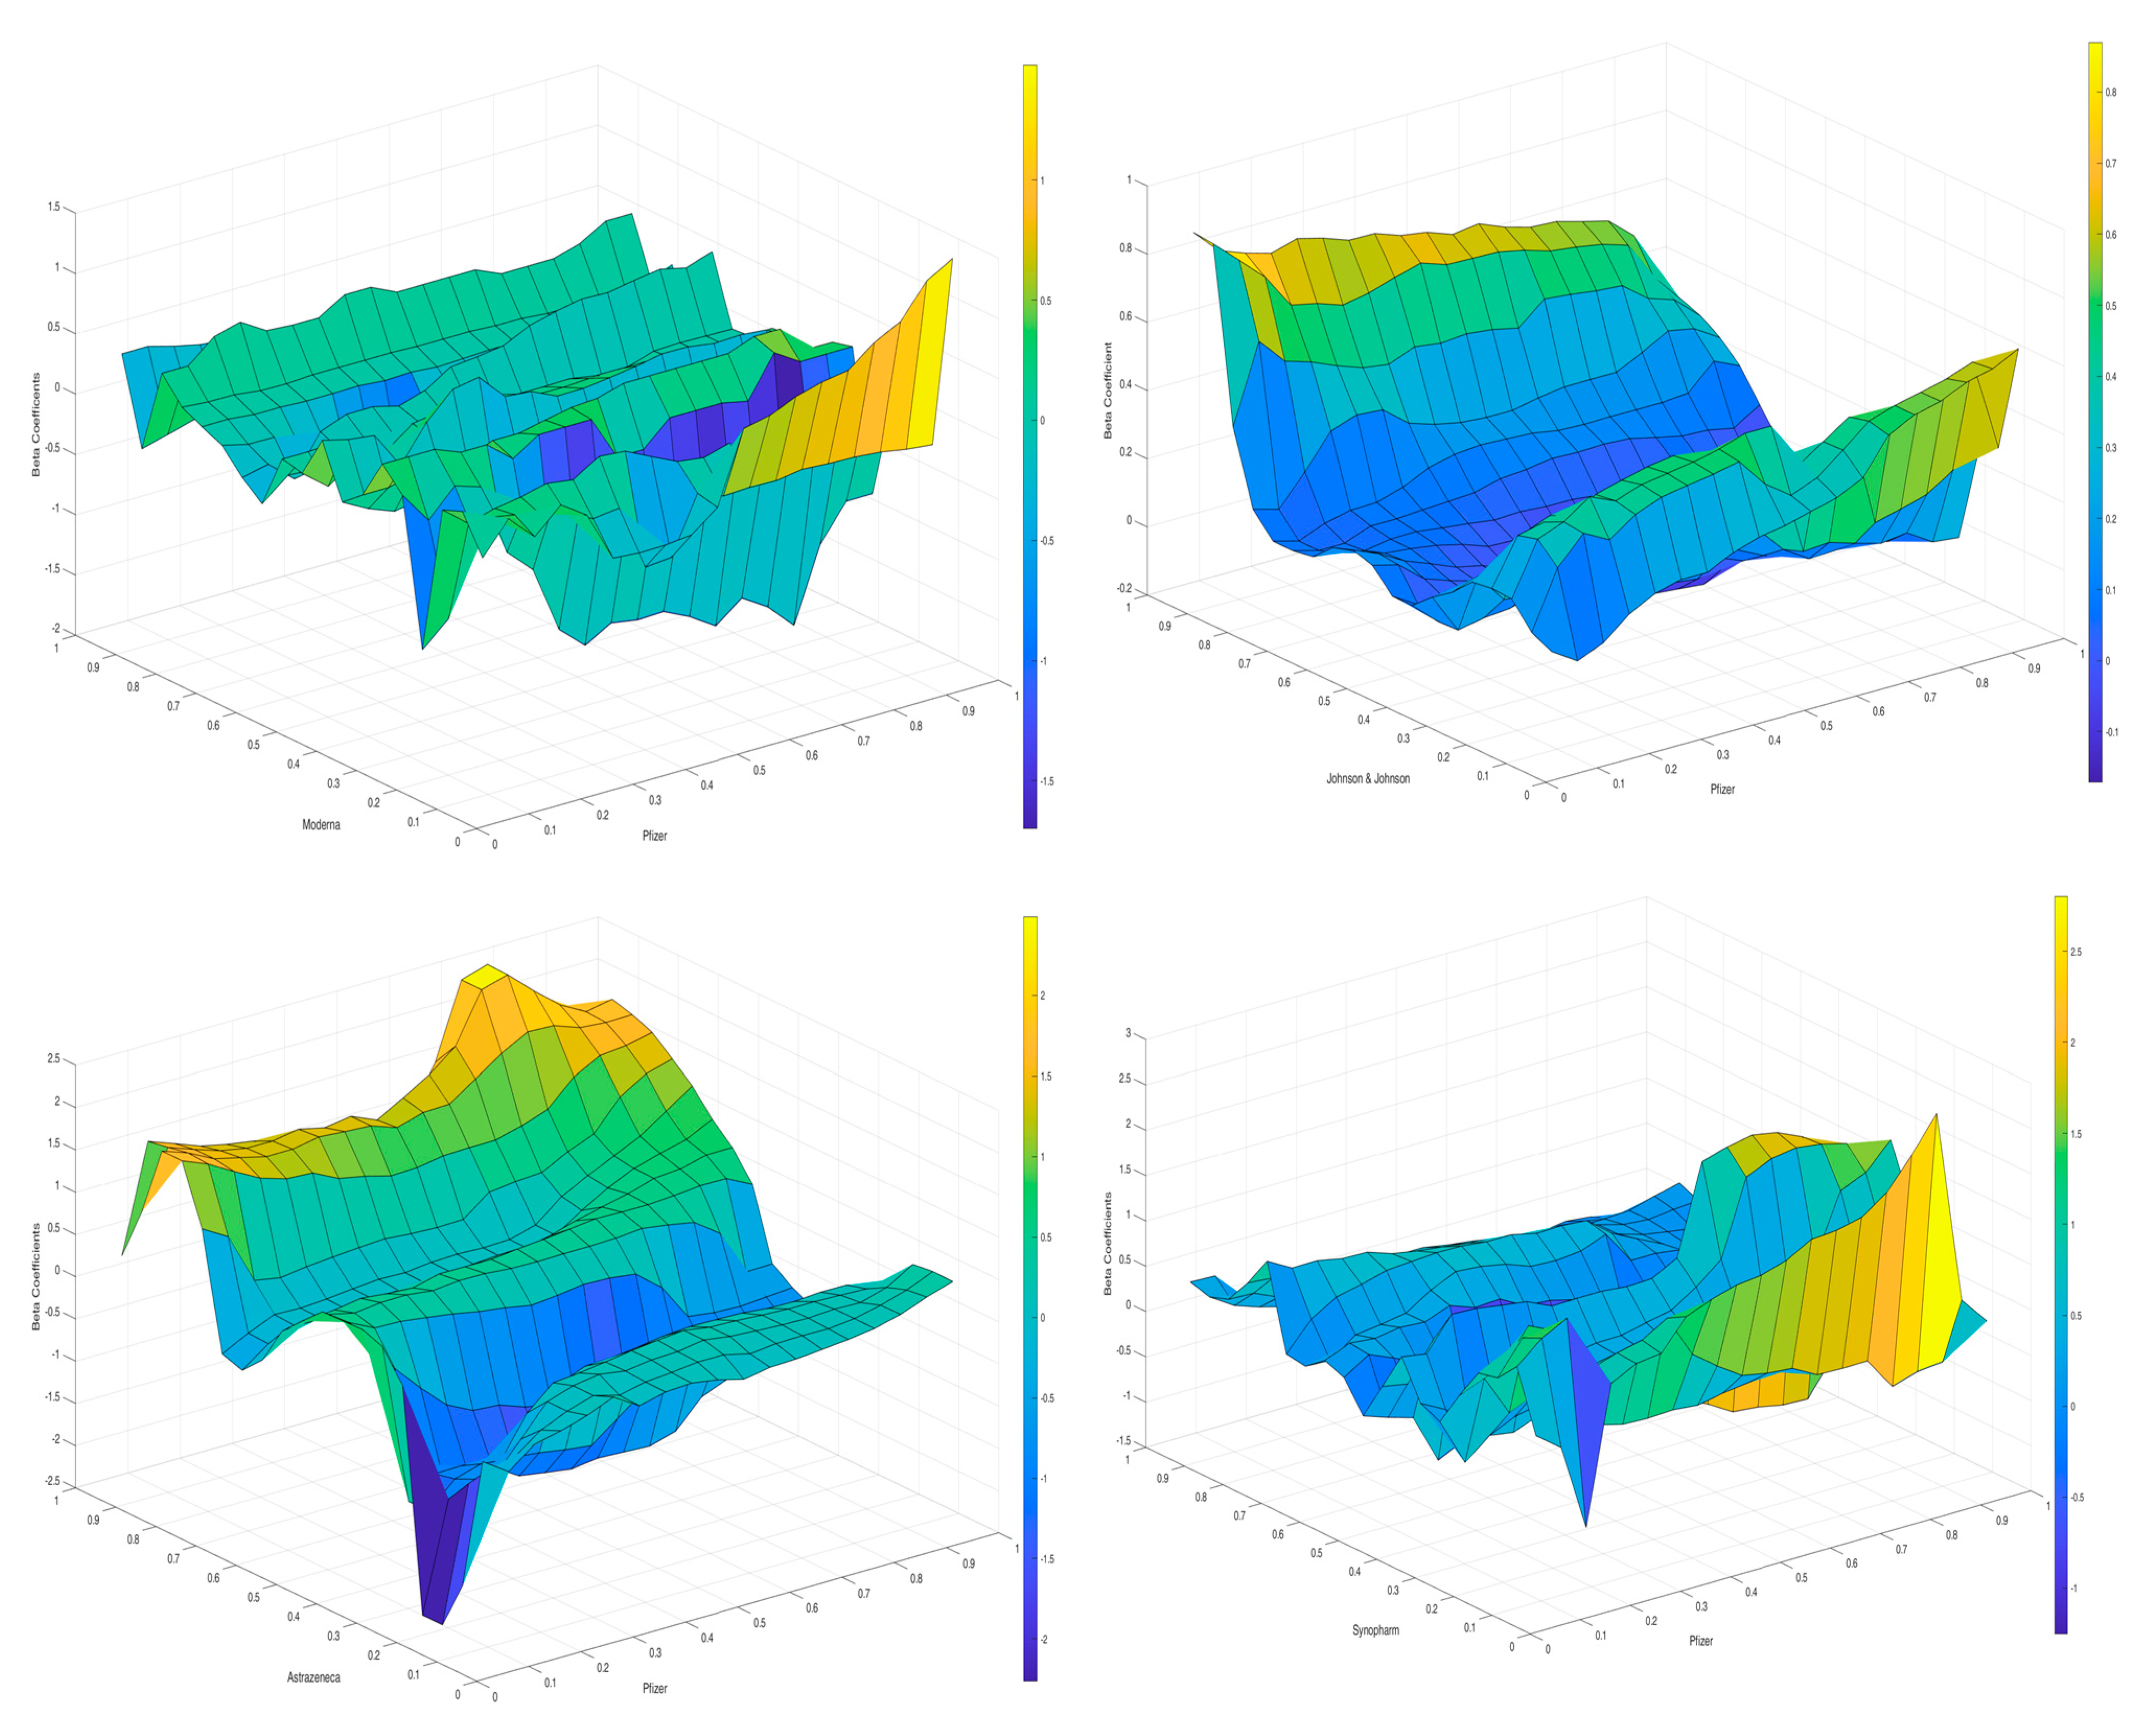
Figure 15 demonstrates the influence of Pfizer on the other respective markets, including Moderna, Sinopharm, AstraZeneca and Johnson & Johnson. Interestingly, Pfizer has little power to transmit volatility to Moderna since most correlations are neutral. Pfizer mainly influences Johnson & Johnson negatively, except for the highest (0.8–0.9) and the lowest (0.1–0.2) quantiles of Johnson & Johnson. Pfizer under the 0.5–0.9 quantiles marginally transmits a positive volatility to Moderna under the 0.1 quantile and a negative volatility under the 0.2 quantiles. In contrast, Pfizer mainly transmits a positive volatility spillover to AstraZeneca, except for the 0.2–0.3 quantiles of AstraZeneca and all quantiles of Pfizer. When considering Pfizer and Sinopharm, the diagram shows a neutral relationship under the higher quantiles and a positive relationship under Pfizer’s higher quantiles and the lower quantiles of Sinopharm.
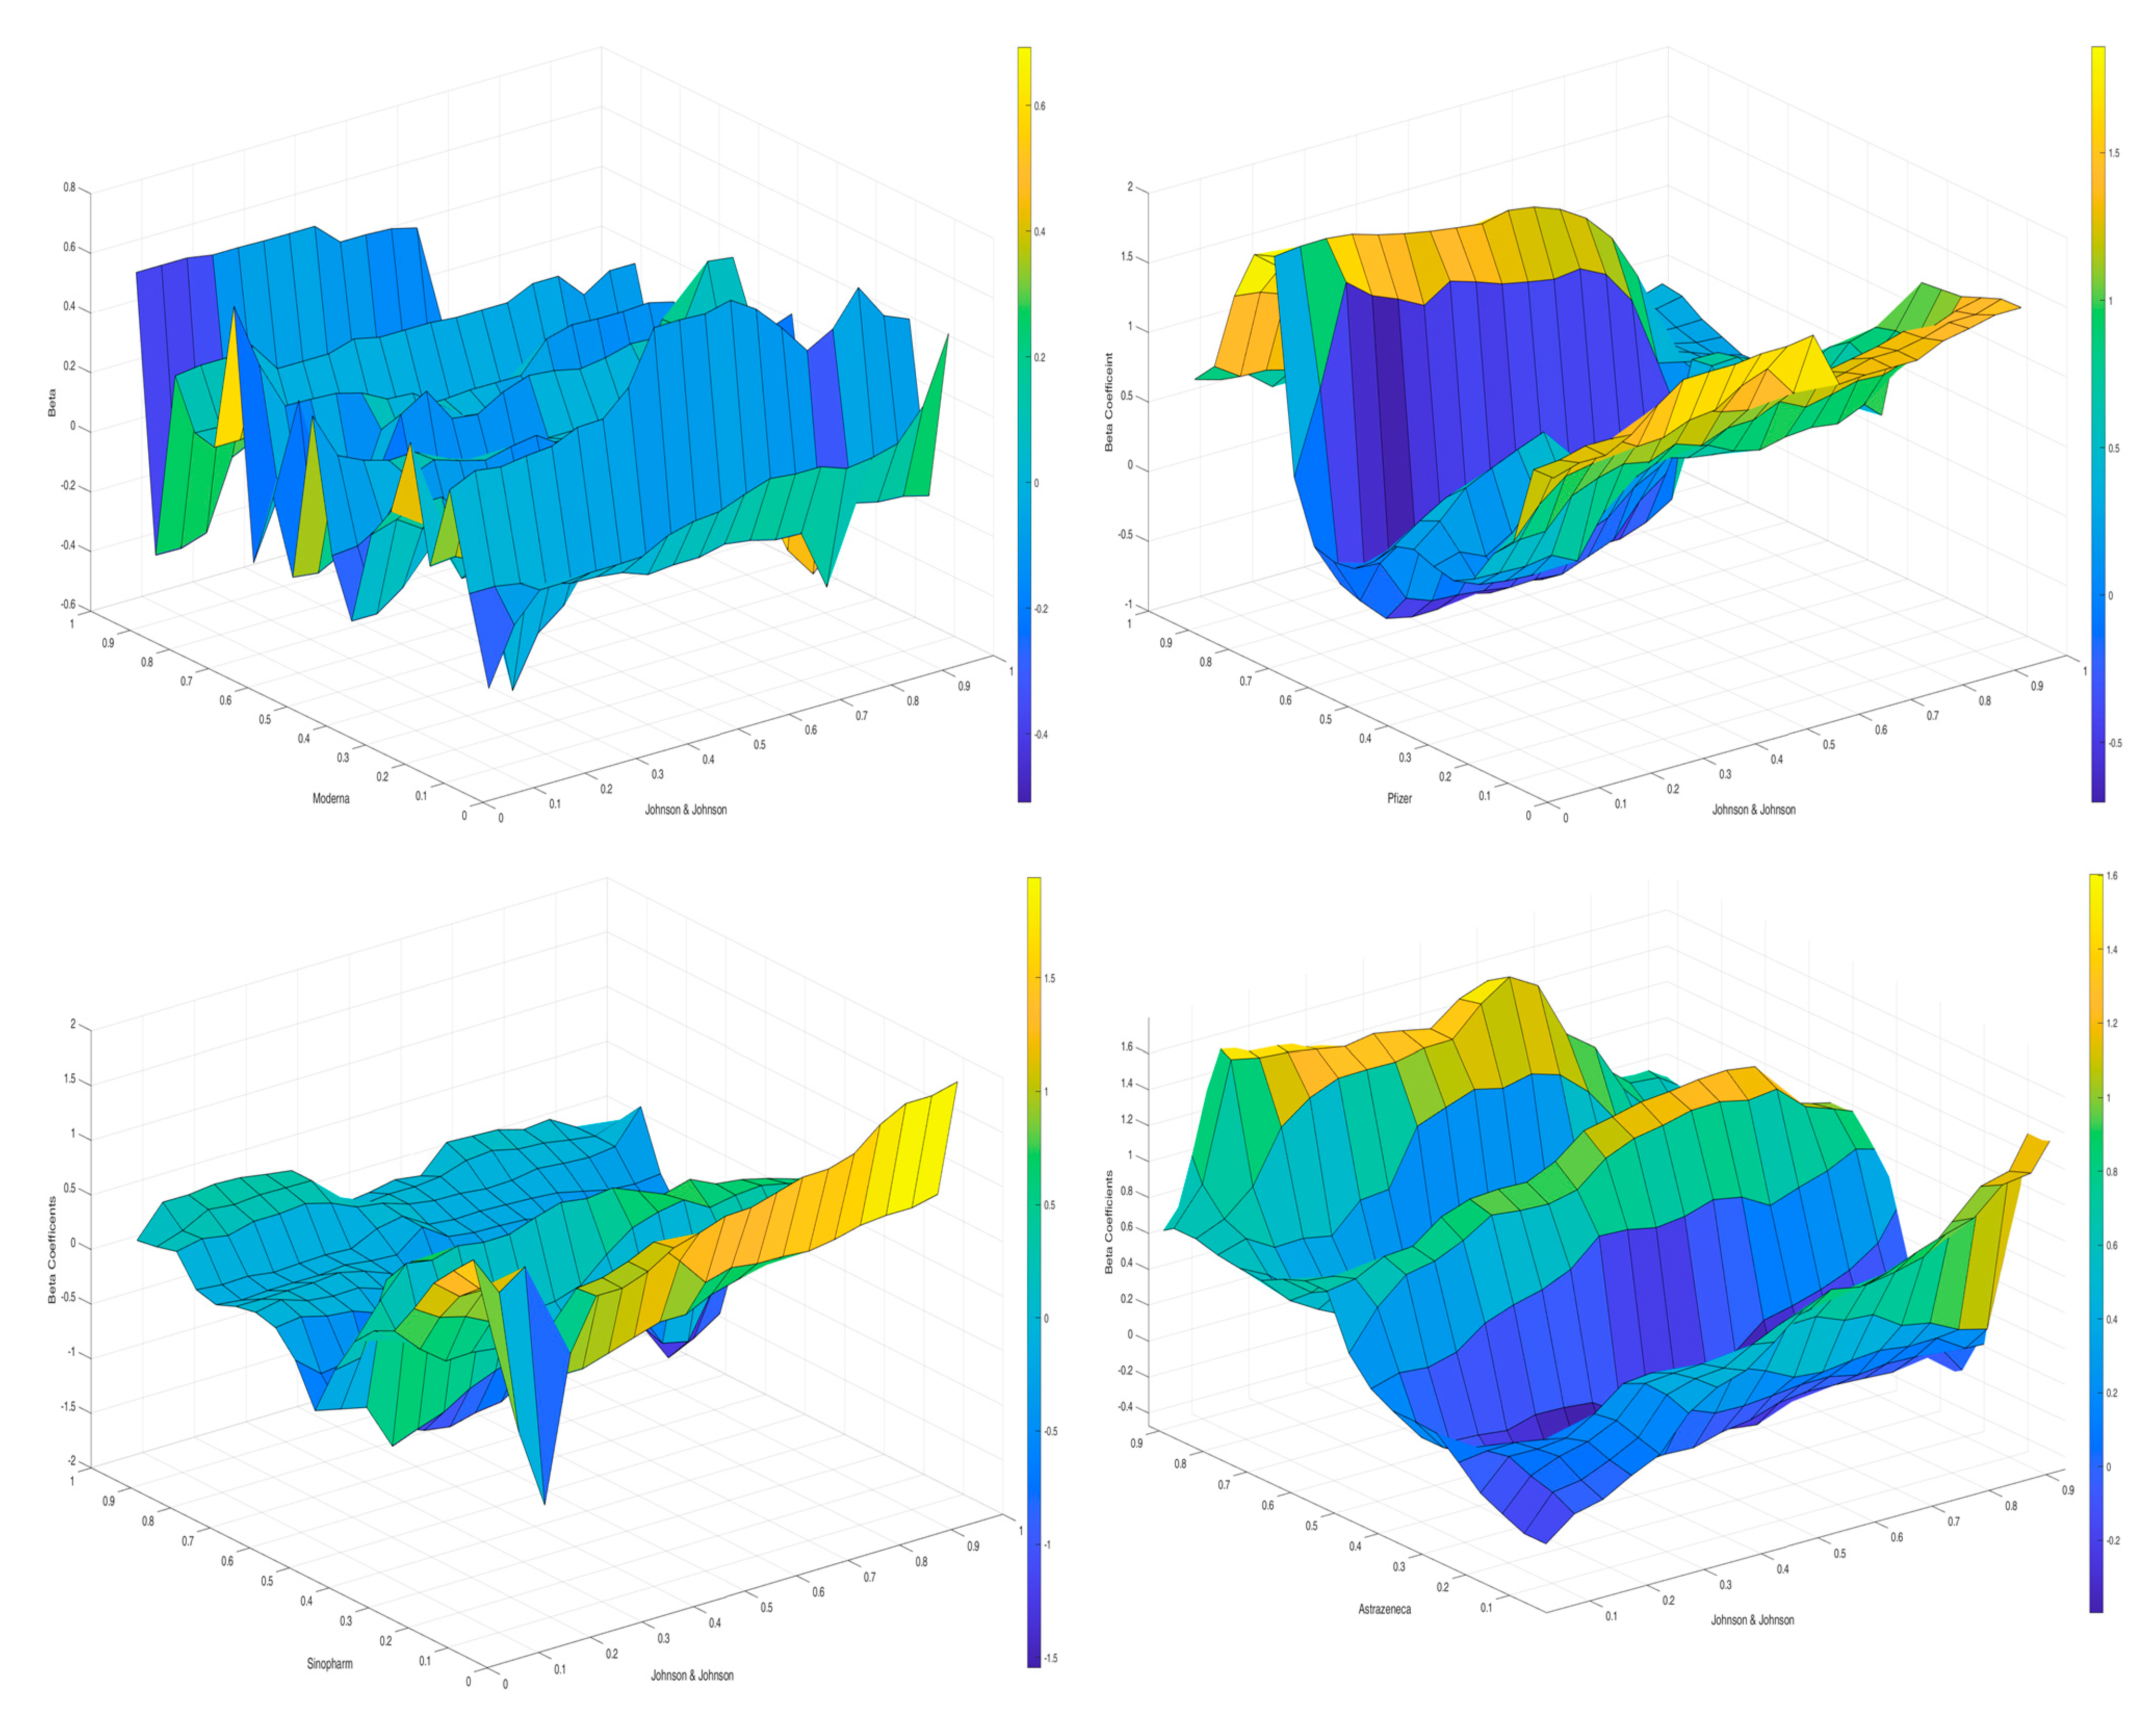
Figure 16 demonstrates the influence of Johnson & Johnson on the other respective markets, including Moderna, Sinopharm, AstraZeneca and Pfizer. It is noteworthy that Johnson & Johnson under all quantiles transmits a negative spillover effect to Moderna under the quantiles 0.15, 0.2, 0.35, 0.4, 0.45, 0.55, 0.6, 0.9 and 0.95. Under the rest of the quantiles, Moderna has either a neutral or a slightly positive spillover effect from Johnson & Johnson. Johnson & Johnson under all quantiles transmits a significant negative spillover effect to Pfizer under the quantiles 0.2–0.7. In contrast, Johnson & Johnson under all quantiles transmits a positive volatility spillover to Pfizer under the quantiles 0.1, 0.8 and 0.9.
4. Discussion
The findings of TVP-VAR represent that overall stock market connectedness among vaccine-producing companies has increased in the second and third quarters of 2021 due to the COVID-19 outbreak. More specifically, the vaccine release induced an increase in total stock market connectedness. This study argues that the stock market connectedness increased through the fundamental channel of foreign investment, for example, via foreign purchases of vaccines by other countries, which is also in line with Hwang et al. [17]. Moreover, investors’ behavior can induce an increase in the stock market connectedness. Due to the COVID-19 pandemic, the vaccine-producing companies are thriving. In addition, the pandemic has created a high level of uncertainty.
Given that investors seek safer assets during crisis periods [9,10,11,12,13,14,15] this study argues that risk-averse agents invest more in vaccine-producing companies, thus increasing their stock returns and connectedness. This finding is in line with Trevino [34], who argues that apart from the fundamental factors, the social channel is crucially important in determining stock market dynamics. It is noteworthy that the increased fluctuations of TCI are conditional on the vaccine release dates. Therefore, the current study expands the findings of several studies [3,5,6,7] who report that the stock market connectedness increased as a response to the COVID-19 pandemic.
The results of TVP-VAR also demonstrate that Moderna, Johnson & Johnson and AstraZeneca perform as net volatility spillover contributors, whereas Pfizer and Sinopharm are net volatility spillover receivers. Notably, Moderna is the most prominent net volatility spillover contributor, whereas Sinopharm is the highest net volatility spillover receiver. In the second quarter of 2021, Moderna appears as a net volatility spillover receiver mainly from AstraZeneca and Pfizer. Such an effect is likely conditional on AstraZeneca and Pfizer vaccine developments and the first authorization in December 2020. However, after the release of the Moderna vaccine, this company turns into a strong net volatility transmitter.
The results of the cross-quantilogram are consistent with the previous findings that Moderna is the most prominent volatility transmitter. Moderna transmits significant volatility spillovers under both bearish and bullish conditions to Sinopharm, Johnson & Johnson and AstraZeneca, though the volatility transmission from Moderna to Pfizer is minor. Overall, the spillover effect is more pronounced in the long run than in the short run. In general, the interconnectedness is more substantial under the bullish market conditions. This finding is in line with several studies [16,17,18,33,44,59,60] who report that stock market connectedness increases during crisis times.
5. Conclusions
The vaccine-producing companies that developed vaccines have thrived during the pandemic period and this is reflected in their stock dynamics. The companies under consideration are: Moderna, Pfizer, Johnson & Johnson, Sinopharm and AstraZeneca. This study investigates how the time-dynamic connectedness among the prominent vaccine-producing companies’ stock returns changes due to the COVID-19 pandemic. Specifically, the study explores how vaccine releases change the pattern of total connectedness and the spillover effects among those companies. Moreover, this investigation explains the interconnectedness among those vaccine-producing companies under bearish and bullish market conditions. Given the high frequency of the time series with high fluctuations, several advanced econometric techniques are applied. Therefore, the significance of this article lies in several aspects: proposition of a novel idea, contribution to the existing literature by utilizing equity returns instead of stock indices, application of sophisticated econometric techniques and obtaining unique findings.
First, TVP-VAR dynamic connectedness is applied in order to determine the net volatility spillover receivers and contributors, considering the time dimension. Notably, the total connectivity among the markets is 47.32%. The TVP-VAR results demonstrate that Moderna performs as the most prominent net volatility contributor, whereas Sinopharm is the highest net volatility receiver. Interestingly, the volatility transmission diagram shows that AstraZeneca is the only company that transmits a spillover to Moderna. Exploring the net volatility transmission diagram, it is observed that Moderna turned into a net volatility receiver in the second quarter of 2021, whereas AstraZeneca and Pfizer were net volatility transmitters. Such an effect is likely conditional on AstraZeneca and Pfizer vaccine developments and the first authorization in December 2020. However, after the release of the Moderna vaccine, this company turns into a strong net volatility transmitter.
Moreover, this study reveals that the total connectedness index rises in the second and third quarters of 2021 after the vaccine release. The study argues that the stock market connectedness has increased through the fundamental channel of foreign investment, for example, via foreign purchases of vaccine by other countries. Moreover, risk aversive agents invest more in vaccine-producing companies, thus increasing their stock returns and connectedness.
Second, a cross-quantile dependency is applied to reveal the interconnectedness among different markets under bullish and bearish market conditions and consider short memory (the 1-day and 5-day lags) and long memory (the 22-day and 66-days lags). The spillover effect is more pronounced in the long run than in the short run. Consistent with the previous findings, Moderna transmits significant volatility spillovers under both bearish and bullish conditions to Sinopharm, Johnson & Johnson and AstraZeneca. However, the volatility transmission from Moderna to Pfizer is less pronounced. We generally observe a higher interconnectedness under the bullish market conditions that correspond to the COVID-19 pandemic circumstances.
The empirical findings of this study provide several policy implications from the investors’ point of view since the findings show that the vaccine-producing companies under consideration are successful in terms of achieving higher stock returns. The total connectivity among the stock returns of the respective companies is found to be considerably high, reaching 80% in 2019 and implying that the stock return of each company can be a good hedge against the stock returns of another company. Moreover, Moderna turns out to be the most prominent net volatility spillover transmitter, providing an opportunity for a rational investment. Moderna and Johnson & Johnson can predict the stock returns of other vaccine producers’ stock returns in quarterly lags at the extreme quantiles, indicating their directional prediction follows long memory. Therefore, the findings of this study are useful for portfolio managers in terms of improving their revenues by portfolio diversification. Finally, it is important to highlight a policy implication for the medications and vaccine-producing companies. The empirical finding shows that vaccine development and release allows companies to enhance their stock returns but induced substantial volatility spillovers from company to company. For instance, after the vaccine release, Moderna and Pfizer enjoyed higher stock prices and a better prediction of the stock returns of the respective companies.
One of the limitations of the current study is that it considers only a few vaccine-producing companies, while state-owned vaccine producers are excluded (e.g., Sputnik V). Moreover, vaccine release may spur the stock market overall, which has been overlooked. Thus, future study may incorporate those issues to fill up the literature loophole.
Author Contributions
Conceptualization, K.S.; methodology, K.S.; software, K.S.; investigation, K.S.; validation, K.S.; supervision, S.H. and R.S.; project administration, S.H. and R.S.; resources, A.G.; data curation, A.G.; writing—original draft preparation, A.G.; writing—review and editing, A.G. All authors have read and agreed to the published version of the manuscript.
Funding
The research funding from the Ministry of Science and Higher Education of the Russian Federation (Ural Federal University project within the Priority-2030 Program) is gratefully acknowledged.
Institutional Review Board Statement
Not applicable.
Informed Consent Statement
Not applicable.
Data Availability Statement
Publicly available datasets were analyzed in this study. This data can be found here: [https://finance.yahoo.com/].
Conflicts of Interest
The authors declare no conflict of interest.
Appendix A
Figure A1.
Volatility transmission from AstraZeneca, Johnson &Johnson, Moderna, Pfizer and Sinopharm.
Figure A1.
Volatility transmission from AstraZeneca, Johnson &Johnson, Moderna, Pfizer and Sinopharm.

Figure A2.
Volatility transmission to AstraZeneca, Johnson & Johnson, Moderna, Pfizer and Sinopharm.
Figure A2.
Volatility transmission to AstraZeneca, Johnson & Johnson, Moderna, Pfizer and Sinopharm.

References
- Begum, J.; Mir, N.A.; Dev, K.; Buyamayum, B.; Wani, M.Y.; Raza, M. Challenges and prospects of COVID-19 vaccine development based on the progress made in SARS and MERS vaccine development. Transbound. Emerg. Dis. 2021, 68, 1111–1124. [Google Scholar] [CrossRef] [PubMed]
- Idris, Z.Z.; Ismail, N.W.; Ibrahim, S. Comparative Advantage and Competitiveness of COVID-19-Related Medical Products Exporters. J. Compet. 2022, 14, 61–79. [Google Scholar] [CrossRef]
- Ali, M.; Alam, N.; Rizvi, S.A.R. Coronavirus (COVID-19)—An epidemic or Pandemic for financial markets. J. Behav. Exp. Financ. 2020, 27, 100341. [Google Scholar] [CrossRef] [PubMed]
- Benlagha, N.; El Omar, S. Connectedness of stock markets with gold and oil: New evidence from COVID-19 pandemic. Financ. Res. Lett. 2022, 46, 102373. [Google Scholar] [CrossRef] [PubMed]
- Costa, A.; Matos, P.; da Silva, C. Sectoral connectedness: New evidence from US stock market during COVID-19 pandemics. Financ. Res. Lett. 2021, 45, 102124. [Google Scholar] [CrossRef]
- Sharif, A.; Aloui, C.; Yarovaya, L. COVID-19 pandemic, oil prices, stock market, geopolitical risk and policy uncertainty nexus in the US economy: Fresh evidence from the wavelet-based approach. Int. Rev. Financ. Anal. 2020, 70, 101496. [Google Scholar] [CrossRef]
- Zhang, D.; Hu, M.; Ji, Q. Financial markets under the global Pandemic of COVID-19. Financ. Res. Lett. 2020, 36, 101528. [Google Scholar] [CrossRef]
- Zhang, H.; Chen, J.; Shao, L. Dynamic spillovers between energy and stock markets and their implications in the context of COVID-19. Int. Rev. Financ. Anal. 2021, 77, 101828. [Google Scholar] [CrossRef]
- Barberis, N.; Shleifer, A.; Wurgler, J. Comovement. J. Financ. Econ. 2005, 75, 283–317. [Google Scholar] [CrossRef] [Green Version]
- Brabenec, T.; Poborsky, F.; Saßmannshausen, P. The Difference Between Preferred & Common Stocks in Europe from the Market Perspective. J. Compet. 2020, 12, 64–81. [Google Scholar] [CrossRef]
- Bu, H.; Tang, W.; Wu, J. Time-varying comovement and changes of comovement structure in the Chinese stock market: A causal network method. Econ. Model. 2019, 81, 181–204. [Google Scholar] [CrossRef]
- Durana, P.; Ginevicius, R.; Urbanski, M.; Podhorska, I.; Tumpach, M. Parallels and Differences in Earnings Management of the Visegrad Four and the Baltics. J. Compet. 2021, 13, 39–55. [Google Scholar] [CrossRef]
- Gkillas, K.; Konstantatos, C.; Siriopoulos, C. Uncertainty Due to Infectious Diseases and Stock–Bond Correlation. Econometrics 2021, 9, 17. [Google Scholar] [CrossRef]
- Rehman, M.U.; Kang, S.H.; Ahmad, N.; Vo, X.V. The impact of COVID-19 on the G7 stock markets: A time-frequency analysis. N. Am. J. Econ. Financ. 2021, 58, 101526. [Google Scholar] [CrossRef]
- Valaskova, K.; Kliestik, T.; Gajdosikova, D. Distinctive determinants of financial indebtedness: Evidence from Slovak and Czech enterprises. Equilib. Q. J. Econ. Econ. Policy 2021, 16, 639–659. [Google Scholar] [CrossRef]
- Gong, C.; Tang, P.; Wang, Y. Measuring the network connectedness of global stock markets. Phys. A Stat. Mech. Its Appl. 2019, 535, 122351. [Google Scholar] [CrossRef]
- Hwang, E.; Min, H.-G.; Kim, B.-H.; Kim, H. Determinants of stock market comovements among US and emerging economies during the US financial crisis. Econ. Model. 2013, 35, 338–348. [Google Scholar] [CrossRef]
- Mensi, W.; Hammoudeh, S.; Nguyen, D.K.; Kang, S.H. Global financial crisis and spillover effects among the U.S. and BRICS stock markets. Int. Rev. Econ. Financ. 2016, 42, 257–276. [Google Scholar] [CrossRef]
- Apostolakis, G.N.; Floros, C.; Gkillas, K.; Wohar, M. Political uncertainty, COVID-19 pandemic and stock market volatility transmission. J. Int. Financ. Mark. Inst. Money 2021, 74, 101383. [Google Scholar] [CrossRef]
- Benkraiem, R.; Lahiani, A.; Miloudi, A.; Shahbaz, M. New insights into the US stock market reactions to energy price shocks. J. Int. Financ. Mark. Inst. Money 2018, 56, 169–187. [Google Scholar] [CrossRef] [Green Version]
- Skintzi, V.D. Determinants of stock-bond market comovement in the Eurozone under model uncertainty. Int. Rev. Financ. Anal. 2019, 61, 20–28. [Google Scholar] [CrossRef]
- Wei, K.J.; Liu, Y.J.; Yang, C.C.; Chaung, G.S. Volatility and price change spillover effects across the developed and emerging markets. Pac. Basin Financ. J. 1995, 3, 113–136. [Google Scholar]
- Wang, Z.; Yang, J.; Bessler, D.A. Financial crisis and African stock market integration. Appl. Econ. Lett. 2003, 10, 527–533. [Google Scholar] [CrossRef]
- Akhtaruzzaman, M.; Boubaker, S.; Sensoy, A. Financial contagion during COVID–19 crisis. Financ. Res. Lett. 2021, 38, 101604. [Google Scholar] [CrossRef] [PubMed]
- Haroon, O.; Rizvi, S.A.R. COVID-19: Media coverage and financial markets behavior—A sectoral inquiry. J. Behav. Exp. Financ. 2020, 27, 100343. [Google Scholar] [CrossRef]
- Jiang, Y.; Wu, L.; Tian, G.; Nie, H. Do cryptocurrencies hedge against EPU and the equity market volatility during COVID-19?–New evidence from quantile coherency analysis. J. Int. Financ. Mark. Inst. Money 2021, 72, 101324. [Google Scholar] [CrossRef]
- Junior, P.O.; Adam, A.M.; Asafo-Adjei, E.; Boateng, E.; Hamidu, Z.; Awotwe, E. Time-Frequency domain analysis of investor fear and expectations in stock markets of BRIC economies. Heliyon 2021, 7, e08211. [Google Scholar] [CrossRef]
- Liu, Y.; Wei, Y.; Wang, Q.; Liu, Y. International stock market risk contagion during the COVID-19 Pandemic. Financ. Res. Lett. 2021, 45, 102145. [Google Scholar] [CrossRef]
- Lyócsa, Š.; Baumöhl, E.; Výrost, T.; Molnár, P. Fear of the coronavirus and the stock markets. Financ. Res. Lett. 2020, 36, 101735. [Google Scholar] [CrossRef]
- Fassas, A. Risk aversion connectedness in developed and emerging equity markets before and after the COVID-19 pandemic. Heliyon 2020, 6, e05715. [Google Scholar] [CrossRef]
- Liu, N.; Xu, Z.; Skare, M. The research on COVID-19 and economy from 2019 to 2020: Analysis from the perspective of bibliometrics. Oecon. Copernic. 2021, 12, 217–268. [Google Scholar] [CrossRef]
- Zehri, C. Stock market comovements: Evidence from the COVID-19 Pandemic. J. Econ. Asymmetries 2020, 24, e00228. [Google Scholar] [CrossRef] [PubMed]
- Chen, P. Understanding international stock market comovements: A comparison of developed and emerging markets. Int. Rev. Econ. Financ. 2018, 56, 451–464. [Google Scholar] [CrossRef]
- Trevino, I. Informational channels of financial contagion. Econometrica 2020, 88, 297–335. [Google Scholar] [CrossRef]
- Pritsker, M. The channels for financial contagion. In International Financial Contagion; Springer: Berlin/Heidelberg, Germany, 2001; pp. 67–95. [Google Scholar]
- Baur, D.G. Financial contagion and the real economy. J. Bank. Financ. 2012, 36, 2680–2692. [Google Scholar] [CrossRef] [Green Version]
- Horta, P.; Lagoa, S.; Martins, L. Unveiling investor-induced channels of financial contagion in the 2008 financial crisis using copulas. Quant. Financ. 2016, 16, 625–637. [Google Scholar] [CrossRef]
- Yuan, K. Asymmetric price movements and borrowing constraints: A rational expectations equilibrium model of crises, contagion, and confusion. J. Financ. 2005, 60, 379–411. [Google Scholar] [CrossRef] [Green Version]
- Kyle, A.S.; Xiong, W. Contagion as a wealth effect. J. Financ. 2001, 56, 1401–1440. [Google Scholar] [CrossRef]
- Boyer, B.H.; Kumagai, T.; Yuan, K. How do crises spread? Evidence from accessible and inaccessible stock indices. J. Financ. 2006, 61, 957–1003. [Google Scholar] [CrossRef]
- Kodres, L.E.; Pritsker, M. A rational expectations model of financial contagion. J. Financ. 2002, 57, 769–799. [Google Scholar] [CrossRef] [Green Version]
- Bouri, E.; Demirer, R.; Gabauer, D.; Gupta, R. Financial market connectedness: The role of investors’ happiness. Financ. Res. Lett. 2021, 44, 102075. [Google Scholar] [CrossRef]
- Frijns, B.; Verschoor, W.F.; Zwinkels, R.C. Excess stock return comovements and the role of investor sentiment. J. Int. Financ. Mark. Inst. Money 2017, 49, 74–87. [Google Scholar] [CrossRef]
- Umar, Z.; Adekoya, O.B.; Oliyide, J.A.; Gubareva, M. Media sentiment and short stocks performance during a systemic crisis. Int. Rev. Financ. Anal. 2021, 78, 101896. [Google Scholar] [CrossRef]
- Lee, H. Time-varying comovement of stock and treasury bond markets in Europe: A quantile regression approach. Int. Rev. Econ. Financ. 2021, 75, 1–20. [Google Scholar] [CrossRef]
- López-Cabarcos, M.Á.; Pérez-Pico, A.M.; Piñeiro-Chousa, J.; Šević, A. Bitcoin volatility, stock market and investor sentiment. Are they connected? Financ. Res. Lett. 2021, 38, 101399. [Google Scholar] [CrossRef]
- Pasquariello, P. Imperfect competition, information heterogeneity, and financial contagion. Rev. Financ. Stud. 2007, 20, 391–426. [Google Scholar] [CrossRef]
- Veldkamp, L.L. Information markets and the comovement of asset prices. Rev. Econ. Stud. 2006, 73, 823–845. [Google Scholar] [CrossRef] [Green Version]
- Antonakakis, N.; Chatziantoniou, I.; Gabauer, D. Refined measures of dynamic connectedness based on Time-Varying Parameter Vector Autoregressions. J. Risk Financ. Manag. 2020, 13, 84. [Google Scholar] [CrossRef]
- Koop, G.; Korobilis, D. A new index of financial conditions. Eur. Econ. Rev. 2014, 71, 101–116. [Google Scholar] [CrossRef] [Green Version]
- Diebold, F.X.; Yılmaz, K. On the network topology of variance decompositions: Measuring the connectedness of financial firms. J. Econom. 2014, 182, 119–134. [Google Scholar] [CrossRef] [Green Version]
- Koop, G.; Pesaran, M.H.; Potter, S.M. Impulse response analysis in nonlinear multivariate models. J. Econom. 1996, 74, 119–147. [Google Scholar] [CrossRef]
- Pesaran, H.H.; Shin, Y. Generalized impulse response analysis in linear multivariate models. Econ. Lett. 1998, 58, 17–29. [Google Scholar] [CrossRef]
- Han, H.; Linton, O.; Oka, T.; Whang, Y.J. The cross-quantilogram: Measuring quantile dependence and testing directional predictability between time series. J. Econom. 2016, 193, 251–270. [Google Scholar] [CrossRef] [Green Version]
- Cho, D.; Han, H. The tail behavior of safe haven currencies: A cross-quantilogram analysis. J. Int. Financ. Mark. Inst. Money 2021, 70, 101257. [Google Scholar] [CrossRef]
- Sim, N.; Zhou, H. Oil prices, US stock return, and the dependence between their quantiles. J. Bank. Financ. 2015, 55, 1–8. [Google Scholar] [CrossRef]
- Bouoiyour, J.; Selmi, R.; Wohar, M.E. Measuring the response of gold prices to uncertainty: An analysis beyond the mean. Econ. Model. 2018, 75, 105–116. [Google Scholar] [CrossRef] [Green Version]
- Meo, M.S.; Abd Karim, M.Z. The role of green finance in reducing CO2 emissions: An empirical analysis. Borsa Istanb. Rev. 2022, 22, 169–178. [Google Scholar]
- Chen, Y.; Li, Y.; Pantelous, A.A.; Stanley, H.E. Short-run disequilibrium adjustment and long-run equilibrium in the international stock markets: A network-based approach. Int. Rev. Financ. Anal. 2020, 79, 3586251. [Google Scholar] [CrossRef]
- González, M.d.; Jareño, F.; Skinner, F.S. Asymmetric interdependencies between large capital cryptocurrency and Gold returns during the COVID-19 pandemic crisis. Int. Rev. Financ. Anal. 2021, 76, 101773. [Google Scholar] [CrossRef]
Figure 1.
Volatility transmission diagram. Note: The brownish yellow color indicates a net volatility receiver, whereas the darkish blue color shows a volatility contributor. The thickness of the lines indicates the magnitude of the volatility transmission.
Figure 1.
Volatility transmission diagram. Note: The brownish yellow color indicates a net volatility receiver, whereas the darkish blue color shows a volatility contributor. The thickness of the lines indicates the magnitude of the volatility transmission.

Figure 2.
Total connectedness index dynamics (TCI). Note: TCI is total connectedness index and TCI_adj is the adjusted total connectedness index among the stock returns of the vaccine producers.
Figure 2.
Total connectedness index dynamics (TCI). Note: TCI is total connectedness index and TCI_adj is the adjusted total connectedness index among the stock returns of the vaccine producers.

Figure 3.
Net volatility spillovers.

Figure 4.
Volatility transmission from market to market.

Figure 5.
Cross-quantile dependence from AstraZeneca to Sinopharm. Notes: The vertical axis indicates the quantile distribution of AstraZeneca’ stock return, whereas the horizontal axis indicates the quantile distribution of Sinopharm’s stock return. The white-to-black intensity in the bar indicates negative to positive associations.

Figure 6.
Cross-quantilogram dependence from Sinopharm to AstraZeneca. Notes: The vertical axis indicates the quantile distribution of Sinopharm’s stock return, whereas the horizontal axis indicates the quantile distribution of AstraZeneca’s stock return. The white-to-black intensity in the bar indicates negative to positive associations.

Figure 7.
Cross-quantile dependence from Johnson & Johnson to Pfizer. Notes: The vertical axis indicates the quantile distribution of Johnson & Johnson’s stock return, whereas the horizontal axis indicates the quantile distribution of Pfizer’s stock return. The white-to-black intensity in the bar indicates negative to positive associations.

Figure 8.
Cross-quantilogram dependence from Moderna to Pfizer. Notes: The vertical axis indicates the quantile distribution of Moderna’s stock return, whereas the horizontal axis indicates the quantile distribution of Pfizer’s stock return. The white-to-black intensity in the bar indicates negative to positive associations.

Figure 9.
Cross-quantilogram dependence from Moderna to AstraZeneca. Notes: The vertical axis indicates the quantile distribution of Moderna’s stock return, whereas the horizontal axis indicates the quantile distribution of AstraZeneca’s stock return. The white-to-black intensity in the bar indicates negative to positive associations.

Figure 10.
Cross-quantile dependency from Moderna to Johnson & Johnson. Notes: The vertical axis indicates the quantile distribution of Moderna’s stock return, whereas the horizontal axis indicates quantile distribution of Johnson & Johnson’s stock return. The white-to-black intensity in the bar indicates negative to positive associations.

Figure 11.
Cross-quantile dependency from Moderna to Sinopharm. Notes: The vertical axis indicates the quantile distribution of Moderna’s stock return, whereas the horizontal axis indicates the quantile distribution of Sinopharm’ stock return. The white-to-black intensity in the bar indicates negative to positive associations.

Figure 12.
Cross-quantile dependency from Pfizer to Moderna. Notes: The vertical axis indicates the quantile distribution of Pfizer’s stock return, whereas the horizontal axis indicates the quantile distribution Modena’s stock return. The white-to-black intensity in the bar indicates negative to positive associations.

Figure 13.
Cross-quantile dependency from Johnson & Johnson to Moderna. Notes: The vertical axis indicates the quantile distribution of Johnson & Johnson’s stock return, whereas the horizontal axis indicates the quantile distribution of Moderna’s stock return. The white to black intensity in the bar indicates negative to positive associations.

Figure 14.
From Moderna to the other respective markets.

Figure 15.
From Pfizer to the other respective markets.

Figure 16.
From Johnson & Johnson to other respective markets.


Table 1.
Description of variables.
| Variable | Description | Vaccine First Authorization | Source |
|---|---|---|---|
| Sinopharm | Stock return of Sinopharm company. The data is transformed by taking the natural log. | 25 February 2021 in China. | Refinitiv Eikon |
| Astrazeneca | Stock return of Astrazeneca company. The data is transformed by taking the natural log. | 30 December 2020 in Britain 29 January 2021 in EU 10 February 2021 in WHO. | Refinitiv Eikon |
| Moderna | Stock return of Moderna company. The data is transformed by taking the natural log. | 18 December 2020 in the US, 6 January 2021 in the EU. | Refinitiv Eikon |
| Pfizer | Stock return of Pfizer company. The data is transformed by taking the natural log. | 2 December 2020 in Britain, 21 December 2020 in the US, 31 December 2020 in WHO. | Refinitiv Eikon |
| Johnson & Johnson | Stock return of Johnson & Johnson company. The data is transformed by taking the natural log. | 27 February 2021 in the US, 11 March 2021 in the EU. | Refinitiv Eikon |
Table 2.
Market volatility spillovers.
| AstraZeneca | Johnson & Johnson | Moderna | Pfizer | Sinopharm | FROM Others | |
|---|---|---|---|---|---|---|
| AstraZeneca | 49.00 | 20.10 | 16.60 | 6.82 | 7.48 | 51.00 |
| Johnson & Johnson | 18.66 | 44.36 | 19.33 | 13.98 | 3.66 | 55.64 |
| Moderna | 12.11 | 16.56 | 58.32 | 8.62 | 4.40 | 41.68 |
| Pfizer | 7.75 | 15.80 | 20.74 | 50.78 | 4.93 | 49.22 |
| Sinopharm | 13.01 | 8.11 | 12.26 | 5.69 | 60.93 | 39.07 |
| TO others | 51.53 | 60.56 | 68.93 | 35.11 | 20.48 | 236.61 |
| Inc. own | 100.53 | 104.92 | 127.25 | 85.89 | 81.41 | TCI |
| NET | 0.53 | 4.92 | 27.25 | −14.11 | −18.59 | 47.32 |
Notes: NET is calculated by deducting volatility received from volatility contribution.
Publisher’s Note: MDPI stays neutral with regard to jurisdictional claims in published maps and institutional affiliations. |
© 2022 by the authors. Licensee MDPI, Basel, Switzerland. This article is an open access article distributed under the terms and conditions of the Creative Commons Attribution (CC BY) license (https://creativecommons.org/licenses/by/4.0/).
Share and Cite
MDPI and ACS Style
Sohag, K.; Gainetdinova, A.; Hammoudeh, S.; Shams, R. Dynamic Connectedness among Vaccine Companies’ Stock Prices: Before and after Vaccines Released. Mathematics 2022, 10, 2812. https://doi.org/10.3390/math10152812
AMA Style
Sohag K, Gainetdinova A, Hammoudeh S, Shams R. Dynamic Connectedness among Vaccine Companies’ Stock Prices: Before and after Vaccines Released. Mathematics. 2022; 10(15):2812. https://doi.org/10.3390/math10152812
Chicago/Turabian StyleSohag, Kazi, Anna Gainetdinova, Shawkat Hammoudeh, and Riad Shams. 2022. "Dynamic Connectedness among Vaccine Companies’ Stock Prices: Before and after Vaccines Released" Mathematics 10, no. 15: 2812. https://doi.org/10.3390/math10152812
Note that from the first issue of 2016, this journal uses article numbers instead of page numbers. See further details here.