Article

The Influence of Service Quality on User’s Perceived Satisfaction with Light Rail Transit Service in Klang Valley, Malaysia

by
Ahmad Nazrul Hakimi Ibrahim
1,2,*,
Muhamad Nazri Borhan
1,2,*,
Mohd Haniff Osman
2,3,
Muhamad Razuhanafi Mat Yazid
1,2 and
Munzilah Md. Rohani
4
1
Department of Civil Engineering, Faculty of Engineering and Built Environment, Universiti Kebangsaan Malaysia, Bangi 43600, Selangor, Malaysia
2
Sustainable Urban Transport Research Centre, Faculty of Engineering and Built Environment, Universiti Kebangsaan Malaysia, Bangi 43600, Selangor, Malaysia
3
Department of Engineering Education, Faculty of Engineering and Built Environment, Universiti Kebangsaan Malaysia, Bangi 43600, Selangor, Malaysia
4
Smart Driving Research Centre, Faculty of Civil Engineering and Built Environment, Universiti Tun Hussein Onn Malaysia, Batu Pahat 86400, Johor, Malaysia
*
Authors to whom correspondence should be addressed.
Mathematics 2022, 10(13), 2213; https://doi.org/10.3390/math10132213
Submission received: 9 April 2022 / Revised: 18 June 2022 / Accepted: 22 June 2022 / Published: 24 June 2022
(This article belongs to the Special Issue Quantitative Methods for Social Sciences)

Abstract

:
Light rail transit (LRT) systems are vital aspects of the worldwide endeavor to achieve transport sustainability and have been essential in enhancing the economies of urban areas. Issues such as pollution, the risk of road accidents, and traffic congestion could be resolved using this progressive alternative. The statistics showed that only 20% of the commuters in Malaysia use public transport, including LRT, and 80% use private transportation. It is relatively low compared to other Asian countries. High-quality service is essential to improve users’ perceived satisfaction with the provided services and increase LRT ridership. The objective of the present study is to acquire an understanding of which factors are crucially influential on users’ perceptions of satisfaction. In-person questionnaires were utilized to obtain the information for this paper, with a total of 417 LRT riders in Malaysia’s Klang Valley surveyed. This study adopted the factor analysis, correlation test, and artificial neural network (ANN) model. Eight elements related to the quality of service were extracted to ascertain how they influenced the perceived satisfaction of users: information signs, ticket-based services, amenities, safety, employee performance, speed, comfort, and the service details available to riders. Each factor was significantly related to the perceptions of satisfaction, according to the correlation test. Finally, the ANN model shows that the dominant factors determining the LRT users’ perceived satisfaction are the signage, amenities, and provision of information. The findings of this research should benefit the providers of services, policy makers, and planning departments by enabling them to formulate successful approaches that ensure user satisfaction is enhanced and the number of riders on the LRT increases.

1. Introduction

Worldwide, many nations have become more urbanized due to economic expansion. While this affects advanced and developed nations, Indonesia, Malaysia, and Thailand are some of the developing countries in which urbanization has also occurred [1]. The transformation of rural areas into urban landscapes defines the complicated phenomenon of urbanization [2]. Shen et al. [3] have claimed that the city landscape has been remodeled and dramatically altered by urbanization, while mobility is in greater demand due to the rising population of urban areas. People have traditionally relied on their own transport to move around in their daily life. For example, Kwan et al. [4] stated that Kuala Lumpur had an 83% private transport use rate, while public transportation was used by 17%. Relying so extensively on private transport has several negative effects: environmental conditions and the quality of life are adversely impacted, while it also leads to busier roads, polluted air, noisy conditions, and traffic accidents [5,6,7,8,9]. According to Mouwen [8], transport is responsible for 40% of the emissions of carbon dioxide and over 70% of different pollutant types.
Public transport is an excellent alternative to solve these problems [6,8,9,10]. Wall et al. [11] and Ibrahim et al. [12] noted that the use of sustainable modes of transportation—for instance, city center public transport systems—reduced traffic congestion and the emissions of CO2 and NOX per mile. A prediction by Replogle and Fulton [13] was that if cities could keep people using public transportation, cycling, and walking, then urban emissions from transportation could be reduced by 40% by 2050. Nevertheless, it remains a major challenge to reduce the dependence on private transportation and raise the number of public transportation users, particularly in urban settings [14]. Transportation researchers, policymakers, and practitioners have been exploring strategic methods to encourage people to choose public transport over private transport [9,15,16,17,18].
Across the majority of the globe, the use of private vehicles is still higher than the use of public transportation [19]. Reviewing literature from Asia, Zulkifli et al. [20] indicated a specific issue: the use of public transportation via rail systems was especially poor. Since private vehicles are seen as faster, more flexible, comfortable, and private, they tend to be preferred to the use of public transport [2,7]. Various researchers have noted how many of the riders on public transportation are dissatisfied with the level of the services delivered, which fails to correspond to the standard expected. This leads to the low rates of public transport usage [15,21,22]. Meanwhile, user dissatisfaction means an absence of loyalty to such services, and riders would not suggest these services to other people [3]. A number of researchers have investigated how satisfied riders were with systems of public transportation, such as railways [3,14,23] and buses [24], discovering that user satisfaction is the dominant aspect driving consumers to utilize the services at a later time and give others a recommendation about using a service. Developing public transport services of higher quality would potentially attract more riders and encourage the existing riders to remain loyal. This would increase rate of public transport usage and generate more profits for the providers of these services.
The significant effect of the standard of public transportation services on user perceptions of satisfaction has recently been evidenced in the numerous case studies in the transport-focused literature, which has featured Malaysia [9,25,26], the Philippines [27,28], Indonesia [29,30], and Thailand [31,32]. The models that have been developed from previous studies to study the public transport user’s perceived satisfaction mainly employed the conventional methodologies including the structural equation model [9,24,33,34], logit model [35,36], and the probit model [37,38,39]. Nonetheless, these orthodox approaches need models to have pre-requisites and assumptions. According to Garver [40], researchers of consumer satisfaction seldom acquire model assumptions (for instance, normality of data, relationships of linearity between a dependent variable and an independent variable, as well as low multicollinearity). The reasons are the considerable degree of heterogeneity and the subjectivity of findings linked to people’s perceptions and behaviors. In the current research, this refers to the perceptions of how satisfied users were with the LRT [35,36]. Additionally, Abbas et al. [41] contended that complex systems related to humans and societies could not be addressed sufficiently by the conventional paradigms for predicting, diagnosing, regulating, and optimizing, such as regression analyses and models of structural equations.
To date, the works by Chong [42], Garrido et al. [43], Ibrahim et al. [44] and Leong et al. [45] have posited the use of artificial neural networks (ANNs) by behavior-focused researchers to deal with these above-mentioned limitations within their methodological approaches. ANNs, which are non-parametric models, are well capable of predicting and capturing intrinsic relationships of high non-linearity between variables, but they do not require models to include the same assumptions and pre-requisites as the standard approaches. The latter include the discrete selection model (such as the probit or logit models) and the structural equation model [43,46]. As Garrido et al. [43] discovered, their ANN model produced superior predictive accuracy, providing over 90% compared to other methods such as the decision tree (whose accuracy level ranged from 59.72% to 62.16%); their context was analyzing the standards of public transportation services in Granada (Spain). Furthermore, their outcomes aligned with those of various researchers who have also employed the ANN method when investigating how the variables of service quality have relatively affected domains unrelated to transportation, such as the service [45,47] and education sectors [48]. Therefore, with the findings from the existing works justifying the current case study, the artificial neural network (ANN) model was employed to examine which principal elements of the standards of service influenced how users perceived satisfaction, in the context of the light railway network in the Klang Valley.
This paper is arranged into six sections: in the second section, the attributes of user satisfaction with the service standard of public transport are explored. In the third section, the study’s methodology is described. In the fourth section, the outcomes of the data analysis are presented, while in the fifth section, the discussion focuses on what this study implies in terms of theory and practice. The sixth and last part summarizes the principal outcomes and concludes the article.

2. Literature Review

2.1. Users’ Satisfaction with the Service Quality Attributes

The justification for modern enterprises adopting the customer orientation philosophy and principles of continuous improvement is customer satisfaction. Generally, service quality determines customer satisfaction. Service standards can be described as how customers evaluate, overall, the way a provider of a service delivers it [49]. As Lai and Chen [14] outlined, the quality of service is the level to which the service that is delivered meets the consumers’ requirements. There is an expanding number of studies in the marketing literature focusing on customer satisfaction, such as Lien, Cao and Zhou [50], Ayalon et al. [51], Wikhamn [52], Kadic-Maglajlic, Boso and Micevski [53], Radojevic et al. [54].
According to the industrial market literature, customers satisfaction is a critical determiner of service or product repurchase. According to Homburg and Rudolph [55], the establishment, development, and maintenance of positive relationships with consumers is essential to customers’ satisfaction. Satisfaction with a relationship can be used as a measurement of the customers’ assessments in the context of a relationship [56,57]. The definition of satisfaction given by Homburg and Rudolph [55] in Ouhna and Mekkaoui [56] was that it was a way to construct relationships by outlining how a supplier might address various aspects of customers’ expectations. These include product attributes, product-related details, services, order taking, and managing complaints, as well the ways commercial and internal workers interact with consumers (pp. 17–18).
The satisfaction concept in the industrial market motivated transportation researchers to study satisfaction with transportation. Over the past years, many studies have explored the notion of satisfaction with public transport [23,50,58,59,60,61]. Public transportation authorities deliver an array of offerings, and overall user satisfaction with these services is reflected by how content the ridership is with the public transportation actually delivered. A simplified definition was offered by Morfoulaki, Tyrinopoulos and Aifadopoulou [62] and van Lierop et al. [19]: customer satisfaction refers to a comparison between consumers’ general experiences when using services and the expected service quality.
Several studies [32,33,63,64,65] posited that the way to expand the ridership of light railway transportation was by making users more satisfied through top-quality services. As Zafreh et al. [66] argued, if users are satisfied, this might enable current riders to be retained and new riders to be attracted. In the context of public transport, users’ contentment is the degree the service provider fulfils the expectations or needs of the riders [62]. Numerous researchers of transportation have previously examined the effects of users’ contentment with the public transport services that they patronize. According to Irtema et al. [6], for instance, how satisfied customers are and how they intend to behave are critically determined by Kuala Lumpur’s public transport service quality. In Turkey, a high-speed rail system was the subject of a case study by Yilmaz and Ari [23], which demonstrated how the quality of the service affected users’ satisfaction, led to fewer complaints, and made users more loyal.
Other studies [24,34] investigating the connections between service quality, user satisfaction, how much users complained, and how loyal they were reported similar outcomes. When examining Hong Kong’s Mass Rapid Transit system, people’s intentions to ride the service were strongly and directly determined by the satisfaction of the users [14]. The standards of service is an essential determinant of how satisfied users are with networks of public transport [23,24,58]. The investigated attributes differ for various reasons: the report writers themselves, the study locations, and the forms of public transportation, as listed in Appendix A.

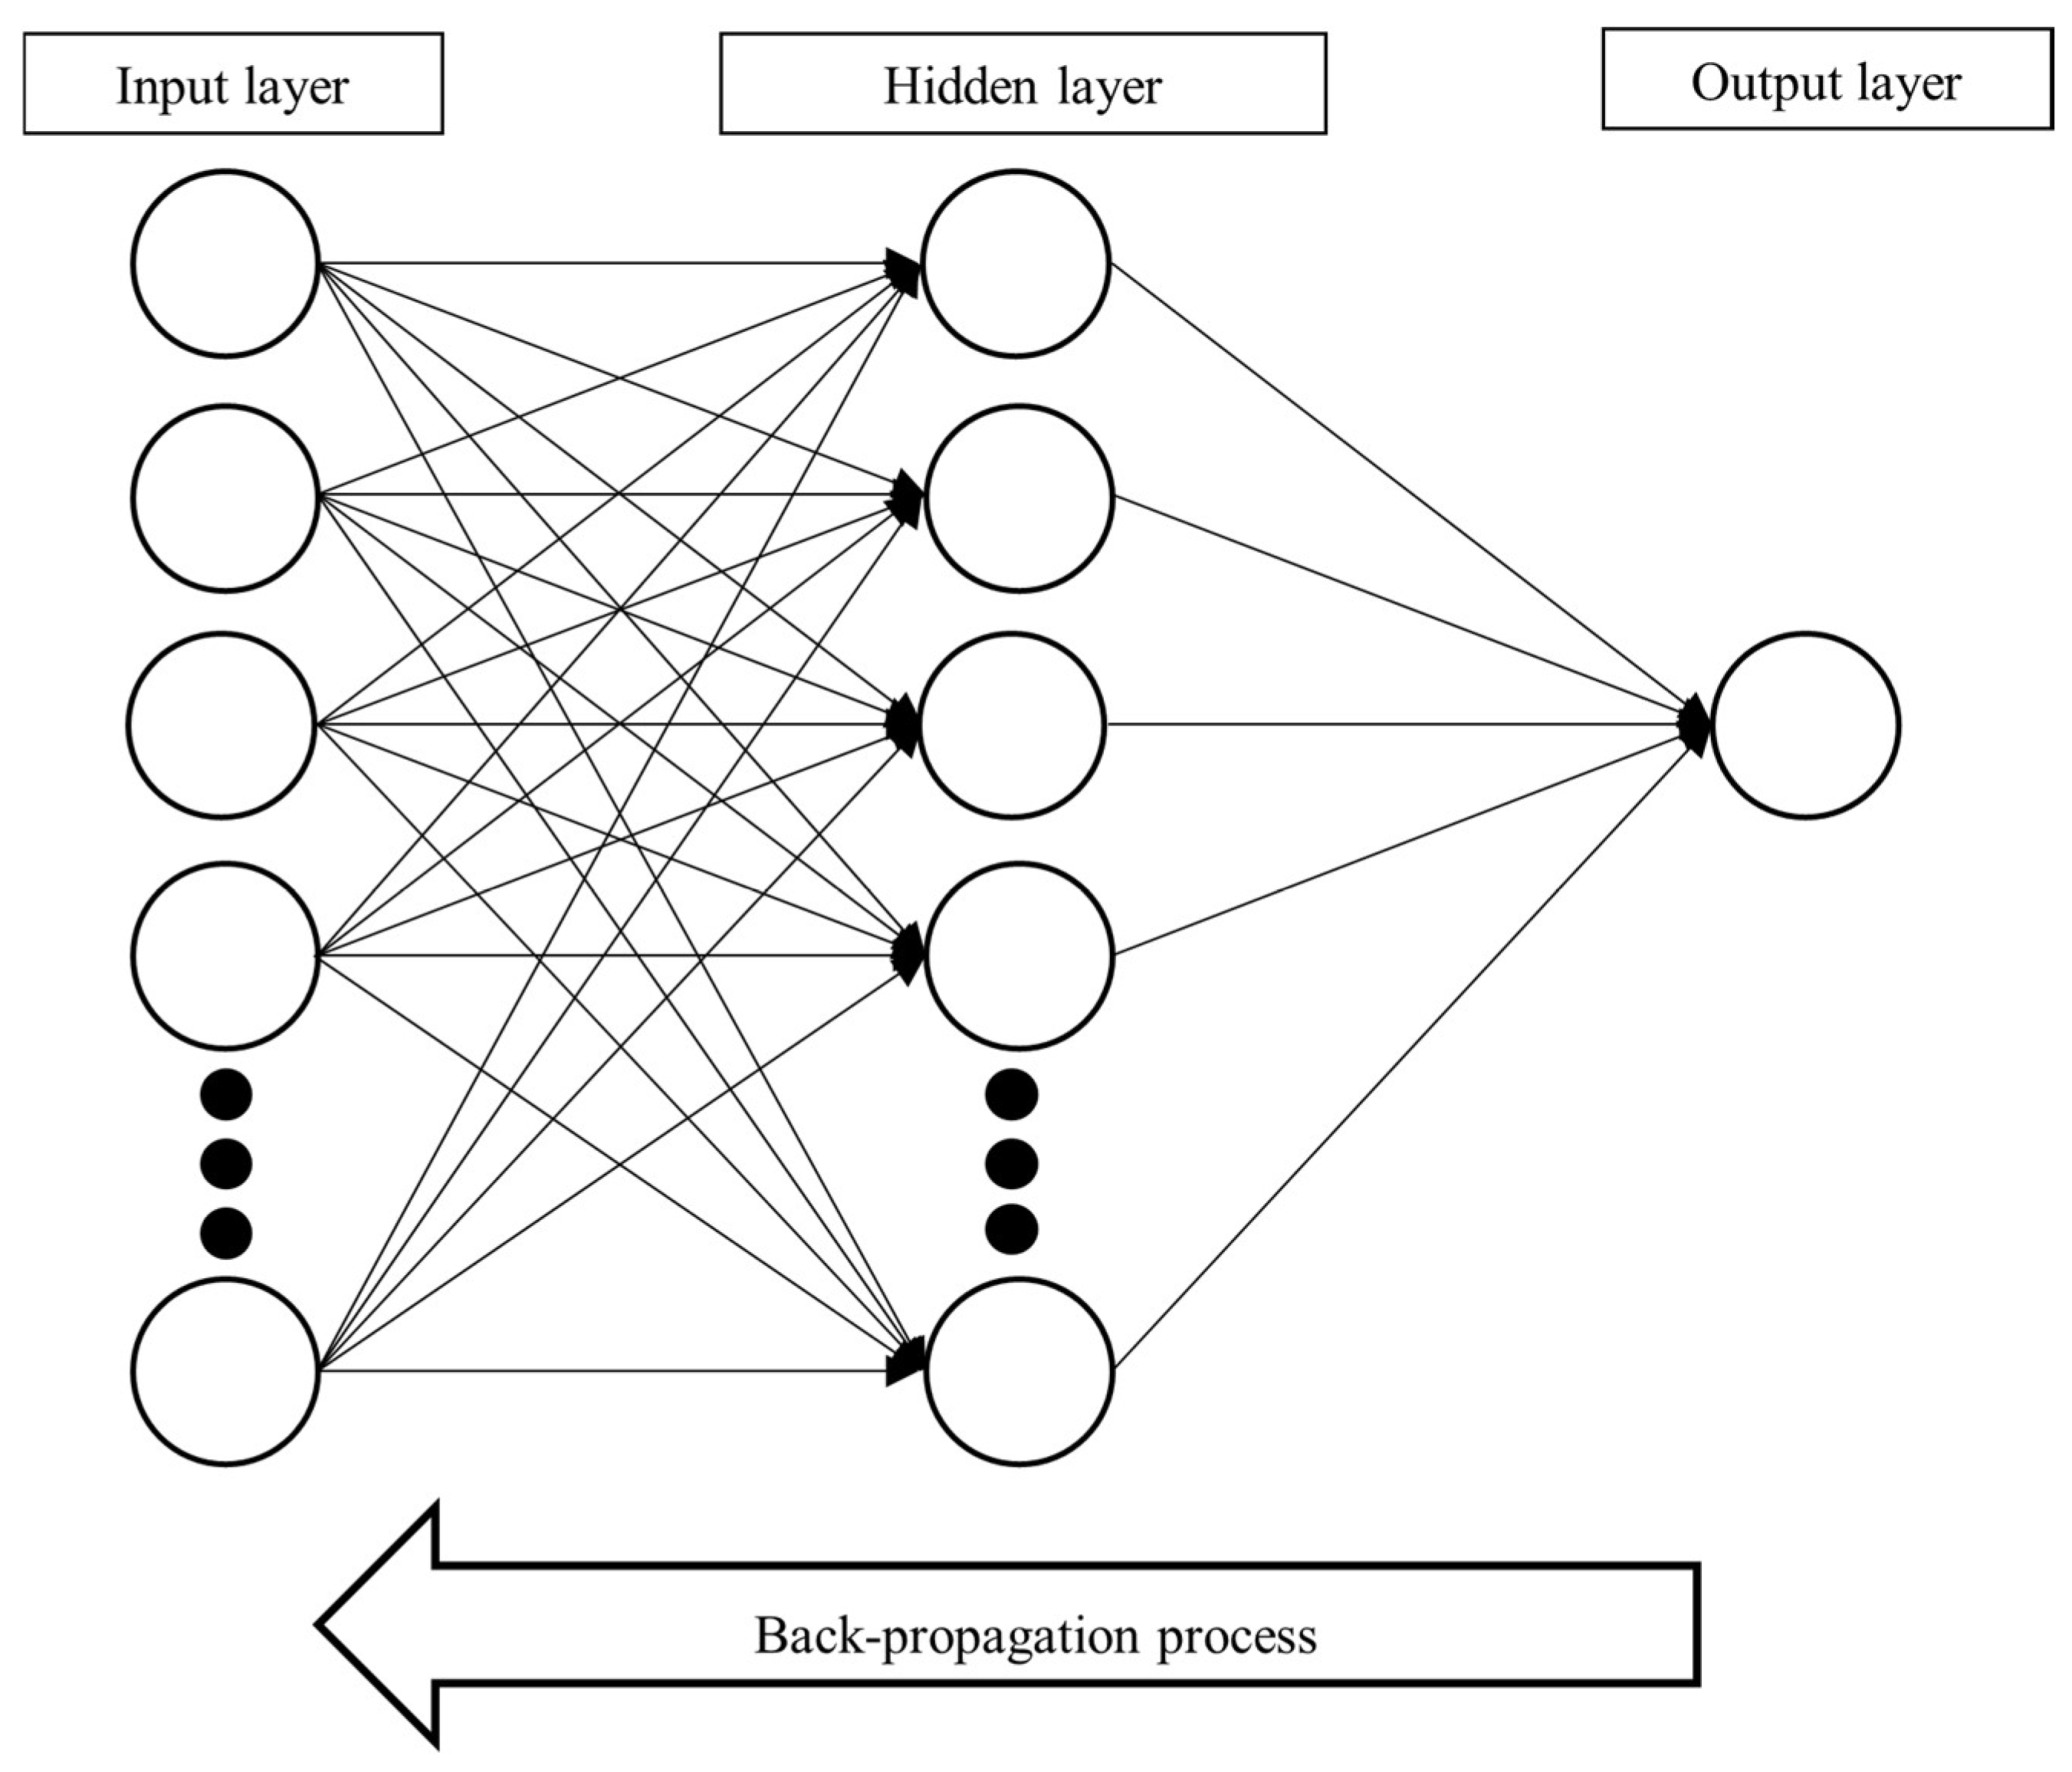
2.2. Artificial Neural Network Model

The method of predicting using artificial neural networks (ANN) features exercises that train a computer to learn using the data provided. The technique uses the human brain’s structure as its basis; in other words, it uses numerous basic elements to process information [67]. Thus, ANN is a way to use computer programs to categorize and recognize trends and similarities in the data employed [68]. The relevant array of variables provides the data which ANNs capture; they then use the existing information to learn, irrespective of the presence of interference [43]. Therefore, no formulations or prefix models are required [69,70].
It is possible to train a neural network to demonstrate particular functions; to do so, the value of the association (weight) between each element is adjusted [71]. When training is in progress, ANNs potentially confirm and check how the input and output data are related, which can be complicated. Subsequently, a synthesis is performed [72]. Once a particular sample of datasets has been used to train an ANN, it can detect similarities between the data and future data to make estimations [73]. Furthermore, ANN has the ability to detect equations in inputs, although those inputs have never been seen before. This allows ANN to have good interpolation capabilities, especially if the data input may be inaccurate or there is a glitch [73].
The most common forms of neuronal networks utilized in making forecasts are outlined in Equation (1):
Y = F H 1 x ,   H 2 x , H n x + u
where x is the clarifying variables group, Y is the reacting variable, F and H are the functions of the network, and u is the term model error [73].
Characterizing ANN models, they contain a network of three layers: the hidden, input, and output layers. These resemble the human body’s neuron network [67,68,74]. ANNs consist of neurons—many basic elements used to process information—which are arranged by their various layers and connected to one other via the synaptic’s weight. The latter is a representation of how intensely the neuron pairs are related, as well as the function of activation, which is used to calculate each neuron’s potential [43,74].
The multi-layered perceptron model (MLP) is the ANN type that is employed most frequently to give a prediction [43,74,75,76]. MLP is a network of artificially supervised neurons based on the original model of a simple perceptive. Figure 1 shows three layers of the reverse slowing network. The input layer is the first layer, which matches the variable of the problem input, whereby a node corresponds to an input variable. Secondly, a hidden layer is utilized to obtain the relationships of non-linearity between variables. The value of the forecast is provided by the output layer, which is third. The input layer’s neuron number equals the independent or input variable numbers, while the output neuron number equals the dependent or output variable number. The variable’s first value is received by the input layer, the network outcome for the input is shown by the output layer, while the output is intended to be achieved by a function performed by the hidden layer [74].

3. Research Methodology

Malaysia’s Klang Valley light rail transit (LRT) network was the focus of the current case study. The Ampang and Kelana Jaya Lines are the components of the LRT network. The Ampang Line began operation in 1998. Operated by drivers, the Ampang Line service features a pair of sub-lines that run from the northern KL district of Sentul either east to Ampang or south to Sri Petaling [77]. At the midpoint of the two lines, Chan Sow Lin Station, one train branches off to Ampang and one to Sri Petaling. The Ampang Line is 18 km in length and features 18 stations, while the Sri Petaling Line is 45.1 km in length and features 29 stations. The Kelana Jaya Line began its operations in 1999. The Kelana Jaya Line, an automatic (driverless) LRT system, is a single-line service linking Petaling Jaya in the western part of the Klang Valley to Gombak in the north-eastern part. This line spans 46.4 km and has 37 stations.
This study adopted the instrument used in previous studies, such as Shen et al. [3], Irtema et al. [6] and Kuo and Tang [64]. Refinements of this instrument were devised to ensure it was suited to the specific context of Malaysia’s society, economy, and culture. The instrument also underwent back-translation into Malay. To administer the questionnaire, it was pilot-tested with 50 participants chosen at random from Bandar Baru Bangi in Selangor. The purposes were to resolve whichever issues might be identified in this version of the instrument design and assist the research team to make improvements. Only then would the questionnaire be administered as part of a real survey [78]. The pilot test feedback suggested the need to omit certain questions as they had either not been answered by the respondents or been answered erroneously. Revisions were made to other questions so they would be clearer and more reliable. The Cronbach alpha value for all factors is ranging between 0.801 and 0.931 indicated that the instruments based on pilot study is reliable (α ≥ 0.80).
The final collection of data for the current study utilized a questionnaire with two principal parts: the demographic attributes of the respondents, as well as the quality of service and the satisfaction perceived by the users; these are listed as Appendix B. Section 2’s questions used a Likert scale with five points, which ranged between 1 = Strongly disagree and 5 = Strongly agree. If a specific measure was of more interest, this would be indicated by a higher score.
The principal research was undertaken in the Klang Valley, the LRT’s area of operation. The data for this study was obtained at stations that have the greatest number of users, such as Bandar Tasik Selatan and Kuala Lumpur Central. This study used the convenience sampling technique to administer the cross-sectional questionnaire to the respondents. The target respondents all had to fulfil the following conditions: (i) to be a Malaysian citizen and (ii) to have ridden on the LRT over the previous month. The enumerators administering the questionnaire were briefed on the purpose of the survey. Any likely respondent was asked to confirm their willingness to be surveyed. So that the questionnaire’s items would be answered accurately and reliably, an enumerator would only interview people who expressed a willingness to be involved. Borhan et al. [79] contended that this technique could raise the response rates of surveys. In-person interviews were conducted with each respondent and lasted around 10 to 15 min, while they afterwards received a small token of appreciation.
From 20 September to 10 December 2019, 500 self-administered questionnaires were issued. Of the questionnaires received back, 83 were rejected because the responses were invalid and/or had not been completed. Overall, 417 of the questionnaires were considered for the subsequent analysis, so the actual rate of response was 83.40%. The 417 respondents is sufficient to reflect the population of the Malaysian as this numbers is exceed the minimum number of respondents required in this study as suggested by Krejcie and Morgan [80]. Additionally, this study used a number of respondents which, in total, matched the number participating in prior research in the Malaysian context that had utilized the artificial neural network (ANN) method. For instance, Leong et al. [45] asked 416 participants, Ooi et al. [81] asked 415 respondents, and Alkawsi et al. [82] asked 318 participants.
This study analyzed the data using the IBM SPSS Statistics version 24.0 (IBM, Armonk, NY, USA). The current study utilized various methods. For instance, the characteristics of the respondents were evaluated though statistical descriptions. The elements of the service standards were extracted using exploration factor analysis, while the possible associations of the elements of service quality with the perceptions of satisfaction were investigated utilizing Spearman’s correlation test.
Furthermore, the elements of the service quality of the LRT that crucially determined the perceptions of satisfaction among users were identified through the development of an ANN model, which featured a feed-forward backpropagation algorithm. Eight service quality factors that extracted from EFA stages used as an input variables and perceived satisfaction factors is an output variable. The transfer function of the Sigmoid was employed, while the training and testing sets were created by randomly dividing the data into two using a 90:10 ratio. the model verification process is carried out after the optimal output is obtained from the training and testing process. Verification was carried out to ascertain the accuracy of the developed model. In the current research, the ANN model that had been developed was assessed for its accuracy using the sum of squared errors (SSE), mean squared error (MSE), root mean square error (RMSE), and determination coefficient (R2), as presented in Equations (2)–(5) [46,74,76,83].
S S E = i = 1 N t i t d i 2
M S E = 1 N i = 1 N t i t d i 2
R M S E = 1 N i = 1 N t i t d i 2
where ti is a real value, tdi is a predicted value, N is the overall number of data, and t d ¯ is an average of the values predicted.
R 2 = 1 R M S E s y 2
where Sy2 is the selected output variance based on the average of SSE value in the testing process.

4. Results

4.1. Respondent Characteristics

The 417 respondents in this study fulfilled the two criteria of being Malaysian citizens and using the light rail transit (LRT) service within the last month. Of the respondents, 50.8% were male, and 49.2% were female. Approximately 44% of the participants were aged between 21 and 30; 37.4% were between 31 and 40; 9.1% were under 20; 8.6% were between 41 and 50; and 1.2% were older than 50. More than half of the respondents (74.6%) had received education up to the degree level (Bachelor’s Degree, Master’s Degree or Doctor of Philosophy).
In terms of employment, over half of the participants (55.9%) worked full-time, 32.4% were studying, 5.8% were not working, 5.5% were part-time workers, and 0.5% belonged to different employment classifications. In terms of monthly income, 29.3% of the respondents earned less than RM2000 per month, and only 1.0% earned more than RM8000 per month. Meanwhile, a monthly income was not disclosed by 18.7% of the participants for reasons of privacy and confidentiality. The questionnaire also asked about the ownership of a driving license (Class D) and the number of cars owned by a household. Most respondents (85.4%) had a driver’s license, and 14.6% did not have a driver’s license. In addition, 27.8% of the respondents did not own a car, 33.6% owned one car, 23.3% owned two cars, and 15.3% owned three or more cars. Regarding the frequency of using the LRT services, majority of the respondents (43.9%) use the service on a regular basis (more than four days a week).

4.2. Exploratory Factor Analysis

In exploratory factor analysis (EFA), the possible structures of latent variables are identified and then employed for dividing variables into reduced sizes that are more easily managed. This is carried out through the removal of any items that have no cores in common [84,85]. In the current research, EFA was conducted by utilizing the techniques of principal component analysis (PCA) and varimax rotation. In doing so, this Malaysian light rail transit (LRT) operation was assessed through its fundamental constructs and dimensions of quality. This approach is the most recommended technique, and previous studies, especially transport studies, often used this approach [64,86,87]. This study retained the eigenvalues ≥ 1 [25,88,89]. Eigenvalues are the variances of variables, each of which uses a specific factor to explain it. Factors with eigenvalue assessments ≥1 can explain a greater level of variance than one variable. Moreover, the reliability of the factor will always be positive when the eigenvalue is ≥1.
The Klang Valley’s LRT services were measured in terms of their quality through 43 characteristics of service quality, derived from EFA. The findings demonstrate the extraction of eight constructs with eigenvalues ≥ 1, which could explain 72.152% of the variance. As illustrated in Table 1, the eight constructs were information signs (five items), safety (five items), amenities (six items), speed (four items), ticket-based services (four items), employee performance (four items), comfortable travel (five items), and the provision of details (four items). This study excluded six items in the LRT services that have a loading factor of less than 0.5 and were present in several factors (repetitive) as recommended by Maskey et al. [89] and Uca et al. [90].
Following the extraction of each factor, Kaiser’s [88] varimax rotation method was employed in EFA since this approach is used most often to identify key factors; it is also easily interpreted [91,92]. Within EFA, the authors carefully considered three criteria: (i) The measurement of Kaiser-Meyer-Olkin (KMO) sampling adequacy and Bartlett spherical test. (ii) The loading factors for each item. (iii) The analysis of the reliability of the factors identified. The current research had highly accurate sampling within the process of factor analysis, as indicated by the 0.964 KMO. Meanwhile, the Bartlett sphere test demonstrated the significance of χ2 = 16084.216, ρ < 0.000 for the LRT operations listed in Table 1. Moreover, sufficient common variance was evident in the matric between each correlation [92].
A range of 0.506 to 0.836 was found for all the measurement items’ loading factors (Table 1). Thus, using the ≥0.5 rule of thumb devised by Kuo and Tang [64] and Maskey et al. [89], every item in Table 1 was retained. Finally, the reliability analysis showed that the threshold for the Cronbach alpha is greater than 0.70 and ranged between 0.897 and 0.947 for the LRT service, thus fulfilling the requirements proposed by Hair et al. [92]. It also shows that the eight factors extracted to assess the LRT service quality are reliable.

4.3. Correlation Analysis

The outcomes of the Spearman’s correlation test of the extracted factors of service quality, as outlined in Section 4.2, and the perceptions users had of satisfaction are shown in Table 2. The table exhibits how the eight service quality elements—information signs, comfortable travel, amenities, ticket-based services, employee performance, safety, provision of details, and speed—were positively and significantly associated with the variable of perceived satisfaction. Various factors of service quality—comfort, ticketing service, facilities and information provision—were strongly and positively related (r > 0.7) to perceptions of satisfaction. This indicates that transport riders considered these features were linked with similar views on perceptions of quality. Conversely, as Table 2 shows, every service quality factor had a significant robust and moderate association with perceptions of satisfaction, suggesting that the factors of service quality, which had been extracted previously, were the key determinants of users’ satisfaction.

4.4. Artificial Neural Network Model

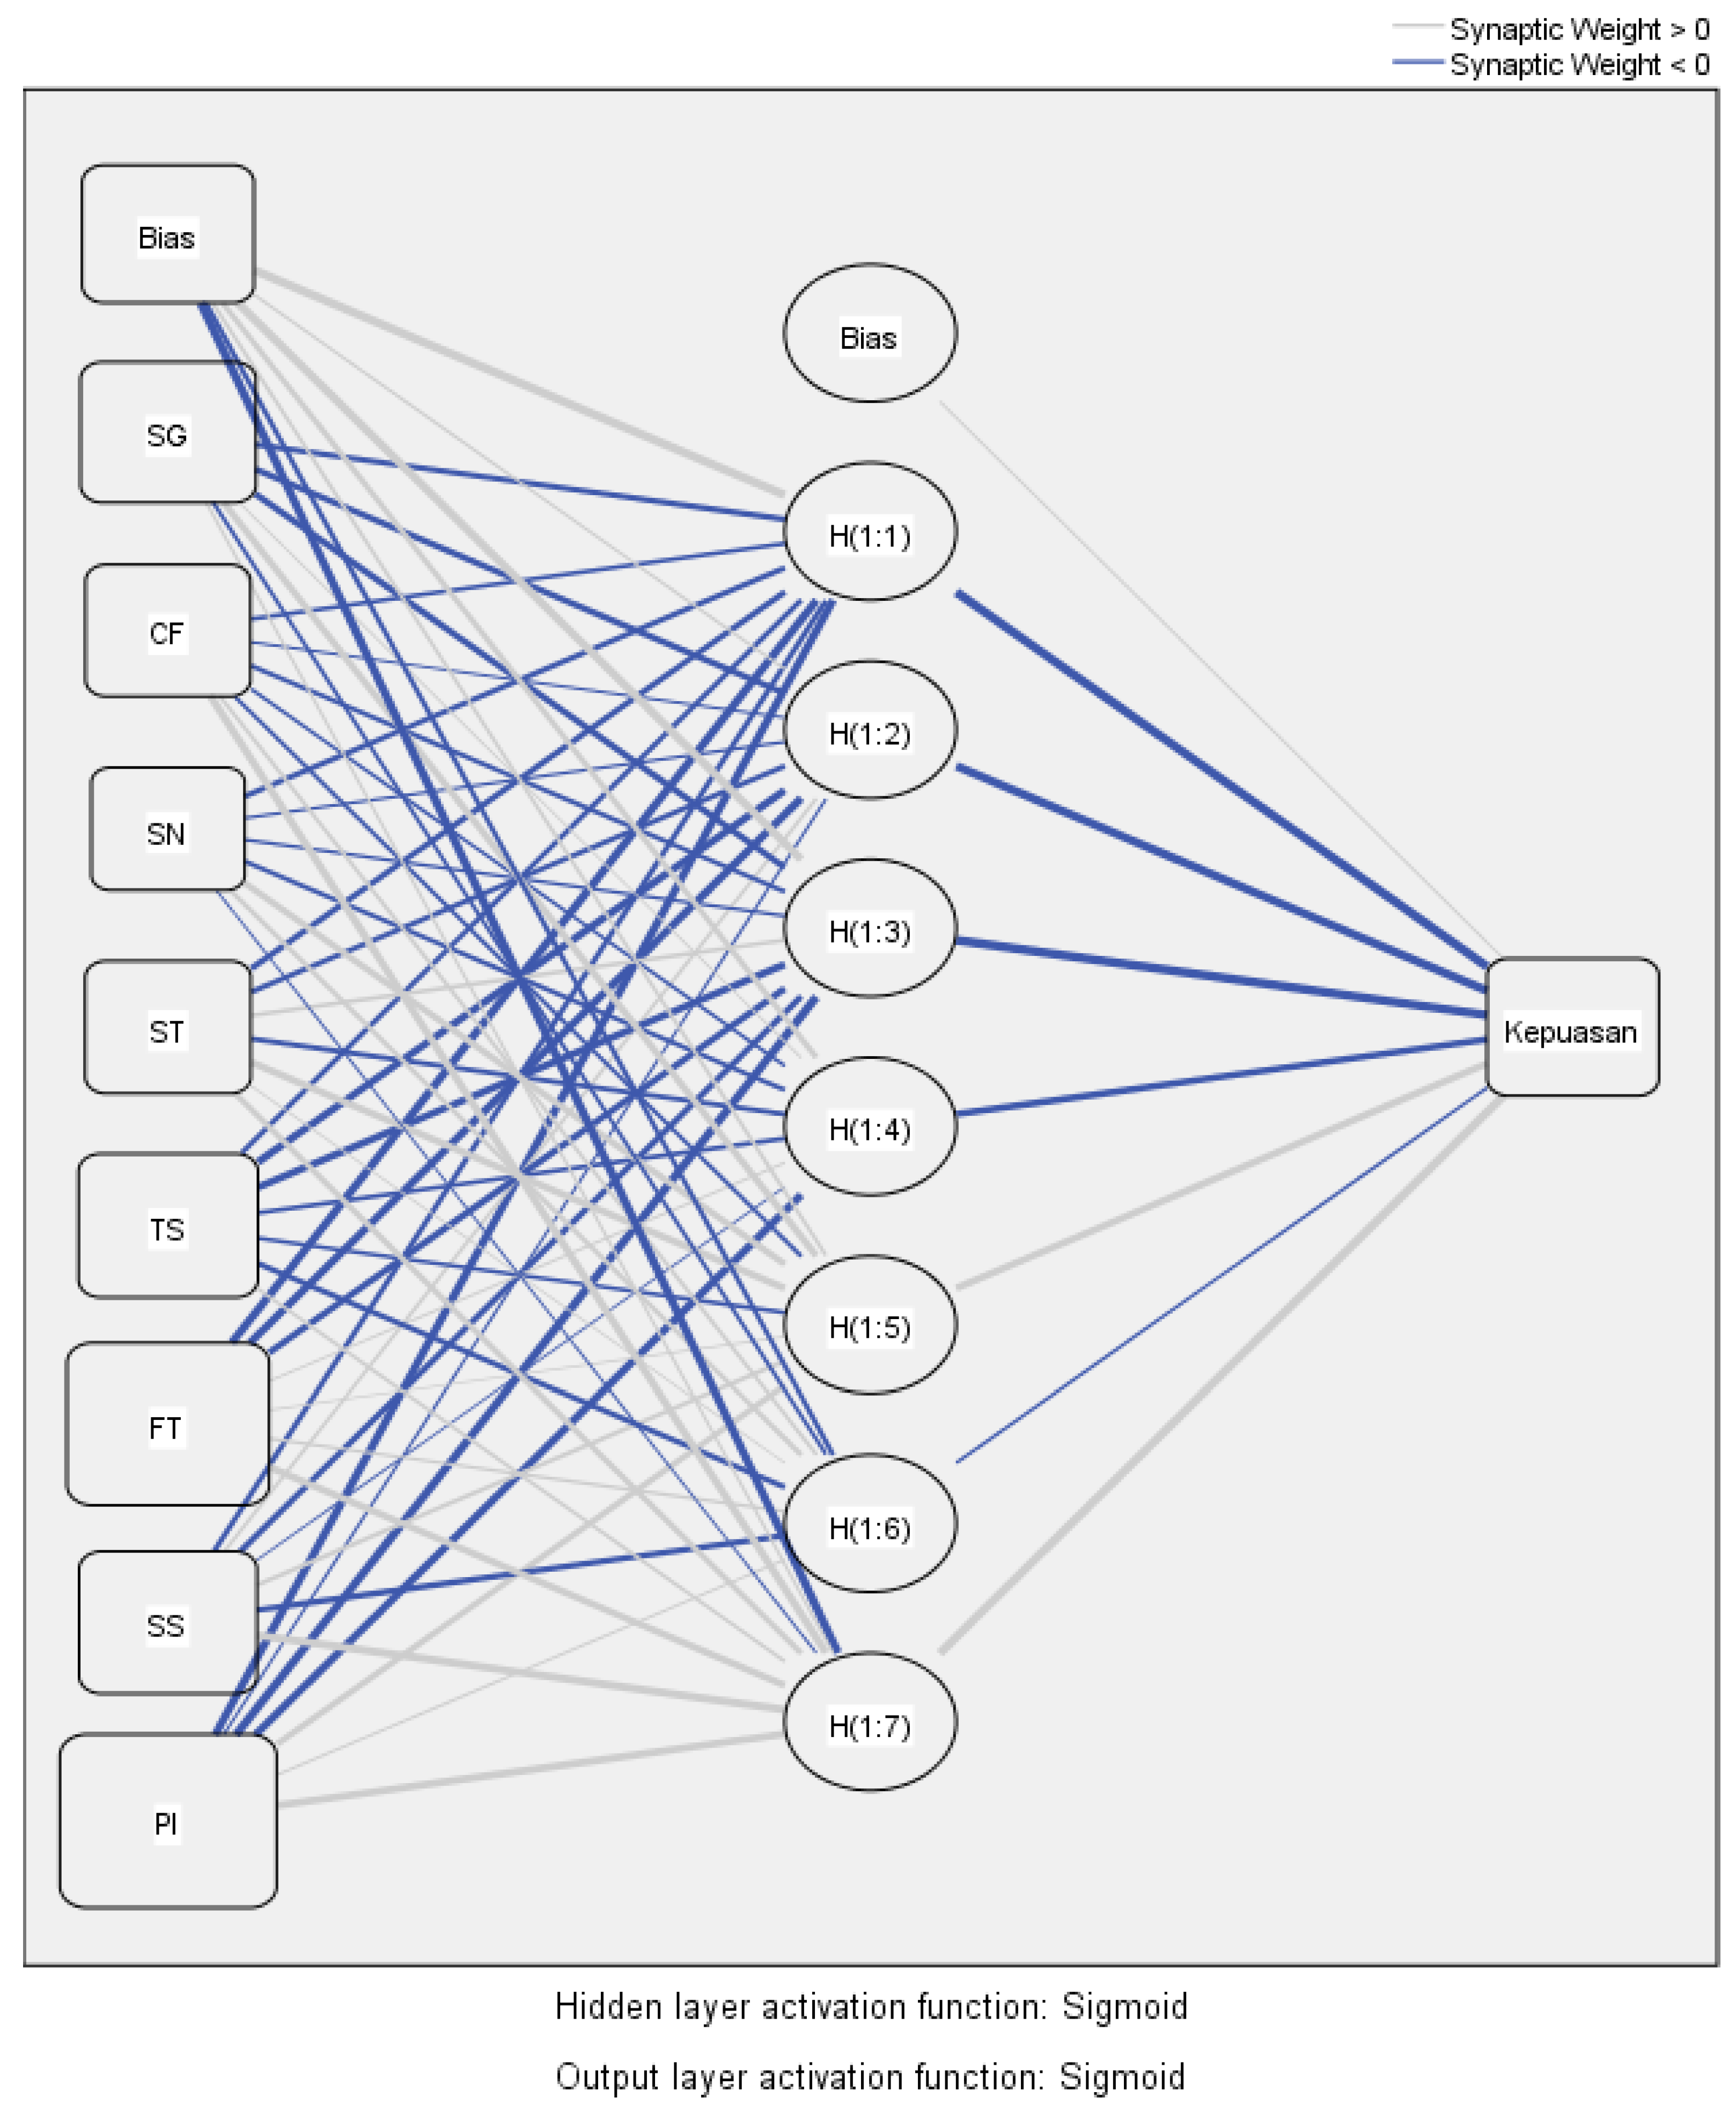
4.4.1. Artificial Neural Network Architecture

In the current research, an artificial neural network (ANN) model was developed that was intended to predict how the quality of service on the Klang Valley light rail transit (LRT) influenced the perceptions that users had of satisfaction. The multi-layered perceptron (MLP) model was utilized, along with SPSS version 24. In research into the behavior of users, this ANN model is used most often [45,93,94,95,96]. This ANN model contained eight variables as the input, which were acquired through exploratory factor analysis, as outlined in Section 4.2: information signs (SG), comfort (CF), facilities (FT), speed (SN), ticketing services (TS), staff performance (SS), safety (ST), and information provision (PI); meanwhile, the perceptions of satisfaction (Satisfaction) formed the output variable.
In the current research, the issue of over-fitting for 10% of the data utilized to test the model and for 90% of the data utilized to train the data was prevented with the use of ten-fold cross-validation; this made it possible for the predictions, when training the network, to be measured for their accuracy. The activation function of hidden layers and output layers was the sigmoid function. The neural network module of SPSS was used to spontaneously calculate the amount of hidden neurons. Seven hidden neurons were featured in the ANN network. Shown in Figure 2 is the ANN model’s architectural structure that was used to predict which factors of service quality affected the perceived satisfaction of LRT users (8-7-1).

4.4.2. Assessment of Model Performance

The ten-fold cross-validation prevented the overfitting problem in the model [46,96]. The seven nods in the hidden layer were optimum and accurately predicted the output variable (see Figure 2). When the data were trained and tested for the ten neural networks, the accuracy of the artificial neural network (ANN) model’s predictions were estimated, using as an indicator the root mean square error (RMSE). For each set of data, the RMSE standard deviation and average values are presented in Table 3. When considering the light rail transit (LRT) service, relatively low average (trained: 0.108, tested: 0.107) and standard deviation (trained: 0.004, tested: 0.017) RMSE values were revealed. Thus, considerable match accuracy was shown by the service model, as these values indicate.
According to Leong et al. [46] and Veerasamy et al. [97], lower values for RMSE indicate the highly accurate predictions of an ANN model, while the values predicted and the actual data match excellently. The model created through this study had a lower RMSE value than those devised, first, for the government’s mobility-focused response approach forecast [95] and, second, for ascertaining the factor of smart meter acceptance (power supply) in Malaysia [82]. Furthermore, the non-zero synaptic weight quantity linked to the hidden neurons, a confirmation of the predictor’s relevance.
The current research employed the values of the determination coefficient (R2), as well as the values for the mean squared error (MSE), root mean square error (RMSE), and sum of squared error (SSE). The ANN model potentially predicts the perceptions of satisfaction that users expressed in relation to the Klang Valley LRT services, as demonstrated by the 79.70% accuracy of the calculated R2 values. As Shen et al. [3] stated, better match accuracy is indicated by high R2 values, whereby R2 values of 67% are high, moderate would equate to values of 33%, and low would be 19%. This study’s models obtained consistent values of R2 (≥70%), corresponding to outcomes of other research, in which user behavior predictions were made using the ANN non-parametric model [45,82,93].

4.4.3. Sensitivity Analysis

Analysis of sensitivity can be referred to as all the independent factors’ importance in measuring the extent to which value predictions by neural network models altered with an independent variable’s value [42,98]. In terms of the total contribution of the input neurons (see the average of relative important value in Table 4), three factors of LRT service quality namely provision of information, facilities and signage shows the highest weight of the input layer of 0.213, 0.189 and 0.146, respectively. This indicated these service quality factors are the most important variable influencing user’s perceived satisfaction to service provided. The lowest weight of the input layer recorded in this study is 0.057 for safety. When the importance values of all the independent variables (input neurons) are divided by the largest values of importance, this produces the normalized importance value, which is expressed in percentage form [96,99]. As revealed by the analysis sensitivity, information provision of (100.0%), facilities (88.8%), and information signs (68.2%) were the three factors that had the most influence when predictions were made of user perceptions of satisfaction with the LRT service, as illustrated in Table 4. Meanwhile, speed (36.5%), comfort (35.8%), and safety (26.6%) were the three least influential factors in terms of user perceptions of satisfaction with the LRT service.

5. Discussions of the Results

5.1. Theoretical Implication

The results of the current study potentially offer in-depth and extensive details of how users perceive Malaysian cities’ rail transit transport in terms of the quality of service. As a case study, the researchers selected the Klang Valley’s system of light rail transit (LRT) to assess its services. The study reports how the factors of the LRT service ranked according to the ways they influenced user perceptions of how satisfactory the service quality was. The techniques of non-parametric models, or artificial neural network (ANN) modeling, were used to rank the quality aspects of the LRT services.
It was proposed that user perceptions of satisfaction were influenced by eight elements that were used an analytical measurement scale: comfort, amenities, safety, ticket-based services, employee performance, speed, information signs, and the provision of information. Shen et al. [3] examined the same constructs in their investigation of how satisfied users were with the Suzhou (China) urban light railway services. In addition, de Oña et al. [100] and Yanık et al. [101] employed similar aspects, including informing passengers, security, comfort, and consumer service, in the case studies they, respectively, undertook in Italian and Turkish contexts. Existing research was utilized to extract factors from the current study’s exploratory factor analysis. Each factor of service quality represents a dimension that underlies the user perceptions of quality. LRT users’ perceptions of satisfaction might be influenced by these factors. Information signs, comfort and amenities were the elements that explained the majority of the variance.
Furthermore, the current research explored how the factors of service quality impacted the user perceptions of satisfaction with the service provided by the Klang Valley’s LRT system. All the factors of service quality were ranked according to their respective contributions (their normalized relative importance values) to these user perceptions. The ANN modeling was utilized when ranking these elements since the existing literature has verified how this is more advantageous than the standard methods of using parametric modeling such as regression modeling, structural equation modeling, and logit or probit modeling [43,94]. Techniques using the ANN are improvements over other non-parametric models such as the approach using decision trees [43] since the ANN can give more accurate predictions (79.70%) than the tree method (from 59.72% to 62.16% better) when evaluating the respective contributions of the service quality of public transportation, according to de Oña et al. [102].
According to the values ranked by importance (in percentages) and the LRT service quality order, information provision, amenities, and information signs were the most essential elements when evaluating how users perceived their satisfaction with the services delivered. Comfort and ticketing services are considered less critical determiners of users’ perceived satisfaction with the LRT services in the Klang Valley. Other studies related to transportation have employed various approaches, such as the analysis of importance-performance, models of structural similarity and models of regression, producing findings resembling those of the current study and thus confirming the validity of its methodology and outcomes [23,101,103,104].

5.2. Practical Implication

As indicated by the outcomes of this study, specific measures might enhance users’ perceived satisfaction and effective strategies could be developed to keep the existing riders and encourage potential riders to use the light rail services. Previous studies have proven that public transport users satisfied with the provided services are more likely to be loyal [6,19,23]. Consequently, better user satisfaction with the provided services (in this case, the LRT) can expand the ridership and facilitate the survival of the service provider in the transportation market in urban areas such as the Klang Valley, for which there is considerable competition.
The user perceptions of satisfaction with the service provided by the LRT were strongly determined by three factors: information provision, facilities, and information signs. These factors were ranked first to third based on their significant contribution to the formation of user satisfaction. Thus, user perceptions of satisfactions with the service provided by the LRT could be enhanced if service providers prioritize these factors.
One way to increase users’ perceived satisfaction is by guaranteeing updated, reliable and accurate details are available at LRT stations and on trains. As mentioned in previous studies, those who deliver the services and the official responsible bodies must provide information on the prices of tickets, interruptions to services (should disruptions occur), service duration, trains’ lines and schedules of arrival and departure because these aspects are essential for boosting users’ perceptions of satisfaction with public transportation and for users to plan and manage their journeys [19,22,105].
At each station and on each train, high-quality facilities need to be delivered by those providing the LRT services. For example, comfortable and ample seats at the stations and on the trains could enhance user comfort while waiting for the trains to arrive and during their journey. As Gao et al. [106] claimed, users would be more satisfied with public transportation if the seats were more comfortable. Additionally, if users have to stand, their convenience should be addressed by providing holders such as hanging straps, rails, grab handles, and stanchions. Furthermore, user perceptions of satisfaction (particularly among new riders) could be enhanced with the installation of clearly marked and systematically arranged signs.
Previous studies have shown that other influential factors of user perceived satisfaction are user comfort and customer service. The current researched showed that temperature and cleanliness affected the comfort of users. The works by Geetika [107] and Ibrahim et al. [22] indicated that those providing the services must guarantee users are comfortable on trains and at stations because this influences users’ perceived contentment. Being comfortable ranges from being thermally comfortable to how clean the trains and stations are. A potential way to ensure cleaner amenities around the urban light railway network (in this study, the LRT service) in the Klang Valley is to provide more litter containers in strategic locations to make it easier for users to dispose of their garbage. It is crucial to provide recycling bins to improve facility cleanliness and encourage recycling, thus promoting a greener and sustainable environment [22,108]. In addition, the policies of preventing people from smoking, eating or drinking on trains could also improve cleanliness and make users more comfortable [109]. If users complied with the rules and policies related to hygiene, this would assist the LRT services to match their expectations.
This study also identified employee performance as one of the vital factors that affected users’ perceived contentment with the LRT services in the Klang Valley. Users would likely be more satisfied with the LRT services if each type of LRT worker—managers, drivers, and regular employees—made equal contributions to ensuring riders were content. Managers need to guarantee that the workforce displays positive representations of the organization and their activities. The LRT employees, especially those at customer service desks, must maintain courtesy and professionalism when dealing with passengers and offer correct, updated, and reliable details. Uniforms of professional appearance might improve the image of the workforce [22].
The proposed measures are based on the outcomes of the current work and are crucial to increasing users’ perceptions of how satisfied they are with the LRT services in Malaysia. These recommendations are intended to help increase the ridership rates on the city-based rail transit services while reducing the dependence on private forms of transport when traveling in the highly urbanized Klang Valley.

6. Conclusions and Suggestion for Further Study

The current research explored how user perceptions of satisfaction were influenced by particular factors of service quality in relation to the Klang Valley’s light rail transit (LRT) system. The findings indicate that user perceptions of satisfaction with the quality of service delivered by the LRT were influenced by various factors: information signs, comfort, speed, safety, ticketing services, facilities, staff performance, and information provision. User perceptions of satisfaction were also noted as being strongly and positively associated with these aspects of service standards. Moreover, the artificial neural network’s non-parametric model produced findings with a 79.70% predictive accuracy, indicating that three service quality factors—information provision, facilities, and information signs—had a dominant influence on user perceptions of satisfaction with the service delivered by Malaysia’s urban rail transit system. This outcome was determined after assessing how significantly each factor contributed to the formation of the user perceptions of satisfaction with the service delivered. Other factors, speediness, comfort and safety, have minimal influence on user satisfaction.
The current research produced results that might enhance the LRT services in theory and in practice. From a theoretical angle, the researchers utilized an innovative methodological approach to behavioral studies by employing the artificial neural network in non-parametric modeling to offer predictions of which factors of service standards would have the most effect on user’s perceptions of how satisfied they were. The technique of the artificial neural network was also employed to develop our basic comprehension of the factors of service quality that influence user perceptions of satisfaction with the services delivered by the LRT. Thus, this study’s major contribution is to offer valuable details that augment the transportation literature, particularly in the context of transport in Asia as a region. In practical terms, the factors with a dominant influence on the user perceptions of satisfaction were revealed in the results of this study. This can help service providers, policy makers, and academics to locate and deliver solutions that specifically and effectively develop the LRT service quality, raise users’ satisfaction in the short term, and encourage more riders to use the LRT. These measures help the service providers to maximize profit while sustaining the transportation market.
Nevertheless, future researchers should recognize and resolve the current study’s limitations. First, the Malaysian context formed the backdrop to the study, thus limiting its scope. Therefore, these results must be applied with caution to other countries or regions since all countries have particular cultures and perceptions. Second, the focus of this research was users’ perceptions of the quality of service. It is suggested that future researchers conduct evaluations of non-users’ (e.g., those using private vehicles) perceptions of the standards of service in public transportation terms. Comparing user and non-user perspectives would offer valuable insights into opinions about service standards and satisfaction with the service that was actually delivered. In addition, another limitation is the numbers of input neuron (service quality factors) in this study has been limited to just eight with the predictive accuracy is 79.70%. We suggest in the future, more factors may be considered as an input variable in ANN model to enhance the prediction capability. Finally, as this study only employed the ANN model, it would be interesting for future study to conduct another experimental approach such as Bayesian network, Decision tree, structural equation model and compare the findings based on these several methodological approach.

Author Contributions

Conceptualization, A.N.H.I. and M.N.B.; methodology, A.N.H.I. and M.N.B.; software, M.H.O. and M.M.R.; validation, A.N.H.I., M.N.B. and M.M.R.; formal analysis, A.N.H.I. and M.H.O.; data curation, M.N.B. and M.R.M.Y.; writing—original draft preparation, A.N.H.I. and M.N.B.; writing—review and editing, A.N.H.I., M.N.B., M.R.M.Y.; supervision, M.N.B.; project administration, A.N.H.I. and M.N.B.; funding acquisition, M.N.B. All authors have read and agreed to the published version of the manuscript.

Funding

This study was supported by the Ministry of Higher Education Malaysia with Grant number FRGS/1/2021/TK02/UKM/02/1.

Institutional Review Board Statement

Ethical review and approval were waived for this study, due to the study not involving biological human experiment and patient data.

Informed Consent Statement

Participants freely decided to participate in the survey and consented to the use of the anonymized data. The need for informed consent statement was waived.

Data Availability Statement

All the necessary data are contained in this paper.

Acknowledgments

The authors wish to acknowledge each reviewer for the recommendations and comments they made, which improved the quality of this paper.

Conflicts of Interest

The authors declare no conflict of interest.

Appendix A

Table A1. Quality of service attributes for public transportation.
No.Quality of Service AttributesReferences
1Frequency[3,6,8,100,105,110,111,112,113,114]
2Network coverage[104,105,112,115,116]
3Service provision hours[3,6,105,117]
4Station parking[100,104,114,118]
5Accessibility[8,104,105,111,113,117]
6Easy of transfer/Distance[105,112,117]
7Ticket price[3,6,8,104,105,110,111,115,116,118,119]
8Ticket selling network[3,6,8,104,105,120]
9Type of tickets/Passes[3,110,117]
10On board information[3,6,8,104,105,111,117,118,119]
11Information at station[3,6,8,105,117,118,119]
12Punctuality[3,6,8,104,105,110,111,115,117,118,119]
13Access time[3,8,105,111,112,113,117]
14Travel speed[3,8,105,111,117]
15Waiting time[105,113,115]
16Driver and personnel’s behavior[3,6,8,104,111,115,117,118,119]
17Customer service[6,105,110]
18Cleanliness[3,8,104,105,111,113,115,117,118,119]
19Comfort[3,8,104,105,110,111,112,113,117,118,119]
20Seating capacity[3,8,104,105,112,113,117]
21Quality of vehicles[105,113,117,118,119]
22Temperature[3,105,111,115]
23Waiting condition[104,110,112,113]
24On board safety[3,6,8,104,105,110,111,117,118,119]
25Safety at station[3,6,8,105,112,117]

Appendix B

Table A2. Measurements in the survey instrument.
SignageSG
Signage for station’s locationSG1
Provision of instructions at the stationSG2
Automatic gate signs at the stationSG3
Clear signs showing directionsSG4
Train departure/arrival signal at the stationSG5
ComfortCF
The level of illumination at the stationCF1
Appropriate ventilation and temperature at the stationCF2
Cleanliness at the stationCF3
Ventilation and suitable temperature in the carriageCF4
Hygiene in the carriageCF5
FacilitiesFT
Suitable location for self-service machines FT1
The location of the waiting area seats at the appropriate stationFT2
The distortion of the sound level for announcementsFT3
Comfortable handrails in carriages for standing passengersFT4
Mobile signal strength level at the stationFT5
Mobile signal strength level in the carriageFT6
SpeedinessSN
Exact train arrival time SN1
Acceptable stopping time at the station SN2
Acceptable departure time intervalSN3
Acceptable length of service timeSN4
Ticketing serviceTS
Types of tickets offeredTS1
Quantity of self-service ticket machinesTS2
Clear instructions for using a self-service ticket machineTS3
Self-service ticket machine functions wellTS4
Staff serviceSS
Staff appearanceSS1
Staff attitudeSS2
Staff efficiency in resolving passenger problemsSS3
Call centre response time during service hoursSS4
SafetyST
Security level at the stationST1
The level of safety in the carriageST2
Safety during travelST3
Other passengers’ behaviourST4
Early signalling of closure of the carriage doors before departureST5
Provision of InformationPI
Announcements related to the services providedPI1
The efficiency of announcements related to service disruptionPI2
Provision of information related to services at the stationPI3
Provision of information related to services in the mass mediaPI4
Perceived SatisfactionKepuasan
Overall satisfaction with the services providedKepuasan 1
My perception of the level of service provided exceeded my expectationsKepuasan 2
My perception of the excellence of the services provided exceeded my expectationsKepuasan 3
I believe I benefitted from using this serviceKepuasan 4

References

  1. Murakami, A.; Zain, A.M.; Takeuchi, K.; Tsunekawa, A.; Yokota, S. Trends in urbanization and patterns of land use in the Asian mega cities Jakarta, Bangkok, and Metro Manila. Landsc. Urban Plan. 2005, 70, 251–259. [Google Scholar] [CrossRef]
  2. Borhan, M.N.; Ibrahim, A.N.H.; Syamsunur, D.; Rahmat, R.A. Why Public Bus is a Less Attractive Mode of Transport: A Case Study of Putrajaya, Malaysia. Period. Polytech. Transp. Eng. 2019, 47, 82–90. [Google Scholar] [CrossRef] [Green Version]
  3. Shen, W.; Xiao, W.; Wang, X. Passenger satisfaction evaluation model for Urban rail transit: A structural equation modeling based on partial least squares. Transp. Policy 2016, 46, 20–31. [Google Scholar] [CrossRef]
  4. Kwan, S.C.; Sutan, R.; Hashim, J.H. Trip characteristics as the determinants of intention to shift to rail transport among private motor vehicle users in Kuala Lumpur, Malaysia. Sustain. Cities Soc. 2018, 36, 319–326. [Google Scholar] [CrossRef] [Green Version]
  5. Hussain, B.; Zefreh, M.M.; Torok, A. Designing the Appropriate Data Collection Method for Public Transport Passenger Satisfaction Analysis. Int. J. Traffic Transp. Eng. 2018, 8, 177–183. [Google Scholar] [CrossRef]
  6. Irtema, H.I.M.; Ismail, A.; Borhan, M.N.; Das, A.M.; Alshetwi, A.B.Z. Case study of the behavioural intentions of public transportation passengers in Kuala Lumpur. Case Stud. Transp. Policy 2018, 6, 462–474. [Google Scholar] [CrossRef]
  7. Redman, L.; Friman, M.; Gärling, T.; Hartig, T. Quality attributes of public transport that attract car users—A research review. Transp. Policy J. 2013, 25, 119–127. [Google Scholar] [CrossRef]
  8. Mouwen, A. Drivers of customer satisfaction with public transport services. Transp. Res. Part A Policy Pract. 2015, 78, 1–20. [Google Scholar] [CrossRef]
  9. Ibrahim, A.N.H.; Borhan, M.N.; Yazid, M.R.M.; Rahmat, R.A.; Yukawa, S. Factors influencing passengers’ satisfaction with the light rail transit service in alpha cities: Evidence from Kuala Lumpur, Malaysia using structural equation modelling. Mathematics 2021, 9, 1954. [Google Scholar] [CrossRef]
  10. Beirão, G.; Cabral, J.A.S. Understanding attitudes towards public transport and private car: A qualitative study. Transp. Policy 2007, 14, 478–489. [Google Scholar] [CrossRef]
  11. Wall, G.; Olaniyan, B.; Woods, L.; Musselwhite, C. Encouraging sustainable modal shift—An evaluation of the Portsmouth Big Green Commuter Challenge. Case Stud. Transp. Policy 2017, 5, 105–111. [Google Scholar] [CrossRef] [Green Version]
  12. Ibrahim, A.N.H.; Borhan, M.N.; Darus, N.S.; Yunin, N.A.M.; Ismail, R. Understanding the Willingness of Students to Use Bicycles for Sustainable Commuting in a University Setting: A Structural Equation Modelling Approach. Mathematics 2022, 10, 861. [Google Scholar] [CrossRef]
  13. Replogle, M.; Fulton, L. A Global High Shift Scenario: Impacts and Potential for More Public Transport, Walking, And Cycling with Lower Car Use; Institute for Transportation and Development Policy: New York, NY, USA; University of California, Davis: Davis, CA, USA, 2014. [Google Scholar]
  14. Lai, W.T.; Chen, C.F. Behavioral intentions of public transit passengers—The roles of service quality, perceived value, satisfaction and involvement. Transp. Policy 2011, 18, 318–325. [Google Scholar] [CrossRef]
  15. Chowdhury, S. Users’ willingness to ride an integrated public-transport service: A literature review. Transp. Policy 2016, 48, 183–195. [Google Scholar] [CrossRef]
  16. Thøgersen, J. Promoting public transport as a subscription service: Effects of a free month travel card. Transp. Policy 2009, 16, 335–343. [Google Scholar] [CrossRef]
  17. Jain, S.; Aggarwal, P.; Kumar, P.; Singhal, S.; Sharma, P. Identifying public preferences using multi-criteria decision making for assessing the shift of urban commuters from private to public transport: A case study of Delhi. Transp. Res. Part F Traffic Psychol. Behav. 2014, 24, 60–70. [Google Scholar] [CrossRef] [Green Version]
  18. Kim, S.H.; Chung, J.H.; Park, S.; Choi, K. Analysis of user satisfaction to promote public transportation: A pattern-recognition approach focusing on out-of-vehicle time. Int. J. Sustain. Transp. 2017, 11, 582–592. [Google Scholar] [CrossRef]
  19. van Lierop, D.; Badami, M.G.; El-Geneidy, A.M. What influences satisfaction and loyalty in public transport? A review of the literature. Transp. Rev. 2018, 38, 52–72. [Google Scholar] [CrossRef]
  20. Zulkifli, S.N.A.M.; Hamsa, A.A.K.; Noor, N.M.; Ibrahim, M. Evaluation of land use density, diversity and ridership of Rail Based Public Transportation System. Transp. Res. Procedia 2017, 25, 5266–5281. [Google Scholar] [CrossRef]
  21. Belwal, R. Public transportation in Oman: A strategic analysis. Adv. Transp. Stud. 2017, 42, 99–116. [Google Scholar] [CrossRef]
  22. Ibrahim, A.N.H.; Borhan, M.N.; Yusoff, N.I.; Ismail, A. Rail-based Public Transport Service Quality and User Satisfaction—A Literature Review. Promet-Traffic Transp. 2020, 32, 423–435. [Google Scholar] [CrossRef]
  23. Yilmaz, V.; Ari, E. The effects of service quality, image, and customer satisfaction on customer complaints and loyalty in high-speed rail service in Turkey: A proposal of the structural equation model. Transp. A Transp. Sci. 2017, 13, 67–90. [Google Scholar] [CrossRef]
  24. Yuan, Y.; Yang, M.; Wu, J.; Rasouli, S.; Lei, D. Assessing bus transit service from the perspective of elderly passengers in Harbin, China. Int. J. Sustain. Transp. 2019, 13, 761–776. [Google Scholar] [CrossRef]
  25. Ibrahim, A.; Borhan, M.; Yusoff, N.; Ismail, A.; Yazid, M.M.; Yunin, N.M.; Sotaro, Y. Gender and Age Do Matter: Exploring the Effect of Passengers’ Gender and Age on the Perception of Light Rail Transit Service Quality in Kuala Lumpur, Malaysia. Sustainability 2021, 13, 990. [Google Scholar] [CrossRef]
  26. Ngah, R.; Putit, L.; Mat, A.; Abdullah, J.; Ab Majid, R. Moderating effect of service quality on public transport travel behaviour and antecedents. Plan. Malays. J. 2020, 18, 80–91. [Google Scholar] [CrossRef]
  27. Tiglao, N.C.C.; De Veyra, J.M.; Tolentino, N.J.Y.; Tacderas, M.A.Y. The perception of service quality among paratransit users in Metro Manila using structural equations modelling (SEM) approach. Res. Transp. Econ. 2020, 83, 100955. [Google Scholar] [CrossRef]
  28. Chuenyindee, T.; Ong, A.K.S.; Ramos, J.P.; Prasetyo, Y.T.; Nadlifatin, R.; Kurata, Y.B.; Sittiwatethanasiri, T. Public utility vehicle service quality and customer satisfaction in the Philippines during the COVID-19 pandemic. Util. Policy 2022, 75, 101336. [Google Scholar] [CrossRef] [PubMed]
  29. Joewono, T.B.; Kubota, H. Paratransit service in Indonesia: User satisfaction and future choice. Transp. Plan. Technol. 2008, 31, 325–345. [Google Scholar] [CrossRef]
  30. Jannah, E.N.; Ibrahim, A.N.H.; Borhan, M.N. Public transportation in Jabodetabek: Performance satisfaction analysis. IOP Conf. Ser. Mater. Sci. Eng. 2020, 930, 012069. [Google Scholar] [CrossRef]
  31. Wonglakorn, N.; Ratanavaraha, V.; Karoonsoontawong, A.; Jomnonkwao, S. Exploring passenger loyalty and related factors for urban railways in Thailand. Sustainability 2021, 13, 5517. [Google Scholar] [CrossRef]
  32. Jomnonkwao, S.; Champahom, T.; Ratanavaraha, V. Methodologies for determining the service quality of the intercity rail service based on users’ perceptions and expectations in Thailand. Sustainability 2020, 12, 4259. [Google Scholar] [CrossRef]
  33. Díez-Mesa, F.; de Oña, R.; de Oña, J. Bayesian networks and structural equation modelling to develop service quality models: Metro of Seville case study. Transp. Res. Part A Policy Pract. 2018, 118, 1–13. [Google Scholar] [CrossRef]
  34. Zhang, C.; Liu, Y.; Lu, W.; Xiao, G. Evaluating passenger satisfaction index based on PLS-SEM model: Evidence from Chinese public transport service. Transp. Res. Part A Policy Pract. 2019, 120, 149–164. [Google Scholar] [CrossRef]
  35. de Oña, J.; Estévez, E.; de Oña, R. Public transport users versus private vehicle users: Differences about quality of service, satisfaction and attitudes toward public transport in Madrid (Spain). Travel Behav. Soc. 2021, 23, 76–85. [Google Scholar] [CrossRef]
  36. de Oña, J.; Estévez, E.; de Oña, R. Perception of Public Transport Quality of Service among Regular Private Vehicle Users in Madrid, Spain. Transp. Res. Rec. 2020, 2674, 213–224. [Google Scholar] [CrossRef]
  37. Alonso, B.; Barreda, R.; Dell’Olio, L.; Ibeas, A. Modelling user perception of taxi service quality. Transp. Policy 2018, 63, 157–164. [Google Scholar] [CrossRef]
  38. Dell’Olio, L.; Ibeas, A.; Cecín, P. Modelling user perception of bus transit quality. Transp. Policy 2010, 17, 388–397. [Google Scholar] [CrossRef]
  39. Allen, J.; Eboli, L.; Mazzulla, G.; Ortúzar, J.d.D. Effect of critical incidents on public transport satisfaction and loyalty: An Ordinal Probit SEM-MIMIC approach. Transportation 2020, 47, 827–863. [Google Scholar] [CrossRef]
  40. Garver, M.S. Best practices in identifying customer-driven improvement opportunities. Ind. Mark. Manag. 2003, 32, 455–466. [Google Scholar] [CrossRef]
  41. Abbas, M.; Avineri, E.; Fries, R.; Ishak, S.; Jha, M.; Kikuchi, S.; Liu, F.; Praveen, E.; Qi, Y.; Sanford-Bernhardt, K.; et al. Thoughts on the future of artificial intelligence and transportation. Transp. Res. Circ. 2012, E-C168, 137–144. [Google Scholar]
  42. Chong, A.Y.L. Predicting m-commerce adoption determinants: A neural network approach. Expert Syst. Appl. 2013, 40, 523–530. [Google Scholar] [CrossRef]
  43. Garrido, C.; de Oña, R.; de Oña, J. Neural networks for analyzing service quality in public transportation. Expert Syst. Appl. 2014, 41, 6830–6838. [Google Scholar] [CrossRef]
  44. Ibrahim, A.N.H.; Borhan, M.N.; Osman, M.H.; Khairuddin, F.H.; Zakaria, N.M. An Empirical Study of Passengers’ Perceived Satisfaction with Monorail Service Quality: Case of Kuala Lumpur, Malaysia. Sustainability 2022, 14, 6496. [Google Scholar] [CrossRef]
  45. Leong, L.; Hew, T.; Ooi, K.; Tan, G.W. Predicting actual spending in online group buying—An artificial neural network approach. Electron. Commer. Res. Appl. 2019, 38, 100898. [Google Scholar] [CrossRef]
  46. Leong, L.; Hew, T.; Ooi, K.; Dwivedi, Y.K. Predicting trust in online advertising with an SEM-artificial neural network approach. Expert Syst. Appl. 2020, 162, 113849. [Google Scholar] [CrossRef]
  47. Larasati, A.; DeYong, C.; Slevitch, L. The Application of Neural Network and Logistics Regression Models on Predicting Customer Satisfaction in a Student-Operated Restaurant. Procedia Soc. Behav. Sci. 2012, 65, 94–99. [Google Scholar] [CrossRef] [Green Version]
  48. Mahapatra, S.S.; Khan, M.S. A Methodology for Evaluation of Service Quality Using Neural Networks. In Proceedings of the International Conference on Global Manufacturing and Innovation, Coimbatore, India, 27–29 July 2006; pp. 1–9. [Google Scholar]
  49. Lien, C.H.; Wu, J.J.; Chen, Y.H.; Wang, C.J. Trust transfer and the effect of service quality on trust in the healthcare industry. Manag. Serv. Qual. 2014, 24, 399–416. [Google Scholar] [CrossRef]
  50. Lien, C.H.; Cao, Y.; Zhou, X. Service quality, satisfaction, stickiness, and usage intentions: An exploratory evaluation in the context of WeChat services. Comput. Human Behav. 2017, 68, 403–410. [Google Scholar] [CrossRef]
  51. Wang, Y.; Lu, X.; Tan, Y. Impact of product attributes on customer satisfaction: An analysis of online reviews for washing machines. Electron. Commer. Res. Appl. 2018, 29, 1–11. [Google Scholar] [CrossRef]
  52. Wikhamn, W. Innovation, sustainable HRM and customer satisfaction. Int. J. Hosp. Manag. 2019, 76, 102–110. [Google Scholar] [CrossRef]
  53. Kadic-Maglajlic, S.; Boso, N.; Micevski, M. How internal marketing drive customer satisfaction in matured and maturing European markets? J. Bus. Res. 2018, 86, 291–299. [Google Scholar] [CrossRef]
  54. Radojevic, T.; Stanisic, N.; Stanic, N.; Davidson, R. The effects of traveling for business on customer satisfaction with hotel services. Tour. Manag. 2018, 67, 326–341. [Google Scholar] [CrossRef]
  55. Homburg, C.; Rudolph, B. Customer satisfaction in industrial markets: Dimensional and multiple role issues. J. Bus. Res. 2001, 52, 15–33. [Google Scholar] [CrossRef]
  56. Ouhna, L.; Mekkaoui, S. The Effect of Relationship Satisfaction in Customer Loyalty: Case Study of Moroccan Agri-Food Industries. Int. J. Bus. Soc. Sci. 2013, 4, 279–286. [Google Scholar]
  57. Chen, S.C. The customer satisfaction-loyalty relation in an interactive e-service setting: The mediators. J. Retail. Consum. Serv. 2012, 19, 202–210. [Google Scholar] [CrossRef]
  58. Suki, N.M. Passenger satisfaction with airline service quality in Malaysia: A structural equation modeling approach. Res. Transp. Bus. Manag. 2014, 10, 26–32. [Google Scholar] [CrossRef]
  59. Hadiuzzman, M.; Das, T.; Hasnat, M.M.; Hossain, S.; Musabbir, S.R. Structural equation modeling of user satisfaction of bus transit service quality based on stated preferences and latent variables. Transp. Plan. Technol. 2017, 40, 257–277. [Google Scholar] [CrossRef]
  60. Hutchinson, T.P. Classification of reasons for poor customer experiences in service industries: The case of public transport. Transp. Plan. Technol. 2011, 34, 747–758. [Google Scholar] [CrossRef]
  61. Ibrahim, A.N.H.; Borhan, M.N. Sex Disparity in Satisfaction and Loyalty Towards Urban Rail Transit: A Survey of Light Rail Transit (LRT) Passengers in Kuala Lumpur, Malaysia. Int. J. Integr. Eng. 2021, 13, 223–228. [Google Scholar] [CrossRef]
  62. Morfoulaki, M.; Tyrinopoulos, Y.; Aifadopoulou, G. Estimation of Satisfied Customers in Public Transport Systems: A New Methodological Approach. J. Transp. Res. Forum 2007, 46, 63–72. [Google Scholar] [CrossRef]
  63. Chou, J.S.; Kim, C. A structural equation analysis of the QSL relationship with passenger riding experience on high speed rail: An empirical study of Taiwan and Korea. Expert Syst. Appl. 2009, 36, 6945–6955. [Google Scholar] [CrossRef]
  64. Kuo, C.W.; Tang, M.L. Relationship among service quality, corporate image, customer satisfaction and behaviroal intention for the elderly in high speed rail service. J. Adv. Transp. 2013, 47, 512–525. [Google Scholar] [CrossRef]
  65. Ibrahim, A.N.H.; Borhan, M.N. The Interrelationship Between Perceived Quality, Perceived Value and User Satisfaction Towards Behavioral Intention in Public Transportation: A Review of the Evidence. Int. J. Adv. Sci. Eng. Inf. Technol. 2020, 10, 2048–2056. [Google Scholar] [CrossRef]
  66. Zefreh, M.M.; Hussain, B.; Sipos, T. In-Depth Analysis and Model Development of Passenger Satisfaction with Public Transportation. KSCE J. Civ. Eng. 2020, 24, 3064–3073. [Google Scholar] [CrossRef]
  67. Srisaeng, P.; Baxter, G.S.; Wild, G. Forecasting demand for low cost carriers in Australia using an artificial neural network approach. Aviation 2015, 19, 90–103. [Google Scholar] [CrossRef] [Green Version]
  68. Srisaeng, P.; Baxter, G.; Wild, G. Using an artificial neural network approach to forecast Australia’s domestic passenger air travel demand. World Rev. Intermodal Transp. Res. 2015, 5, 281–313. [Google Scholar] [CrossRef] [Green Version]
  69. Curcio, S.; Iorio, G. Models of membrane reactors based on artificial neural networks and hybrid approaches. In Handbook of Membrane Reactors; Woodhead Publishing: Cambridge, UK, 2013; ISBN 9780857097330. [Google Scholar]
  70. Watts, M.J.; Worner, S.P. Using artificial neural networks to determine the relative contribution of abiotic factors influencing the establishment of insect pest species. Ecol. Inform. 2008, 3, 64–74. [Google Scholar] [CrossRef]
  71. Kunt, M.M.; Aghayan, I.; Noii, N. Prediction for traffic accident severity: Comparing the artificial neural network, genetic algorithm, combined genetic algorithm and pattern search methods. Transport 2011, 26, 353–366. [Google Scholar] [CrossRef] [Green Version]
  72. Sineglazov, V.; Chumachenko, E.; Gorbatyuk, V. An algorithm for solving the problem of forecasting. Aviation 2013, 17, 9–13. [Google Scholar] [CrossRef]
  73. Ba-fail, A.O.; Abed, S.Y.; Jasimuddin, S.M. The determinants of domestic air travel demand in the Kingdom of Saudi Arabia. J. Air Transp. World Wide 2000, 5, 72–86. [Google Scholar]
  74. Tiryaki, S.; Aydin, A. An artificial neural network model for predicting compression strength of heat treated woods and comparison with a multiple linear regression model. Constr. Build. Mater. 2014, 62, 102–108. [Google Scholar] [CrossRef]
  75. Claveria, O.; Torra, S. Forecasting tourism demand to Catalonia: Neural networks vs. time series models. Econ. Model. 2014, 36, 220–228. [Google Scholar] [CrossRef] [Green Version]
  76. Arif, M.I.M.; Hamim, A.; Ibrahim, A.N.H.; Khairuddin, F.H.; Jamaludin, N.A.A.; Yusoff, N.I. Kajian perbandingan penggunaan model rangkaian saraf tiruan dan model penyesuaian logik kabur untuk meramal modulus elastik turapan boleh lentur. J. Kejuruter. 2019, 31, 357–366. [Google Scholar]
  77. Masirin, M.I.M.; Salin, A.M.; Zainorabidin, A.; Martin, D.; Samsuddin, N. Review on Malaysian Rail Transit Operation and Management System: Issues and Solution in Integration. IOP Conf. Ser. Mater. Sci. Eng. 2017, 226, 012029. [Google Scholar] [CrossRef] [Green Version]
  78. Ibrahim, A.N.H.; Borhan, M.N.; Rahmat, R.A.O.K. Understanding users’ intention to use park-and-ride facilities in malaysia: The role of trust as a novel construct in the theory of planned behaviour. Sustainability 2020, 12, 2484. [Google Scholar] [CrossRef] [Green Version]
  79. Borhan, M.N.; Ibrahim, A.N.H.; Aziz, A.; Yazid, M.R.M. The relationship between the demographic, personal, and social factors of Malaysian motorcyclists and risk taking behavior at signalized intersections. Accid. Anal. Prev. 2018, 121, 94–100. [Google Scholar] [CrossRef]
  80. Krejcie, R.V.; Morgan, D.W. Determining Sample Size for Research Activities. Educ. Psychol. Meas. 1970, 38, 607–610. [Google Scholar] [CrossRef]
  81. Ooi, K.B.; Foo, F.E.; Tan, G.W.H.; Hew, J.J.; Leong, L.Y. Taxi within a grab? A gender-invariant model of mobile taxi adoption. Ind. Manag. Data Syst. 2020, 121, 312–332. [Google Scholar] [CrossRef]
  82. Alkawsi, G.A.; Ali, N.; Mustafa, A.S.; Baashar, Y.; Alhussian, H.; Alkahtani, A.; Tiong, S.K.; Ekanayake, J. A hybrid SEM-neural network method for identifying acceptance factors of the smart meters in Malaysia: Challenges perspective. Alex. Eng. J. 2021, 60, 227–240. [Google Scholar] [CrossRef]
  83. Hamim, A.; Hardwiyono, S.; El-Shafie, A.; Yusoff, N.I.M.; Hainin, M.R. Ramalan Cirian Reologi Campuran Berasfalt Menggunakan Rangkaian. J. Teknol. 2013, 65, 1–8. [Google Scholar]
  84. Nguyen-Phuoc, D.Q.; Su, D.N.; Tran, P.T.K.; Le, D.T.T.; Johnson, L.W. Factors influencing customer’s loyalty towards ride-hailing taxi services—A case study of Vietnam. Transp. Res. Part A Policy Pract. 2020, 134, 96–112. [Google Scholar] [CrossRef]
  85. Nikolaou, P.; Basbas, S.; Politis, I.; Borg, G. Trip and personal characteristics towards the intention to cycle in Larnaca, Cyprus: An EFA-SEM approach. Sustainability 2020, 12, 4250. [Google Scholar] [CrossRef]
  86. Morton, C.; Caulfield, B.; Anable, J. Customer perceptions of quality of service in public transport: Evidence for bus transit in Scotland. Case Stud. Transp. Policy 2016, 4, 199–207. [Google Scholar] [CrossRef]
  87. Obsie, A.; Woldeamanuel, M.; Woldetensae, B. Service Quality of Addis Ababa Light Rail Transit: Passengers’ Views and Perspectives. Urban Rail Transit 2020, 6, 231–243. [Google Scholar] [CrossRef]
  88. Kaiser, H.F. The Application of Electronic Computers to Factor Analysis. Educ. Psychol. Meas. 1960, 20, 141–151. [Google Scholar] [CrossRef]
  89. Maskey, R.; Fei, J.; Nguyen, H.O. Use of exploratory factor analysis in maritime research. Asian J. Shipp. Logist. 2018, 34, 91–111. [Google Scholar] [CrossRef]
  90. Uca, S.; Altintas, V.; Tuzunkan, D.; Toanoglou, M. A study on the effects of demographic factors on hotel selection process. Int. J. Tour. Sci. 2017, 17, 231–246. [Google Scholar] [CrossRef]
  91. Field, A. Discovering Statistics using SPSS Statistics, 3rd ed.; SAGE Publications Ltd.: Thousand Oaks, CA, USA, 2009; ISBN 9781847879073. [Google Scholar]
  92. Hair, J.F.; Hult, G.T.M.; Ringle, C.M.; Sarstedt, M. A Primer on Partial Least Squares Structural Equation Modeling (PLS-SEM); SAGE Publications, Inc.: Thousand Oaks, CA, USA, 2014. [Google Scholar]
  93. Leong, L.; Hew, T.; Lee, V.; Ooi, K. An SEM—artificial-neural-network analysis of the relationships between SERVPERF, customer satisfaction and loyalty among low-cost and full-service airline. Expert Syst. Appl. 2015, 42, 6620–6634. [Google Scholar] [CrossRef]
  94. Leong, L.; Hew, T.; Ooi, K.; Chong, A.Y. Predicting the antecedents of trust in social commerce—A hybrid structural equation modeling with neural network approach. J. Bus. Res. 2020, 110, 24–40. [Google Scholar] [CrossRef]
  95. Shahzad, F.; Xiu, G.; Aamir, M.; Khan, S.; Shahbaz, M. Predicting the adoption of a mobile government security response system from the user’ s perspective: An application of the artificial neural network approach. Technol. Soc. 2020, 62, 101278. [Google Scholar] [CrossRef]
  96. Sharma, S.K.; Gaur, A.; Saddikuti, V.; Rastogi, A. Structural equation model (SEM)-neural network (NN) model for predicting quality determinants of e-learning management systems. Behav. Inf. Technol. 2017, 36, 1053–1066. [Google Scholar] [CrossRef]
  97. Veerasamy, R.; Rajak, H.; Jain, A.; Sivadasan, S.; Varghese, C.P.; Agrawal, R.K. Validation of QSAR Models—Strategies and Importance. Int. J. Drug Des. Disocovery 2011, 2, 511–519. [Google Scholar]
  98. Chong, A.Y.L. A two-staged SEM-neural network approach for understanding and predicting the determinants of m-commerce adoption. Expert Syst. Appl. 2013, 40, 1240–1247. [Google Scholar] [CrossRef]
  99. Sim, J.J.; Tan, G.W.H.; Wong, J.C.J.; Ooi, K.B.; Hew, T.S. Understanding and predicting the motivators of mobile music acceptance—A multi-stage MRA-artificial neural network approach. Telemat. Inform. 2014, 31, 569–584. [Google Scholar] [CrossRef]
  100. de Oña, R.; Machado, J.L.; de Oña, J. Perceived Service Quality, Customer Satisfaction, and Behavioral Intentions. Transp. Res. Rec. J. Transp. Res. Board 2015, 2538, 76–85. [Google Scholar] [CrossRef]
  101. Yanık, S.; Aktas, E.; Topcu, Y.I. Traveler satisfaction in rapid rail systems: The case of Istanbul metro. Int. J. Sustain. Transp. 2017, 11, 642–658. [Google Scholar] [CrossRef] [Green Version]
  102. de Oña, J.; de Oña, R.; Calvo, F.J. A classification tree approach to identify key factors of transit service quality. Expert Syst. Appl. 2012, 39, 11164–11171. [Google Scholar] [CrossRef]
  103. Li, L.; Cao, M.; Bai, Y.; Song, Z. Analysis of Public Transportation Competitiveness Based on Potential Passenger Travel Intentions: Case Study in Shanghai, China. Transp. Res. Rec. 2019, 2673, 823–832. [Google Scholar] [CrossRef]
  104. Das, A.M.; Ladin, M.A.; Ismail, A.; Rahmat, R.O.K. Consumers satisfaction of public transport monorail user in Kuala Lumpur. J. Eng. Sci. Technol. 2013, 8, 272–283. [Google Scholar]
  105. Machado-Leóna, J.L.; de Oñaa, R.; Baounib, T.; de Oñaa, J. Railway transit services in Algiers: Priority improvement actions based on users perceptions. Transp. Policy 2017, 53, 175–185. [Google Scholar] [CrossRef]
  106. Gao, L.; Yu, Y.; Liang, W. Public Transit Customer Satisfaction Dimensions Discovery from Online Reviews. Urban Rail Transit 2016, 2, 146–152. [Google Scholar] [CrossRef] [Green Version]
  107. Geetika, S.N. Determinants of Customer Satisfaction on Service Quality: A Study of Railway Platforms in India. J. Public Transp. 2010, 13, 97–113. [Google Scholar] [CrossRef] [Green Version]
  108. Borhan, M.N.; Akhir, N.M.; Ismail, A.; Rahmat, R.A.A.O. Pemodelan Hubungan Antara Kualiti Perkhidmatan, Kesan Alam Sekitar, Sikap dan Keinginan untuk Menggunakan Park-and-Ride. J. Kejuruter. 2015, 27, 63–70. [Google Scholar] [CrossRef]
  109. Borhan, M.N.; Ibrahim, A.N.H.; Miskeen, M.A.A. Extending the theory of planned behaviour to predict the intention to take the new high-speed rail for intercity travel in Libya: Assessment of the influence of novelty seeking, trust and external influence. Transp. Res. Part A Policy Pract. 2019, 130, 373–384. [Google Scholar] [CrossRef]
  110. Githui, J.N.; Okamura, T.; Nakamura, F. The Structure of Users’ Satisfaction on Urban Public Transport Service in Developing Country: The Case of Nairobi. J. East. Asia Soc. Transp. Stud. 2010, 8, 1288–1300. [Google Scholar] [CrossRef]
  111. de Oña, J.; de Oña, R.; Eboli, L.; Mazzulla, G. Perceived service quality in bus transit service: A structural equation approach. Transp. Policy 2013, 29, 219–226. [Google Scholar] [CrossRef]
  112. Susilo, Y.O.; Cats, O. Exploring key determinants of travel satisfaction for multi-modal trips by different traveler groups. Transp. Res. Part A Policy Pract. 2014, 67, 366–380. [Google Scholar] [CrossRef]
  113. Nwachukwu, A.A. Assessment of Passenger Satisfaction with Intra-City Public Bus Transport Services in Abuja, Nigeria. J. Public Transp. 2014, 17, 99–119. [Google Scholar] [CrossRef]
  114. de Oña, J.; de Oña, R. Quality of service in public transport based on customer satisfaction surveys: A review and assessment of methodological approaches. Transp. Sci. 2015, 49, 605–622. [Google Scholar] [CrossRef] [Green Version]
  115. Grujičić, D.; Ivanović, I.; Jović, J.; Đorić, V. Customer perception of service quality in public transport. Transport 2014, 29, 285–295. [Google Scholar] [CrossRef] [Green Version]
  116. Eboli, L.; Forciniti, C.; Mazzulla, G.; Calvo, F.J. Exploring the Factors that Impact on Transit Use through an Ordered Probit Model: The Case of Metro of Madrid. In Proceedings of the Transportation Research Pro, Valencia, Spain, 7–9 June 2016; pp. 35–43. [Google Scholar]
  117. Eboli, L.; Fu, Y.; Mazzulla, G. Multilevel Comprehensive Evaluation of the Railway Service Quality. Procedia Eng. 2016, 137, 21–30. [Google Scholar] [CrossRef] [Green Version]
  118. de Oña, R.; Eboli, L.; Mazzulla, G. Key factors affecting rail service quality in the Northern Italy: A decision tree approach. Transport 2014, 29, 75–83. [Google Scholar] [CrossRef] [Green Version]
  119. de Oña, J.; de Oña, R.; Eboli, L.; Mazzulla, G. Heterogeneity in Perceptions of Service Quality among Groups of Railway Passengers. Int. J. Sustain. Transp. 2015, 9, 612–626. [Google Scholar] [CrossRef]
  120. de Oña, J.; de Oña, R.; Eboli, L.; Forciniti, C.; Mazzulla, G. Transit passengers’ behavioural intentions: The influence of service quality and customer satisfaction. Transp. A Transp. Sci. 2016, 12, 385–412. [Google Scholar] [CrossRef]
Figure 1. The architecture of ANN model.
Mathematics 10 02213 g001
Figure 2. The Artificial Neural Network model. Note: CF: Comfort; FT: Facilities; PI: provision of information; SG: Signage; SN: Speediness; SS: Staff service; ST: Safety; TS: Ticketing service; Kepuasan: Perceived satisfaction (PS).
Mathematics 10 02213 g002
Table 1. Result of Exploratory factor analysis.
Factor/ItemExploratory Factor Analysis (EFA)
Loading FactorEigenvalueExplained VarianceCronbach Alpha
Signage (SG)/
SG1-SG5
0.639–0.69814.83934.5090.903
Comfort (CF)/
CF1-CF5
0.599–0.6927.41917.2540.912
Facilities (FT)/
FT1-FT6
0.667–0.8082.2125.1450.947
Speediness (SN)/
SN1-SN6
0.639–0.7121.7073.9100.904
Ticketing service (TS)/
TS1-TS4
0.611–0.6721.4713.4210.908
Staff service (SS)/
SS1-SS4
0.738–0.7841.2312.8770.897
Safety (ST)/
ST1-ST5
0.506–0.8361.1482.6700.912
Provision of Information (PI)/
PI1-PI4
0.515–0.5521.0172.3660.929
Table 2. The association between the element of the quality of service and user perceptions of satisfaction.
FactorSGCFSNSTTSFTSSPIPS
SG1.000
CF0.757 **1.000
SN0.683 **0.710 **1.000
ST0.605 **0.649 **0.679 **1.000
TS0.707 **0.706 **0.680 **0.714 **1.000
FT0.649 **0.676 **0.648 **0.558 **0.680 **1.000
SS0.566 **0.601 **0.564 **0.575 **0.628 **0.615 **1.000
PI0.663 **0.677 **0.631 **0.586 **0.685 **0.738 **0.643 **1.000
PS0.696 **0.719 **0.684 **0.597 **0.725 **0.722 **0.650 **0.740 **1.000
Note: CF: Comfort; FT: Facilities; PI: provision of information; PS: Perceived satisfaction; SG: Signage; SN: Speediness; SS: Staff service; ST: Safety; TS: Ticketing service; **: p-value < 0.01.
Table 3. The SSE, MSE and RMSE values for the ANN LRT model.
ANN
Network
TrainingTesting
NSSEMSERMSENSSEMSERMSE
ANN13724.4570.0120.109450.8330.0190.136
ANN23753.9320.0100.102420.6440.0150.124
ANN33724.2150.0110.106450.3170.0070.084
ANN43694.3260.0120.108480.5850.0120.110
ANN53684.2520.0120.107490.4580.0090.097
ANN63804.1300.0110.104370.5890.0160.126
ANN73754.4360.0120.109420.4690.0110.106
ANN83643.9050.0110.104530.6080.0110.107
ANN93825.0410.0130.115350.2600.0070.086
ANN103654.5150.0120.111520.5080.0100.099
x ¯ 4.3210.0120.108 x ¯ 0.5270.0120.107
SD0.3270.0010.004SD0.1650.0040.017
Note: ANN: Artificial neural network; SSE: Sum of squared error; MSE: Mean squared error; RMSE: Root mean square error.
Table 4. The results of sensitivity analysis.
ANN NetworkRelative Importance
SGCFSNSTTSFTSSPI
ANN10.1160.0900.0640.0920.1250.1790.1210.213
ANN20.1490.0450.0510.0300.1410.2180.0860.280
ANN30.1280.0950.0680.0300.0910.2160.1380.234
ANN40.1810.0920.1170.0200.2000.1890.0450.155
ANN50.0670.0760.0910.0160.2240.2250.0810.220
ANN60.1580.0900.0490.0770.0280.2220.1220.254
ANN70.1490.0930.1030.0480.1710.2190.0770.141
ANN80.1760.0240.0880.0100.0920.1550.1670.289
ANN90.1890.0480.0590.0800.1230.1160.1280.258
ANN100.1440.1100.0930.1640.1290.1560.1140.091
Average of relative importance0.1460.0770.0780.0570.1320.1890.1080.213
Normalised relative importance (%)68.235.836.526.662.088.850.5100.0
Note: ANN: Artificial Neural Network; CF: Comfort; FT: Facilities; PI: provision of information; SG: Signage; SN: Speediness; SS: Staff service; ST: Safety; TS: Ticketing service.
Publisher’s Note: MDPI stays neutral with regard to jurisdictional claims in published maps and institutional affiliations.

