
Chalcopyrite Leaching in the Presence of Isopropanol—The Kinetic and Mechanistic Studies

Faculty of Non-Ferrous Metals, AGH University of Krakow, Mickiewicza Ave. 30, 30-059 Krakow, Poland
*
Author to whom correspondence should be addressed.
Materials 2024, 17(4), 824; https://doi.org/10.3390/ma17040824
Submission received: 20 December 2023
/
Revised: 17 January 2024
/
Accepted: 5 February 2024
/
Published: 8 February 2024
(This article belongs to the Special Issue Advanced Metallurgy Technologies: Physical and Numerical Modelling)
Abstract
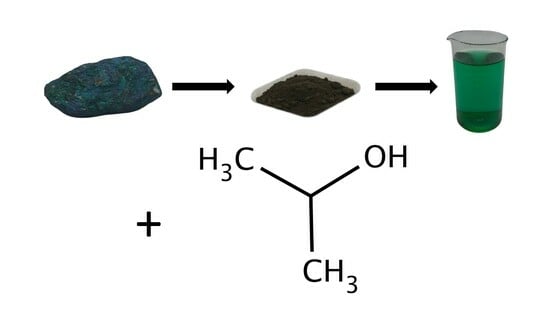
:Oxidative leaching, as a basic step of the hydrometallurgical process of pure copper production from chalcopyrite, is a slow process in which mineral acids with strong oxidants addition are usually used as a leaching medium. It was found experimentally that the copper leaching from chalcopyrite in the H2SO4–H2O2–H2O system, in the presence of isopropanol (IPA) and under other conditions (H2O2 concentration, rate of mixing and temperature), takes place with satisfactory rate and efficiency. To quantify how much the change of these crucial variables affects the rate of the process, experimentally obtained kinetic curves (conversion over time) were analyzed using a Shrinking Core Model (SCM). The determined values of the copper leaching rate constants (kobs) confirmed the positive influence of increasing IPA and H2O2 concentrations as well as the temperature on the kinetics and efficiency of the leaching. The kinetic studies were also supported by using X-ray diffraction (XRD), 57Fe Mössbauer spectroscopy, scanning electron microscopy (SEM), and adsorption measurements. The positive influence of IPA was explained by its stabilizing role for iron compounds (hematite, magnetite, and pyrite), which are catalysts during the Cu dissolution, as well as H2O2 protection from decomposition during free radical reactions. Finally, the optimal conditions for efficient leaching, the rate-limiting step as well as the mechanism suggestion of the copper dissolution, were given.
1. Introduction
Leaching, which is a method leading to the transfer of metallic elements from minerals to the liquid phase, can be conducted by a variety of ways [1]. This important technological step determines further processing conditions, especially the methods (e.g., extraction, sorption, chemical reduction, electro-reduction, precipitation, etc. [2,3,4,5]) and the external conditions of pure metal production. Depending on the form of the metal (metallic or metal compound), the proper type of leaching system (oxidative or non-oxidative one [6]) with specific chemical composition must be applied. The most popular and efficient agents for copper leaching from chalcopyrite are aqueous solutions containing either mineral acids with ferric ions [7,8,9] or hydrogen peroxide addition [10,11,12]. Generally, the equation describing the chalcopyrite leaching reaction in acidic media with the addition of hydrogen peroxide can be written as follows:
2CuFeS2 (s) + 17H2O2 + 2H+ = 2Cu2+ + 2Fe3+ + SO42− + 18H2O
While chalcopyrite leaching has been studied for a long time under different conditions (up to now, in the world market, ca. 80% sources for pure copper production are still chalcopyrite), due to economic reasons, new methods of process improvement are constantly in demand. From a practical point of view, two of them seem to be essential: photocorrosion (using the semiconductive nature of chalcopyrite [13]) and leaching in acidic media with different additives [14]. While the former has not yet been studied in detail (at least the kinetics of the photocatalytic leaching), the latter is already partly proven (e.g., by Solís-Marcíal et al. [14,15,16] or by Ghomi et al. [17]) to be effective for improving the process of leaching. These two scientific groups suggested benefits of non-polar organic solvents present in the leaching solution playing the role of a stabilizing factor of the cuprous ions (the product of chalcopyrite leaching) or stabilizing effect for oxidant (H2O2), respectively. These phenomena resulted in heightened process efficiency and had a positive impact on the reaction rate.
In our studies, we determined quantitatively how the rate of the copper leaching from chalcopyrite is affected by varied factors, i.e., the presence of isopropanol (IPA) in the system, the rate of solution stirring (vSR), H2O2 concentration (CH2O2), and the temperature (T). As an integral part of kinetic studies, the microscopic (SEM) observations of the chalcopyrite morphology supplemented by BET isotherm determination and the 57Fe Mössbauer analyses of the phase composition were performed. The obtained experimental results gave the basis for the suggestion of optimal process conditions and the possible mechanism of the copper leaching from chalcopyrite.
2. Materials and Methods
The starting material, which was used to prepare the powder samples for copper leaching experiments, were natural chalcopyrite nuggets (San Martin Mine, Zacatecas, Mexico). They were pre-crushed in a mortar and then ground for five minutes using a roller-ring mill. As a result, a fine powder fraction of the mineral, with particles from 5 to 100 µm in size, was obtained (Figure 1). All microscopic analyses of samples surface morphology were performed using Scanning Electron Microscopy (SEM) (HITACHI, SU-70, Tokyo, Japan) with an accelerating voltage of 10 kV. Prior to SEM analysis, the samples were sputter-coated with gold in an argon atmosphere (99.999%, Air Liquide, Kraków, Poland) using the DC magnetron sputter (Emitech, K575XD, Fall River, MA, USA).
The chemical and phase compositions of the powder samples were analyzed using combined methods of X-ray Fluorescence XRF (RIGAKU, Miniflex, Tokyo, Japan) with a palladium lamp as a source of radiation, X-ray Diffraction XRD (RIGAKU, Primini, Japan) with the use of a copper tube (λ = 1.54059 Å) and 57Fe Mössbauer spectroscopy (RENON, MS-4, Kraków, Poland). Additionally, for the carbon content determination, an exhaust gas (CO and CO2) analysis of burnt sample was performed using the infra-red IR method (LECO, CS-600, St. Joseph, MI, USA). During this measurement process, the chalcopyrite sample (0.1 g), mixed with LECOCEL II HP and Iron Chip HP fluxes (each weighing 1 g), undergoes inductive heating in high-purity oxygen (99.999%, Air Liquide, Poland). This process leads to combustion, converting carbon into oxides. Gas content is then analyzed after passing through a catalytic bed and filters.
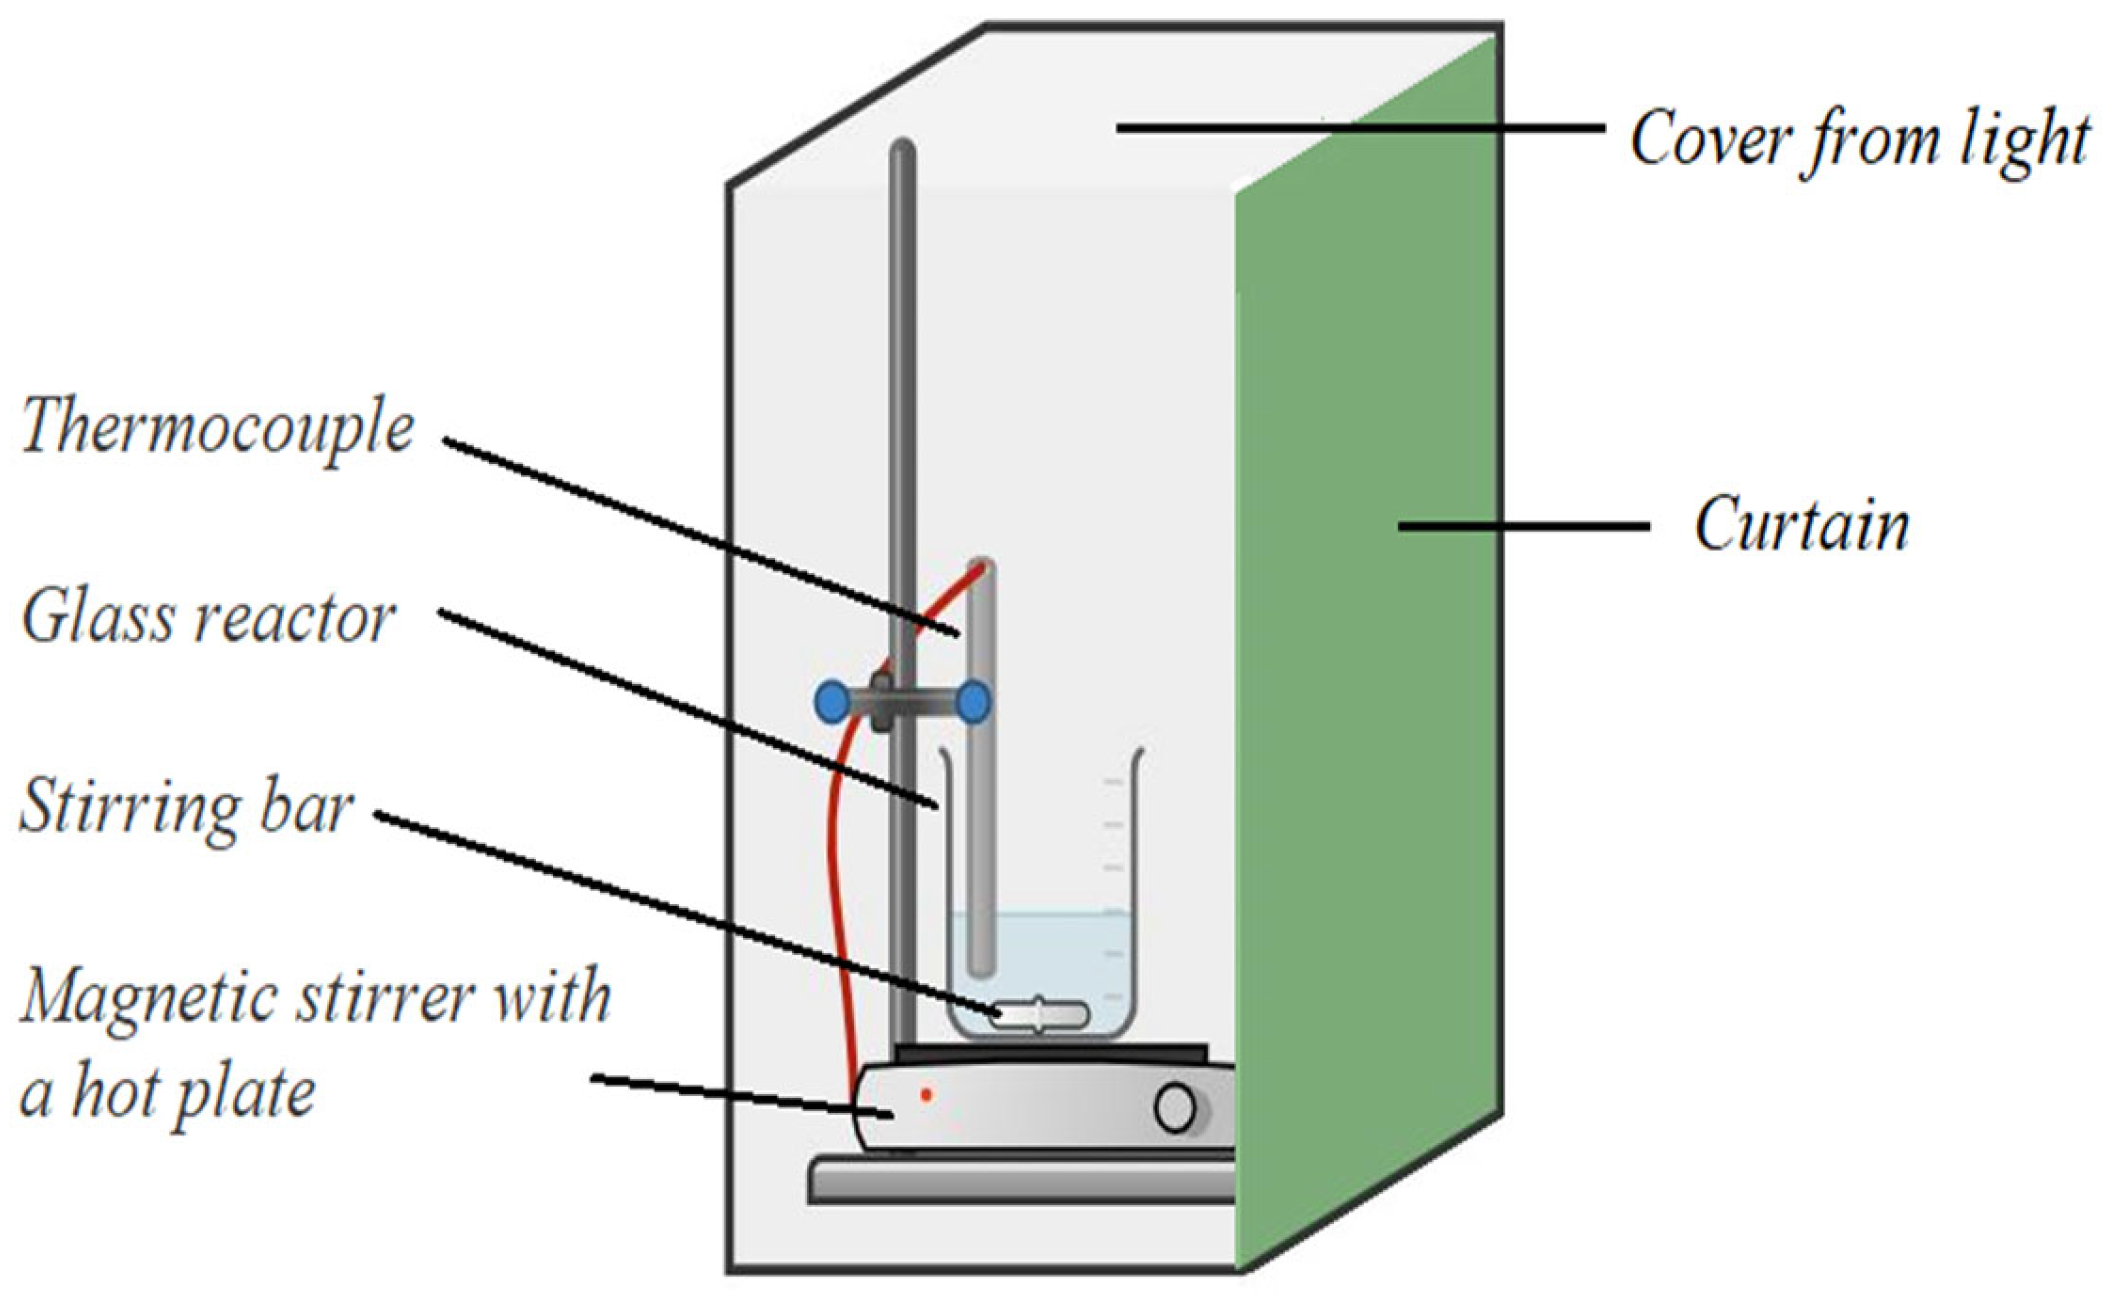
The experiments of chalcopyrite leaching were conducted in a stationary glass reactor (600 mL capacity) with a cover, thermostated and equipped with a magnetic stirrer. The scheme of this experimental arrangement is shown in Figure 2. The entire system was shielded from external light to ensure that the kinetics would not be influenced by the semiconductive nature of chalcopyrite [13].
In each experimental run, a sample of chalcopyrite powder with a mass of 2.0 g was placed in the reactor, which was filled with 200 mL of leaching solution. The solution consisted of 0.5 M sulfuric acid (30%, pure p.a., Chempur, Piekary Śląskie, Poland), 0–2.0 M isopropanol (60.10 g/mol, pure p.a., Chempur, Piekary Śląskie, Poland), and 0–2.0 M hydrogen peroxide (30%, pure p.a., POCH, Gliwice, Poland), depending on the variant of the experiment. During the leaching time (after 20, 40, 60, 90, 120, and 180 min), 2.0 mL sample for copper ions content analysis was taken. The analysis was performed using Microwave Plasma–Atomic Emission Spectroscopy (AGILENT, 4210 MP AES, Santa Clara, CA, USA). In this way, the kinetic curves (the conversion, XCu, over time) were obtained. The conversion XCu was defined as a ratio of Cu content in the solution to Cu initial content in the solid sample of the chalcopyrite. Collected data were subjected to mathematical analysis to fit them with an appropriate kinetic model, and to determine the values of the Cu leaching rate constants (kobs). For kinetic data description, the Shrinking Core Model (SCM) [18] has been applied in three variants, describing different rate-limiting steps:
Product diffusion through the film: XCu = kobst
Product diffusion through the ash: XCu + (1 − XCu)ln (1 − XCu) = kobst
The reaction: 1 − (1 − XCu)1/2 = kobst
The kobs values corresponded to the slope of linear dependencies obtained during the fitting procedure. The results obtained from kinetic measurements assisted us in determining the optimal leaching conditions and identifying the rate-limiting step of the studied reaction. Since each limiting step is characterized by a different equation, by mathematically applying these equations to experimental data, the step with the highest coefficient of determination (R2) is considered the limiting step. SCM assumes constant particle geometry, with different shapes of particles described by distinct equations. In the case of this study, the best fit was achieved for the cylinder-shaped particles, and Equations (2)–(4) correspond to this specific geometry.
After leaching experiments performed in the presence of IPA, the morphology and the phase composition of solid samples residue were analyzed using SEM and the 57Fe Mössbauer method, respectively. The registered kinetic curves, the results of their fitting, and the results discussion are presented in the next subsections.
The samples were also subjected to BET analyses (Micromeritics ASAP 2010, USA), after their preliminary degassing process at 50 °C for a duration of 24 h. The initial data collection commenced at a pressure of 9–10 mmHg. The measuring cell temperature was maintained at 77.35 K, and each sample was examined at 10 min intervals.
3. Results
The results of XRF (for metallic elements) and IR (for carbon) chemical analysis of the chalcopyrite used in all kinetic experiments are shown in Table 1.
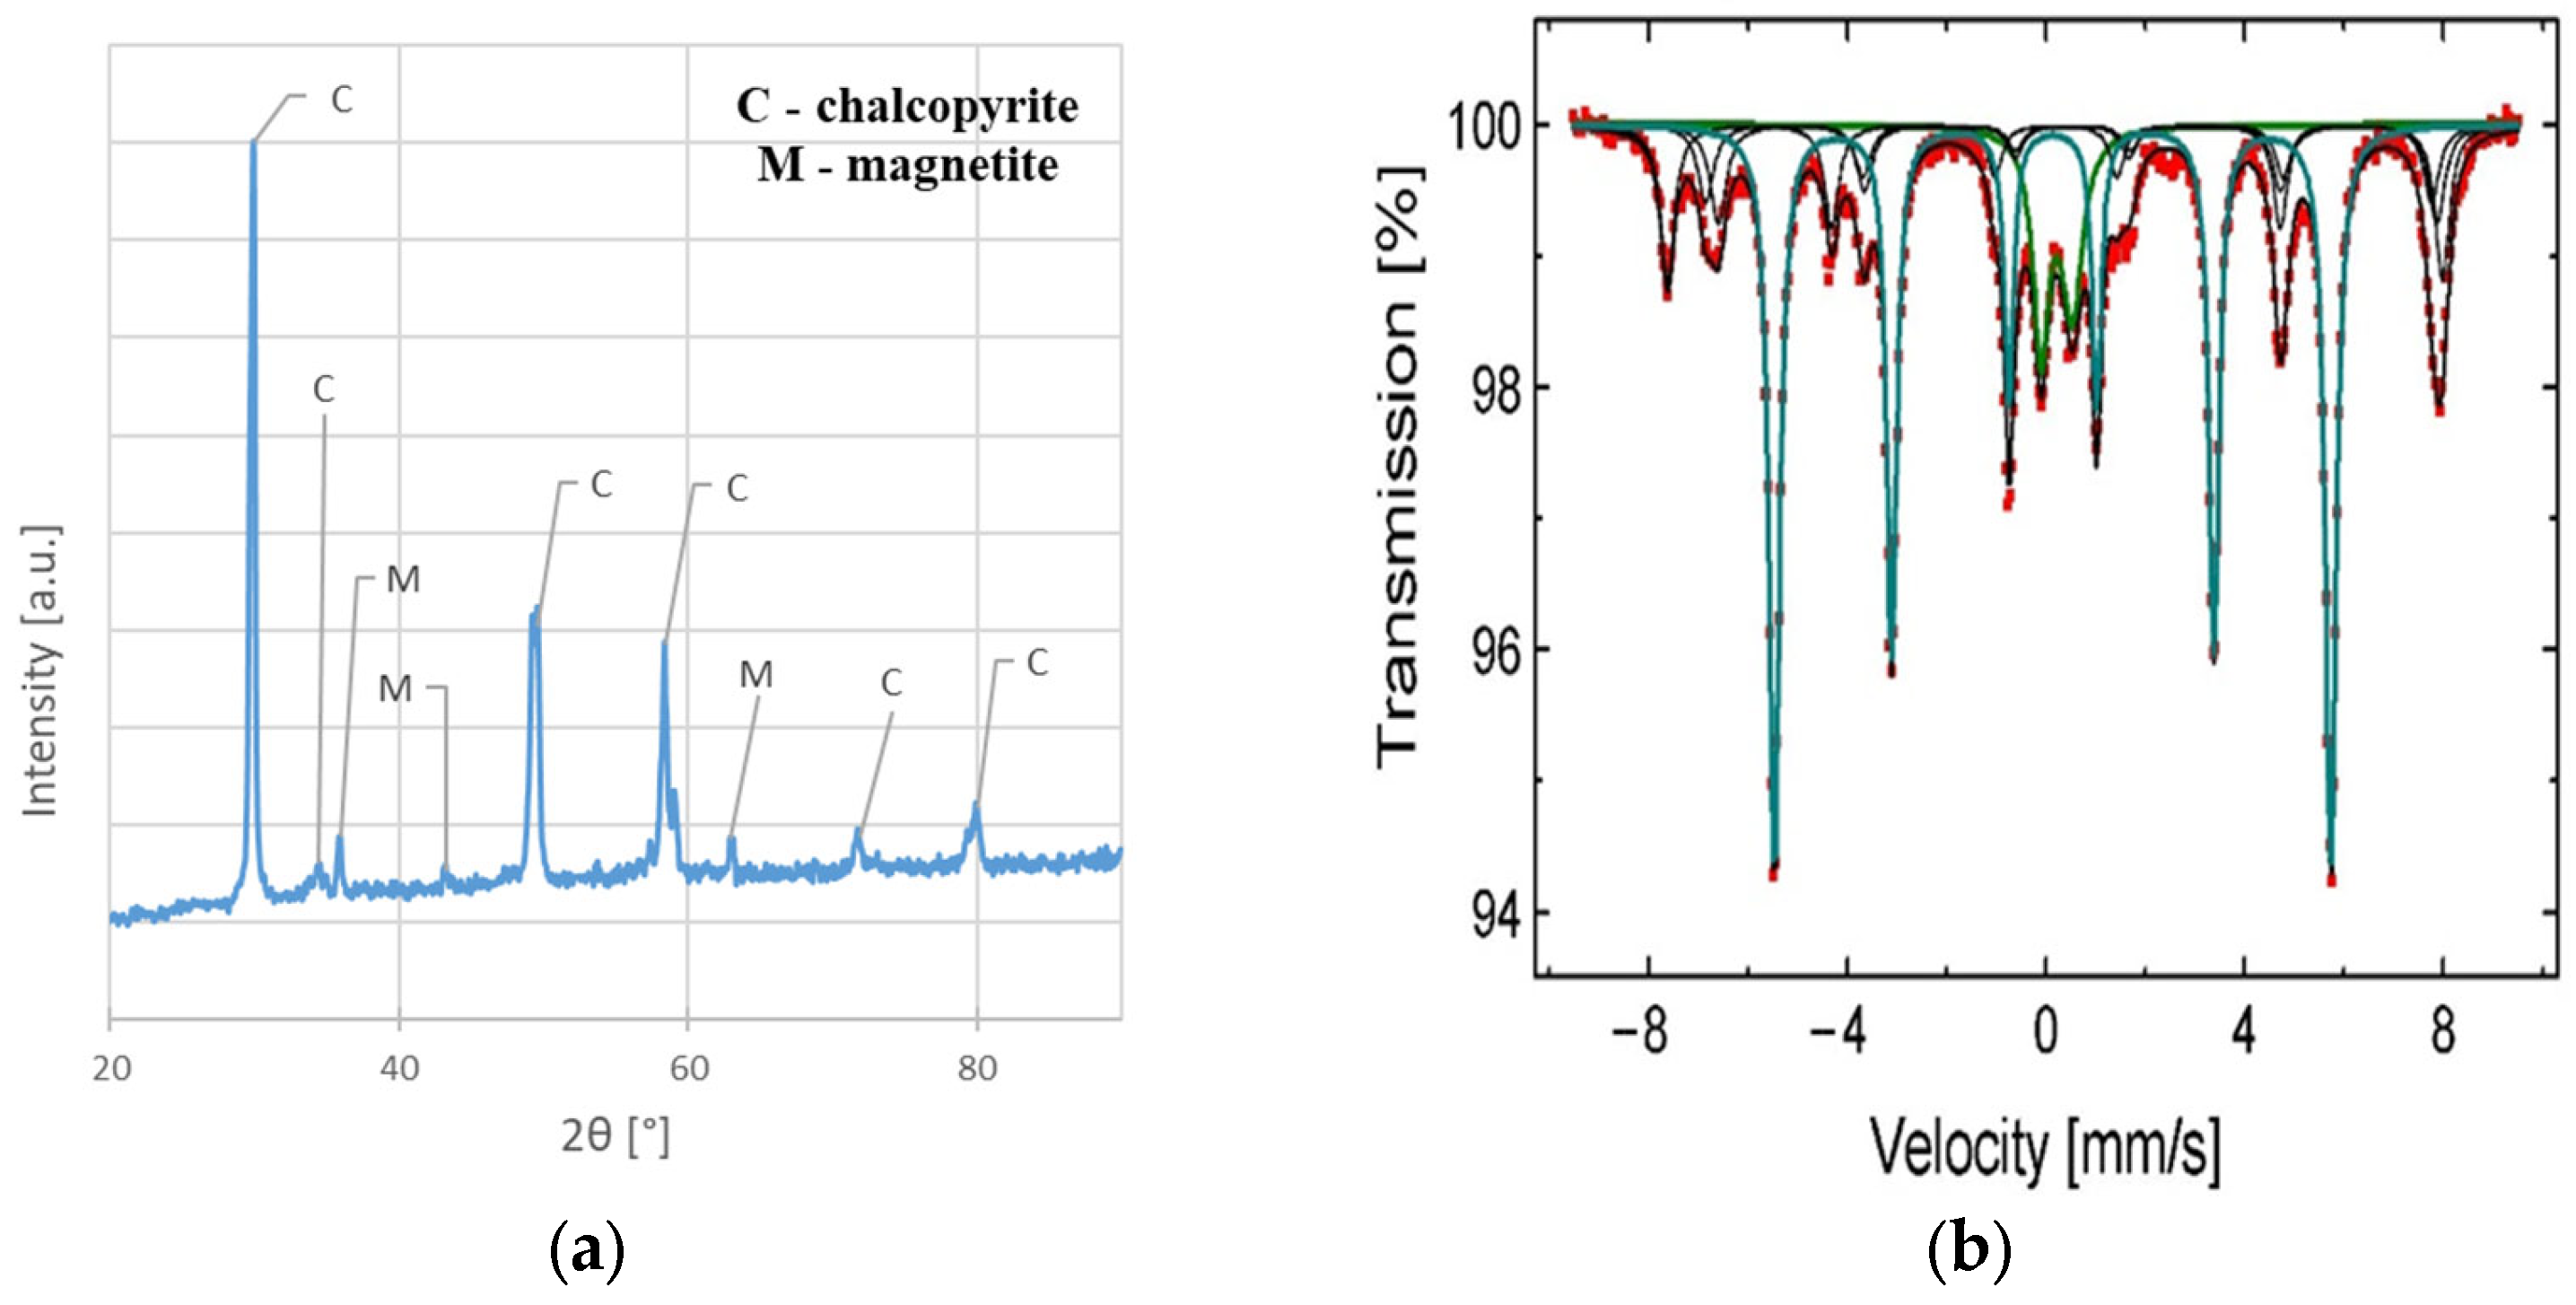
The chemical composition of the sample before leaching shows that except for main elements (Cu, Fe, and S), a slight amount of Ag, Pb, Zn, Ni, Mn, and C are present. The results also indicated a greater Fe and S content than would appear from the CuFeS2 stoichiometry (pure CuFeS2 should contain approximately 34.5% Cu, 30.5% Fe, and 35% S [19]). This fact can be explained by the phase analysis results indicating that magnetite (Fe3O4) and pyrite (FeS2) (Figure 3a,b) are also present in the material. Detailed parameters of phases from 57Fe Mössbauer analysis, as well as the names of the identified phases, are presented in Table 2. The identification was conducted by comparing the resulting values to those found in the literature.
3.1. Effect of Isopropanol
To analyze the influence of isopropanol (IPA) addition on the kinetics of copper leaching from chalcopyrite, experiments in the presence of 0, 1.0, and 2.0 M of IPA in the reacting system were conducted. Experimental conditions are given in Table 3.
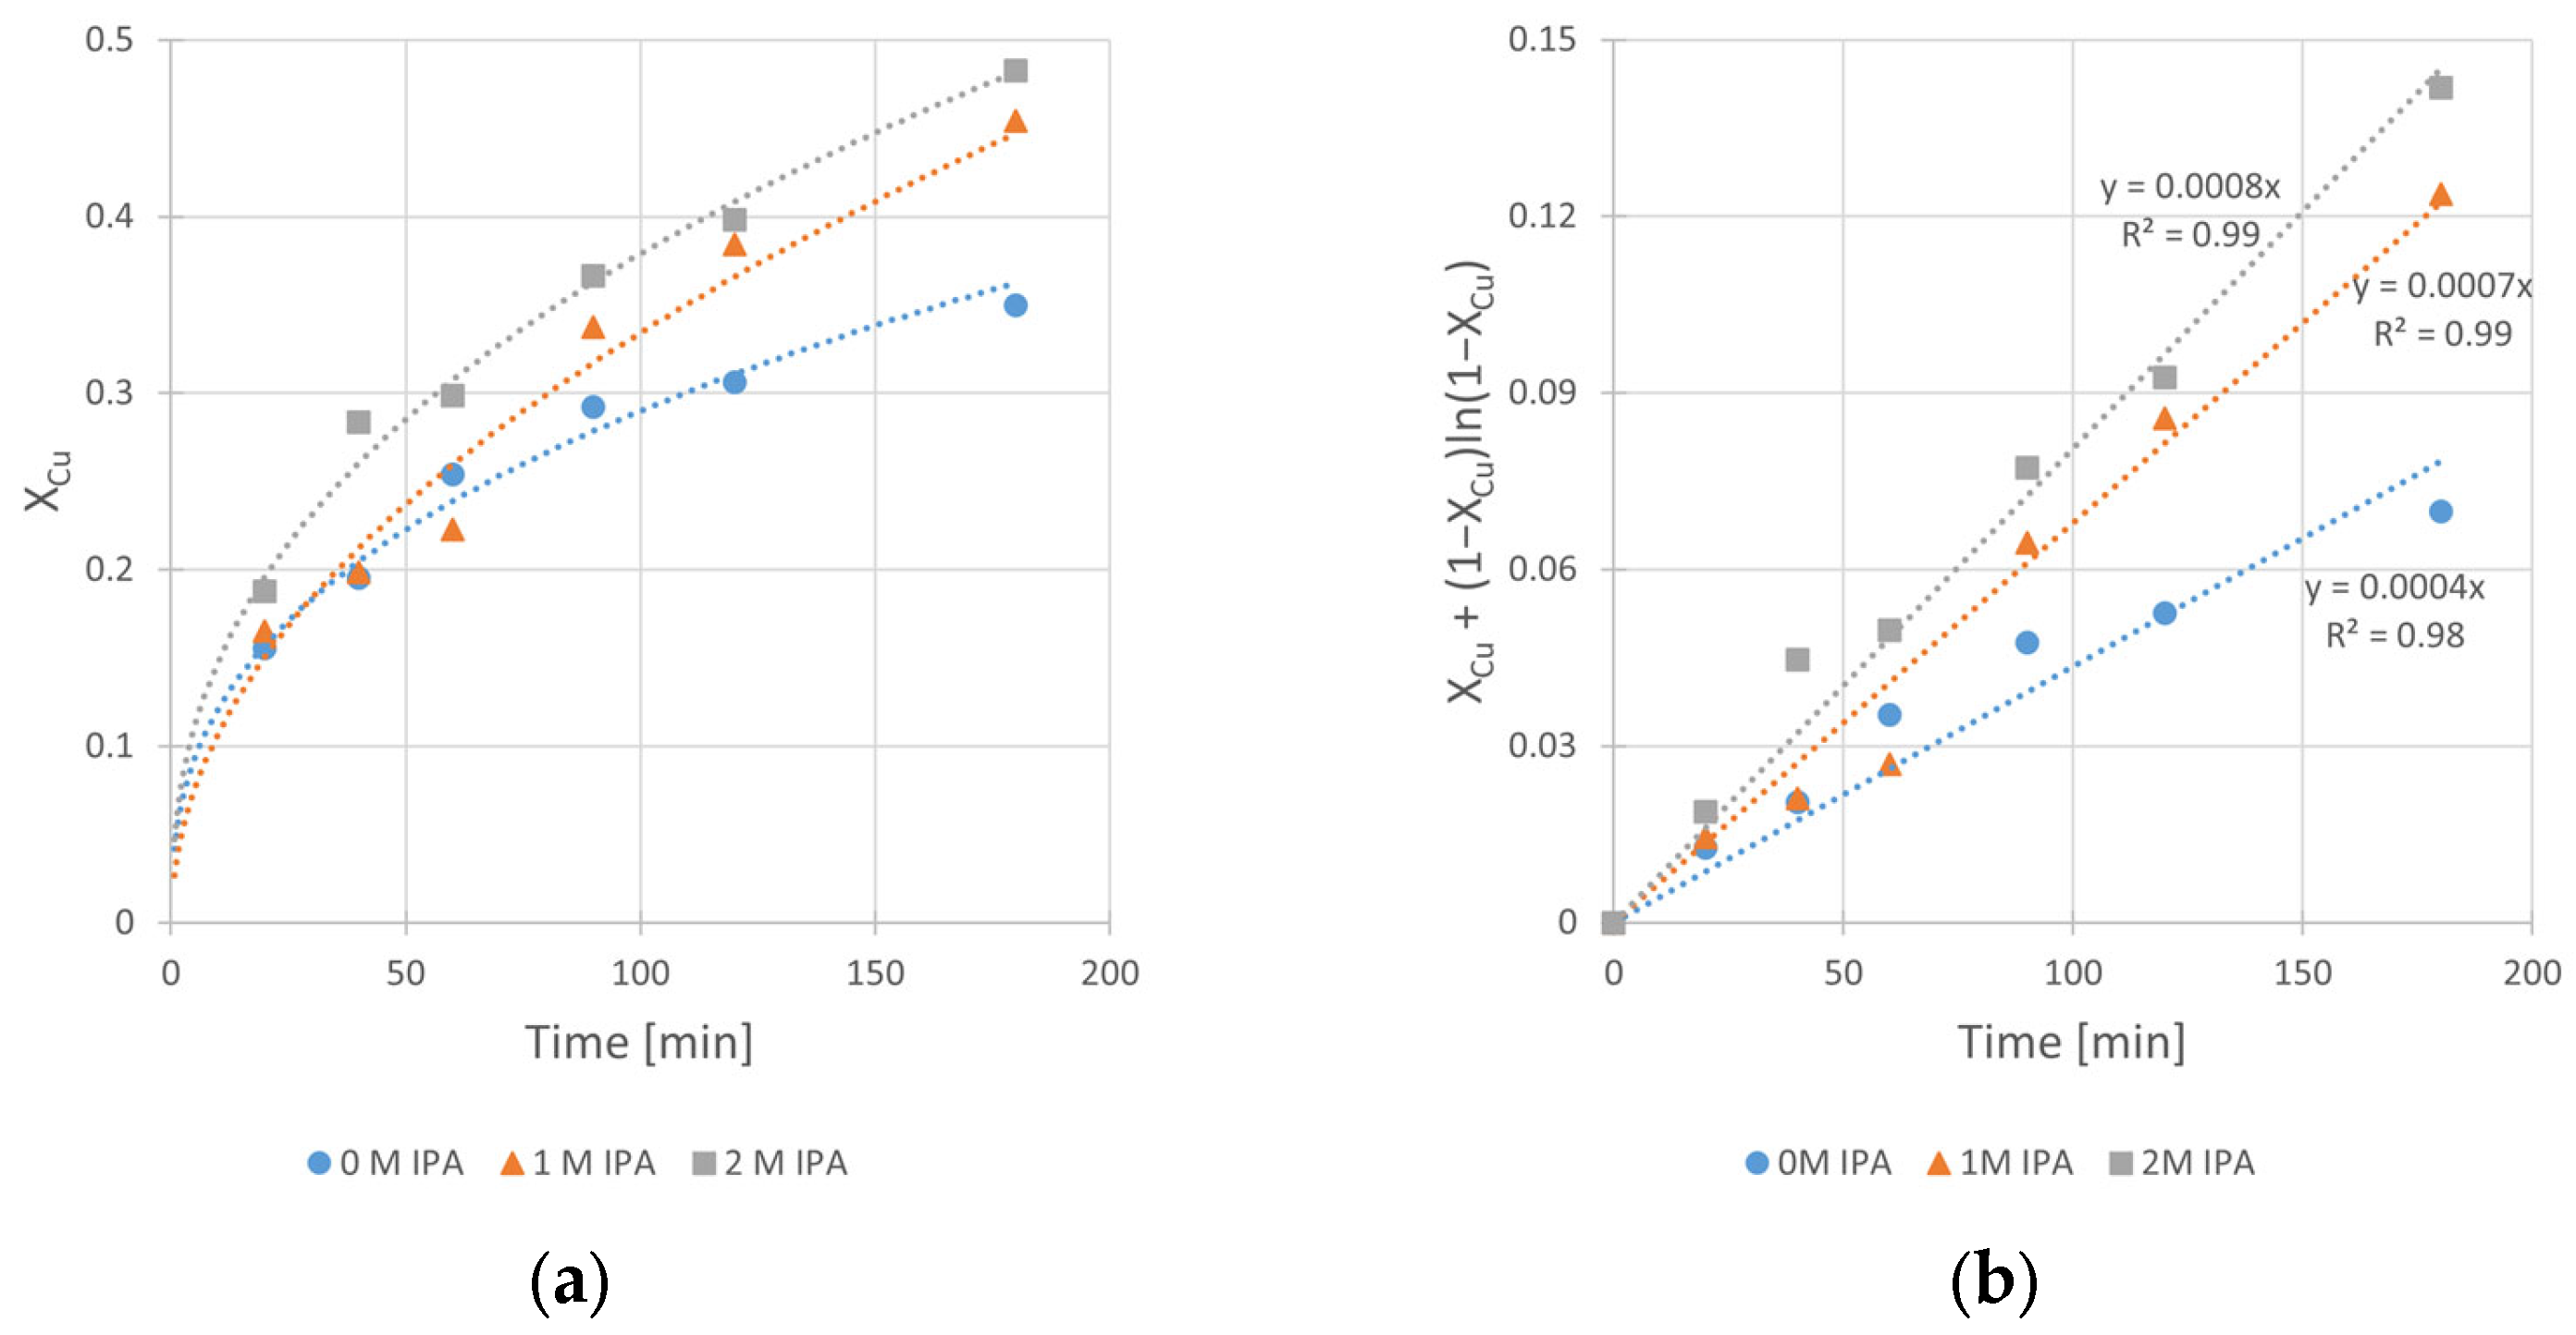
The obtained kinetic curves and the corresponding fits of kinetic equation (according to Equation (3)) are shown in Figure 4a,b, respectively.
The analysis of these results clearly shows the beneficial influence of the IPA on the kinetics of copper leaching in H2SO4–H2O2 solution. It is clearly seen from Figure 4b that the increase in the slope (corresponding to kobs of the reaction) of the relationships takes place with the increase in IPA content in the system. The kobs value increases twice, from 4 × 10⁻⁴ min−1 (for the solution without IPA presence) to 8 × 10⁻⁴ min−1 (for the solution containing 2 M of IPA). The same beneficial effect of IPA addition can be observed in Figure 4a for leaching efficiency, represented by maximum conversion value (XCu,max) reached after 180 min. There is a visible difference in conversion (XCu,max) between a run without IPA and that with the presence of 1.0 M IPA in the system. The XCu,max values are equal to 35% and 45%, respectively. It can also be noticed that further increase in IPA concentration (up to 2.0 M) did not have a significant impact on the conversion (XCu,max = 48%) in the analyzed time range. However, since the 2.0 M value has proven to be the most effective among tested concentrations, further kinetic experiments were performed at this concentration.
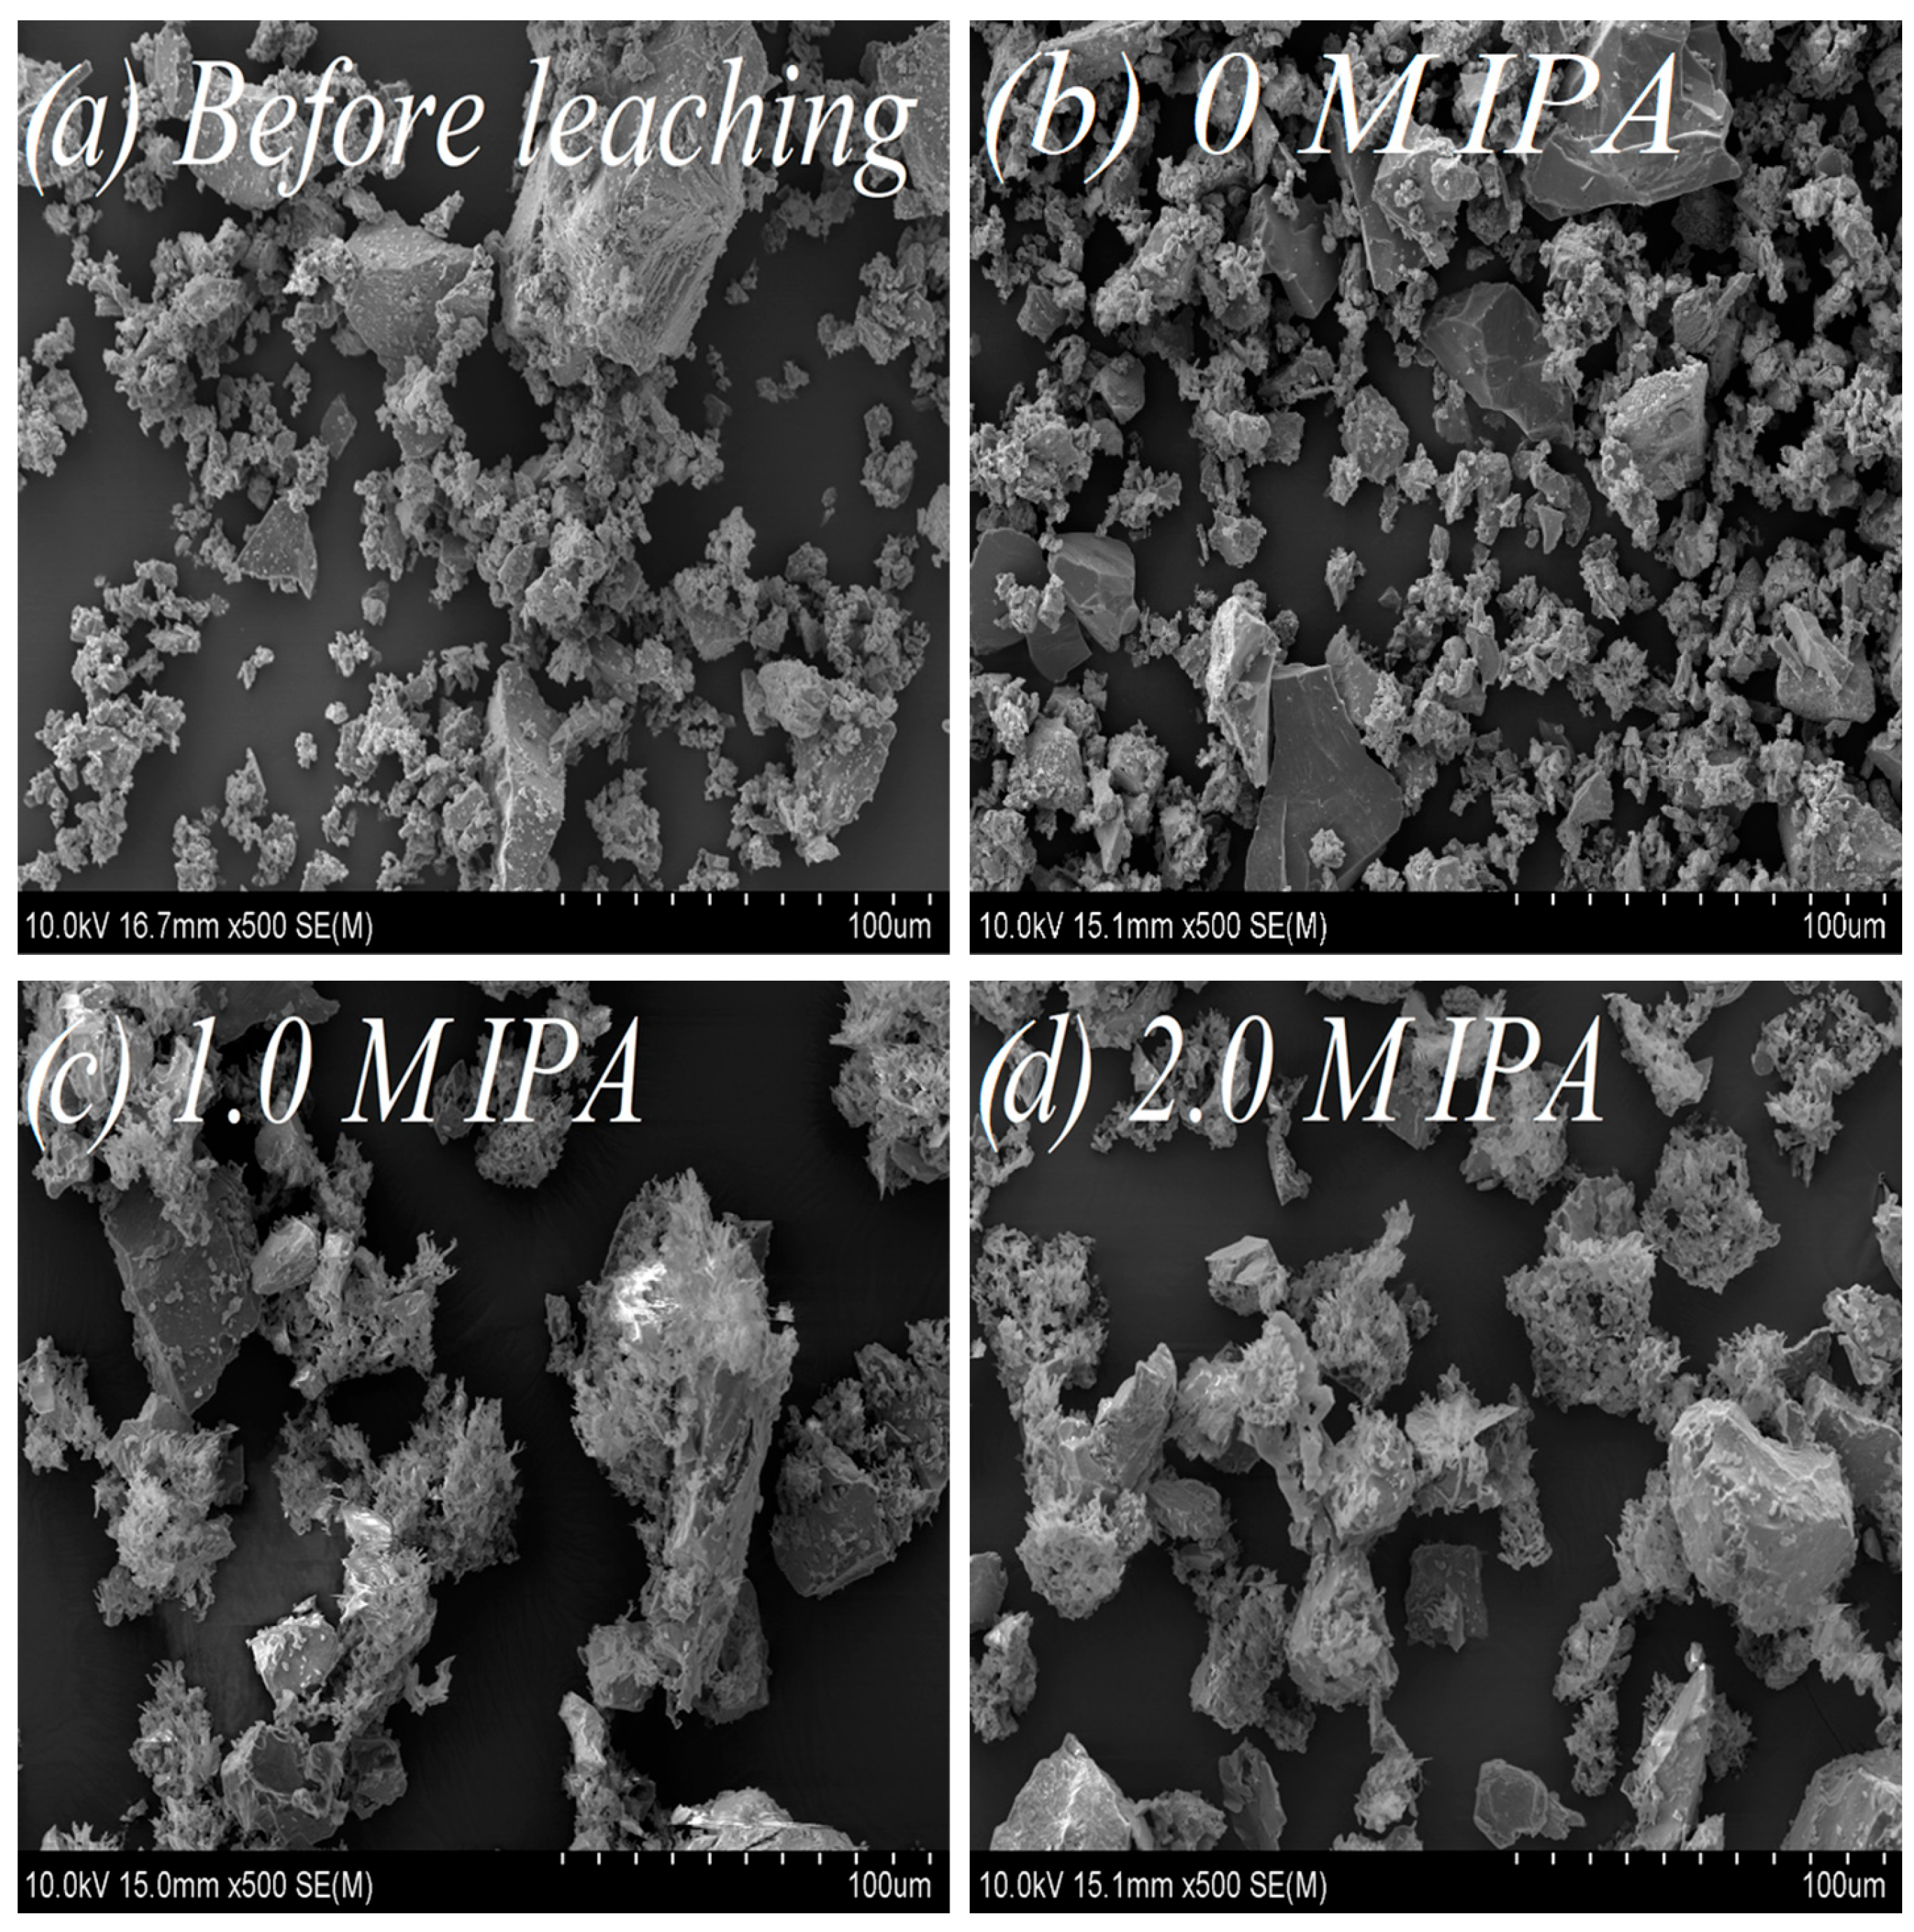
For evaluation of isopropanol influence on the change of surface morphology and phase composition in leached chalcopyrite samples, SEM (Figure 5a,d) and 57Fe Mössbauer (Figure 6, Table 4) analyses were performed. Additionally, as a supplementary study, the change of the substrate (chalcopyrite) surface was estimated from the measurements of N2 adsorption using BET analysis (Figure 7a,b).
The SEM images vividly depict the influence of IPA on chalcopyrite surface morphology. The un-leached sample (Figure 5a), characterized by a relatively undeveloped surface, and the leached chalcopyrite sample without IPA addition (Figure 5b) exhibit similarities. However, following the addition of IPA (1.0 and 2.0 M IPA), notable transformations unfold—the chalcopyrite surface becomes subtly smoother, spongy, and more porous, as illustrated in Figure 5c,d.
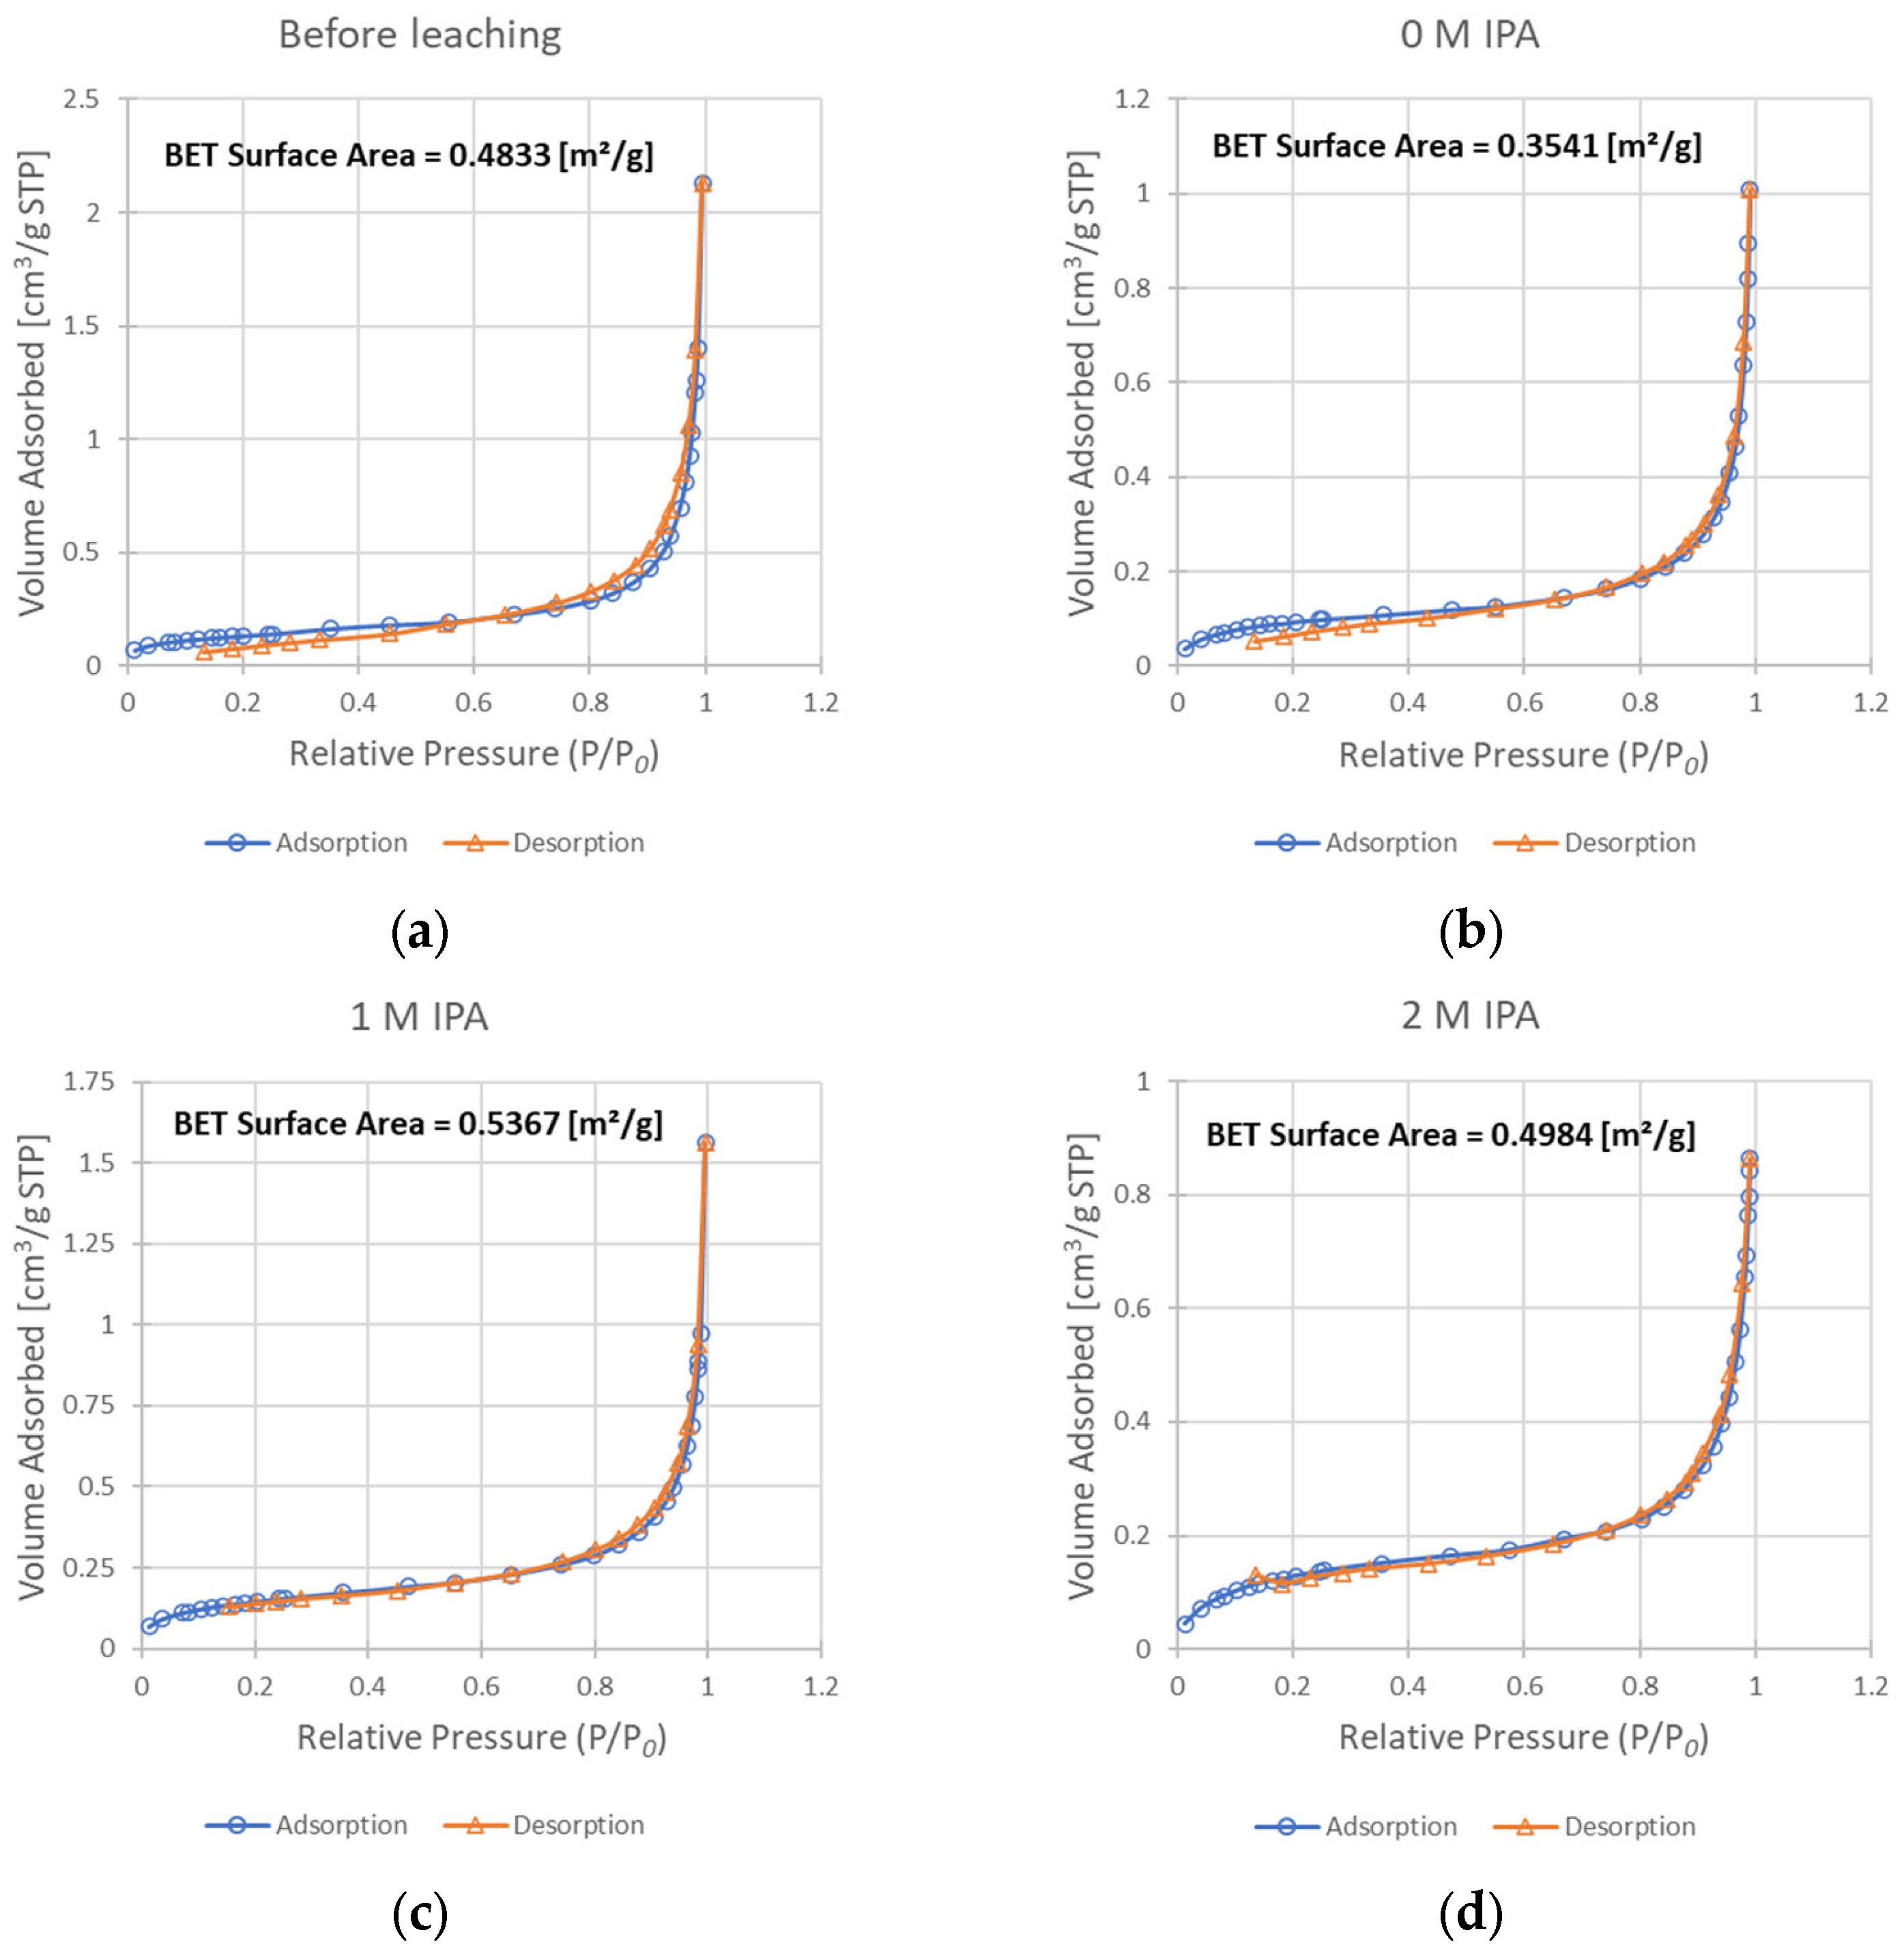
The progress of surface expansion was also experimentally confirmed from the adsorption studies. The comparison of BET isotherm data for the un-leached sample (Figure 7a) and samples leached with the addition of IPA (Figure 7c,d) showed a slight increase in the surface area from 0.483 m2/g to 0.537 and 0.498 m2/g for concentrations of IPA of 1 M and 2 M, respectively. While this increase may be subtle, the analysis of the surface of the sample leached without any IPA present in the system (Figure 7b) shows that its surface area decreased substantially when compared to chalcopyrite before leaching (to 0.354 m2/g). Such a decrease is not a desired effect during the leaching process, as it may result in a more difficult penetration of the leaching solution to the unreacted core of solid particles. Summarizing this part of our studies, it appears that the addition of IPA into the reacting system leads to improved surface development. As a result, the enhancement of copper oxidization is demonstrated by the rate increase in the leaching process (the kobs value increases twice when comparing leaching without IPA and with 2 M IPA). However, as an IPA concentration of 1 M resulted in a more developed surface than a concentration of 2 M, while simultaneously achieving a lower kobs value, it is safe to say that this mechanism is not the only way by which the presence of IPA influences this process.
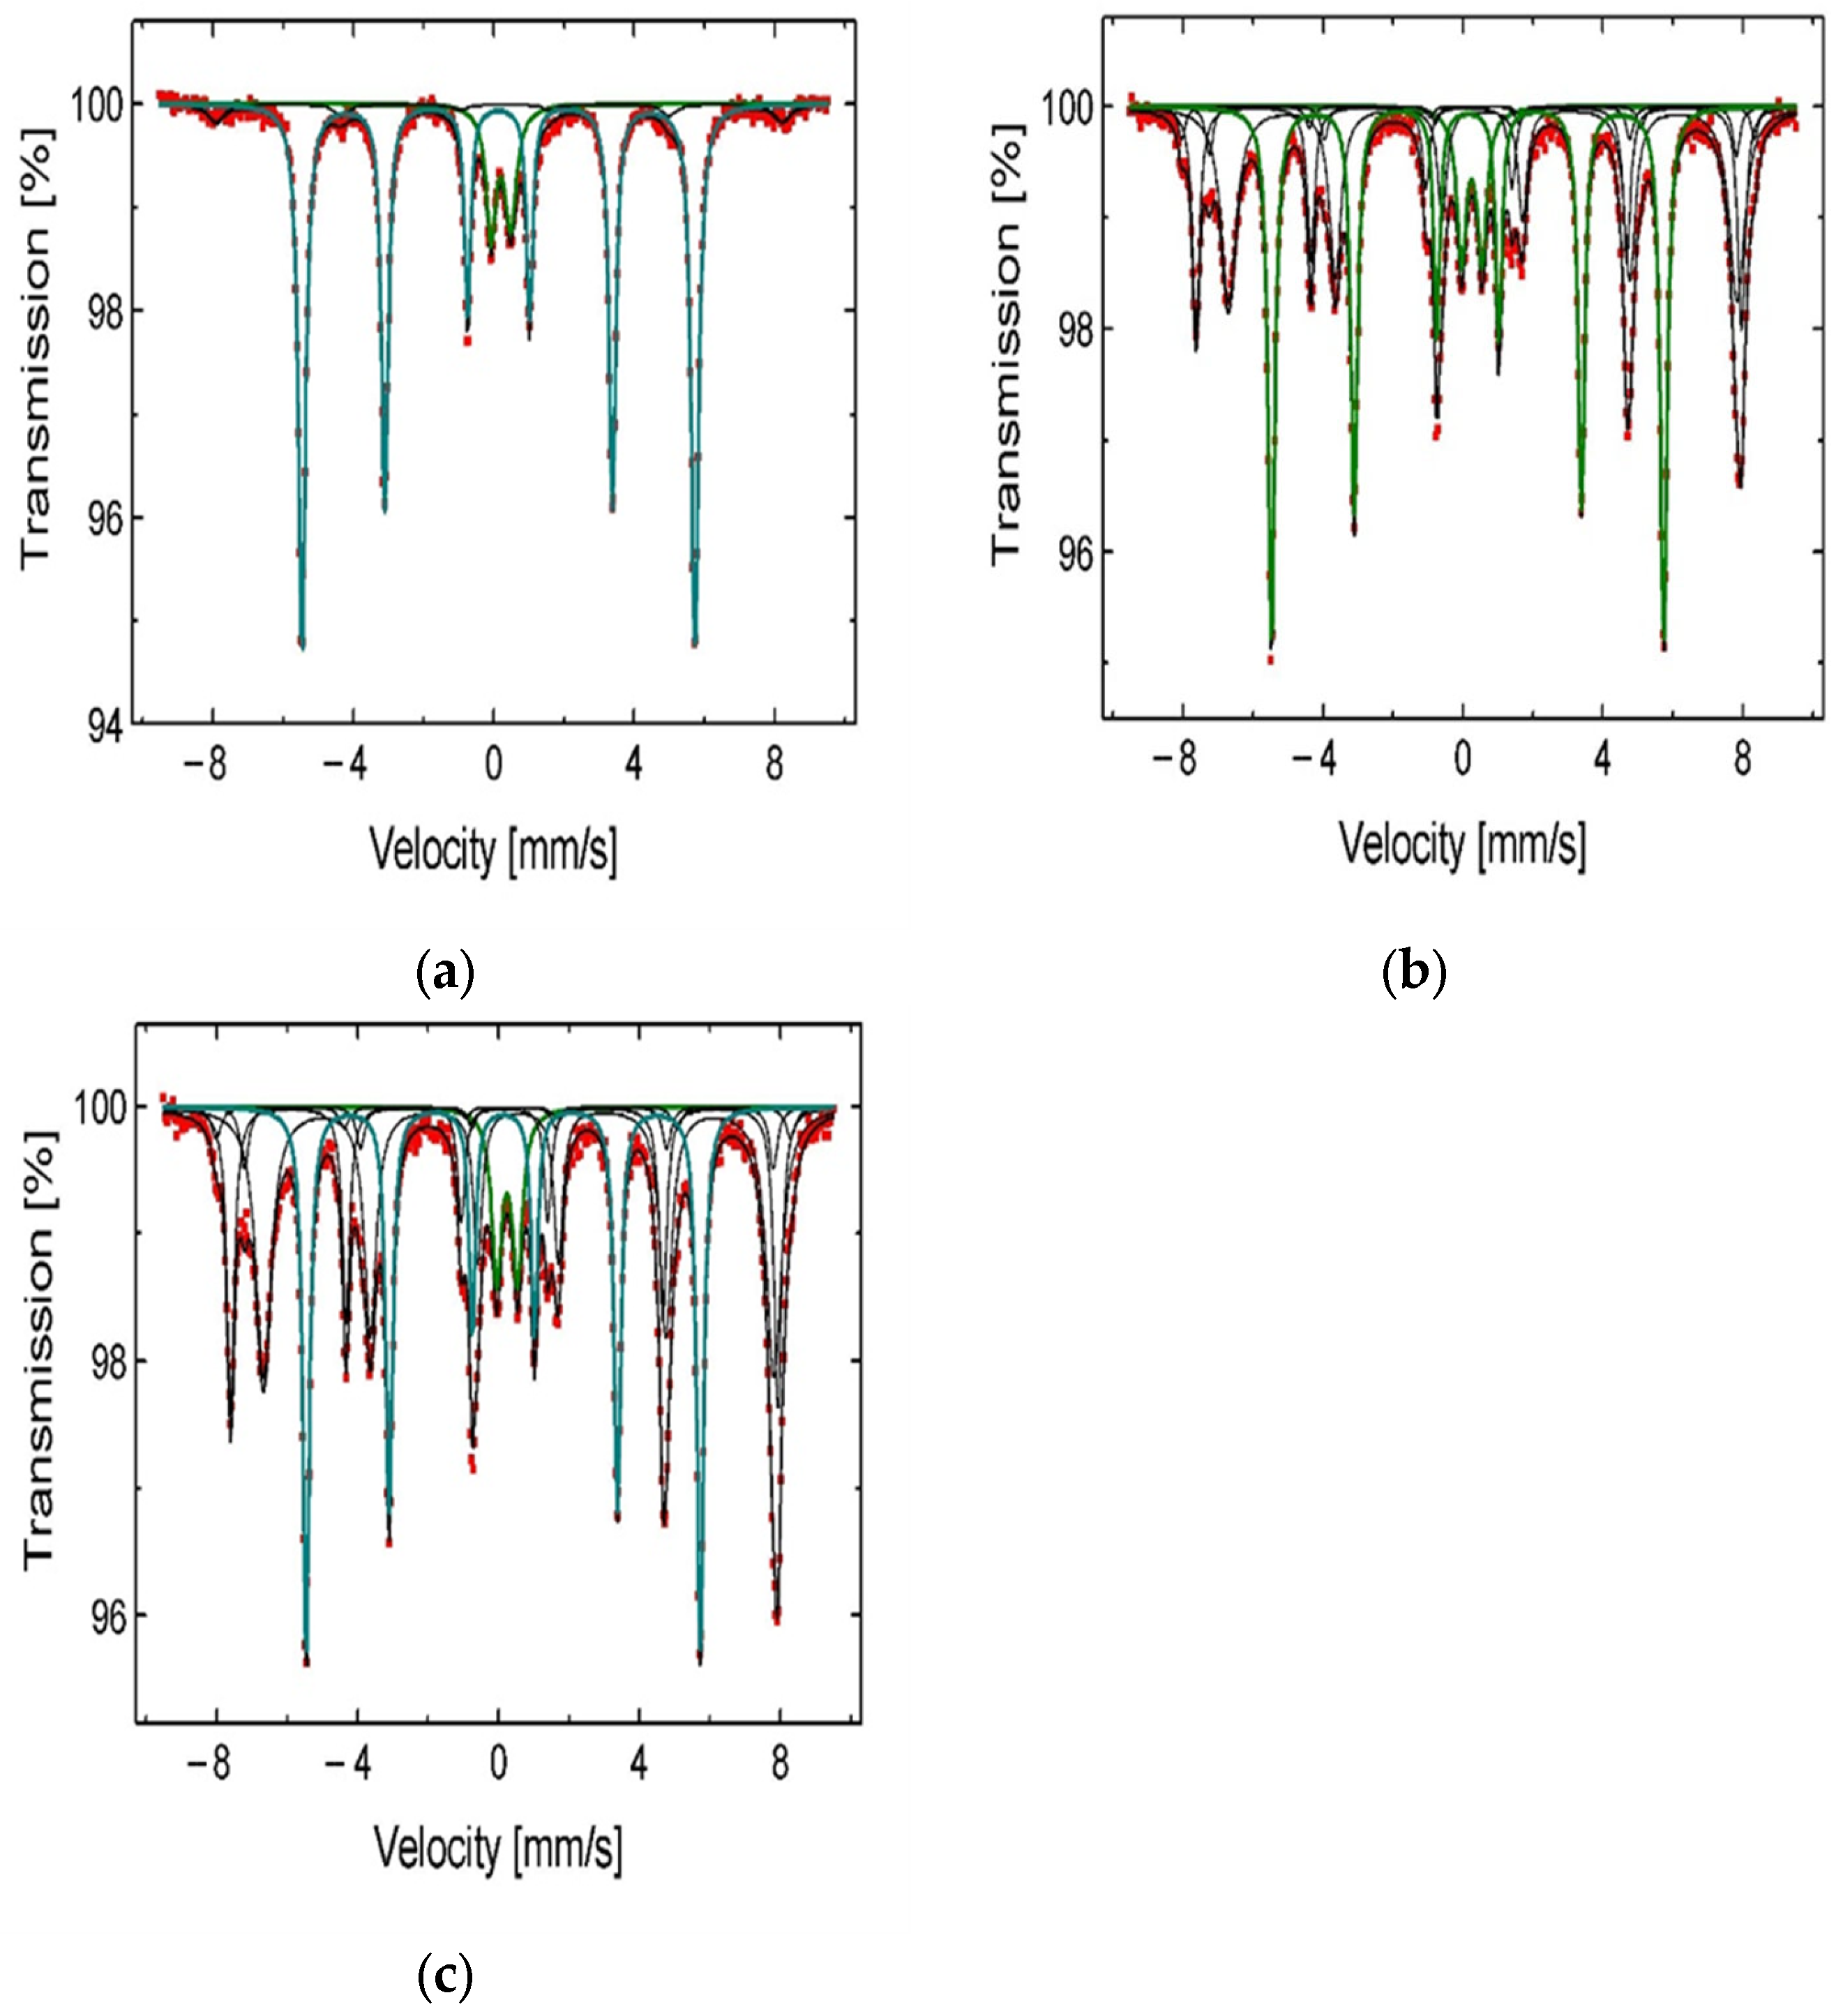
From the 57Fe Mössbauer spectra analysis (Figure 6a–c), one can observe an increasing contribution of the iron compounds (Fe2O3, Fe3O4, and FeS2) in solid residue when the CIPA increases in the leaching medium. These compounds are less leachable and remain relatively stable during the leaching process. It is highly likely that these compounds, stabilized by the IPA on the reaction surface, play the role of catalysts during the copper dissolution. The mechanism of catalytic activity of ferric ions was already suggested by Hirato et al. [8]. It is also worth mentioning the stabilizing role of IPA for hydrogen peroxide, which was described by Ghomi et al. [17]. The authors concluded that alcohol protects H2O2 from decomposition in a free-radical reaction. To summarize, both phenomena mentioned give the synergetic kinetic effect resulting in the acceleration of the copper dissolution from chalcopyrite samples. Considering the obtained results, further optimization of the leaching conditions was conducted under constant CIPA = 2.0 M applying different rates of stirring (vSR), H2O2 concentrations (CH2O2), and temperatures (T). These results are described in the next sections.
3.2. Effect of Stirring Rate
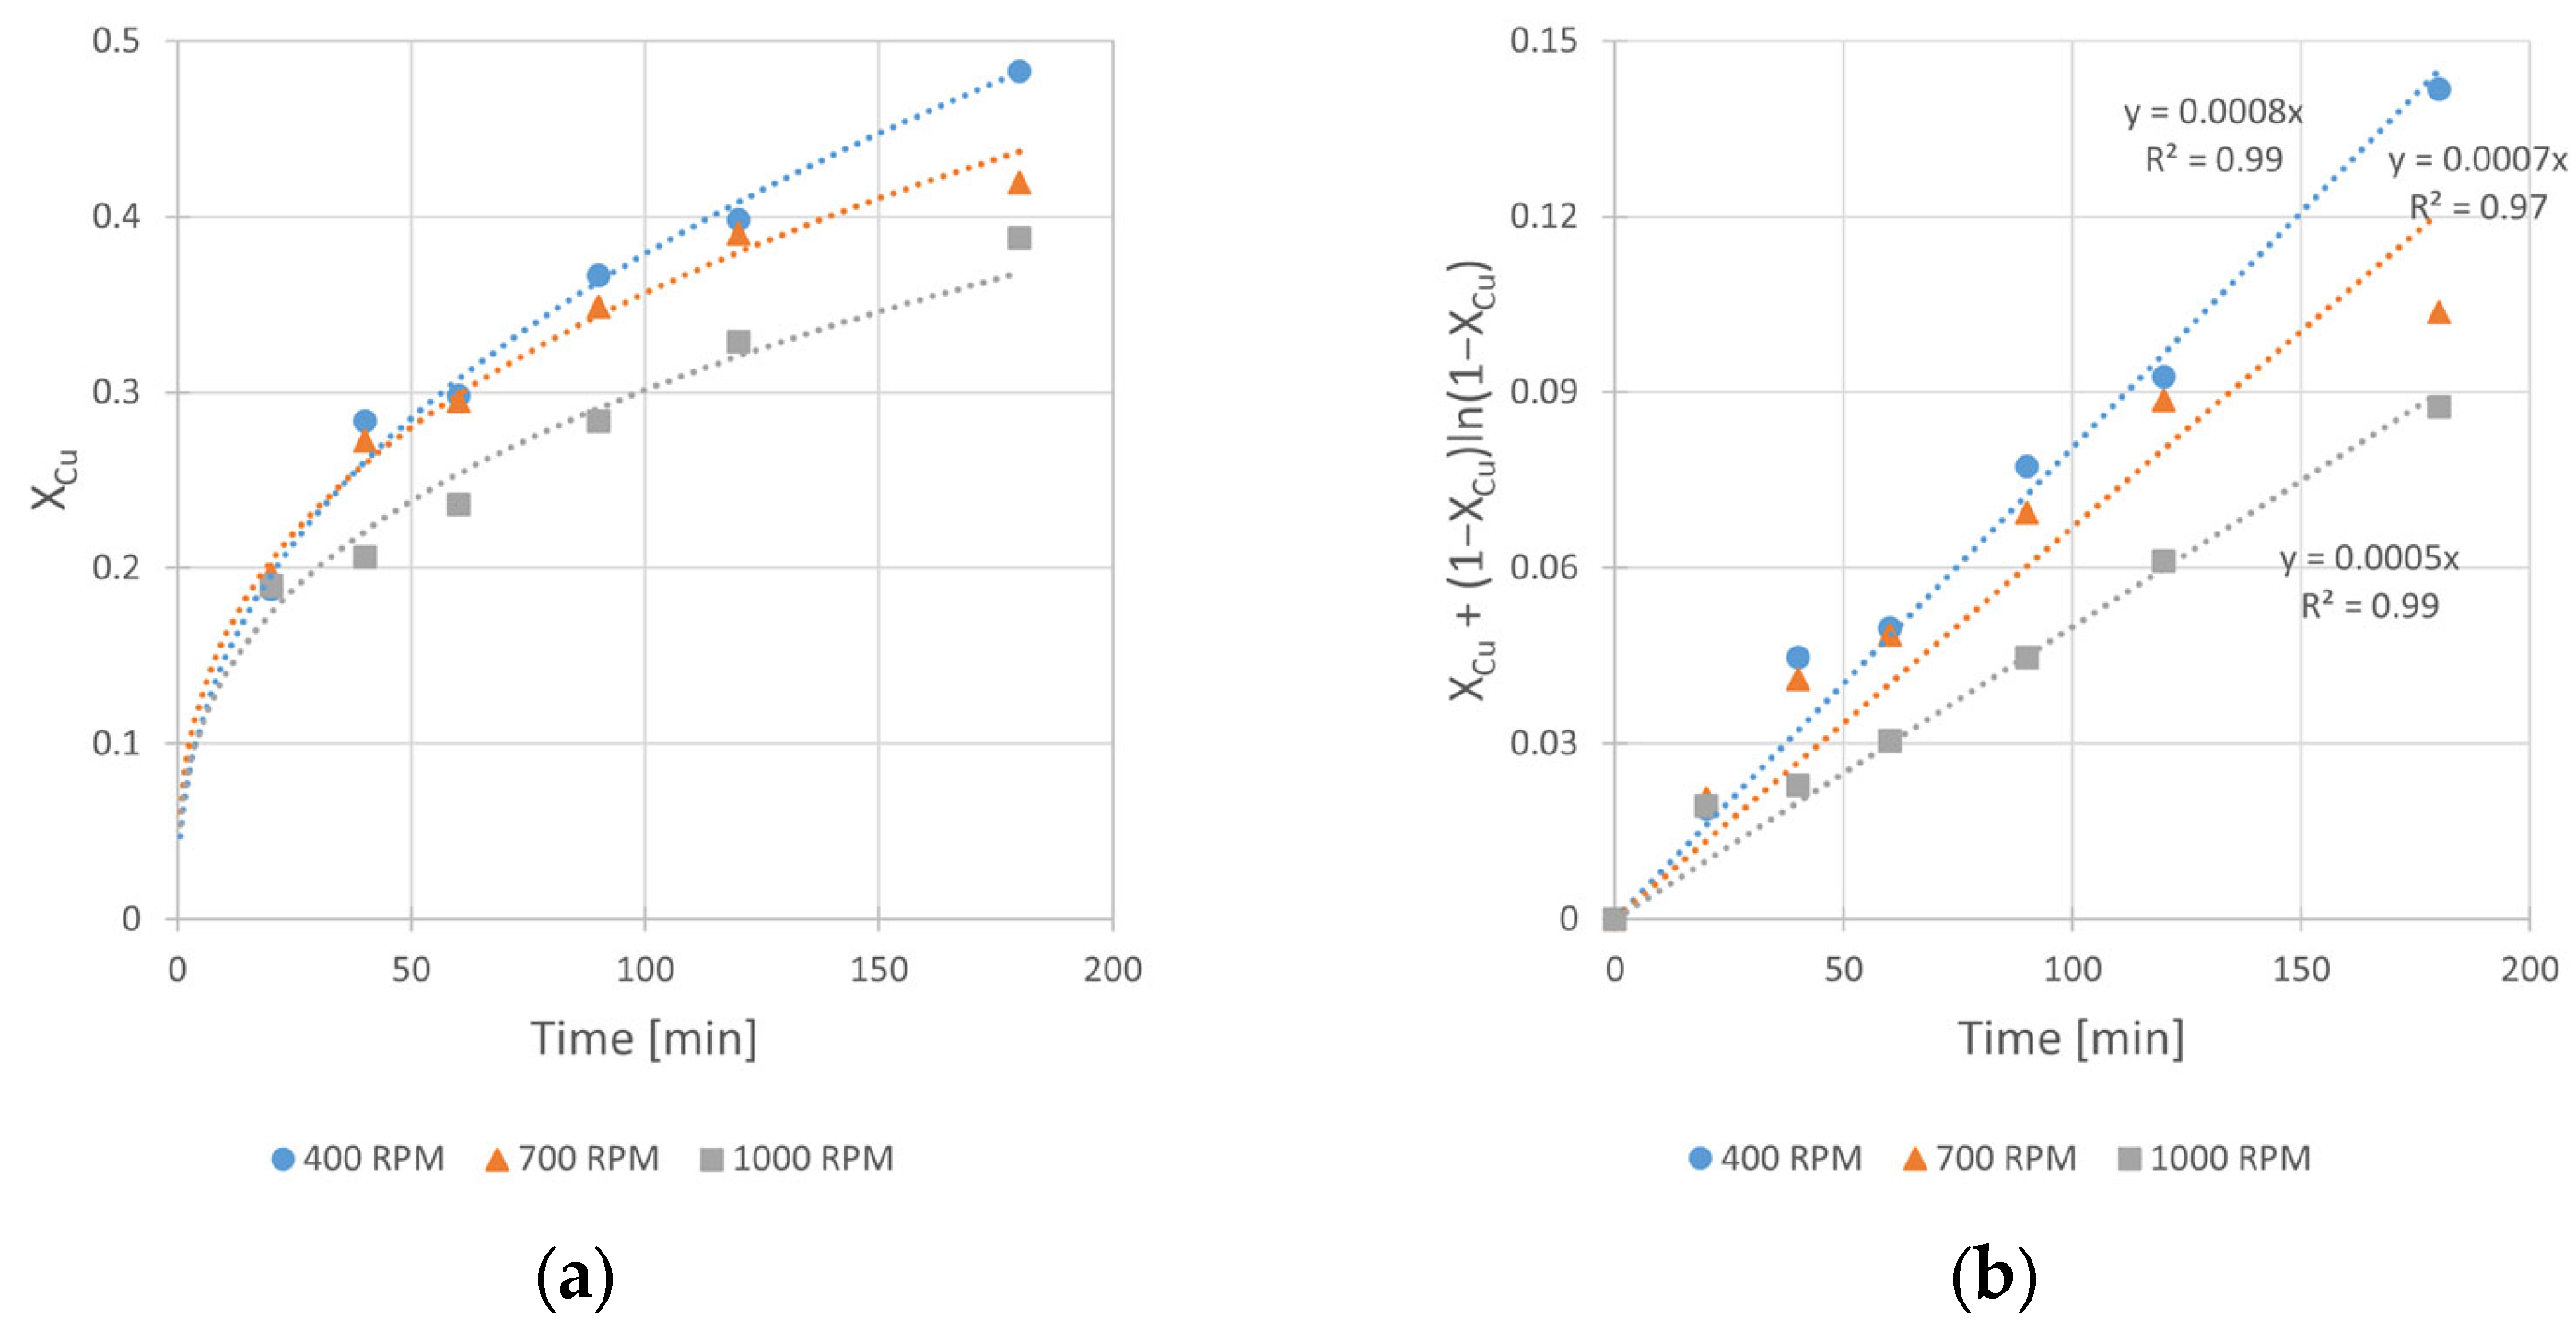
Due to the heterogeneous character of the studied reaction, the diffusion (either a transfer of an oxidant to the chalcopyrite surface or a product to the bulk solution) under certain conditions can play a role of the kinetic limiting factor of the overall process. Thus, it was expected that the rate of stirring (vSR) effect should give an answer to the question of whether the copper leaching process is diffusion- or reaction-controlled under the studied conditions. To describe the effect quantitatively, kinetic experiments at different vSR values (400, 700, and 1000 RPM) were conducted. Experimental conditions are given in Table 5.
The analysis of experimental kinetic curves (Figure 8) shows that increasing rate of stirring has a negative impact on the leaching rate. The leaching rate constant was inversely proportional to the rate of mixing. The kobs value changes from 8 × 10⁻⁴ to 5 × 10⁻⁴ min−1 when the vSR increases from 400 to 1000 RPM, respectively. This relationship contradicts the usually expected dependence according to which the intensive reactants stirring results in their better contact and consequently to acceleration of the leaching reaction. The observed opposite behavior of the reacting system can be explained by faster decomposition of hydrogen peroxide (the oxidant of metallic copper) under conditions of its relatively high concentration (2.0 M H2O2). Indeed, an intense gas (O2) evolution and solution foaming was noticed. The effect of the reaction inhibition was also reported by Sokić et al. [12] and Gok et al. [27], who conducted copper leaching in aqueous solutions of mineral acids (H2SO4 and HNO3, respectively) with a large excess of H2O2. Thus, it can be concluded that too intensive mixing results in the decrease in a copper oxidant concentration in the leaching solution, and finally it hinders copper leaching kinetics. Considering the experimental results, it was assumed the stirring rate of 400 RPM was the optimal one among the tested rates, and then it was applied in further studies.
3.3. Effect of H2O2 Concentration
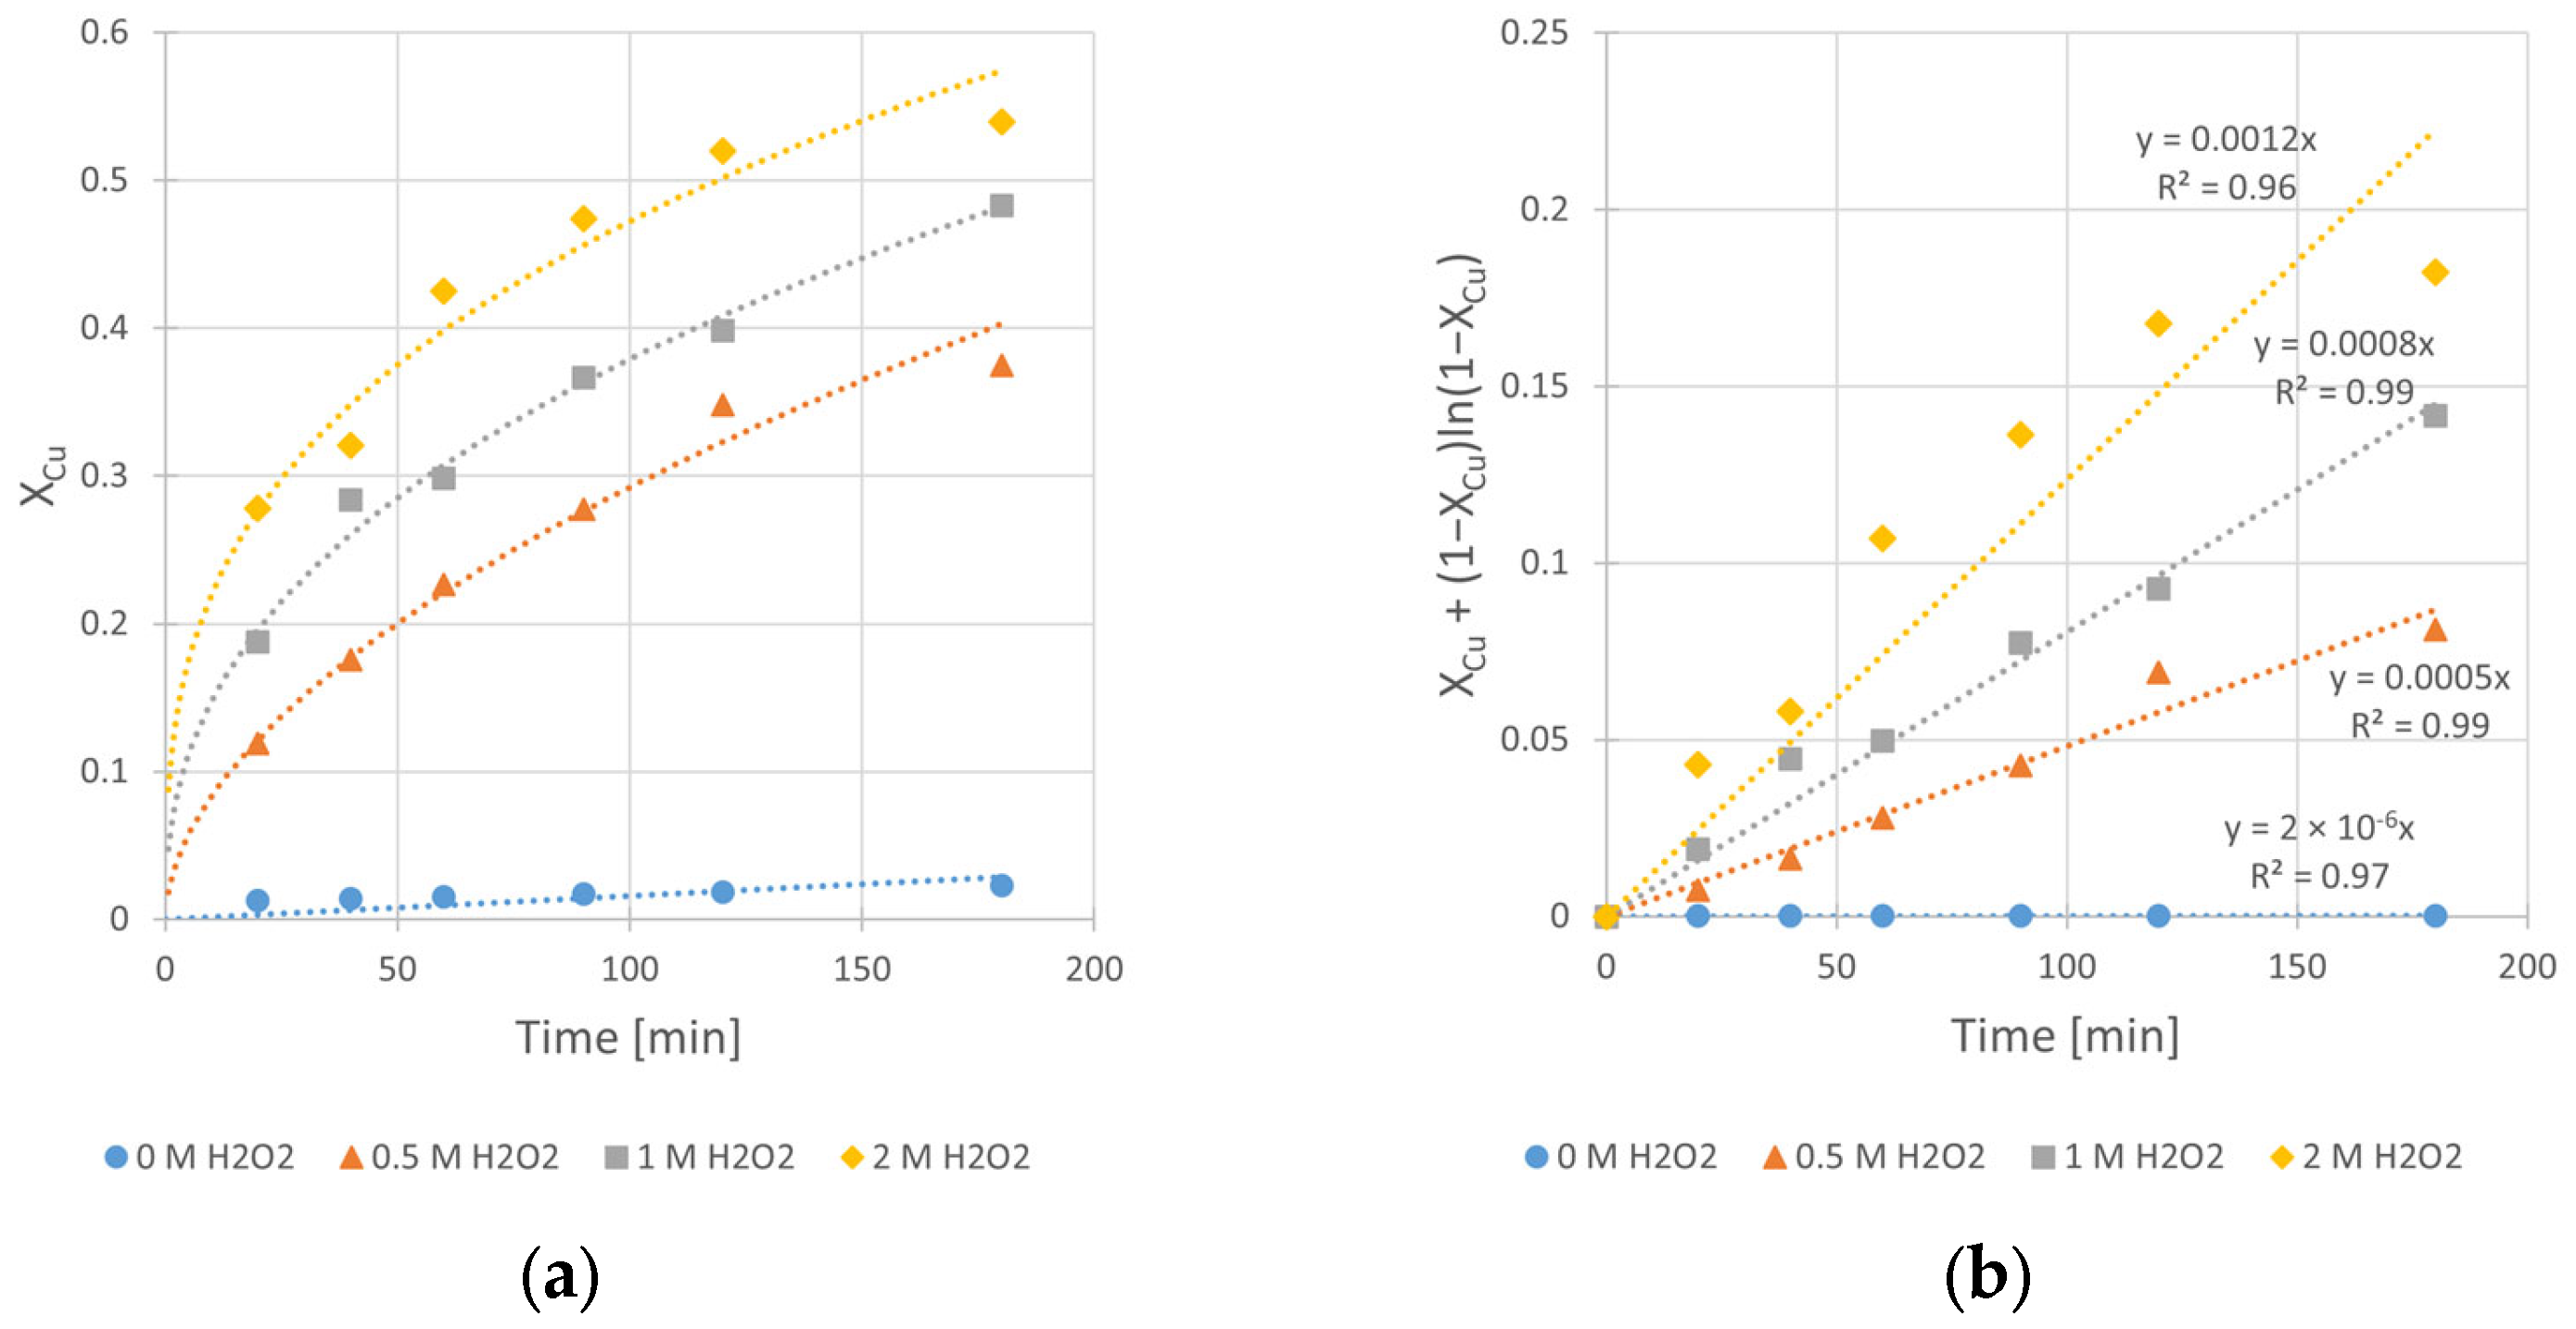
Hydrogen peroxide, as an oxidant, plays a crucial role in the copper leaching from chalcopyrite. However, it is clear from our previous experiments that H2O2 in contact with a mineral, especially when its surface is well developed, continuously decomposes. This fact underscores the challenge of selecting an appropriate initial concentration of H2O2 in the system, as it significantly impacts the final reaction yield. In order to find the optimal H2O2 concentration for the copper leaching, kinetic experiments at different CH2O2 values (0, 0.5, 1.0, and 2.0 M) were carried out. Experimental conditions are given in Table 6.
The obtained kinetic curves (Figure 9) clearly show the beneficial effect of H2O2 on the copper leaching efficiency, as well as the kinetics. Without its presence in the system, the final conversion (Xmax), registered after 3 h of the leaching process, was merely 2.3%. Application of 0.5, 1.0, and 2.0 M H2O2 results in significant increase in the conversion value up to 37, 48, and 54%, respectively. Also, the determined rate constants (kobs) clearly reflect the positive impact of CH2O2 increase. The change of CH2O2 from 0 to 2.0 M yields a kobs increase of three orders of magnitude (from 2 × 10⁻⁶ to 1.2 × 10⁻³ min−1). However, despite the greatest positive impact on the leaching kinetics being from high (2.0 M) H2O2 concentration, intensive decomposition of H2O2 was observed during the process. Due to the exothermic nature of this decomposition, the reactor required cooling during the first 30 min of the experiment. Taking into account the synergy of these phenomena, we decided to use a CH2O2 concentration of 1.0 M in experiments conducted at different temperatures (Section 3.4).
3.4. Effect of Temperature
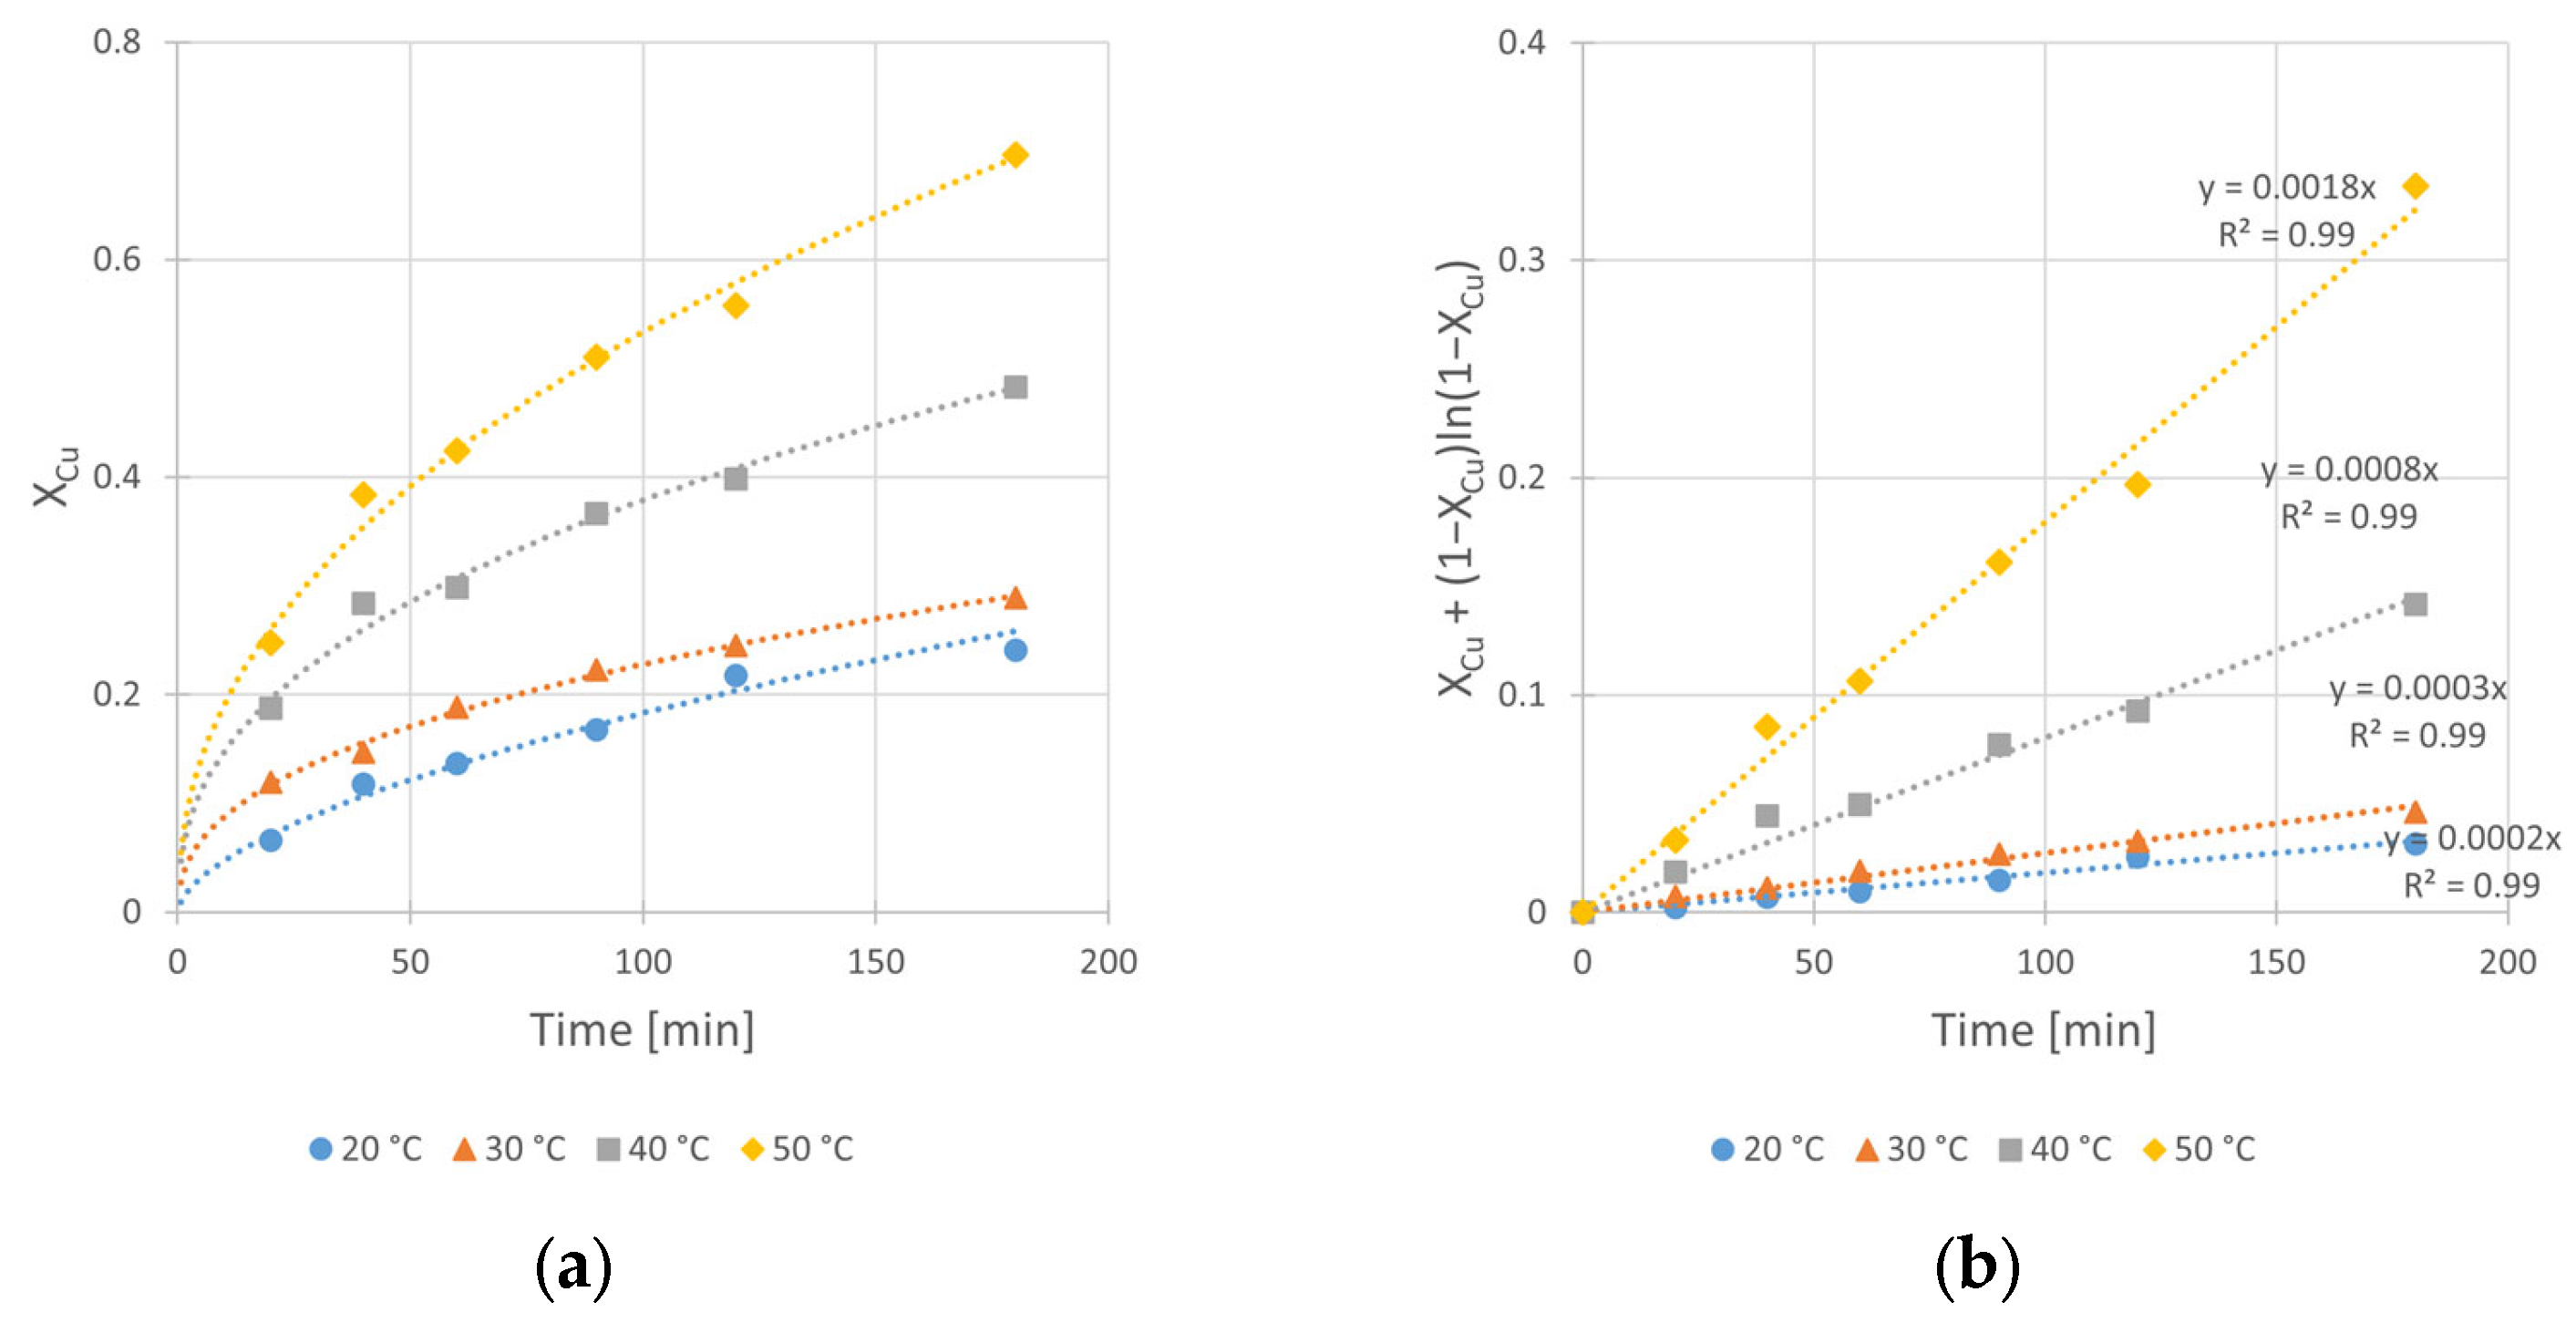
To determine the temperature influence on the rate constant kobs and on the conversion value Xmax, as well as to estimate the enthalpy and entropy of activation for the studied reaction, the kinetic curves at different temperatures (20, 30, 40, and 50 °C) were registered. Experimental conditions are given in Table 7.
The obtained graphical relationships of conversions over time and the corresponding fits of kinetic equation fits are presented in Figure 10a,b, respectively.
From the data shown in Figure 10, the effect of increasing temperature from 20 to 50 °C is evident. The 9-fold increase in kobs value from 2 × 10⁻⁴ to 18 × 10−4 min−1, as well as the change in conversion value (Xmax) from 24 to 70%, are derived. It is worth noting that under 50 °C, dynamic oxidant decomposition is observed. Thus, it can be suggested that the optimal leaching temperature should be lower than 50 °C.
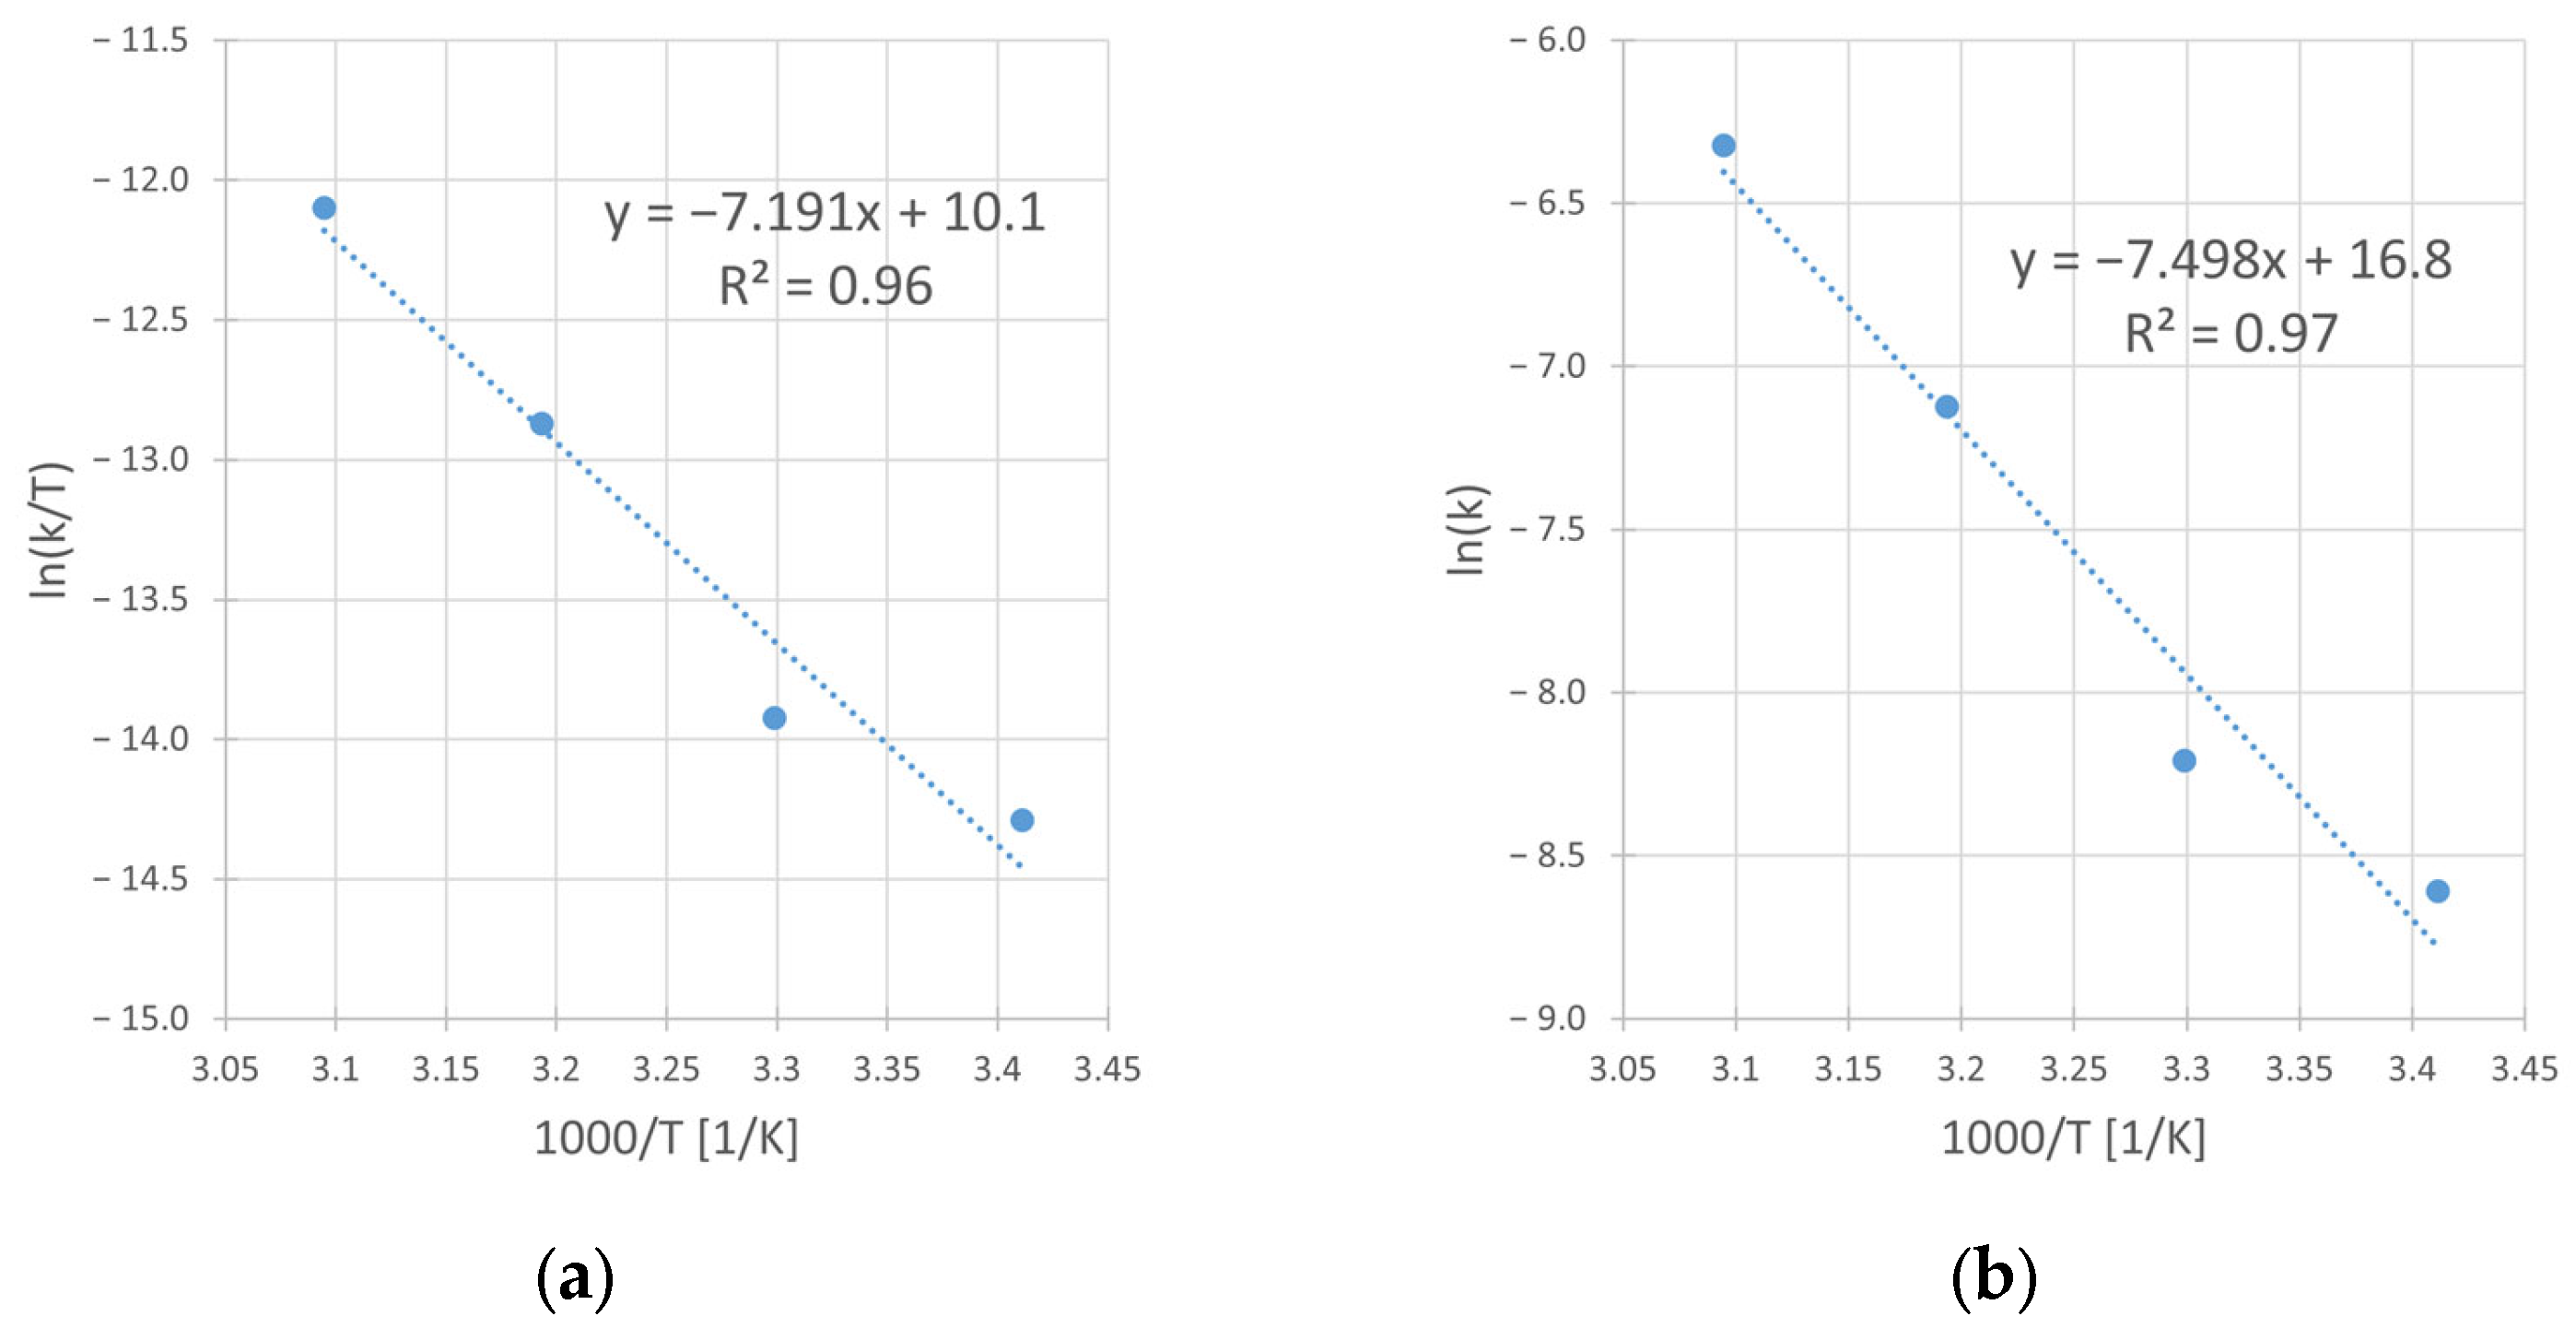
Using the linear form of Eyring [28] and Arrhenius’ [29] equation, from the slope and intercept of corresponding graphs (Figure 11a,b), the activation parameters were determined. The obtained values of the enthalpy (ΔH#) and the entropy (ΔS#) of activation in Eyring’s equation as well as of activation energy (EA) and preexponential factor (A) in Arrhenius’ equation, are presented in Table 8.
4. Discussion
For a large excess of copper oxidant (H2O2) and Cu2+ counter ions (SO42−) in the solution (as it was applied in the experiments), the rate of copper ions appearance in the system under reaction-controlled conditions can be generally described as a differential first-order kinetic equation:
where [Cu] is the copper content in the solid chalcopyrite sample.
dCCu2+/dt = kobs∙f ([Cu])
However, the integral form of Equation (5) is represented by Equation (3) under the assumption of cylindrical shape of particles. This Equation has worked best for the kinetic results interpretation (Figure 4b, Figure 8b, Figure 9b and Figure 10b) and considered the diffusion phenomenon. The data fitting with R2 from 0.96 to 0.99 for kinetic curves obtained at different IPA concentrations (CIPA), stirring rates (vSR), hydrogen peroxide concentrations (CH2O2), and temperatures (T) suggests that the rate-limiting step of the process is the transport of dissolution product (Cu2+ ad–ions) through the ash layer. It is worth mentioning that for a description of chalcopyrite leaching kinetic data, this SCM model was commonly used by several authors [10,11,14]. Thus, it was assumed that this step is rate-limiting for the reaction of copper leaching from chalcopyrite. The same model was used also by Sokić et al. [12] and Gok et al. [27]. These authors conducted leaching experiments in similar systems (H2SO4–H2O2 and H2SO4–HNO3, respectively), but without IPA presence in both cases. Due to the close similarity between the leaching conditions in our studies and those applied by Sokić et al. [12] (with identical 1 M H2O2 concentrations and the same limiting step in the SCM model), we compared the activation energy values determined in both cases. The lower EA value (approximately 25% lower) determined in our studies indicates more favorable conditions (with IPA additive) for copper leaching in such a system.
The role of various alcohols, along with some other polar organic reagents such as ethylene glycol, acetone, and formic and acetic acids, has already been explored in the literature, as seen in the work of Ruiz-Sánchez et al. [30]. According to these authors, short-chain organic additives inhibit the hydrogen peroxide dismutation reaction and slow down its decomposition in the leaching solution. Although hydrogen peroxide is relatively stable in acidic solutions, the presence of copper and iron promotes its decomposition, generating HO* radicals through Fenton and Fenton-type reactions [31]. Among the organic additives tested by Ruiz-Sánchez et al. [30], cyclohexanol proved to be the most effective due to its resistance to mineralization by HO* radicals, resulting in the highest percentage of leached copper. Following cyclohexanol, alcohols (methanol, ethanol, and isopropanol) were the next best additives, showing similar copper conversion rates (50–51%), with isopropanol attaining the lowest mineralization (8.5% as compared to 98% for methanol). As a result, IPA emerges as a promising additive in certain leaching systems, bolstered by its low cost and the possibility of sustainable production from biomass [32]. In the studied reacting system, the positive role of IPA is evident. It manifests itself via the increase in the rate constant (kobs) of the copper dissolution reaction as well as by an increase in conversion efficiency (Xmax) of the reaction (Section 3.1).
It is worth mentioning the role of IPA in the behavior of the iron compounds present in the leached material. From the comparison of the 57Fe Mössbauer spectrograms (Figure 6), it is evident that the leaching in the presence of increasing amount of IPA results in reduced dissolution of these compounds from chalcopyrite samples. This effect was also presented in a work of Solis-Marcial et al. [16], where methanol was tested. They suggest that the presence of alcohol stabilizes cuprous ion (Cu+), which then partakes in the redox reaction, resulting in oxidation of copper and simultaneous reduction of iron. Considering the literature data [7,8,9] indicating that ferric ions can be a catalyst for Cu oxidation, such a mechanism in the studied system also cannot be excluded. The Fe3+ ions coming from magnetite, as well as from Fe2+ oxidation, may accelerate the copper dissolution while undergoing reduction themselves. Summarizing, in addition to the stabilizing role of IPA in preventing H2O2 decomposition in the system, alcohol protects the iron oxides and sulfides from fast dissolution. Consequently, they can further play a catalytic role in the copper dissolution process.
To refer to the literature data presented by other authors, the comparison of experimentally determined EA value, the leaching medium composition, and the SCM kinetic model applied for kinetic data description was performed (Table 9).
One can tell from these data that the EA determined in our studies corresponds well to the values obtained by other authors conducting experiments in solutions containing both H2SO4 and H2O2. It can also be seen from the data shown in Table 9 that Adebayo et al. [10] reported an EA value of only 39 kJ/mol, which is significantly smaller than that given this study. They used only sulfuric acid and hydrogen peroxide as a leaching medium (without any alcohols), although the hydrogen peroxide was significantly more concentrated in their work. Another case of a system with only sulfuric acid and hydrogen peroxide as a leaching medium is the study of Sokić et al. [12]. They used a higher concentration of sulfuric acid than Adebayo et al. [10] while using a lower concentration of hydrogen peroxide. This resulted in an EA value of 80 kJ/mol, which may suggest that increasing the H2O2 concentration in the leaching medium may decrease the EA value of the process (as it is very unlikely that lower sulfuric acid concentrations caused those differences in EA values). However, the dynamic decomposition of hydrogen peroxide is observed when its concentration is relatively high (see Section 3.3). H2O2 decomposition is also observed at elevated temperature (50 °C) (see Section 3.4). Both facts tend to preclude leaching conditions with high concentrations of CH2O2 and T in practice. Only the application of the leaching medium with optimal composition (CH2SO4 = 0.5 M, CIPA = 2.0 M, CH2O2 = 1.0 M) and temperature (T = 40 °C) determined in this work offers the chance for stable conduction of the leaching process. However, applying these conditions, satisfactory process efficiency can be achieved in a time longer than 3 h.
As the used rate equation suggested, the transfer of copper ad–ions from the chalcopyrite surface to the solution is controlled by diffusion of Cu2+ ions through the ash layer. This suggestion indicates the significant role of stirring rate (vSR) as well as the role of the reaction surface, which both ensure the effective penetration by the leaching medium and easy transport of the products. In the studied heterogeneous reaction, specific due to the sensitivity of the oxidant (H2O2) to too high a vSR value (see Section 3.2), its concentration (see Section 3.3), and the temperature (see Section 3.4), these variables were optimized and can be partly controllable.
5. Conclusions
Summarizing the results of this work, the following conclusions can be drawn:
- The presence of isopropanol (IPA) in the leaching system enhances the kinetics of copper dissolution from chalcopyrite. The observed leaching rate constant (kobs) changes by as much as twice (from 4 × 10⁻⁴ to 8 × 10⁻⁴ min−1) when the IPA concentration (CIPA) increases from 0 to 2.0 M, respectively. The IPA also improved the efficiency of the studied reaction. The final conversion (Xmax) of the copper leaching conducted without IPA in reacting system reaches 35%, while the application of 1.0 and 2.0 M of IPA results in increases in Xmax to 45 and 48%, respectively.
- The iron compounds (Fe2O3, Fe3O4 and FeS2) present in the chalcopyrite are more stable (less leachable) during the leaching process when IPA is added into the solution. Under such conditions, the enhancement of the copper leaching efficiency as well as the rate of the process are evident. It is probably caused by the synergy of two phenomena: the catalytic impact of iron compounds on the rate of Cu dissolution and the stabilizing role of IPA for H2O2.
- The microscopic and BET isotherm analyses prove that the IPA presence affects the surface morphology of the leached chalcopyrite. Under such conditions, the spongy and enlarged substrate surface facilitates improved contact with the leaching medium, allowing for easier penetration into the unreacted core of solid particles. This, in turn, promotes a more efficient leaching process.
- The increase in the stirring rate (vSR) causes a negative effect on the copper leaching kinetics. In the range from 400 to 1000 RPM, the rate constant (kobs) decreases from 8 × 10⁻⁴ to 5 × 10⁻⁴ min−1. The same relation refers to the conversion (Xmax), which decreases from 48 to 39%, respectively. The leaching inhibition with the vSR increase is explained by the better reactants contact at higher vSR, which results in a rapid decrease in oxidant (H2O2) concentration due to its faster decomposition on the enlarged substrate surface.
- The application of the optimal H2O2 concentration is required during the leaching. The lack of H2O2 presence in the system results in very slow reaction (kobs = 0.2 min−1) and a very small final conversion (Xmax equal to only 2.3%). The increase in H2O2 concentrations from 0.5 to 2 M results in significant increases in both kobs (from 5 × 10⁻⁴ to 12 × 10−4 min−1, respectively) and Xmax (from 37 to 54%, respectively). However, using concentration CH2O2 = 2.0 M in the leaching medium results in a foaming of the reacting solution due to the H2O2 decomposition with corresponding O2 release.
- The temperature significantly influenced the rate and the efficiency of the process. In the temperature range from 20 to 50 °C, a 9–fold increase in kobs value (from 2 × 10⁻⁴ to 18 × 10−4 min−1) as well as a ca. 3–fold change of conversion value (Xmax) (from 24 to 70%) is observed.
- The kinetic results indicate that the rate-limiting step for the overall copper leaching process is the diffusion through the ash layer. The optimal conditions for the copper leaching under the range of applied variables are given in Table 10:
Author Contributions
Conceptualization, T.M. and K.P.; methodology, K.P.; validation, T.M.; formal analysis, T.M.; investigation, T.M.; data curation, T.M.; writing—original draft preparation, T.M. and K.P.; writing—review and editing, K.F.; visualization, T.M.; supervision, K.P.; project administration, K.F. All authors have read and agreed to the published version of the manuscript.
Funding
This research received no external funding.
Institutional Review Board Statement
Not applicable.
Informed Consent Statement
Not applicable.
Data Availability Statement
The datasets used and/or analyzed during the current study are available from T. Michałek ([email protected]) upon reasonable request.
Acknowledgments
The authors would like to thank Jan Żukrowski from the Academic Centre for Materials and Nanotechnology (AGH University of Krakow) for his assistance in Mössbauer analysis, Kamil Kornaus from the Faculty of Materials Sciences and Ceramics (AGH University of Krakow) for his assistance in adsorption measurements, and Anna Kula from the Faculty of Non-ferrous Metals (AGH University of Krakow) for her assistance in SEM analysis.
Conflicts of Interest
The authors declare no conflict of interest.
Correction Statement
This article has been republished with a minor correction to the existing affiliation information. This change does not affect the scientific content of the article.
References
- Faris, N.; Pownceby, M.I.; Bruckard, W.J.; Chen, M. The Direct Leaching of Nickel Sulfide Flotation Concentrates—A Historic and State-of-the-Art Review Part II: Laboratory Investigations into Pressure Leaching. Miner. Process. Extr. Metall. Rev. 2023, 44, 451–473. [Google Scholar] [CrossRef]
- Song, K.C.; Lee, S.M.; Park, T.S.; Lee, B.S. Preparation of Colloidal Silver Nanoparticles by Chemical Reduction Method. Korean J. Chem. Eng. 2009, 26, 153–155. [Google Scholar] [CrossRef]
- Lewis, A.E. Review of Metal Sulphide Precipitation. Hydrometallurgy 2010, 104, 222–234. [Google Scholar] [CrossRef]
- Mohandas, K.S. Direct Electrochemical Conversion of Metal Oxides to Metal by Molten Salt Electrolysis: A Review. Miner. Process. Extr. Metall. 2013, 122, 195–212. [Google Scholar] [CrossRef]
- Willner, J.; Pacholewska, M.; Fornalczyk, A. Wprowadzenie Do Hydrometalurgii i Biometalurgii Metali Nieżelaznych; Wydawnictwo Politechniki Śląskiej: Gliwice, Poland, 2015; ISBN 978-83-7880-279-2. [Google Scholar]
- Li, M.T.; Wei, C.; Zhou, X.J.; Qiu, S.; Deng, Z.G.; Li, X.B. Kinetics of Vanadium Leaching from Black Shale in Non-Oxidative Conditions. Trans. Inst. Min. Metall. Sect. C Miner. Process. Extr. Metall. 2012, 121, 40–47. [Google Scholar] [CrossRef]
- Majima, H.; Awakura, Y.; Hirato, T.; Tanakat, T. The Leaching of Chalcopyrite in Ferric Chloride and Ferric Sulfate Solutions. Can. Metall. Q. 1985, 24, 283–291. [Google Scholar] [CrossRef]
- Hirato, T.; Kinoshita, M.; Awakura, Y.; Majima, H. The Leaching of Chalcopyrite with Ferric Chloride. Metall. Mater. Trans. B 1986, 17, 19–28. [Google Scholar] [CrossRef]
- Munoz, P.B.; Miller, J.D.; Wadsworth, M.E. Reaction Mechanism for the Acid Ferric Sulfate Leaching of Chalcopyrite. Metall. Mater. Trans. B 1979, 10, 149–158. [Google Scholar] [CrossRef]
- Adebayo, A.; Ipinmoroti, K.; Ajayi, O. Dissolution Kinetics of Chalcopyrite with Hydrogen Peroxide in Sulphuric Acid Medium. Chem. Biochem. Eng. Q. 2003, 17, 213–218. [Google Scholar]
- Antonijević, M.M.; Janković, Z.D.; Dimitrijević, M.D. Kinetics of Chalcopyrite Dissolution by Hydrogen Peroxide in Sulphuric Acid. Hydrometallurgy 2004, 71, 329–334. [Google Scholar] [CrossRef]
- Sokić, M.; Marković, B.; Stanković, S.; Kamberović, Ž.; Štrbac, N.; Manojlović, V.; Petronijević, N. Kinetics of Chalcopyrite Leaching by Hydrogen Peroxide in Sulfuric Acid. Metals 2019, 9, 1173. [Google Scholar] [CrossRef]
- Yepsen, O.; Yáñez, J.; Mansilla, H.D. Photocorrosion of Copper Sulfides: Toward a Solar Mining Industry. Sol. Energy 2018, 171, 106–111. [Google Scholar] [CrossRef]
- Solís-Marcíal, O.J.; Lapidus, G.T. Chalcopyrite Leaching in Alcoholic Acid Media. Hydrometallurgy 2014, 147–148, 54–58. [Google Scholar] [CrossRef]
- Solís Marcial, O.J.; Nájera Bastida, A.; Bañuelos, J.E.; Valdés Martínez, O.U.; Luevano, L.A.; Serrano Rosales, B. Chalcopyrite Leaching Kinetics in the Presence of Methanol. Int. J. Chem. React. Eng. 2019, 17, 20190081. [Google Scholar] [CrossRef]
- Solís-Marcial, O.J.; Lapidus, G.T. Study of the Dissolution of Chalcopyrite in Sulfuric Acid Solutions Containing Alcohols and Organic Acids. Electrochim. Acta 2014, 140, 434–437. [Google Scholar] [CrossRef]
- Ghomi, M.A.; Mozammel, M.; Moghanni, H.; Shahkar, L. Atmospheric Leaching of Chalcopyrite in the Presence of Some Polar Organic Reagents: A Comparative Study and Optimization. Hydrometallurgy 2019, 189, 105120. [Google Scholar] [CrossRef]
- Levenspiel, O. Chemical Reaction Engineering; John Wiley & Sons: Hoboken, NJ, USA, 1998; ISBN 047125424X. [Google Scholar]
- Haldar, S.K. Minerals and Rocks. In Introduction to Mineralogy and Petrology; Elsevier: Amsterdam, The Netherlands, 2020; pp. 1–51. [Google Scholar]
- Morice, J.A.; Rees, L.V.C.; Rickard, D.T. Mössbauer Studies of Iron Sulphides; Pergamon Press: Oxford, UK, 1969; Volume 3. [Google Scholar]
- Winsett, J.; Moilanen, A.; Paudel, K.; Kamali, S.; Ding, K.; Cribb, W.; Seifu, D.; Neupane, S. Quantitative Determination of Magnetite and Maghemite in Iron Oxide Nanoparticles Using Mössbauer Spectroscopy. SN Appl. Sci. 2019, 1, 1636. [Google Scholar] [CrossRef]
- Evans, B.J.; Hafner, S.S. 57Fe Hyperfine Fields in Magnetite (Fe3O4). J. Appl. Phys. 1969, 40, 1411–1413. [Google Scholar] [CrossRef]
- Frenzel, N.; Mehne, M.; Bette, S.; Kureti, S.; Frisch, G. Synthesis and Stability of Single-Phase Chalcopyrite-a Potential Reference Material for Key Investigations in Chemistry and Metallurgical Engineering. RSC Adv. 2021, 11, 3153–3161. [Google Scholar] [CrossRef]
- Dyar, M.D.; Agresti, D.G.; Schaefer, M.W.; Grant, C.A.; Sklute, E.C. Mössbauer Spectroscopy of Earth and Planetary Materials. Annu. Rev. Earth Planet Sci. 2006, 34, 83–125. [Google Scholar] [CrossRef]
- Stevens, J.G.; Khasanov, A.M.; Miller, B.; Pollak, H.; Li, Z. Mössbauer Mineral Handbook. Mössbauer Effect Data Center: Asheville, NC, USA, 2005. [Google Scholar]
- Bahgat, A.A.; Fayek, M.K.; Salah, S.; Eissa, N.A. Effect of divalent iron on mossbauer parameters of COX2+ FE1−X2+ FE23+ O4 ferrites. Indian J. Pure Appl. Phys. 1978, 16, 810–814. [Google Scholar]
- Gok, O.; Anderson, C.G.; Cicekli, G.; Ilknur Cocen, E. Leaching Kinetics of Copper from Chalcopyrite Concentrate in Nitrous-Sulfuric Acid. Physicochem. Probl. Miner. Process. 2014, 50, 399–413. [Google Scholar] [CrossRef]
- Rehman, A.; Saleem, F.; Javed, F.; Qutab, H.G.; Eze, V.C.; Harvey, A. Kinetic Study for Styrene Carbonate Synthesis via CO2 Cycloaddition to Styrene Oxide Using Silica-Supported Pyrrolidinopyridinium Iodide Catalyst. J. CO2 Util. 2021, 43, 101379. [Google Scholar] [CrossRef]
- Kohout, J. Modified Arrhenius Equation in Materials Science, Chemistry and Biology. Molecules 2021, 26, 7162. [Google Scholar] [CrossRef] [PubMed]
- Ruiz-Sánchez, A.; Lapidus, G.T. Decomposition of Organic Additives in the Oxidative Chalcopyrite Leaching with Hydrogen Peroxide. Min. Eng. 2022, 187, 107783. [Google Scholar] [CrossRef]
- Nicol, M.J. The Role and Use of Hydrogen Peroxide as an Oxidant in the Leaching of Minerals. 1. Acid Solutions. Hydrometallurgy 2020, 193, 105328. [Google Scholar] [CrossRef]
- Liew, F.E.; Nogle, R.; Abdalla, T.; Rasor, B.J.; Canter, C.; Jensen, R.O.; Wang, L.; Strutz, J.; Chirania, P.; De Tissera, S.; et al. Carbon-Negative Production of Acetone and Isopropanol by Gas Fermentation at Industrial Pilot Scale. Nat. Biotechnol. 2022, 40, 335–344. [Google Scholar] [CrossRef]
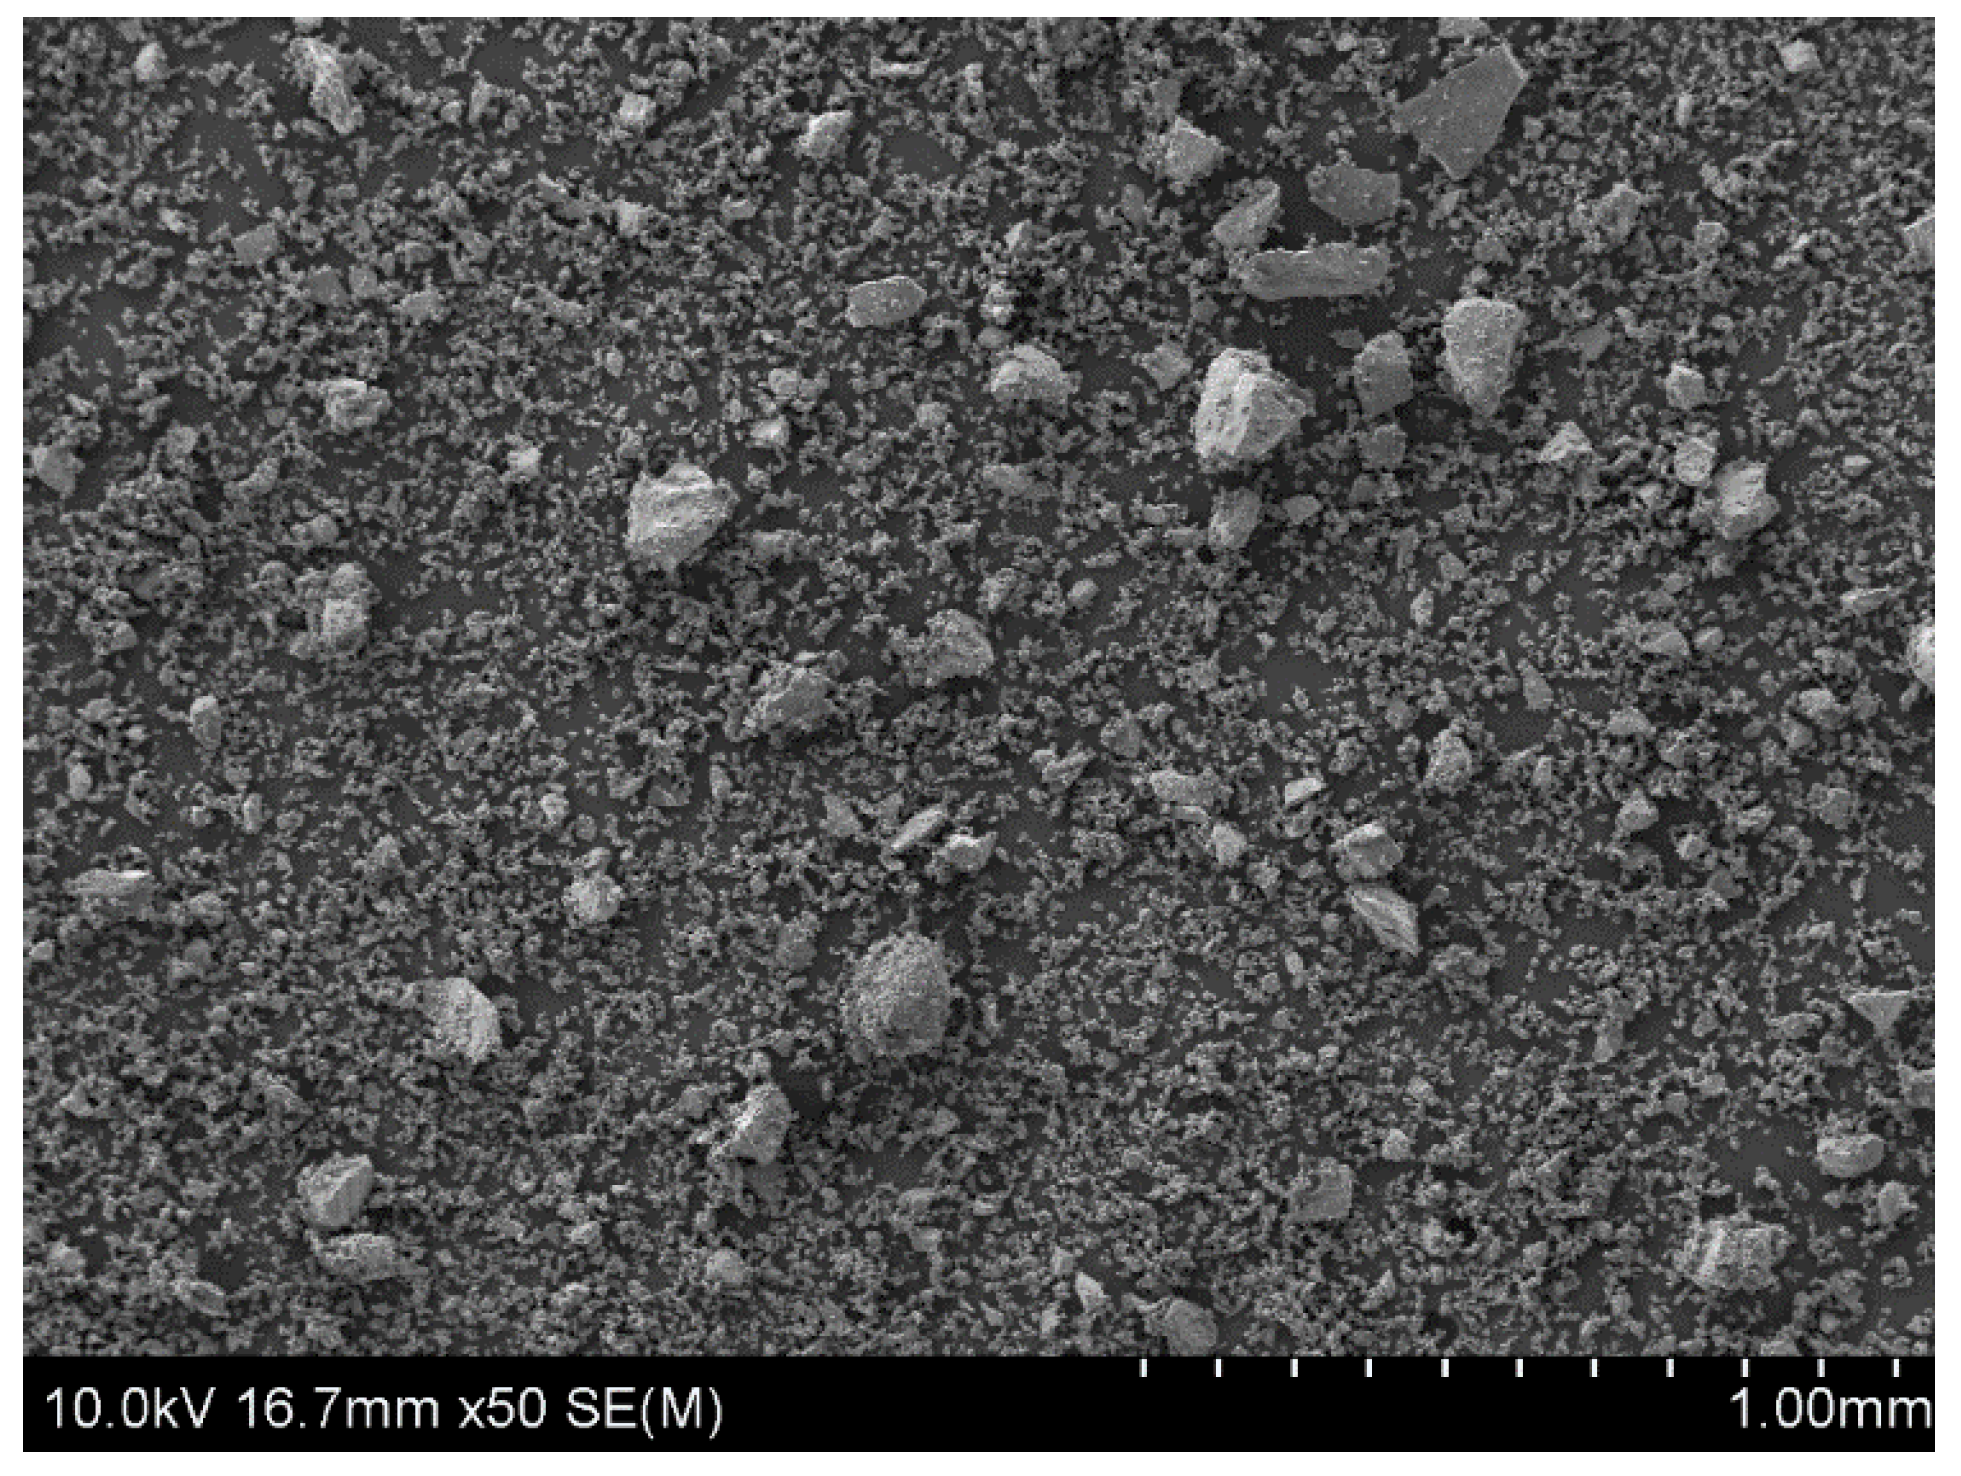
Figure 1.
The SEM image of chalcopyrite sample after 5 min grinding in a roller-ring mill. A starting material for the leaching experiments.
Figure 1.
The SEM image of chalcopyrite sample after 5 min grinding in a roller-ring mill. A starting material for the leaching experiments.

Figure 2.
The setup used for experiments of copper leaching from chalcopyrite.

Figure 3.
The phase composition analysis of the chalcopyrite sample before the leaching experiments: (a) XRD spectrum; (b) 57Fe Mössbauer spectra characteristic of Fe3O4, Fe2O3, and FeS2 (obtained at 300 K).
Figure 3.
The phase composition analysis of the chalcopyrite sample before the leaching experiments: (a) XRD spectrum; (b) 57Fe Mössbauer spectra characteristic of Fe3O4, Fe2O3, and FeS2 (obtained at 300 K).

Figure 4.
The influence of isopropanol (IPA) concentration on the kinetics of copper leaching from chalcopyrite: (a) the conversion (X) over time; (b) XCu + (1 − XCu)ln (1 − XCu) over time. Conditions: T = 40 °C, CH2SO4 = 0.5 M, CH2O2 = 1 M, vRPM = 400 RPM.
Figure 4.
The influence of isopropanol (IPA) concentration on the kinetics of copper leaching from chalcopyrite: (a) the conversion (X) over time; (b) XCu + (1 − XCu)ln (1 − XCu) over time. Conditions: T = 40 °C, CH2SO4 = 0.5 M, CH2O2 = 1 M, vRPM = 400 RPM.

Figure 5.
Morphology of the chalcopyrite samples under various leaching conditions: (a) before leaching; (b) after leaching, without IPA addition (0 M IPA); (c) after leaching, in presence of 1.0 M IPA; (d) after leaching, in presence of 2.0 M IPA. Magnification: 500–fold.
Figure 5.
Morphology of the chalcopyrite samples under various leaching conditions: (a) before leaching; (b) after leaching, without IPA addition (0 M IPA); (c) after leaching, in presence of 1.0 M IPA; (d) after leaching, in presence of 2.0 M IPA. Magnification: 500–fold.

Figure 6.
57Fe Mössbauer spectra of the chalcopyrite samples after the leaching in H2SO4 + H2O2 aqueous solution containing (a) 0 M IPA; (b) 1.0 M IPA; and (c) 2.0 M IPA.
Figure 6.
57Fe Mössbauer spectra of the chalcopyrite samples after the leaching in H2SO4 + H2O2 aqueous solution containing (a) 0 M IPA; (b) 1.0 M IPA; and (c) 2.0 M IPA.

Figure 7.
Results of the BET analysis—isotherms of adsorption and desorption, as well as resulting BET surface area values: (a) sample before leaching; (b) solid residue after leaching without IPA in the system; (c) solid residue after leaching with 1 M IPA concentration; (d) solid residue after leaching with 2 M IPA.

Figure 8.
The influence of stirring rate (vRPM) on the rate of chalcopyrite leaching: (a) the conversion (X) over time; (b) XCu + (1 − XCu)ln (1 − XCu) over time. Conditions: mChal. = 2.0 g, T = 40 °C, V = 200 mL, CH2O2 = 1.0 M, CH2SO4 = 0.5 M, CIPA = 2.0 M.
Figure 8.
The influence of stirring rate (vRPM) on the rate of chalcopyrite leaching: (a) the conversion (X) over time; (b) XCu + (1 − XCu)ln (1 − XCu) over time. Conditions: mChal. = 2.0 g, T = 40 °C, V = 200 mL, CH2O2 = 1.0 M, CH2SO4 = 0.5 M, CIPA = 2.0 M.

Figure 9.
The influence of H2O2 concentration (CH2O2) on the rate of chalcopyrite leaching: (a) the conversion (X) over time; (b) XCu + (1 − XCu)ln (1 − XCu) over time. Conditions: mChal. = 2.0 g, T = 40 °C, V = 200 mL, CH2SO4 = 0.5 M, CIPA = 2.0 M, vSR = 400 RPM.
Figure 9.
The influence of H2O2 concentration (CH2O2) on the rate of chalcopyrite leaching: (a) the conversion (X) over time; (b) XCu + (1 − XCu)ln (1 − XCu) over time. Conditions: mChal. = 2.0 g, T = 40 °C, V = 200 mL, CH2SO4 = 0.5 M, CIPA = 2.0 M, vSR = 400 RPM.

Figure 10.
Effect of temperature on the copper leaching kinetics from chalcopyrite: (a) conversion (X) over time; (b) kinetic curves interpreted in accordance to Shrinking Core Model—Equation (2). Conditions: mChal. = 2.0 g, V = 200 mL, CH2SO4 = 0.5 M, CIPA = 2.0 M, CH2O2 = 1.0 M, vSR = 400 RPM.
Figure 10.
Effect of temperature on the copper leaching kinetics from chalcopyrite: (a) conversion (X) over time; (b) kinetic curves interpreted in accordance to Shrinking Core Model—Equation (2). Conditions: mChal. = 2.0 g, V = 200 mL, CH2SO4 = 0.5 M, CIPA = 2.0 M, CH2O2 = 1.0 M, vSR = 400 RPM.

Figure 11.
The Eyring (a) and Arrhenius (b) plots for the reaction of copper leaching from chalcopyrite in the H2SO4–H2O2 aqueous medium. Conditions: CH2SO4 = 0.5 M, CIPA = 2.0 M, CH2O2 = 1.0 M, vSR = 400 RPM.
Figure 11.
The Eyring (a) and Arrhenius (b) plots for the reaction of copper leaching from chalcopyrite in the H2SO4–H2O2 aqueous medium. Conditions: CH2SO4 = 0.5 M, CIPA = 2.0 M, CH2O2 = 1.0 M, vSR = 400 RPM.


Table 1.
The chemical composition of the chalcopyrite (starting material) used in the kinetic experiments—XRF analysis supplemented by IR results.
Table 1.
The chemical composition of the chalcopyrite (starting material) used in the kinetic experiments—XRF analysis supplemented by IR results.
| Element | Cu | Fe | S | Ag | Pb | Zn | Ni | Mn | C |
|---|---|---|---|---|---|---|---|---|---|
| mass. % | 31.67 | 34.55 | 28.40 | 2.39 | 1.50 | 0.64 | 0.62 | 0.22 | 0.01 |
Table 2.
Phase identification and corresponding 57Fe Mössbauer parameters for sample before leaching (obtained at 300 K).
Table 2.
Phase identification and corresponding 57Fe Mössbauer parameters for sample before leaching (obtained at 300 K).
| Phase | Relative Intensity [%] | IS [mm/s] | H [kGs] | [mm/s] | Γ/2 [mm/s] | Reference |
|---|---|---|---|---|---|---|
| Pyrite | 12.4 | 0.318 (5) | 0.0 | 0.314 (4) | 0.191 (9) | [20] |
| Magnetite A-site | 14.7 | 0.297 (5) | 483.6 (4) | −0.010 (4) | 0.168 (8) | [21] |
| Magnetite B-site | 8.3 | 0.60 (2) | 453.0 (8) | −0.05 (2) | 0.189 (9) | [22] |
| Magnetite B-site | 10.5 | 0.69 (2) | 448.5 (7) | 0.05 (2) | 0.189 (9) | [21] |
| Chalcopyrite | 54.1 | 0.241 (7) | 347.4 (1) | −0.002 (1) | 0.129 (2) | [23] |
IS—isomeric shift; H—magnetic hyperfine field; QS—quadrupole shift; Γ/2—half of the experimental line width. The numbers in parentheses are the errors on the last digit.
Table 3.
The effect of isopropanol (IPA)—experimental conditions.
| Parameter | Value |
|---|---|
| Chalcopyrite mass (mChal.) | 2.0 g |
| Volume of a leaching medium (V) | 200 mL |
| Temperature (T) | 40 °C |
| H2SO4 concentration (CH2SO4) | 0.5 M |
| H2O2 concentration (CH2O2) | 1.0 M |
| Stirring rate (vSR) | 400 RPM |
| IPA concentration (CIPA) | 0, 1.0 and 2.0 M |
Table 4.
Phase identification and corresponding 57Fe Mössbauer parameters for samples after leaching (obtained at 300 K).
Table 4.
Phase identification and corresponding 57Fe Mössbauer parameters for samples after leaching (obtained at 300 K).
| Phase | Relative Intensity [%] | IS [mm/s] | H [kGs] | [mm/s] | Γ/2 [mm/s] | Reference |
|---|---|---|---|---|---|---|
| 0 M IPA | ||||||
| Pyrite | 13.3 | 0.305 (4) | 0.0 | 0.281 (3) | 0.164 (8) | [24] |
| Hematite | 5.6 | 0.35 (3) | 500 (2) | −0.08 (3) | 0.27 (5) | [25] |
| Chalcopyrite | 81.1 | 0.242 (1) | 347.0 (1) | −0.001 (1) | 0.126 (1) | [23] |
| 1 M IPA | ||||||
| Pyrite | 6.8 | 0.356 (3) | 0.0 | 0.291 (3) | 0.185 (7) | [20] |
| Hematite | 2.1 | 0.36 (1) | 507.6 (9) | −0.10 (1) | 0.135 (6) | [25] |
| Magnetite A-site | 16.2 | 0.272 (2) | 483.3 (2) | −0.001 (2) | 0.135 (6) | [21] |
| Magnetite B-site | 3.2 | 0.45 (1) | 467.1 (9) | −0.06 (1) | 0.20 (2) | [26] |
| Magnetite B-site | 28.3 | 0.668 (4) | 450.6 (4) | 0.006 (3) | 0.255 (9) | [21] |
| Chalcopyrite | 43.4 | 0.241 (1) | 347.6 (1) | −0.002 (1) | 0.120 (1) | [23] |
| 2 M IPA | ||||||
| Pyrite | 6.6 | 0.347 (4) | 0.0 | 0.294 (4) | 0.167 (6) | [20] |
| Hematite | 2.3 | 0.35 (2) | 506 (1) | −0.10 (2) | 0.167 (6) | [25] |
| Magnetite A-site | 18.7 | 0.270 (2) | 481.7 (2) | −0.003 (2) | 0.119 (6) | [21] |
| Magnetite B-site | 3.9 | 0.47 (2) | 466 (1) | −0.07 (1) | 0.14 (2) | [26] |
| Magnetite B-site | 32.3 | 0.668 (4) | 449.4 (4) | 0.010 (3) | 0.247 (9) | [21] |
| Chalcopyrite | 36.2 | 0.241 (1) | 346.9 (5) | −0.001 (1) | 0.110 (1) | [23] |
IS—isomeric shift; H—magnetic hyperfine field; QS—quadrupole shift; Γ/2—half of the experimental line width. The numbers in parentheses are the errors on the last digit.
Table 5.
The effect of stirring rate—experimental conditions.
| Parameter | Value |
|---|---|
| Chalcopyrite mass (mChal.) | 2.0 g |
| Volume of a leaching medium (V) | 200 mL |
| Temperature (T) | 40 °C |
| H2SO4 concentration (CH2SO4) | 0.5 M |
| H2O2 concentration (CH2O2) | 1.0 M |
| IPA concentration (CIPA) | 2.0 M |
| Stirring rate (vSR) | 400, 700 and 1000 RPM |
Table 6.
The effect of H2O2 concentration—experimental conditions.
| Parameter | Value |
|---|---|
| Chalcopyrite mass (mChal.) | 2.0 g |
| Volume of a leaching medium (V) | 200 mL |
| Temperature (T) | 40 °C |
| H2SO4 concentration (CH2SO4) | 0.5 M |
| IPA concentration (CIPA) | 2.0 M |
| Stirring rate (vSR) | 400 RPM |
| H2O2 concentration (CH2O2) | 0, 0.5, 1.0 and 2.0 M |
Table 7.
The effect of temperature—experimental conditions.
| Parameter | Value |
|---|---|
| Chalcopyrite mass (mChal.) | 2.0 g |
| Volume of a leaching medium (V) | 200 mL |
| H2SO4 concentration (CH2SO4) | 0.5 M |
| H2O2 concentration (CH2O2) | 1.0 M |
| IPA concentration (CIPA) | 2.0 M |
| Stirring rate (vSR) | 400 RPM |
| Temperature (T) | 20, 30 and 40 °C |
Table 8.
Enthalpy and entropy of activation for the reaction of copper leaching from chalcopyrite.
| Eyring Model | |||
| Slope | Intercept | Enthalpy of activation ∆H# [kJ/mol] | Entropy of activation ∆S# [J/mol∙K] |
| −7191 | 10.1 | 59.79 | −113.57 |
| Arrhenius Model | |||
| Slope | Intercept | Energy of activation EA [kJ/mol] | Pre-exponential factor A [min−1] |
| −7498 | 16.8 | 62.34 | 1.98∙109 |
Table 9.
Data comparison taken from different authors of the activation energy (EA), the leaching medium composition, and SCM model applied for the reaction of copper leaching from chalcopyrite.
Table 9.
Data comparison taken from different authors of the activation energy (EA), the leaching medium composition, and SCM model applied for the reaction of copper leaching from chalcopyrite.
| Author | Leaching Solution Composition | EA [kJ/mol] | The Type of SCM |
|---|---|---|---|
| This study | 0.5 M H2SO4 1 M H2O2 2 M IPA | 60.68 | Cylinder shape, Ash diffusion control |
| Sokić et al. [12] | 1.5 M H2SO4 1 M H2O2 | 80.00 | Flat plate shape, Ash diffusion control |
| Antonijević et al. [11] | 2 M H2SO4 2 M H2O2 | 60.00 | Sphere shape, Reaction control |
| Solís Marcíal et al. [15] | 0.6 M H2SO4 3 M H2O2 5.7 M CH3OH | 24.27 | Cylinder shape, Reaction control |
| Adebayo et al. [10] | 0.1 M H2SO4 5.9 M H2O2 | 39.00 | Sphere shape, Reaction control |
Table 10.
The optimal conditions for efficient copper leaching from the chalcopyrite.
| Parameter | Value |
|---|---|
| Volume of a leaching medium (V) | 200 mL |
| Temperature (T) | 50 °C |
| H2SO4 concentration (CH2SO4) | 0.5 M |
| H2O2 concentration (CH2O2) | 1.0 M |
| IPA concentration (CIPA) | 2.0 M |
| Stirring rate (vSR) | 400 RPM |
Disclaimer/Publisher’s Note: The statements, opinions and data contained in all publications are solely those of the individual author(s) and contributor(s) and not of MDPI and/or the editor(s). MDPI and/or the editor(s) disclaim responsibility for any injury to people or property resulting from any ideas, methods, instructions or products referred to in the content. |
© 2024 by the authors. Licensee MDPI, Basel, Switzerland. This article is an open access article distributed under the terms and conditions of the Creative Commons Attribution (CC BY) license (https://creativecommons.org/licenses/by/4.0/).
Share and Cite
MDPI and ACS Style
Michałek, T.; Pacławski, K.; Fitzner, K. Chalcopyrite Leaching in the Presence of Isopropanol—The Kinetic and Mechanistic Studies. Materials 2024, 17, 824. https://doi.org/10.3390/ma17040824
AMA Style
Michałek T, Pacławski K, Fitzner K. Chalcopyrite Leaching in the Presence of Isopropanol—The Kinetic and Mechanistic Studies. Materials. 2024; 17(4):824. https://doi.org/10.3390/ma17040824
Chicago/Turabian StyleMichałek, Tomasz, Krzysztof Pacławski, and Krzysztof Fitzner. 2024. "Chalcopyrite Leaching in the Presence of Isopropanol—The Kinetic and Mechanistic Studies" Materials 17, no. 4: 824. https://doi.org/10.3390/ma17040824
Note that from the first issue of 2016, this journal uses article numbers instead of page numbers. See further details here.