


Assessment of pH Value and Release of Calcium Ions in Calcium Silicate Cements: An In Vitro Comparative Study
 , ,
, ,
Abstract
:1. Introduction
2. Materials and Methods
2.1. Study Design
2.2. Study Setup and Specimen Fabrication
2.3. Statistical Analysis
3. Results
4. Discussion
5. Conclusions
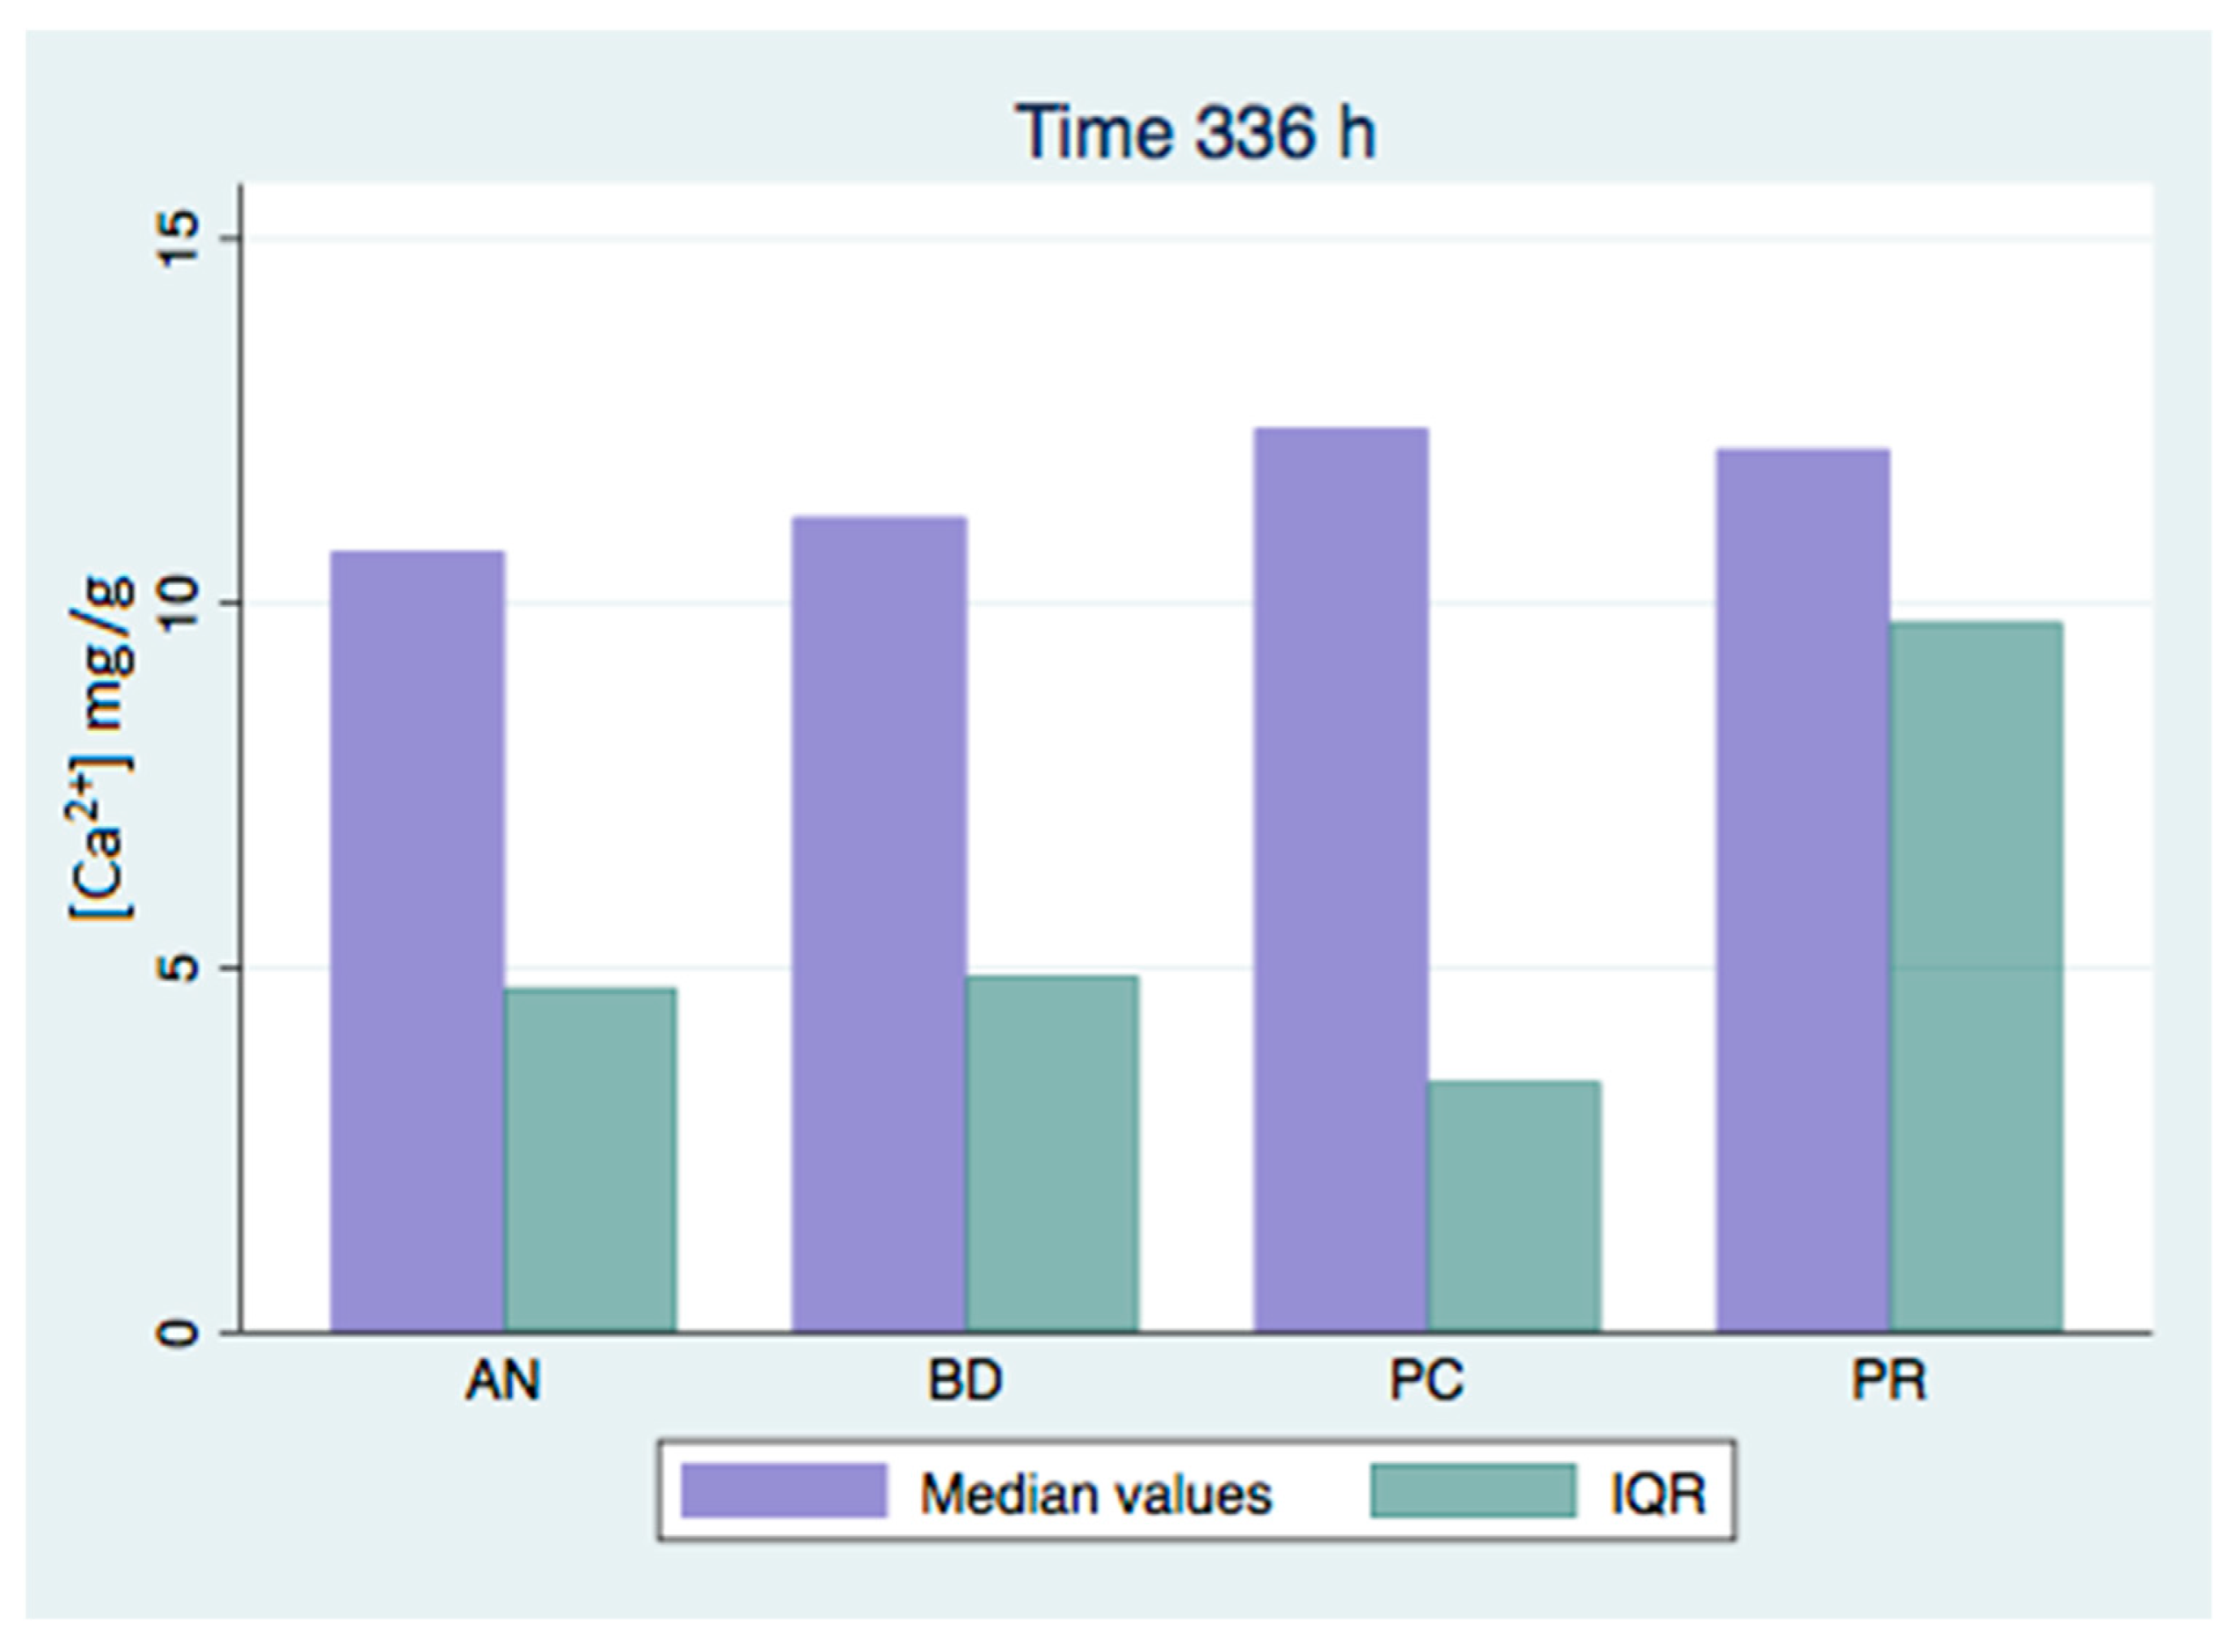
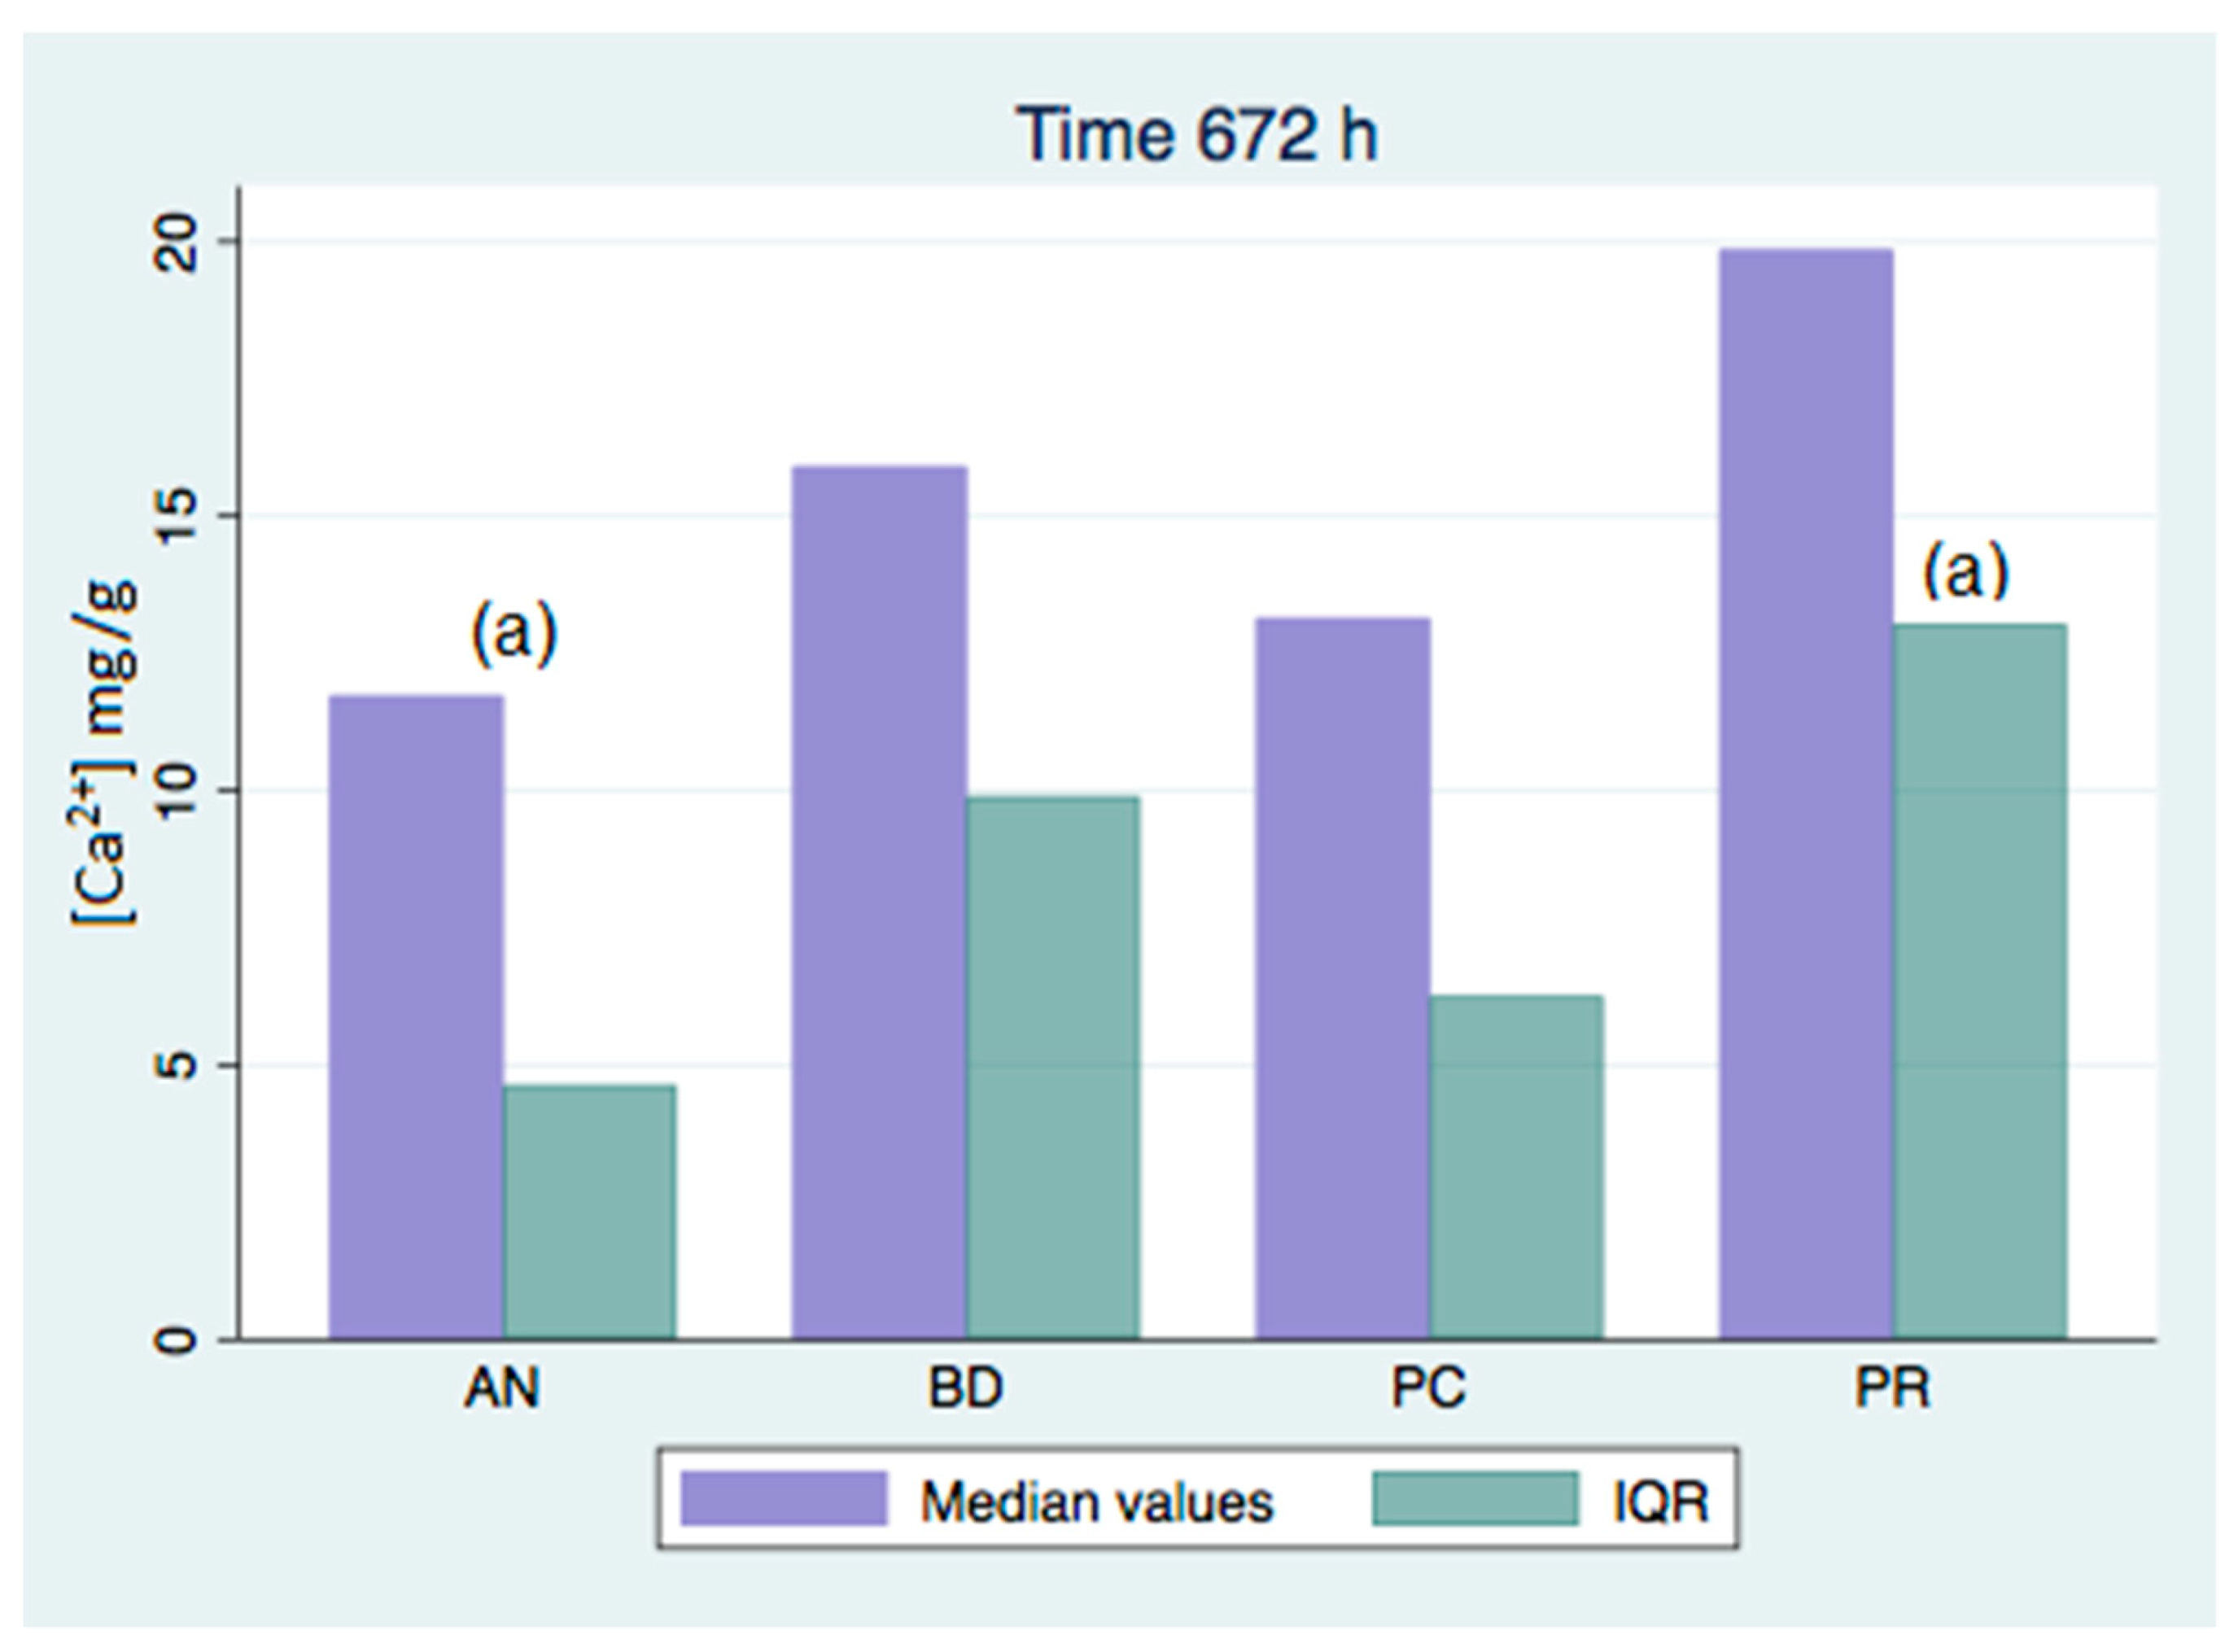
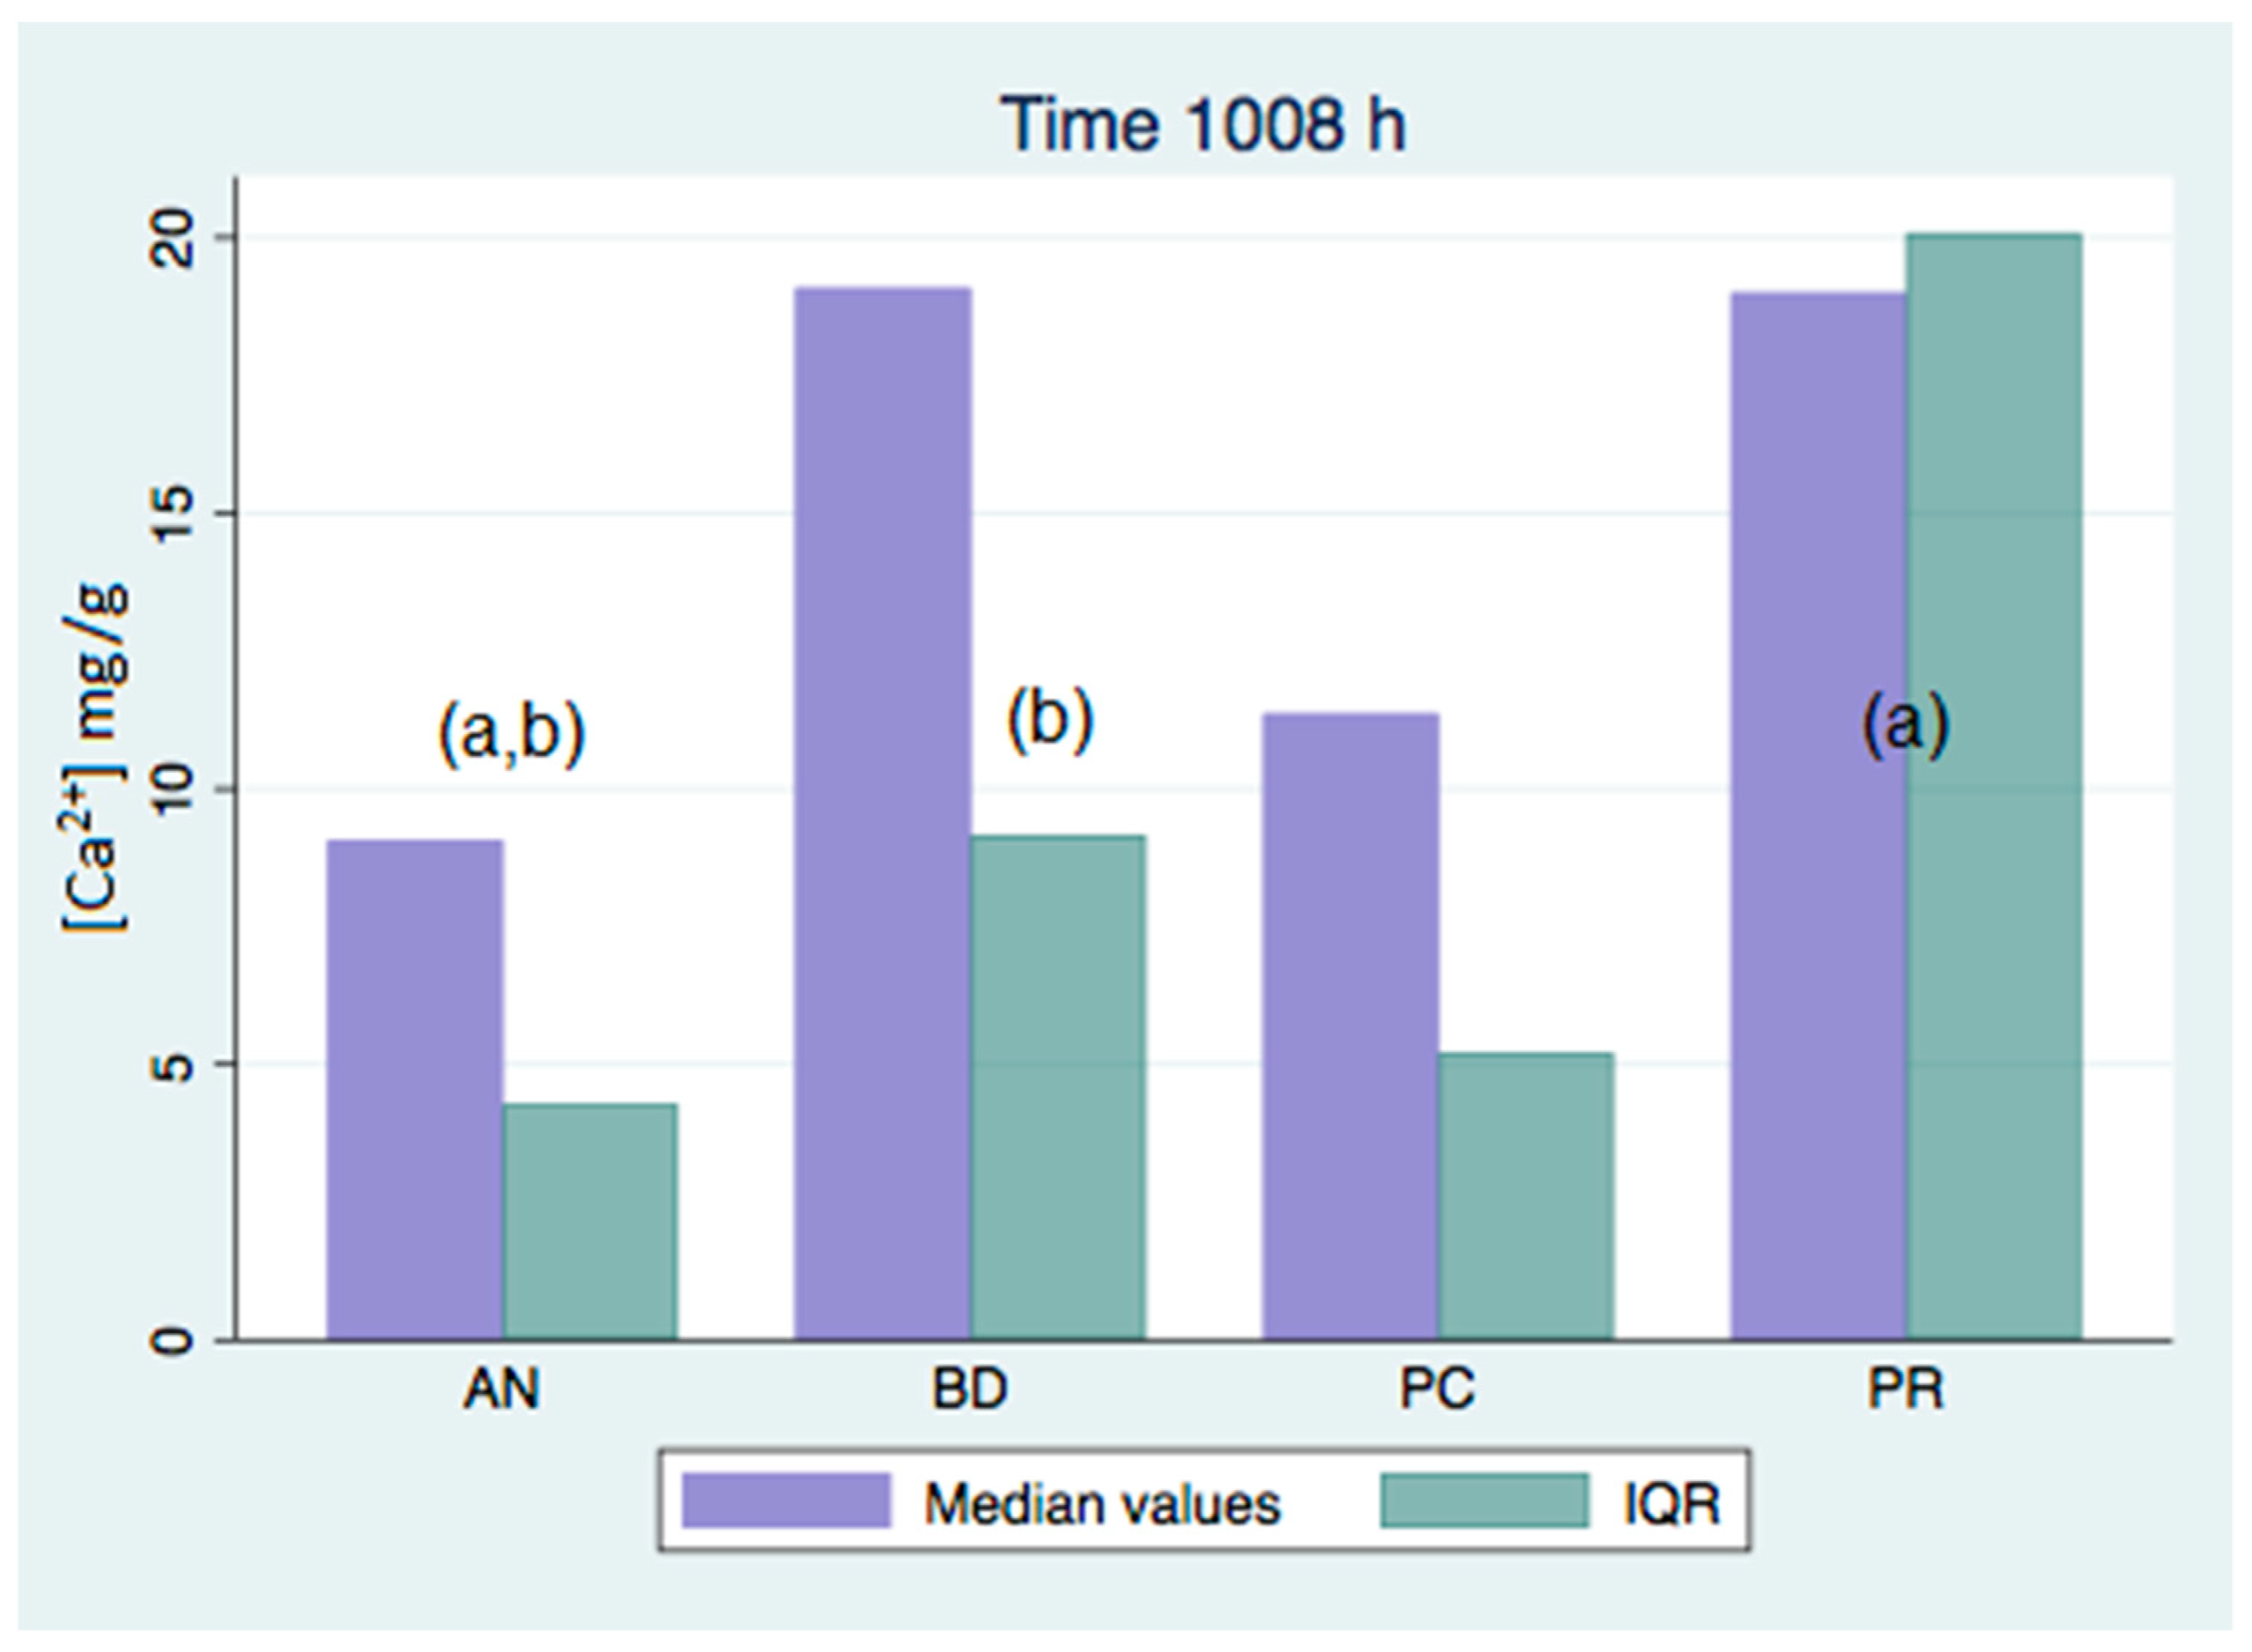
- There were significant differences in the concentration of calcium release between the different groups studied, with no group being predominant.
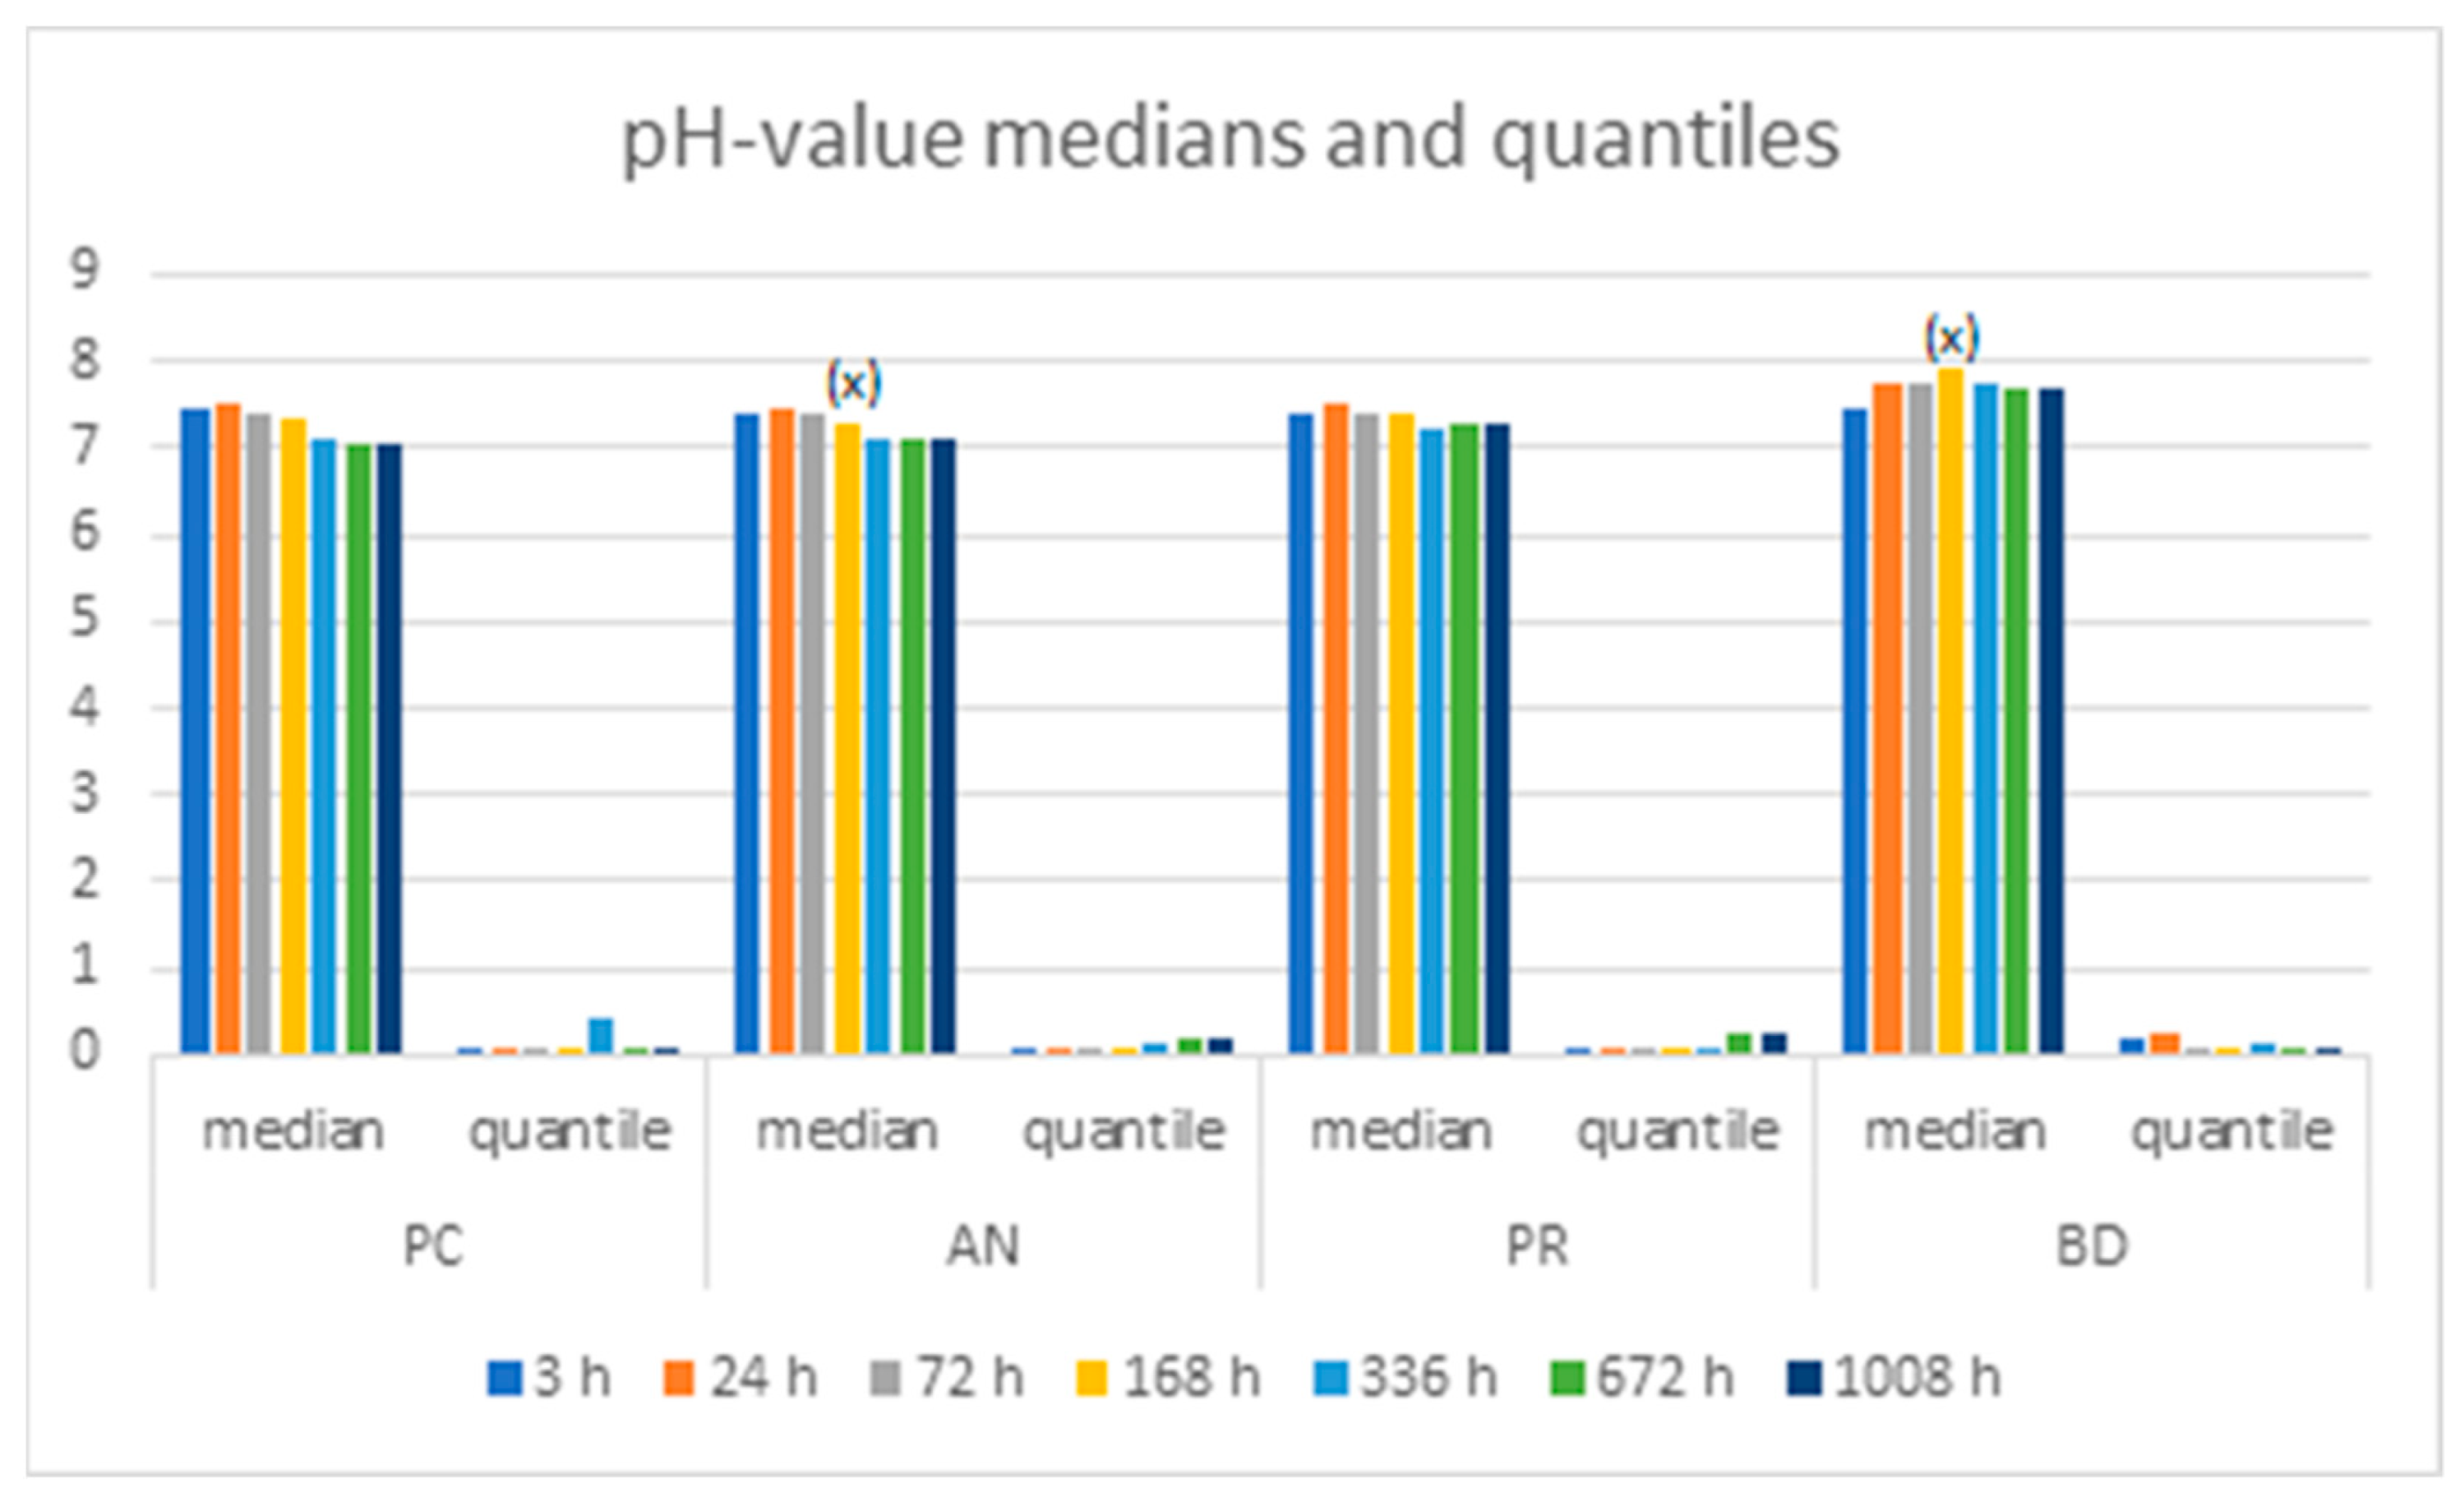
- There were no significant differences in the pH values at the timepoints studied, except for the values at 168 h. The pH values showed small variations throughout the evaluated period due to the buffered medium in which the samples were found.
Author Contributions
Funding
Institutional Review Board Statement
Informed Consent Statement
Data Availability Statement
Conflicts of Interest
References
- Camilleri, J. Investigation of Biodentine as dentine replacement material. J. Dent. 2013, 41, 600–610. [Google Scholar] [CrossRef] [PubMed]
- Witte, D.R. The filling of a root canal with Portland cement. J. Cent. Assoc. Ger. Dent. 1878, 18, 153–154. [Google Scholar]
- Torabinejad, M.; Watson, T.; Ford, T.P. Sealing ability of a mineral trioxide aggregate when used as a root end filling material. J. Endod. 1993, 19, 591–595. [Google Scholar] [CrossRef]
- Torabinejad, M.; White, D.J. Tooth Filling Material and Method. U.S. Patent 5769638, 16 May 1995. [Google Scholar]
- Schwartz, R.S.; Mauger, M.; Clement, D.J.; Walker, W.A., 3rd. Mineral trioxide aggregate: A new material for endodontics. J. Am. Dent. Assoc. 1999, 130, 967–975. [Google Scholar] [CrossRef]
- Torabinejad, M.; Chivian, N. Clinical applications of mineral trioxide aggregate. J. Endod. 1999, 25, 197–205. [Google Scholar] [CrossRef]
- Parirokh, M.; Torabinejad, M. Mineral trioxide aggregate: A comprehensive literature review—Part III: Clinical applications, drawbacks, and mechanism of action. J. Endod. 2010, 36, 400–413. [Google Scholar] [CrossRef] [PubMed]
- Margunato, S.; Taşlı, P.N.; Aydın, S.; Kazandağ, M.K.; Şahin, F. In Vitro Evaluation of ProRoot MTA, Biodentine, and MM-MTA on Human Alveolar Bone Marrow Stem Cells in Terms of Biocompatibility and Mineralization. J. Endod. 2015, 41, 1646–1652. [Google Scholar] [CrossRef]
- Antonijevic, D.; Jeschke, A.; Colovic, B.; Milovanovic, P.; Jevremovic, D.; Kisic, D.; Scheidt, A.V.; Hahn, M.; Amling, M.; Jokanovic, V.; et al. Addition of a Fluoride-containing Radiopacifier Improves Micromechanical and Biological Characteristics of Modified Calcium Silicate Cements. J. Endod. 2015, 41, 2050–2057. [Google Scholar] [CrossRef]
- Parirokh, M.; Torabinejad, M. Mineral trioxide aggregate: A comprehensive literature review—Part I: Chemical, physical, and antibacterial properties. J. Endod. 2010, 36, 16–27. [Google Scholar] [CrossRef]
- Gandolfi, M.G.; Siboni, F.; Primus, C.M.; Prati, C. Ion release, porosity, solubility, and bioactivity of mta plus tricalcium silicate. J. Endod. 2014, 40, 1632–1637. [Google Scholar] [CrossRef]
- Giraud, T.; Jeanneau, C.; Bergmann, M.; Laurent, P.; About, I. Tricalcium Silicate Capping Materials Modulate Pulp Healing and Inflammatory Activity In Vitro. J. Endod. 2018, 44, 1686–1691. [Google Scholar] [CrossRef] [PubMed]
- Hakki, S.S.; Bozkurt, B.S.; Ozcopur, B.; Gandolfi, M.G.; Prati, C.; Belli, S. The response of cementoblasts to calcium phosphate resin-based and calcium silicate-based commercial sealers. Int. Endod. J. 2013, 46, 242–252. [Google Scholar] [CrossRef] [PubMed]
- Mehrvarzfar, P.; Abbott, P.V.; Mashhadiabbas, F.; Vatanpour, M.; Savadkouhi, S.T. Clinical and histological responses of human dental pulp to MTA and combined MTA/treated dentin matrix in partial pulpotomy. Aust. Endod. J. 2018, 44, 46–53. [Google Scholar] [CrossRef]
- Wattanapakkavong, K.; Srisuwan, T.; Dent, G.D.C. Release of Transforming Growth Factor Beta 1 from Human Tooth Dentin after Application of Either ProRoot MTA or Biodentine as a Coronal Barrier. J. Endod. 2019, 45, 701–705. [Google Scholar] [CrossRef] [PubMed]
- Costa, F.; Gomes, P.S.; Fernandes, M.H. Osteogenic and Angiogenic Response to Calcium Silicate–based Endodontic Sealers. J. Endod. 2016, 42, 113–119. [Google Scholar] [CrossRef] [PubMed]
- Gandolfi, M.G.; Taddei, P.; Tinti, A.; Prati, C. Apatite-forming ability (bioactivity) of ProRoot MTA. Int. Endod. J. 2010, 43, 917–929. [Google Scholar] [CrossRef]
- Irawan, R.M.; Margono, A.; Djauhari, N. The comparison of calcium ion release and pH changes from modified MTA and bioceramics in regeneration. J. Phys. Conf. Ser. 2017, 884, 012110. [Google Scholar] [CrossRef]
- Natale, L.C.; Rodrigues, M.C.; Xavier, T.A.; Simões, A.; de Souza, D.N.; Braga, R.R. Ion release and mechanical properties of calcium silicate and calcium hydroxide materials used for pulp capping. Int. Endod. J. 2015, 48, 89–94. [Google Scholar] [CrossRef]
- Cavenago, B.C.; Pereira, T.C.; Duarte, M.A.H.; Ordinola-Zapata, R.; Marciano, M.A.; Bramante, C.M.; Bernardineli, N. Influence of powder-to-water ratio on radiopacity, setting time, pH, calcium ion release and a micro-CT volumetric solubility of white mineral trioxide aggregate. Int. Endod. J. 2014, 47, 120–126. [Google Scholar] [CrossRef]
- Kim, M.; Yang, W.; Kim, H.; Ko, H. Comparison of the biological properties of ProRoot MTA, OrthoMTA, and Endocem MTA cements. J. Endod. 2014, 40, 1649–1653. [Google Scholar] [CrossRef]
- Bernardi, A.; Bortoluzzi, E.A.; Felippe, W.T.; Felippe, M.C.S.; Wan, W.S.; Teixeira, C.S. Effects of the addition of nanoparticulate calcium carbonate on setting time, dimensional change, compressive strength, solubility and pH of MTA. Int. Endod. J. 2016, 50, 97–105. [Google Scholar] [CrossRef] [PubMed]
- Urbansky, E.T.; Schock, M.R. Understanding, Deriving, and Computing Buffer Capacity. J. Chem. Educ. 2000, 77, 1640. [Google Scholar] [CrossRef]
- Zakaria, M.N.; Cahyanto, A.; El-Ghannam, A. Calcium release and physical properties of modified carbonate apatite cement as pulp capping agent in dental application. Biomater. Res. 2018, 22, 35. [Google Scholar] [CrossRef] [PubMed]
- Matczuk, J.; Żendzian-Piotrowska, M.; Maciejczyk, M.; Kurek, K. Salivary lipids: A review. Adv. Clin. Exp. Med. 2017, 26, 1023–1031. [Google Scholar] [CrossRef] [PubMed]
- Palczewska-Komsa, M.; Kaczor-Wiankowska, K.; Nowicka, A. New Bioactive Calcium Silicate Cement Mineral Trioxide Aggregate Repair High Plasticity (MTA HP)—A Systematic Review. Materials 2021, 14, 4573. [Google Scholar] [CrossRef] [PubMed]
- Jiménez-Sánchez, M.C.; Segura-Egea, J.J.; Díaz-Cuenca, A. A Microstructure Insight of MTA Repair HP of Rapid Setting Capacity and Bioactive Response. Materials 2020, 13, 1641. [Google Scholar] [CrossRef]
- Rocha, A.C.R.; Padrón, G.H.; Garduño, M.V.G.; Aranda, R.L.G. Physicochemical analysis of MTA Angelus® and Biodentine® conducted with X ray difraction, dispersive energy spectrometry, X ray fluorescence, scanning electron microscope and infra red spectroscopy. Rev. Odontológica Mex. 2015, 19, e170–e176. [Google Scholar] [CrossRef]
- Ertas, H.; Kucukyilmaz, E.; Ok, E.; Uysal, B. Push-out bond strength of different mineral trioxide aggregates. Eur. J. Dent. 2014, 8, 348–352. [Google Scholar] [CrossRef]
- Poggio, C.; Ceci, M.; Beltrami, R.; Chiesa, M.; Colombo, M. Biological and chemical-physical properties of root-end filling materials: A comparative study. J. Conserv. Dent. 2015, 18, 94–99. [Google Scholar] [CrossRef]
- Herrera Trinidad, R.; García Barbero, E. Liberación de iones calcio y ph de los cementos de silicato de calcio. 2019. Available online: https://eprints.ucm.es/57362/ (accessed on 3 July 2023).
- De Deus, G.; Ximenes, R.; Gurgel-Filho, E.D.; Plotkowski, M.C.; Coutinho-Filho, T. Cytotoxicity of MTA and Portland cement on human ECV 304 endothelial cells. Int. Endod. J. 2005, 38, 604–609. [Google Scholar] [CrossRef]
- Min, K.-S.; Park, H.-J.; Lee, S.-K.; Park, S.-H.; Hong, C.-U.; Kim, H.-W.; Lee, H.-H.; Kim, E.-C. Effect of Mineral Trioxide Aggregate on Dentin Bridge Formation and Expression of Dentin Sialoprotein and Heme Oxygenase-1 in Human Dental Pulp. J. Endod. 2008, 34, 666–670. [Google Scholar] [PubMed]
- Giraud, T.; Jeanneau, C.; Rombouts, C.; Bakhtiar, H.; Laurent, P.; About, I. Pulp capping materials modulate the balance between inflammation and regeneration. Dent. Mater. 2019, 35, 24–35. [Google Scholar] [CrossRef] [PubMed]
- Laurent, P.; Camps, J.; About, I. BiodentineTM induces TGF-β1 release from human pulp cells and early dental pulp mineralization. Int. Endod. J. 2012, 45, 439–448. [Google Scholar] [PubMed]
- Chen, I.; Salhab, I.; Setzer, F.C.; Kim, S.; Nah, H.-D. A New Calcium Silicate–based Bioceramic Material Promotes Human Osteo- and Odontogenic Stem Cell Proliferation and Survival via the Extracellular Signal-regulated Kinase Signaling Pathway. J. Endod. 2016, 42, 480–486. [Google Scholar] [CrossRef]
- Jung, J.-Y.; Woo, S.-M.; Lee, B.-N.; Koh, J.-T.; Nör, J.E.; Hwang, Y.-C. Effect of Biodentine and Bioaggregate on odontoblastic differentiation via mitogen-activated protein kinase pathway in human dental pulp cells. Int. Endod. J. 2015, 48, 177–184. [Google Scholar] [CrossRef] [PubMed]
- Chang, S.W.; Bae, W.J.; Yi, J.K.; Lee, S.; Lee, D.W.; Kum, K.Y.; Kim, E.C. Odontoblastic Differentiation, Inflammatory Response, and Angiogenic Potential of 4 Calcium Silicate–Based Cements: Micromega MTA, ProRoot MTA, RetroMTA, and Experimental calcium Silicate Cement. J. Endod. 2015, 41, 1524–1529. [Google Scholar] [CrossRef]
- Chang, S.-W.; Lee, S.-Y.; Kum, K.-Y.; Kim, E.-C. Effects of ProRoot MTA, Bioaggregate, and Micromega MTA on Odontoblastic Differentiation in Human Dental Pulp Cells. J. Endod. 2014, 40, 113–118. [Google Scholar] [CrossRef]
- Machado, J.; Johnson, J.D.; Paranjpe, A. The Effects of Endosequence Root Repair Material on Differentiation of Dental Pulp Cells. J. Endod. 2016, 42, 101–105. [Google Scholar] [CrossRef]
- Benetti, F.; Gomes-Filho, J.E.; de Araújo Lopes, J.M.; Barbosa, J.G.; Jacinto, R.C.; Cintra, L.T. In vivo biocompatibility and biomineralization of calcium silicate cements. Eur. J. Oral Sci. 2018, 126, 326–333. [Google Scholar]
- Rajasekharan, S.; Vercruysse, C.; Martens, L.; Verbeeck, R. Effect of Exposed Surface Area, Volume and Environmental pH on the Calcium Ion Release of Three Commercially Available Tricalcium Silicate Based Dental Cements. Materials 2018, 11, 123, Correction Materials 2021, 14, 340. [Google Scholar] [CrossRef]
- Braga, R.R.; About, I. How far do calcium release measurements properly reflect its multiple roles in dental tissue mineralization? Clin. Oral Investig. 2019, 23, 501. [Google Scholar] [CrossRef] [PubMed]
- Sarkar, N.; Caicedo, R.; Ritwik, P.; Moiseyeva, R.; Kawashima, I. Physicochemical Basis of the Biologic Properties of Mineral Trioxide Aggregate. J. Endod. 2005, 31, 97–100. [Google Scholar] [CrossRef] [PubMed]
- AlShwaimi, E.; Majeed, A.; Ali, A.A. Pulpal Responses to Direct Capping with Betamethasone/Gentamicin Cream and Mineral Trioxide Aggregate: Histologic and Micro–Computed Tomography Assessments. J. Endod. 2016, 42, 30–35. [Google Scholar] [CrossRef] [PubMed]
- Kim, B.; Lee, Y.-H.; Kim, I.-H.; Lee, K.E.; Kang, C.-M.; Lee, H.-S.; Choi, H.-J.; Cheon, K.; Song, J.S.; Shin, Y. Biocompatibility and mineralization potential of new calcium silicate cements. J. Dent. Sci. 2023, 18, 1189–1198. [Google Scholar] [CrossRef] [PubMed]


| ProClinic Group (PC) n = 10 | Angelus Group (AN) n = 10 | ProRoot Group (PR) n = 10 | Biodentine Group (BD) n = 10 | |||||
|---|---|---|---|---|---|---|---|---|
| [Ca2+] mg/g | pH | [Ca2+] mg/g | pH | [Ca2+] mg/g | pH | [Ca2+] mg/g | pH | |
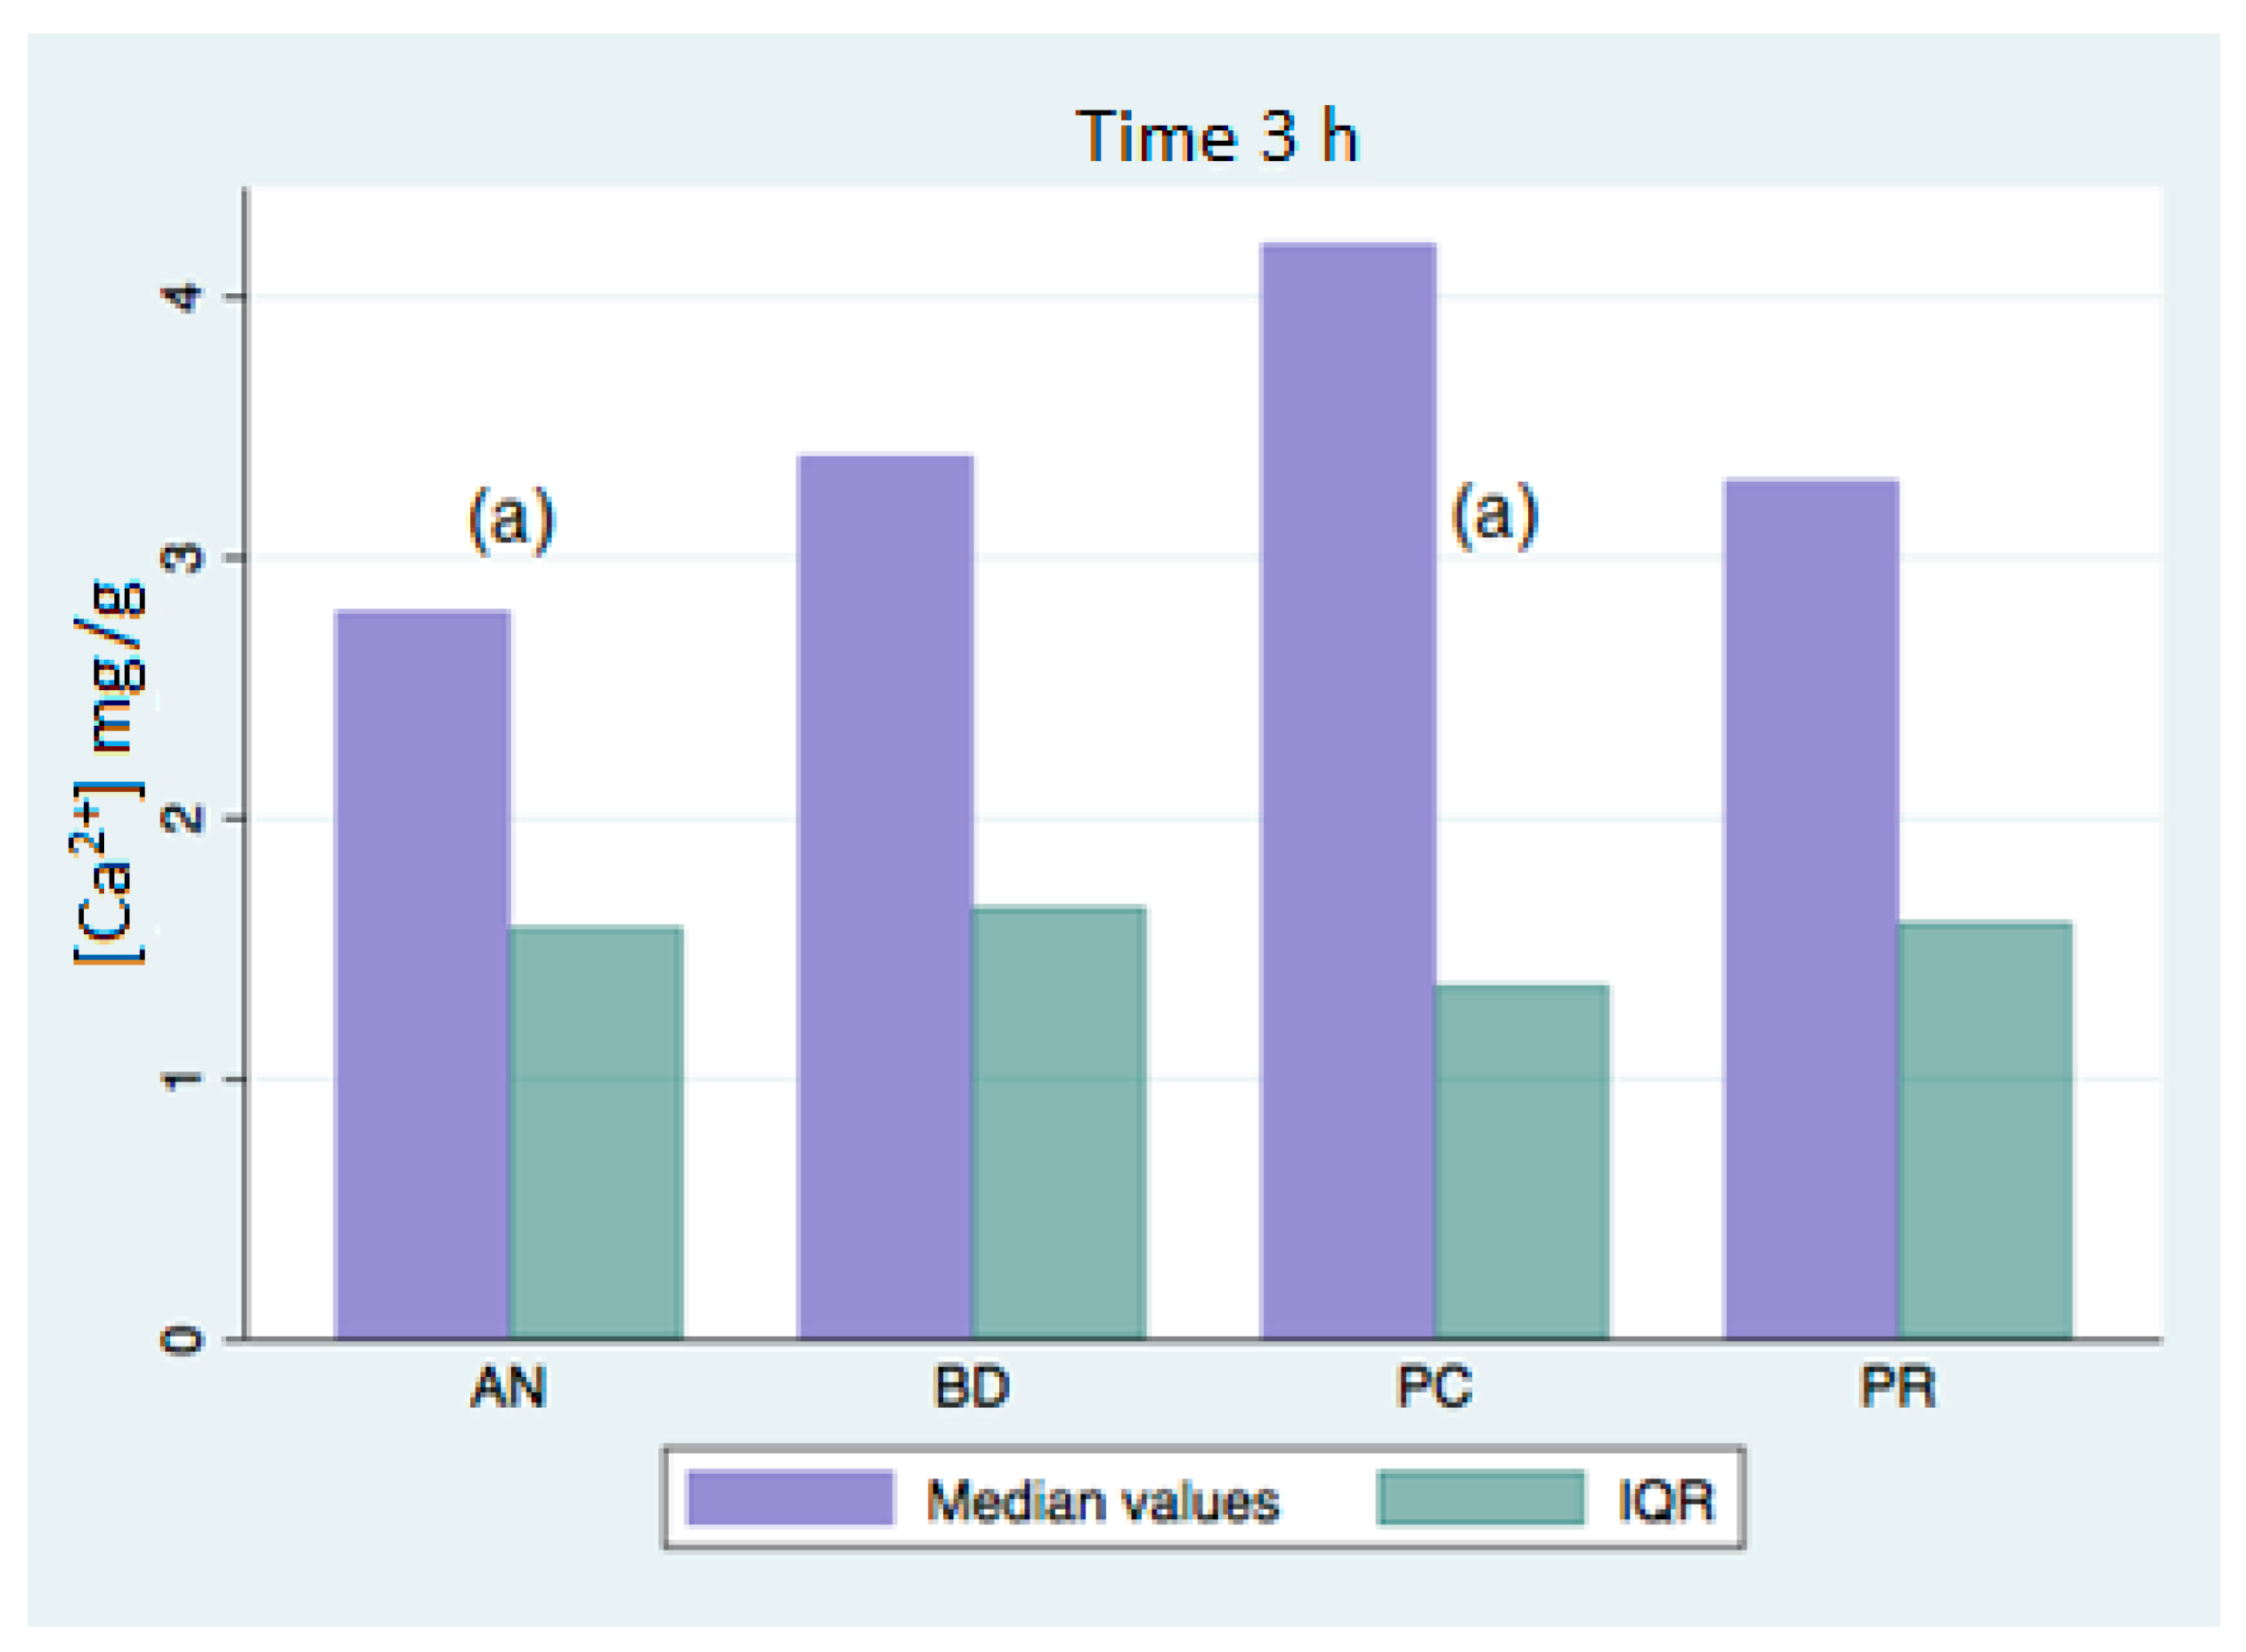
| 3 h | 4.44 ± 1.08 (a) | 7.43 ± 0.01 | 2.95 ± 0.82 (a) | 7.41 ± 0.01 | 3.36 ± 1.19 | 7.41 ± 0.02 | 3.36 ± 1.22 | 7.48 ± 0.12 |
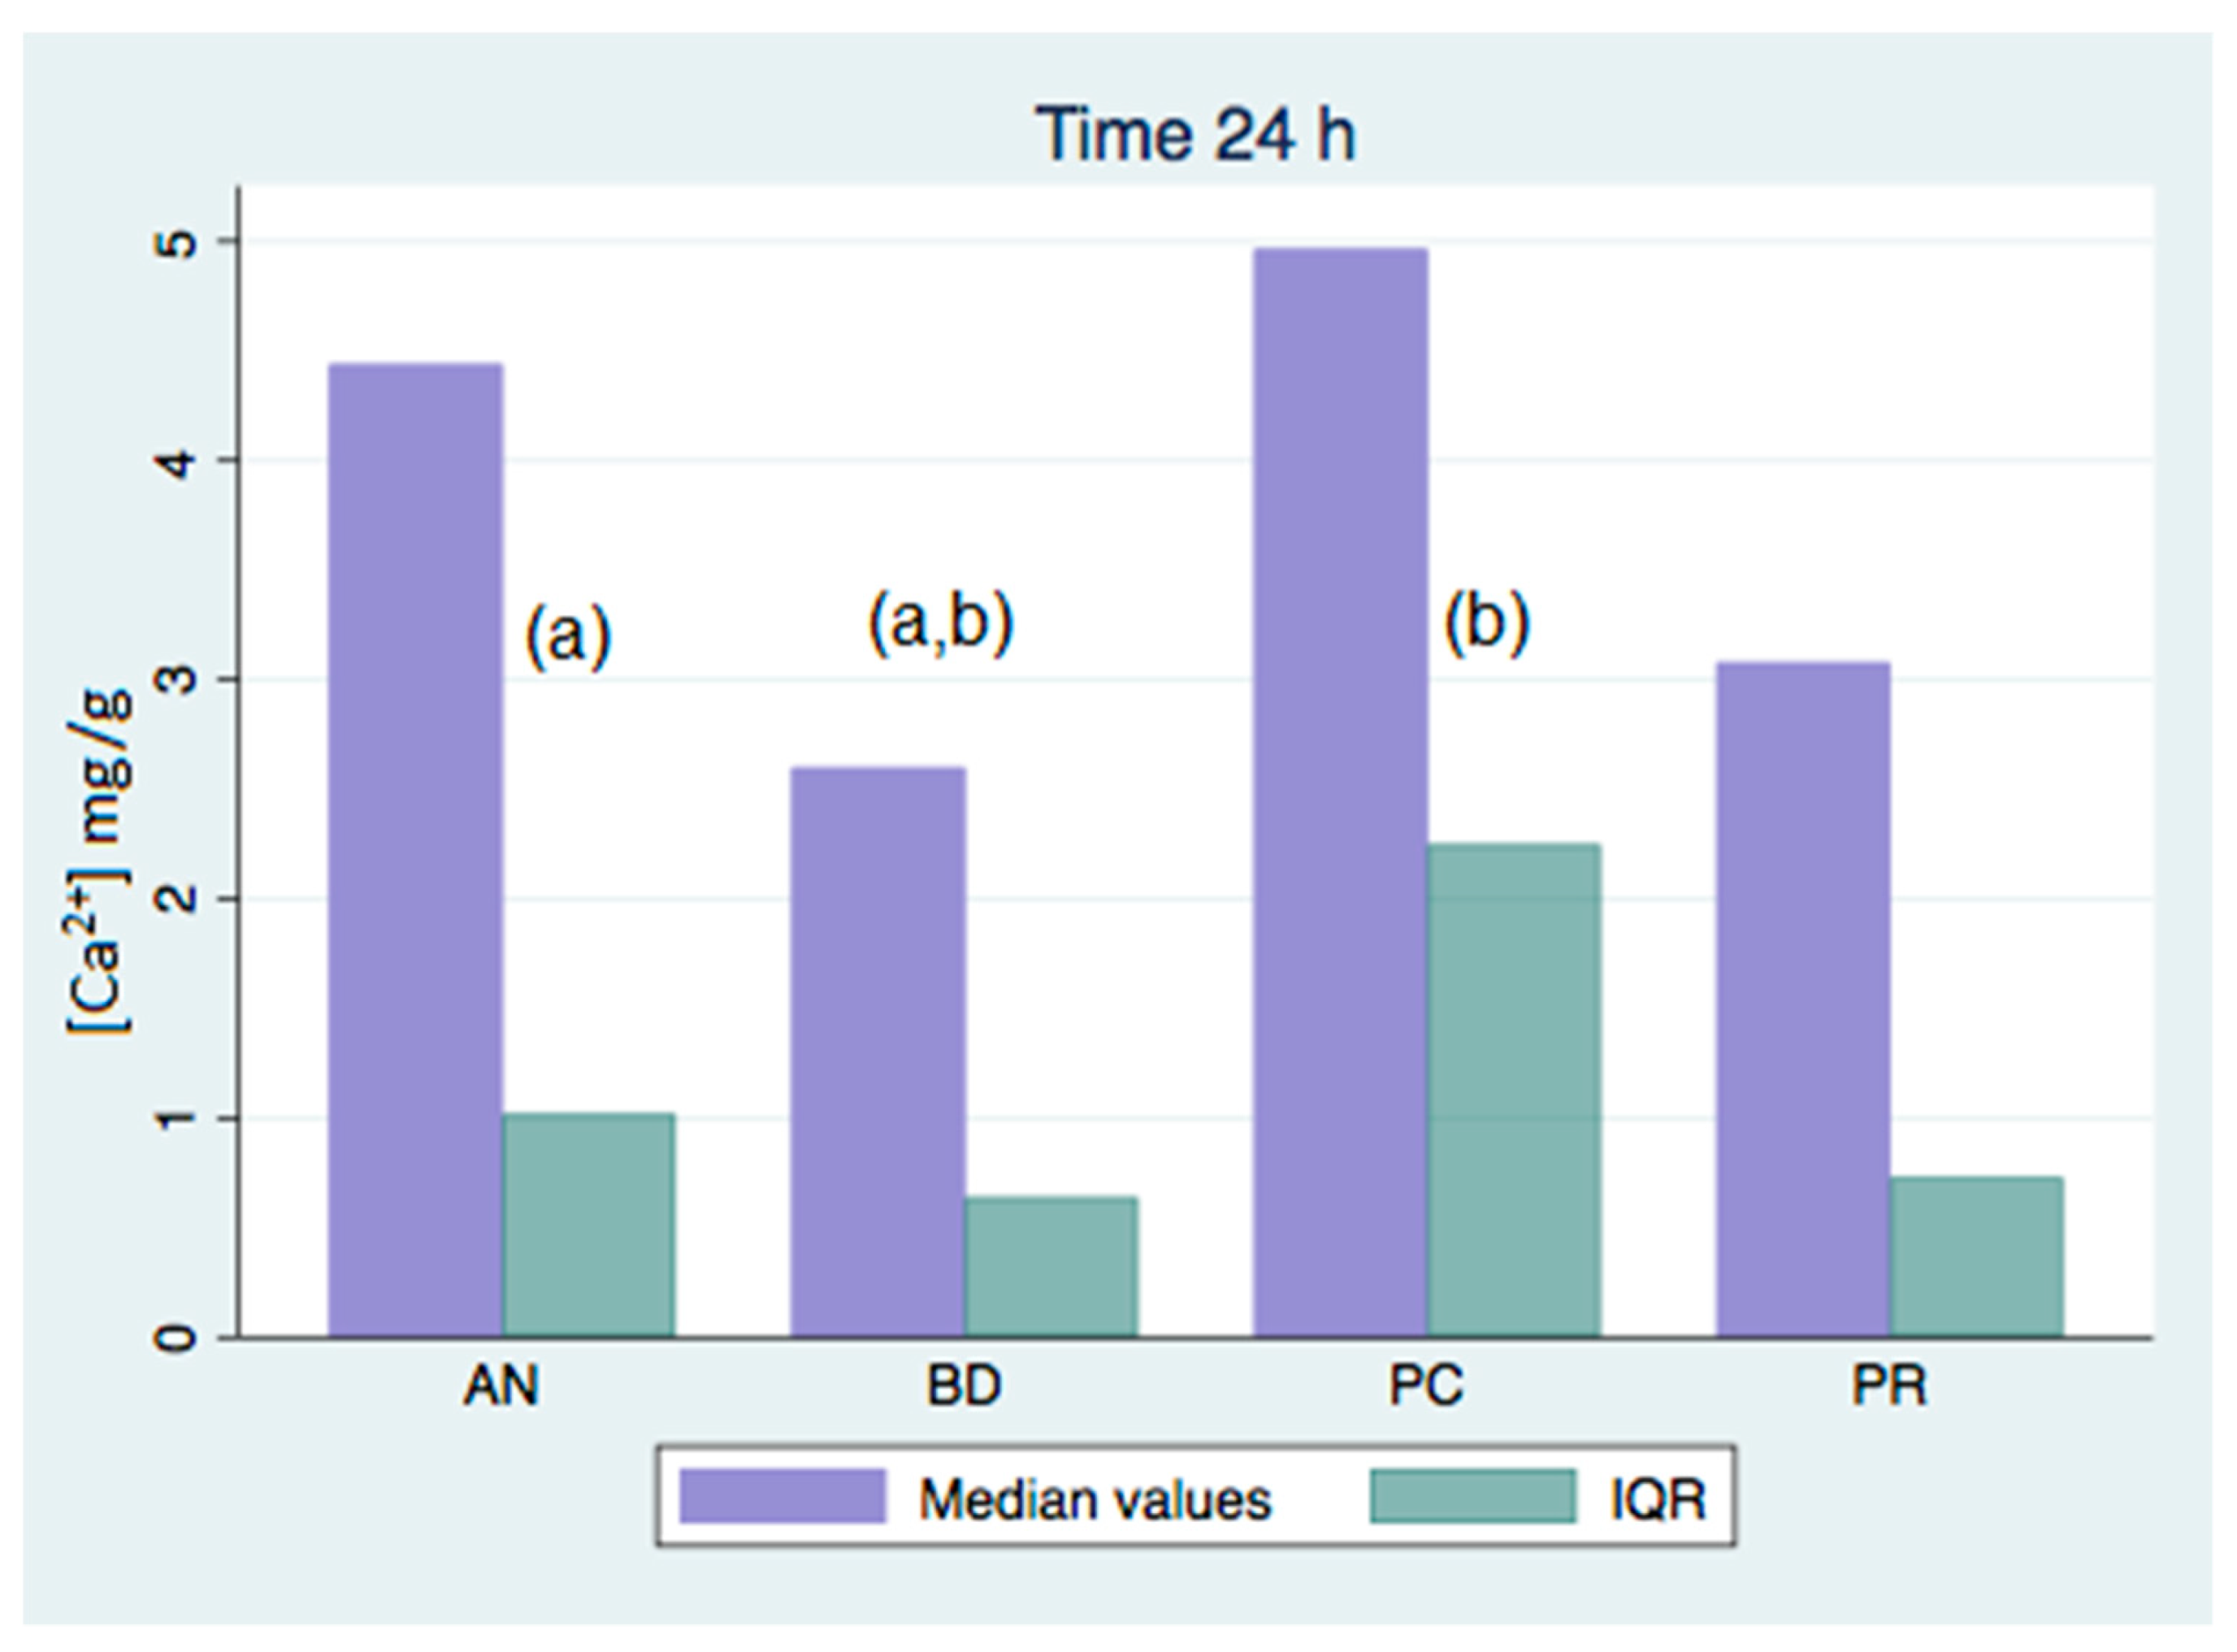
| 24 h | 5.37 ± 1.35 (b) | 7.51 ± 0.01 | 4.36 ± 0.81 (a) | 7.48 ± 0.01 | 3.66 ± 1.64 | 7.50 ± 0.03 | 2.61 ± 0.37 (a,b) | 7.75 ± 0.19 |
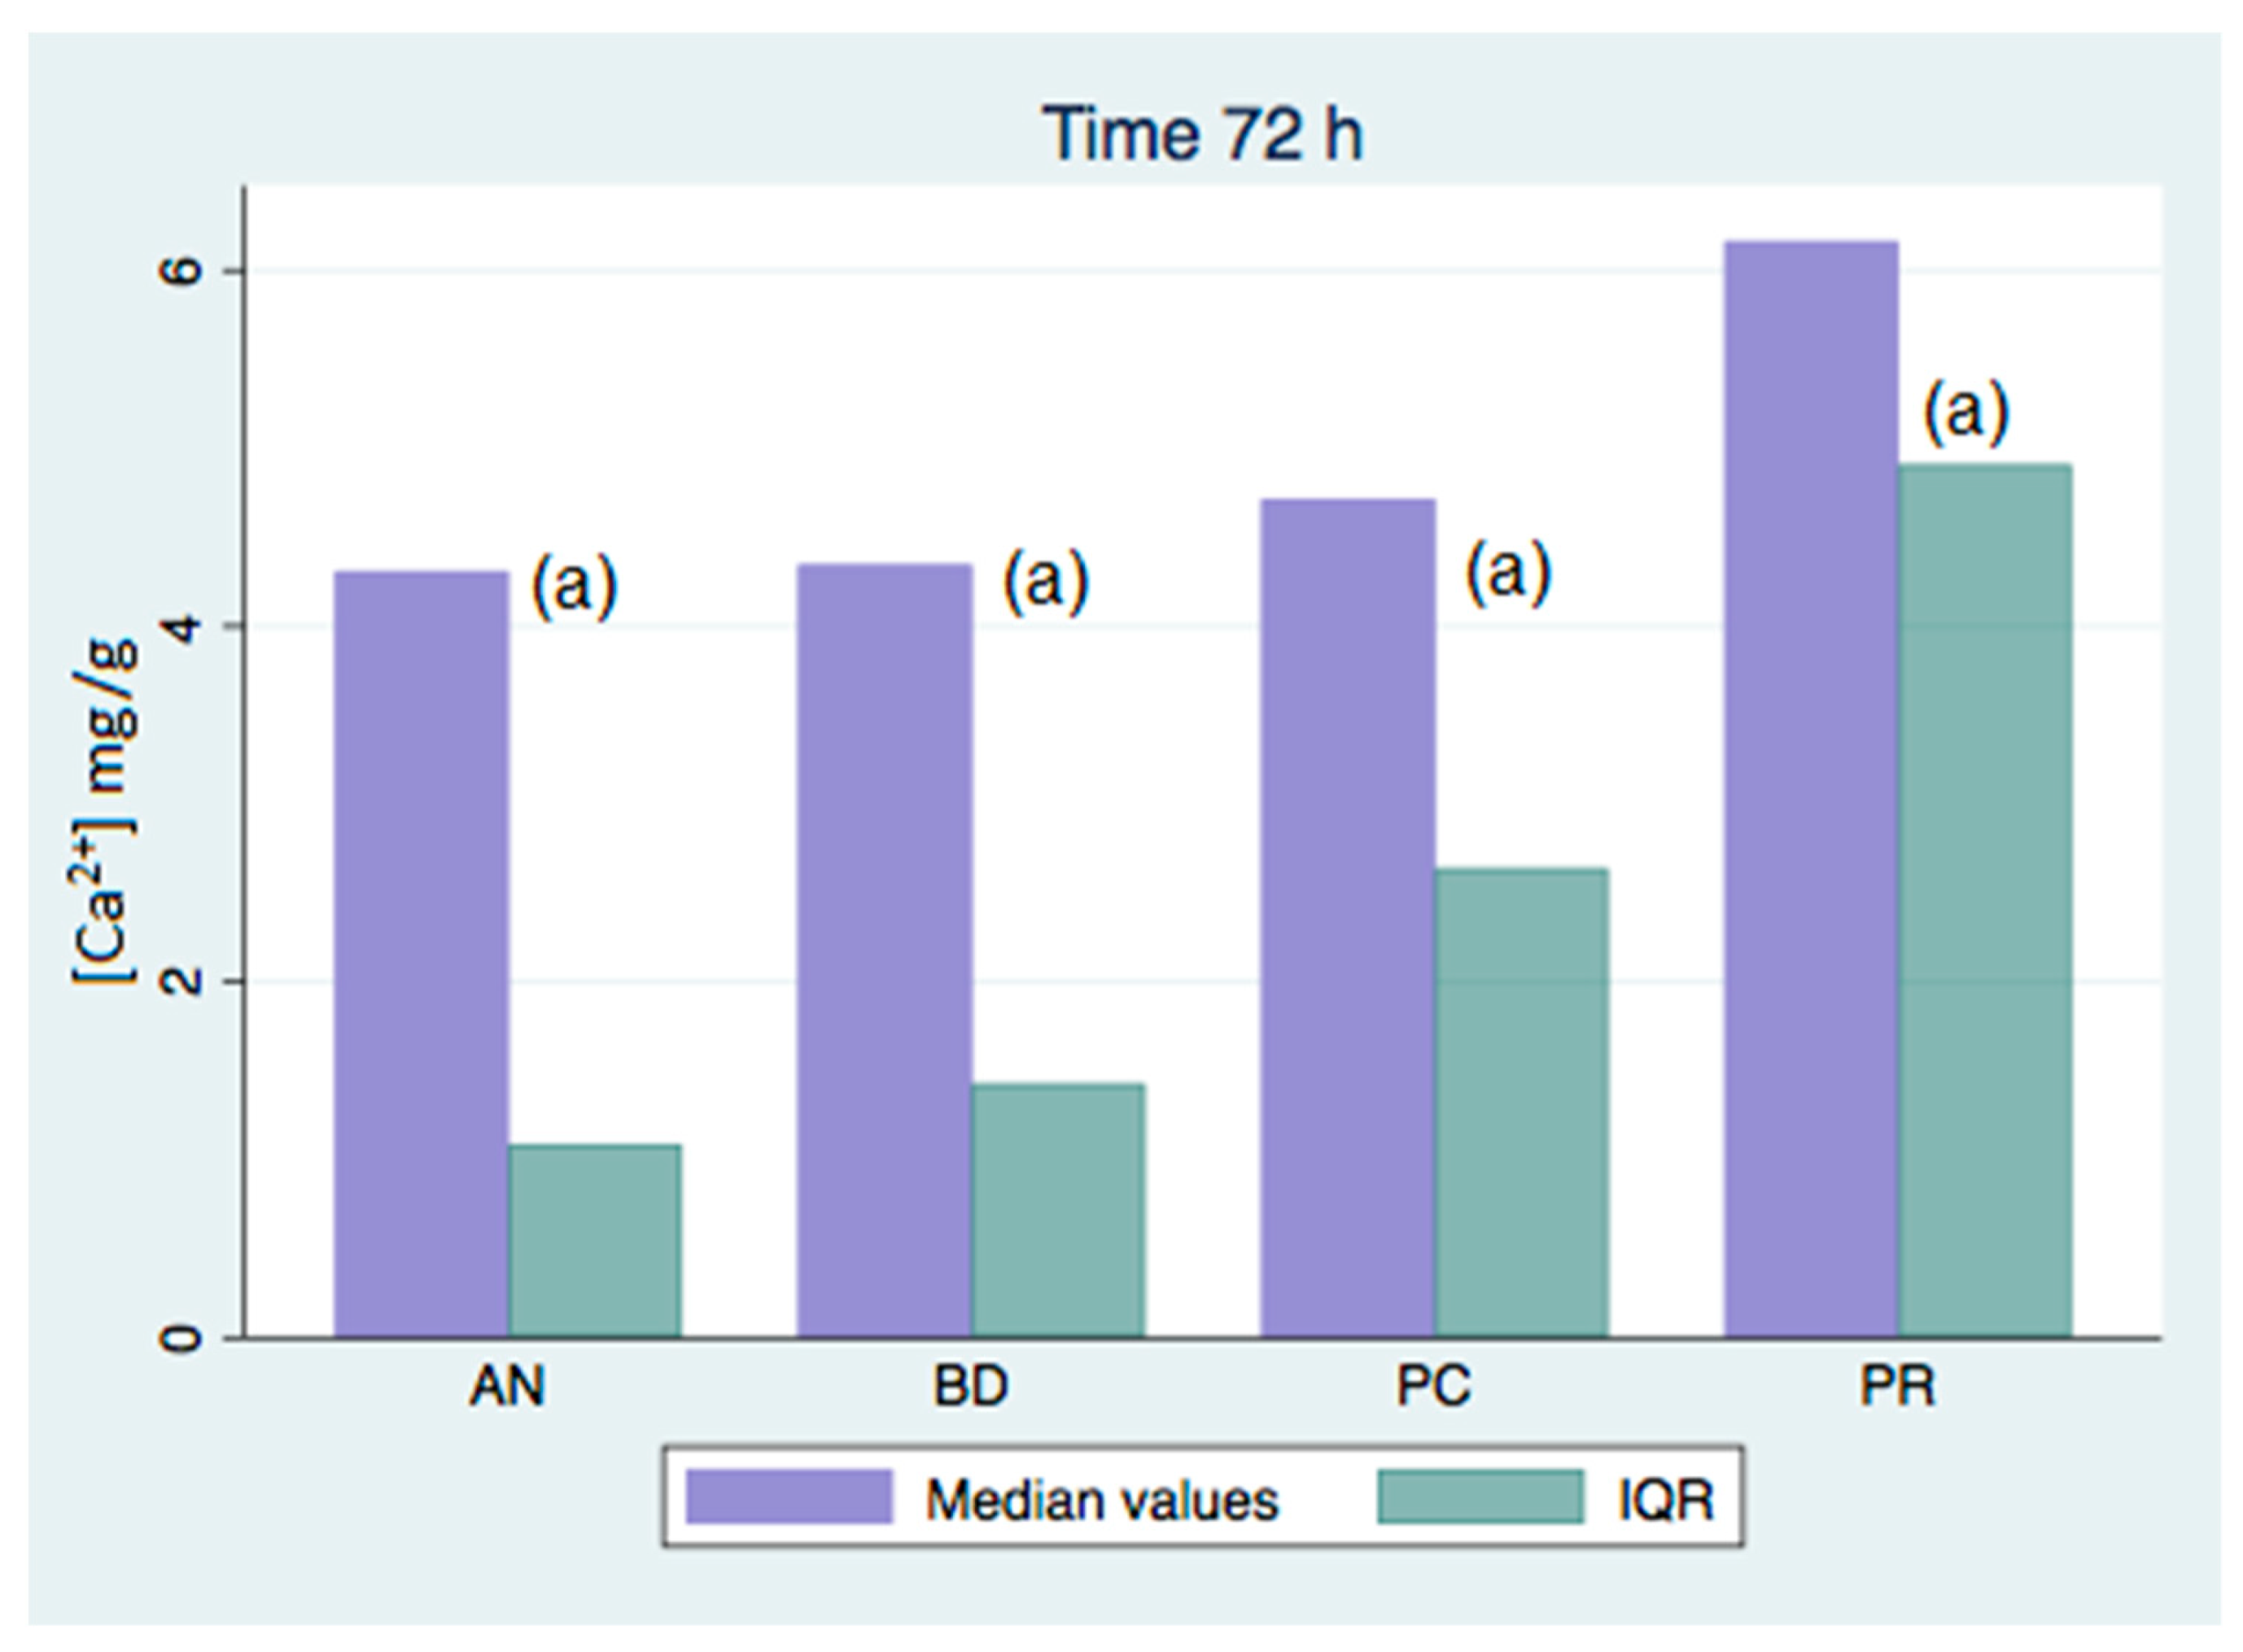
| 72 h | 4.71 ± 1.22 (a) | 7.39 ± 0.04 | 4.57 ± 1.91 (a) | 7.38 ± 0.02 | 6.64 ± 2.89 (a) | 7.40 ± 0.04 | 4.28 ± 0.99 (a) | 7.73 ± 0.04 |
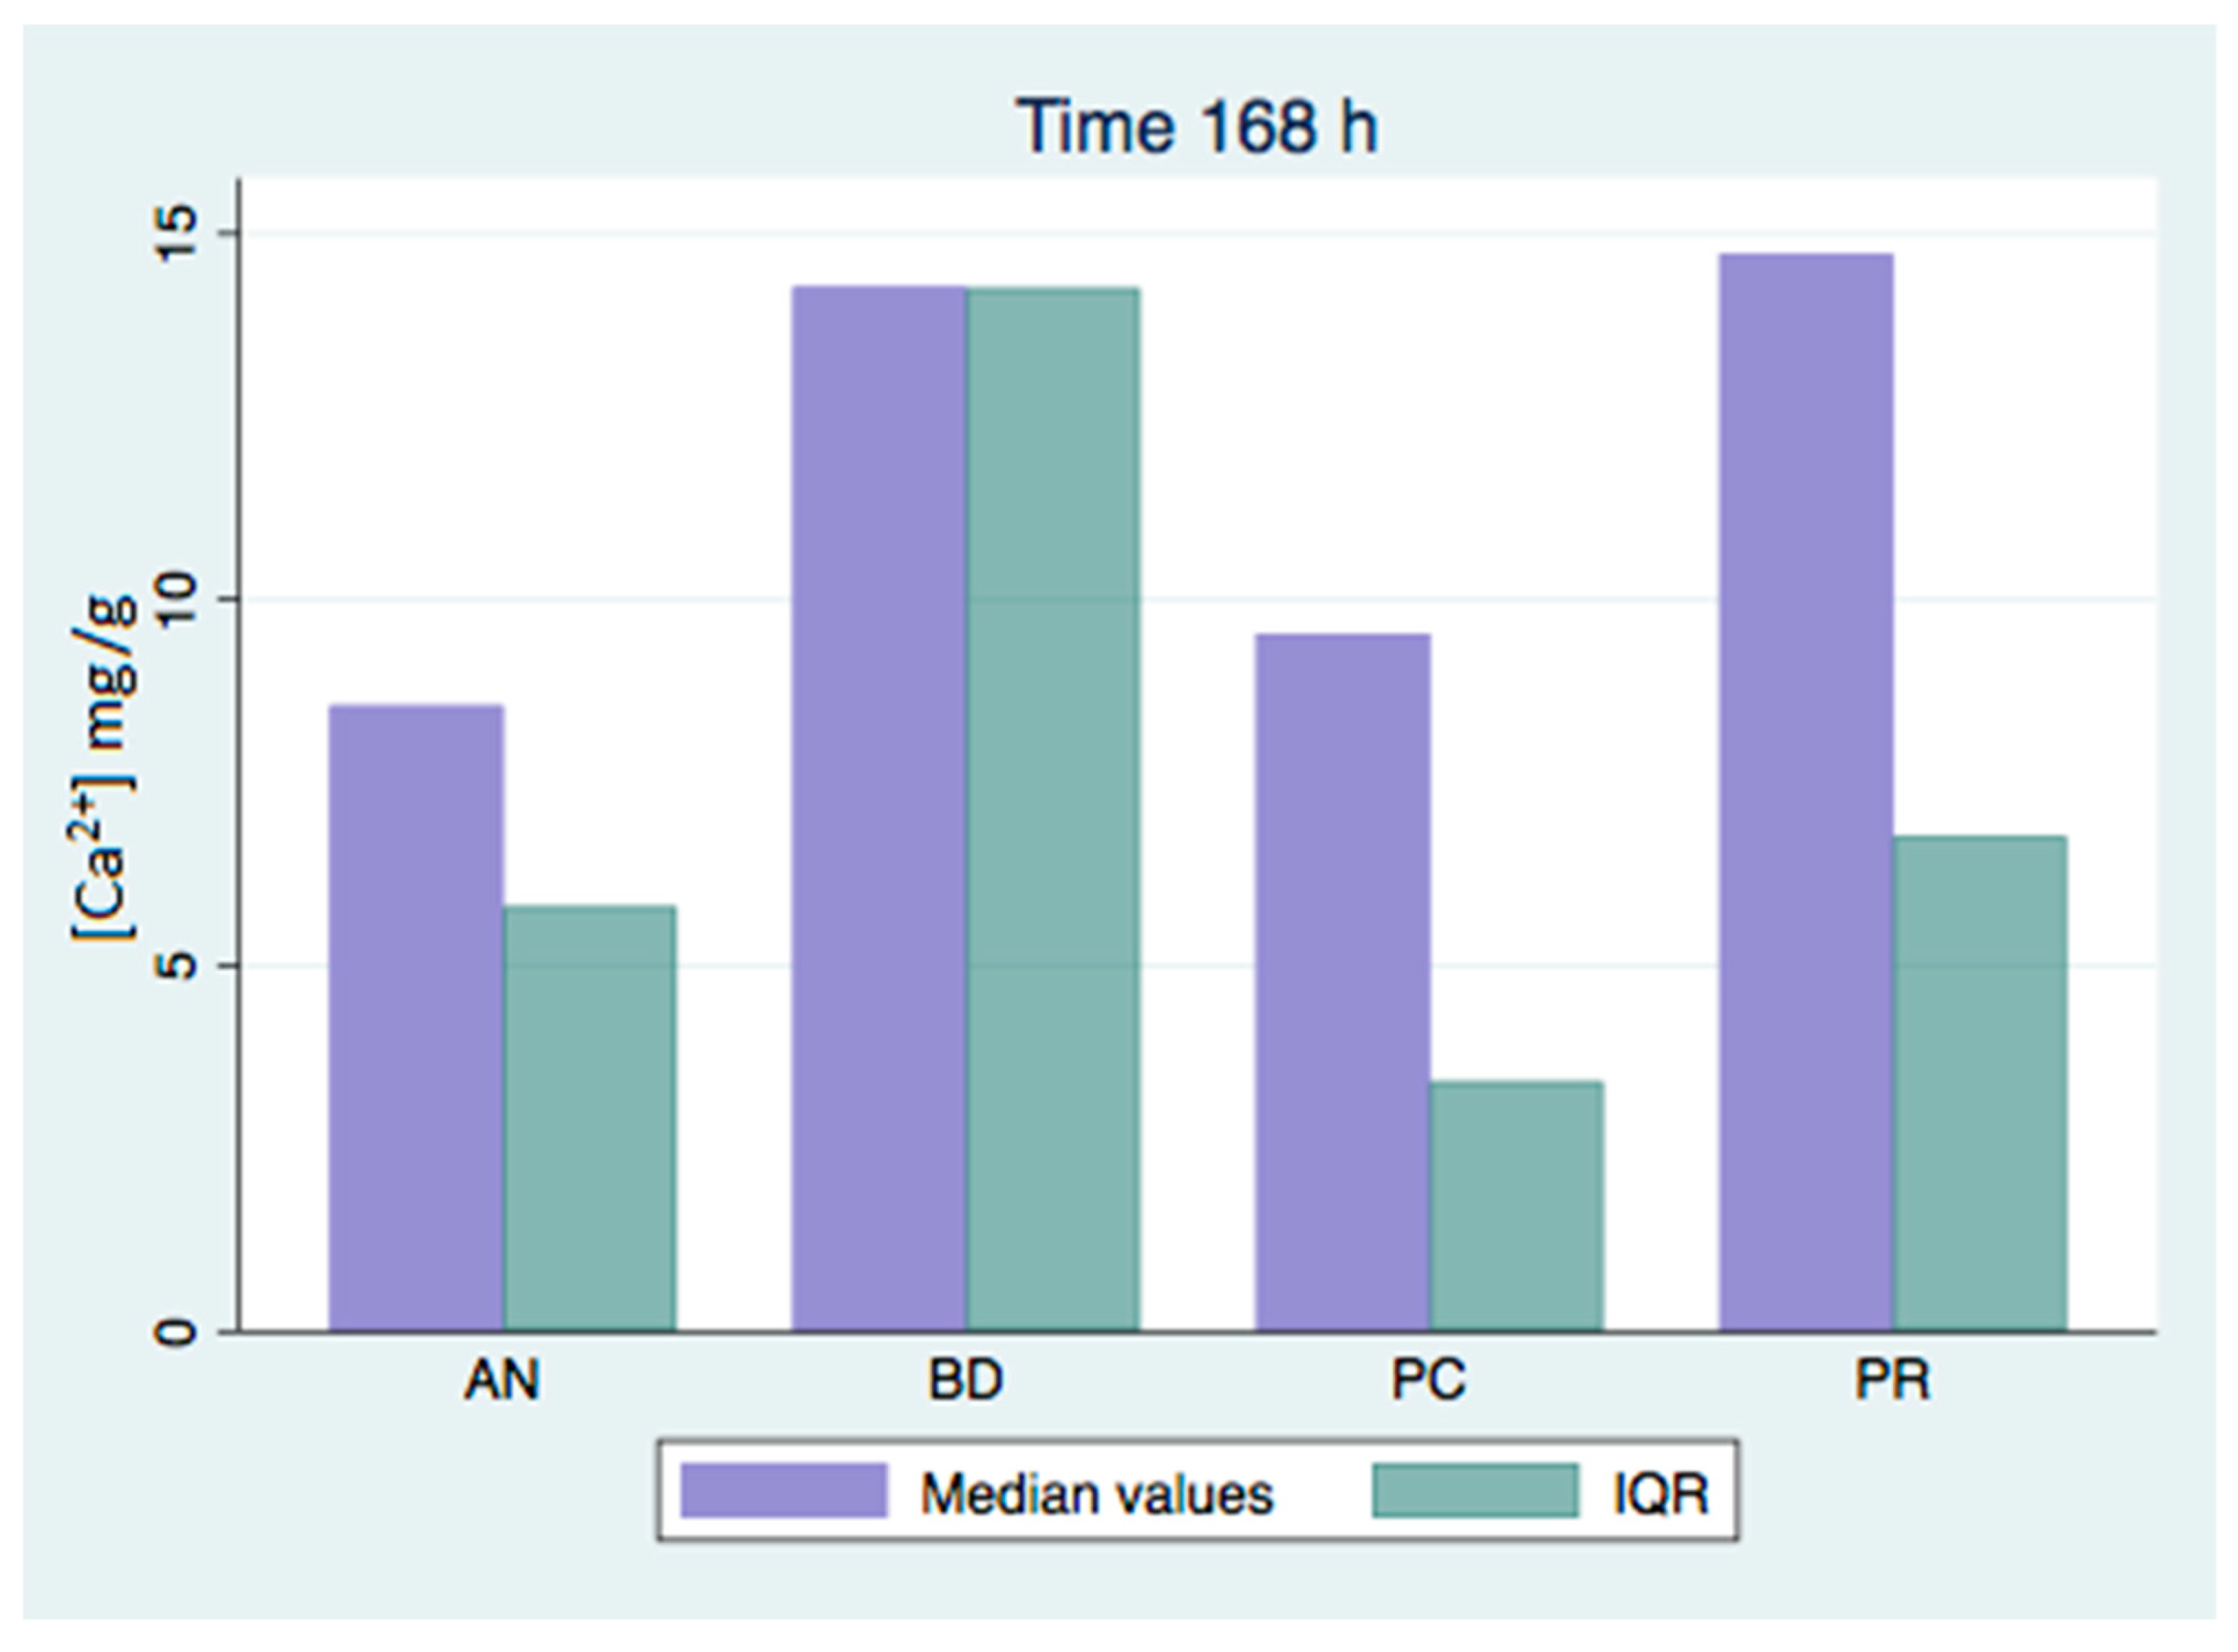
| 168 h | 10.28 ± 3.17 | 7.35 ± 0.07 | 9.15 ± 3.80 | 7.31 ± 0.02 (x) | 13.48 ± 5.74 | 7.39 ± 0.07 | 14.80 ± 9.03 | 7.93 ± 0.02 (x) |
| 336 h | 13.11 ± 5.10 | 7.12 ± 0.02 | 11.03 ± 2.49 | 7.13 ± 0.09 | 13.11 ± 6.13 | 7.22 ± 0.03 | 12.86 ± 6.32 | 7.76 ± 0.09 |
| 672 h | 13.73 ± 3.97 | 7.05 ± 0.01 | 12.52 ± 3.92 (a) | 7.10 ± 0.14 | 25.45 ± 18.63 (a) | 7.28 ± 0.16 | 17.58 ± 6.99 | 7.67 ± 0.03 |
| 1008 h | 12.31 ± 3.64 | 7.05 ± 0.01 | 9.35 ± 2.23 (a,b) | 7.10 ± 0.14 | 23.83 ± 12.45 (a) | 7.28 ± 0.16 | 20.07 ± 5.41 (b) | 7.67 ± 0.03 |
| ProClinic Group (PC) n = 10 | Angelus Group (AN) n = 10 | ProRoot Group (PR) n = 10 | Biodentine Group (BD) n = 10 | |||||
|---|---|---|---|---|---|---|---|---|
| [Ca2+] mg/g | pH | [Ca2+] mg/g | pH | [Ca2+] mg/g | pH | [Ca2+] mg/g | pH | |
| 3 h | 4.20 (1.44) (a) | 7.43 (0.02) | 2.79 (1.66) (a) | 7.41 (0.01) | 3.29 (1.92) | 7.41 (0.03) | 3.39 (1.69) | 7.48 (0.17) |
| 24 h | 4.96 (2.50) (b) | 7.51 (0.01) | 4.44 (1.23) (a) | 7.48 (0.01) | 3.08 (1.44) | 7.5 (0.05) | 2.60 (0.67) (a,b) | 7.75 (0.27) |
| 72 h | 4.71 (2.66) (a) | 7.39 (0.06) | 4.31 (1.44) (a) | 7.38 (0.03) | 6.16 (5.31) (a) | 7.4 (0.06) | 4.34 (1.67) (a) | 7.73 (0.06) |
| 168 h | 9.54 (3.62) | 7.35 (0.10) | 8.55 (5.99) | 7.31 (0.03) | 14.72 (7.10) | 7.39 (0.10) | 14.27 (16.10) | 7.93 (0.03) (x) |
| 336 h | 12.40 (5.68) | 7.12 (0.04) | 10.71 (4.88) | 7.13 (0.14) | 12.12 (10.72) | 7.22 (0.05) | 11.18 (5.29) | 7.76 (0.13) |
| 672 h | 13.15 (7.05) | 7.05 (0.01) | 11.73 (4.84) (a) | 7.1 (0.21) | 19.85 (14.91) (a) | 7.28 (0.23) | 15.91 (10.73) | 7.67 (0.05) |
| 1008 h | 11.37 (3.64) | 7.05 (0.01) | 9.07 (4.43) (a,b) | 7.1 (0.21) | 19.00 (21.85) (a) | 7.28 (0.23) | 19.09 (10.10) (b) | 7.67 (0.05) |
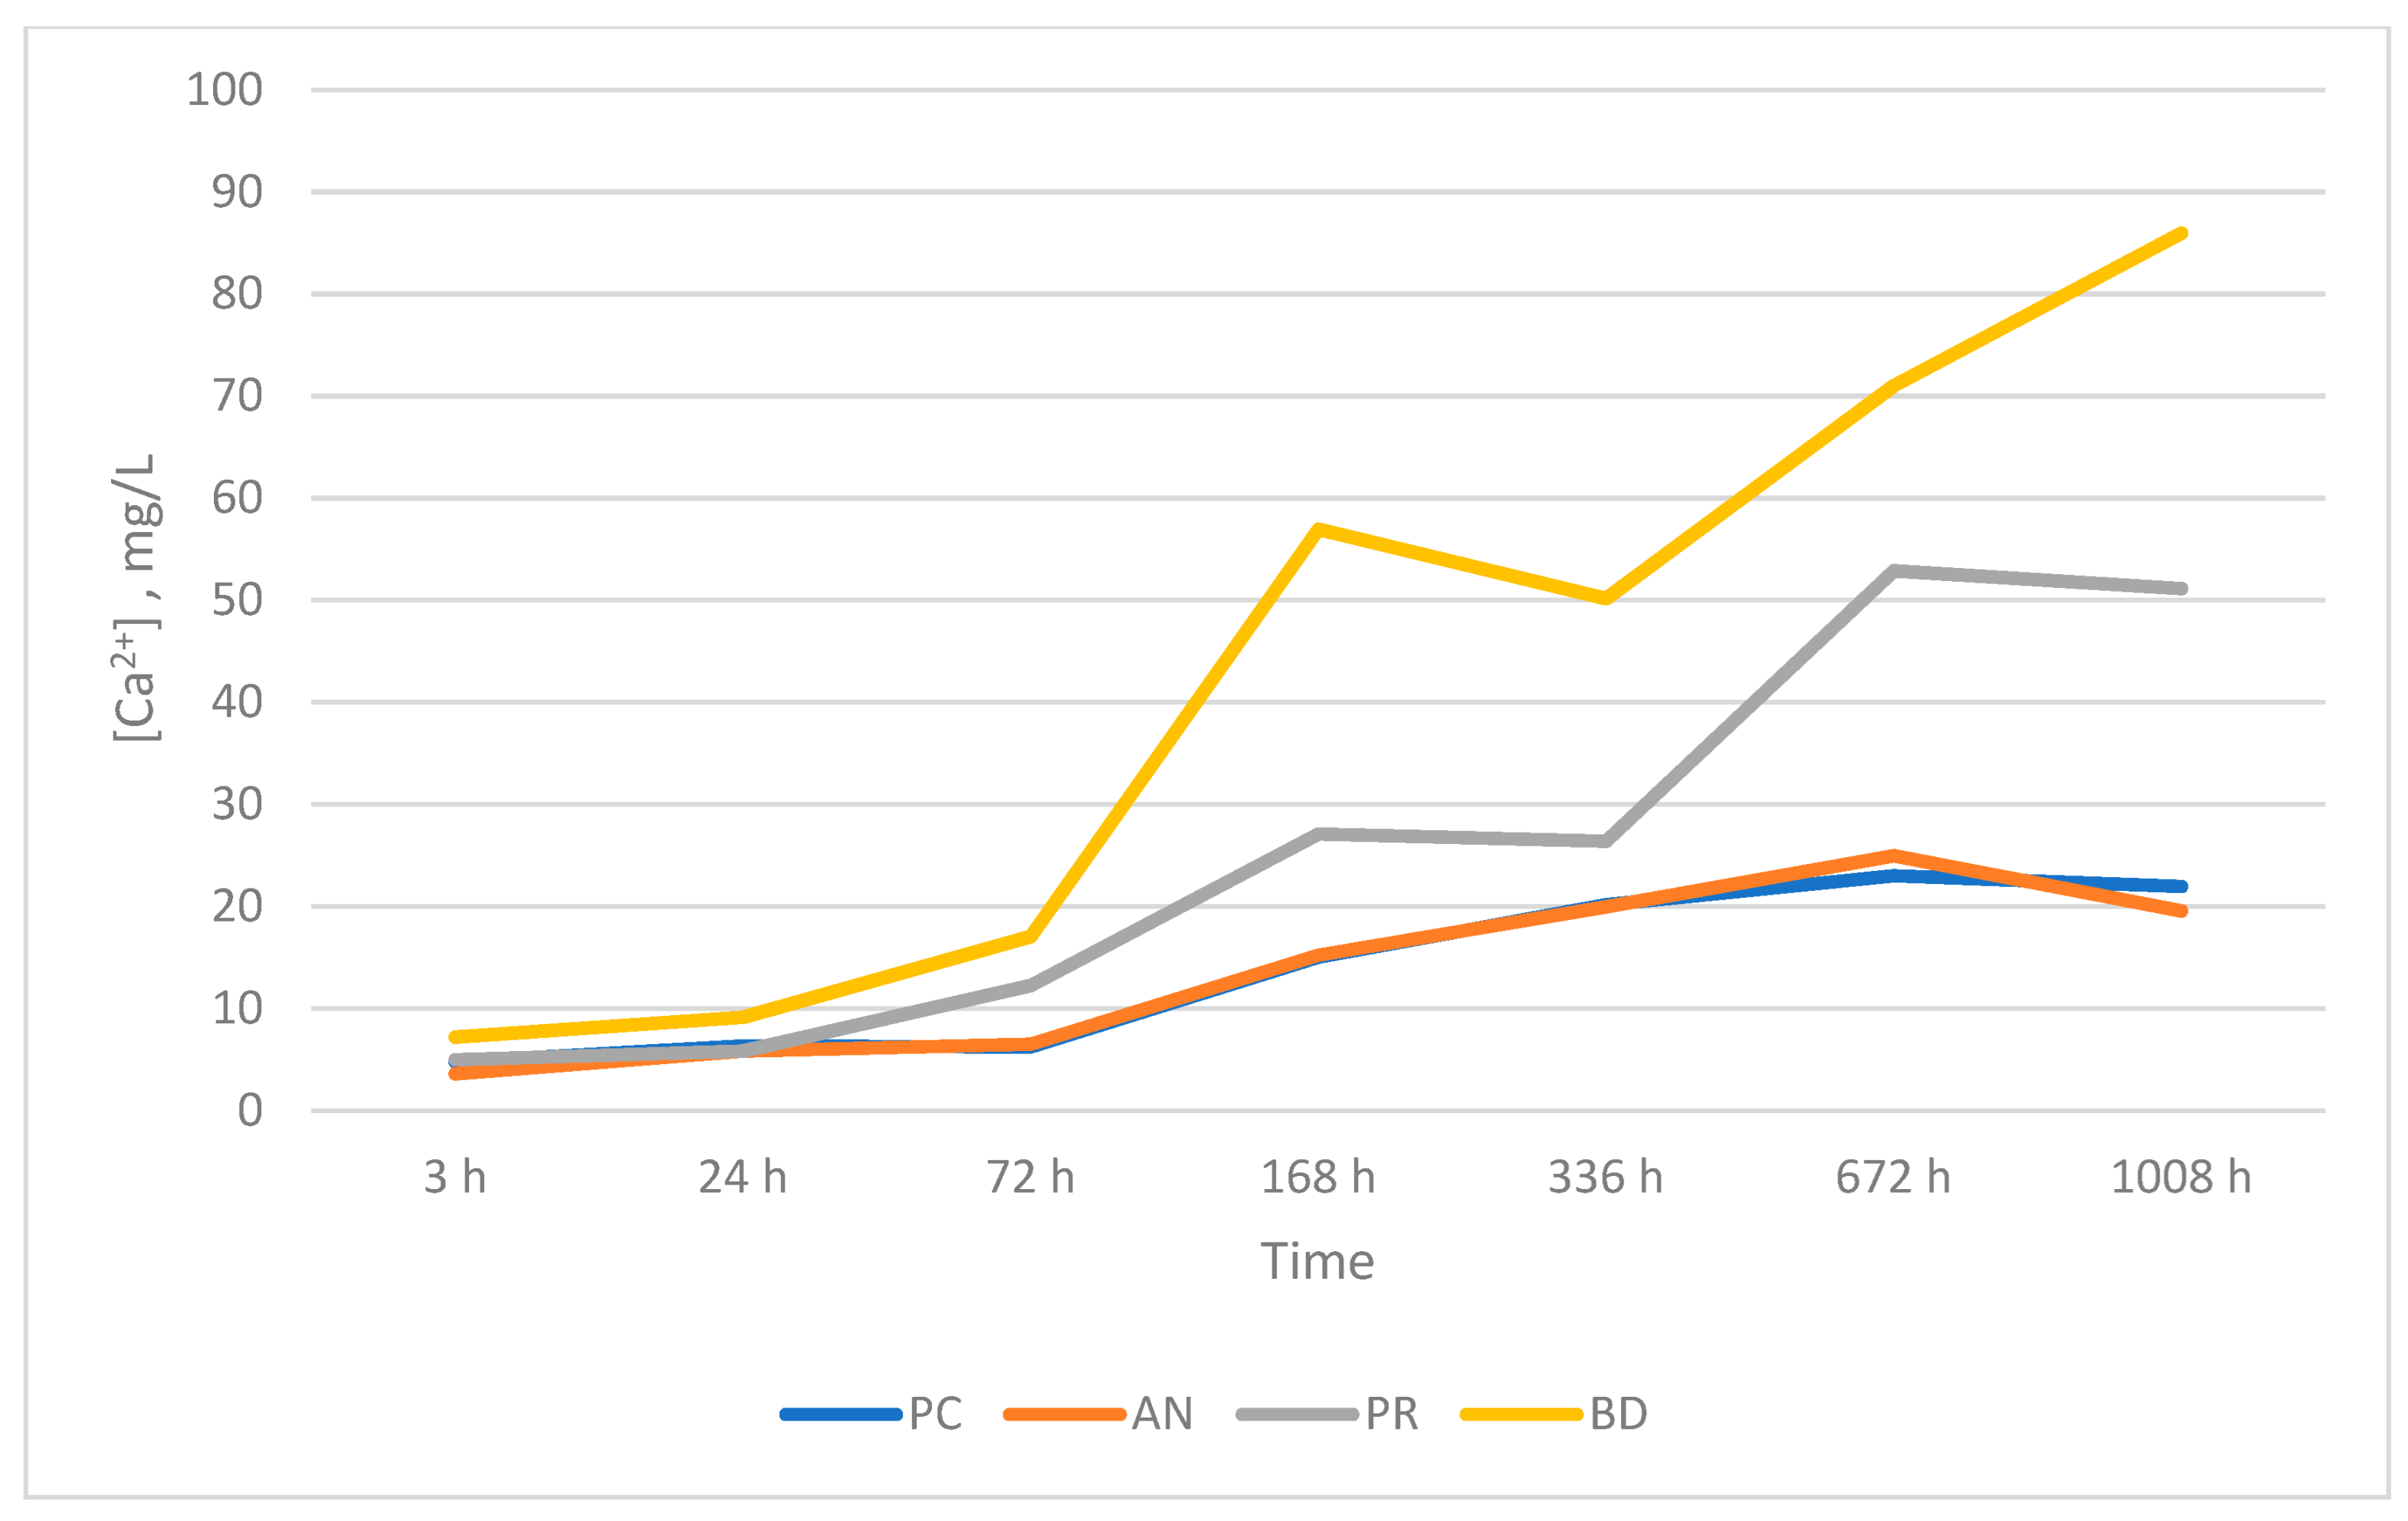
| [Ca2+], mg/L | ||||
|---|---|---|---|---|
| ProClinic Group (PC) | Angelus Group (AN) | ProRoot Group (PR) | Biodentine Group (BD) | |
| 3 h | 4.76 | 3.61 | 4.98 | 7.20 |
| 24 h | 6.34 | 5.82 | 5.84 | 9.15 |
| 72 h | 6.22 | 6.52 | 12.24 | 17.06 |
| 168 h | 15.01 | 15.23 | 27.10 | 56.95 |
| 336 h | 20.16 | 19.96 | 26.39 | 50.15 |
| 672 h | 23.00 | 24.95 | 52.87 | 71.00 |
| 1008 h | 21.94 | 19.57 | 51.13 | 85.95 |
Disclaimer/Publisher’s Note: The statements, opinions and data contained in all publications are solely those of the individual author(s) and contributor(s) and not of MDPI and/or the editor(s). MDPI and/or the editor(s) disclaim responsibility for any injury to people or property resulting from any ideas, methods, instructions or products referred to in the content. |
© 2023 by the authors. Licensee MDPI, Basel, Switzerland. This article is an open access article distributed under the terms and conditions of the Creative Commons Attribution (CC BY) license (https://creativecommons.org/licenses/by/4.0/).
Share and Cite
Herrera-Trinidad, R.; Molinero-Mourelle, P.; Fonseca, M.; Weber, A.R.; Vera, V.; Mena, M.L.; Vera-González, V. Assessment of pH Value and Release of Calcium Ions in Calcium Silicate Cements: An In Vitro Comparative Study. Materials 2023, 16, 6213. https://doi.org/10.3390/ma16186213
Herrera-Trinidad R, Molinero-Mourelle P, Fonseca M, Weber AR, Vera V, Mena ML, Vera-González V. Assessment of pH Value and Release of Calcium Ions in Calcium Silicate Cements: An In Vitro Comparative Study. Materials. 2023; 16(18):6213. https://doi.org/10.3390/ma16186213
Chicago/Turabian StyleHerrera-Trinidad, Rubén, Pedro Molinero-Mourelle, Manrique Fonseca, Adrian Roman Weber, Vicente Vera, María Luz Mena, and Vicente Vera-González. 2023. "Assessment of pH Value and Release of Calcium Ions in Calcium Silicate Cements: An In Vitro Comparative Study" Materials 16, no. 18: 6213. https://doi.org/10.3390/ma16186213