
Development of Piezoresistive Sensors Based on Graphene Nanoplatelets Screen-Printed on Woven and Knitted Fabrics: Optimisation of Active Layer Formulation and Transversal/Longitudinal Textile Direction

 , ,
, ,  , and
, and 
Abstract
:1. Introduction
1.1. Piezoresistive Behaviour in Polymer Composites
1.2. Materials (Active, Electrodes and Substrates)
2. Materials and Methods
2.1. Materials
2.2. Samples Preparation
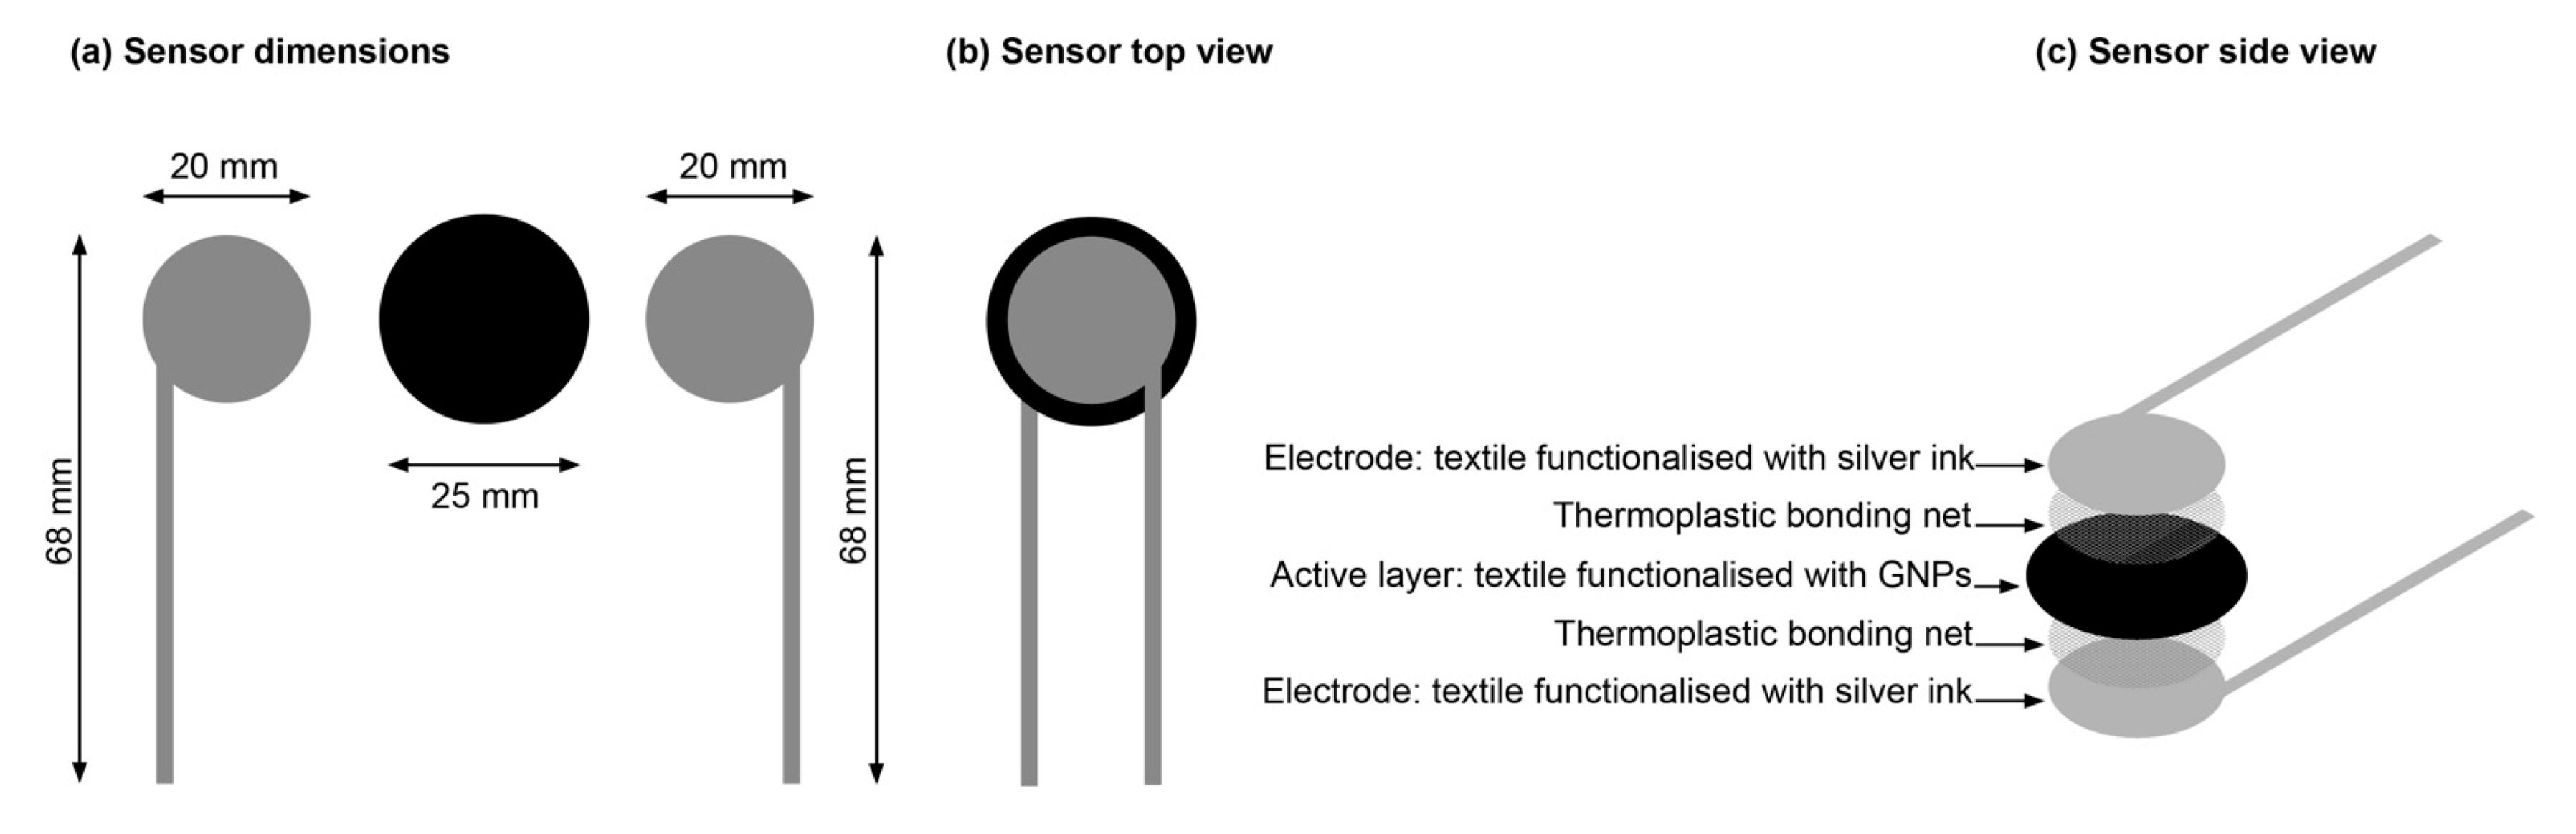
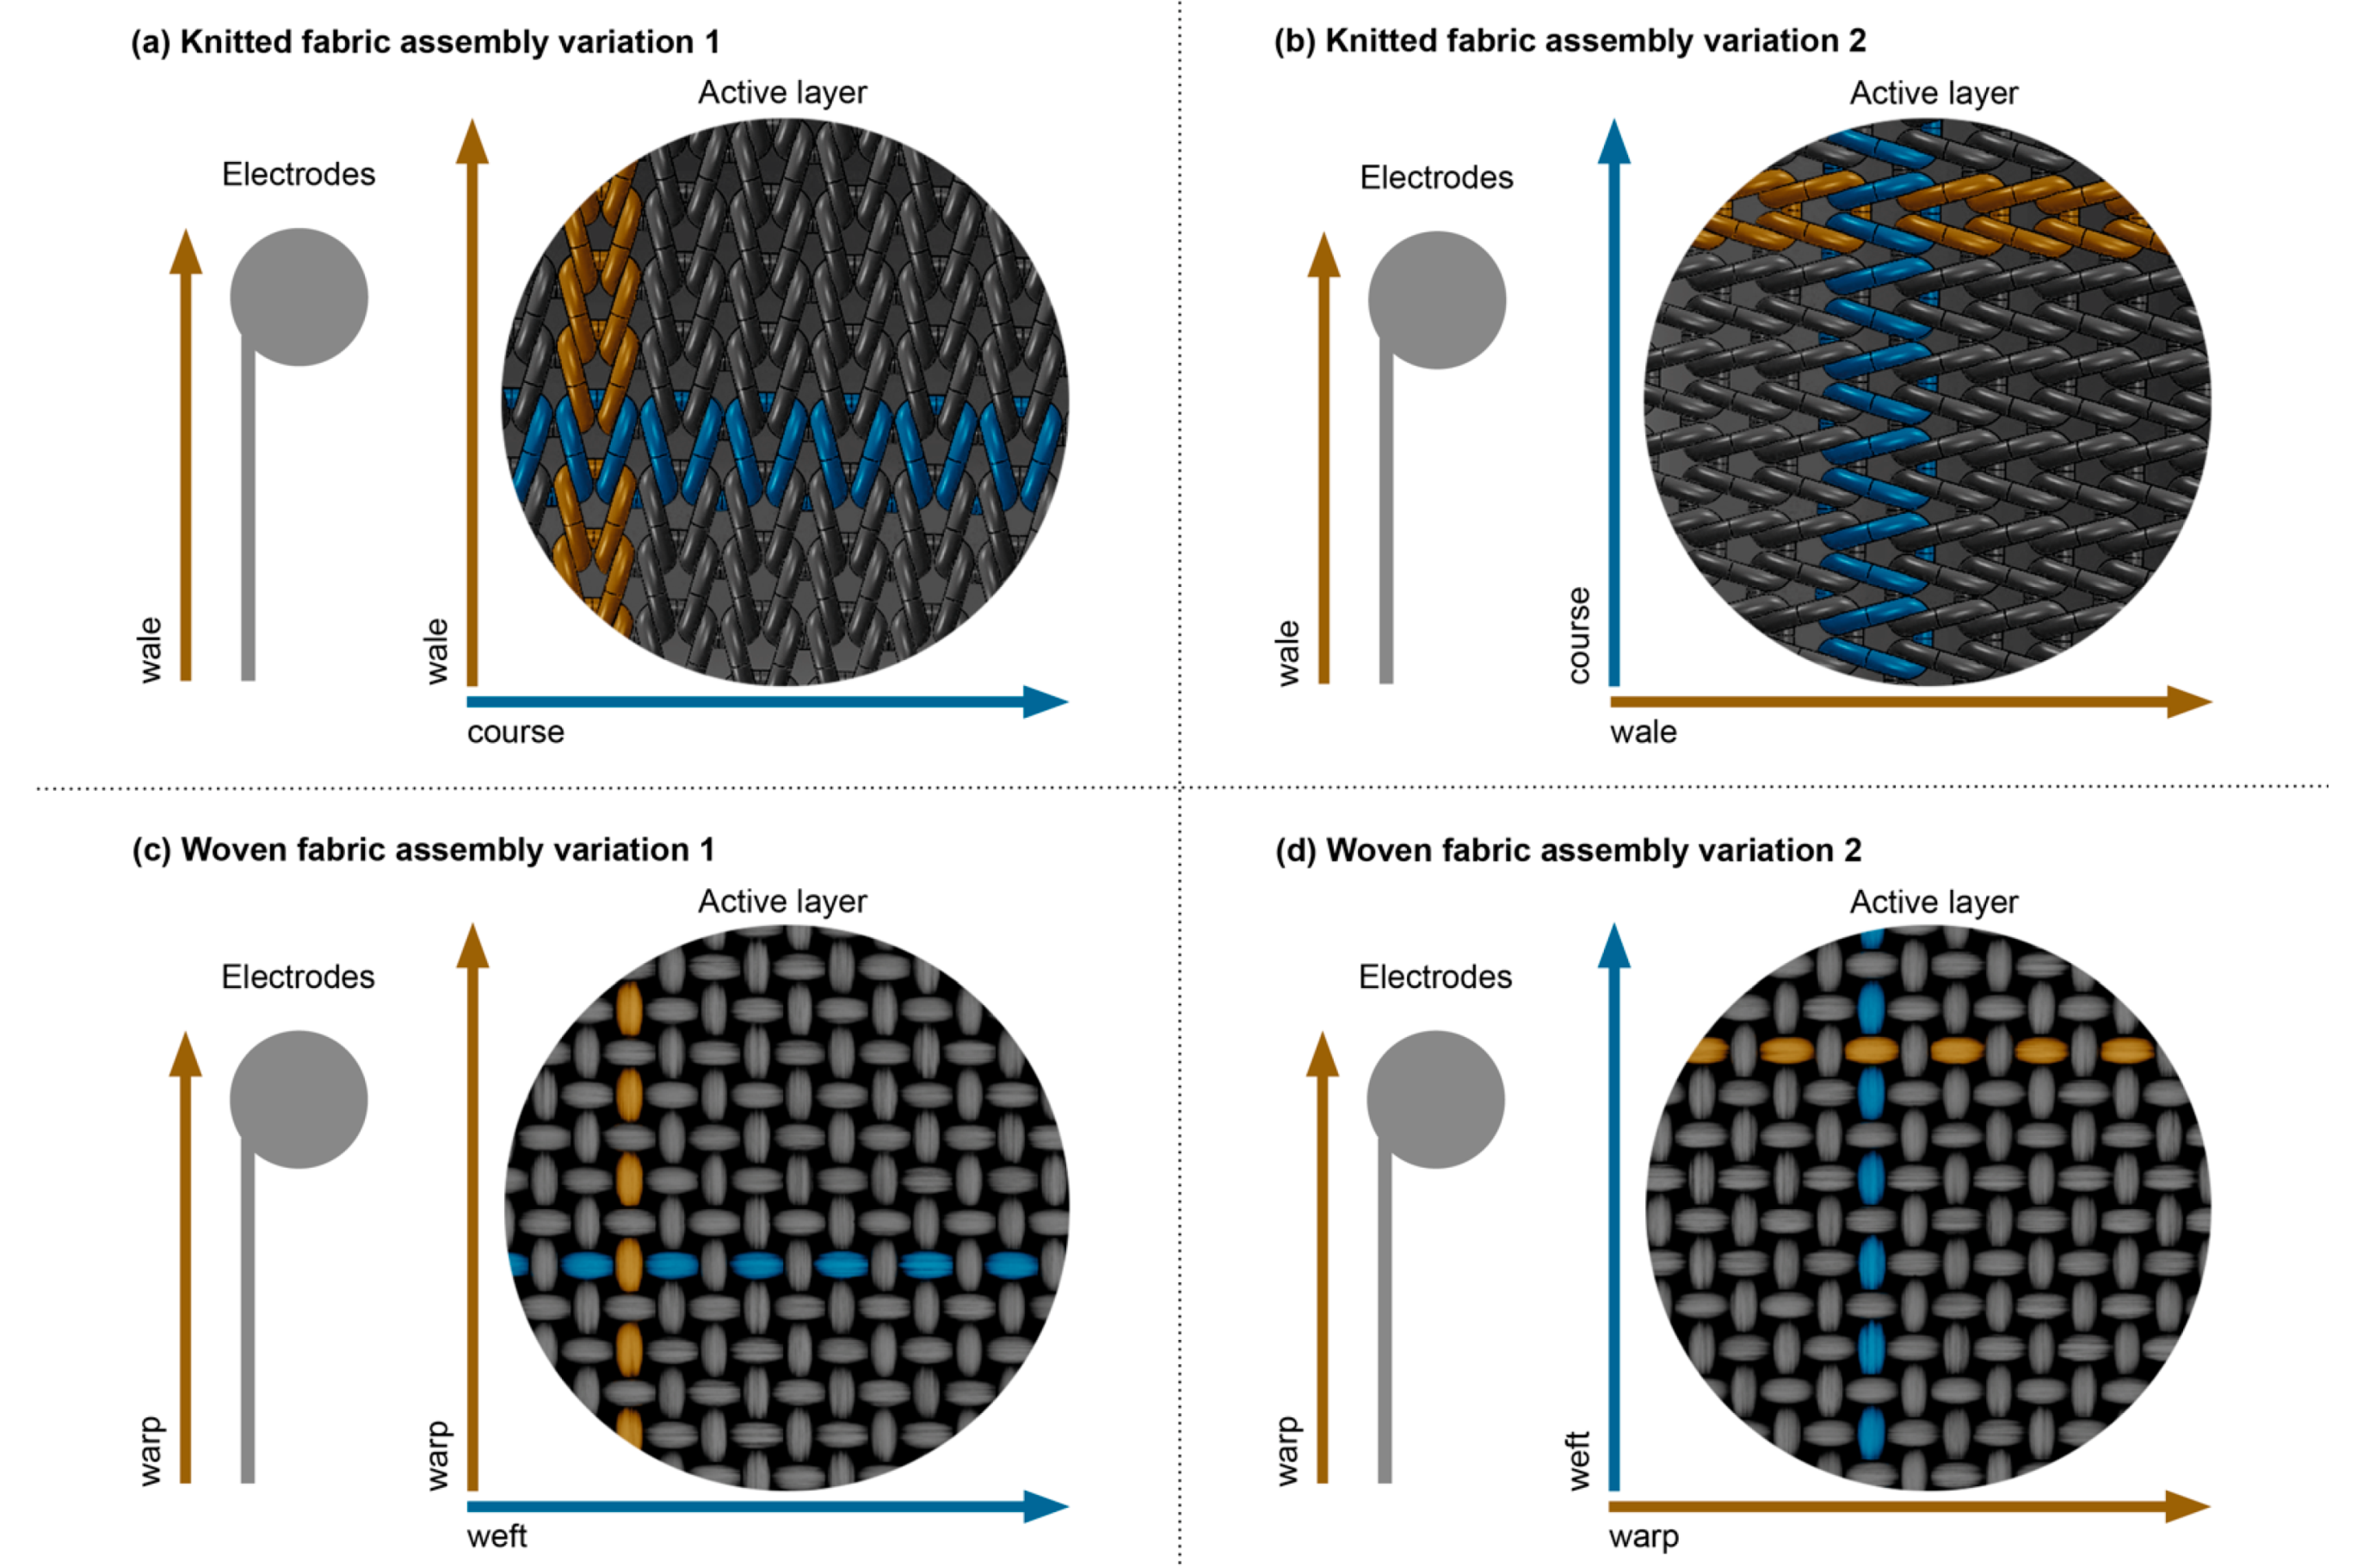
2.2.1. Sensor Design
2.2.2. Active Layer Formulation
2.2.3. Screen-Printing and Process
2.3. Samples Characterisation
2.3.1. Field Emission Scanning Electron Microscopy (FESEM)
2.3.2. Ground State Diffuse Reflectance (GSDR)
2.3.3. Raman Spectroscopy
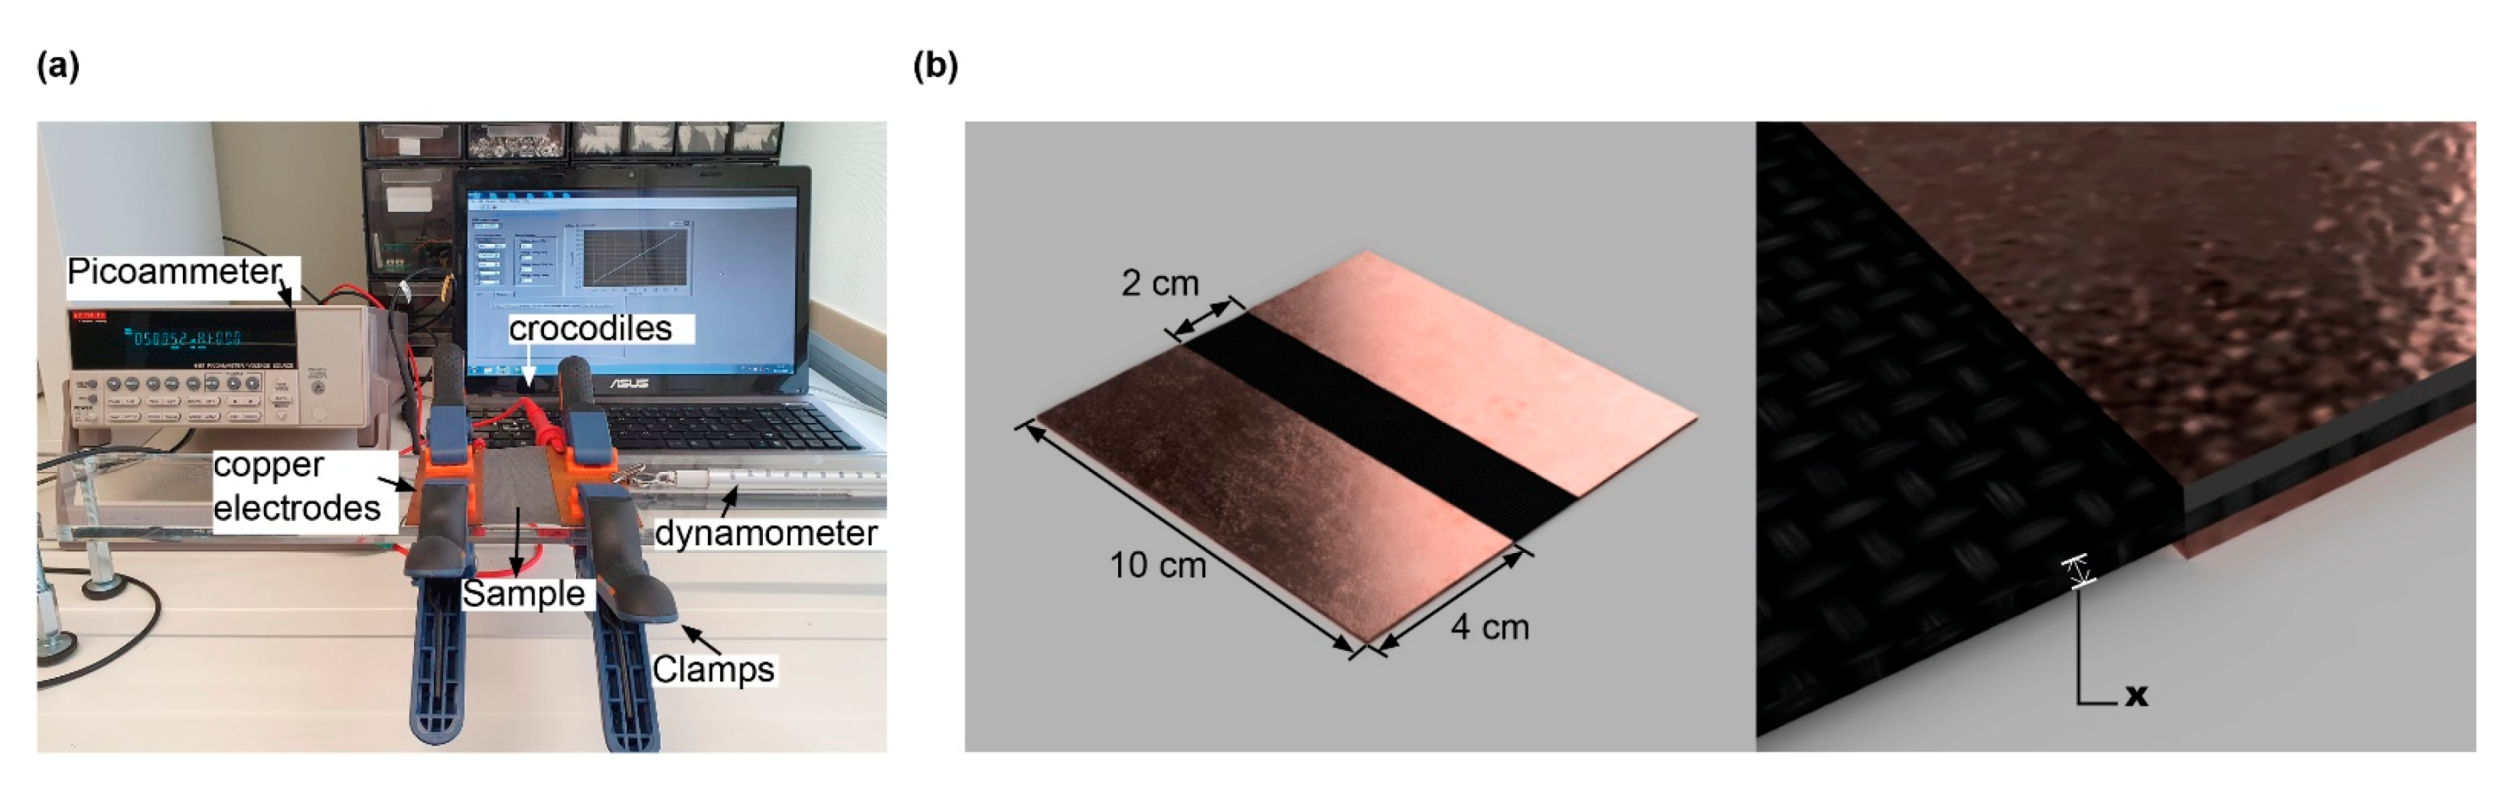
2.3.4. Linear Electrical Resistance and Electrical Conductivity
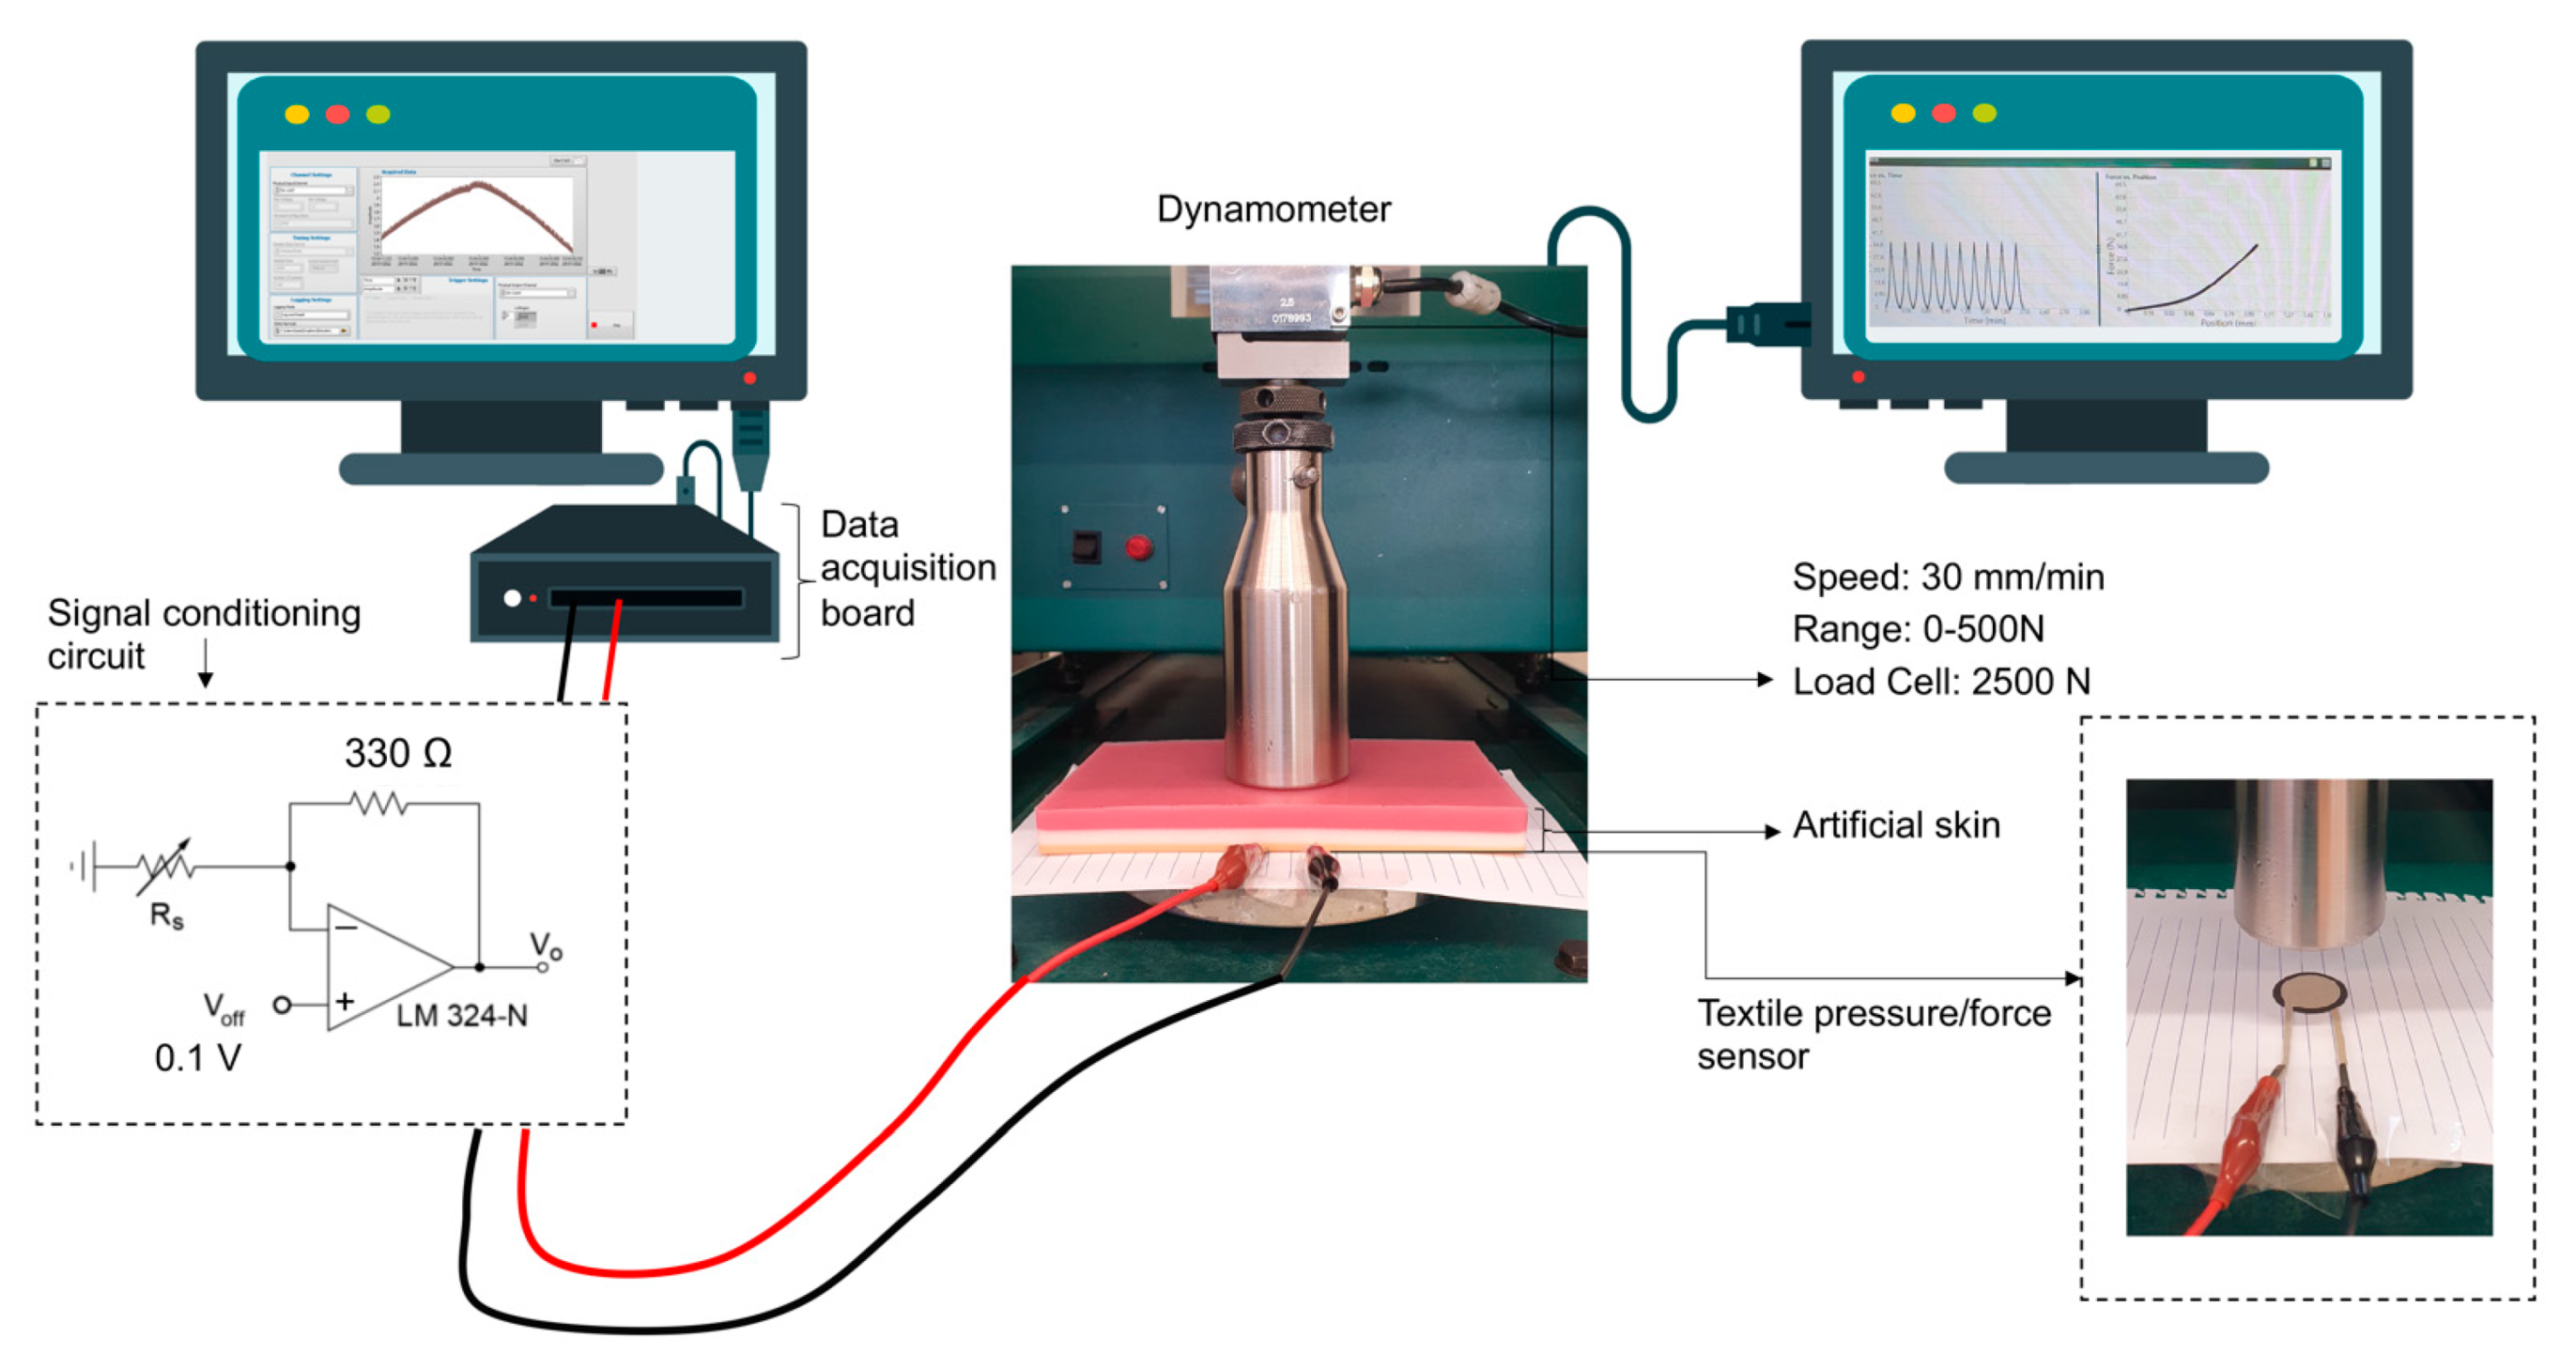
2.3.5. Piezoresistive Behaviour
3. Results and Discussion
3.1. Morphological and Structural Analyses
3.2. Physicochemical Characterisation
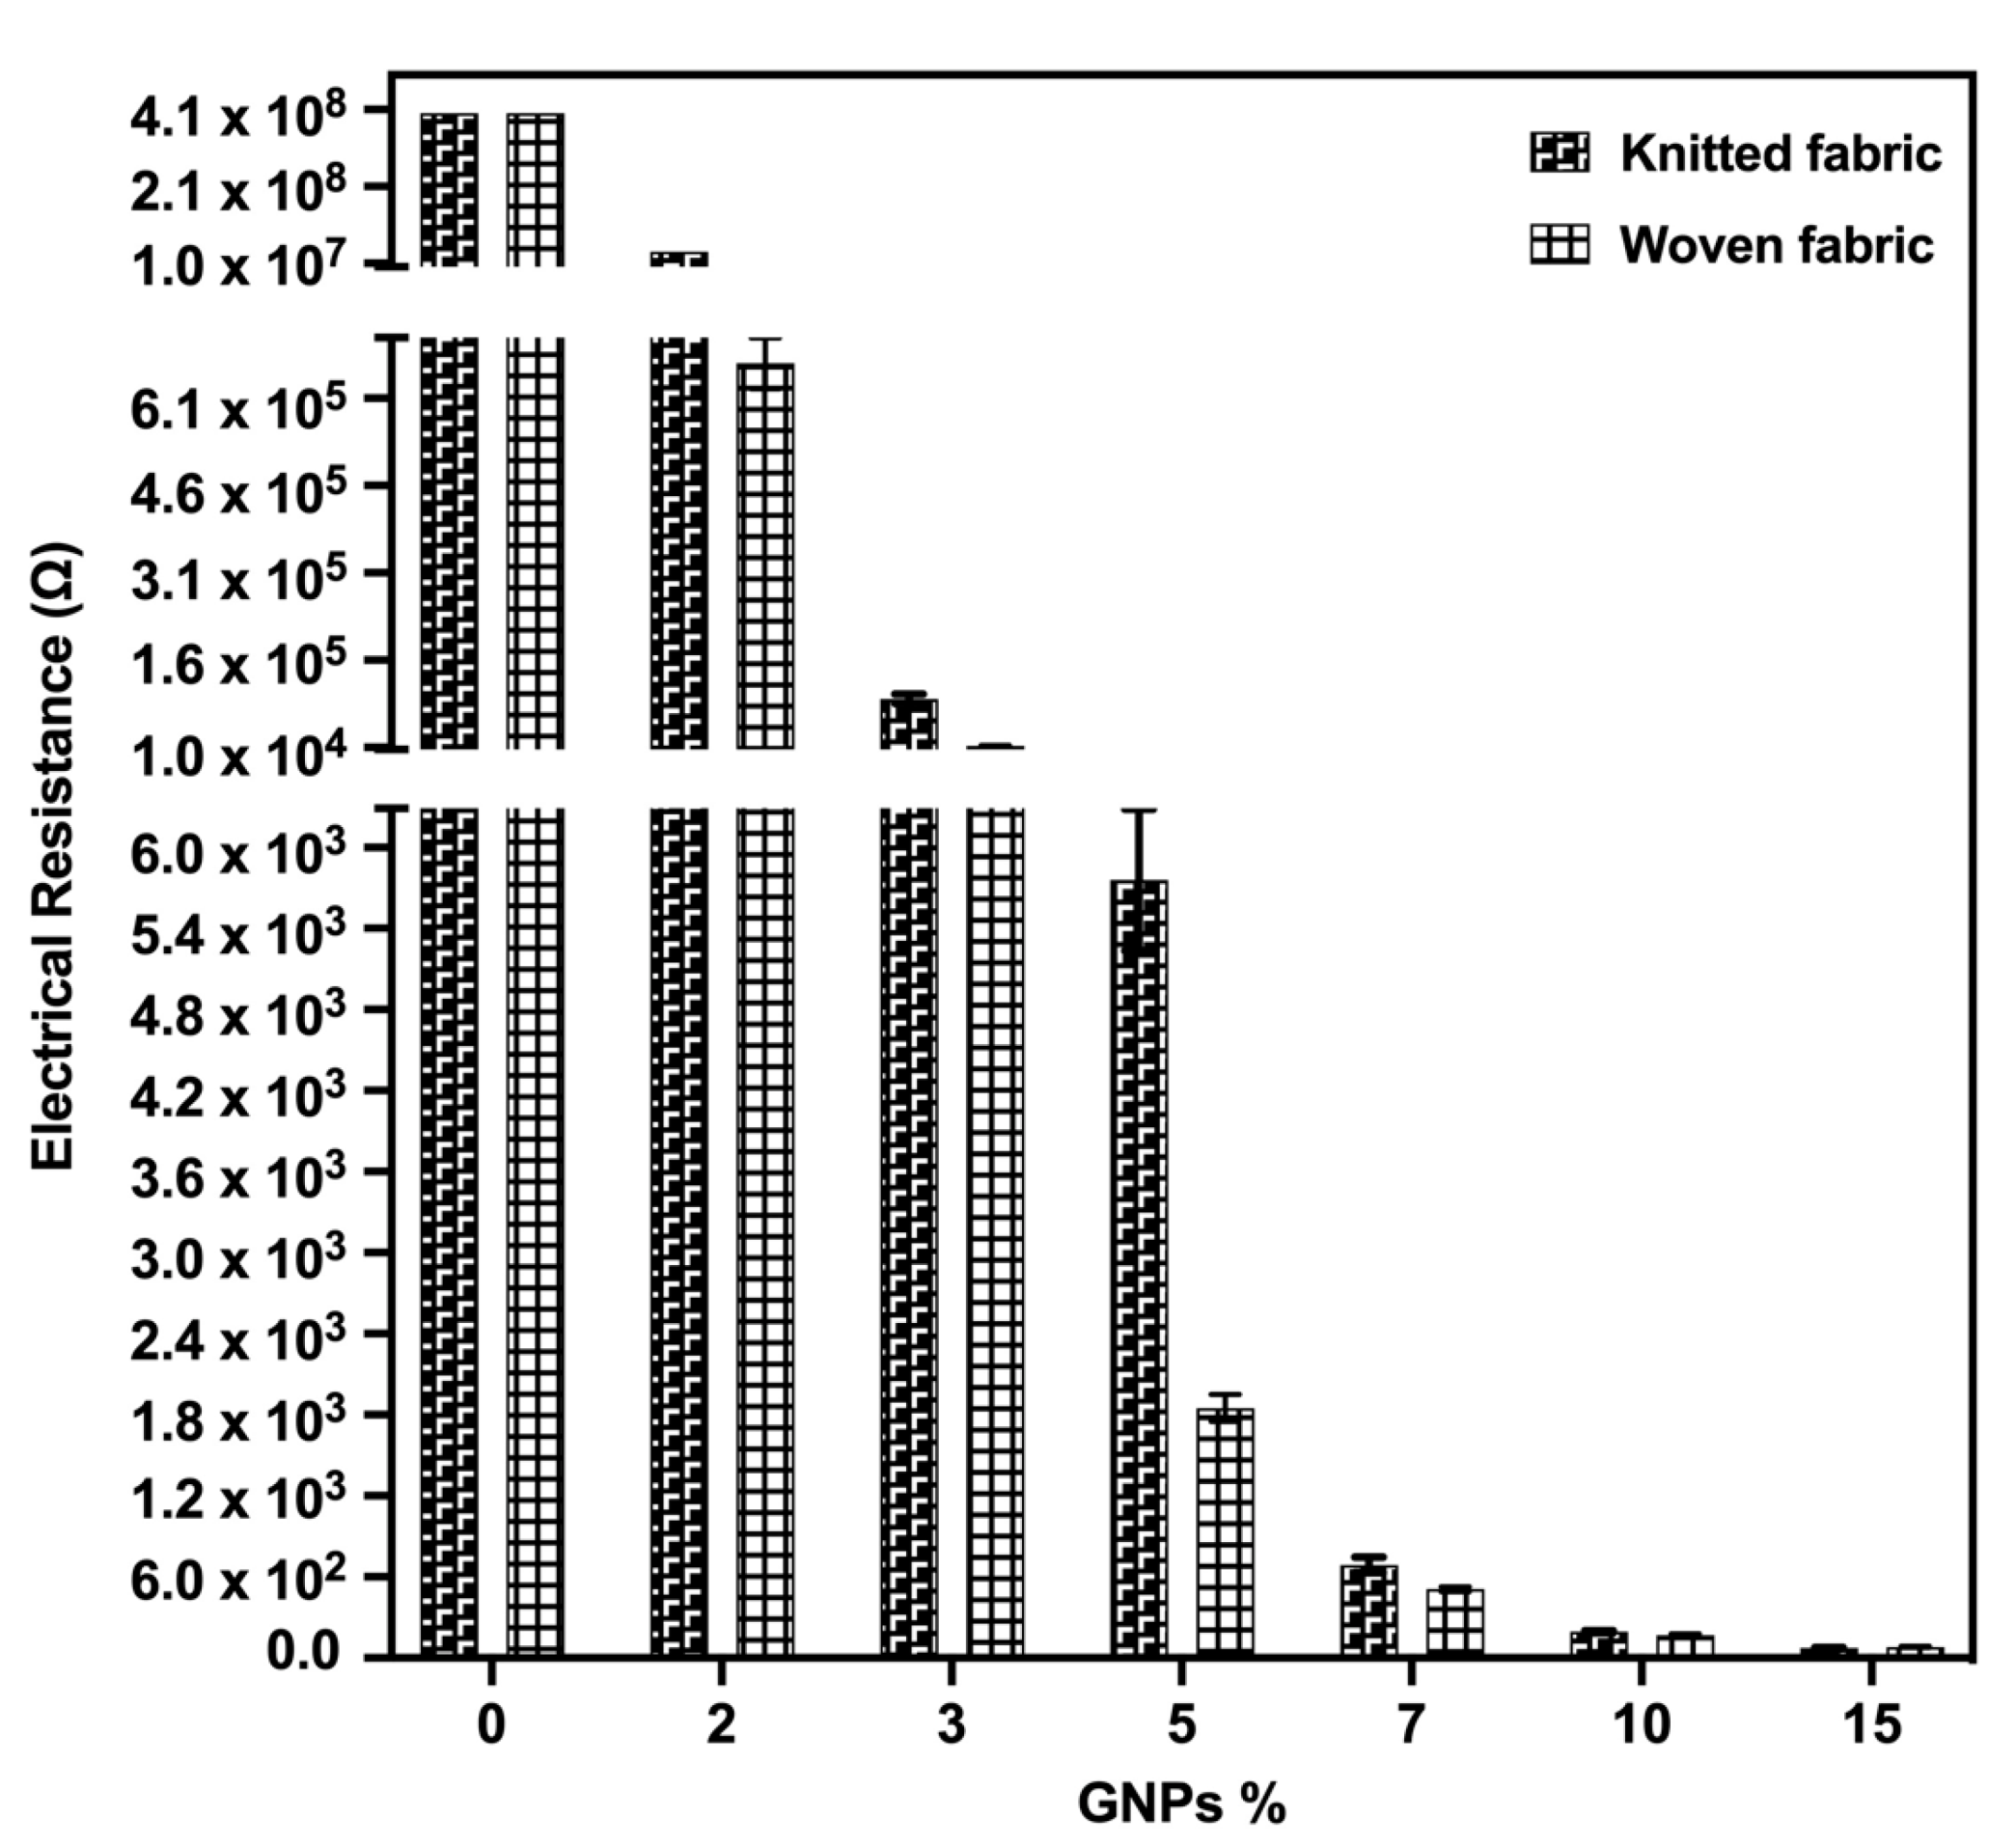
3.3. Electrical Characterisation
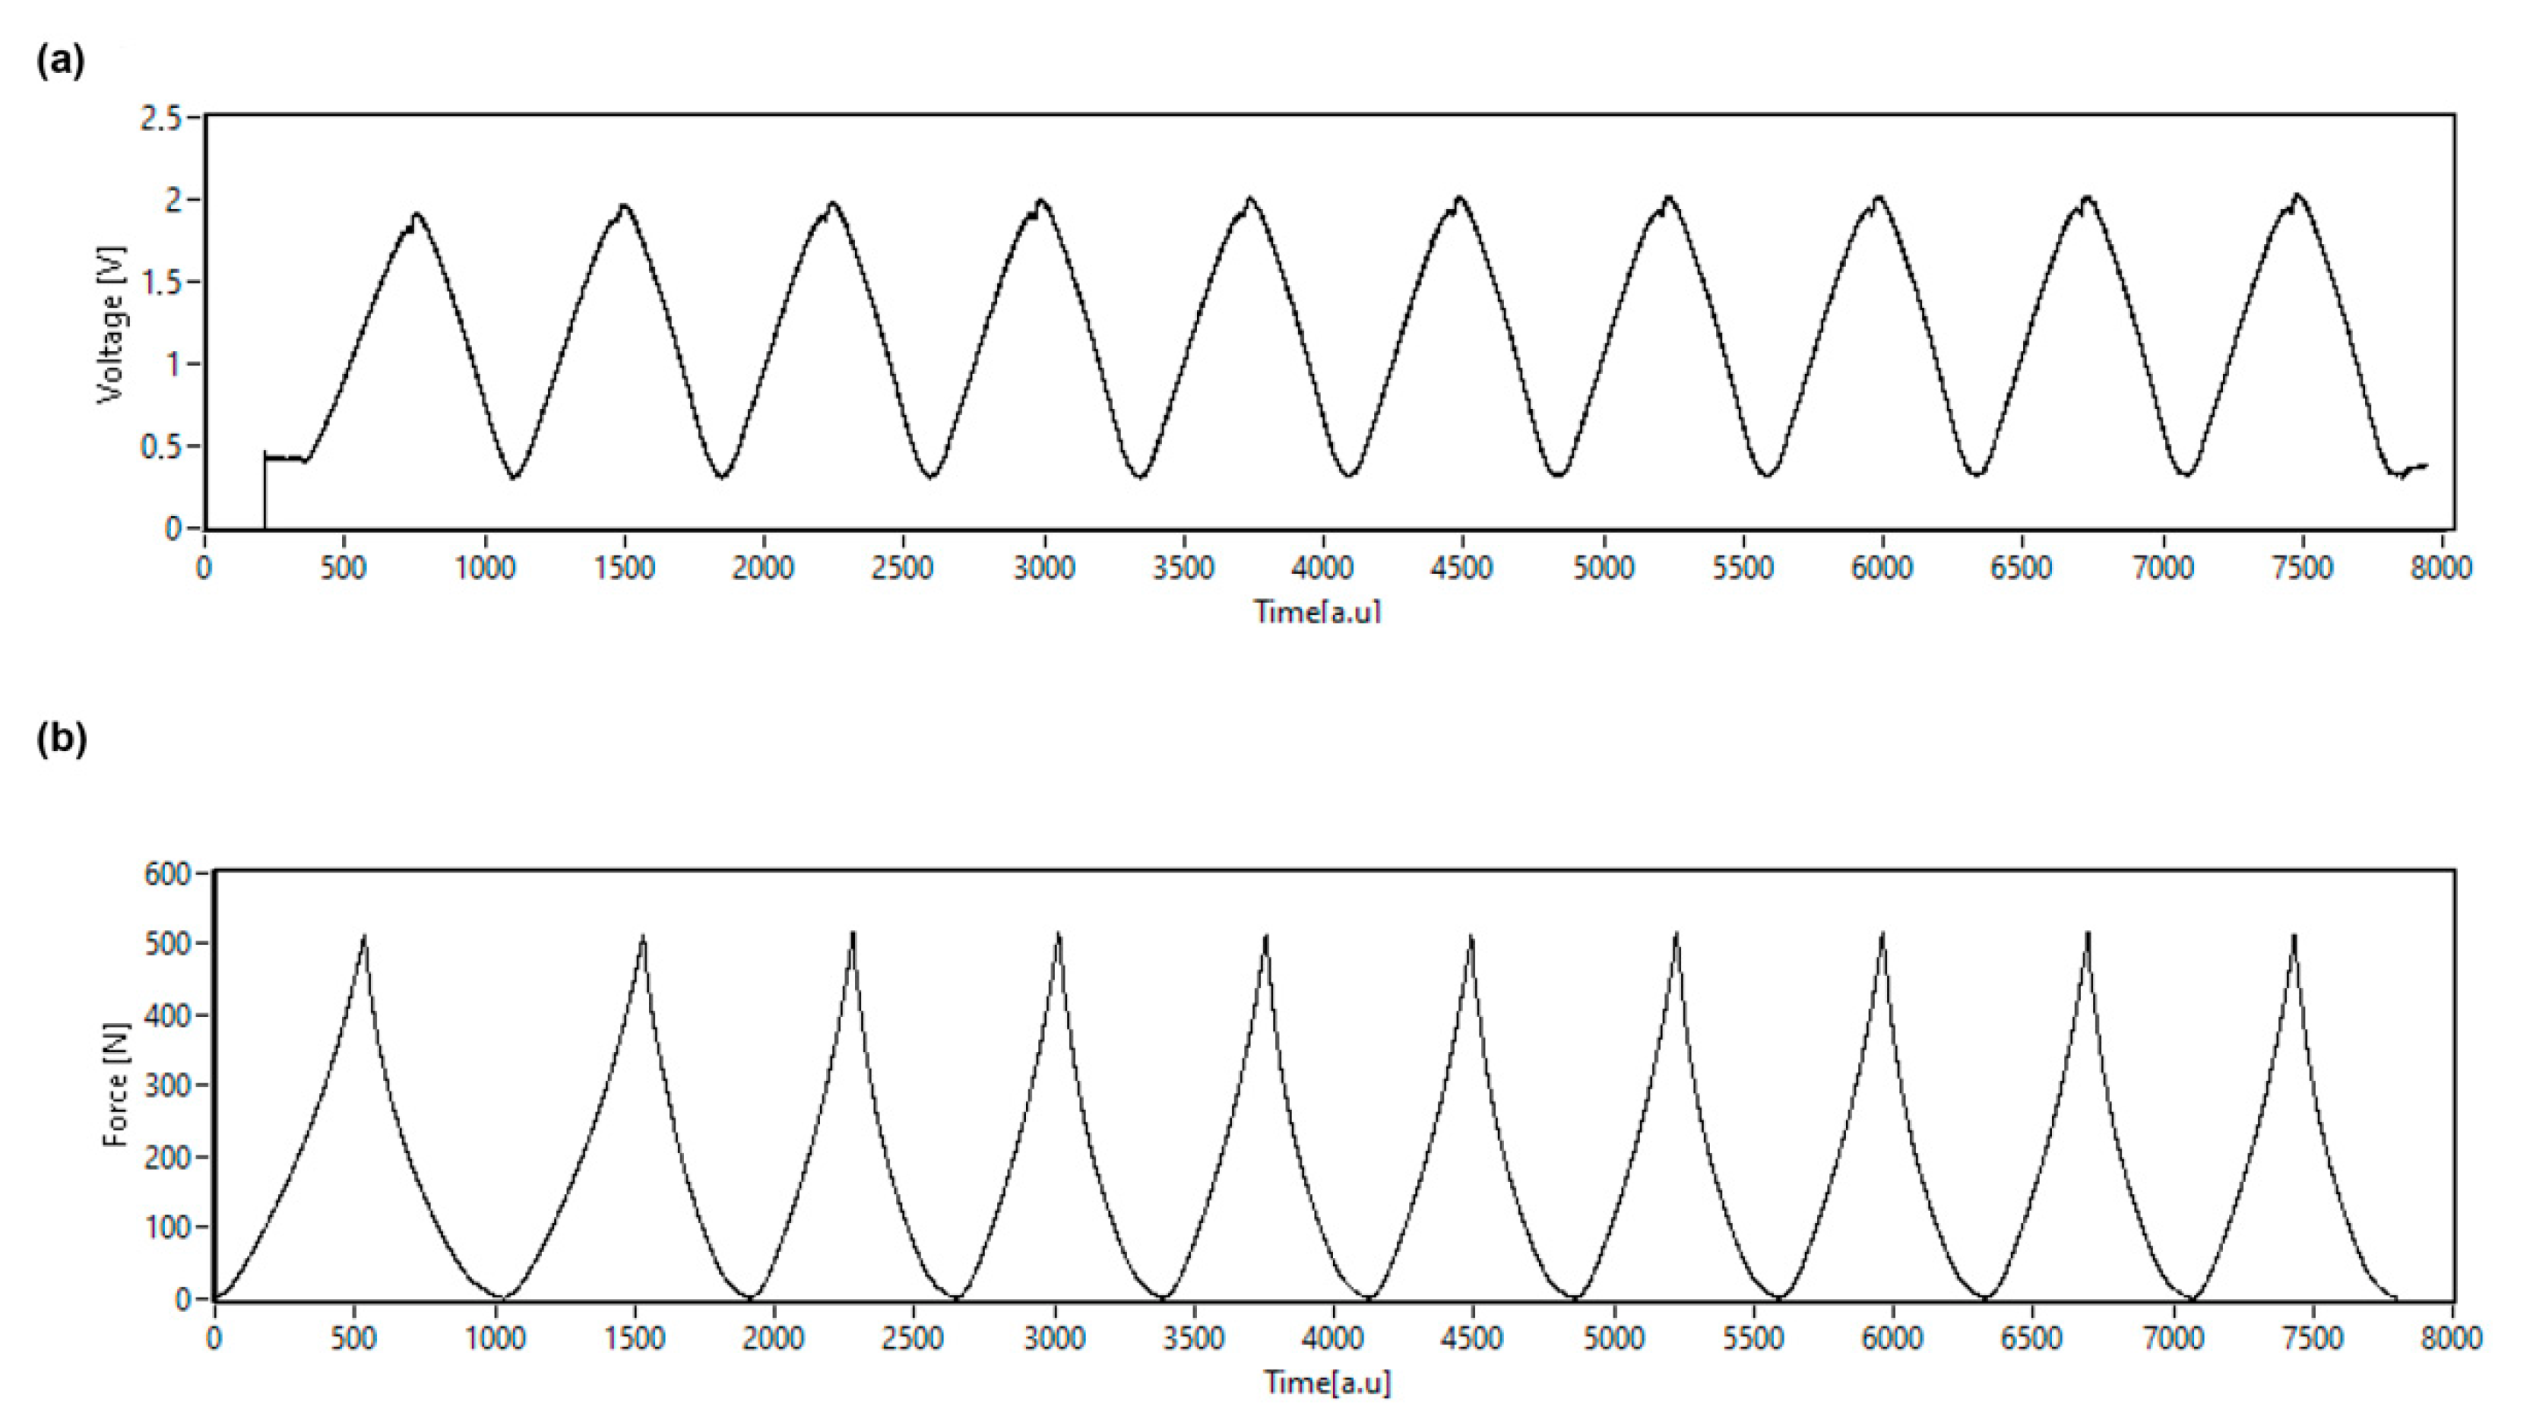
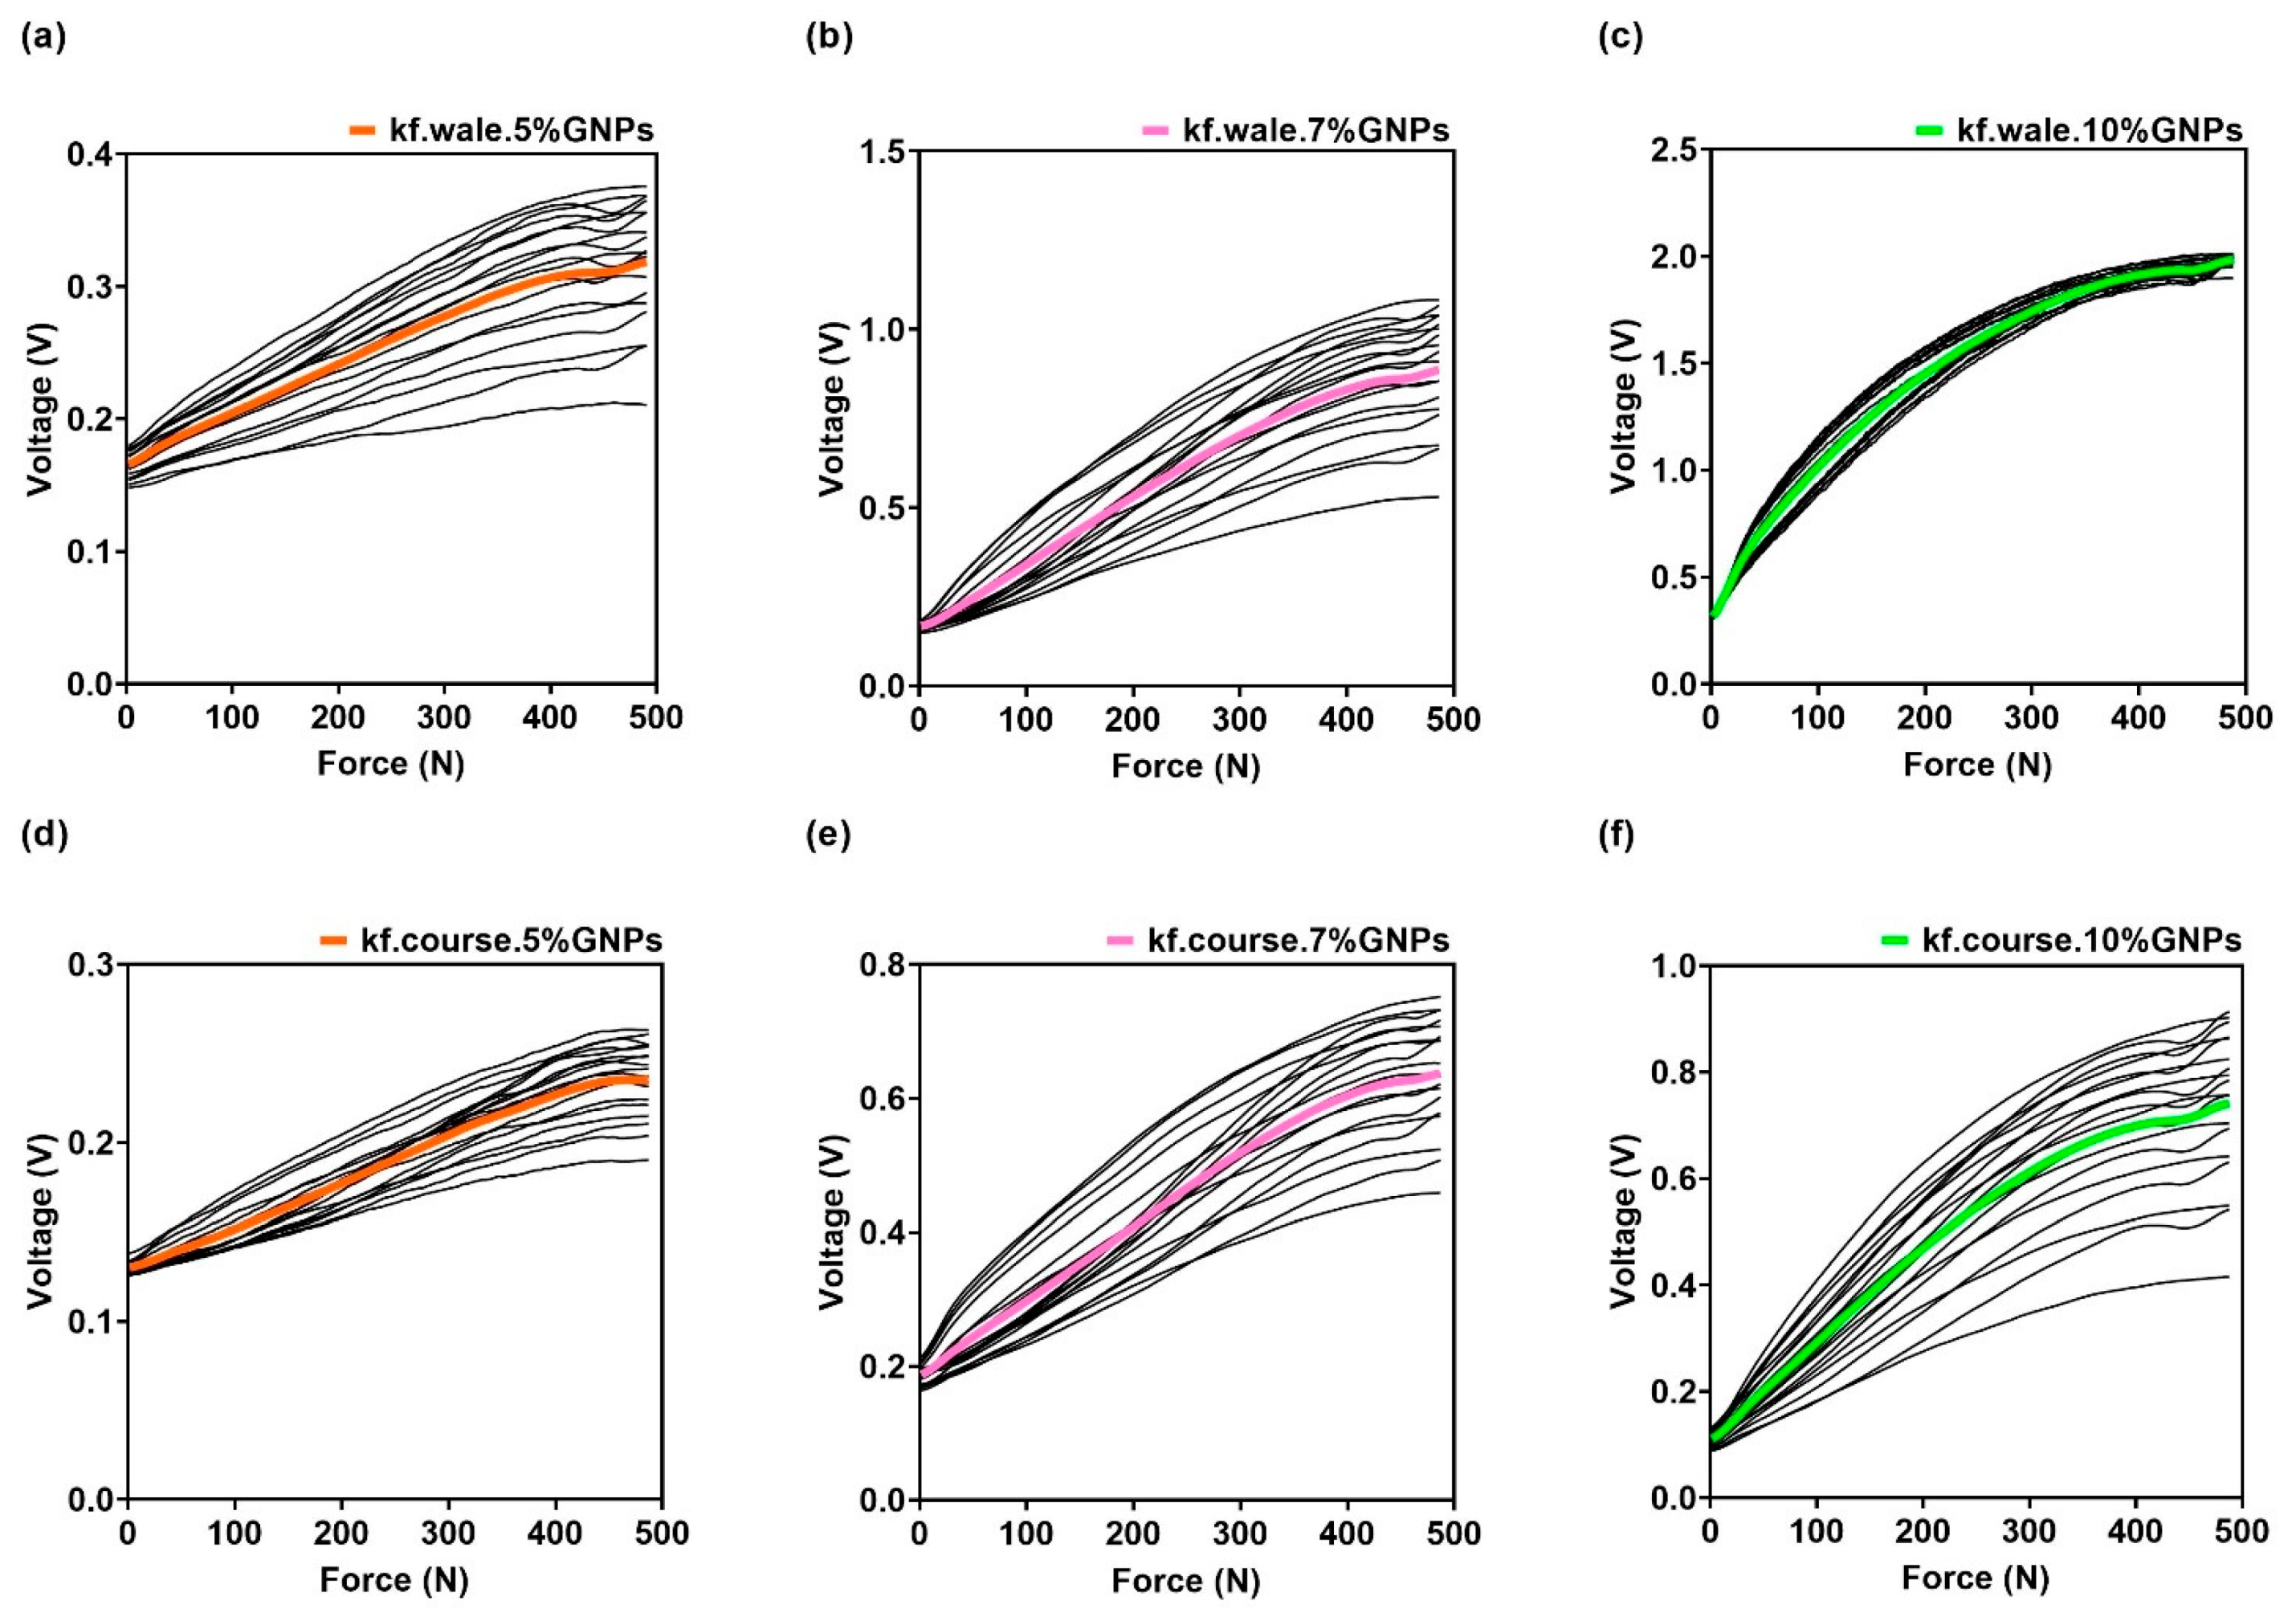
Piezoresistive Behaviour
- 1.
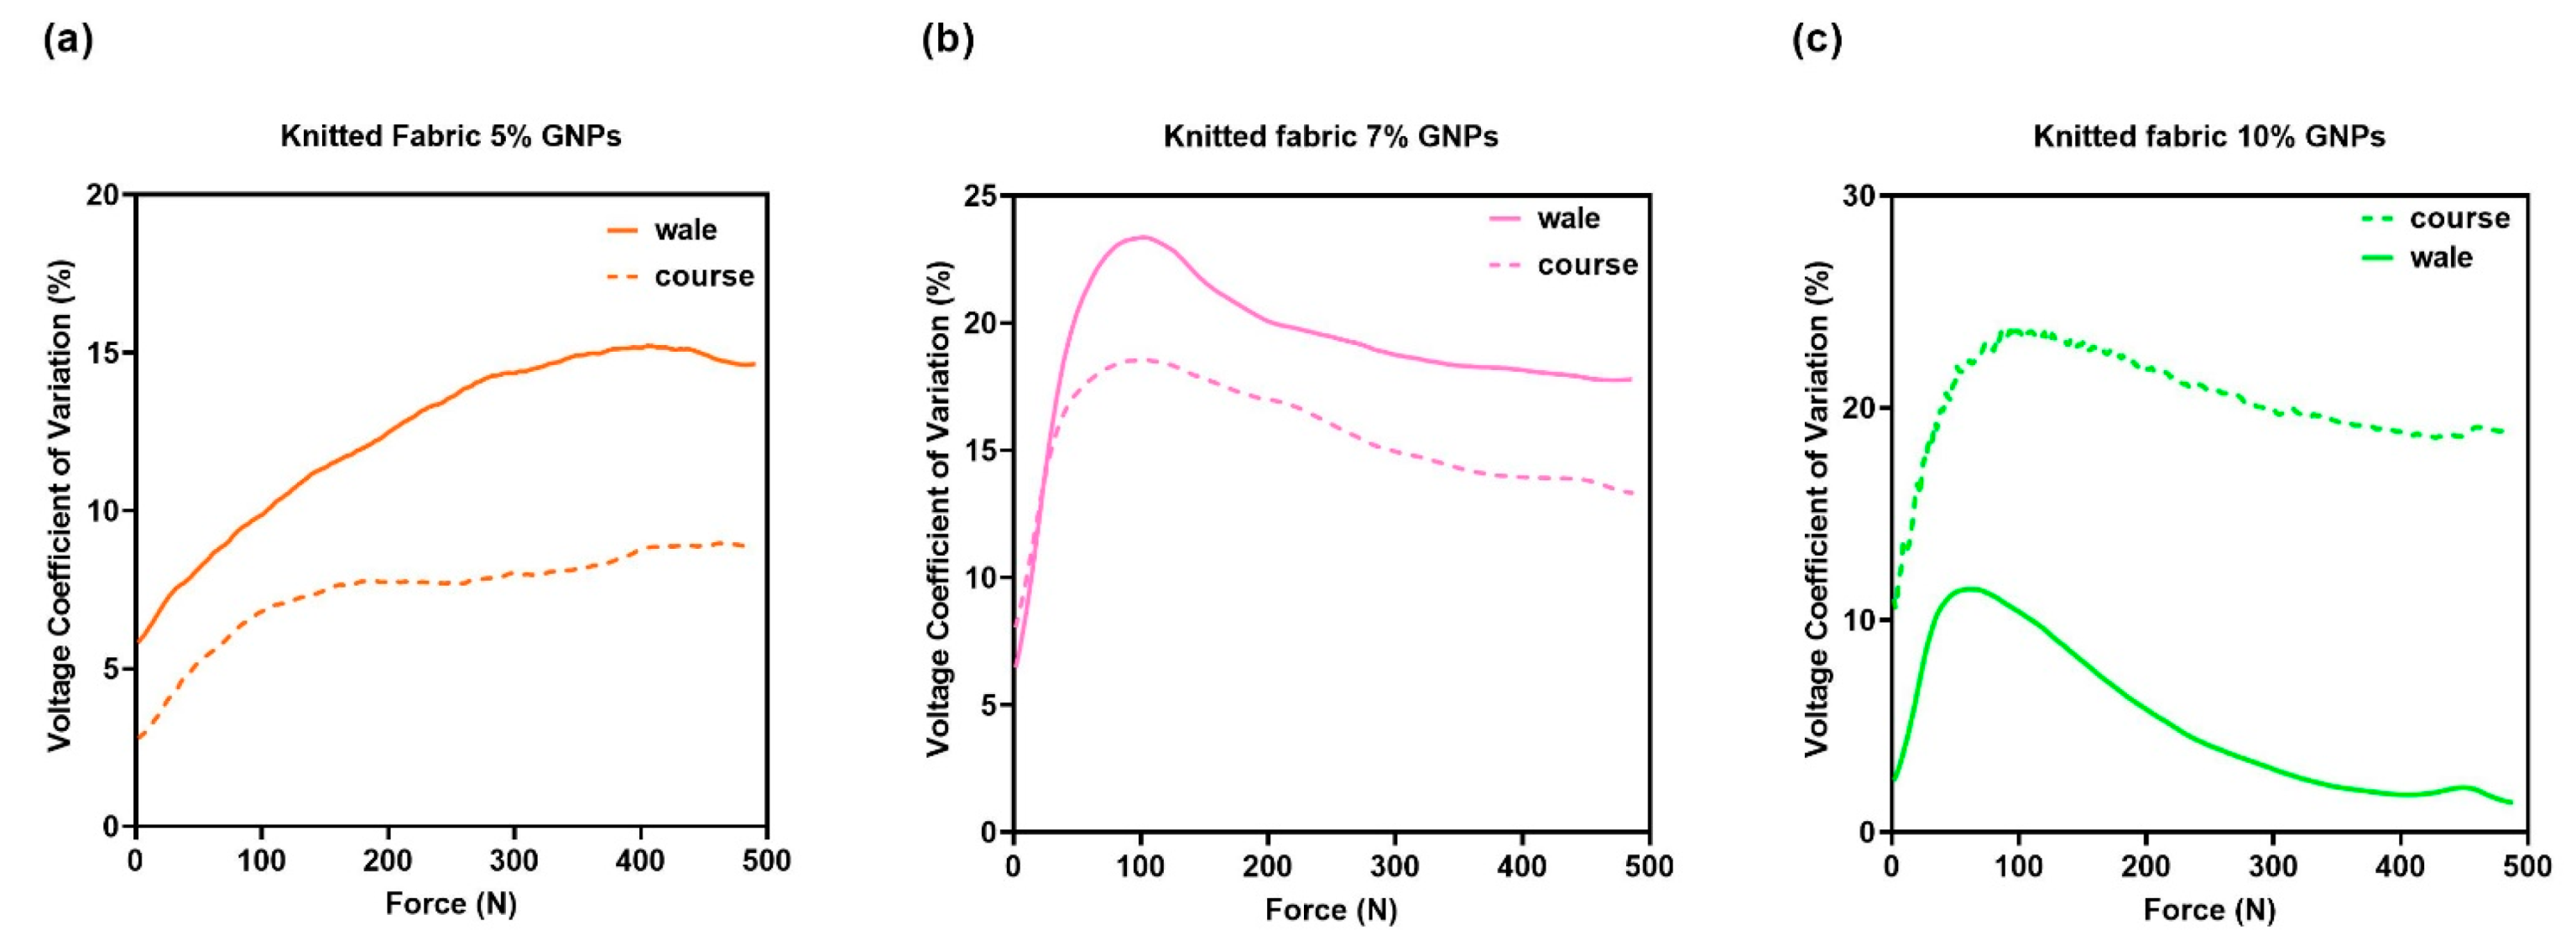
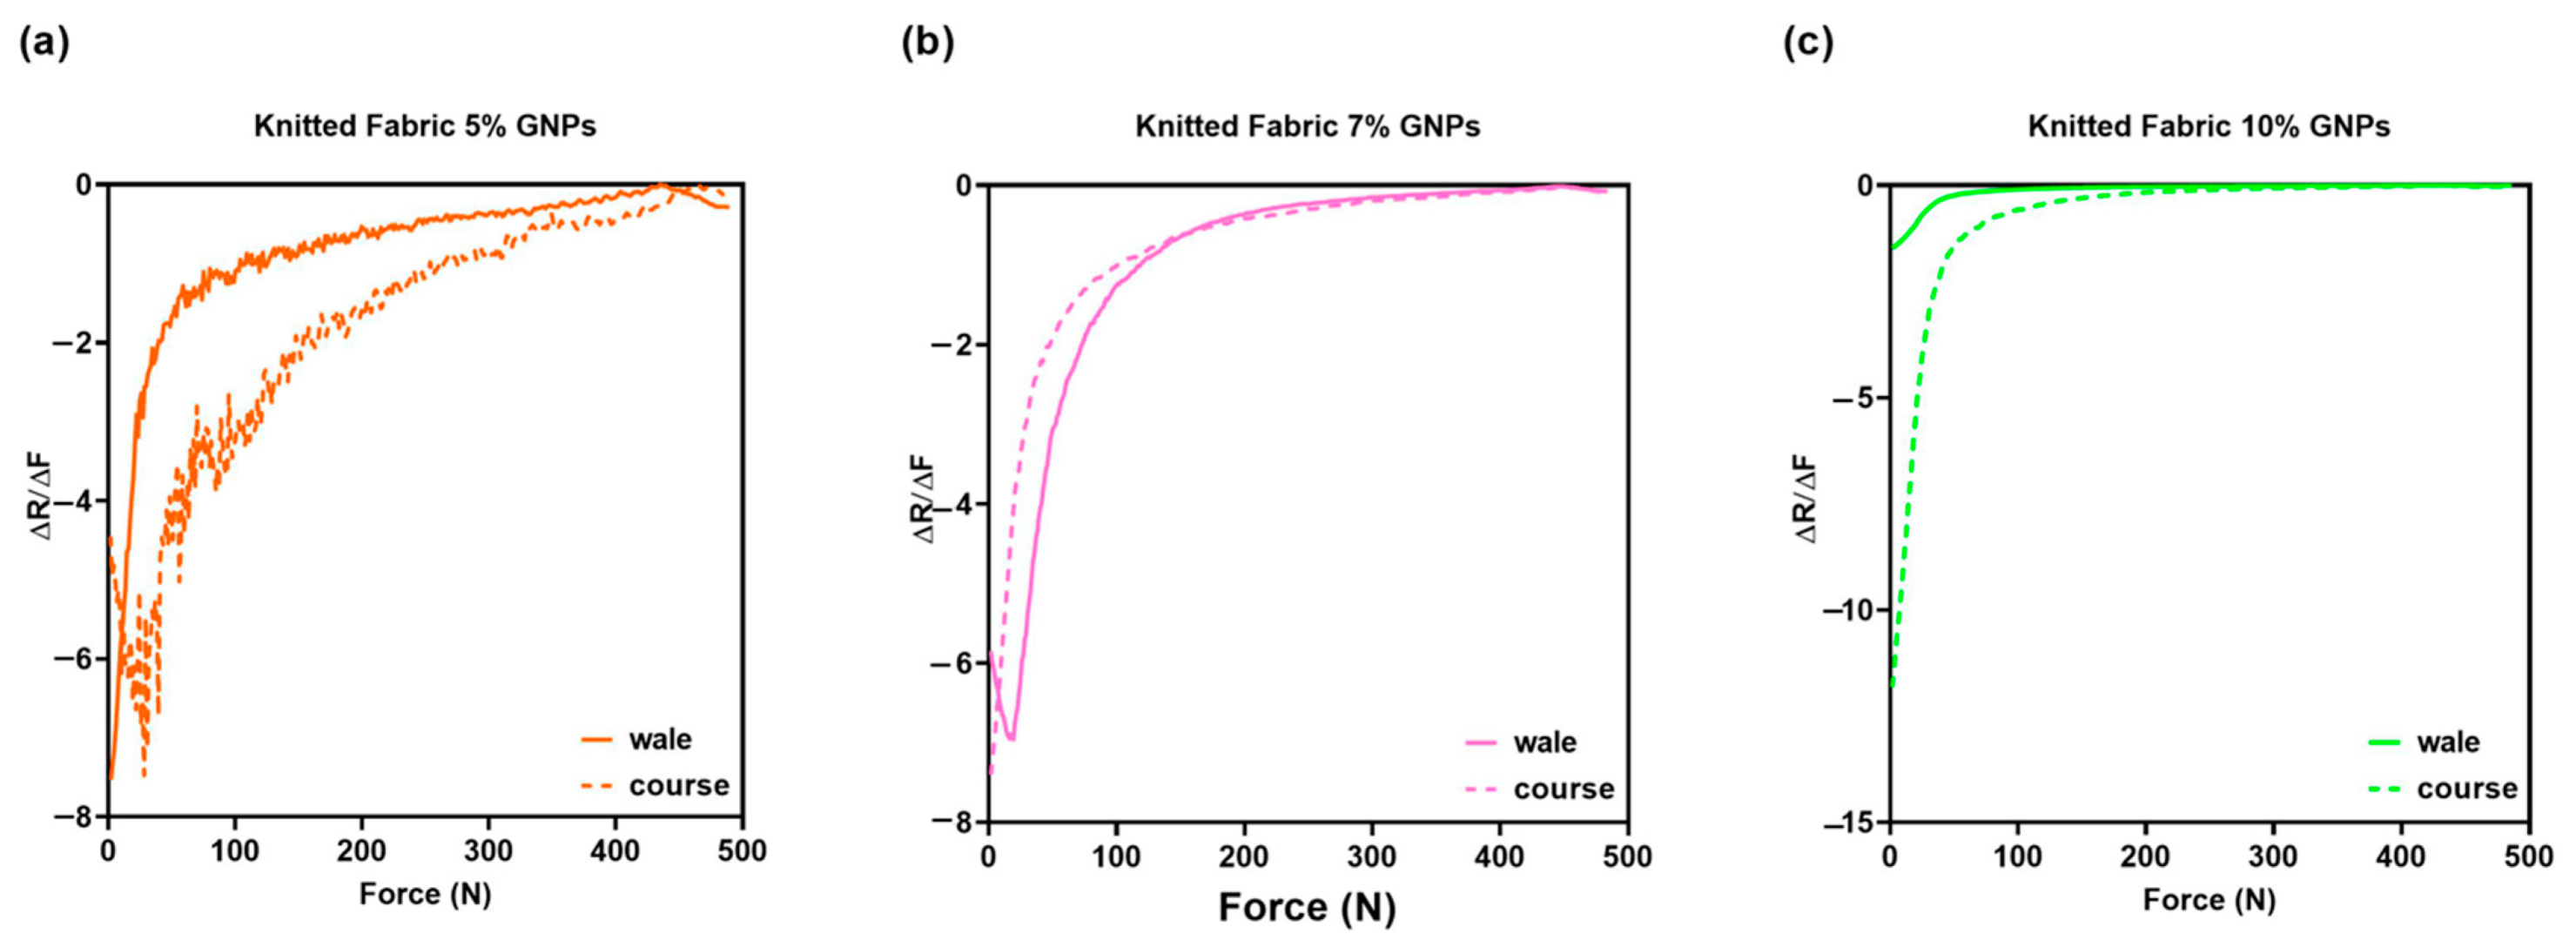
- Knitted fabric sensors
- 2.
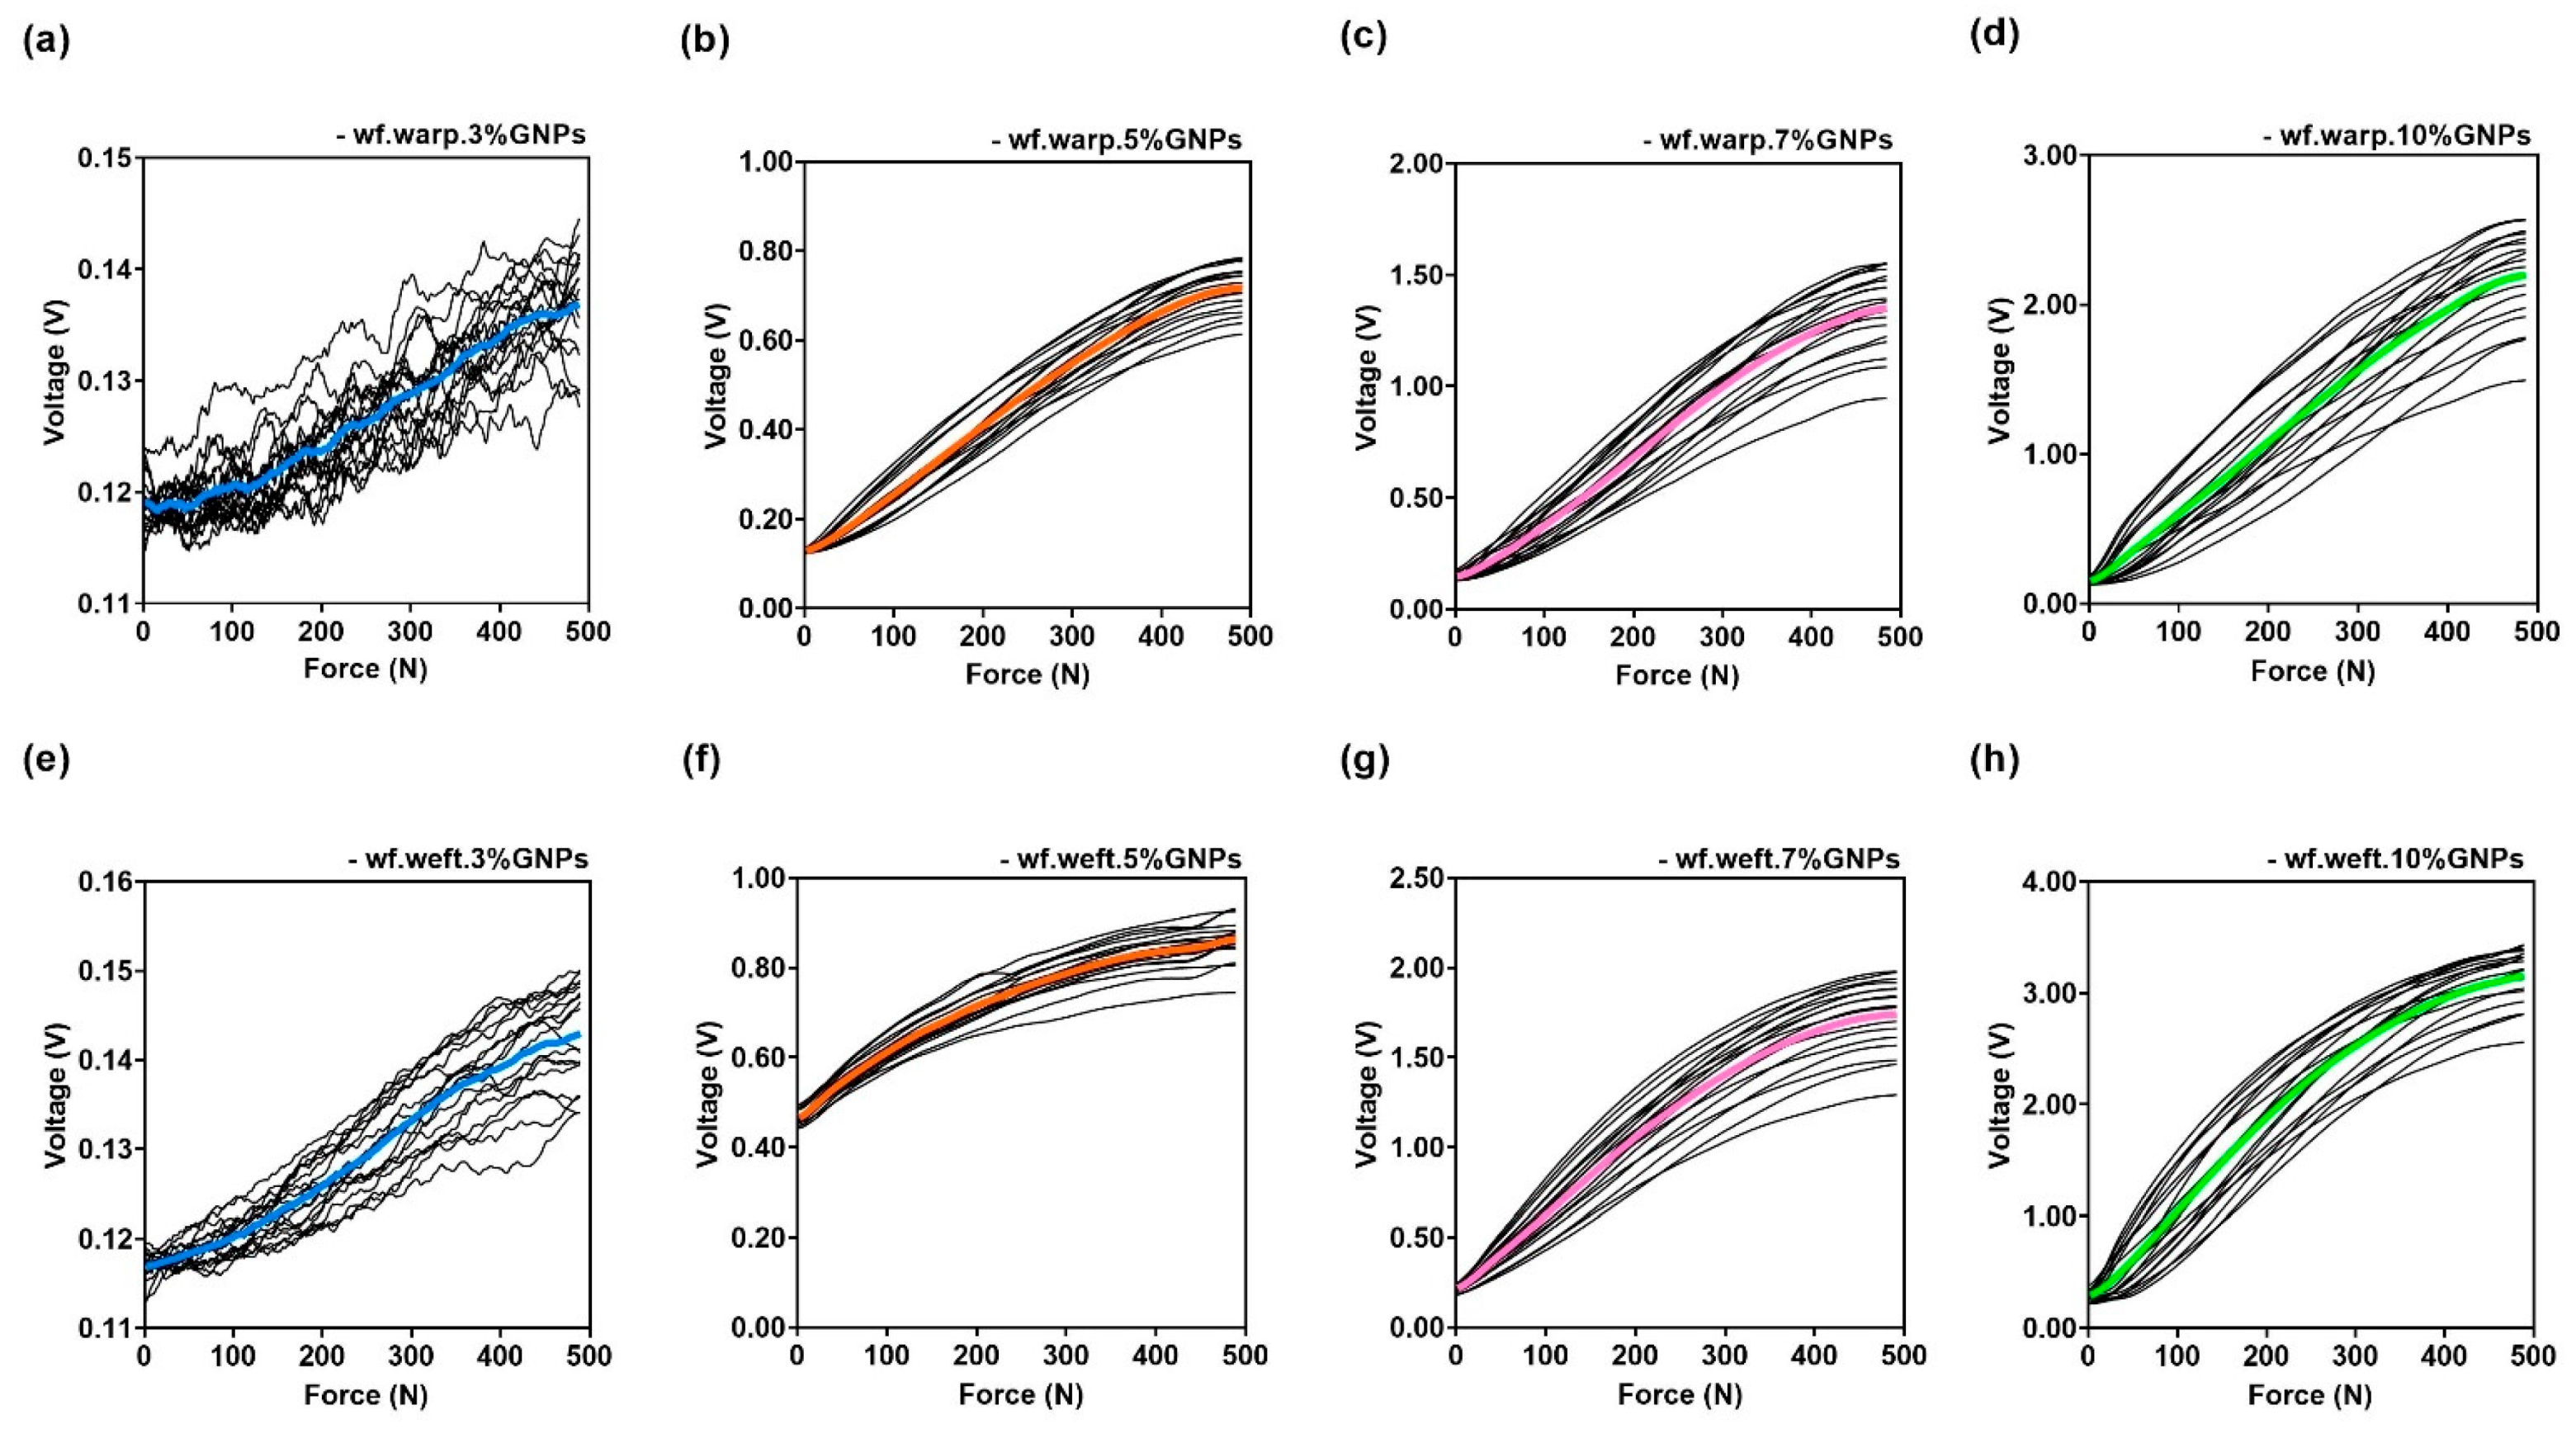
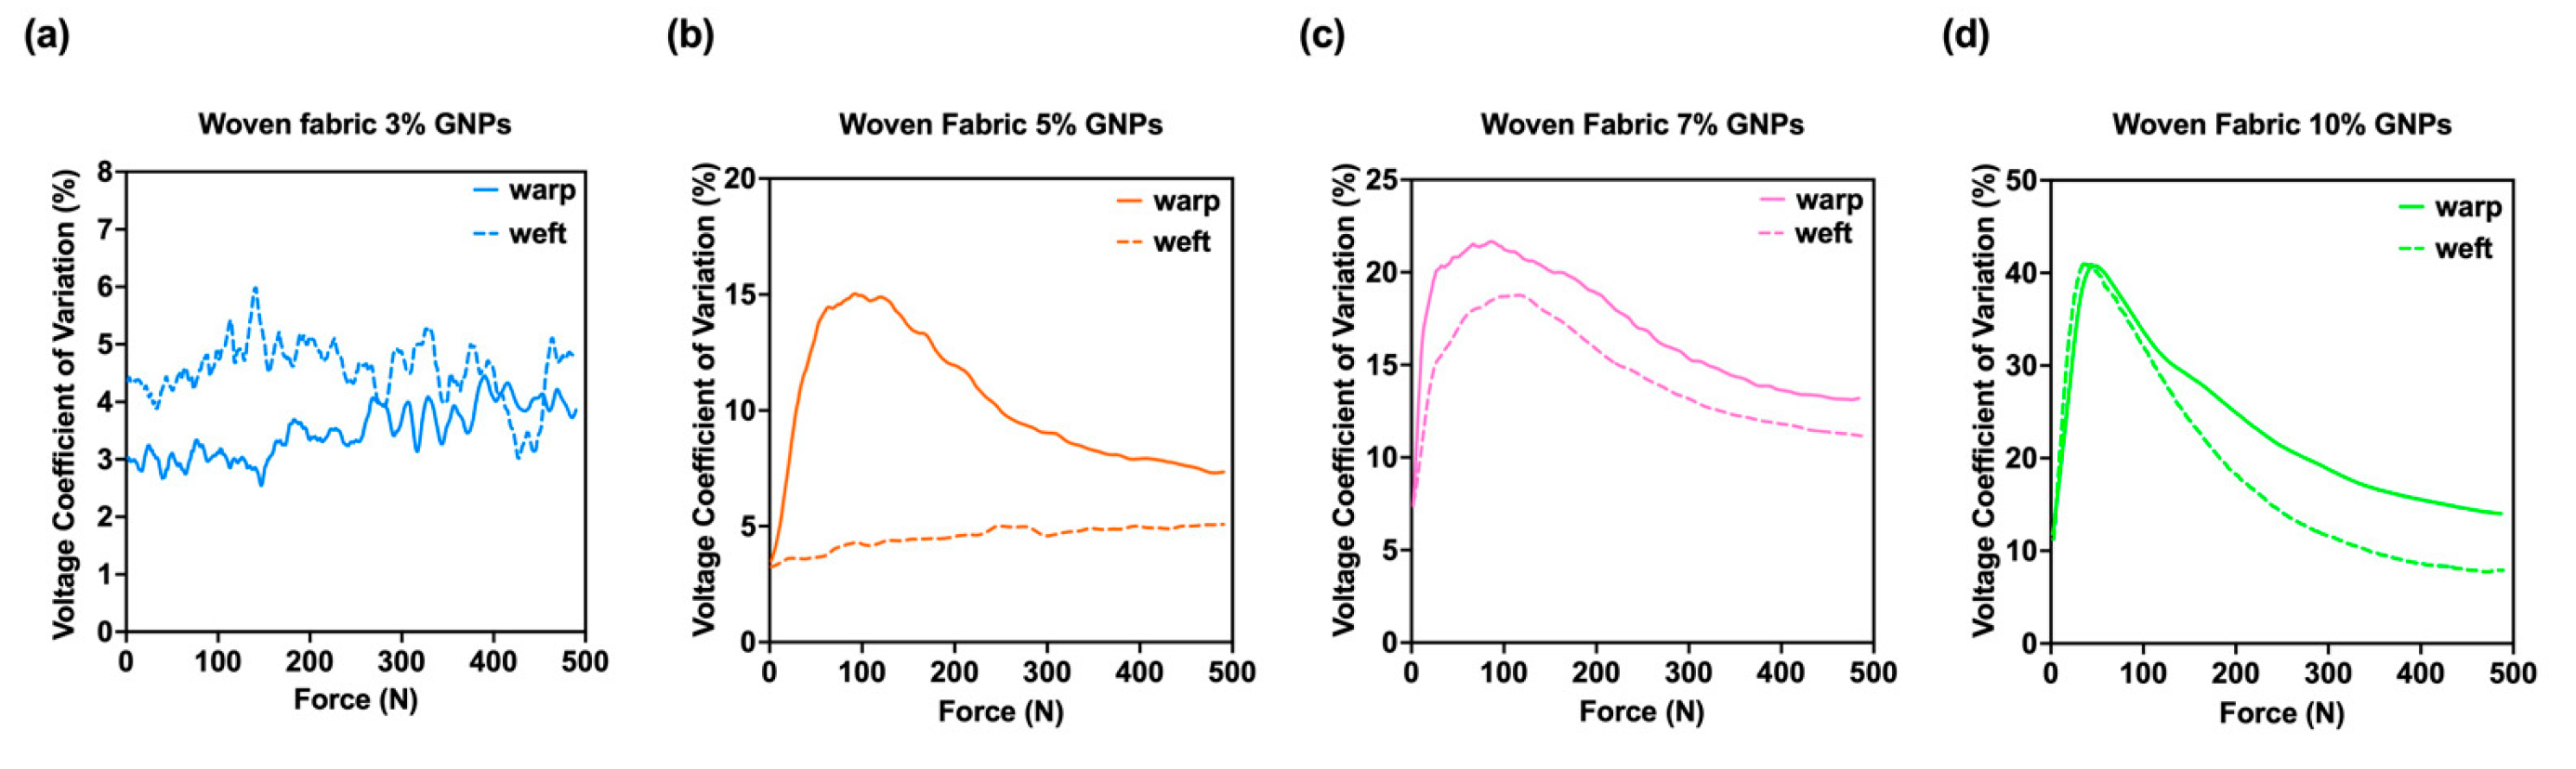
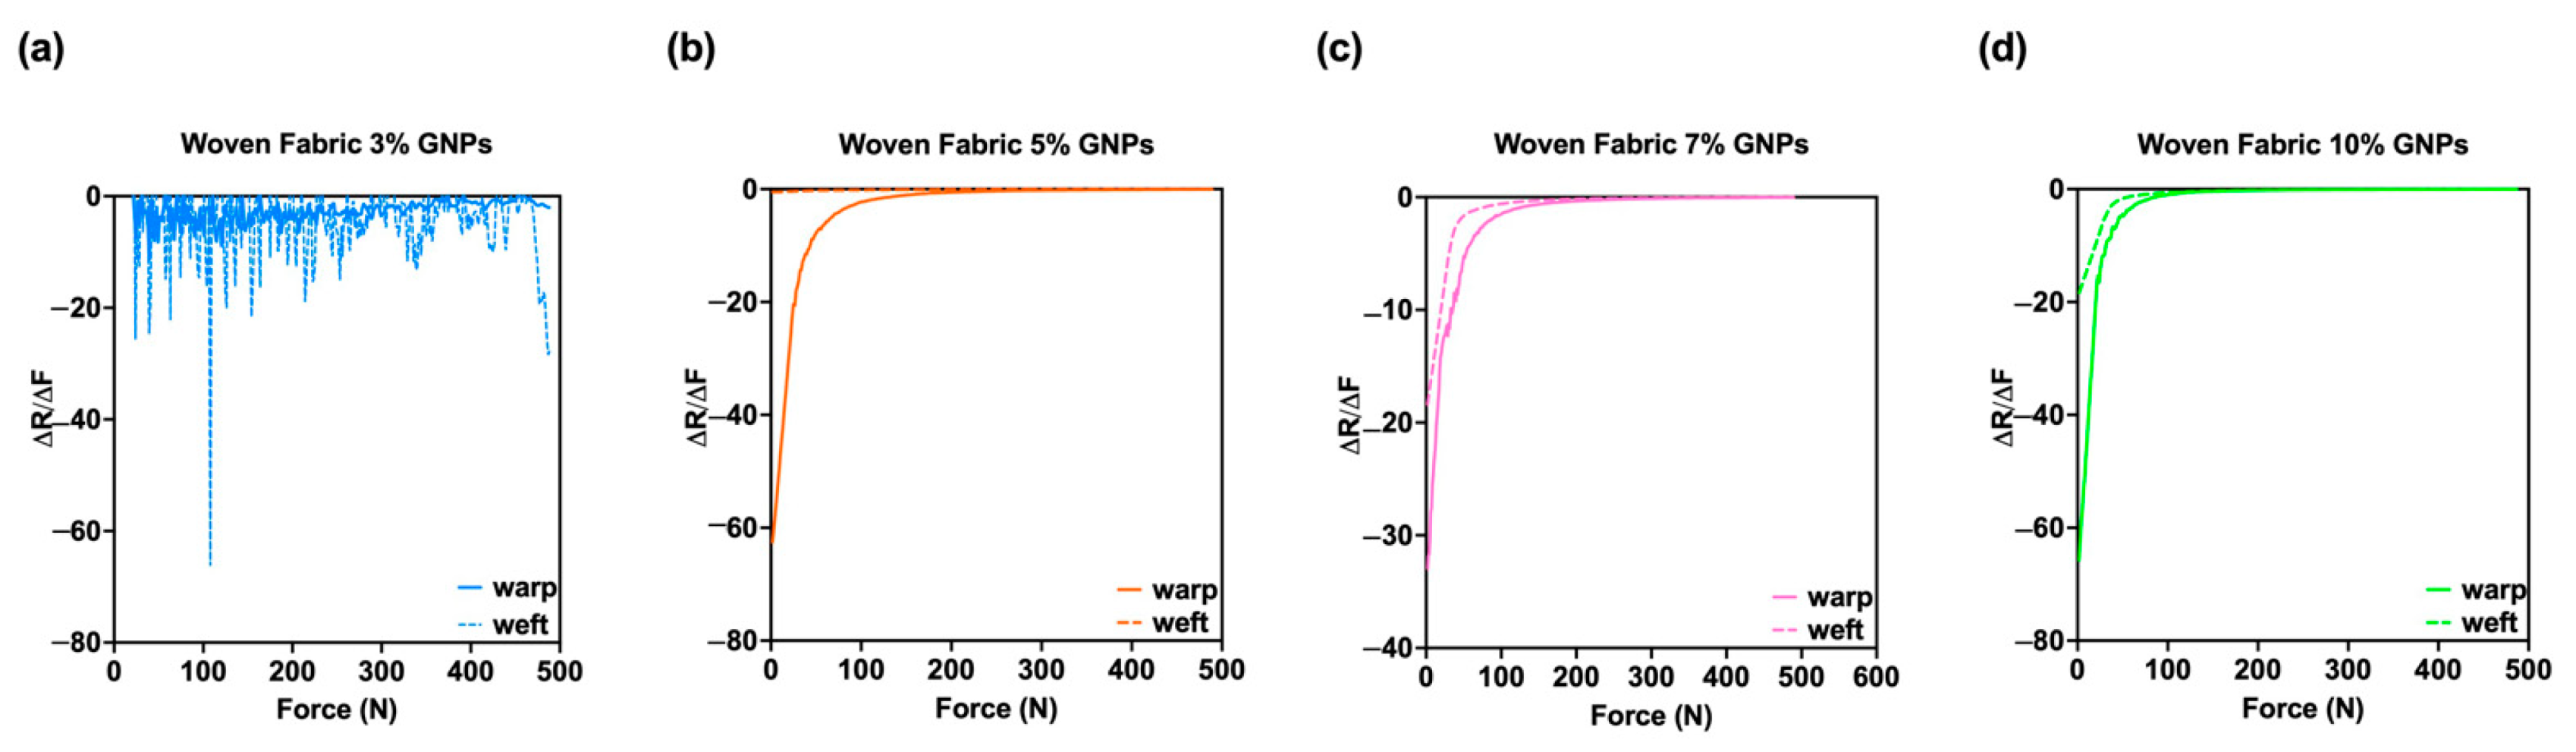
- Woven fabric sensors
4. Conclusions
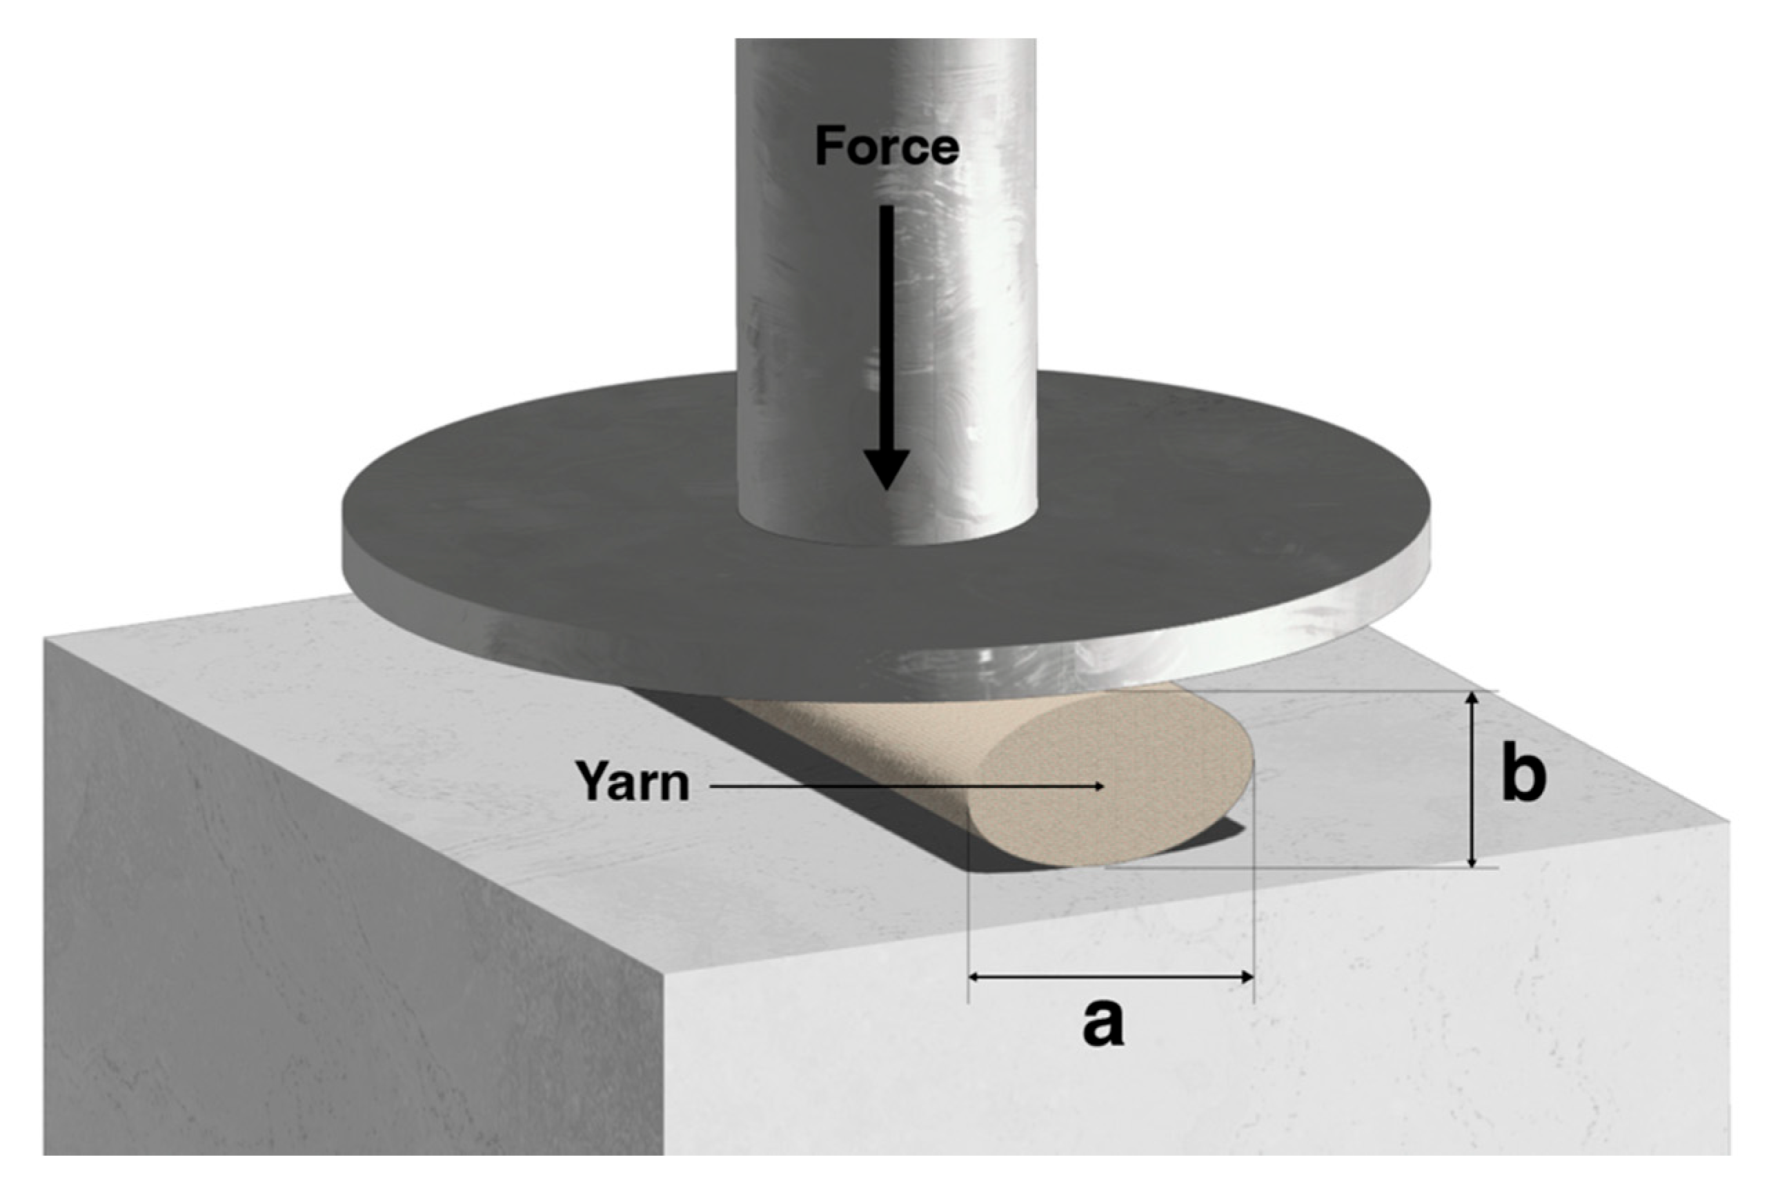
- In the transversal direction, coursewise for knitted and weftwise for woven fabrics, the friction phenomenon caused a lower CV%, suggesting that there is a correlation between higher RC and lower CV%;
- Crimp ratios and superior crossing zone per unit area provided by its warpwise density contributed to a higher sensitivity in woven fabrics, in the warpwise direction.
Author Contributions
Funding
Institutional Review Board Statement
Informed Consent Statement
Acknowledgments
Conflicts of Interest
References
- Esmail, A.; Poncet, F.; Auger, C.; Rochette, A.; Dahan-Oliel, N.; Labbé, D.; Kehayia, E.; Billebaud, C.; de Guise, É.; Lessard, I.; et al. The role of clothing on participation of persons with a physical disability: A scoping review. Appl. Ergon. 2020, 85, 103058. [Google Scholar] [CrossRef] [PubMed]
- Ullah, H.M.K.; Lejeune, J.; Cayla, A.; Monceaux, M.; Campagne, C.; Devaux, É. A review of noteworthy/major innovations in wearable clothing for thermal and moisture management from material to fabric structure. Text. Res. J. 2021, 1–36. [Google Scholar] [CrossRef]
- Sharaf, S.M. Smart conductive textile. In Advances in Functional and Protective Textiles; Elsevier Ltd.: Amsterdam, The Netherlands, 2020; pp. 141–167. [Google Scholar] [CrossRef]
- Lung, C.W.; Wu, F.L.; Liao, F.; Pu, F.; Fan, Y.; Jan, Y.K. Emerging technologies for the prevention and management of diabetic foot ulcers. J. Tissue Viability 2020, 29, 61–68. [Google Scholar] [CrossRef]
- Meng, K.; Xiao, X.; Wei, W.; Chen, G.; Nashalian, A.; Shen, S.; Xiao, X.; Chen, J. Wearable pressure sensors for pulse wave monitoring. Adv. Mater. 2022, 34, 2109357. [Google Scholar] [CrossRef] [PubMed]
- Pacchierotti, C.; Sinclair, S.; Solazzi, M.; Frisoli, A.; Hayward, V.; Prattichizzo, D. Wearable haptic systems for the fingertip and the hand: Taxonomy, review, and perspectives. IEEE Trans. Hapt. 2017, 10, 580–600. [Google Scholar] [CrossRef] [PubMed] [Green Version]
- Costa, J.C.; Spina, F.; Lugoda, P.; Garcia-Garcia, L.; Roggen, D.; Münzenrieder, N. Flexible sensors—From materials to applications. Technologies 2019, 7, 35. [Google Scholar] [CrossRef] [Green Version]
- Homayounfar, S.Z.; Andrew, T.L. Wearable sensors for monitoring human motion: A review on mechanisms, materials, and challenges. SLAS Technol. 2020, 25, 9–24. [Google Scholar] [CrossRef]
- He, J.; Zhang, Y.; Zhou, R.; Meng, L.; Chen, T.; Mai, W.; Pan, C. Recent advances of wearable and flexible piezoresistivity pressure sensor devices and its future prospects. J. Mater. 2020, 6, 86–101. [Google Scholar] [CrossRef]
- Xie, J.; Jia, Y.; Miao, M. High sensitivity knitted fabric bi-directional pressure sensor based on conductive blended yarn. Smart Mater. Struct. 2019, 28, 035017. [Google Scholar] [CrossRef]
- Kawabata, S.; Niwa, M.; Kawai, H. 3—The finite-deformation theory of plain-weave fabrics part I: The biaxial-deformation theory. J. Text. Inst. 1973, 64, 21–46. [Google Scholar] [CrossRef]
- Fraden, J. Handbook of Modern Sensors, 3rd ed.; Springer: Berlin/Heidelberg, Germany; San Diego, CA, USA, 2004. [Google Scholar] [CrossRef]
- Fiorillo, A.S.; Critello, C.D.; Pullano, A.S. Theory, technology and applications of piezoresistive sensors: A review. Sens. Actuators A Phys. 2018, 281, 156–175. [Google Scholar] [CrossRef]
- Li, Y.Q.; Huang, P.; Zhu, W.B.; Fu, S.Y.; Hu, N.; Liao, K. Flexible wire-shaped strain sensor from cotton thread for human health and motion detection. Sci. Rep. 2017, 7, 1–7. [Google Scholar] [CrossRef]
- Grancarić, A.M.; Jerković, I.; Koncar, V.; Cochrane, C.; Kelly, F.M.; Soulat, D.; Legrand, X. Conductive polymers for smart textile applications. J. Ind. Text. 2018, 48, 612–642. [Google Scholar] [CrossRef]
- Mármol, G.; Sanivada, U.K.; Fangueiro, R. Effect of GNPs on the piezoresistive, electrical and mechanical properties of PHA and PLA films. Fibers 2021, 9, 86. [Google Scholar] [CrossRef]
- Marsden, A.J.; Papageorgiou, D.G.; Valles, C.; Liscio, A.; Palermo, V.; Bissett, M.A.; Young, R.J.; Kinloch, I.A. Electrical percolation in graphene–polymer composites. 2D Mater. 2018, 5, 032003. [Google Scholar] [CrossRef] [Green Version]
- Jiménez-Suárez, A.; Prolongo, S.G. Graphene nanoplatelets. Appl. Sci. 2020, 10, 1753. [Google Scholar] [CrossRef] [Green Version]
- Shen, J.; Hu, Y.; Li, C.; Qin, C.; Ye, M. Synthesis of amphiphilic graphene nanoplatelets. Small 2009, 5, 82–85. [Google Scholar] [CrossRef] [PubMed]
- Kamedulski, P.; Truszkowski, S.; Lukaszewicz, J.P. Highly effective methods of obtaining N-doped graphene by gamma irradiation. Materials 2020, 13, 4975. [Google Scholar] [CrossRef] [PubMed]
- Pereira, P.; Ferreira, D.P.; Araújo, J.C.; Ferreira, A.; Fangueiro, R. The potential of graphene nanoplatelets in the development of smart and multifunctional ecocomposites. Polymers 2020, 12, 2189. [Google Scholar] [CrossRef]
- Wei, Y.; Chen, S.; Lin, Y.; Yang, Z.; Liu, L. Cu–Ag core–shell nanowires for electronic skin with a petal molded microstructure. J. Mater. Chem. C 2015, 3, 9594–9602. [Google Scholar] [CrossRef]
- Carvalho, H.; Yao, Y.; Gonçalves, L.M. Flexible force sensors for e-textiles. IOP Conf. Ser. Mater. Sci. Eng. 2017, 254, 3–8. [Google Scholar] [CrossRef]
- Tokarska, M. Characterization of electro-conductive textile materials by its biaxial anisotropy coefficient and resistivity. J. Mater. Sci. Mater. Electron. 2019, 30, 4093–4103. [Google Scholar] [CrossRef] [Green Version]
- Çiplak, Z.; Yildiz, N.; Cąlimli, A. Investigation of graphene/Ag nanocomposites synthesis parameters for two different synthesis methods. Fuller. Nanotub. Carbon Nanostructur. 2015, 23, 361–370. [Google Scholar] [CrossRef]
- Zhang, G.; Zhang, H.; Zhang, X.; Zhu, S.; Zhang, L.; Meng, Q.; Wang, M.; Li, Y.; Yang, B. Embedding graphene nanoparticles into poly (N, N′-dimethylacrylamine) to prepare transparent nanocomposite films with high refractive index. J. Mater. Chem. 2012, 22, 21218–21224. [Google Scholar] [CrossRef]
- Socrates, G. Infrared and Raman Characteristic Group Frequencies, 3rd ed.; Wiley: Hoboken, NJ, USA, 2001. [Google Scholar]
- Tanevska, V.; Colomban, P.; Minceva-Sukarova, B.; Grupce, O. Characterization of pottery from the Republic of Macedonia I: Raman analyses of Byzantine glazed pottery excavated from Prilep and Skopje (12th–14th century). J. Raman Spectrosc. 2009, 40, 1240–1248. [Google Scholar] [CrossRef]
- Shazali, S.S.; Rozali, S.; Amiri, A.; Zubir, M.N.M.; Sabri, M.F.M.; Zabri, M.Z. Evaluation on stability and thermophysical performances of covalently functionalized graphene nanoplatelets with xylitol and citric acid. Mater. Chem. Phys. 2018, 212, 363–371. [Google Scholar] [CrossRef]
- Francavilla, P.; Ferreira, D.P.; Ara, J.C.; Fangueiro, R. Smart fibrous structures produced by electrospinning using the combined effect of pcl/graphene nanoplatelets. Appl. Sci. 2021, 11, 1124. [Google Scholar] [CrossRef]
- Sanivada, U.K.; Esteves, D.; Arruda, L.M.; Silva, C.A.; Moreira, I.P.; Fangueiro, R. Joule-heating effect of thin films with carbon-based nanomaterials. Materials 2022, 15, 4323. [Google Scholar] [CrossRef]
- Wang, X.; Xu, W.; Li, W.; Cui, W. Study on the electrical resistance of textiles under wet conditions. Text. Res. J. 2009, 79, 753–760. [Google Scholar] [CrossRef]
- Bosque, A.D.; Xoan, F.S.-R.; Sánchez, M.; Alejandro, U. Wearable sensors based on graphene nanoplatelets reinforced polydimethylsiloxane for human motion monitoring: Analysis of crack propagation and cycling load monitoring. Chemosensors 2022, 10, 75. [Google Scholar] [CrossRef]
- Georgousis, G.; Pandis, C.; Kalamiotis, A.; Georgiopoulos, P.; Kyritsis, A.; Kontou, E.; Pissis, P. Strain sensing in polymer/carbon nanotube composites by electrical resistance measurement. Compos. Part B 2015, 68, 162–169. [Google Scholar] [CrossRef]
- De Jong, S.; Snaith, J.W.; Michie, N.A. A mechanical model for the lateral compression of woven fabrics. Text. Res. J. 1986, 56, 759–767. [Google Scholar] [CrossRef]
- Senior, F. Review on compression properties of textile materials. J. Emerg. Technol. Innov. Res. 2021, 8, 799–806. [Google Scholar]
- Atalie, D.; Rotich, G.K. Impact of cotton parameters on sensorial comfort of woven fabrics. Res. J. Text. Appar. 2020, 24, 281–302. [Google Scholar] [CrossRef]
- Guru, R.; Kumar Varshney, R.; Kumar, R. Compression and Recovery Functional Application for the Sportswear Fabric; IntechOpen: London, UK, 2022. [Google Scholar] [CrossRef]
- Knezić, Ž.; Penava, Ž.; Penava, D.Š.; Rogale, D. The impact of elongation on change in electrical resistance of electrically conductive yarns woven into fabric. Materials 2021, 14, 3390. [Google Scholar] [CrossRef] [PubMed]
- Basov, M. Development of high-sensitivity pressure sensor with on-chip differential transistor amplifier. J. Micromechan. Microeng. 2020, 30, 065001. [Google Scholar] [CrossRef]
- Kumar, S.; Ropmay, G.D.; Rathore, P.K.; Rangababu, P.; Akhtar, J. Sensitivity enhancement of P-and N-MOS based current mirror pressure sensor using differential amplifier. In AIP Conference Proceedings; AIP Publishing LLC: Melville, NY, USA, 2020; Volume 2294. [Google Scholar] [CrossRef]


| Knitted Fabric | Woven Fabric | ||
|---|---|---|---|
| Walewise density | 12 cm−1 | Warpwise density | 32 cm−1 |
| Coursewise density | 26 cm−1 | Weftwise density | 29 cm−1 |
| Wale yarn | 20.25 Tex | Warp yarn | 19.59 Tex |
| Course yarn | 20.25 Tex | Weft yarn | 17.31 Tex |
| Loop length | 0.22 cm | - | - |
| Thickness | 0.48 mm | Thickness | 0.21 mm |
| Mass per unit surface | 145.6 g/m2 | Mass per unit surface | 122 g/m2 |
| Sample | Thickness (mm) ± S.D | Sample | Thickness (mm) ± S.D |
|---|---|---|---|
| K.F | 0.50 ± 0.006 | W.F | 0.25 ± 0.011 |
| K.F.C | 0.57 ± 0.00 | W.F.C | 0.28 ± 0.009 |
| K.F.C + 2% GNPs | 0.56 ± 0.007 | W.F.C + 2% GNPs | 0.28 ± 0.005 |
| K.F.C + 3% GNPs | 0.57 ± 0.008 | W.F.C + 3% GNPs | 0.28 ± 0.005 |
| K.F.C + 5% GNPs | 0.57 ± 0.011 | W.F.C + 5% GNPs | 0.28 ± 0.004 |
| K.F.C + 7% GNPs | 0.57 ± 0.007 | W.F.C + 7% GNPs | 0.29 ± 0.004 |
| K.F.C + 10% GNPs | 0.58 ± 0.010 | W.F.C + 10% GNPs | 0.30 ± 0.006 |
| K.F.C + 15% GNPs | 0.60 ± 0.010 | W.F.C + 15% GNPs | 0.35 ± 0.028 |
| Sample | ID/IG | I2D/IG | Sample | ID/IG | I2D/IG |
|---|---|---|---|---|---|
| GNPs Powder | 0.13 | 0.88 | - | - | - |
| K.F + 2% GNPs | 0.04 | 1.10 | W.F + 2% GNPs | 0.22 | 0.44 |
| K.F + 3% GNPs | 0.06 | 0.44 | W.F + 3% GNPs | 0.22 | 0.59 |
| K.F + 5% GNPs | 0.13 | 1.11 | W.F + 5% GNPs | 0.15 | 0.79 |
| K.F + 7% GNPs | 0.17 | 0.75 | W.F + 7% GNPs | 0.19 | 0.67 |
| K.F + 10% GNPs | 0.23 | 0.73 | W.F + 10% GNPs | 0.21 | 0.84 |
| K.F + 15% GNPs | 0.28 | 1.01 | W.F + 15% GNPs | 0.22 | 0.80 |
Publisher’s Note: MDPI stays neutral with regard to jurisdictional claims in published maps and institutional affiliations. |
© 2022 by the authors. Licensee MDPI, Basel, Switzerland. This article is an open access article distributed under the terms and conditions of the Creative Commons Attribution (CC BY) license (https://creativecommons.org/licenses/by/4.0/).
Share and Cite
Arruda, L.M.; Moreira, I.P.; Sanivada, U.K.; Carvalho, H.; Fangueiro, R. Development of Piezoresistive Sensors Based on Graphene Nanoplatelets Screen-Printed on Woven and Knitted Fabrics: Optimisation of Active Layer Formulation and Transversal/Longitudinal Textile Direction. Materials 2022, 15, 5185. https://doi.org/10.3390/ma15155185
Arruda LM, Moreira IP, Sanivada UK, Carvalho H, Fangueiro R. Development of Piezoresistive Sensors Based on Graphene Nanoplatelets Screen-Printed on Woven and Knitted Fabrics: Optimisation of Active Layer Formulation and Transversal/Longitudinal Textile Direction. Materials. 2022; 15(15):5185. https://doi.org/10.3390/ma15155185
Chicago/Turabian StyleArruda, Luisa M., Inês P. Moreira, Usha Kiran Sanivada, Helder Carvalho, and Raul Fangueiro. 2022. "Development of Piezoresistive Sensors Based on Graphene Nanoplatelets Screen-Printed on Woven and Knitted Fabrics: Optimisation of Active Layer Formulation and Transversal/Longitudinal Textile Direction" Materials 15, no. 15: 5185. https://doi.org/10.3390/ma15155185