
Removal of Cr(VI) from Wastewater Using Graphene Oxide Chitosan Microspheres Modified with α–FeO(OH)
by
 , and
, and
Yunquan Liu
1,2,3 ,
,
Huimei Shan
1,2,3,*,
Chunya Zeng
1,2,3,
Hongbin Zhan
4,* and
Yanyue Pang
1,2,3 1
Guangxi Key Laboratory of Environmental Pollution Control Theory and Technology, Guilin University of Technology, Guilin 541004, China
2
Collaborative Innovation Center of Water Pollution Control and Water Security in Karst Area, Guilin University of Technology, Guilin 541004, China
3
College of Environmental Science and Engineering, Guilin University of Technology, Guilin 541004, China
4
Department of Geology and Geophysics, Texas A&M University, College Station, TX 77843, USA
*
Authors to whom correspondence should be addressed.
Materials 2022, 15(14), 4909; https://doi.org/10.3390/ma15144909
Submission received: 9 June 2022
/
Revised: 5 July 2022
/
Accepted: 12 July 2022
/
Published: 14 July 2022
Abstract
:Graphene oxide and chitosan microspheres modified with α–FeO(OH) (α–FeO(OH)/GOCS) are prepared and utilized to investigate the performance and mechanism for Cr(VI) removal from aqueous solutions and the possibility of Fe secondary pollution. Batch experiments were carried out to identify the effects of pH, mass, and volume ratio (m/v), coexisting ions, time (t), temperature (T), and Cr(VI) initial concentration (C0) on Cr(VI) removal, and to evaluate adsorption kinetics, equilibrium isotherm, and thermodynamics, as well as the possibility of Fe secondary pollution. The results showed that Cr(VI) adsorption increased with C0, t, and T but decreased with increasing pH and m/v. Coexisting ions inhibited Cr(VI) adsorption, and this inhibition increased with increasing concentration. The influence degrees of anions and cations on the Cr(VI) adsorption in descending order were SO42− > PO42− > NO3− > Cl− and Ca2+ > Mg2+ > Mn2+, respectively. The equilibrium adsorption capacity of Cr(VI) was the highest at 24.16 mg/g, and the removal rate was 97.69% under pH = 3, m/v = 1.0 g/L, T = 298.15 K, and C0 = 25 mg/L. Cr(VI) adsorption was well fitted to a pseudo-second-order kinetic model and was spontaneous and endothermic. The best fit of Cr(VI) adsorption with the Langmuir and Sips models indicated that it was a monolayer and heterogeneous adsorption. The fitted maximum adsorption capacity was 63.19 mg/g using the Sips model under 308.15 K. Cr(VI) removal mainly included electrostatic attraction between Cr(VI) oxyanions with surface Fe–OH2+, and the adsorbed Cr(VI) was partially reduced to Cr(III) and then precipitated on the surface. In addition, there was no Fe secondary pollution during Cr(VI) adsorption.
1. Introduction
Heavy metal pollution in wastewater is becoming severe with the rapid development of industry and has become a widespread concern worldwide. Heavy metals mostly refer to elements with significant biological toxicity, such as mercury, cadmium, lead, chromium, and metal-like arsenic [1]. Chromium pollution is an increasingly prominent problem and widely occurs in industrial wastewater, involving metal processing, leather tanning, electroplating, and pigment manufacturing [2]. The two main oxidation states of chromium in wastewater are hexavalent chromium (Cr(VI)) and trivalent chromium (Cr(III)) [3], and Cr(VI) is more dangerous to human health because it has stronger carcinogenicity, teratogenicity, and mutagenicity [4]. The species of Cr(VI) in wastewater include CrO42−, Cr2O72−, HCrO4−, and H2CrO4 [5]. The World Health Organization (WHO) has suggested that the limitation of chromium concentration in drinking water is 0.05 mg/L [6]. Therefore, it is necessary to develop effective methods to remove Cr(VI) from wastewater.
Recently, many methods have been applied to remove Cr(VI) from wastewater, including chemical precipitation, electrolysis, ion exchange, membrane filtration, adsorption, and photocatalytic reduction [7,8,9,10]. The adsorption method is regarded as one of the most popular methods due to its advantages of simple operation, low energy consumption, and environmental friendliness [11]. Many traditional adsorption materials have been widely used for Cr(VI) removal, including activated carbon [12], zeolite [13], clay minerals [14] and ion exchange resins [15], etc. Although these materials are highly efficient in removing Cr(VI), they are difficult to recycle and may cause secondary pollution problems [16]. Therefore, it is necessary to design and develop new types of adsorbents with better stability and to avoid secondary pollution.
Graphene oxide (GO) is a new nanomaterial that has a large surface area (theoretically ~2600 m2/g) [17] and is rich in oxygen functional groups (such as −OH, −C=O, and −COOH) that can bind well with heavy metal ions [18]. In addition, it has been confirmed that the modification of GO surface functional groups has a positive effect on Cr(VI) removal [19]. However, GO also has some limitations, such as poor separation and easy self-aggregation [20]. Therefore, it is necessary to overcome the above disadvantages by combining them with biomass materials [21,22]. Chitosan (CS) is a biomass material with great potential for Cr(VI) wastewater treatment. On the one hand, CS is a naturally degradable polymer material widely obtained from animal carapaces [23]. In addition, there are abundant amino and hydroxyl groups on the CS molecular chain that coordinate and chelate with heavy metal ions independently and assemble and modify with GO as well [20,24,25].
At present, using GO or CS as precursors and combining them with some materials has become an important way to develop high-performance Cr(VI) removal composites [16]. This can not only enrich the functional groups but also improve the stability and adsorption performance of composite materials [25,26,27]. For example, the research of Yaşar et al. (2009) showed that the maximum adsorption capacity of Cr(VI) on flake CS was 7.94 mg/g [28]. Melvin et al. (2019) used a CS-grafted GO nanocomposite to remove Cr(VI) [29]. The adsorption capacity for Cr(VI) was as high as 104.16 mg/g. Singh et al. (2022) prepared a novel nanocomposite by immobilizing CaO nanoparticles on the surface of GO, and the adsorption capacity of Cr(VI) was 38.04 mg/g [30]. Sheth et al. (2022) prepared a novel composite (CS-[BMIM] [OAc]) by modifying the CS with 1-butyl-3-methylimidazolium acetate. The adsorption capacity of Cr(VI) was 125.63 mg/g [31]. In addition, iron-based materials have the advantages of high efficiency, environmental benignness, abundant resources, and easy magnetic separation, and they are potential candidate materials for adsorbents [32]. Recently, it has become common to add iron-based materials to CS or GO composites [25,33,34,35]. This type of composite can be rapidly separated by applying a magnetic field from the water after Cr(VI) adsorption, thus reducing solid–liquid separation processes (such as centrifugation or filtration) and improving the secondary recovery efficiency [36,37,38]. For example, by supporting Fe2O3 on GO to prepare a reductive nanocomposite (rGO), the maximum adsorption capacity of Cr(VI) was 41.67 mg/g [35]. Compared with GO, rGO was much more easily separated from the solution after Cr(VI) removal. Daimei et al. (2013) had prepared CS/montmorillonite–Fe3O4 microsphere to remove Cr(VI) [39]. This microsphere showed an adsorption capacity of 58.82 mg/g (higher than the mean value of CTS and MMT) and retained good removal efficiency after reusing over 3 cycles. Chaoke et al. (2020) prepared α–Fe2O3/GO nanocomposite [40], and its adsorption capacity and removal rate were 172.63 mg/g and 86.31%, respectively. The CS/magnetite–GO (MGO) composite was prepared by depositing Fe3O4 particles on the surface of the GO to fabricate the MGO hybrid first and then attaching CS on MGO sheets [16]. This composite showed an adsorption capacity of 120.97 mg/g for Cr(VI) (higher than that of CS, GO/CS and glutaraldehyde cross-linked CS). Shan et al. (2021) applied a GOCS composite (Fe2O3–GOCS) modified by Fe2O3 to remove Cr(VI) from wastewater [25]. It was found that the adsorption capacity of Fe2O3–GOCS was 72.53 mg/g, higher than 52.03 mg/g of GOCS. The zero-valent iron GO alginate beads were prepared by immobilization of pre-synthesized zero-valent iron nanoparticles into GO-modified alginate gel [41]. The introduction of zero-valent iron could raise the Cr(VI) removal efficiency of GO–alginate beads from 55.1% to 87.0%. The above studies indicate that iron-based materials, such as magnetite, ferric oxide, and zero-valent iron [25,39,41], can further improve the adsorption capacity of GO or CS composites for Cr(VI), and that different types of iron modify GO or CS composites have different effects on the adsorption capacity of Cr(VI). Additionally, goethite (α–FeO(OH)) has been proven to be another type of iron-based material with excellent adsorption performance due to its stability, abundance, and low cost [20,42,43]. However, to the best of our knowledge, modifying the GOCS composite with α–FeO(OH) to prepare α–FeO(OH)/GOCS microsphere for researching the performance and mechanism of Cr(VI) adsorption has not been reported. In addition, few studies have noticed the potential danger of secondary pollution caused by the Fe dissolution of iron-based adsorbents [20,25].
Therefore, this study was an attempt to investigate the performance and mechanism of α–FeO(OH)/GOCS microsphere as an adsorbent for Cr(VI) removal from aqueous solutions and evaluate its possibility of Fe secondary pollution. The characterization was conducted by X-ray powder diffraction (XRD), Fourier transform infrared spectroscopy (FT-IR), Scanning Electron Microscopy with Energy Dispersive Spectrometer (SEM-EDS), and X-ray photoelectron spectroscope (XPS) analysis. Batch experiments were carried out to determine the effects of pH, mass, and volume ratio (m/v), coexisting ions, time (t), temperature (T), and Cr(VI) initial concentration (C0) on Cr(VI) removal, and to evaluate the possibility of Fe secondary pollution during the microspheres adsorption for Cr(VI). Kinetic, isotherm, and thermodynamic characteristics were studied to further understand the adsorption mechanisms.
2. Materials and Methods
2.1. Materials
GO with a purity of 95 wt% was purchased from Tanfeng Graphene Technology Co., Ltd. (Suzhou, China). CS with deacetyiation of more than 90% and glutaraldehyde with a purity of 50% were purchased from Lanji Technology Development Co., Ltd. (Zhuhai, China), and Aladdin Reagent Co., Ltd. (Shanghai, China), respectively. Other AR-grade reagents and chemicals, including HCl, FeCl3·6H2O, K2Cr2O7, anhydrous ethanol, NaOH, acetic acid, and methanol, were purchased from Xilong Science Co., Ltd. (Shanghai, China). Ultrapure water was prepared using a Milli–Q water system (Millipore, Boston, MA, USA).
2.2. Synthesis of α–FeO(OH) Microspheres
Referring to the reported method used for preparing goethite [25], α–FeO(OH)/GOCS microspheres were prepared as follows: a total of 200 mL of 1.5% acetic acid solution was prepared, 0.8 g of GO powder was added, and the solution was stirred ultrasonically until the GO powder was uniformly dissolved. The GOCS solution was prepared after the CS powder was uniformly dissolved. Then, 20.7 g FeCl3·6H2O was added to the GOCS solution and stirred until it was uniformly dissolved to obtain the α–FeO(OH)/GOCS mixture. Using 10 mL syringes, the α–FeO(OH)/GOCS mixture was dropped into a 400 mL 20% NaOH solution at a constant rate to form microspheres evenly. The α–FeO(OH)/GOCS microspheres in the aqueous solution were left standing for 24 h and then repeatedly soaked in ultrapure water to wash the pH of the solution to neutral. Then, filtration, adding methanol-glutaraldehyde solution, standing curing crosslinking for 2.5 h. The solution was fully washed with anhydrous ethanol, filtered, and dried to obtain α–FeO(OH)/GOCS microspheres. The microsphere was named α–FeO(OH)/GOCS because the form of iron in this composite was α–FeO(OH) from the following XRD analysis.
2.3. Batch Adsorption Experiment
The batch adsorption experiments aimed to explore the effects of pH (3.0–11.0), mass, and volume ratio (m/v) (0.2–1.4 g/L), coexisting ions (0.1 mmol/L, 1 mmol/L, and 10 mmol/L Cl−, NO3−, SO42−, PO43−, Ca2+, Mg2+ and Mn2+), time (t) (5–3840 min), temperature (T) (298.15 K, 308.15 K, and 318.15 K) and Cr(VI) initial concentration (C0, 5–300 mg/L). Then, further sorption experiments were conducted to characterize adsorption kinetics, isotherms, and thermodynamics at the optimum values of pH and m/v. The α–FeO(OH)/GOCS microspheres were added to a series of 50 mL Cr(VI) solutions with 25 mg/L, and their pH was adjusted by 0.1 mol HCl and NaOH. Then, the mixtures were shaken until equilibrium was reached. Finally, the supernatant was collected for Cr(VI) concentration measurement.
All experiments were performed in 100 mL PE tubes at a shaking rate of 170 rpm, and three repetitions were performed to obtain repeatable results with an error of less than 5%. All aqueous samples were filtered with a 0.45 μm filter before the Cr(VI) concentration was determined.
The equilibrium adsorption capacity (qe) and removal rate (re) of α–FeO(OH)/GOCS microspheres for Cr(VI) were calculated by the formulas below:
where qe is the adsorption capacity of α–FeO(OH)/GOCS for Cr(VI) at adsorption equilibrium, mg/g; C0 is the Cr(VI) initial concentration, mg/L; Ce is the concentration of Cr(VI) at adsorption equilibrium, mg/L; V is the volume of simulated liquid containing Cr(VI), L; m is the dosage of adsorbent, g; re is the removal rate of Cr(VI) at adsorption equilibrium, %.
2.4. Kinetic, Isotherm, and Thermodynamic Models
The pseudo-first-order kinetic model, pseudo-second-order kinetic model, and Weber–Morris model were used to fit the adsorption of α–FeO(OH)/GOCS for Cr(VI). The equations associated with the above three models were listed as the following Equations (3)–(5):
where qe and qt are the removal capacity of Cr(VI) at adsorption equilibrium and time (t) respectively, mg/g; K1 and K2 are the adsorption rate constants of pseudo-first-order and pseudo-second-order kinetics, respectively; Kdi is the diffusion rate constant within the particle; Ci is a constant related to boundary layer thickness.
The Langmuir, Freundlich, and Sips models were used to study the adsorption mechanism and compute the adsorption-related parameters. The three models were as follows:
where qe is the adsorption capacity of α–FeO(OH)/GOCS for Cr(VI) at adsorption equilibrium, mg/g; Ce is the mass concentration for Cr(VI) in the solution at adsorption equilibrium, mg/L; qm is the maximum adsorption capacity of α–FeO(OH)/GOCS for Cr(VI), mg/g; KL is the Langmuir adsorption equilibrium constant and is related to the strength of the adsorption interaction; KF and 1/n are the adsorption equilibrium constant and adsorption strength constant of the Freundlich equation, respectively; Ks is the adsorption equilibrium constant of the Sips equation; 1/m is used to measure the heterogeneity of the adsorption sites on the surface of the material. When the 1/m value is closer to 1, the adsorption sites on the adsorbent surface are more uniform [44].
Thermodynamic parameters were calculated using the following equations:
where ΔGθ is the change in Gibbs free energy, kJ/mol; T is the temperature measured in Kelvin, K; R is the universal gas constant, 8314 J/(mol·K); Kc is the thermodynamic equilibrium constant; C0 and Ce are the initial and adsorption equilibrium mass concentrations of Cr(VI), respectively, mg/L; V is the volume of simulated liquid containing Cr(VI), L; m is the dosage of adsorbent, g; ΔHθ is the standard enthalpy change, kJ/mol; ΔSθ is the standard entropy change, J/(mol·K).
2.5. Analytical Techniques
The concentration of Cr(VI) in aqueous solutions was determined by an inductively coupled plasma optical emission spectrometer (Optima 7000DV, Platinum Elmer Instruments, Inc. Waltham, MA, USA), and the relative standard deviation was less than 5%. Microspheres before and after adsorption were used for characterization, including XRD, FT-IR, SEM-EDS, and XPS. The crystal structure was determined by X’Pert3 Powder-type multifunctional XRD (Panaco, Cu target, λ = 1.54056 Å, Almelo, The Netherlands). The scanning step, speed, and range were 0.02626°, 0.6565°/s, and 5–90° (2θ), respectively. The functional groups were measured using IS10 FT-IR (Thermo Fisher Scientific, Waltham, MA, USA). Surface morphology and elemental analysis were determined using SEM-EDS (JSM–7900F, JEOL, Tokyo, Japan). The chemical and electronic states of the elements were analyzed using XPS (WISDOM–9600, Shanghai, China). The Zeta potential of α–FeO(OH)/GOCS microspheres in an aqueous dispersion was measured by the Zetasizer Nano ZS analyzer (MALVERN, Nano zs90, Melvin, UK).
3. Results and Discussion
3.1. Material Characterization
3.1.1. XRD
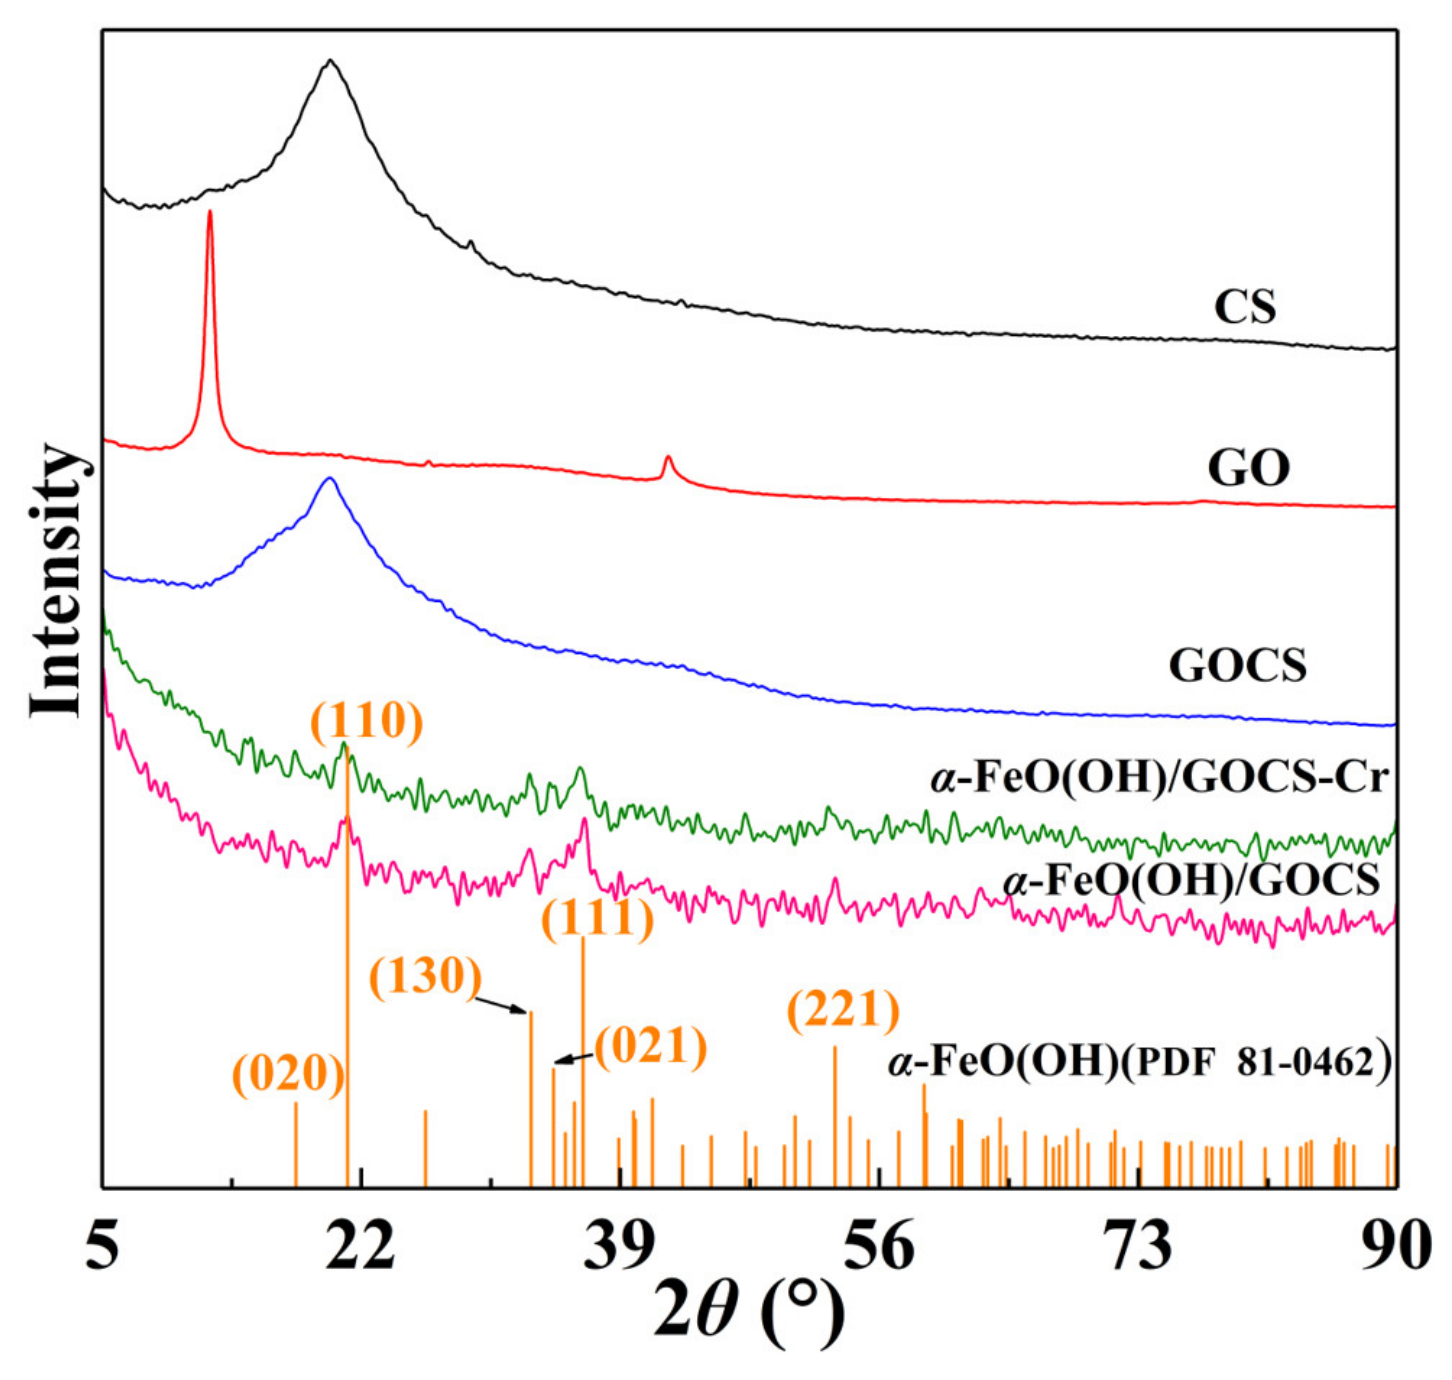
Figure 1 shows the XRD patterns of GO, CS, GOCS, and α–FeO(OH)/GOCS before and after Cr(VI) adsorption. GO had two diffraction peaks at 2θ = 12.19° and 2θ = 42.26°, and CS showed a diffraction peak at 2θ = 20.06°. The diffraction peaks of GOCS were at 2θ = 20.20°, and the peaks became wider and weaker. This showed that GOCS was successfully synthesized at room temperature [21]. After the addition of FeCl3·6H2O, new diffraction peaks of α–FeO(OH)/GOCS were at 2θ = 21.13° (110), 32.50° (130), 34.58° (021), 36.47° (111), and 53.06° (221). This indicated that the iron-bearing mineral in the adsorbent was goethite, and the form of iron was α–FeO(OH) by comparing it with the standard ICDD PDF card (No. 81–0462). Compared with the XRD patterns of α–FeO(OH)/GOCS before the adsorption of Cr(VI), the diffraction peaks of α–FeO(OH) became weaker after adsorption, indicating that α–FeO(OH) was involved in Cr(VI) adsorption.
3.1.2. FT-IR
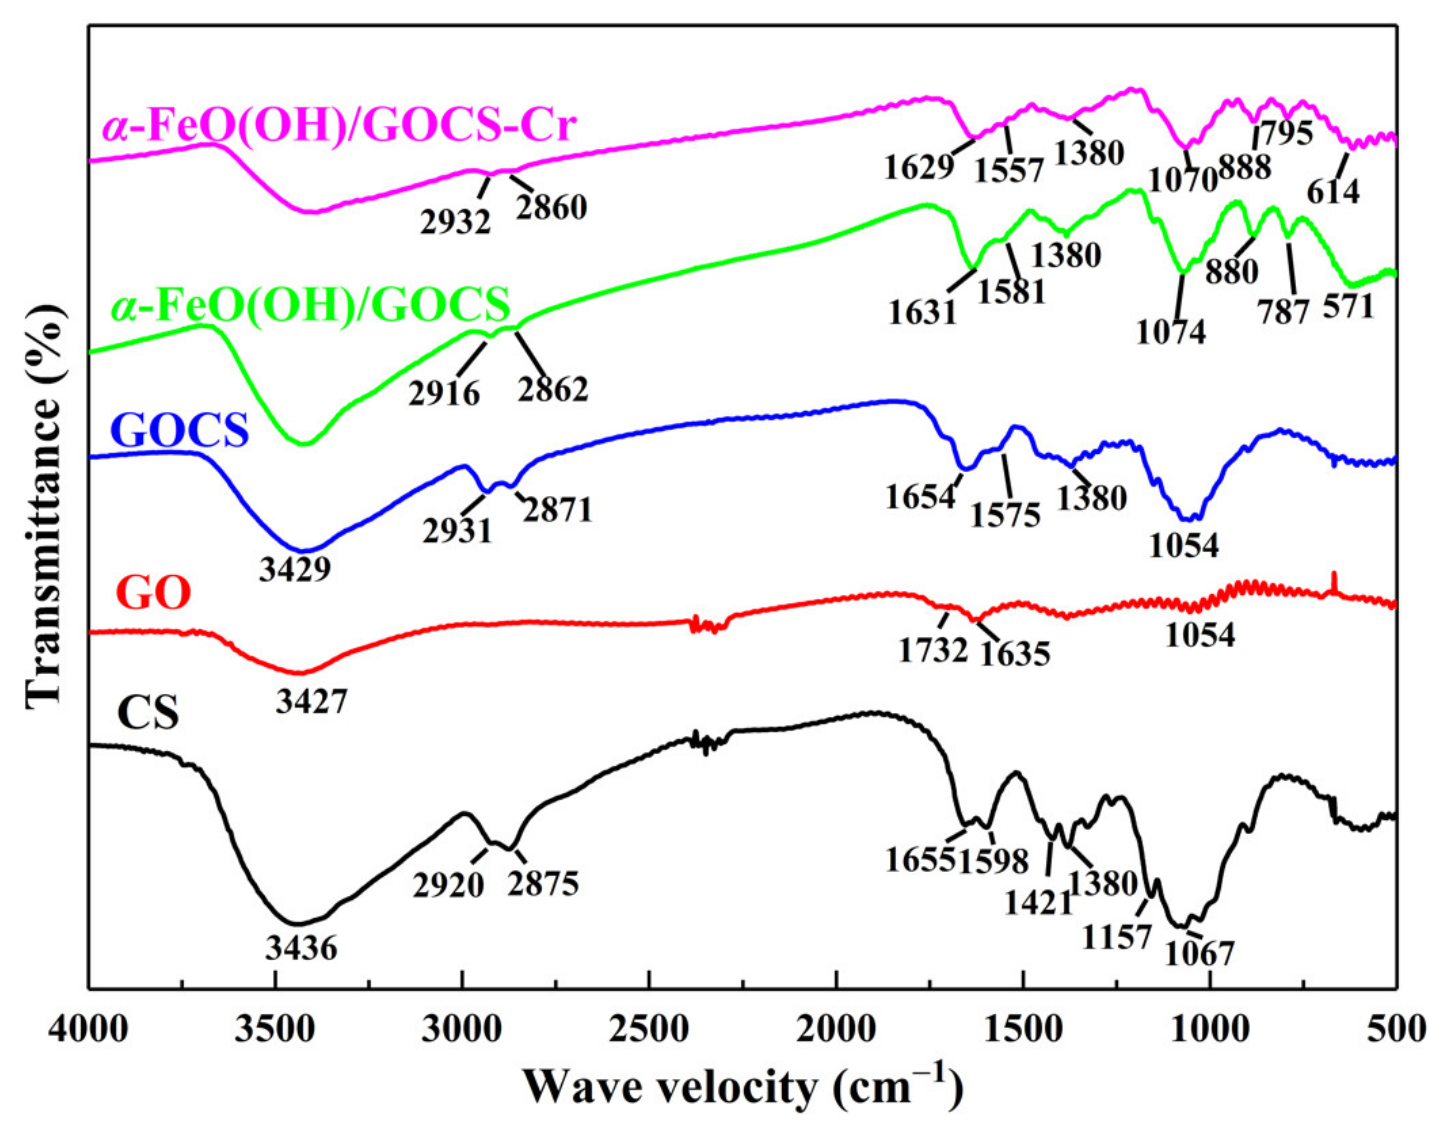
The spectra of GO, CS, GOCS, and α–FeO(OH)/GOCS before and after Cr(VI) adsorption are shown in Figure 2. The characteristic bands at 1067 cm−1 and 1157 cm−1 were related to the C–O bending vibration in CS [45] and at 1380 cm−1 and 1421 cm−1 were the C–H bending vibration bands in CH2, except for the water molecule vibration band at 3436 cm−1. The bands of 1655 cm−1 and 1598 cm−1 were the C = O stretching vibration bands of the amide I band, and at 2875 cm−1 and 2920 cm−1 were the C–H stretching vibration bands in CH3 and CH2 [46]. The characteristic bands at 1054 cm−1, 1635 cm−1, and 1732 cm−1 were the bending vibration band of C–O–C, the bending vibration band of –OH, and the stretching vibration band of C = O in –COOH, respectively [47]. The spectra of GOCS retained some characteristic bands of GO and CS and had new characteristic bands. The new characteristic bands at 1654 cm−1 were the C = O stretching vibration band of amide –CONH–. The bands at 1575 cm−1 were deformation characteristic bands in the –NH2 plane. The intensity of the deformation characteristic bands was weakened, which may be related to the interference of –NH2 by the extremely strong characteristic band value of the amide bond [21]. The above results showed that GO and CS were successfully assembled to form GOCS and had abundant functional groups.
Compared with the spectra of GOCS, the spectra of α–FeO(OH)/GOCS showed that the bending vibration band of –OH moved to 1631 cm−1, and the band intensity decreased. In addition, the in-plane deformation characteristic band of –NH2 moved to 1581 cm−1, and the band intensity of the bending vibration band of C–O–C decreased. These results suggest that –OH, –NH2, and C–O–C were involved in the modification reactions of GOCS using α–FeO(OH). Meanwhile, the weak band at 571 cm−1 was the Fe–O vibration band, and the bands at 880 cm−1 and 787 cm−1 were the in-plane and out-of-plane bending vibration bands of –OH [21]. After adsorption for Cr (VI), the band of the –OH bending vibration at 1631 cm−1, the C–OH bending vibration at 1074 cm−1, and the bending vibration bands of C–H at 1380 cm−1 became weakened, and the location of the Fe–O band shifted to 614 cm−1. These results indicated that –OH, C–OH, C–H, and Fe–O participated in Cr(VI) removal.
3.1.3. SEM-EDS
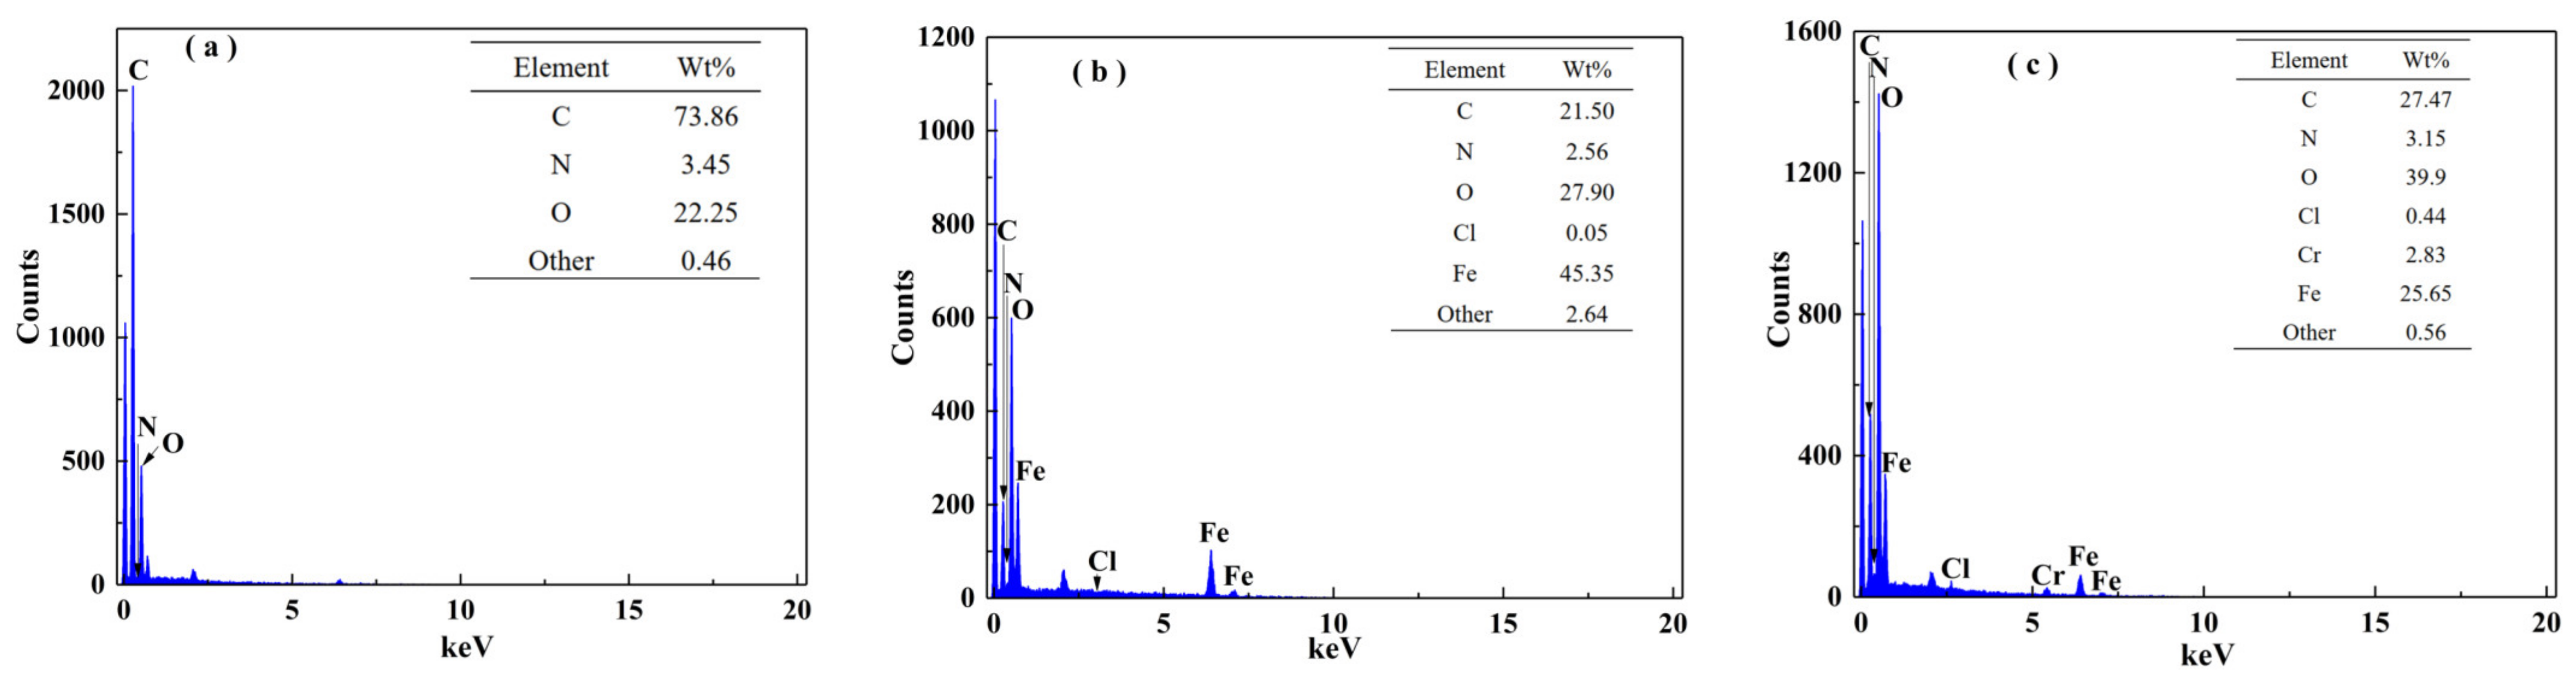
The SEM images of GOCS and α–FeO(OH)/GOCS are shown in Figure S1 in the Supplementary Materials. The surface of the GOCS was randomly distributed, with various fragments and abundant pores. After α–FeO(OH) modification, some needle-like substances appeared on the surface of the GOCS. These needle-like substances are intertwined to make many orderly folds. After Cr(VI) adsorption, the needle-like substances were replaced with some dispersedly scaly or flaky substances, which may have been chromium adsorbed on the α–FeO(OH)/GOCS surface. Figure 3 shows the EDS results of GOCS, α–FeO(OH)/GOCS before and after Cr(VI) adsorption. The major elements of GOCS were C, O, and N (Figure 3a). After the addition of FeCl3·6H2O, Fe and Cl appeared, and the counts of O also increased, indicating that GOCS was well modified by α–FeO(OH) (Figure 3b). The result was consistent with the XRD analysis of α–FeO(OH)/GOCS characteristic peaks. The existence of chromium confirmed that Cr(VI) was adsorbed to the surface of the α–FeO(OH)/GOCS (Figure 3c). In addition, the decrease in Fe content from 45.35% to 25.65% after Cr(VI) adsorption was mainly related to the dissolution of α–FeO(OH) in an acid environment (see Figure S2, Supplementary Materials). The increase in O content from 27.90% to 39.9% was related to the fact that Cr(VI) was reduced to Cr(III) by a reductive hydroxyl group (C–OH), and the produced Cr(III) was precipitated as Cr(III) oxides (Cr2O3 or Cr(OH)3) on the surface of the α–FeO(OH)/GOCS.
3.1.4. XPS
Figure 4 shows the XPS scanning results of α–FeO(OH)/GOCS before and after Cr(VI) adsorption. After Cr(VI) adsorption, four new peaks appeared at binding energies of 576.62 eV and 579.58–588.45 eV, respectively, as shown in Figure 4a. The former belonged to Cr(III) in the form of Cr2O3 or Cr(OH)3 [48,49], and the latter belonged to Cr(VI) in the form of HCrO4− and Cr2O72− [35]. These results showed that the adsorbed Cr(VI) was partly reduced to Cr(III) during α–FeO(OH)/GOCS adsorption for Cr(VI). Similar results have been reported for Cr(VI) removal using an iron-based modified GOCS composite [25,35]. Cr(III) was not found in the aqueous solution after Cr(VI) adsorption. This indicates that Cr(VI) was first adsorbed to α–FeO(OH)/GOCS. Then, the adsorbed Cr(VI) was partly reduced to Cr(III), which precipitated in the form of Cr2O3 or Cr(OH)3 on the surface of α–FeO(OH)/GOCS [25]. Another adsorption, Cr(VI), mainly existed in the form of an ionic complex on the adsorbent by electrostatic attraction. The C1s spectra of α–FeO(OH)/GOCS before and after Cr(VI) adsorption are shown in Figure 4b. The peaks at the binding energies of 284.65 eV, 285.70 eV, and 288.72 eV were C–H, C–OH, and C–O, respectively [50]. After Cr(VI) adsorption, the peaks of C–H, C–OH, and C–O were weakened and shifted to a higher binding energy. Similar results were also found in the change in the Fe–OH peak from the O1s spectra in Figure 4c. These results indicated that C–H, C–OH, C–O, and Fe–OH had been involved in Cr(VI) adsorption and were consistent with the results of the FT-IR analysis. However, almost nothing changed in the N1s spectra after adsorption (Figure 4d), indicating that the functional groups of –NH2 did not participate in Cr(VI) adsorption. Figure 4e shows that Fe(III) and Fe(II) coexisted in the microspheres. Before Cr(VI) adsorption, the peaks at binding energies of 710.10 eV and 712.16–727.26 eV were Fe(II) and Fe(III), respectively [50,51]. After adsorption for Cr(VI), there was no change in the peak of Fe(II), indicating that Fe(II) was not involved in Cr(VI) adsorption. The peaks of Fe(III) at 714.69 eV and 727.26 eV disappeared. These were attributed to the dissolution of α–FeO(OH) in an acid environment and corresponded to the decreasing Fe content in the EDS analysis. In addition, another intensity of Fe(III) peaks became weaker, indicating that some Fe(III) was involved in Cr(VI) adsorption.
3.2. Influencing Factors
3.2.1. Effect of pH
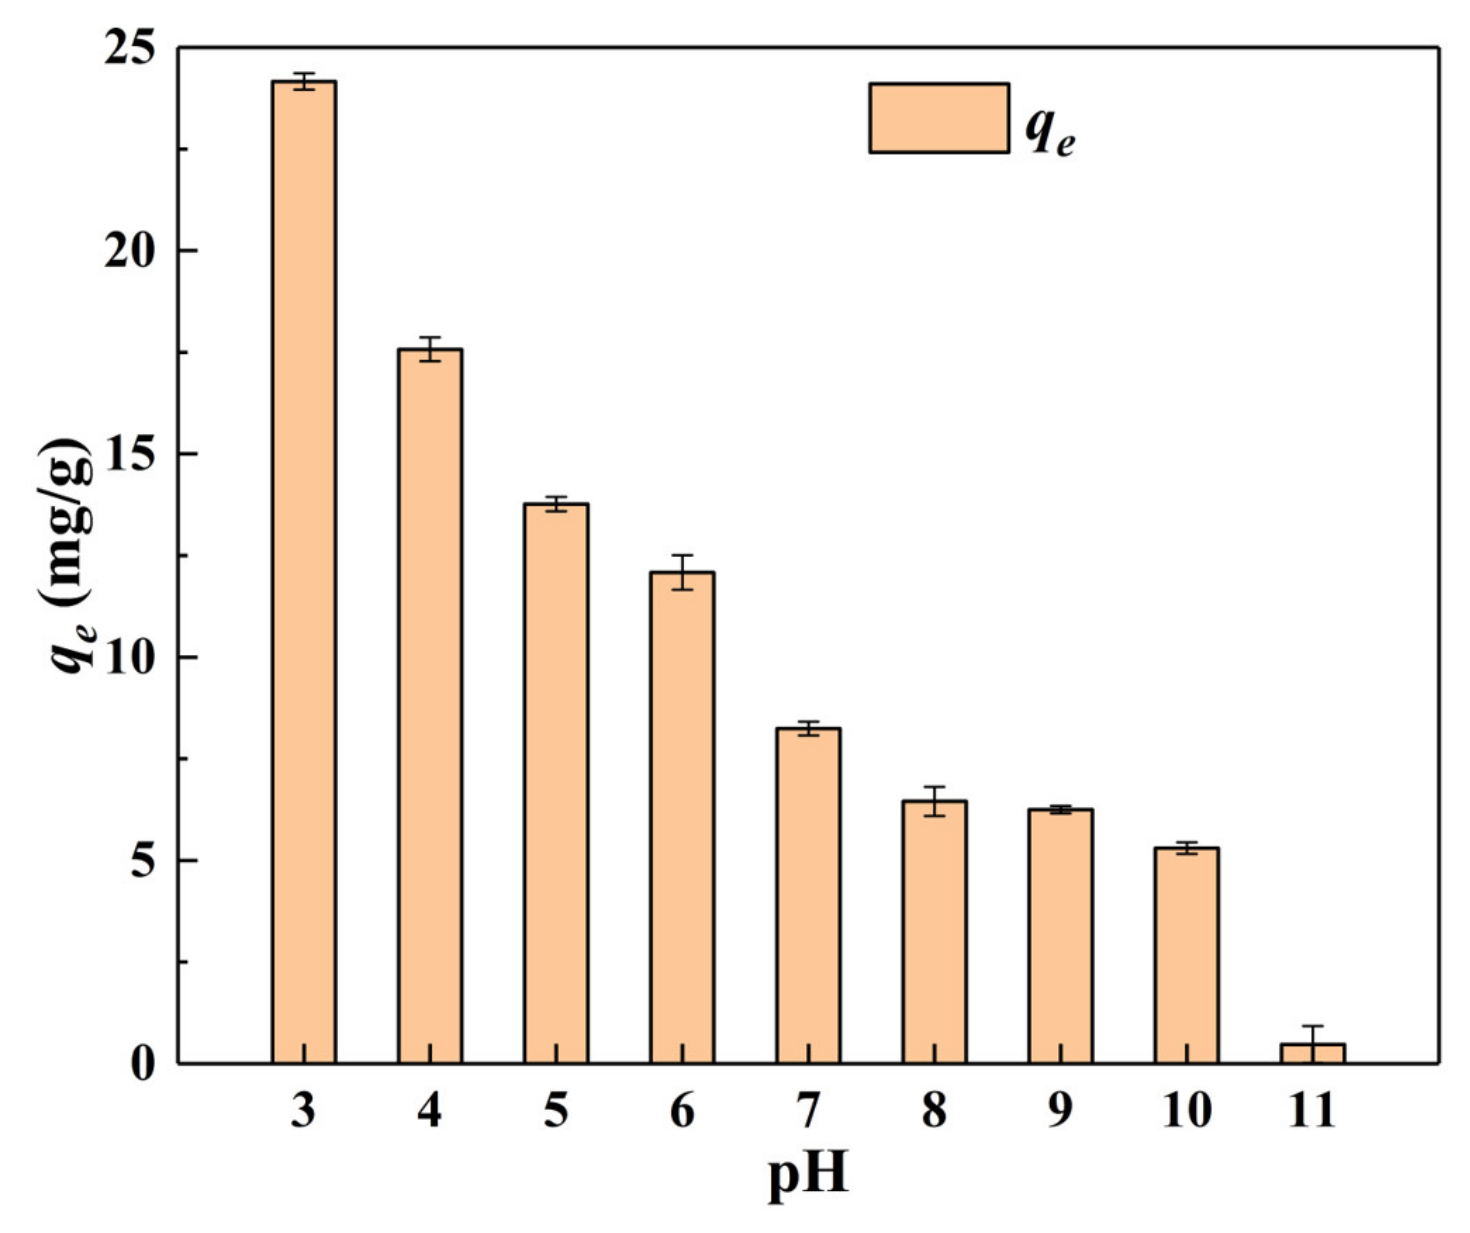
Figure 5 shows the equilibrium adsorption capacity (qe) of α–FeO(OH)/GOCS adsorption for Cr(VI), varying with pH values at C0 = 25 mg/L, m/v = 1.0 g/L, and T = 298.15 K. The qe values decreased with increasing pH values from 3.0 to 11.0. The qe value was the highest (24.16 mg/g) and the lowest (0.47 mg/g) when pH = 3 and 11, respectively, indicating that the pH values had a great influence on the qe of Cr(VI) adsorption. The experimental results were consistent with many studies on GOCS-based materials for Cr(VI) removal [25,52].
This could be explained by the distribution of chromium ions in the solution and the types of charged charges on the adsorbent surface [53]. When the solution was under acidic conditions, Cr(VI) mainly occurred in the ion forms of HCrO4− and Cr2O72−. Under alkaline conditions, it primarily exists in the form of CrO42− [5]. In addition, the pH at the potent of zero charges (pHpzc) for α–FeO(OH)/GOCS was 8.2 [20]. This indicated that the surface of α–FeO(OH)/GOCS had positive charges when the pH value was below 8.2 and negative charges at a pH value above 8.2. Therefore, Fe–OH on the surface of α–FeO(OH)/GOCS was protonated to Fe–OH2+ when the pH value was 3. Then, the electrostatic attraction was improved between Fe–OH2+ and HCrO4− (or Cr2O72−), making Cr(VI) adsorbed to a large number of surface sites. Meanwhile, the partly adsorbed Cr(VI) could be reduced to Cr(III) by the reductive hydroxyl groups (C–OH) of the microspheres, and then the reduced Cr(III) in the form of Cr2O3 or Cr(OH)3 precipitated on the surface of the microspheres [25]. The OH− concentration and –OH2+ deprotonation increased with increasing pH, and then the electrostatic repulsion was improved between them and CrO42−, causing the qe to decrease significantly.
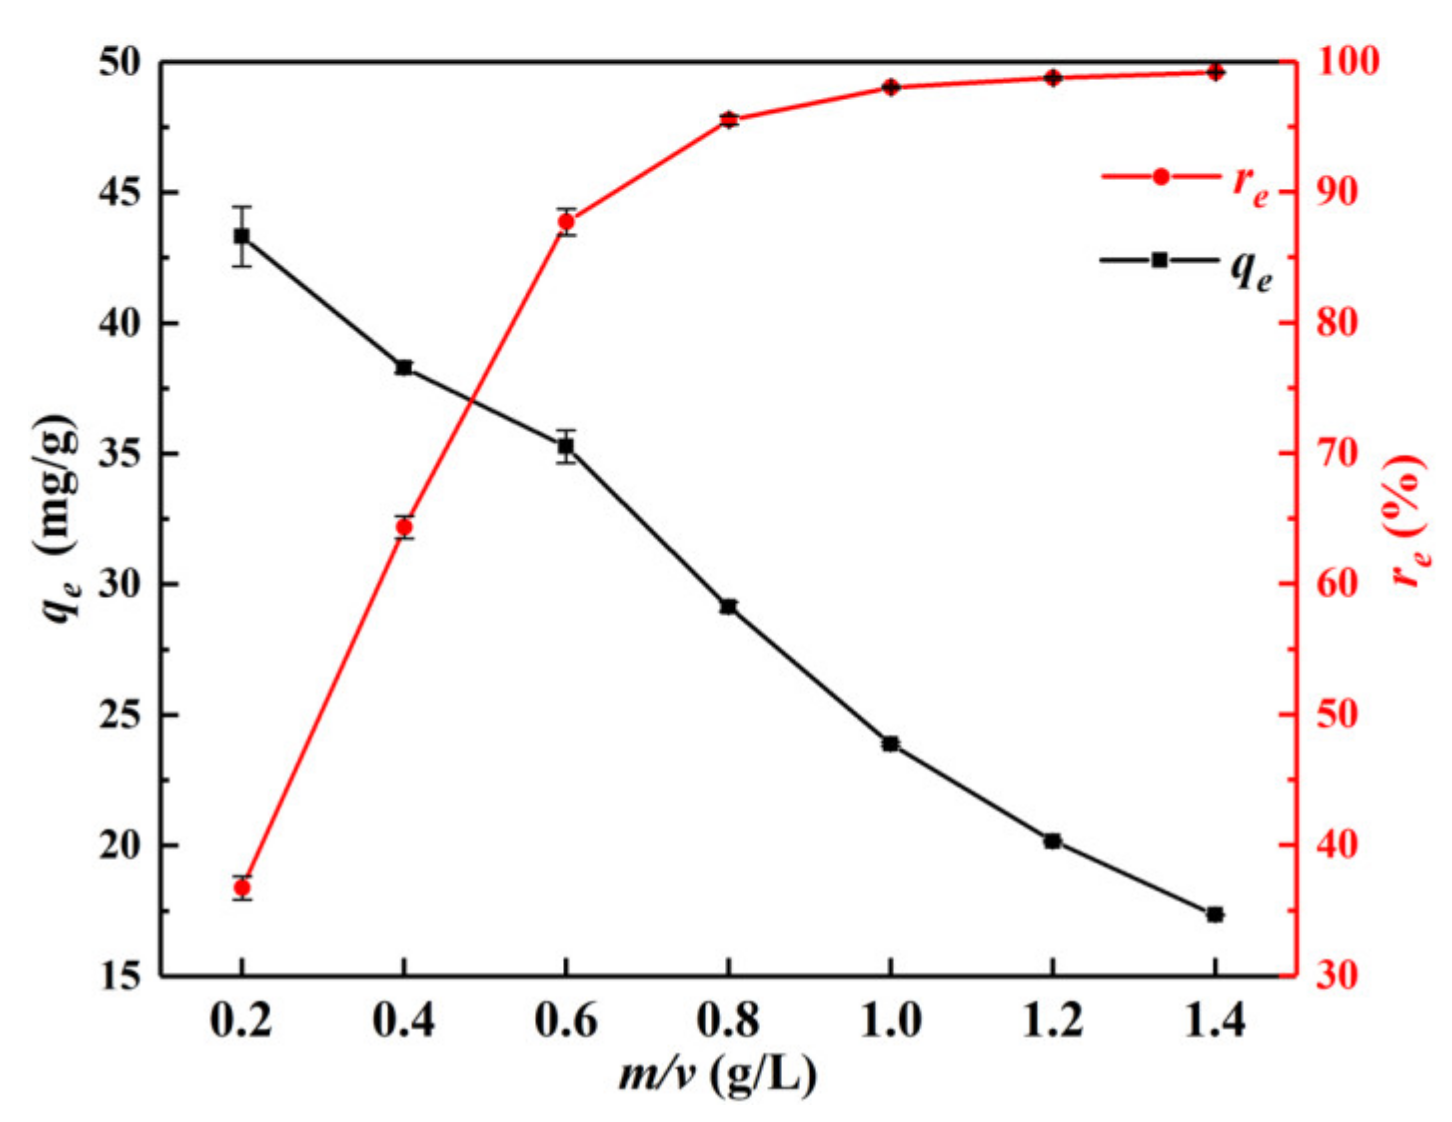
3.2.2. Effect of m/v
Figure 6 shows the changes in the equilibrium adsorption capacity (qe) and the removal rate (re) of Cr(VI) on α–FeO(OH)/GOCS with the m/v values under the conditions of C0 = 25 mg/L, pH = 3.0, and T = 298.15 K. It can be seen that the re value of Cr(VI) increased from 36.71% to 99.15%, and the qe value decreased from 43.31 mg/g to 17.35 mg/g with increasing m/v. The re value rose rapidly when the m/v values increased from 0.2 g/L to 0.6 g/L. This may be related to the fact that the effective adsorption sites on the surface of the microsphere were limited. Therefore, the re value can rapidly increase with the increasing m/v value while the qe value decreases. After that, the re value increased slowly with the m/v value increasing from 0.6 g/L to 1.4 g/L, indicating that the adsorption of Cr(VI) by α–FeO(OH)/GOCS gradually reached saturation. To achieve a better effect of Cr(VI) removal, m/v around 1.0 g/L should be selected.
3.2.3. Effect of Coexisting Ions
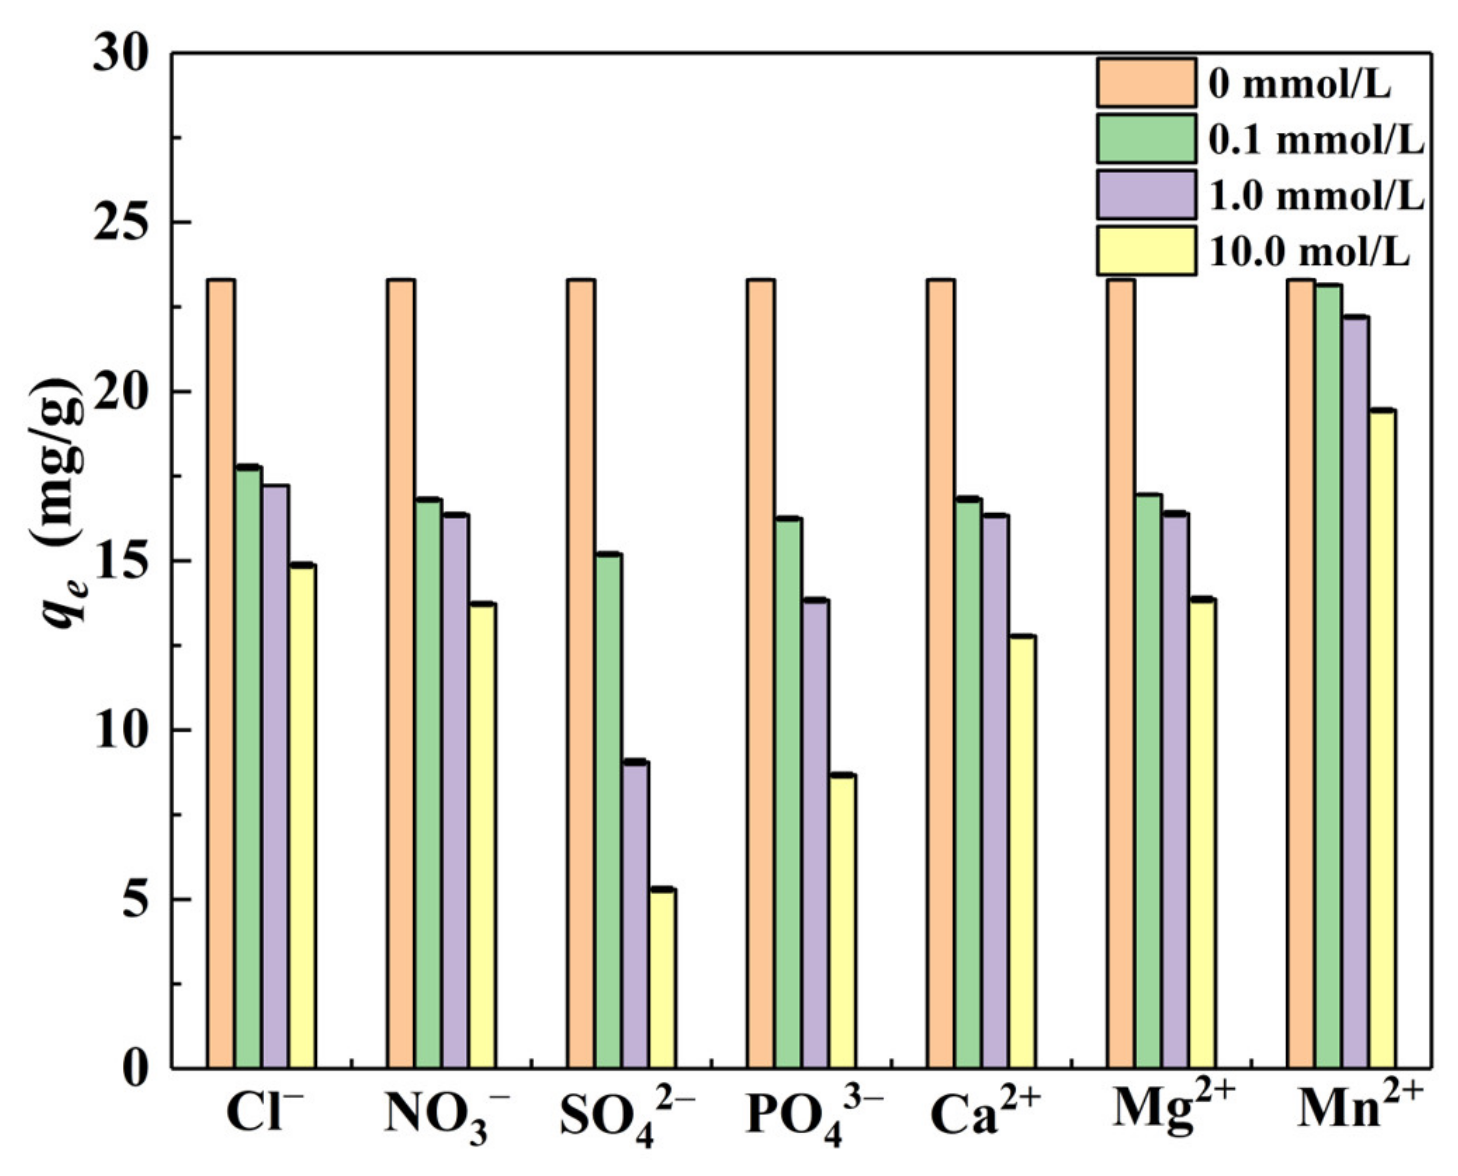
Cl−, NO3−, SO42−, PO43−, Ca2+, Mg2+, and Mn2+ are selected to study the influence on the adsorption of Cr(VI) in an aqueous solution. The experimental results are shown in Figure 7. The initial concentrations of all ions were 0.1 mmol/L, 1.0 mmol/L, and 10.0 mmol/L, respectively. Other reaction conditions included C0 = 25 mg/L, pH = 3.0, m/v = 1.0 g/L, and T = 298.15K. It can be seen that the higher the concentration of cations and anions, the stronger the inhibition ability of Cr(VI) removal. The degree of influence of the anions on the qe value of Cr(VI) in descending order was SO42− > PO42− > NO3− > Cl−, while the influence degree of cations on the qe value of Cr(VI) in descending order was Ca2+ > Mg2+ > Mn2+. The qe value was 23.30 mg/g under no ions were added. When SO42− was added at 0.1 mmol/L, 1.0 mmol/L and 10.0 mmol/L, the qe value decreased by 8.10 mg/g, 14.24 mg/g and 18.01 mg/g, respectively. Then the qe value decreased by 6.48 mg/g, 6.96 mg/g and 10.52 mg/g, respectively under the influence of Ca2+. This was because anions could compete with Cr(VI) anions in the main forms of HCrO4− and Cr2O72− for the active sites on the adsorbent, and α–FeO(OH) likewise displayed a strong adsorption capacity for SO42− and PO42− [54]. In addition, the positive charges were distributed on the surface of the material, and there was a strong repulsive force with these cations (Ca2+, Mg2+, and Mn2+) under the acidic conditions. Other researchers have reported similar results [25,52].
3.2.4. Effect of Contact Time
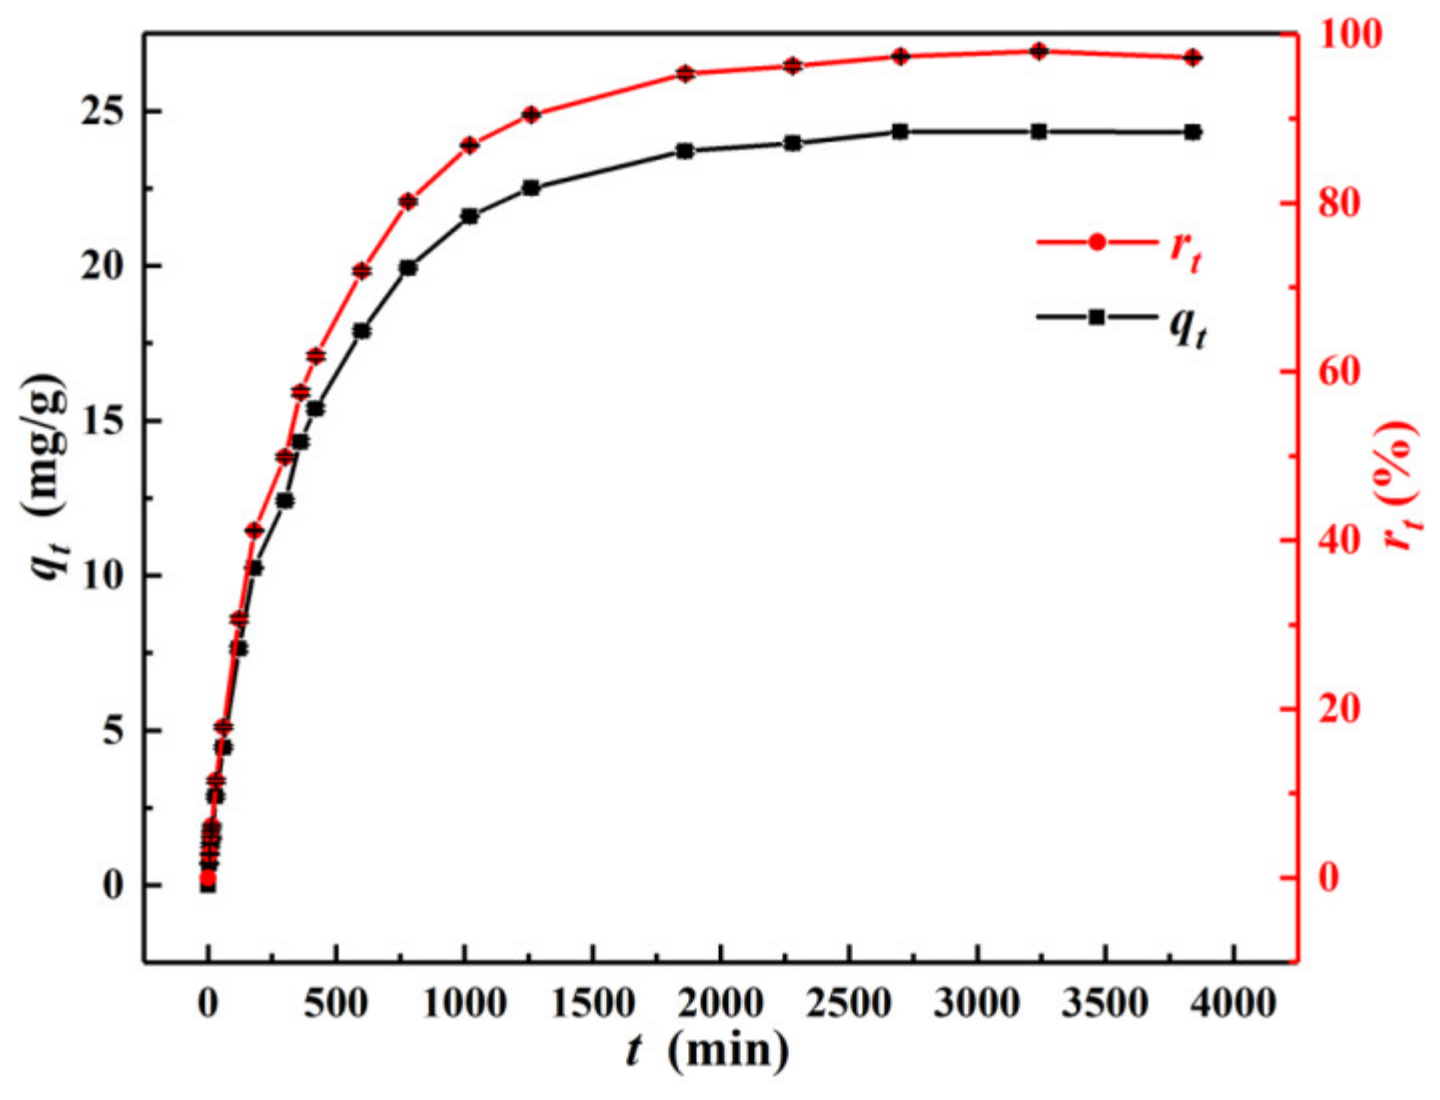
Figure 8 shows the changes in the adsorption amount (qt) and removal rate (rt) of Cr(VI) with contact time (t) at C0 = 25 mg/L, pH = 3.0, m/v = 1.0 g/L, and T = 298.15 K. It showed that the qt and rt values both rapidly increased before 180 min. This was because α–FeO(OH)/GOCS had abundant adsorption sites and pores at the beginning, and it swiftly adsorbed Cr(VI) under strong electrostatic attraction [52]. Then qt and rt values increased slowly between 300 min and 1260 min due to the saturation of adsorption sites and pores on the surface. From 1860 min to 3840 min, the qt and rt values reached 24.32 mg/g and 97.78%, respectively. In this stage, the adsorption sites on the surface of the material reached saturation, suggesting that the reaction reached equilibrium. Therefore, more than 1860 min was determined as the time of the equilibrium stage.
3.2.5. Effect of Initial Concentration
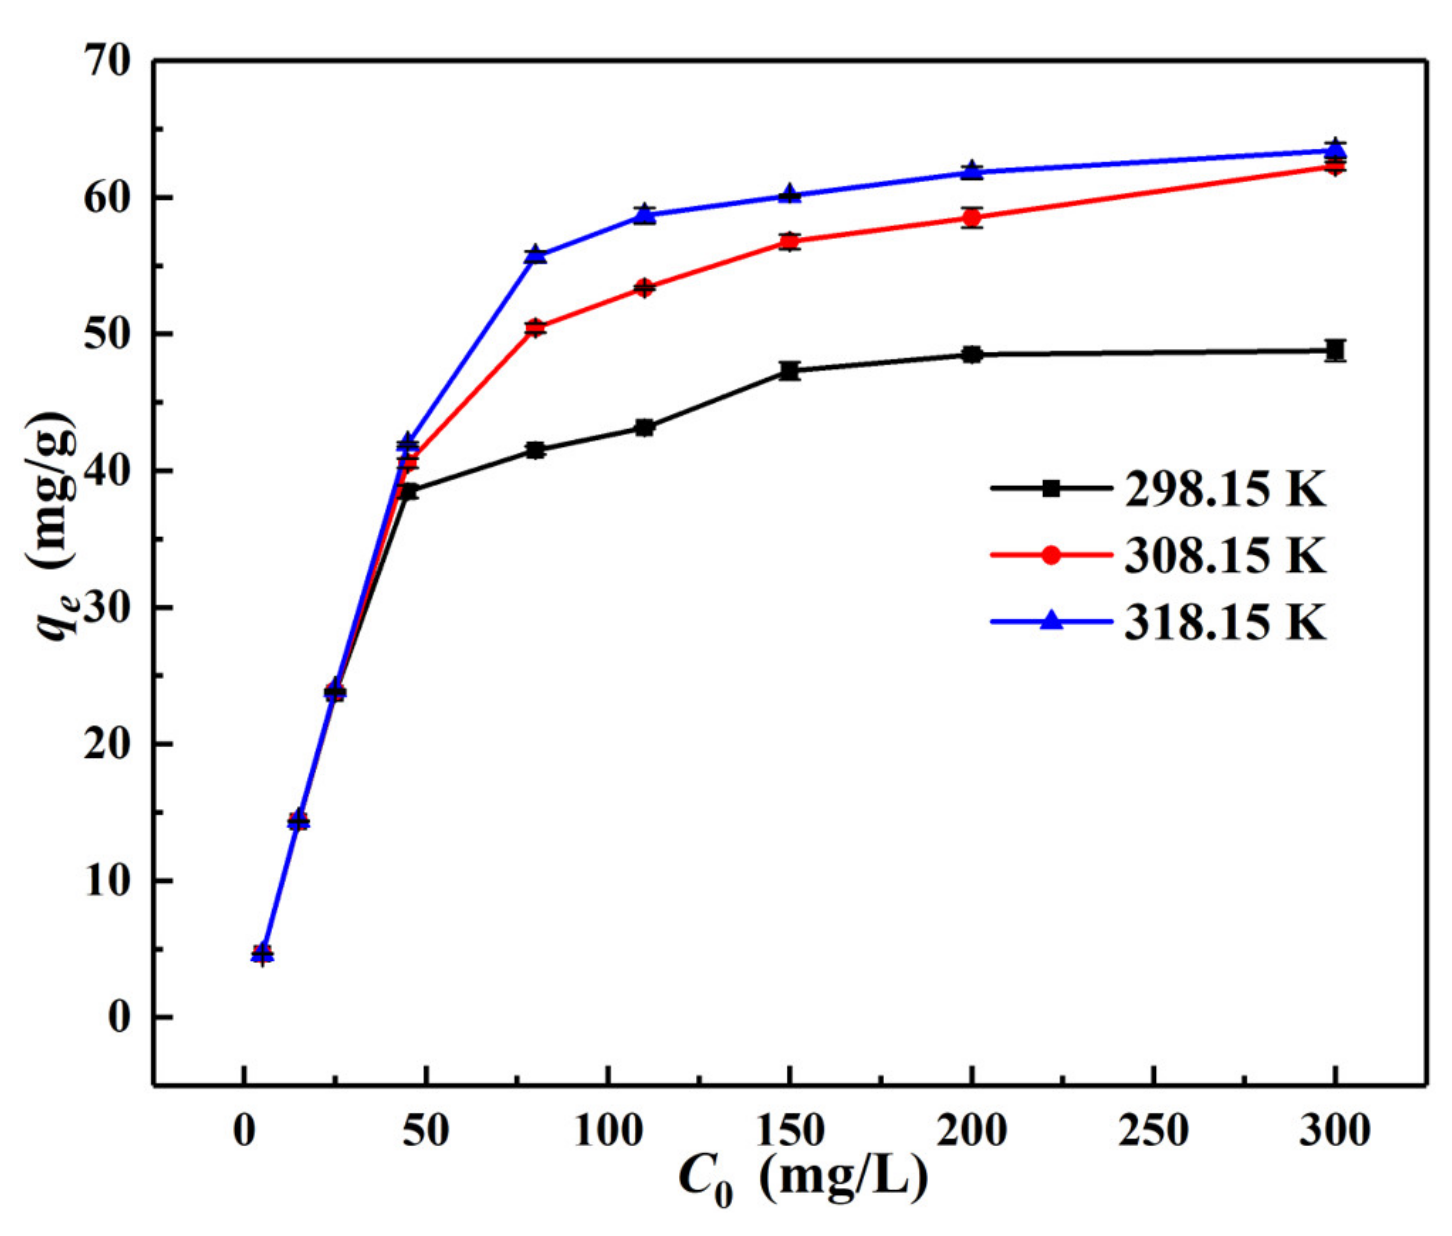
Figure 9 shows the changes of equilibrium adsorption capacity (qe) with initial concentration (C0, 5–300 mg/L) under the conditions of pH = 3.0, m/v = 1.0 g/L and T = 298.15 K, 308.15 K, and 318.15 K, respectively. This showed that the qe value increased promptly first and then gently later until it became balanced with the increase of C0. This may indicate that Cr(VI) adsorption on α–FeO(OH)/GOCS was a diffusion-driven process [25]. At 298.15 K, 308.15 K, and 318.15 K, the qe value reached 48.80 mg/g, 62.30 mg/g, and 63.43 mg/g respectively, indicating that elevating the temperature could increase the qe value of Cr(VI). This was probably because increasing temperatures can strengthen the irregular movement of Cr(VI) ions and enhance the pore size expansion and surface activation of the adsorbent to adsorb more Cr(VI) [55].
3.3. Adsorption Characteristics
3.3.1. Adsorption Kinetics
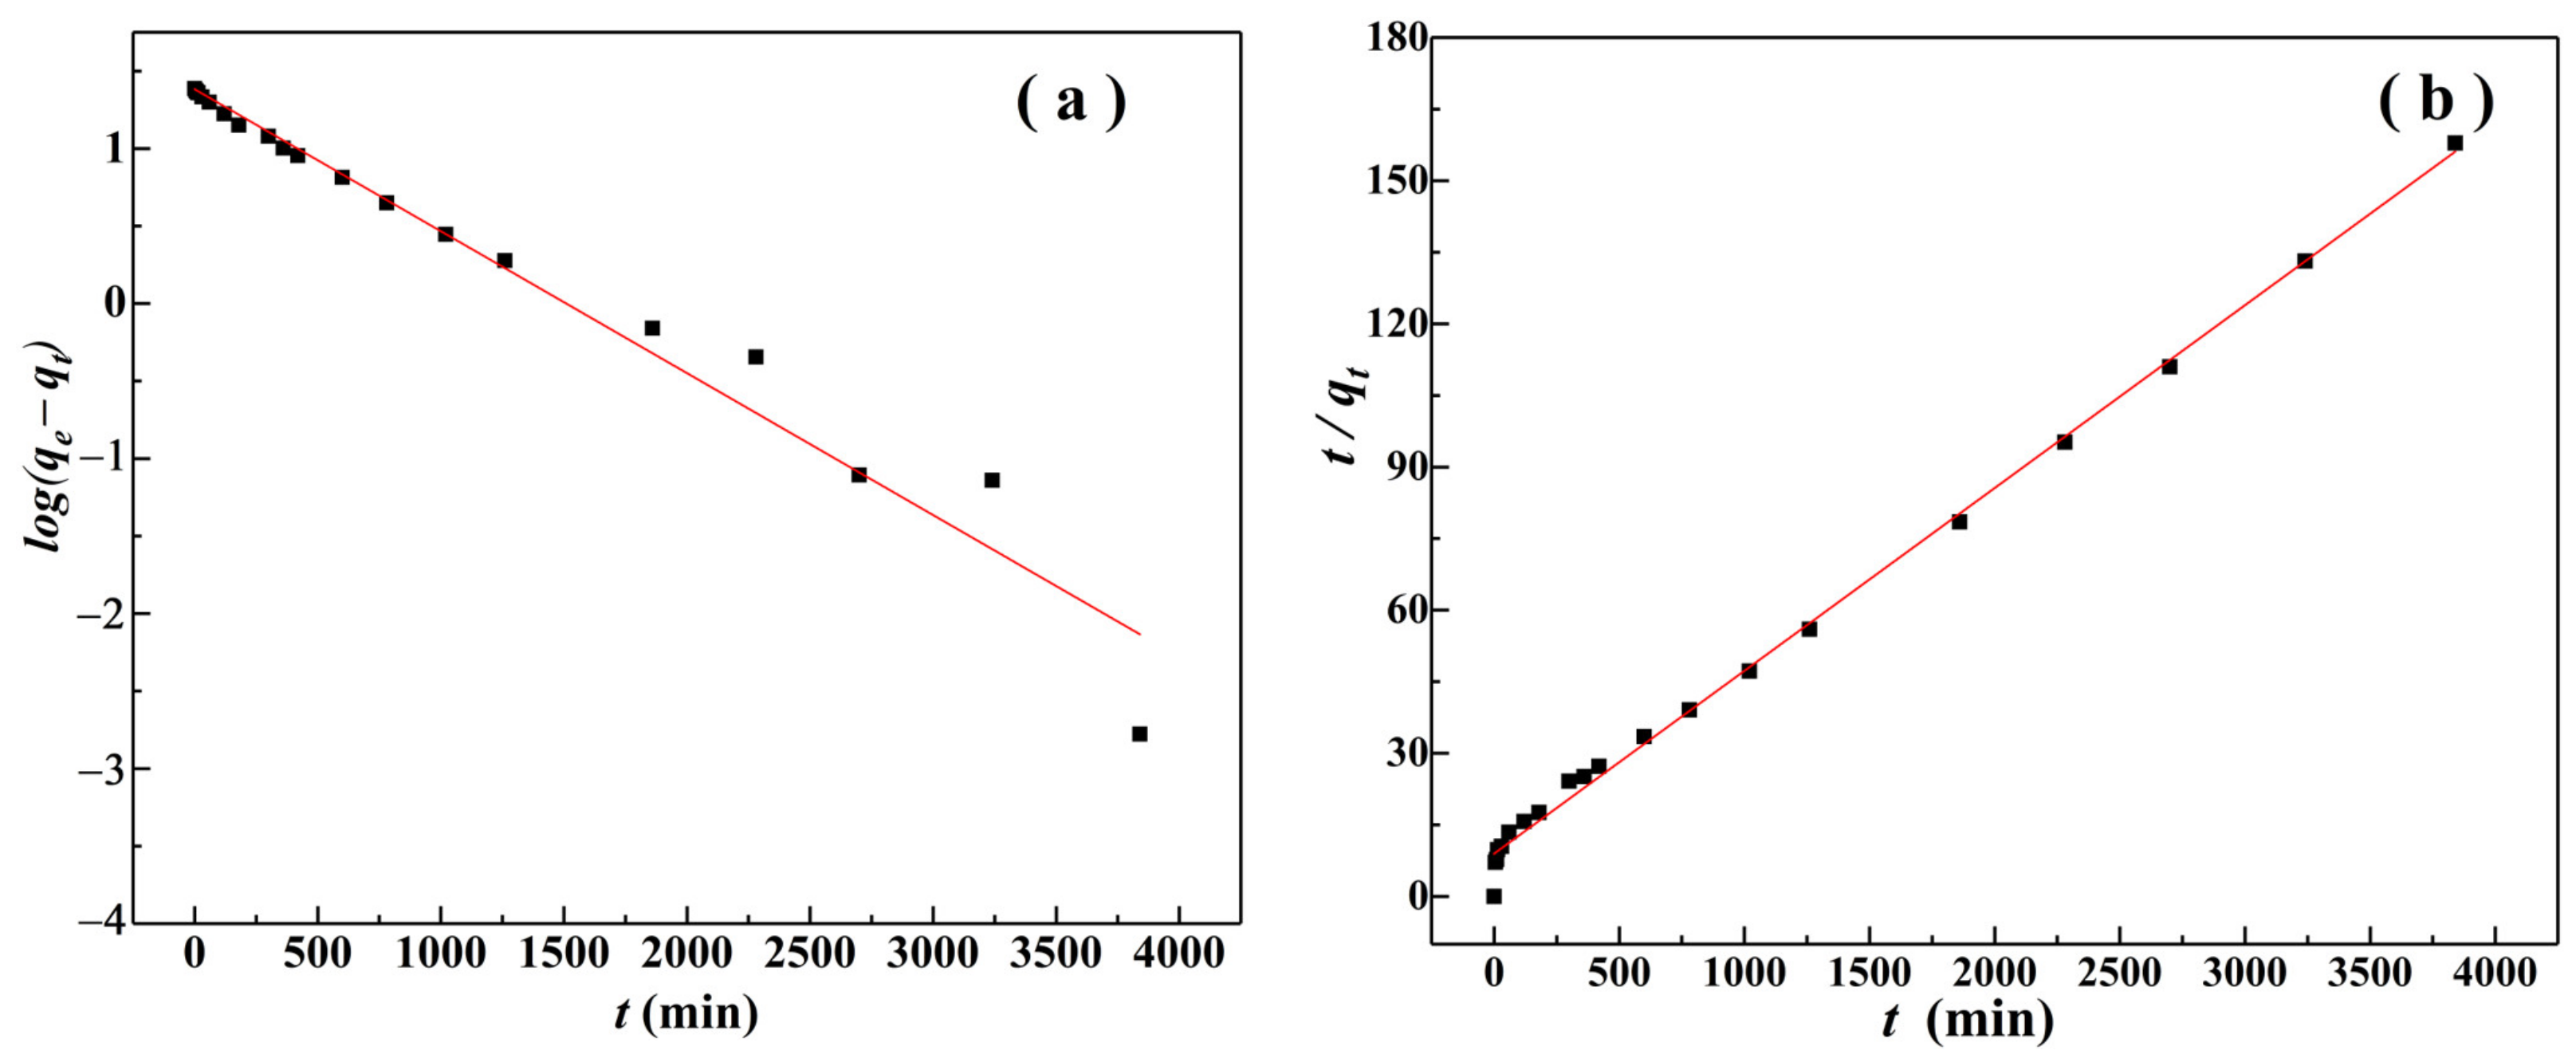
The pseudo-first-order kinetic model assumed that adsorption was predominantly physical [56], while the pseudo-second-order kinetic model assumed that adsorption was mainly chemical [57]. The Weber-Morris model facilitates the understanding of the mechanism described by external mass transfer (boundary layer diffusion) and intraparticle diffusion [58].
Figure 10 and Table 1 show the fitting analysis results of the pseudo-first-order kinetic model and pseudo-second-order kinetic model to the experimental data. It can be seen that under the conditions of C0 = 25 mg/L, pH = 3, m/v = 1.0 g/L, and T = 298.15 K, the determination coefficient (R2) of the pseudo-second-order kinetics was greater than 0.99, indicating that the Cr(VI) adsorption was more consistent with the pseudo-second-order kinetic model and was mainly a chemical mode of adsorption [30].
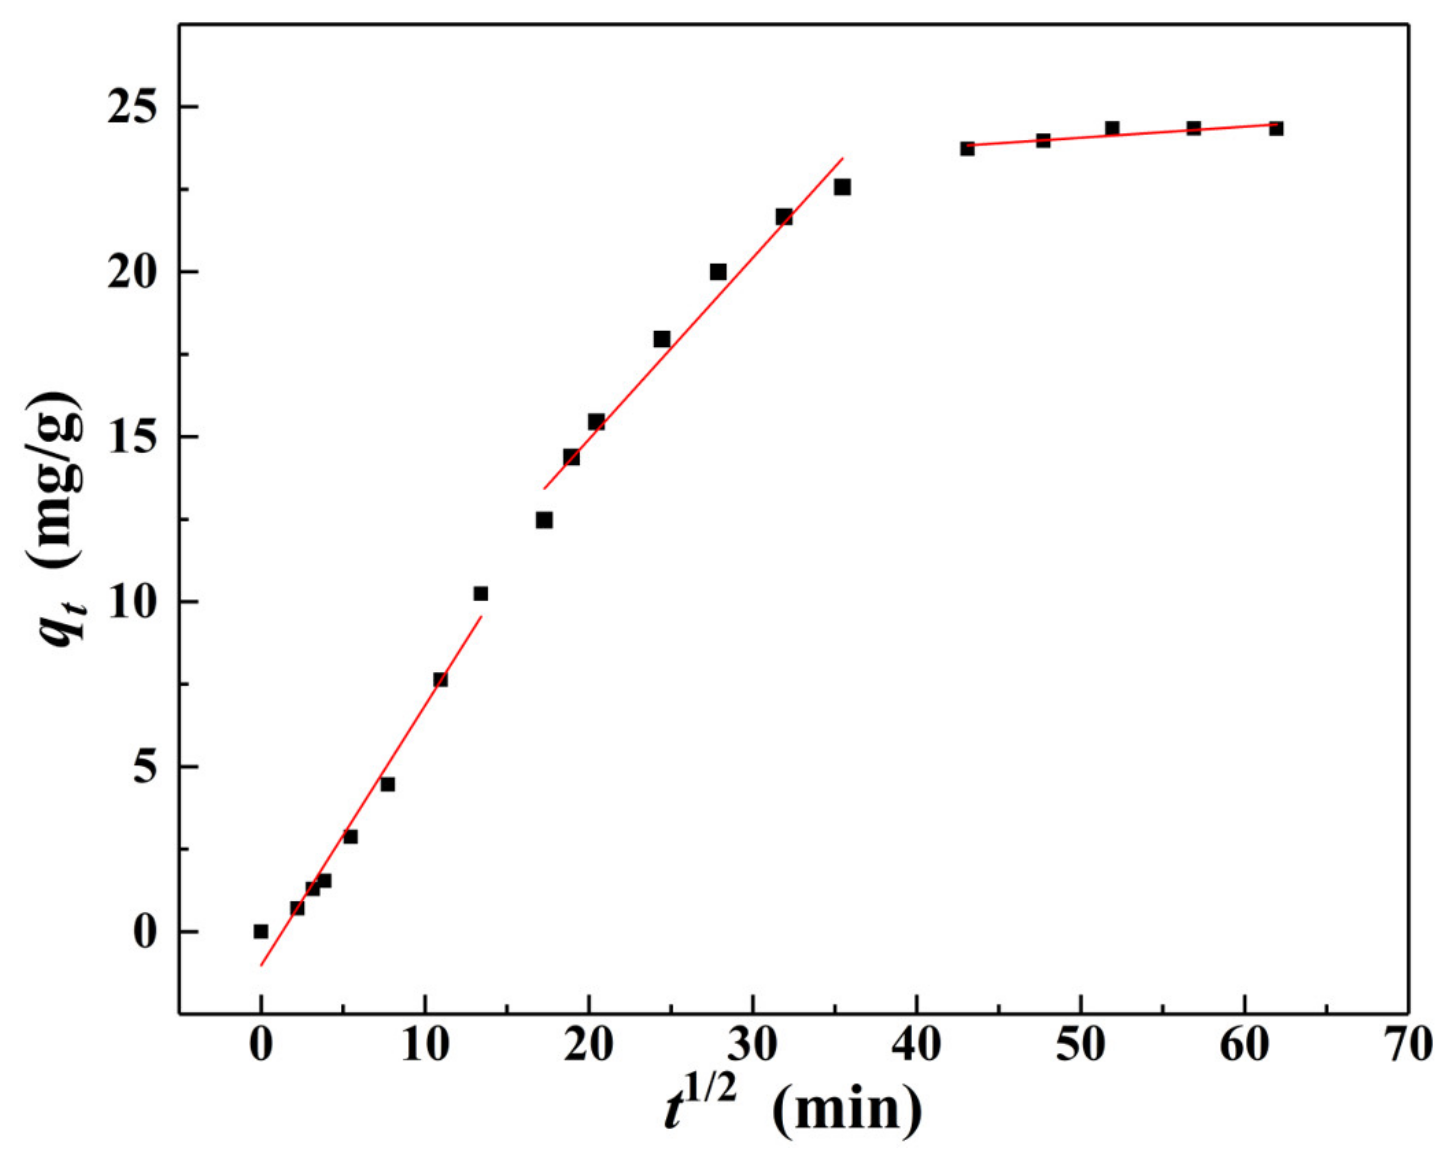
Figure 11 and Table 2 show the adsorption results of the Weber–Morris model. The fitting results were consistent with the changes in adsorption amount (qt) and removal rate (re) of Cr(VI) with contact time (t) (Figure 8), and the fitting of adsorption of Cr(VI) could be divided into three stages. In the first stage, qt value rapidly increased with the increase of t1/2. This was because the surface of α–FeO(OH)/GOCS had abundant adsorption sites at the initial stage of adsorption that could quickly combine with Cr(VI) in the solution. In this stage, α–FeO(OH)/GOCS mainly adsorbed Cr(VI) on the surface. The second stage was slow adsorption; the adsorption sites on the surface progressively attained saturation, and the adsorption mode switched from surface adsorption to pore diffusion. In the third stage, adsorption reached equilibrium because of the saturation of the adsorption sites. In addition, qt and t1/2 in each of the above three stages follow a linear function. However, such linear functions did not pass through the origin (meaning that qt did not drop to zero at t = 0), and Kid kept decreasing and Ci kept increasing. This indicated that Cr(VI) adsorption was not only affected by internal diffusion but may also be affected by the molecular size, concentration, affinity, and diffusion coefficient of adsorbate in the aqueous solution [59].
3.3.2. Adsorption Isotherms
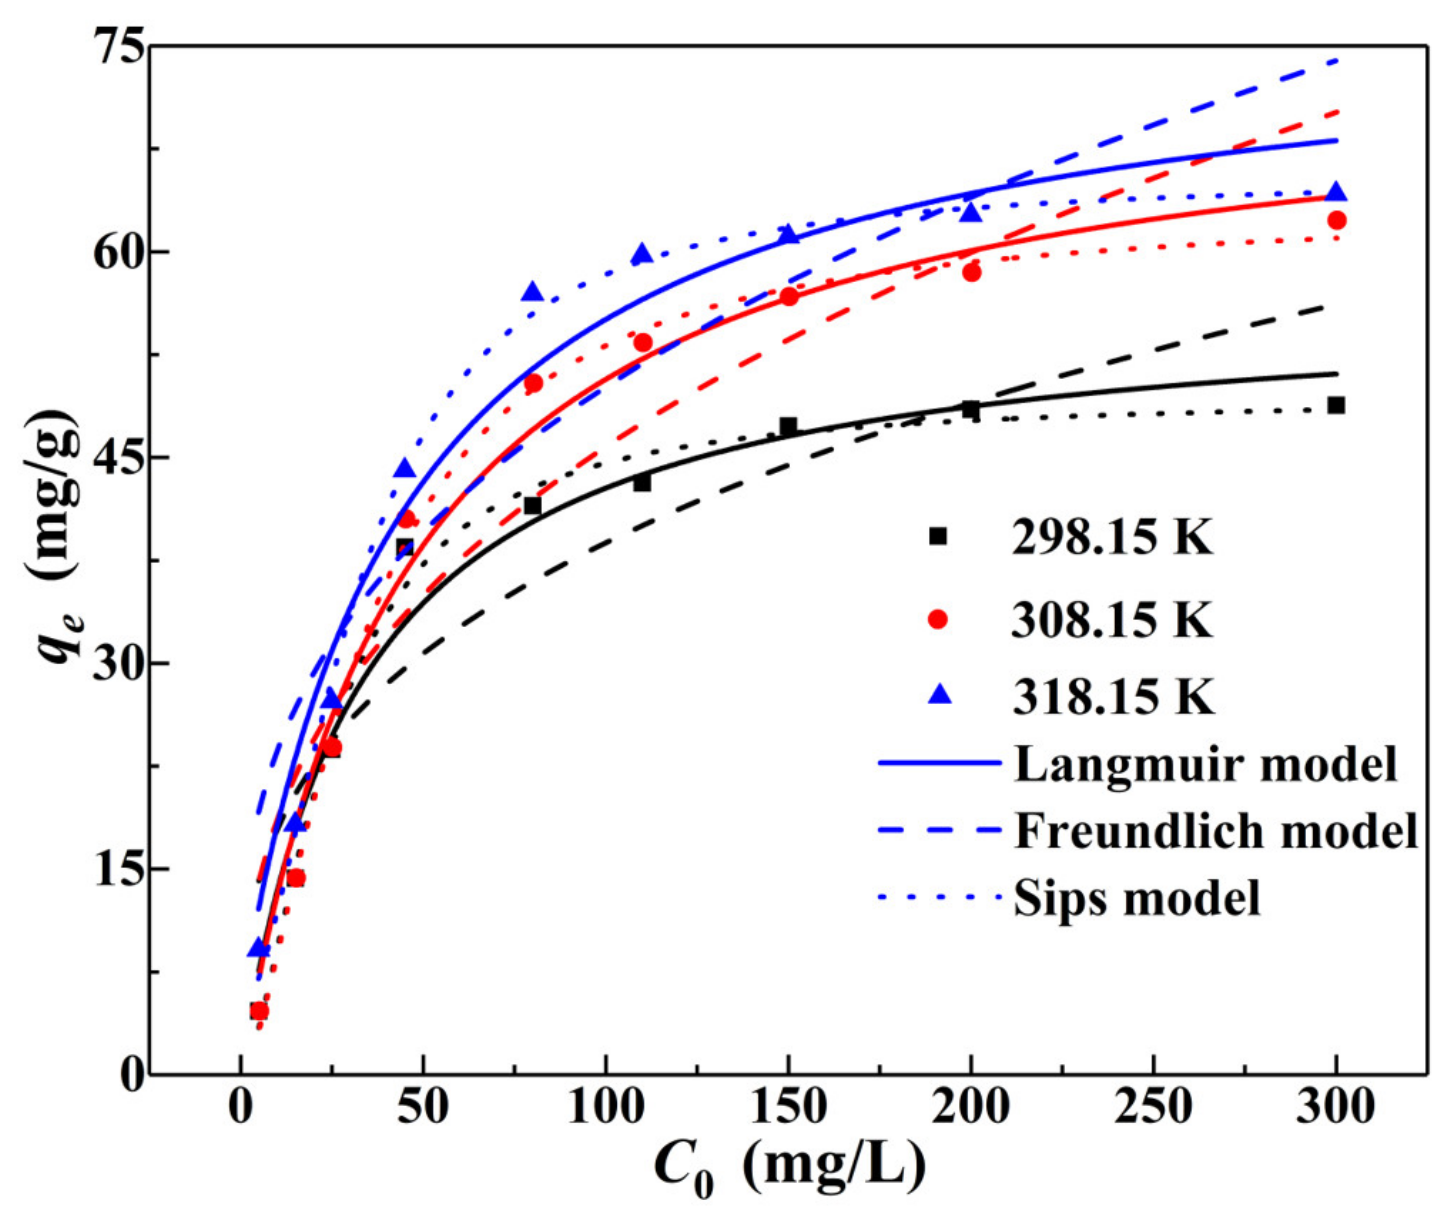
The Langmuir model assumed that the adsorbent had a uniform surface structure, dominated by monolayer adsorption, and that its binding sites had the same adsorption tendency and did not interact with each other [60]. The Freundlich model assumed that the adsorbent surface was inhomogeneous and considered multilayer adsorption [61]. The Sips adsorption isotherm model is a comprehensive model with asymptotic properties [62], and the suitable adsorption amount eventually reaches its maximum value. When the heterogeneity factor 1/m was equal to 1, indicating that the distribution of adsorption sites on the surface was uniform [44], then the Sips model was equivalent to the Langmuir isotherm [62].
Figure 12 and Table 3 show the results of using the Langmuir, Freundlich, and Sips models to fit the experimental data on the adsorption of Cr(VI). The Langmuir model and Sips model fit the adsorption data best, and the determination coefficients (R2) were in the range of 0.9650–0.9804 and 0.9885–0.9964, respectively. When the heterogeneity factor (1/m) was equal to 1, indicating that the distribution of adsorption sites on the surface was uniform [44] and the Sips model was equivalent to the Langmuir isotherm [62]. Therefore, the best-fitted 1/m values of 1.51–1.76 in the Sips model indicated that the adsorption of Cr(VI) was mainly monolayer adsorption, with a certain heterogeneity. In addition, at 298.15 K, 308.15 K, and 318.15 K, the maximum adsorption capacities of Cr(VI) were 49.37 mg/g, 63.19 mg/g, and 64.77 mg/g, respectively, which were closer to the actual situation (Figure 9).
The basic features of the Langmuir model can be analyzed in terms of RL. RL was a dimensionless constant used to forecast whether an adsorption system was appropriate for adsorption [63]. Defined as follows:
where C0 is the initial concentration of Cr(VI), mg/L; KL is the Langmuir constant.
From the relationship between C0 and RL at different concentrations (5–300 mg/L) and temperatures (298.15 K, 308.15 K, and 318.15 K) (see Figure S3, Supplementary Materials), the RL value was lower if the initial concentration was higher, indicating that it was supportive of adsorption by increasing the initial concentration of Cr(VI) [63]. The value of RL was in the range of 0–1, suggesting that Cr(VI) adsorption was spontaneous [63].
3.3.3. Thermodynamic Characteristics
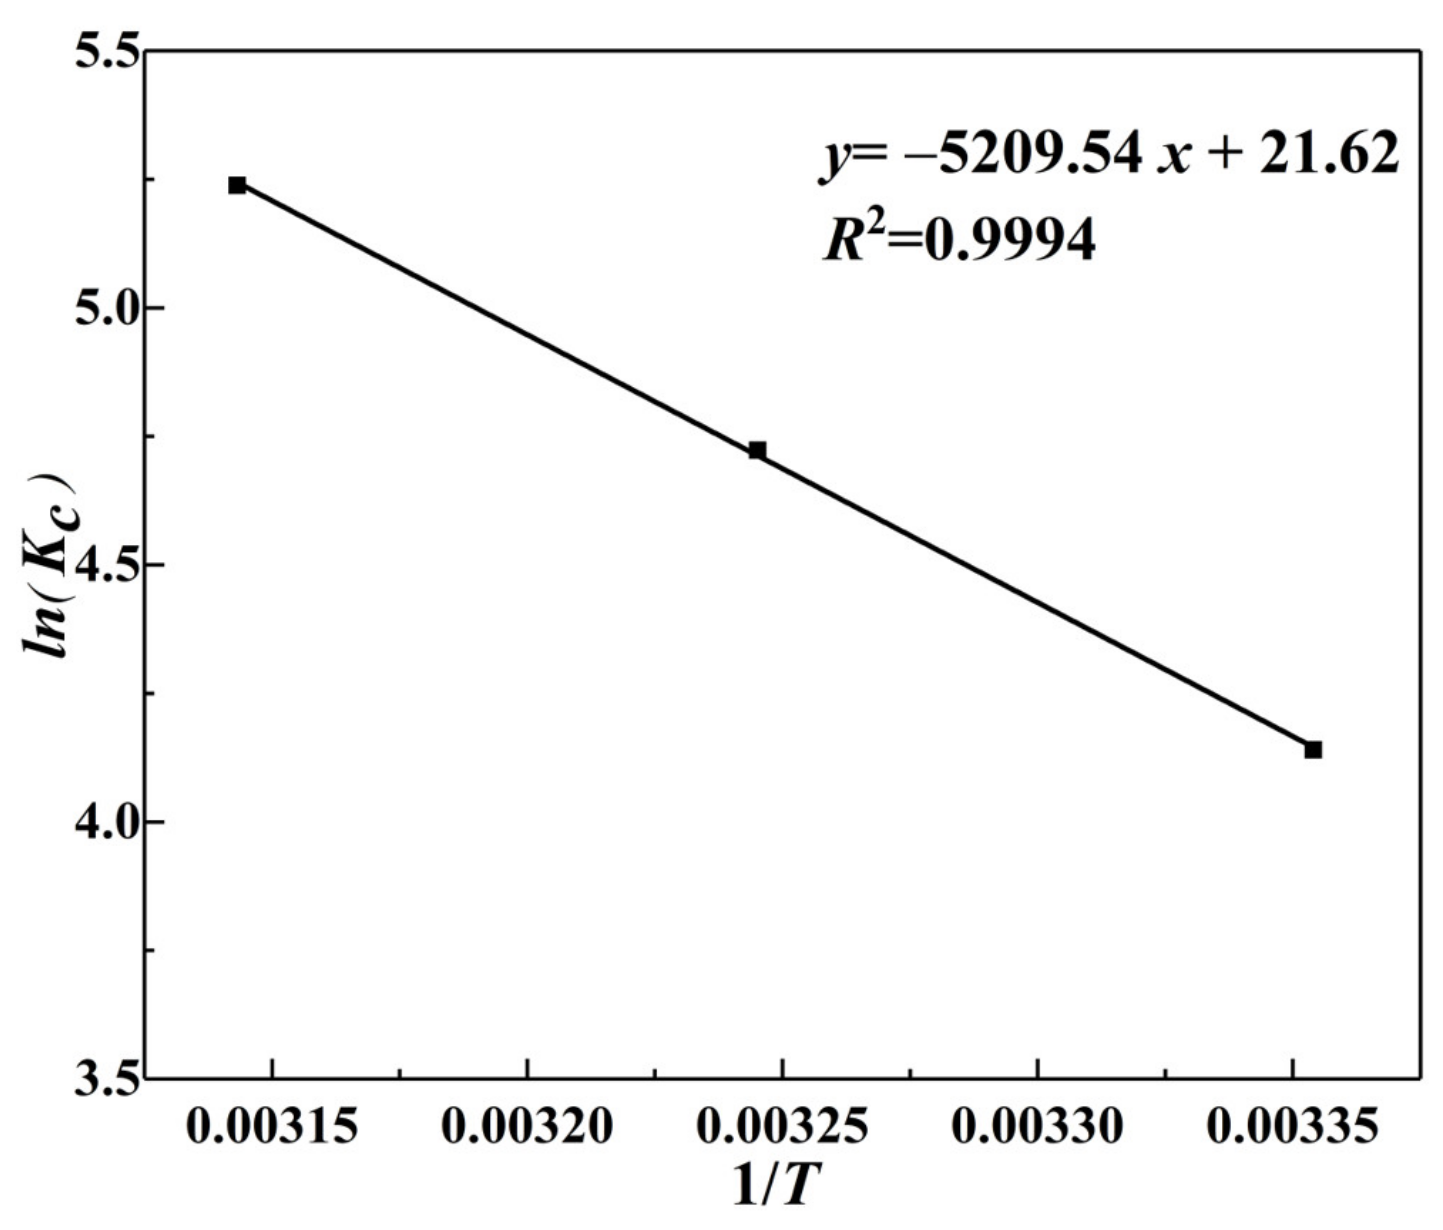
To analyze the effect of ambient temperature on the adsorption of Cr(VI) and the reaction process using thermodynamic parameters [64]. Figure 13 shows the linear equations of lnKc and 1/T calculated according to the experimental data, and Table 4 shows the thermodynamic parameters. This showed that ΔHθ was 43.31 kJ/mol, indicating that adsorption was an endothermic reaction. Then ΔSθ = 179.75 J/(mol·K) indicated that the adsorption of Cr(VI) was a large degree of disorder or randomness in the system. The ΔGθ values were negative at 298.15 K, 308.15 K, and 318.15 K, and the absolute value of ΔGθ increased with increasing temperature, indicating that the adsorption process of Cr(VI) was spontaneous. This result confirmed the previous results in Section 3.3.2 regarding the analysis of RL.
3.4. Performance Evaluation
Table 5 shows the comparison of Cr(VI) adsorption capacity between α–FeO(OH)/GOCS microsphere and other similar composites. The maximum adsorption capacities (qm) of α–FeO(OH)/GOCS for Cr(VI) were 63.43 mg/g (experimental data) and 63.19 mg/g (Sips model fitting result) under the conditions of C0 = 25 mg/L, pH = 3, m/v = 1.0 g/L. It could be seen that the qm value of Cr(VI) was higher than those for the most similar composite materials reported before, such as CS/magnetic bagasse biochar (8.78 mg/g) [65], magnetic glutaraldehyde cross-linked CS on nitrogen-doped GO (30.2 mg/g) [47], magnetite nanomaterials (34.87 mg/g) [66], fibrous mat of CS/polyvinyl alcohol/containing cerium(III) (52.88 mg/g) [67], magnetic CS (55.80 mg/g) [68] and Fe3O4 NPs/CS/glyoxal hydrogel (27.25 mg/g) [69], etc. These results indicate that α–FeO(OH)/GOCS microsphere had a good effect on Cr(VI) adsorption. Other similar chitosan-based composites, such as 1-butyl-3-methylimidazolium acetate modified CS (CS- [BMIM] [OAc], 125.63 mg/g) [31] and CS/cellulose nanocrystals/carbon dots composite (CNCD, 217.80 mg/g) [70], show a higher qm value than α–FeO(OH)/GOCS prepared in this study; these provided references for further optimization of the adsorption properties.

Table 5.
Adsorption capacity of other adsorbents for Cr(VI).
| Adsorbent | pH | Temperature (K) | C0 (mg/L) | qm (mg/g) | References |
|---|---|---|---|---|---|
| α–FeO(OH)/GOCS | 3.0 | 308.15 | 5–300 | 63.19 | This study |
| CS | 4.0 | 308.15 | 5–200 | 7.94 | [28] |
| Sea shell (CaO NPs) GO | 3.3 | 303.00 | 10–50 | 38.04 | [30] |
| Chitosan-[BMIM][OAc] | 3.0 | 298.15 | 50–300 | 125.63 | [31] |
| Reductive Fe2O3/GO (rGO) nanocomposite | 2.0 | 288.00 | 12.66–37.65 | 41.67 | [35] |
| Magnetic glutaraldehyde cross-linked CS on nitrogen-doped GO(MCC@NGO) | 3.0 | 297.00 | 4 | 30.20 | [47] |
| 2.0 | 297.00 | 2.7 | 15.90 | ||
| CMB(γ–Fe2O3) | 2.0 | 298.15 | 10–100 | 8.78 | [65] |
| Fe3O4 nanoparticle | – | 328.15 | 2–100 | 34.87 | [66] |
| Fibrous mat of CS/polyvinyl alcohol/containing cerium(III) | 4.0 | 208.15 | 10–50 | 52.88 | [67] |
| Magnetic CS | 3.0 | 298.00 | 60–180 | 55.80 | [68] |
| Fe3O4 NPs/CS/glyoxal hydrogel | 4.0 | 298.00 | 5–30 | 27.25 | [69] |
| CS/cellulose nanocrystals/carbon dots (CNCD) composite | 2.0 | 298.15 | 20–120 | 217.80 | [70] |
It was worth noting that the α–FeO(OH)/GOCS microsphere also had abundant functional groups, such as C–O, C = C, –CH, –OH, –NH2, and Fe–O, so it could be expected to remove other metal ions, organic pollutants, dyes, etc. This will be verified in future studies. In addition, the prepared α–FeO(OH)/GOCS in this study exhibited a high Cr(VI) removal ability in acidic aqueous solution, but a lower Cr(VI) removal ability in alkaline aqueous solution. This may limit the application of α–FeO(OH)/GOCS microsphere.
The advantages of the adsorbent were not only reflected in its high adsorption capacity but also in its stability and environmental benignness. However, few researchers have noted this problem before [21,35,39,40,71]. The removal rate (re) of Cr(VI) and Fe concentration of α–FeO(OH)/GOCS varied with pH, as shown in Figure S2, Supplementary Materials. It can be seen that the maximum amount of Fe concentration in α–FeO(OH)/GOCS was only 0.17 mg/L in the measured pH range, far lower than the World Health Organization (WHO) drinking water limit of 0.3 mg/L for Fe. In addition, the Fe concentration was only 0.14 mg/L at pH = 3, which was lower than that of Fe2O3/GOCS (0.179 mg/L) studied by Shan et al. (2021) [25]. When pH = 3, the re value of Cr(VI) reached 97.69%. It is higher than those of α–Fe2O3/GO nanocomposite (86.31%) [40], magnetic greigite/biochar (MGBs) composites (93.00%) [72], MnO2/CS nanocomposite (94.21%) [73] and polyamine modified carbon nanotube (PA–CNT) adsorbents (95.00%) [74]. These results indicated that the adsorbent did not cause secondary pollution to the environment, and at the same time retained good stability and a high removal rate in a strongly acidic solution. In addition, GOCS (a) and α–FeO(OH)/GOCS (b) appeared uniformly spherical at room temperature, as shown in the real diagrams of GOCS, and α–FeO(OH)/GOCS (Figure S4, Supplementary Materials) provided favorable conditions for recycling.
3.5. Adsorption Mechanism
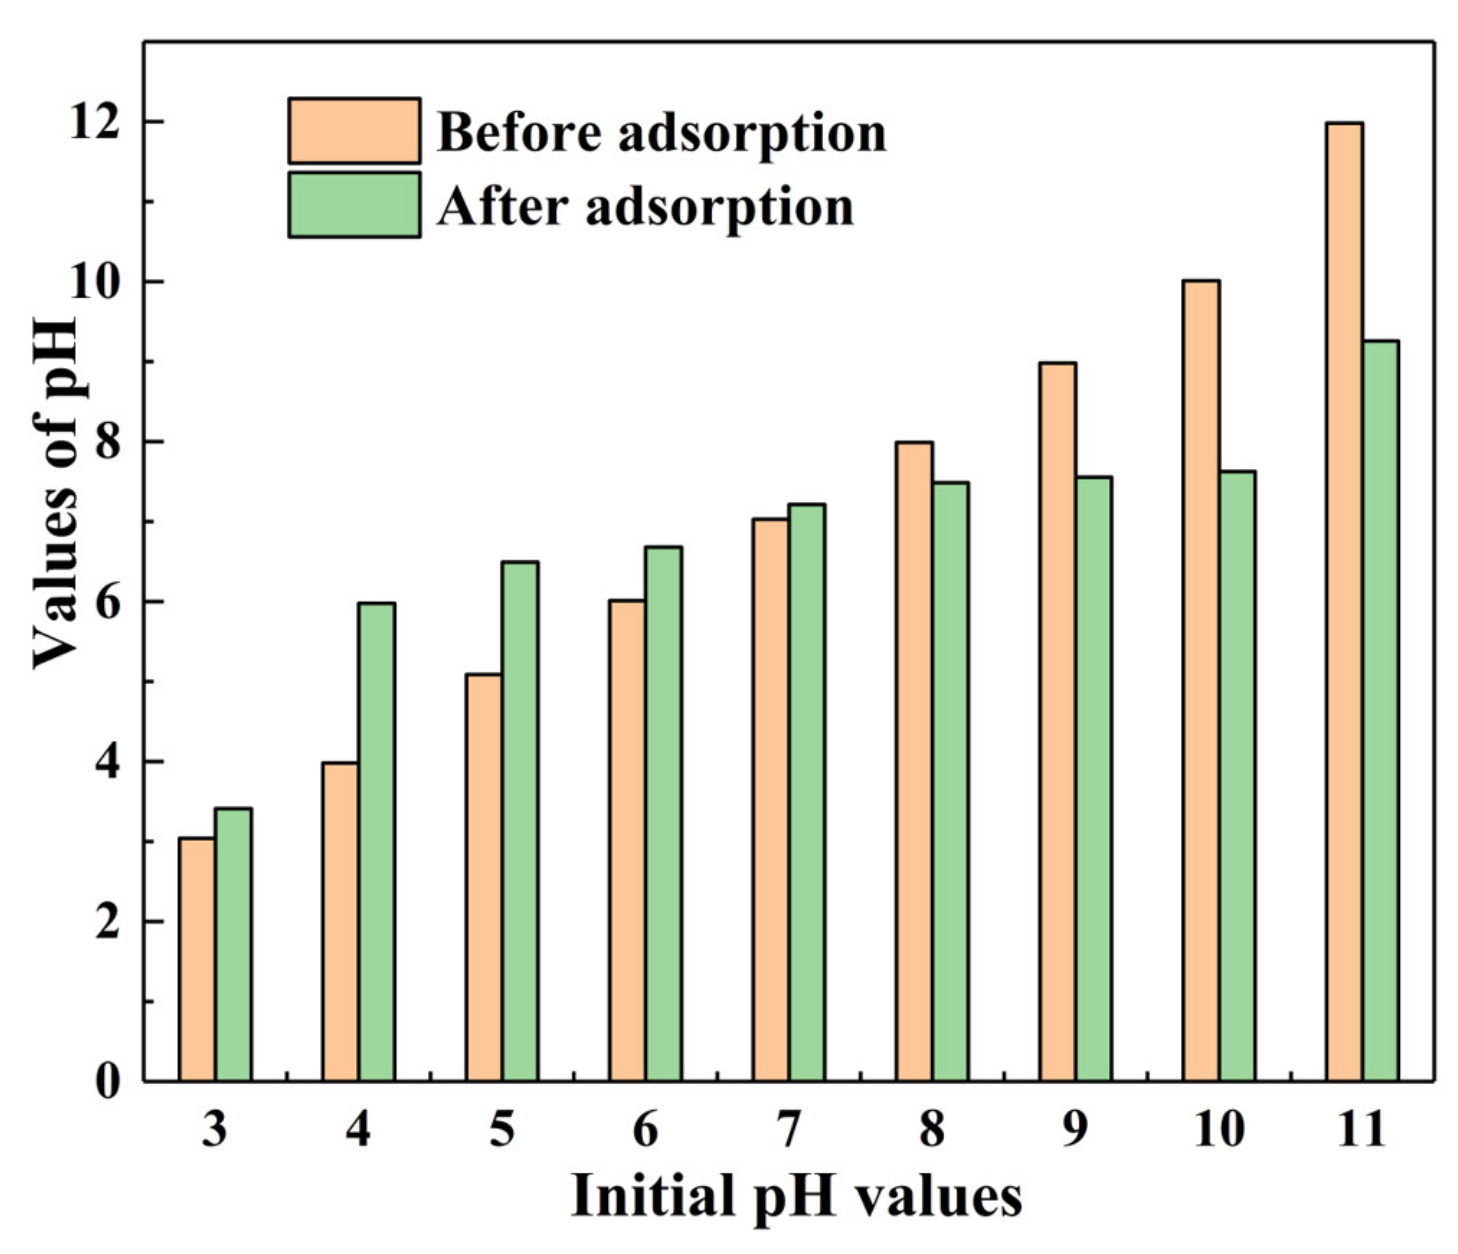
According to XRD, FT-IR, SEM-EDS, and XPS analysis and batch experimental results, there were two main factors affecting the adsorption of Cr(VI). One was the form of iron (α–FeO(OH)) and the functional groups (–OH, C–OH, Fe–O, etc.), and the other was the pH value of the aqueous solution. Figure 14 shows the pH changes of the solution after the Cr(VI) adsorption reached equilibrium. This showed that the pH value rose in acidic conditions when adsorption equilibrium was attained. This was due to the Fe–OH on the surface of α–FeO(OH)/GOCS being protonated to Fe–OH2+. Then, Cr(VI) was adsorbed by Fe–OH2+ combination with HCrO4− and Cr2O72− under electrostatic attraction. The pH value of the solution decreased after Cr(VI) adsorption under alkaline conditions, indicating the release of H+. This was mainly related to the deprotonation of Fe–OH2+. It could be seen that electrostatic attraction was one of the adsorption mechanisms for Cr(VI) removal. This result confirmed the analysis of the Fe–O peak in FT-IR and Fe–OH in XPS, and was listed as follows:
However, XPS analysis results showed that there was Fe (II) and Cr(III) on the surface of the microsphere. However, Fe(II) was not involved in reducing Cr(VI). The EDS analysis results showed that the O content on the microsphere surface increased after Cr(VI) adsorption. No Cr (III) was detected in the aqueous solution after adsorption. This indicated that adsorbed Cr(VI) was reduced by the hydroxyl groups (C–OH), and then the resulting Cr(III) precipitated in the form of Cr2O3 and/or Cr(OH)3 on the surface of the microspheres:
4. Conclusions
In this study, α–FeO(OH)/GOCS microspheres were prepared and used for Cr(VI) removal from aqueous solutions to examine their performance and adsorption mechanisms and to evaluate the possibility of secondary pollution. The following conclusions were summarized:
- (1)
- The factors of pH, m/v, coexisting ions, t, T, and C0 could affect Cr(VI) adsorption on the microspheres. The optimal conditions for Cr(VI) adsorption were pH = 3, m/v = 1.0 g/L, t = 3840 min, T = 308.15 K, and C0 = 25 mg/L. In addition, the qe value decreased with the increase in pH, m/v, and coexisting ions. However, the qe value decreased with increasing C0, t, and T. The existence of SO42− and Ca2+ could significantly decline Cr(VI) adsorption, and the qe value was reduced with the rise of the molar concentration of the anion and cation. In addition, α–FeO(OH)/GOCS microspheres did not cause secondary contamination during Cr(VI) adsorption, and the removal rate remained at 97.69% at pH = 3.
- (2)
- The adsorption of Cr(VI) was well fitted to the pseudo-second-order kinetic model with the determination coefficient (R2 = 0.9963), indicating that the process of adsorption was spontaneous and endothermic. Meanwhile, the adsorption of Cr(VI) followed the Langmuir and Sips models, suggesting heterogeneous monolayer adsorption. The maximum adsorption capacity of Cr(VI) was 63.19 mg/g at 308.15 K, which is much higher than the reported value in most similar composites.
- (3)
- The results of the performance evaluation indicated that the α–FeO(OH)/GOCS had a good effect on Cr(VI) adsorption and did not cause secondary pollution to the environment. After being modified by α–FeO(OH), the microspheres had various functional groups, such as C–O, C = C, C–H, C–OH, –NH2, –COOH, and Fe–O. Functional groups of –OH, C–OH, C–H, and Fe–O were involved in binding the Cr(VI) anions to α–FeO(OH)/GOCS, and the electrostatic attraction of Fe–OH2+ was one of the adsorption mechanisms for Cr(VI) removal. In addition, the adsorbed Cr(VI) was reduced by the hydroxyl groups (C–OH), and then the resulting Cr(III) precipitated in the form of Cr2O3 or Cr(OH)3 on the surface of the microspheres.
Supplementary Materials
The following supporting information can be downloaded at: https://www.mdpi.com/article/10.3390/ma15144909/s1, Figure S1: SEM images of GOCS (a, b), α–FeO(OH)/GOCS before (c, d)/after (e, f) adsorption, Figure S2: Cr(VI) removal rate and Fe concentration change with pH value, Figure S3: The RL of Cr(VI) adsorbed by α–FeO(OH)/GOCS, Figure S4: GOCS (a) and α–FeO(OH)/GOCS (b) microspheres.
Author Contributions
Y.L.: Writing—Original Draft, Conceptualization, and Methodology; H.S.: Supervision, Writing—Review & Editing; C.Z.: Visualization, Resources; H.Z.: Supervision, Writing—Review & Editing; Y.P.: Investigation, Validation. All authors have read and agreed to the published version of the manuscript.
Funding
This research was funded by the Natural Science Foundation of China (No. 41877194, No. 42167026), the Natural Science Foundation of Guangxi (2022GXNSFBA035600), the Guangxi Education Department (Qiangu Program), the Guangxi Key Laboratory of Theory and Technology for Environmental Pollution Control, and the Guilin University of Technology Program (GLUTQD 2016047), and the Innovation Project of Guangxi Graduate Education (No. YCSW2022337).
Institutional Review Board Statement
Not applicable.
Informed Consent Statement
Not applicable.
Data Availability Statement
All data used during the study appear in the submitted article.
Acknowledgments
The authors thank the three anonymous reviewers for their constructive comments, which helped improve the quality of the manuscript.
Conflicts of Interest
The authors declare no conflict of interest.
References
- Rehman, A.U.; Nazir, S.; Irshad, R.; Tahir, K.; Rehman, K.U.; Islam, R.U.; Wahab, Z. Toxicity of heavy metals in plants and animals and their uptake by magnetic iron oxide nanoparticles. J. Mol. Liq. 2020, 321, 114455. [Google Scholar] [CrossRef]
- Liu, S.; Chen, M.; Cao, X.; Li, G.; Zhang, D.; Li, M.; Meng, N.; Yin, J.; Yan, B. Chromium (VI) removal from water using cetylpyridinium chloride (CPC)-modified montmorillonite. Sep. Purif. Technol. 2020, 241, 116732. [Google Scholar] [CrossRef]
- Jiang, Y.; Liu, Z.; Zeng, G.; Liu, Y.; Shao, B.; Li, Z.; Liu, Y.; Zhang, W.; He, Q. Polyaniline-based adsorbents for removal of hexavalent chromium from aqueous solution: A mini review. Environ. Sci. Pollut. Res. 2018, 25, 6158–6174. [Google Scholar] [CrossRef] [PubMed]
- Zhang, X.; Gao, J.; Zhao, S.; Lei, Y.; Yuan, Y.; He, C.; Gao, C.; Deng, L. Hexavalent chromium removal from aqueous solution by adsorption on modified zeolites coated with Mg-layered double hydroxides. Environ. Sci. Pollut. Res. 2019, 26, 32928–32941. [Google Scholar] [CrossRef]
- Tekay, E.; Aydınoğlu, D.; Şen, S. Effective Adsorption of Cr(VI) by High Strength Chitosan/Montmorillonite Composite Hydrogels Involving Spirulina Biomass/Microalgae. J. Polym. Environ. 2019, 27, 1828–1842. [Google Scholar] [CrossRef]
- Shahid, M.; Shamshad, S.; Rafiq, M.; Khalid, S.; Bibi, I.; Niazi, N.K.; Dumat, C.; Rashid, M.I. Chromium speciation, bioavailability, uptake, toxicity and detoxification in soil-plant system: A review. Chemosphere 2017, 178, 513–533. [Google Scholar] [CrossRef]
- Cao, W.; Wang, Z.; Ao, H.; Yuan, B. Removal of Cr(VI) by corn stalk based anion exchanger: The extent and rate of Cr(VI) reduction as side reaction. Colloids Surf. A Physicochem. Eng. Asp. 2018, 539, 424–432. [Google Scholar] [CrossRef]
- Li, Y.; Zhu, S.; Liu, Q.; Chen, Z.; Gu, J.; Zhu, C.; Lu, T.; Zhang, D.; Ma, J. N-doped porous carbon with magnetic particles formed in situ for enhanced Cr(VI) removal. Water Res. 2013, 47, 4188–4197. [Google Scholar] [CrossRef]
- Liu, Y.; Sohi, S.P.; Liu, S.; Guan, J.; Zhou, J.; Chen, J. Adsorption and reductive degradation of Cr(VI) and TCE by a simply synthesized zero valent iron magnetic biochar. J. Environ. Manag. 2019, 235, 276–281. [Google Scholar] [CrossRef]
- Li, X.; Chen, D.; Li, N.; Xu, Q.; Li, H.; He, J.; Lu, J. Efficient reduction of Cr(VI) by a BMO/Bi2S3 heterojunction via synergistic adsorption and photocatalysis under visible light. J. Hazard. Mater. 2020, 400, 123243. [Google Scholar] [CrossRef]
- Lihua, L.; Li, T.; Yang, G.; Wang, Y.; Tang, A.; Ling, Y. Synthesis of thiol-functionalized mesoporous calcium silicate and its adsorption characteristics for heavy metal ions. J. Environ. Chem. Eng. 2017, 5, 6201–6215. [Google Scholar] [CrossRef]
- Nasseh, N.; Khosravi, R.; Abu Rumman, G.; Ghadirian, M.; Eslami, H.; Khoshnamvand, M.; Al-Musawi, T.J.; Khosravi, A. Adsorption of Cr(VI) ions onto powdered activated carbon synthesized from Peganum harmala seeds by ultrasonic waves activation. Environ. Technol. Innov. 2020, 21, 101277. [Google Scholar] [CrossRef]
- Zhang, X.; Zhao, S.; Gao, J.; Lei, Y.; Yuan, Y.; Jiang, Y.; Xu, Z.; He, C. Microbial action and mechanisms for Cr(VI) removal performance by layered double hydroxide modified zeolite and quartz sand in constructed wetlands. J. Environ. Manag. 2019, 246, 636–646. [Google Scholar] [CrossRef]
- Yang, R.; Wang, H.; Shi, M.; Jiang, Y.; Dong, Y.; Shi, L. Biosurfactant rhamnolipid affacts the desorption of sorbed As(III), As(V), Cr(VI), Cd(II) and Pb(II) on iron (oxyhydr)oxides and clay minerals. Int. Biodeterior. Biodegrad. 2020, 153, 105019. [Google Scholar] [CrossRef]
- Han, S.; Zang, Y.; Gao, Y.; Yue, Q.; Zhang, P.; Kong, W.; Jin, B.; Xu, X.; Gao, B. Co-monomer polymer anion exchange resin for removing Cr(VI) contaminants: Adsorption kinetics, mechanism and performance. Sci. Total Environ. 2019, 709, 136002. [Google Scholar] [CrossRef]
- Zhang, B.; Hu, R.; Sun, D.; Wu, T.; Li, Y. Fabrication of chitosan/magnetite-graphene oxide composites as a novel bioadsorbent for adsorption and detoxification of Cr(VI) from aqueous solution. Sci. Rep. 2018, 8, 15397. [Google Scholar] [CrossRef] [Green Version]
- Li, L.; Fan, L.; Sun, M.; Qiu, H.; Li, X.; Duan, H.; Luo, C. Adsorbent for chromium removal based on graphene oxide functionalized with magnetic cyclodextrin–chitosan. Colloids Surf. B Biointerfaces 2013, 107, 76–83. [Google Scholar] [CrossRef]
- Kumara, A.S.K.; Jiang, S.-J. Chitosan-functionalized graphene oxide: A novel adsorbent an efficient adsorption of arsenic from aqueous solution. J. Environ. Chem. Eng. 2016, 4, 1698–1713. [Google Scholar] [CrossRef]
- Singh, S.; Anil, A.G.; Khasnabis, S.; Kumar, V.; Nath, B.; Adiga, V.; Naik, T.S.K.; Subramanian, S.; Kumar, V.; Singh, J.; et al. Sustainable removal of Cr(VI) using graphene oxide-zinc oxide nanohybrid: Adsorption kinetics, isotherms and thermodynamics. Environ. Res. 2021, 203, 111891. [Google Scholar] [CrossRef]
- Shan, H.; Peng, S.; Zhao, C.; Zhan, H.; Zeng, C. Highly efficient removal of As(III) from aqueous solutions using goethite/graphene oxide/chitosan nanocomposite. Int. J. Biol. Macromol. 2020, 164, 13–26. [Google Scholar] [CrossRef]
- Subedi, N.; Lähdea, A.; Abu-Danso, E.; Iqbal, J.; Bhatnagara, A. A comparative study of magnetic chitosan (Chi@Fe3O4) and graphene oxide modified magnetic chitosan (Chi@Fe3O4GO) nanocomposites for efficient removal of Cr(VI) from water. Int. J. Biol. Macromol. 2019, 137, 948–959. [Google Scholar] [CrossRef]
- Reynosa-Martínez, A.; Tovar, G.N.; Gallegos, W.; Rodríguez-Meléndez, H.; Torres-Cadena, R.; Mondragón-Solórzano, G.; Barroso-Flores, J.; Alvarez-Lemus, M.; Montalvo, V.G.; López-Honorato, E. Effect of the degree of oxidation of graphene oxide on As(III) adsorption. J. Hazard. Mater. 2019, 384, 121440. [Google Scholar] [CrossRef] [Green Version]
- Keshvardoostchokami, M.; Majidi, M.; Zamani, A.; Liu, B. A review on the use of chitosan and chitosan derivatives as the bio-adsorbents for the water treatment: Removal of nitrogen-containing pollutants. Carbohydr. Polym. 2021, 273, 118625. [Google Scholar] [CrossRef]
- Deng, Y.; Kano, N.; Imaizumi, H. Adsorption of Cr(VI) onto Hybrid Membrane of Carboxymethyl Chitosan and Silicon Dioxide. J. Chem. 2017, 2017, 3426923. [Google Scholar] [CrossRef]
- Shan, H.; Zeng, C.; Zhao, C.; Zhan, H. Iron oxides decorated graphene oxide/chitosan composite beads for enhanced Cr(VI) removal from aqueous solution. Int. J. Biol. Macromol. 2021, 172, 197–209. [Google Scholar] [CrossRef]
- Parastar, M.; Sheshmani, S.; Shokrollahzadeh, S. Cross-linked chitosan into graphene oxide-iron(III) oxide hydroxide as nano-biosorbent for Pd(II) and Cd(II) removal. Int. J. Biol. Macromol. 2020, 166, 229–237. [Google Scholar] [CrossRef]
- Kong, D.; He, L.; Li, H.; Zhang, F.; Song, Z. Preparation and characterization of graphene oxide/chitosan composite aerogel with high adsorption performance for Cr(VI) by a new crosslinking route. Colloids Surf. A Physicochem. Eng. Asp. 2021, 625, 126832. [Google Scholar] [CrossRef]
- Aydın, Y.A.; Aksoy, N.D. Adsorption of chromium on chitosan: Optimization, kinetics and thermodynamics. Chem. Eng. J. 2009, 151, 188–194. [Google Scholar] [CrossRef]
- Samuel, M.S.; Bhattacharya, J.; Raj, S.; Santhanam, N.; Singh, H.; Singh, N.P. Efficient removal of Chromium(VI) from aqueous solution using chitosan grafted graphene oxide (CS-GO) nanocomposite. Int. J. Biol. Macromol. 2018, 121, 285–292. [Google Scholar] [CrossRef]
- Singh, S.; Naik, T.S.S.K.; Anil, A.G.; Khasnabis, S.; Nath, B.; Basavaraju, U.; Kumar, V.; Garg, V.K.; Subramanian, S.; Singh, J.; et al. A novel CaO nanocomposite cross linked graphene oxide for Cr(VI) removal and sensing from wastewater. Chemosphere 2022, 301, 134714. [Google Scholar] [CrossRef]
- Sheth, Y.; Dharaskar, S.; Khalid, M.; Walvekar, R. Investigating chromium Cr(VI) removal using imidazolium based ionic liquid-chitosan composite adsorptive film. J. Mol. Liq. 2021, 347, 118317. [Google Scholar] [CrossRef]
- Zeng, J.; Qi, P.; Shi, J.; Pichler, T.; Wang, F.; Wang, Y.; Sui, K. Chitosan functionalized iron nanosheet for enhanced removal of As(III) and Sb(III): Synergistic effect and mechanism. Chem. Eng. J. 2019, 382, 122999. [Google Scholar] [CrossRef]
- Guo, X.; Du, B.; Wei, Q.; Yang, J.; Hu, L.; Yan, L.; Xu, W. Synthesis of amino functionalized magnetic graphenes composite material and its application to remove Cr(VI), Pb(II), Hg(II), Cd(II) and Ni(II) from contaminated water. J. Hazard. Mater. 2014, 278, 211–220. [Google Scholar] [CrossRef] [PubMed]
- Li, Y.; Dong, X.; Zhao, L. Application of magnetic chitosan nanocomposites modified by graphene oxide and polyethyleneimine for removal of toxic heavy metals and dyes from water. Int. J. Biol. Macromol. 2021, 192, 118–125. [Google Scholar] [CrossRef]
- Kong, C.; Li, M.; Li, J.; Ma, X.; Feng, C.; Liu, X. One-step synthesis of Fe2O3 nano-rod modified reduced graphene oxide composites for effective Cr(vi) removal: Removal capability and mechanism. RSC Adv. 2019, 9, 20582–20592. [Google Scholar] [CrossRef] [Green Version]
- Ali, A.M.; Yahya, N.; Qureshi, S. Interactions of ferro-nanoparticles (hematite and magnetite) with reservoir sandstone: Implications for surface adsorption and interfacial tension reduction (Retraction of Vol 17, Pg 1037, 2020). Pet. Sci. 2022, 19, 927. [Google Scholar] [CrossRef]
- Tian, R.; Xian, L.; Li, Y.; Zheng, X. Silica Modified Chitosan/Polyethylenimine Nanogel for Improved Stability and Gene Carrier Ability. J. Nanosci. Nanotechnol. 2016, 16, 5426–5431. [Google Scholar] [CrossRef]
- Allafchian, A.; Mousavi, Z.S.; Hosseini, S.S. Application of cress seed musilage magnetic nanocomposites for removal of methylene blue dye from water. Int. J. Biol. Macromol. 2019, 136, 199–208. [Google Scholar] [CrossRef]
- Chen, D.; Li, W.; Wu, Y.; Zhu, Q.; Lu, Z.; Du, G. Preparation and characterization of chitosan/montmorillonite magnetic microspheres and its application for the removal of Cr (VI). Chem. Eng. J. 2013, 221, 8–15. [Google Scholar] [CrossRef]
- Bulin, C.; Li, B.; Zhang, Y.H.; Zhang, B.W. Removal performance and mechanism of nano alpha-Fe2O3/graphene oxide on aqueous Cr(VI). J. Phys. Chem. Solids 2020, 147, 109659. [Google Scholar] [CrossRef]
- Lv, X.; Zhang, Y.; Fu, W.; Cao, J.; Zhang, J.; Ma, H.; Jiang, G. Zero-valent iron nanoparticles embedded into reduced graphene oxide-alginate beads for efficient chromium (VI) removal. J. Colloid Interface Sci. 2017, 506, 633–643. [Google Scholar] [CrossRef]
- Ni, Y.H.; Ge, X.W.; Liu, H.R.; Zhang, Z.C.; Ye, Q.; Wang, F. Synthesis and characterization of alpha-FeO(OH) nano-rods in situ via a solution-oxidation. Mater. Lett. 2001, 49, 185–188. [Google Scholar] [CrossRef]
- Lakshmipathiraj, P.; Narasimhan, B.R.V.; Prabhakar, S.; Raju, G.B. Adsorption of arsenate on synthetic goethite from aqueous solutions. J. Hazard. Mater. 2006, 136, 281–287. [Google Scholar] [CrossRef]
- Song, X.L.; Li, L.; Geng, Z.R.; Zhou, L.; Ji, L.J. Effective and selective adsorption of As(III) via imprinted magnetic Fe3O4/HTCC composite nanoparticles. J. Environ. Chem. Eng. 2017, 5, 16–25. [Google Scholar] [CrossRef]
- Chethan, P.; Vishalakshi, B.; Sathish, L.; Ananda, K.; Poojary, B. Preparation of substituted quaternized arylfuran chitosan derivatives and their antimicrobial activity. Int. J. Biol. Macromol. 2013, 59, 158–164. [Google Scholar] [CrossRef]
- Sheshmani, S.; Nematzadeh, M.A.; Shokrollahzadeh, S.; Ashori, A. Preparation of graphene oxide/chitosan/FeOOH nanocomposite for the removal of Pb(II) from aqueous solution. Int. J. Biol. Macromol. 2015, 80, 475–480. [Google Scholar] [CrossRef]
- Moghaddam, A.Z.; Esmaeilkhanian, E.; Shakourian-Fard, M. Immobilizing magnetic glutaraldehyde cross-linked chitosan on graphene oxide and nitrogen-doped graphene oxide as well-dispersible adsorbents for chromate removal from aqueous solutions. Int. J. Biol. Macromol. 2019, 128, 61–73. [Google Scholar] [CrossRef]
- Mischler, S.; Mathieu, H.J.; Landolt, D. The Investigation of Passive Films on Iron-Chromium Alloys by AES and XPS. Surf. Interface Anal. 1988, 12, 429–444. [Google Scholar] [CrossRef]
- Moffat, T.; Latanision, R.; Ruf, R. An X-ray photoelectron spectroscopy study of chromium-metalloid alloys—III. Electrochim. Acta 1995, 40, 1723–1734. [Google Scholar] [CrossRef]
- Navarathna, C.M.; Karunanayake, A.G.; Gunatilake, S.R.; Pittman, C.U.; Perez, F.; Mohan, D.; Mlsna, T. Removal of Arsenic(III) from water using magnetite precipitated onto Douglas fir biochar. J. Environ. Manag. 2019, 250, 109429. [Google Scholar] [CrossRef]
- Tan, B.J.; Klabunde, K.J.; Sherwood, P.M.A. X-ray photoelectron spectroscopy studies of solvated metal atom dispersed catalysts. Monometallic iron and bimetallic iron-cobalt particles on alumina. Chem. Mater. 1990, 2, 186–191. [Google Scholar] [CrossRef]
- Samuel, M.S.; Shah, S.S.; Subramaniyan, V.; Qureshi, T.; Bhattacharya, J.; Singh, N.P. Preparation of graphene oxide/chitosan/ferrite nanocomposite for Chromium(VI) removal from aqueous solution. Int. J. Biol. Macromol. 2018, 119, 540–547. [Google Scholar] [CrossRef]
- Periyasamy, S.; Manivasakan, P.; Jeyaprabha, C.; Meenakshi, S.; Viswanathan, N. Fabrication of nano-graphene oxide assisted hydrotalcite/chitosan biocomposite: An efficient adsorbent for chromium removal from water. Int. J. Biol. Macromol. 2019, 132, 1068–1078. [Google Scholar] [CrossRef]
- Chitrakar, R.; Tezuka, S.; Sonoda, A.; Sakane, K.; Ooi, K.; Hirotsu, T. Phosphate adsorption on synthetic goethite and akaganeite. J. Colloid Interface Sci. 2006, 298, 602–608. [Google Scholar] [CrossRef]
- Jabeen, H.; Chandra, V.; Jung, S.; Lee, J.W.; Kim, K.S.; Bin Kim, S. Enhanced Cr(vi) removal using iron nanoparticle decorated graphene. Nanoscale 2011, 3, 3583–3585. [Google Scholar] [CrossRef] [Green Version]
- Zimmermann, A.C.; Mecabô, A.; Fagundes, T.; Rodrigues, C.A. Adsorption of Cr(VI) using Fe-crosslinked chitosan complex (Ch-Fe). J. Hazard. Mater. 2010, 179, 192–196. [Google Scholar] [CrossRef]
- Ho, Y.S.; McKay, G. Pseudo-second order model for sorption processes. Process Biochem. 1999, 34, 451–465. [Google Scholar] [CrossRef]
- Ferreira, A.S.; Mota, A.A.; Oliveira, A.M.; Rodrigues, F.I.L.; Pacífico, S.N.; Da Silva, J.E.; Abagaro, B.T.O.; Saraiva, G.D.; de Castro, A.J.R.; Teixeira, R.N.P.; et al. Equilibrium and Kinetic Modelling of Adsorption: Evaluating the Performance of an Adsorbent in Softening Water for Irrigation and Animal Consumption. Rev. Virtual Quim. 2019, 11, 1752–1766. [Google Scholar] [CrossRef]
- Liu, L.; Fan, S. Removal of cadmium in aqueous solution using wheat straw biochar: Effect of minerals and mechanism. Environ. Sci. Pollut. Res. 2018, 25, 8688–8700. [Google Scholar] [CrossRef] [PubMed]
- Chen, S.; Tian, Z. Simulation of thermal micro-flow using lattice Boltzmann method with Langmuir slip model. Int. J. Heat Fluid Flow 2010, 31, 227–235. [Google Scholar] [CrossRef]
- Stromer, B.S.; Woodbury, B.; Williams, C.F. Tylosin sorption to diatomaceous earth described by Langmuir isotherm and Freundlich isotherm models. Chemosphere 2018, 193, 912–920. [Google Scholar] [CrossRef]
- Pillewan, P.; Mukherjee, S.; Roychowdhury, T.; Das, S.; Bansiwal, A.; Rayalu, S. Removal of As(III) and As(V) from water by copper oxide incorporated mesoporous alumina. J. Hazard. Mater. 2011, 186, 367–375. [Google Scholar] [CrossRef]
- Wang, S.; Gao, B.; Li, Y.; Mosa, A.; Zimmerman, A.R.; Ma, L.Q.; Harris, W.G.; Migliaccio, K.W. Manganese oxide-modified biochars: Preparation, characterization, and sorption of arsenate and lead. Bioresour. Technol. 2015, 181, 13–17. [Google Scholar] [CrossRef]
- Gaur, J.; Mishra, R. Estimation of thermodynamic parameters for Au- and Mg-based metallic glasses. Chem. Phys. Lett. 2017, 685, 244–250. [Google Scholar] [CrossRef]
- Xuemei, L.; Chuang, M.; Fan, W.; Bei, Z. Adsorption of Cr(VI) on Chitosan/Magnetic Bagasse Biochar Composite Material. Hydrometall. China 2019, 38, 208–214. (In Chinese) [Google Scholar]
- Rajput, S.; Pittman, C.U., Jr.; Mohan, D. Magnetic magnetite (Fe3O4) nanoparticle synthesis and applications for lead (Pb2+) and chromium (Cr6+) removal from water. J. Colloid Interface Sci. 2016, 468, 334–346. [Google Scholar] [CrossRef]
- Wang, F.; Ge, M. Fibrous mat of chitosan/polyvinyl alcohol/containing cerium(III) for the removal of chromium(VI) from aqueous solution. Text. Res. J. 2012, 83, 628–637. [Google Scholar] [CrossRef]
- Thinh, N.N.; Hanh, P.T.B.; Ha, L.T.T.; Anh, L.N.; Hoang, T.V.; Hoang, V.D.; Dang, L.H.; Van Khoi, N.; Lam, T.D. Magnetic chitosan nanoparticles for removal of Cr(VI) from aqueous solution. Mater. Sci. Eng. C 2013, 33, 1214–1218. [Google Scholar] [CrossRef]
- Mirabedini, M.; Kassaee, M.Z.; Poorsadeghi, S. Novel Magnetic Chitosan Hydrogel Film, Cross-Linked with Glyoxal as an Efficient Adsorbent for Removal of Toxic Cr(VI) from Water. Arab. J. Sci. Eng. 2016, 42, 115–124. [Google Scholar] [CrossRef]
- Zeng, H.; Hu, Z.; Peng, C.; Deng, L.; Liu, S. Effective Adsorption and Sensitive Detection of Cr(VI) by Chitosan/Cellulose Nanocrystals Grafted with Carbon Dots Composite Hydrogel. Polymers 2021, 13, 3788. [Google Scholar] [CrossRef]
- Khalil, T.E.; Elhusseiny, A.F.; Ibrahim, N.M.; El-Dissouky, A. Unexpected effect of magnetic nanoparticles on the performance of aqueous removal of toxic Cr(VI) using modified biopolymer chitosan. Int. J. Biol. Macromol. 2020, 170, 768–779. [Google Scholar] [CrossRef]
- Wang, X.; Xu, J.; Liu, J.; Liu, J.; Xia, F.; Wang, C.; Dahlgren, R.A.; Liu, W. Mechanism of Cr(VI) removal by magnetic greigite/biochar composites. Sci. Total Environ. 2019, 700, 134414. [Google Scholar] [CrossRef]
- Dinh, V.P.; Nguyen, M.D.; Nguyen, Q.H.; Do, T.T.T.; Luu, T.T.; Luu, A.T.; Tap, T.D.; Ho, T.H.; Phan, T.P.; Nguyen, T.D.; et al. Chitosan-MnO2 nanocomposite for effective removal of Cr (VI) from aqueous solution. Chemosphere 2020, 257, 127147. [Google Scholar] [CrossRef]
- Jia, D.; Jing, Z.; Duan, Y.; Li, J. Ultrafast removal of Cr(VI) ions using polyamine modified carbon nanotubes. J. Taiwan Inst. Chem. Eng. 2022, 133, 104265. [Google Scholar] [CrossRef]
Figure 1.
XRD patterns of GO, CS, GOCS, α–FeO(OH)/GOCS before Cr(VI) adsorption, and that of α–FeO(OH)/GOCS after adsorption for Cr(VI).
Figure 1.
XRD patterns of GO, CS, GOCS, α–FeO(OH)/GOCS before Cr(VI) adsorption, and that of α–FeO(OH)/GOCS after adsorption for Cr(VI).

Figure 2.
FT-IR spectra of GO, CS, GOCS, α–FeO(OH)/GOCS before Cr(VI) adsorption, and that of α–FeO(OH)/GOCS after adsorption for Cr(VI).
Figure 2.
FT-IR spectra of GO, CS, GOCS, α–FeO(OH)/GOCS before Cr(VI) adsorption, and that of α–FeO(OH)/GOCS after adsorption for Cr(VI).

Figure 3.
EDS spectra of GOCS (a), α–FeO(OH)/GOCS before (b) and after (c) Cr(VI) adsorption.

Figure 4.
The XPS response spectra of Cr2p (a) after Cr(VI) adsorption, and C1s (b), O1s (c), N1s (d), and Fe2p (e) before and after Cr(VI) adsorption.
Figure 4.
The XPS response spectra of Cr2p (a) after Cr(VI) adsorption, and C1s (b), O1s (c), N1s (d), and Fe2p (e) before and after Cr(VI) adsorption.

Figure 5.
Changes in equilibrium adsorption capacity of Cr(VI) with pH value.

Figure 6.
Changes in equilibrium adsorption capacity (qe) and removal rate (re) of Cr(VI) with m/v values.
Figure 6.
Changes in equilibrium adsorption capacity (qe) and removal rate (re) of Cr(VI) with m/v values.

Figure 7.
Effects of coexisting ions on Cr(VI) equilibrium adsorption capacity (qe).

Figure 8.
Cr(VI) adsorption amount (qt) and removal rate (rt) changes with the increasing contact time at 298.15 K, respectively.
Figure 8.
Cr(VI) adsorption amount (qt) and removal rate (rt) changes with the increasing contact time at 298.15 K, respectively.

Figure 9.
Influence of initial concentration on Cr(VI) adsorption by α–FeO(OH)/GOCS.

Figure 10.
Pseudo-first-order kinetic plot (a) and pseudo-second-order kinetic (b) plot for Cr (VI) adsorption on α–FeO(OH)/GOCS at 298.15 K.
Figure 10.
Pseudo-first-order kinetic plot (a) and pseudo-second-order kinetic (b) plot for Cr (VI) adsorption on α–FeO(OH)/GOCS at 298.15 K.

Figure 11.
Fitting curve of the Weber-Morris model for Cr (VI) adsorption by α–FeO(OH)/GOCS at 298.15 K.
Figure 11.
Fitting curve of the Weber-Morris model for Cr (VI) adsorption by α–FeO(OH)/GOCS at 298.15 K.

Figure 12.
Adsorption isotherm fitting curves of Cr(VI) on the α–FeO(OH)/GOCS.

Figure 13.
Van’t Hoff curve of α–FeO(OH)/GOCS adsorption of Cr(VI).

Figure 14.
pH change of Cr(VI) adsorption equilibrium at initial pH of 3 to 11 Changes in pH during Cr(VI) removal (or adsorption) at 298.15 K.
Figure 14.
pH change of Cr(VI) adsorption equilibrium at initial pH of 3 to 11 Changes in pH during Cr(VI) removal (or adsorption) at 298.15 K.

Table 1.
Parameters of the adsorption kinetics model.
| Adsorbed Substance | Temperature | Pseudo-First-Order | ||
|---|---|---|---|---|
| Cr(VI) | 298.15 K | qe (mg/g) | K1 | R2 |
| 24.16 | 0.0020 | 0.9647 | ||
| Pseudo-second-order | ||||
| qe (mg/g) | K2 | R2 | ||
| 26.10 | 0.0002 | 0.9963 | ||
The actual pH value of the aqueous solution was 3.0, the initial concentration of Cr(VI) was 25 mg/L, and the reaction time was 3840 min. The adsorption was carried out at an oscillation rate of 170 rpm and a temperature of 298.15 K.
Table 2.
Parameters of the Weber-Morris model.
| Adsorbed Substance | Temperature | Time/min | Parameter | |
|---|---|---|---|---|
| Cr(VI) | 298.15 K | 0–180 | Kid1 | Ci1 |
| 0.7876 | –1.0253 | |||
| 300–1260 | Kid2 | Ci2 | ||
| 0.5503 | 3.8360 | |||
| 1860–3840 | Kid3 | Ci3 | ||
| 0.0336 | 22.3646 | |||
The actual pH value of an aqueous solution was 3.0, the initial concentration of Cr(VI) was 25 mg/L, and the reaction time was 3840 min. The adsorption was carried out at an oscillation rate of 170 rpm and a temperature of 298.15 K.
Table 3.
Adsorption isothermal model parameters.
| Temperature (K) | Langmuir | Freundlich | Sips | |||||||
|---|---|---|---|---|---|---|---|---|---|---|
| qm (mg/g) | KL | R2 | KF | n | R2 | qm (mg/g) | Ks | 1/m | R2 | |
| 298.15 | 56.58 | 0.030 | 0.9673 | 8.22 | 2.97 | 0.8337 | 49.37 | 0.006 | 1.61 | 0.9885 |
| 308.15 | 73.68 | 0.022 | 0.9804 | 7.69 | 2.58 | 0.8765 | 63.19 | 0.005 | 1.51 | 0.9964 |
| 318.15 | 77.62 | 0.022 | 0.9650 | 8.28 | 2.61 | 0.8410 | 64.77 | 0.002 | 1.76 | 0.9962 |
The actual pH value of the aqueous solution was 3.0, the initial concentration of Cr(VI) was 25 mg/L, and the reaction time was 3840 min. The adsorption was carried out at an oscillation rate of 170 rpm and a temperature of 298.15 K.
Table 4.
Thermodynamic parameters.
| Temperature (K) | ΔGθ (kJ/mol) | ΔSθ [J/(mol·K)] | ΔHθ (kJ/mol) |
|---|---|---|---|
| 298.15 | –10.28 | 179.75 | 43.31 |
| 308.15 | –12.08 | ||
| 318.15 | –13.87 |
Publisher’s Note: MDPI stays neutral with regard to jurisdictional claims in published maps and institutional affiliations. |
© 2022 by the authors. Licensee MDPI, Basel, Switzerland. This article is an open access article distributed under the terms and conditions of the Creative Commons Attribution (CC BY) license (https://creativecommons.org/licenses/by/4.0/).
Share and Cite
MDPI and ACS Style
Liu, Y.; Shan, H.; Zeng, C.; Zhan, H.; Pang, Y. Removal of Cr(VI) from Wastewater Using Graphene Oxide Chitosan Microspheres Modified with α–FeO(OH). Materials 2022, 15, 4909. https://doi.org/10.3390/ma15144909
AMA Style
Liu Y, Shan H, Zeng C, Zhan H, Pang Y. Removal of Cr(VI) from Wastewater Using Graphene Oxide Chitosan Microspheres Modified with α–FeO(OH). Materials. 2022; 15(14):4909. https://doi.org/10.3390/ma15144909
Chicago/Turabian StyleLiu, Yunquan, Huimei Shan, Chunya Zeng, Hongbin Zhan, and Yanyue Pang. 2022. "Removal of Cr(VI) from Wastewater Using Graphene Oxide Chitosan Microspheres Modified with α–FeO(OH)" Materials 15, no. 14: 4909. https://doi.org/10.3390/ma15144909
Note that from the first issue of 2016, this journal uses article numbers instead of page numbers. See further details here.