
Reduced Order Multiscale Simulation of Diffuse Damage in Concrete


1
Institute for Structural Mechanics, Ruhr University Bochum, Universitaetsstrasse 150, 44801 Bochum, Germany
2
Chair of Materials Science and Testing, Centre for Building Materials, Technical University of Munich, Franz-Langinger-Strasse 10, 81245 Munich, Germany
*
Author to whom correspondence should be addressed.
Materials 2021, 14(14), 3830; https://doi.org/10.3390/ma14143830
Submission received: 10 June 2021
/
Revised: 1 July 2021
/
Accepted: 5 July 2021
/
Published: 8 July 2021
(This article belongs to the Special Issue Concrete and Construction Materials)
Abstract
:Damage in concrete structures initiates as the growth of diffuse microcracks that is followed by damage localisation and eventually leads to structural failure. Weak changes such as diffuse microcracking processes are failure precursors. Identification and characterisation of these failure precursors at an early stage of concrete degradation and application of suitable precautionary measures will considerably reduce the costs of repair and maintenance. To this end, a reduced order multiscale model for simulating microcracking-induced damage in concrete at the mesoscale level is proposed. The model simulates the propagation of microcracks in concrete using a two-scale computational methodology. First, a realistic concrete specimen that explicitly resolves the coarse aggregates in a mortar matrix was generated at the mesoscale. Microcrack growth in the mortar matrix is modelled using a synthesis of continuum micromechanics and fracture mechanics. Model order reduction of the two-scale model is achieved using a clustering technique. Model predictions are calibrated and validated using uniaxial compression tests performed in the laboratory.
1. Introduction
Concrete is a heterogeneous, multiphase material with a disordered material structure across multiple length scales. At the mesoscopic scale ( m m), concrete is characterised by coarse aggregates of various shapes and sizes embedded in a cementitious mortar material. The morphology of the mortar matrix around the length scale of m is also highly heterogeneous and comprises of the hardened cement paste and the fine aggregates (sand). At length scales smaller than m, cement paste is characterised by a C-S-H matrix hosting clinker phases, the CH crystal, and capillary porosity [1]. It is well known that cementitious materials such as concrete, mortar, or cement paste contain initial microcracks and defects, typically distributed diffusively within the material, arising from autogeneous and drying shrinkage of the material. Subjected to external loadings, heterogeneities such as coarse aggregates and pores induce a highly disordered stress field within the material. Interaction of the initial stresses with the loading-induced evolution of initial defects and pre-existing microcracks results in a complex damage process on the mesostructure of the material [2,3]. Damage in concrete initiates at defects and pre/existing microcracks and propagates, leading to microcrack coalescence i.e., crack localisation, eventually leading to the complete loss of the load-bearing capacity of the concrete structure. Despite its infinitesimal size, pre-existing microcracks and their evolution significantly determine the behaviour of concrete subjected to external loadings. In this context, surface tomography analysis [4,5] can be used to provide additional information on the load induced microcracking behavior in concrete. Moreover, microcracking in concrete initiates already at a load levels much lower than the ultimate load [6,7,8,9,10,11]. Thus, from a structural health monitoring point of view, detection of microcracking, which is a precursor to complete failure of the structure, can help take suitable precautionary measures in advance [12,13]. Due to the high sensitivity of the so-called coda waves, Coda Wave Interferometry techniques (CWI) can be used to detect weak changes such as microcracking in concrete [14,15,16]. However, research in this direction is challenging and still remains at a very early stage far from practical application.
The synthesis of computational modelling and experimental techniques can significantly accelerate the development of a reliable methodology to detect microcracking induced damage in concrete. Having this goal in mind, this paper presents a computational model for simulating microcracking induced damage in the pre-peak regime of concrete, taking into account the heterogeneity of concrete at the mesoscale and, in particular, the role of the aggregates. It is to be noted that the term ‘diffuse damage’, also called diffuse microcracking or distributed microcracking in the paper, is associated with the stable propagation of preexisting microcracks caused by the mechanical load. This microcracking manifests itself at the macroscopic level as a gradual reduction in the stiffness of concrete in the pre-peak regime.
Several computational modelling strategies ranging from phenomenological macroscopic models, continuum micromechanics based models, mesoscale simulations to multiscale models have been proposed in the literature. Phenomenological damage and plasticity-damage models (e.g., [17,18,19,20,21,22,23], just to mention a few) consider concrete as a homogeneous medium. They are calibrated based on stress–strain relations from tensile and compression tests and are suitable for simulating damage and the ultimate load of large-scale concrete structures. However, no information on the microstructural changes during loading is included in this type of macroscopic model.
In contrast, continuum micromechanics models are able to approximately model the interactions of the heterogeneities (e.g., microcracks, aggregates, etc.) across multiple length scales using multi-level homogenisation schemes (see for e.g., [1,24,25]). Due to the mean-field assumption, damage within this framework is assumed to be represented by diffusely distributed flat or penny-shaped inclusions that are embedded in a continuous matrix ([26,27,28,29]). The evolution of the microcrack geometry is governed by fracture mechanics (e.g., [25,30]), or phenomenological damage laws [31,32]. As these models are analytical or semi-analytical formulations, they are computationally inexpensive. On the other hand, mesoscopic modelling approaches explicitly resolve the individual components of the material, see, e.g., [33,34,35,36,37,38,39,40,41,42]. Mesoscale models can be formulated using a variety of discretisation methods, such as the Finite Element Method (FEM) [33,34,39,43,44], the Discrete Element Method (DEM) [45], and Fast Fourier Transform (FFT)-based homogenisation methods [46,47,48]. Among these methods, the FFT homogenisation approach based on the Lippmann–Schwinger equation has recently gained in popularity for the analysis of materials with a complex morphology. This method allows a direct use of image-based data structures describing materials obtained from CT scans or other imaging techniques and it outperforms FEM and DEM in terms of computational efficiency and memory footprint.
Inevitably, the range of length scales that can be considered using computational mesoscale models is limited. Thus, for concrete, given the wide range of length scales involved, micromechanics-based multiscale modeling, in conjunction with model-order reduction techniques such as proper orthogonal decomposition [49,50,51], data-driven reduced-order PSP linkages [52], and the recently introduced clustering-based homogenisation methods [53,54,55], is essential. The self-consistent analysis (SCA) methods proposed in [53,54,55] offer high cost efficiency in terms of training data requirement and leads to a substantial reduction of the degrees of freedoms from a few million to only a few hundred.
Goals and Structure of the Paper
The aim of the paper is to model the load induced distributed microcracking phenomenon in concrete by means of a multiscale reduced order modelling approach. To this end, we have developed a multiscale model, characterised by the combination of continuum micromechanics and fracture mechanics on the microcrack level and a direct computational resolution of the mesoscale of concrete to describe load induced microcrack evolution. We demonstrate the predictive capability of the model by validations with experimental measurements.
The remainder of the paper is organised as follows: In Section 2, we provide key results from the experimental program devoted to the validation of the proposed model. Section 3 addresses the model description at the meso- and microscopic scales. In Section 4, we present the k-means based model reduction procedure as well as a series of numerical experiments. Proceeding to Section 5, calibration and validation procedure of the proposed model is presented, and the results are discussed. Finally, in Section 6, we summarise the paper and provide concluding remarks.
2. Experimental Program
2.1. Material and Specimen Preparation
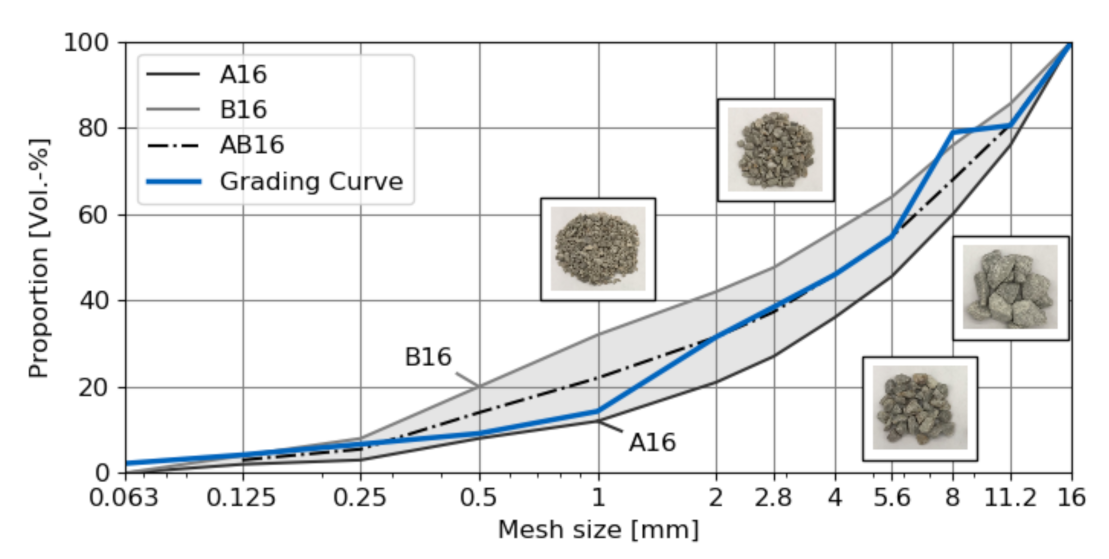
In order to support and validate the proposed model, three cubes (a = 10 cm) made of concrete and mortar serve as test specimens. We used ordinary Portland cement with a water-to-cement ratio of 0.45 for both types of specimens, crushed aggregates with an AB16 grading curve (Figure 1) and a cement content of 350 kg/m for the concrete (see Table 1 for a list of the raw materials in this concrete composition). The predominantly quartzitic aggregates used in the material composition come from the Taunus region in Germany and are available in four different grain sizes [0/2, 2/5.6, 5.6/8, 8/16] mm. The aggregates were nearly purely quartzitic which is favorable in order to minimize variations of mechanical properties due to variable minerals and their proportions. For the mortar specimens, we added quartz powder () with an average grain size of = 8 m and an upper grain size of = 25 m to increase resistance against shrinkage. Shrinkage-induced cracks should be prevented as specimens were tested after more than one year to ensure almost complete hydration. The specimens have been cured with the following conditioning procedure: After the production day (t = 0), specimens harden for one day. Thereafter, the specimens were conditioned under water for 56 days at T = 20 C. Then, the specimens were conditioned at T = 20 C and RH = 65% until the test. It is to be noted that no considerable difference to be expected between the strength and mechanical properties of specimens tested after one month and after one year. In this paper, we use the terms grains and aggregates interchangeably.
2.2. Characterisation of the Mesostructure of Concrete
The volume fractions of aggregates and air pores, along with their spatial distribution, are key parameters for characterising the mesostructure of concrete specimens and serve as input data for the generation of synthetic concrete mesostructure models. For the test specimens, an optimised aggregate composition was computed using the Generalised Reduced Gradient Method [56] by minimisation of the residuals between the cumulative proportions of four aggregate fractions at the specified discrete points (Figure 1) and the ideal AB16 aggregate composition according to building standards [57,58].
A more refined quantification procedure of the quartzitic aggregates was also carried out to extract the statistical data required for the generation of synthetic concrete mesostructures. The resulting absolute volume fraction of each concrete constituent is listed in Table 2. As can be seen, we further classify the aggregates into two sub-categories according to their size: fine and coarse aggregates. Here, the ’threshold’ value is set to 3 mm. Thus, the volume fraction of cement paste matrix, fine aggregates, and coarse aggregates are 29.259%, 22.448%, and 48.292%, respectively.
2.3. Determination of Elastic Properties of Concrete and Its Constituents
The proposed multiscale model also requires data regarding the mechanical properties of the material composition. Thus, a series of tests were performed to determine the properties of mortar, quartzitic aggregates and concrete of standard AB16. The testing machine is a Walter+Bai AG DB 3000/300 kN with a digital controller, Digicon 2000 (Löhningen, Switzerland). In order to design the testing procedure, we used the materials testing software “Proteus”. The material parameters of interest include the Young’s modulus, Poisson’s ratio, and the compressive strength. These parameters are summarised for each constituent in Table 3.
To measure the Young’s Modulus and the Poisson’s ratio of the quartzitic aggregates, a uniaxial compression test is performed on a quartzitic sample of cylindrical geometry. The cylinder with 5 cm diameter and 10 cm height was extracted from the same quartzitic material as the concrete aggregates. The specimen is subjected to a load controlled test and two strain gauges, arranged in a diagonal bridge circuit, were used to monitor the longitudinal and lateral strains on the aggregate surface [59,60]. Anderson–Darling-Tests [61] show a linear relationship up to 60% of the ultimate compressive strength for longitudinal strain and up to 30% for lateral strain, assuming a normal residual distribution between the experimental values and a linear regression function using a p-value of 5% (see Figure 2). The derived parameters for the quartzitic aggregates are in line with data from the literature [62], whereas the compressive strength is slightly smaller (90 GPa) and Poisson’s ratio slightly larger (0.10) as compared to -Quartz.
The Young’s modulus for concrete and mortar samples is also obtained from a uniaxial compression test. Three samples of size 10 cm were loaded in a displacement controlled test with a displacement rate mm/h. To accurately measure the true longitudinal deformation of the specimens, two external strain gauges (DD1 displacement transducer) were used. The Young’s modulus was estimated and averaged using a linear regression between two points from the stress–strain curve, at 10% and 30% of the maximum compressive stress. In all tests, Polytetrafluoroethylene (PTFE) films were placed between the samples and the loading platens to reduce friction. Figure 3 shows the specimens in a sound state and after displacement controlled compressive loading tests up to the ultimate state.
3. Scale-Bridging Modelling of Cementitious Materials
3.1. The Scale-Bridging Modelling Concept
When subjected to external mechanical loads, damage in concrete initiates from pre-existing defects and microcracks. These microcracks grow and ultimately coalesce to form visible macroscopic localised cracks. The growth of microcracks in concrete is completely governed by the presence and distribution of the heterogeneities (aggregates, pores, defects, initial microcracks, etc.). Moreover, it involves mechanisms that interact across multiple length scales i.e., the loading is applied at the macroscopic scale, the coarse aggregates serve as stress concentrations at the mesoscopic scale and the microcracks initiate and start growing at the microscopic scale. In order to bridge these scales, a multiscale model that takes into account the most essential physics contributing to the damage evolution in concrete is required.
In this paper, a reduced order model for scale-bridging modelling of damage evolution in concrete is formulated. Figure 4 illustrates the proposed modelling procedure. First, we consider a representative elementary volume (REV) at the mesoscale. At this scale, the coarse aggregates are explicitly resolved. At each mesoscopic point, an associated microscopic representative elementary volume (REV) is incorporated. Hence, the REV at the mesoscale bridges the applied macroscopic loading at the macroscale and the growth of microcracks at the microscale. At the microscopic scale, the mortar solid consists of an intact mortar matrix and pre-existing microcracks as weak inclusions. The mortar solid is idealised as a multi-phase material with spherical fine aggregates embedded in the cementitious matrix. Microcracks are modelled using three-sets of mutually orthogonal penny-shaped microcrack families, see Section 3.2. At the mesoscale, concrete is explicitly represented in a computational model as a two-phase composite consisting of a mortar matrix and coarse aggregates. The aggregates are assumed to be linear elastic, while the nonlinear behaviour of the mortar matrix is modelled at the microscopic scale using a combination of continuum micromechanics and Linear Elastic Fracture Mechanics [25].
In summary, this modelling approach entails separate model descriptions at different scales as well as the coupling relations between the scales. The interaction among scales is realised through homogenisation and localisation procedures. In the homogenisation process, information at lower scales is transferred to the higher scale through physically consistent averaged quantities (e.g., macroscopic stresses, effective stiffness). Localisation (also called concentration in the literature) is a downscaling procedure that relates strain or stress measures across the scales.
See Appendix A for the algorithmic implementation.
3.2. Microscale Model: Microcracking in the Mortar Material
3.2.1. Model Description
In order to model distributed microcracking in the mortar material, we adopt the multiscale concrete model proposed in [25]. The model is based on the synthesis of continuum micromechanics and Linear Elastic Fracture Mechanics (LEFM) (see [30]). At the microscale, a mortar REV of size l is considered, which is consisting of a mortar solid matrix and microcracks as inclusions. Microcracks represent the initial defects in the mortar and their evolution accounts for the fracture and damage mechanism at this length scale.
Three microcrack families, embedded in an "intact" mortar matrix material and oriented in three mutually orthogonal planes aligned with the major axes, are considered as inclusions. The geometry of these microcracks is idealised as penny-shape (oblate ellipsoid) with aspect ratio , microcrack radius a, and half microcrack opening c. The volume fraction of each microcrack family is evaluated as , where is the number of microcracks per unit volume. The dimensionless crack density parameter Given the microcrack volume fractions and the elastic properties of the mortar matrix , the initial effective stiffness of mortar REV can be estimated using analytical homogenisation schemes (for e.g., Mori–Tanaka scheme used in [25,30]).
3.2.2. Microcrack Growth
When concrete is subjected to loading, the growth of microcracks is idealised in the model as an extension of microcrack radius. Microcracks may grow only if they satisfy the criterion:
where is the applied strain obtained from the mesoscale simulation. is the dimensionless crack density parameter and is the microscopic fracture energy. denotes the equivalent strain, which is defined as the positive part of [63]. The homogenised stiffness is a function of , and .
Equation (1) involves solving a system of three coupled inequalities for the current microcrack radius . The partial derivative of with respect to the microcrack density parameter is evaluated accurately using the complex-step derivative. The computation of at a given load state is computed iteratively using the Newton–Raphson algorithm as follows. Let be the residual
and denotes the microcrack-radii, then expresses the partial derivative of with respect to . This derivative is approximated using the numerical derivative technique
At iteration k, the microcrack radius increment is computed as
and the microcrack radius is updated accordingly as
With being a small value close to zero (e.g., ), the convergence criterion is expressed as
After a converged microcrack radius is computed, the reduced effective stiffness tensor corresponding to the current microcrack configuration is updated. It should be noted that each microcrack family is allowed to grow independently, and, therefore, depending on the direction of microcrack growth, an anisotropy of the homogenised stiffness is induced.
3.2.3. Analysis of a Micro-Cracked Mortar REV under Uniaxial Loading Tests Using the Mori–Tanaka Homogenisation Scheme
In order to verify the proposed microcracking model, we simulate a uniaxial tension and uniaxial compression loading on a mortar REV. The investigated mortar REV consists of fine aggregates (sand) with a volume fraction of 35% embedded in a cement matrix. The material stiffness for the cement matrix and the aggregates are 21.6 GPa (taken from [24]) and 84.6 GPa, respectively. The Poisson ratio of sand inclusions is assumed to be [25]. The model parameters including the geometrical parameters are chosen within the range proposed in [25].
A summary of input and calibrated parameters as well as the numerical results can be found in Table 4. It is to be noted that and correspond to the elasticity parameters of a theoretical cement paste without microcracks. These values are calibrated to obtain the effective Young’s modulus of hardened cement paste of 21.6 GPa and Poisson ratio 0.15.
In this numerical experiment, the micro-cracked mortar REV is assumed to contain an initial microcrack volume fraction of 11.79% with aspect ratio 17. As a consequence of introducing initial microcracks, the mortar REV stiffness reduces to GPa at the zero-stress state. Figure 5 top and bottom left show the stress and strain responses of the mortar REV subjected to uniaxial tension and compression, respectively. Under uniaxial tension, microcrack family 1, which is oriented in a direction perpendicular to the maximum stress, propagates. This microcrack propagation results in a significant reduction of the stiffness in a longitudinal direction (z-direction in this particular numerical example) and a slight reduction in the stiffness in the transversal directions. The volume fraction of microcracks belonging to family 1 grows with increasing loads while the volume fraction of the other (two families) remains constant.
When subjected to uniaxial compression, microcrack families 2 and 3 grow due to the effect of the Poisson ratio. This leads to a dramatic reduction of material stiffnesses in the transversal directions, while reduces at a much slower rate. For the given parameter set, under compression, microcracking initiates at a load level 38.1% of the compressive strength. Both the computed compressive and tensile strengths are within the standard range for mortar composite. It should be noted that the proposed micromechanics model is computationally cheap and provides an almost instant upscaling tool, in comparison with explicit computational modelling of discrete microcracks, and therefore is ideally suited to be combined with a computational model at a larger scale. In addition, depending on the direction of microcrack growth, anisotropic damage can be simulated, as this information is directly obtained from the anisotropic homogenised stiffness tensor. A detailed parametric study of the influence of the model parameters on various characteristics of the compression behaviour of mortar is presented in Appendix B for interested readers.
3.3. Computational Model of Concrete on the Mesoscopic Scale
At the mesoscopic scale, concrete is idealised numerically in terms of a two-phase composite occupying a given volume , where the subscript “M” denotes quantities at the mesoscale. The numerical concrete specimen exhibits a periodic microstructure and is discretised using a uniform three-dimensional grid of voxels.
A concrete mesostructure generator (CMG) has been developed by authors [65] that allows an efficient computation of voxel-based synthetic concrete numerical samples. The algorithm is capable of generating realistic concrete periodic mesostructures given the aggregate size distribution. A Python implementation of the Concrete Mesostructure Generator (pyCMG, [65]) is also available.
The stress and strain fields of a concrete REV subjected to a prescribed macroscopic strain are computed by solving the integral form of the periodic Lippmann–Schwinger equation
where denotes the periodic Green tensor of the reference elasticity tensor . The explicit expression of the Green tensor for an isotropic elastic reference material with Lame parameters and in Fourier space is given as follows [46]:
with and denoting the frequency vector in Fourier space and Fourier formulation of the respective field, respectively. Equation (7) can be conveniently reformulated such that it can be solved iteratively using fixed-point iteration [46] in Fourier space:
For the iterative solution, strain-based convergence criterion
is used.
4. Model Reduction Using K-Means Clustering
An explicit multiscale approach without using proper model reduction would result in an explosion of the number of unknowns, especially in the case of complex three-dimensional microstructures. To accelerate material analysis and design, one looks for a strategic way to reduce the computational complexity of the model, both in terms of computation time and data storage requirement. In our work, the clustering technique proposed by [53] is adopted. The method couples the data-driven approach using the k-means clustering algorithm to efficiently characterise the salient features of a microstructure, with the clustered FFT-based solver. Essentially, the methodology consists of two steps:
- Offline stage Pre-computation of a reduced-order dataset characterising the behaviour of a given REV by decomposing the entire domain of the high fidelity REV into a set of sub-domains (often denoted as clusters) and computing the so-called interaction tensors for all cluster pairs.
- Online stage Actual computation of the response of the REV for various loading conditions using the reduced-order dataset obtained from the offline stage.
4.1. K-Means Model Reduction Procedure
4.1.1. Offline Stage
In the offline stage, the k-means clustering procedure was employed for grouping voxels that deform in a similar fashion. The algorithm requires a collection of data characterising the behaviour of all voxels under various loading conditions. To this end, fine-scale simulations of six orthogonal unit loading conditions were performed on the concrete REV and the corresponding strain fields are recorded, as suggested in [53]. In our implementation, training data in the offline stage were generated by means of the Lippmann–Schwinger based FFT solver described in Section 3.3. Alternatively, such calculation can also be performed using a commercial FEM software (e.g., [66,67]).
The metric used to group the voxels is the localisation tensor denoted as , which basically maps the local elastic response of the material to the macroscopic strain :
As a result, the k-means clustering algorithm groups the voxels into one cluster based on the similarity of their localisation tensors. Full details regarding the construction of and the k-means clustering algorithm can be found in [53].
Next, for the sake of clarity, but without going into too much detail, we shall provide the basic formulation of the interaction tensor . is defined as
with being the volume fraction of the cluster. is the characteristic function in the domain of the material cluster , defined as
4.1.2. Online Stage
The equilibrium stress and strain for each cluster () for a loading condition are computed using the cluster based Lippmann–Schwinger equation, re-formulated as
where is the number of material clusters, and Equation (16) can be rearranged so that it can be solved using the fixed point iteration algorithm as follows:
denotes the reduced secant stiffness tensor of cluster J. The algorithmic implementation of the cluster based reduced-order simulation model is analogous to Algorithm Appendix A, except that each cluster of mortar material is now linked with a microscopic BVP.
4.2. Numerical Assessment of the Convergence Behaviour of the Reduced Order Simulation (ROS)
In this section, numerical analyses are conducted to investigate the performance of the proposed reduced order multiscale model. The central interests of this study are:
- The convergence behaviour of the ROS in comparison to Direct Numerical Simulations (DNS) on a simple microstructure.
- The convergence behaviour with respect to the number of clusters on a simplified concrete microstructure.
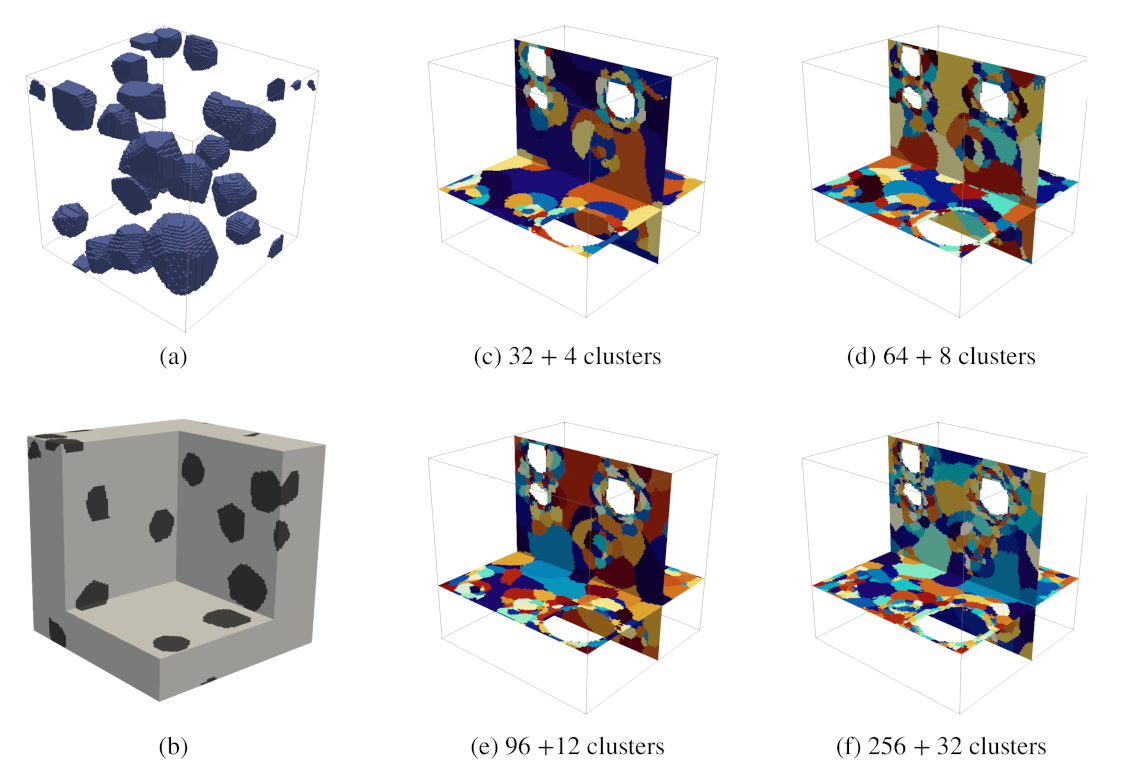
Two numerical samples were considered in the analysis. From these microstructures, we generated the corresponding reduced-order microstructures with an increasing number of clusters, as illustrated in Figure 6 and Figure 7. The ratio between cluster count of matrix () and inclusion phases () was chosen to be 8:1. These microstructures are subjected to uniaxial compression with a strain increment of in the z-direction.
To investigate the convergence behaviour of the ROS with respect to the DNS for increasing loading strains, we used the following macrostress-based error criterion
where is the reference macrostress (i.e., the macrostress obtained from the DNS).
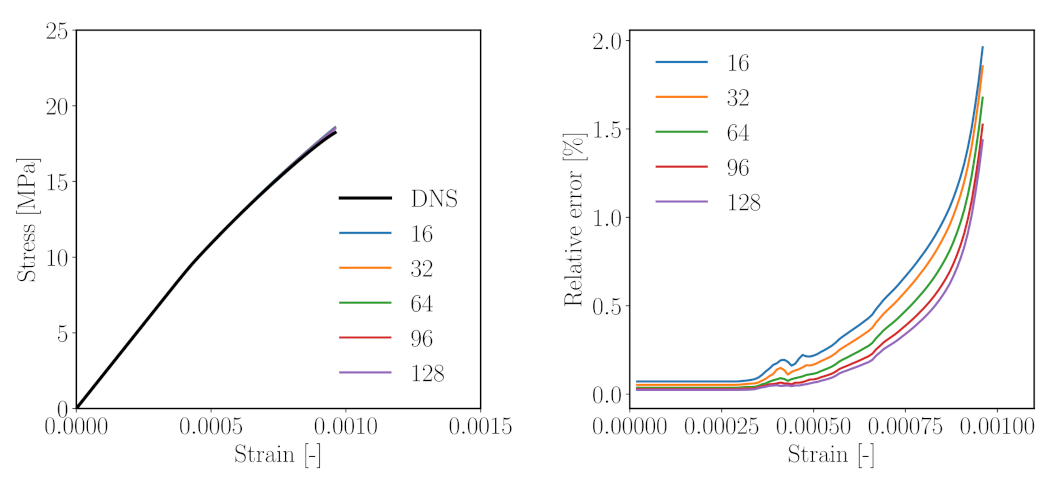
4.2.1. Study 1—Comparison with DNS
Both DNS and reduced-order simulations (ROSs) were carried out for simulations of the simplified mesoscale structure shown in Figure 6. In the case of the ROSs, six unit strain fields were used as training data for the k-means clustering operations. All simulations were run over 100 timesteps. Figure 8 shows the result from the comparative analysis of the simple 3D model structure subjected to uniaxial compression for five numbers of clusters (Figure 6b–f). It can be observed that
- in comparison with DNS, the ROSs capture the overall response in the elastic regime (up to a strain level of 0.03%) well. In this range, an error of only 0.03–0.08% is observed (Figure 8, right).
- The ROSs generally tend to overestimate the computed effective stress as compared to the DNS.
- When microcracking starts in the nonlinear regime, the error increases with increasing loading strain (Figure 8). At the loading strain of 0.1%, up to a 2% error is reported.
- As the number of clusters is increased, the reduced order simulation converges to the result of the high fidelity simulation.
Thus, we can conclude that, for a simple mesostructure, a good convergence can be achieved with the proposed ROS. Even a clustered mesostructure with a small number of clusters can capture the effective behaviour of the composite well. It should be noted that the solution of the uniaxial compression loading on this simplified mesoscale structure using DNS requires computation of a total of micromechanical subproblems per load step, as opposed to 16–128 micromechanical evaluations per load step in the case of using ROSs. Even with a theoretical size of voxels, DNS requires 164 h running on 300 threads on a high-performance computer, as opposed to approximately 15 h computation time (online stage) on a desktop computer for a reduced model with 144 clusters.
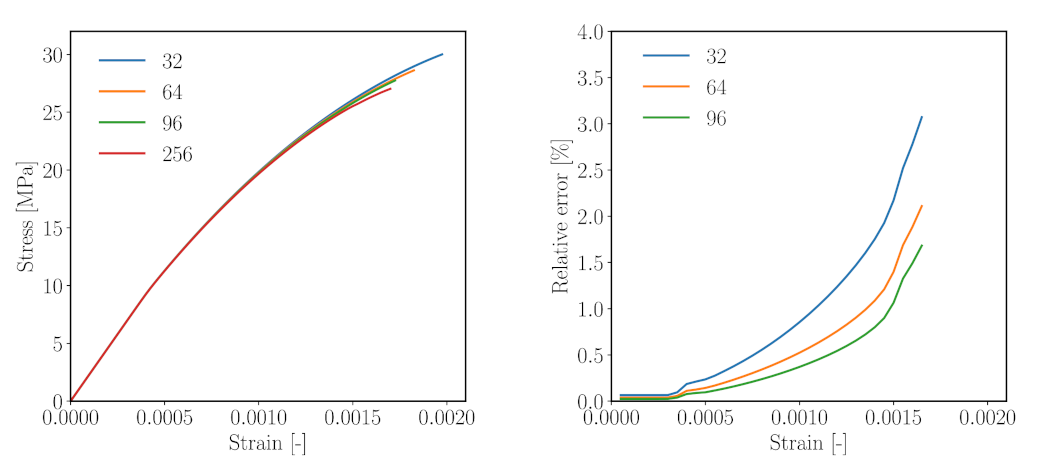
4.2.2. Study 2—Convergence Analysis on a Concrete-Like Meso-Structure
In the second numerical analysis, a concrete-like mesostructural model as shown in Figure 7, subjected to uniaxial compression, is simulated by means of the proposed multiscale reduced order model. The numerical simulation terminates, when the microcrack volume fraction of any given mortar cluster reaches 0.99, which is assumed to be the onset of complete material rupture. Here, the direct numerical analysis was not carried out. Instead, the simulation result of the model with the highest number of clusters is considered as the reference result for the assessment of the error caused by choosing different smaller numbers of clusters.
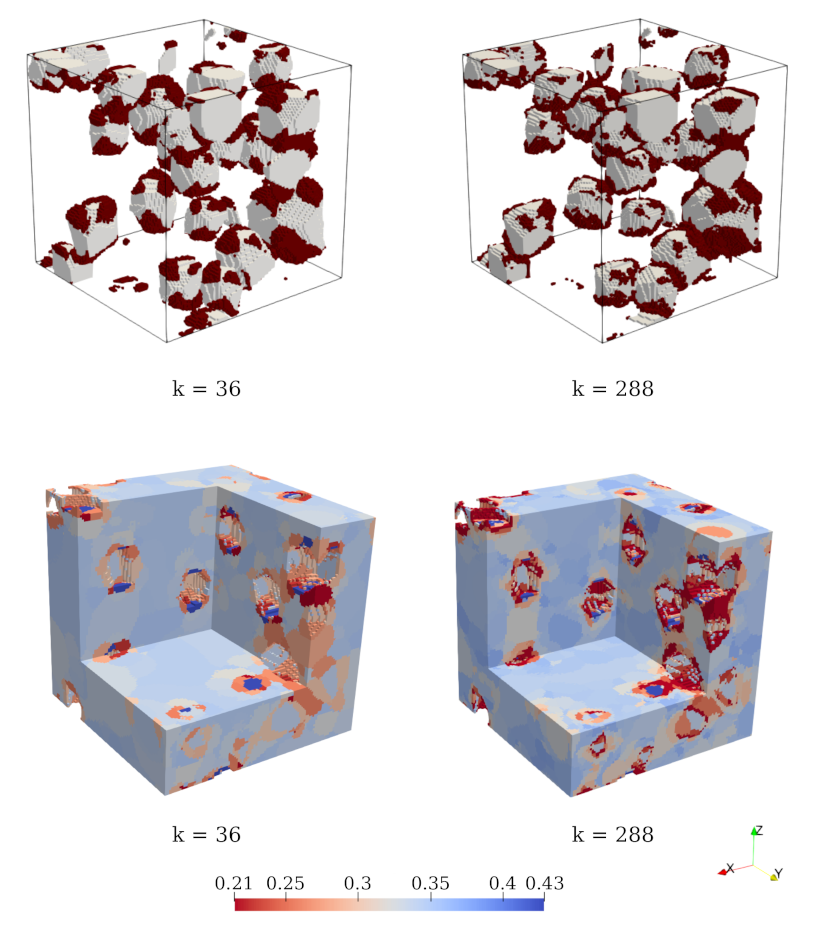
Five reduced order models with number of mortar clusters = 32, 64, 96 and 256 (corresponding to 36, 72, 108, 288, respectively) were considered for the analyses. Herein, the number of clusters of mortar material () is used to denote the numerical result of the associated clustered structure. Figure 9 (left) shows the stress–strain diagrams resulting from the four analyses, and Figure 9 (right) contains the error as a function of the strain level determined for the simulations with = 32, 64, 96 as compared to the result obtained for 256 clusters. It is observed that the error increases with increasing strain level, associated with an increasing microcracking in the microstructure, and that the error decreases with an increasing number of clusters. A larger number of clusters results in an improved resolution of damaging regions in the reduced REV, in particular in the vicinity of aggregates.
Similar to the previous study, one can draw the following conclusions from this study:
- Simulations with a higher number of clusters entered the inelastic stage earlier and failed earlier as well. Subsequently, the maximum compressive stress reduces with increasing cluster count.
- A maximum 3.07% of error with respect to the reference result () at ’failure strain’ is recorded.
- In comparison with the previous analysis, the effective stress–strain curves obtained from the different analysis show a slightly larger spread. However, the discrepancy is still within a tolerable range.
In conclusion, with increasing complexity of the microstructure, a higher number of clusters is necessary. However, such choice should also be reasonable, as the computation of the interaction tensor for each cluster pair is increasingly expensive for finer meshes.
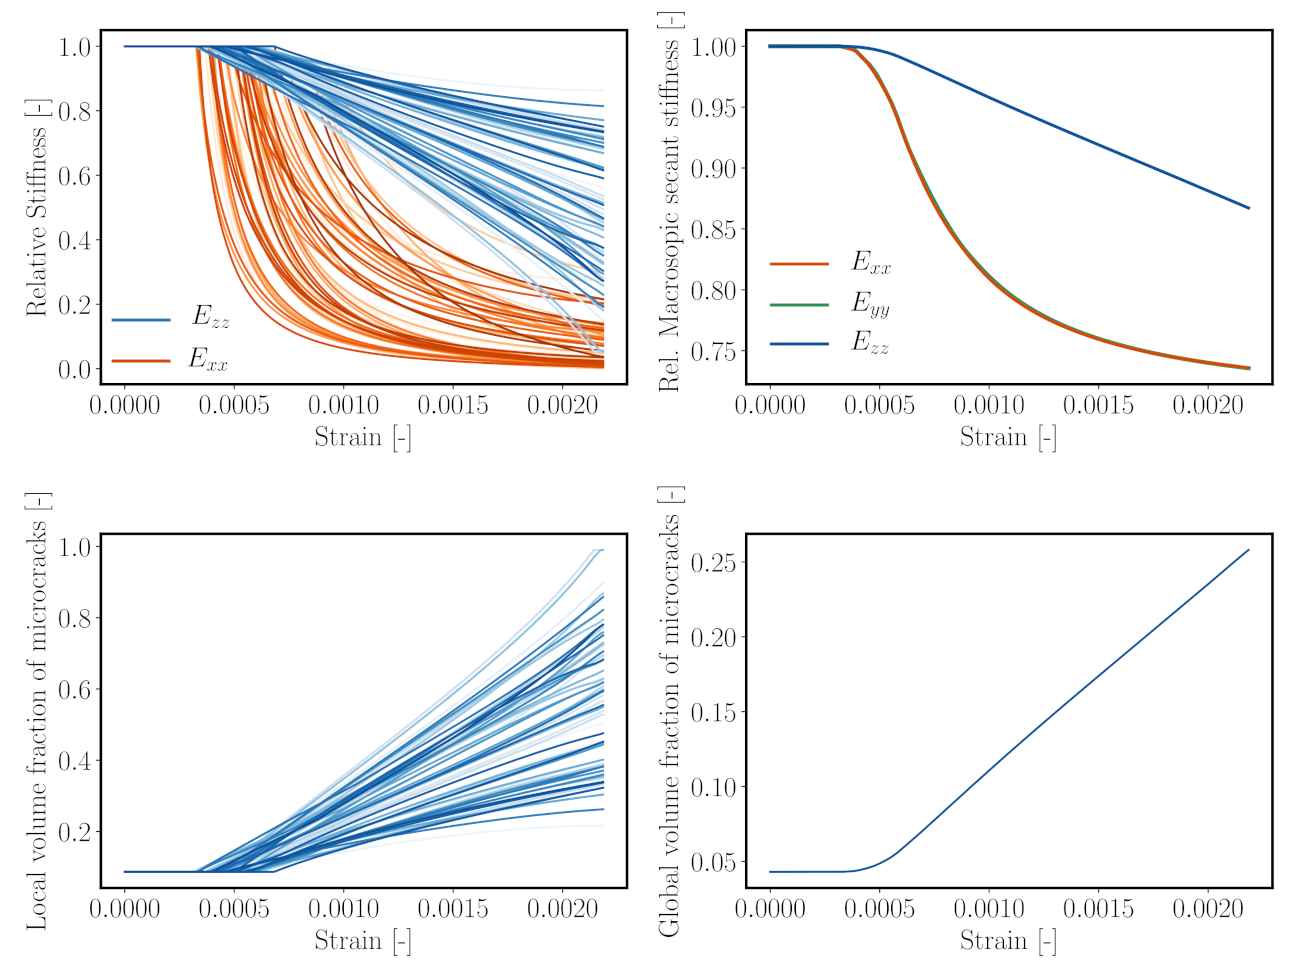
It is also of interest to examine further the damage field distribution obtained from the ROS simulations. To characterise damage in the REV, we define a relative stiffness parameter as
with denoting the relative average secant stiffness of the cluster i at the current time step. are the current (degraded) Young’s moduli in x-, y- and z-directions, respectively, and is the initial Young’s modulus of the mortar cluster i. Figure 10 (bottom) visualises the stiffness degradation due to compressive loading computed in two clustered numerical samples. At the same loading strain, the numerical sample with finer discretisation () yields a higher damage concentration, while it is smeared out in the coarser discretisation. However, one observes that, in both of the fine and coarse discretisations, regions of diffusive damage are qualitatively similar.
4.2.3. Computational Aspects
It is worth pointing out that the computation of the tensor for each cluster pair in the offline stage is computationally intensive. For instance, considering a model of voxels, each tensor took eight seconds of computation time on an Intel(R) Core(TM) i7-8700 CPU @ 3.20GHz with 1.83 GB memory. The code was programmed in Python language. In the online stage, the uniaxial compression simulations of the reduced order model with 34, 108, and 288 clusters over 200 load steps took 2.92, 9.53, and 43 h, respectively. In comparison with the DNS, a substantial speed-up is attained.
5. Model Validation: Simulation of a Realistic Concrete Mesoscale Model Subjected to Uniaxial Compression
In this section, a reduced ordered multiscale simulation of a concrete specimen subjected to uniaxial compression is performed. The modelling strategy consists of the following four steps. First, a virtual concrete mesostructure is generated according to the measured aggregate size distribution of concrete (standard AB16). Second, the material properties of the material constituents are specified. The third step is the determination of the localisation tensors for each voxel in the mesostructure for the k-means based domain decomposition procedure (offline stage). Finally, a simulation of the mesoscale model subjected to uniaxial compression is performed on a synthetic concrete sample, and the model predictions are compared with experimental data (online stage).
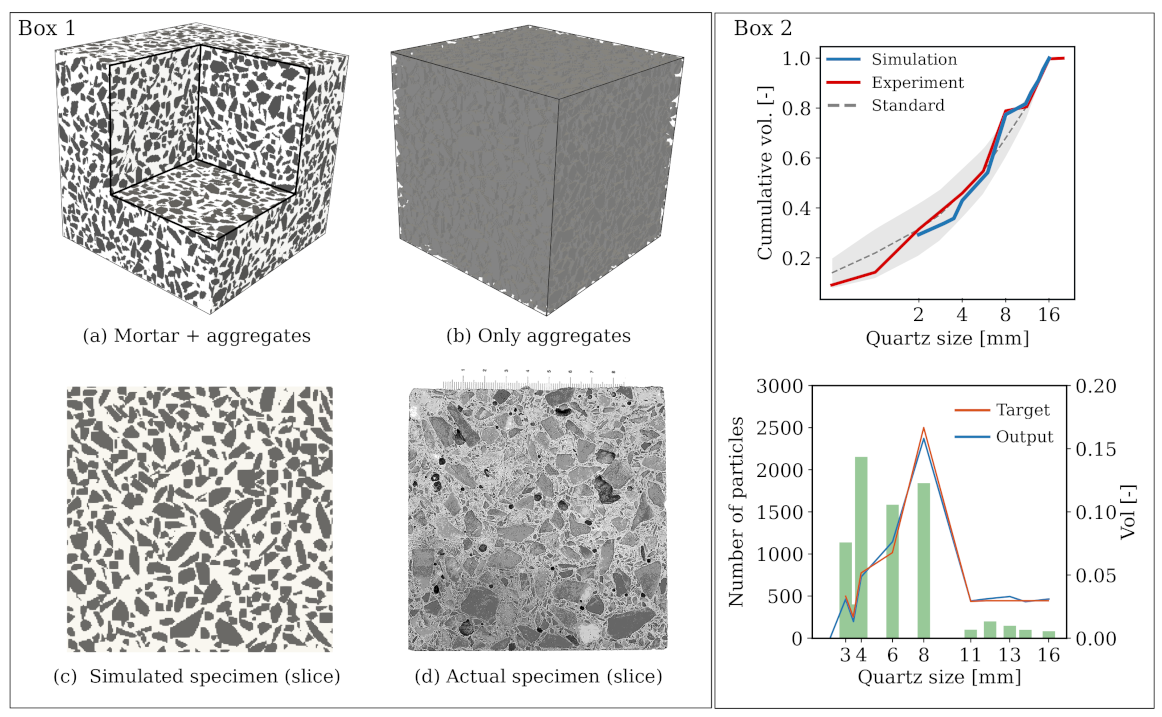
5.1. Simulated Concrete Sample
A virtual concrete mesostructure corresponding to the concrete standard AB16 is generated using PyCMG [65], an opensource concrete mesostructure generator. The sample consists of voxels with the smallest and largest aggregate sizes of 3, and 16 mm, respectively. In total, an approximate 47.75% coarse aggregate is explicitly resolved and thus the remaining 22.25% fine aggregate content (<3 mm) is implicitly incorporated into the mortar matrix via continuum micromechanics homogenisation. Figure 11 (bottom) shows a comparison of the synthetically generated concrete mesostructure and the actual concrete specimen. It is noteworthy that it takes only 201 s on a standard computer to generate the above virtual specimen. For interested readers, further details regarding the generation procedure involving geometrical parameters as well as the realistic aspects of the virtual concrete specimen are described in [68].
5.2. Calibration of the Parameters of Mortar Constituents
At the mesoscale, while the material properties of the aggregates are measured directly in laboratory tests, the material properties of the considered mortar matrix is to be determined. To this end, using the material data obtained from the experiment, we proceed to calibrate the model parameters at the constituents of mortar, i.e., the cement paste and the fine aggregates, according to the following calibration strategy:
- We use experimental data from the mortar samples () to calibrate the microscopic constituents parameters such that the Young’s modulus and compressive strength of the mortar REV match the experimental stress–strain curve. The parameters to be calibrated include the Young’s modulus of the cement paste solid , the microcrack volume fraction and their aspect ratio X, and the microscopic fracture energy . Figure 12 shows the calibrated (homogenised) stress–strain curve of the mortar REV in comparison with the experimental stress–strain curve.
- In the numerical concrete sample (Figure 11a), the mortar matrix contains cement paste and fine aggregates with the relative proportion of between the two material phases. Thus, in mortar matrix equals 43.95% and differs from the actual mortar sample. We assume the content of microcracks is identical for the same cement mixture. The effective Young’s modulus of mortar matrix is obtained, by setting instead of , while the other parameters are kept unchanged. As a result, the mortar matrix of the simulated concrete has a Young’s modulus of GPa. At this scale, the fine sand grain inclusions are assumed to have a spherical geometry. A summary of the parameters is contained in Table 5.
In Table 5, the parameters listed in the group Material parameters are obtained from the laboratory investigation reported in Section 2. As the name indicates, Model parameters lists micromechanics parameters, which are to be calibrated. It is worth mentioning that the Young’s modulus and the Poisson ratio of cements paste solid is referred to as the elastic parameters of the theoretical intact cement solid without microcracks. Thus, these values are higher than the experimental range for real hardened cement paste with pre-existing microcracks. By introducing microcracks () and fine aggregates (), the effective properties of mortar at zero-stress state reduces to 29.8 GPa and 0.124, as shown in the group Homogenised parameters. These values match the experimentally measured range of values for mortar (Figure 12).
It is also of interest to estimate the effective elastic properties of the numerical concrete sample, given that the morphology of the mesostructure and the elastic properties of all constituents are known. A FFT-based computational homogenisation was performed on the numerical concrete sample. From the resulting effective stiffness tensor, we obtained effective material constants at the concrete level listed in Table 6. In comparison with the laboratory test, the Young’s modulus of the virtual concrete sample is approximately 4.7% larger, which is considered as satisfactory agreement. The Poisson’s ratio is slightly smaller as compared to the test. Due to the stochastic arrangement of the aggregates in the synthetic concrete sample, a slight anisotropy of the Young’s modulus in axial and lateral direction with a ratio of 1.003 is obtained.
5.3. Offline Training Stage
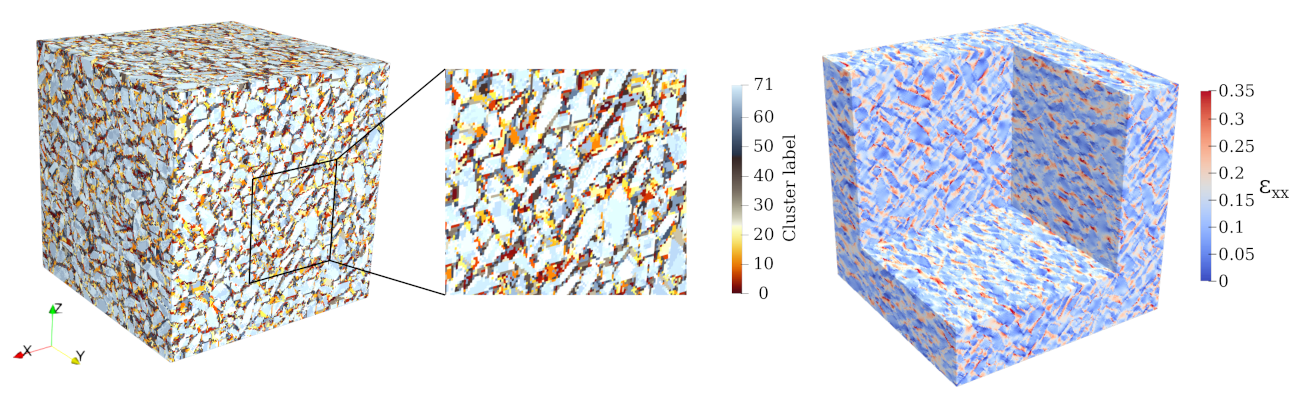
In the offline stage, we used the six unit strain fields obtained from the FFT-based homogenisation step as training data to evaluate the similarity in the mechanical behaviour of all voxels. Intuitively, two additional strain fields as training data were included in the k-means clustering step, as suggested in [55]: (i) the local strain field under uniaxial compression in the z-direction (see Figure 13 right), and (ii) the positive component of the strain field during uniaxial compression in the z-direction. In this numerical analysis, the high fidelity mesostructure is decomposed into 72 clusters, with the ratio between the number of matrix clusters and the inclusion clusters chosen as 8:1. This is motivated by the priority of capturing the damage evolution in the mortar matrix (Figure 13 (left, center)).
This choice of the cluster configuration results in the computation of cluster pairs. An average computation time for each tensor took 55 s and 17.3 Gigabyte RAM. In our implementation, the computation of interaction tensors was performed in parallel on a high performance cluster using 50 Intel(R) Xeon(R) Gold 6148 CPU @ 2.40 GHz. The total computational time was approximately 43 min.
5.4. Simulation of a Uniaxial Compression Test on the Virtual Concrete Sample
With the preparations accomplished in the offline stage, simulation on the reduced mesostructure subjected to uniaxial compression can be performed. The uniaxial load condition is simulated by restricting the macroscopic strain component to a prescribed value, and setting the macroscopic stress components perpendicular to the z-direction to zero. The strain increment is prescribed as . The simulation terminates when the microcrack volume fraction of one cluster reaches 0.99, which is assumed to be the onset of complete failure in material. It is to be noted that the multiscale homogenisation method, by following the scale separation principle [71], is restricted to the pre-peak regime of concrete. Possible remedies are also proposed in [72,73,74]. However, it is beyond the scope of the study.
The macroscopic stress tensor at load level is recorded and evaluated as
where and are the volume fraction and mesoscopic stress tensor of a cluster I, respectively.
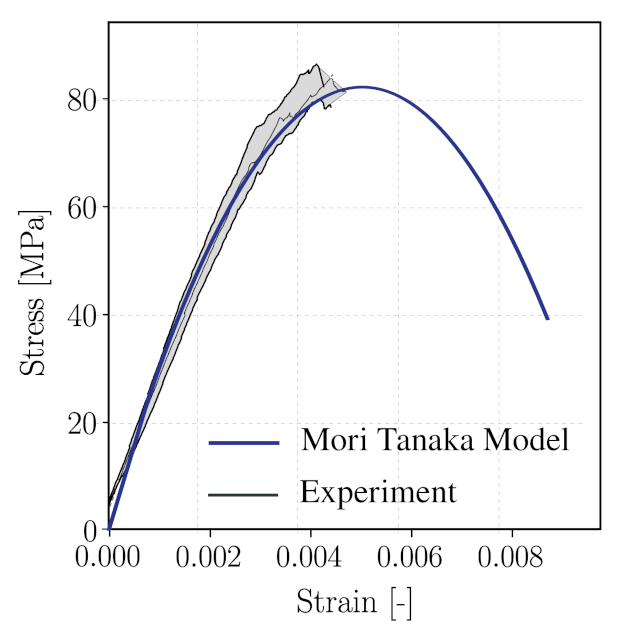
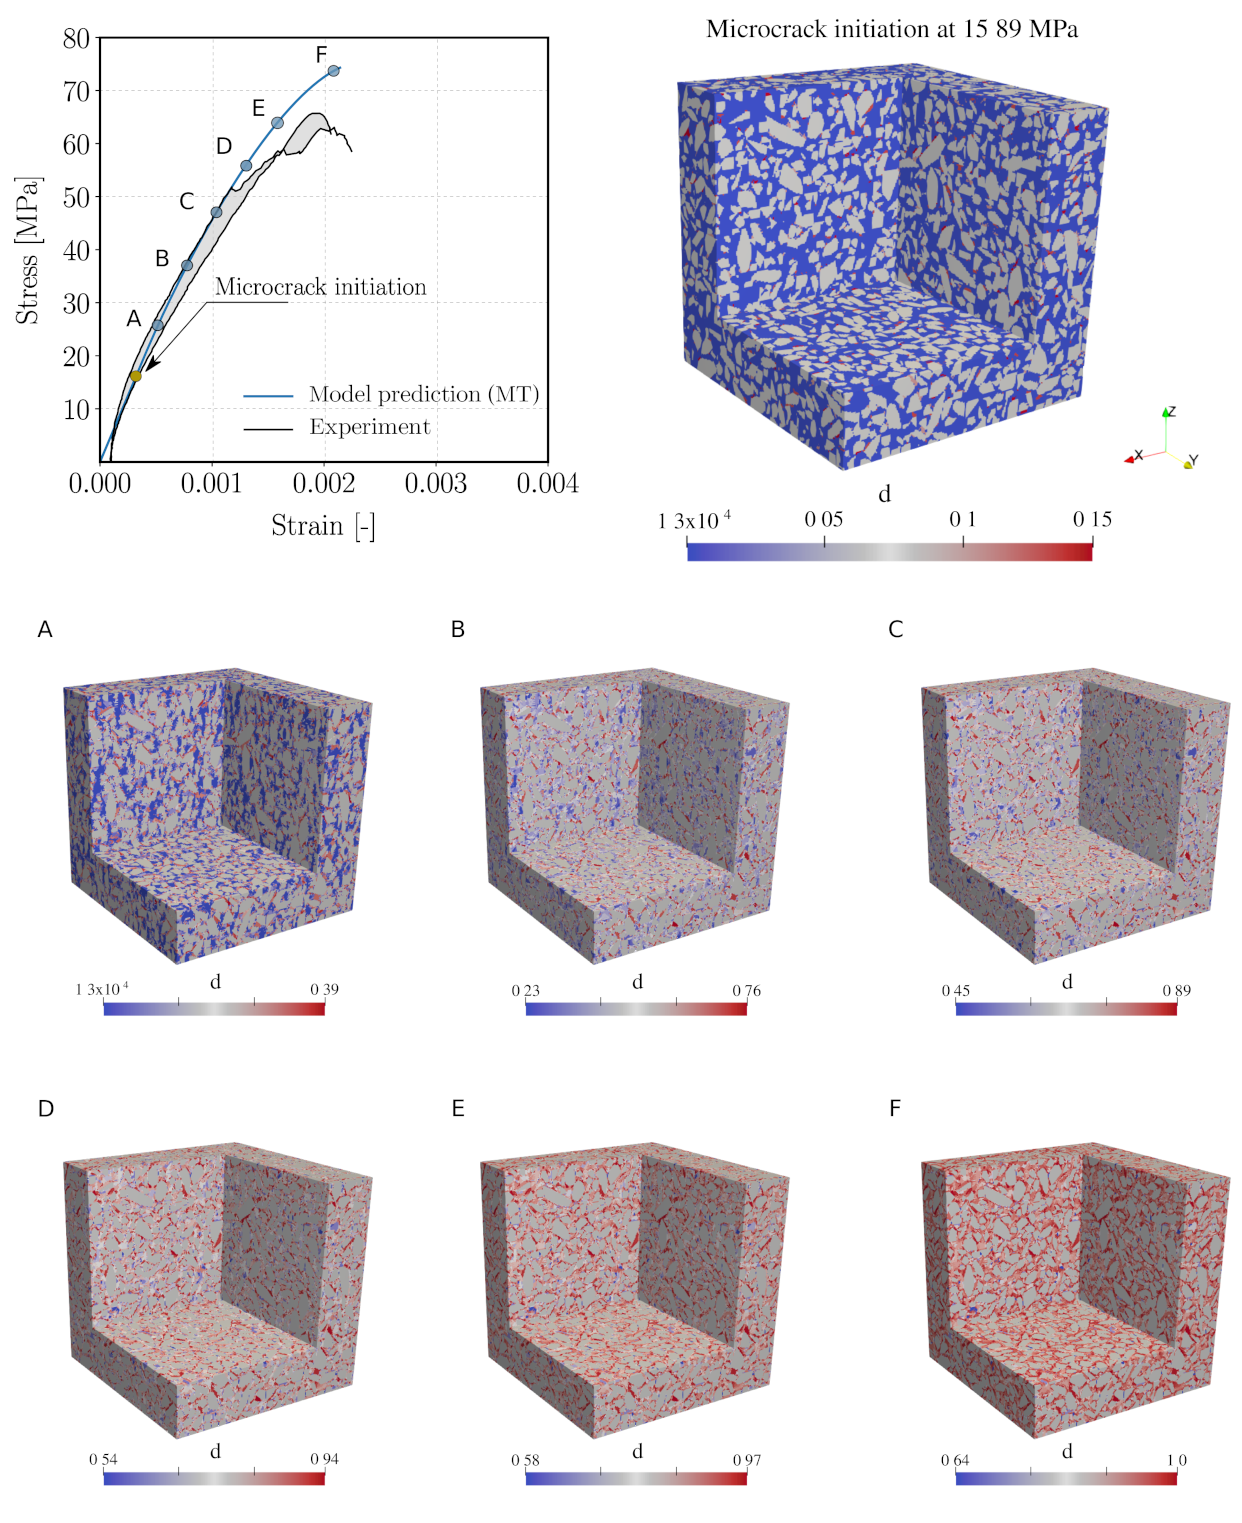
Figure 14 (top left) shows the stress–strain curve predicted from the reduced order multiscale model and a comparison with experimental data. We can observe that the initial portion of the curve up to approximately 50% of the measured compressive strength agrees well with the measure curve. However, the proposed multiscale model leads to an overestimation by 13.4% of the material strength. Several reasons may be responsible for this deviation. One reason possibly lies in the calibration of the parameters for the mortar matrix according to measurements of separate mortar specimen, which are characterised by a different volume fraction of fine aggregates as compared to the one used in the concrete specimen (see also respective comments in Section 5.2). Another possible cause may be connected with the influence of initial defects at mesoscale, in particular the interfacial transition zone (ITZ), which play a significant role in the damage process in concrete. The ITZ, however, is not yet separately considered in the current modelling approach. Finally, the choice of the analytical homogenisation scheme at the microscale (currently, the Mori–Tanaka scheme) might play a role. The role of the micromechanics homogenisation scheme will be further investigated in Section 5.6.
5.5. Interpretation of Numerical Results
To examine the evolution of the stiffness degradation due to microcracking, the effective secant stiffnesses in three orthogonal directions were recorded for all clusters at each load step. To show the effect of microcracking on the transversal stiffness degradation of each cluster, we introduce the damage parameter :
where and are the current secant Young’s moduli in x and y-directions, respectively, and denotes the initial concrete stiffness. indicates no damage, and denotes a complete loss of transversal stiffness of the respective cluster.
From the stress–strain curve (Figure 14 (top left)), it can be seen that the initial microcracks start propagating at a strain level of , corresponding to a loading level of MPa (20.37% of the compressive strength). In contrast, damage initiation in the calibrated mortar REV is recorded at a much later stage ( = ). This indicates that, due to the heterogeneity of the material, the threshold value of strain state that triggers propagation of existing microcracking is reached already at a relative low loading level of loading in several regions of the mesostructure. Such early initiation of damage is also confirmed by several non-destructive tests on concrete [75,76]. Figure 14 (top right) highlights the regions exhibiting the start of microcrack propagation.
Figure 14A–F illustrates the damage evolution in x- and y-directions with increasing loading level. All clusters connected with the mortar material exhibit a gradually increasing growth of microcracks parallel to the loading direction, leading to an anisotropic reduction in the macroscopic secant stiffness. This is corroborated by Figure 15 (top), which shows the evolution of the secant stiffnesses both in axial (z) and lateral (x) directions. As seen in Figure 15 (top left), the lateral stiffnesses (in x- and y-directions) of all clusters decrease at a much faster rate in comparison with the longitudinal one due to the growth of microcracks, whose orientation is parallel to the major stress axis. Moreover, a closer inspection into the spatial distribution of damage in the mortar matrix reveals that microcracking takes place predominantly in the immediate vicinity of the aggregates, caused by the stress concentration in these regions of the mesoscale structure. In addition, these degradation mechanisms revealed by the multiscale reduced order model is in agreement with experiment observations [75].
Recording the microcrack volume fraction provides information on the damage evolution in the clusters as well as in the complete mesostructure of the virtual concrete specimen. Figure 15 (bottom left) shows the evolution of the microcrack volume fraction in all clusters during compressive loading. At ultimate load, the microcrack volume fraction in one cluster reaches a value of 1. Comparing Figure 15 (bottom left) and (bottom right), one observes that this state corresponds to a 25% total microcrack volume fraction in the virtual concrete sample.
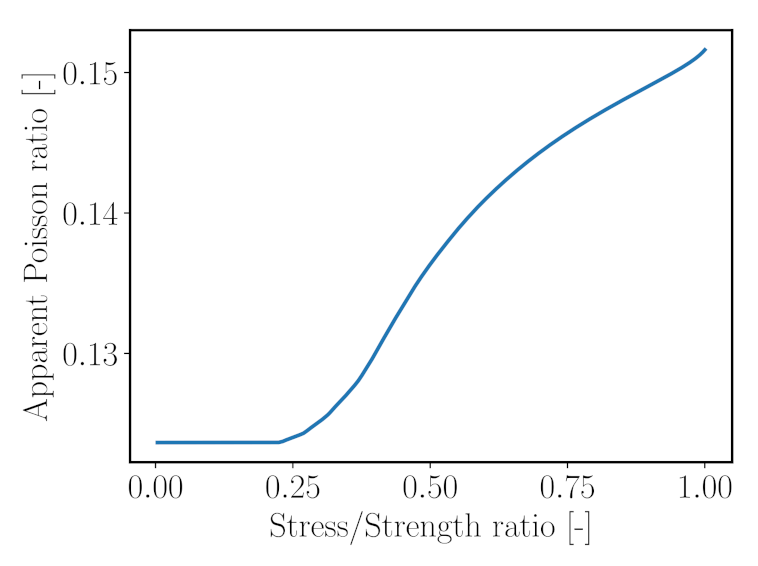
Once microcracking initiates, the model is also able to predict an increase of the apparent Poisson’s ratio, defined as the ratio between the transversal and axial strain,
5.6. Improvement of the Model by Means of the Modified Interaction Direct Derivative Scheme (MIDD)
As already discussed above, the choice of the homogenisation scheme for the mortar matrix material at the microscale may have a strong influence on the predicted response of concrete at the macroscopic scale. As can be seen in Figure 5 and Figure 12, in the post-peak regime, the reduction of stiffness in the longitudinal direction is relatively steady, which results in a prolonged stress–strain curve. An overestimation of concrete compressive strength can be attributed to the Mori–Tanaka homogenisation scheme as the matrix material is always assumed to be “connected” and the spatial distribution mimics that of the inclusion shape [78].
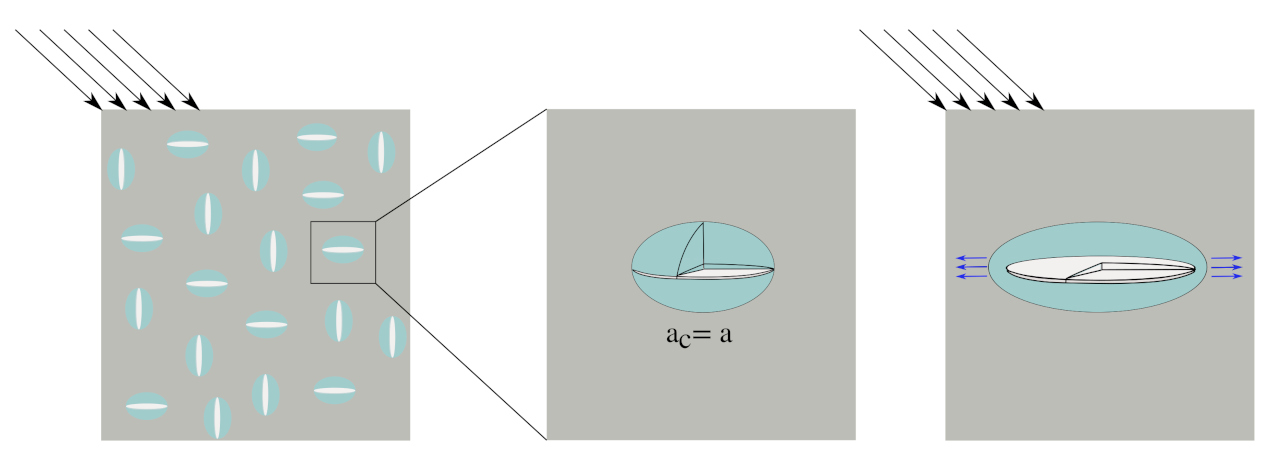
To replicate a more brittle behaviour of the mortar matrix, we now investigate using the Interaction Direct Derivative homogenisation scheme [79] (IDD) in this subsection as an alternative scheme. The IDD scheme allows consideration of not only the microcrack morphology, but also the spatial distribution of microcracks, which is proven to play a significant role in damage behaviour of cracked solids (see, e.g., [29]).
The distribution of the microcracks is determined by the shape of a “double cell” surrounding a microcrack (see Figure 17). The shape of the double cell surrounding a crack has a clear physical meaning and often is idealised as an ellipsoid. In our model, we assume that the microcrack distribution takes the form of an oblated spheriod and is coaxial with the associated microcracks, as illustrated in Figure 17. Given three microcrack families with radius a, half thickness c and crack density , the geometrical parameters characterising the double cell for a certain microcrack family i are the double cell radius and the half thickness . We denote as the aspect ratio of the cell. An explicit formulation [80] for estimating the stiffness is given as
where is the Hill Polarization tensor corresponding to the double cell i. The superscript D denotes quantities belonging to the distribution (i.e., the double cell) of the microcracks. When the geometry of the distribution is identical to that of the microcracks, the prediction of the IDD and Mori–Tanaka schemes is identical. Assuming zero stiffness for the three crack families yields
When the external load reaches a critical value, pre-existing microcracks start propagating. As the microcrack distribution in the IDD model is governed by the double cell that encloses the microcrack, we assume that this double cell evolves to accommodate the microcrack. Eventually, the microcrack distribution flattens and follows the penny shape of microcracks. The concept of an evolving microcrack distribution was suggested by various analyses, such as [29,79,80]. It is found that, in order to capture the characteristic softening behaviour of mortar, (i) the growth of the double cell has to be in proportion with the ratio between and , and (ii) the growth rate of the double cell is higher than the growth rate of crack family i.
To control the growth of double cell , we introduce a dimensionless parameter . When subjected to an applied macrostrain , the current crack radius is evaluated according to the procedure described in Section 3.2.1. The growth of the double cell determining the microcrack distribution is computed as
A calibration procedure was undertaken to obtain parameters for the double cell i.e., the microcrack distribution, which are able to realistically replicate the response of a mortar sample subjected to uniaxial compression. According to this calibration procedure, the initial aspect ratio and distribution growth rate of crack distribution are found to be 12 and , respectively. All remaining microscale parameters are kept unchanged and listed in Table 5.
Figure 18 shows the stress–strain diagram of mortar sample obtained from the model using the modified IDD estimated with the calibrated double-cell parameters. In comparison with the Mori–Tanaka estimate (MT) (also shown in Figure 18), we see that a more brittle behaviour of mortar is obtained from the MIDD scheme. As this experiment was used for calibration, the compressive strength is well replicated. In the post-peak regime, a brittle response is predicted. It should be noted that the simulation terminates as the point where the homogenised stiffness becomes negative, predicted by the MIDD scheme. As soon as the stress–strain curve enters the softening branch, a sudden drop in stress is observed. Using the modified IDD scheme predicts failure of the mortar material at a microcrack volume fracture of , while, in the MT estimate, the material fails at a microcrack volume fraction 1.
The modified IDD scheme has also been applied to simulations of the virtual concrete sample subjected to uniaxial compression, which has been investigated before in Section 5 using the MT homogenisation scheme on the microscale of the mortar matrix. The parameters for the double cell calibrated before for mortar material are used, and all remaining parameters are identical to those listed in Table 5.
The stress–strain diagram obtained from this modified micromechanics-reduced order meso-scale model for concrete is shown in Figure 19 and compared with the previous result from the model using the Mori–Tanaka scheme and the experimental results. Now, the peak load is in much better agreement with the compressive strength of the concrete sample recorded in the laboratory, with a deviation of only 3.52%. Interestingly, above 93% of the peak load, the stress–strain curve is no longer continuous. This is attributed to a combination of disorder at the mesoscale and the rapid reduction in longitudinal stiffness after peak stress (Figure 18 center).
6. Conclusions
In this work, a reduced order multiscale model for computational simulations of distributed microcracking in concrete on the mesoscale has been presented. Within the mortar matrix, a continuum micromechanics model takes into account pre-existing microcracks, which may propagate according to the Griffith criterion. This continuum micromechanics model in conjunction with a fracture energy model for crack propagation was incorporated into a computational mesoscale model of concrete. At this scale, a numerical model is proposed, which realistically resolves the coarse aggregates and its size distribution. To reduce the computational costs for high resolution multiscale simulations, a k-means based model reduction technique [53] has been employed. First, a synthetic concrete mesostructure has been generated from the size distribution of coarse aggregates determined in the laboratory. Next, the parameters of the micromechanics based microcracking model that governs the behaviour of the mortar material have been calibrated using experimental data for the individual constituents, i.e., the cement paste, the fine aggregates in the mortar matrix, the initial microcrack volume fraction in the initial state (due to autogeneous shrinkage), and the coarse aggregates. Finally, the two scale reduced order concrete model has been validated by means of data from uniaxial compression tests performed in the laboratory. Based on the results, the following conclusions can be drawn:
- It was observed that the Mori–Tanaka scheme, which has been used in the initial model design at the micro-level, overestimates the compressive strength of concrete.
- In order to improve the model predictions, the Mori–Tanaka scheme governing microcracking at the microscale has been replaced by an improved interaction direct derivative scheme [79]. This model is able to incorporate information on the microcrack distribution, which, however, needs additional calibration effort.
- After calibration of the additional distribution-related parameters, model predictions of the improved model for the uniaxial compression test have substantially improved, with a deviation of only 3.2%.
- The proposed model has been proven to be capable of simulating anisotropic microcrack evolution, leading to anisotropic stiffness degradation on the macroscopic level. In addition, the evolution of the Poisson’s ratio during loading could be predicted.
Nevertheless, the model should also be extended to account for the interfacial transition zone (ITZ). This will enable the investigation of the effect of ITZ on the overall behavior of concrete. Lastly, two potential practical applications are also outlined:
- Due to the multiscale nature of the proposed model, it can be used to simulate a wide variety of concrete compositions by simply altering the predominantly physically measurable microscale and mesoscale parameters governing the topology and material properties of the required concrete composition. Thus, the proposed modelling framework can be the basis of a Virtual Material Testing Environment and can collaboratively aid in the development of concrete with a better performance.
- From a structural health monitoring view point, the outcome of the model can serve as a high-fidelity input for an ultrasonic-wave propagation numerical investigation of damaged concrete (see, e.g., [81,82,83]). This, in turn, can support the development of an ultrasonic wave based technology (the so-called coda wave) on early detection of (diffuse) damage in concrete.
Author Contributions
Conceptualization, G.V., F.D., J.J.T. and G.M.; Data curation, F.D. and G.V.; Formal analysis, G.V. and F.D.; Funding acquisition, J.J.T., C.G. and G.M.; Investigation, G.V., F.D., J.J.T., C.G. and G.M.; Methodology, G.V., F.D., J.J.T., C.G. and G.M.; Project administration, J.J.T., C.G. and G.M.; Resources, C.G. and G.M.; Software, G.V.; Supervision, J.J.T., C.G. and G.M.; Validation, G.V., J.J.T. and G.M.; Visualization, G.V., F.D. and J.J.T.; Writing—original draft, G.V., F.D. and J.J.T.; Writing—review and editing, G.V., F.D., J.J.T. and G.M. All authors have read and agreed to the published version of the manuscript.
Funding
This research was funded by the German Research Foundation (DFG) in the framework of Subprojects RUB1 and TUM1 of the Research Unit FOR 2825 (project number 398216472). This support is gratefully acknowledged.
Institutional Review Board Statement
Not applicable.
Informed Consent Statement
Not applicable.
Data Availability Statement
Data sharing is not applicable.
Acknowledgments
We would like to thank Tagir Iskhakov for interesting discussions.
Conflicts of Interest
The authors declare no conflict of interest.
Abbreviations
The following abbreviations are used in this manuscript:
| CWI | Coda Wave Interferometry |
| FFT | Fast Fourier Transform |
| REV | Representative Elementary Volume |
| LEFM | Linear Elastic Fracture Mechanics |
| CMG | Concrete Mesostructure Generator |
| DNS | Direct Numerical Simulation |
| ROS | Reduced Order Simulation |
| SCA | Self-consistent Clustering Analysis |
| ITZ | Interfacial Transition zone |
| IDD | Interaction Direct Derivative |
| MIDD | Modified Interaction Direct Derivative |
Appendix A. Structure of Hierarchical Numerical Simulation of the Multiscale Model
| Algorithm 1: Structure of hierarchical numerical simulation of the multiscale model (High-fidelity model). |
 |
Appendix B. Parametric Study of Mori–Tanaka Based Damage Model of Cementitious Composite
In this analysis, we investigate the effect of the initial aspect ratio X, the microscopic fracture energy , the crack density , and the Poisson ratio of the mortar solid . Here, the mortar solid refers to the mortar composite without the microcracks. Given the microcrack volume fraction and the microcrack geometry, the effective stiffness of the mortar REV can be computed using the Mori–Tanaka homogenisation scheme and is given by the following expression:
and the effective stress as the mesoscale is evaluated using
Here, is the Mori–Tanaka strain localisation tensor of microcrack family i,
Assuming zero stiffness of all microcrack families, Equation (A4) is simplified as
The parameter range chosen for the subsequent study is listed in Table A1.

Table A1.
Summary of parameters used for the parametric study.
| Model Parameters | ||
|---|---|---|
| m | ||
| 1 | m | |
| N/mm | ||
| 43 | GPa | |
| 0.3 | ||
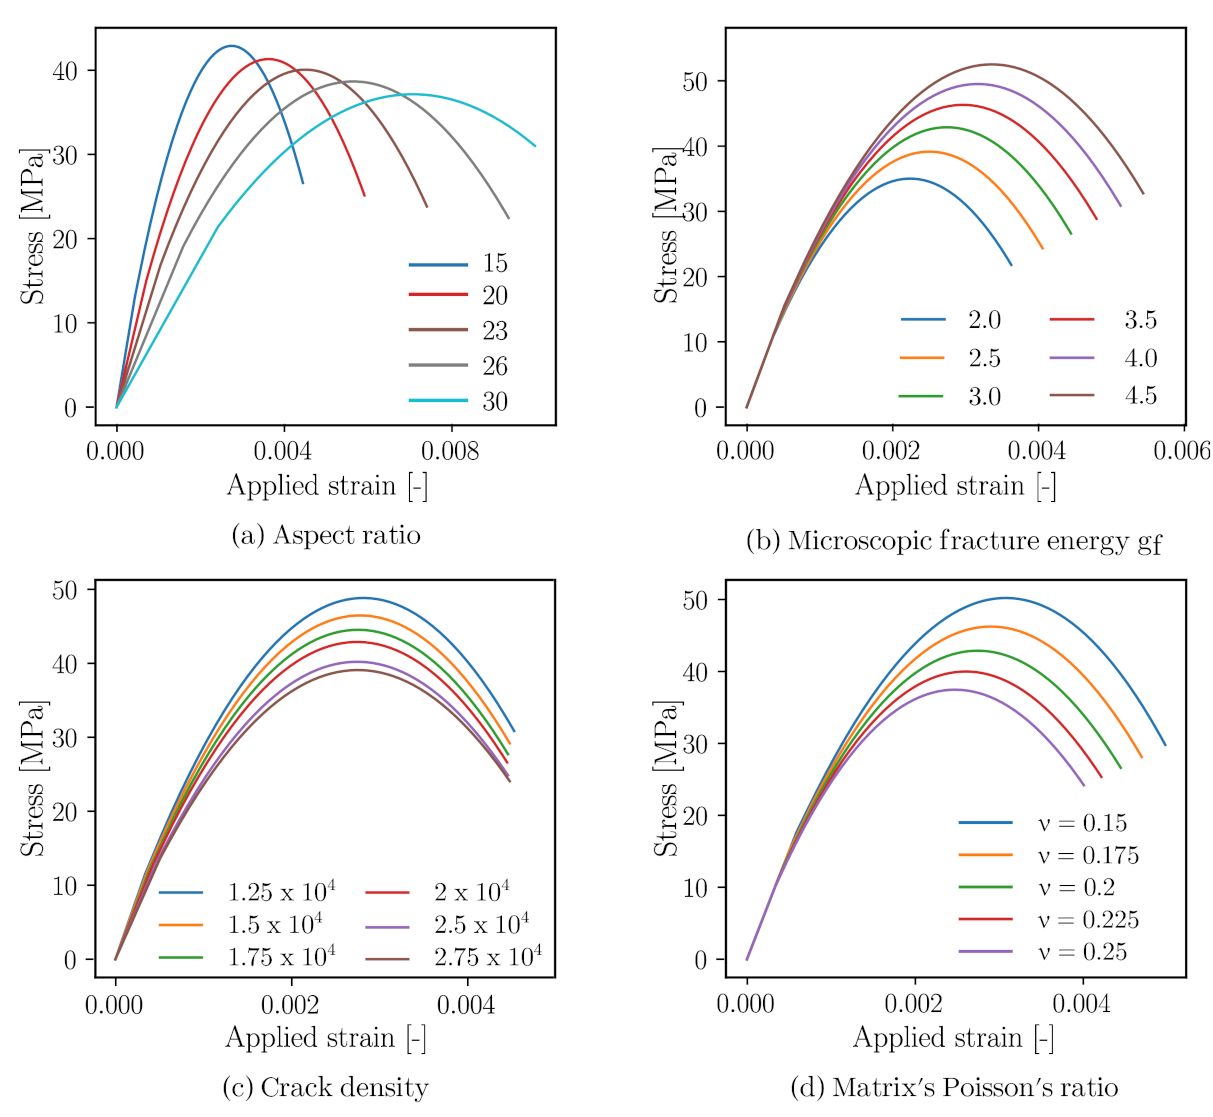
The first analysis is regarding the influence of the aspect ratio. In the micromechanical model, the aspect ratio is controlled by modifying the initial crack radius, while crack thickness is held constant in all simulations. In general, the absolute size of a penny-shaped microcrack is irrelevant, at least from the point of view of the mathematical formulation. The choice of the microcrack dimensions should nevertheless follow the principle of the separation of scales. The effect of aspect ratio is taken into account via the computation of the internal Eshelby tensor for that associated crack family. As can be seen in Figure A1 (top-left), by increasing the size of the microcrack radius, a reduction in the compressive strength is observed.
Figure A1.
Parametric study: effect of model parameters at a microscopic scale on the compressive response of mortar REV.
Figure A1.
Parametric study: effect of model parameters at a microscopic scale on the compressive response of mortar REV.

Moreover, due to the increase in the microcrack radius, the initial volume fraction of microcracks is also higher, thus it leads to a significant reduction in the initial stiffness of the mortar REV. We see that mortar whose microcrack’s aspect ratio of higher value exhibits a more prolonged nonlinear stress strain curve. This effect is not trivial and can be explained as follows: an increase in the aspect ratio leads to a reduction of the Poisson ratio of the microcracked mortar, according to the Mori–Tanaka homogenisation scheme. Thus, in uniaxial compression, given a constant applied strain, the ratio between the positive components of strain tensor and the maximum strain components is smaller, thus the crack grows at a much slower rate.
The influence of the microscopic fracture energy parameter is shown in Figure A1 (top right). A smaller value of yields an earlier microcrack initiation and, subsequently, lower compressive strength. The elastic property or the REV is not affected by this parameter.
Meanwhile, a high value of microcrack density has a negative effect on both initial stiffness and the compressive strength. However, the parameter is insensitive to the strain value at peak stress. Lastly, material parameter has a strong influence on the elastic limit strain and the compressive strength. Higher value of leads to earlier microcracking and failure due to faster lateral expansion. In contrast, a parametric study under uniaxial tension reveals that the (only) most sensitive parameter is . The tensile strength of mortar increases with increasing . Of all studied parameters, the initial aspect ratio or the initial microcrack radius appears to be highly influential on the compressive behaviour of the composites as compared to other parameters. It can be seen that the model is capable of simulating a wide range of stress–strain behaviour of cementitious materials.
References
- Ulm, F.J.; Constantinides, G.; Heukamp, F.H. Is concrete a poromechanics materials?—A multiscale investigation of poroelastic properties. Mater. Struct. 2004, 37, 43–58. [Google Scholar] [CrossRef]
- Hoagland, R.G.; Hahn, G.T.; Rosenfield, A.R. Influence of microstructure on fracture propagation in rock. Rock Mech. 1973, 5, 77–106. [Google Scholar] [CrossRef]
- Van Mier, J.G. Fracture Processes of Concrete; CRC Press: Boca Raton, FL, USA, 2017; Volume 12. [Google Scholar]
- Kobayashi, T.; Shockey, D.A. Fracture surface topography analysis (FRASTA)—Development, accomplishments, and future applications. Eng. Fract. Mech. 2010, 77, 2370–2384. [Google Scholar] [CrossRef]
- Macek, W.; Marciniak, Z.; Branco, R.; Rozumek, D.; Królczyk, G. A fractographic study exploring the fracture surface topography of S355J2 steel after pseudo-random bending-torsion fatigue tests. Measurement 2021, 178, 109443. [Google Scholar] [CrossRef]
- Hsu, T.T.; Slate, F.O.; Sturman, G.M.; Winter, G. Microcracking of plain concrete and the shape of the stress–strain curve. Proceedings 1963, 60, 209–224. [Google Scholar]
- Hsu, T.T. Fatigue and microcracking of concrete. Mater. Constr. 1984, 17, 51–54. [Google Scholar] [CrossRef]
- Shah, S.P.; Chandra, S. Critical stress, volume change, and microcracking of concrete. Proceedings 1968, 65, 770–780. [Google Scholar]
- Shah, S.; Sankar, R. Internal cracking and strain softening response of concrete under uniaxial compression. Mater. J. 1987, 84, 200–212. [Google Scholar]
- Ravindrarajah, R.S.; Swamy, R. Load effects on fracture of concrete. Mater. Struct. 1989, 22, 15–22. [Google Scholar] [CrossRef]
- Nemati, K.M.; Monteiro, P.J.; Scrivener, K.L. Analysis of compressive stress-induced cracks in concrete. ACI Mater. J. 1998, 95, 617–630. [Google Scholar]
- Hall, A.J.; Brennan, I.; Raymond, E.; Ghoshal, A.; Liu, K.C.; Coatney, M.; Haynes, R.; Bradley, N.; Weiss, V.; Tzeng, J. Damage Precursor Investigation of Fiber-Reinforced Composite Materials under Fatigue Loads; Technical Report; Army Research Lab Aberdeen Proving Ground MD Vehicle Technology Directorate: Aberdeen, MD, USA, 2013. [Google Scholar]
- Reifsnider, K.L.; Case, S.W. Damage Tolerance and Durability of Material Systems; Willey: Hoboken, NJ, USA, 2002. [Google Scholar]
- Selleck, S.F.; Landis, E.N.; Peterson, M.L.; Shah, S.; Achenbach, J.D. Ultrasonic investigation of concrete with distributed damage. ACI Mater. J. 1998, 95, 27–36. [Google Scholar]
- Anugonda, P.; Wiehn, J.S.; Turner, J.A. Diffusion of ultrasound in concrete. Ultrasonics 2001, 39, 429–435. [Google Scholar] [CrossRef]
- Schurr, D.P.; Kim, J.Y.; Sabra, K.G.; Jacobs, L.J. Damage detection in concrete using coda wave interferometry. Ndt E Int. 2011, 44, 728–735. [Google Scholar] [CrossRef]
- Bažant, Z.P.; Oh, B.H. Crack band theory for fracture of concrete. Matér. Constr. 1983, 16, 155–177. [Google Scholar] [CrossRef] [Green Version]
- Oñate, E.; Oller, S.; Oliver, J.; Lubliner, J. A constitutive model for cracking of concrete based on the incremental theory of plasticity. Eng. Comput. 1988, 5, 309–319. [Google Scholar] [CrossRef]
- Meschke, G.; Lackner, R.; Mang, H.A. An anisotropic elastoplastic-damage model for plain concrete. Int. J. Numer. Methods Eng. 1998, 42, 703–727. [Google Scholar] [CrossRef]
- Jirasek, M. Nonlocal models for damage and fracture: Comparison of approaches. Int. J. Solids Struct. 1998, 35, 4133–4145. [Google Scholar] [CrossRef]
- Peerlings, R.H.; de Borst, R.; Brekelmans, W.M.; De Vree, J. Gradient enhanced damage for quasi-brittle materials. Int. J. Numer. Methods Eng. 1996, 39, 3391–3403. [Google Scholar] [CrossRef]
- Lubliner, J.; Oliver, J.; Oller, S.; Oñate, E. A plastic-damage model for concrete. Int. J. Solids Struct. 1989, 25, 299–326. [Google Scholar] [CrossRef]
- Caner, F.C.; Bažant, Z.P. Microplane model M7 for plain concrete. I: Formulation. J. Eng. Mech. 2013, 139, 1714–1723. [Google Scholar] [CrossRef]
- Pichler, B.; Hellmich, C. Upscaling quasi-brittle strength of cement paste and mortar: A multi-scale engineering mechanics model. Cem. Concr. Res. 2011, 41, 467–476. [Google Scholar] [CrossRef]
- Iskhakov, T.; Timothy, J.; Meschke, G. Expansion and deterioration of concrete due to ASR: Micromechanical modeling and analysis. Cem. Concr. Res. 2019, 11, 407–418. [Google Scholar] [CrossRef]
- Horii, H.; Nemat-Nasser, S. Overall moduli of solids with microcracks: Load-induced anisotropy. J. Mech. Phys. Solids 1983, 31, 155–171. [Google Scholar] [CrossRef]
- Zimmerman, R.W. The effect of microcracks on the elastic moduli of brittle materials. J. Mater. Sci. Lett. 1985, 4, 1457–1460. [Google Scholar] [CrossRef]
- Kachanov, M. Elastic solids with many cracks and related problems. Adv. Appl. Mech. 1993, 30, 259–445. [Google Scholar]
- Castañeda, P.P.; Willis, J.R. The effect of spatial distribution on the effective behavior of composite materials and cracked media. J. Mech. Phys. Solids 1995, 43, 1919–1951. [Google Scholar] [CrossRef]
- Pichler, B.; Hellmich, C.; Mang, H. A combined fracture-micromechanics model for tensile strain-softening in brittle materials, based on propagation of interacting microcracks. Int. J. Numer. Anal. Methods Geomech. 2007, 31, 111–132. [Google Scholar] [CrossRef]
- Pensée, V.; Kondo, D.; Dormieux, L. Micromechanical analysis of anisotropic damage in brittle materials. J. Eng. Mech. 2002, 128, 889–897. [Google Scholar] [CrossRef]
- Zhu, Q.Z.; Kondo, D.; Shao, J.F. Homogenization-based analysis of anisotropic damage in brittle materials with unilateral effect and interactions between microcracks. Int. J. Numer. Anal. Methods Geomech. 2009, 33, 749–772. [Google Scholar] [CrossRef]
- Wriggers, P.; Moftah, S.O. Mesoscale models for concrete: Homogenisation and damage behaviour. Finite Elem. Anal. Des. 2006, 42, 623–636. [Google Scholar] [CrossRef]
- Benkemoun, N.; Hautefeuille, M.; Colliat, J.B.; Ibrahimbegovic, A. Failure of heterogeneous materials: 3D meso-scale FE models with embedded discontinuities. Int. J. Numer. Methods Eng. 2010, 82, 1671–1688. [Google Scholar] [CrossRef] [Green Version]
- La Borderie, C.; Lawrence, C.; N’Guyen, T.; Nahas, G. A mesoscopic approach for a better understanding of the transition from diffuse damage to localized damage. In Proceedings of the FraMCoS’7, Jeju, Korea, 23–28 May 2010. [Google Scholar]
- Zhang, H.; Sheng, P.; Zhang, J.; Ji, Z. Realistic 3D modeling of concrete composites with randomly distributed aggregates by using aggregate expansion method. Constr. Build. Mater. 2019, 225, 927–940. [Google Scholar] [CrossRef]
- Kim, S.M.; Al-Rub, R.K.A. Meso-scale computational modeling of the plastic-damage response of cementitious composites. Cem. Concr. Res. 2011, 41, 339–358. [Google Scholar] [CrossRef]
- Huang, Y.; Yang, Z.; Ren, W.; Liu, G.; Zhang, C. 3D meso-scale fracture modelling and validation of concrete based on in-situ X-ray Computed Tomography images using damage plasticity model. Int. J. Solids Struct. 2015, 67, 340–352. [Google Scholar] [CrossRef]
- Roubin, E.; Vallade, A.; Benkemoun, N.; Colliat, J.B. Multi-scale failure of heterogeneous materials: A double kinematics enhancement for Embedded Finite Element Method. Int. J. Solids Struct. 2015, 52, 180–196. [Google Scholar] [CrossRef]
- Nguyen, T.T.; Yvonnet, J.; Bornert, M.; Chateau, C. Initiation and propagation of complex 3D networks of cracks in heterogeneous quasi-brittle materials: Direct comparison between in situ testing-microCT experiments and phase field simulations. J. Mech. Phys. Solids 2016, 95, 320–350. [Google Scholar] [CrossRef]
- Nguyen, T.T.; Yvonnet, J.; Bornert, M.; Chateau, C.; Bilteryst, F.; Steib, E. Large-scale simulations of quasi-brittle microcracking in realistic highly heterogeneous microstructures obtained from micro CT imaging. Extrem. Mech. Lett. 2017, 17, 50–55. [Google Scholar] [CrossRef] [Green Version]
- Yılmaz, O.; Molinari, J.F. A mesoscale fracture model for concrete. Cem. Concr. Res. 2017, 97, 84–94. [Google Scholar] [CrossRef]
- Ren, W.; Yang, Z.; Sharma, R.; Zhang, C.; Withers, P.J. Two-dimensional X-ray CT image based meso-scale fracture modelling of concrete. Eng. Fract. Mech. 2015, 133, 24–39. [Google Scholar] [CrossRef]
- Qiu, Q.; Dai, J.G. Meso-scale modeling of chloride diffusivity in mortar subjected to corrosion-induced cracking. Comput. Aided Civ. Infrastruct. Eng. 2021, 36, 602–619. [Google Scholar] [CrossRef]
- Suchorzewski, J.; Tejchman, J.; Nitka, M. Discrete element method simulations of fracture in concrete under uniaxial compression based on its real internal structure. Int. J. Damage Mech. 2018, 27, 578–607. [Google Scholar] [CrossRef]
- Moulinec, H.; Suquet, P. A fast numerical method for computing the linear and nonlinear mechanical properties of composites. Comptes Rendus De L’Académie Des Sciences. Série II, Mécanique, Phys. Chim. Astron. 1994, 318, 1417–1423. [Google Scholar]
- Escoda, J.; Willot, F.; Jeulin, D.; Sanahuja, J.; Toulemonde, C. Estimation of local stresses and elastic properties of a mortar sample by FFT computation of fields on a 3D image. Cem. Concr. Res. 2011, 41, 542–556. [Google Scholar] [CrossRef] [Green Version]
- Li, J.; Tian, X.X.; Abdelmoula, R. A damage model for crack prediction in brittle and quasi-brittle materials solved by the FFT method. Int. J. Fract. 2012, 173, 135–146. [Google Scholar] [CrossRef]
- Yvonnet, J.; He, Q.C. The reduced model multiscale method (R3M) for the nonlinear homogenization of hyperelastic media at finite strains. J. Comput. Phys. 2007, 223, 341–368. [Google Scholar] [CrossRef] [Green Version]
- Goury, O.; Amsallem, D.; Bordas, S.P.A.; Liu, W.K.; Kerfriden, P. Automatised selection of load paths to construct reduced-order models in computational damage micromechanics: From dissipation-driven random selection to Bayesian optimization. Comput. Mech. 2016, 58, 213–234. [Google Scholar] [CrossRef] [Green Version]
- Ladevèze, P.; Passieux, J.C.; Néron, D. The latin multiscale computational method and the proper generalized decomposition. Comput. Methods Appl. Mech. Eng. 2010, 199, 1287–1296. [Google Scholar] [CrossRef] [Green Version]
- Kalidindi, S.R. A Bayesian framework for materials knowledge systems. MRS Commun. 2019, 9, 518–531. [Google Scholar] [CrossRef] [Green Version]
- Liu, Z.; Bessa, M.; Liu, W.K. Self-consistent clustering analysis: An efficient multi-scale scheme for inelastic heterogeneous materials. Comput. Methods Appl. Mech. Eng. 2016, 306, 319–341. [Google Scholar] [CrossRef]
- Tang, S.; Zhang, L.; Liu, W.K. From virtual clustering analysis to self-consistent clustering analysis: A mathematical study. Comput. Mech. 2018, 62, 1443–1460. [Google Scholar] [CrossRef]
- Liu, Z.; Fleming, M.; Liu, W.K. Microstructural material database for self-consistent clustering analysis of elastoplastic strain softening materials. Comput. Methods Appl. Mech. Eng. 2018, 330, 547–577. [Google Scholar] [CrossRef]
- Lasdon, L.S.; Waren, A.D.; Jain, A.; Ratner, M. Design and testing of a generalized reduced gradient code for nonlinear programming. ACM Trans. Math. Softw. (TOMS) 1978, 4, 34–50. [Google Scholar] [CrossRef]
- ISO. 3310-1: Test Sieves—Technical Requirements and Testing—Part 1: Test Sieves of Metal wire Cloth; ISO: Geneva, Switzerland, 2016. [Google Scholar]
- 1045-2 D. Concrete, Reinforced and Prestressed Concrete Structures—Part 2: Concrete—Specification, Properties, Production and Conformity—Application Rules for DIN EN 206-1; Beuth: Berlin, Germany, 2015. [Google Scholar]
- Wesche, K.; Manns, W. Results of an international survey on the determination of the modulus of elasticity of the beton in compression. Mater. Constr. 1970, 3, 179–196. [Google Scholar] [CrossRef]
- Ross, B.E.; Hamilton, H.T., III. Evaluation of strain gage lengths for testing limestone and granite aggregate concretes. Constr. Build. Mater. 2011, 25, 406–408. [Google Scholar] [CrossRef]
- Anderson, T.W.; Darling, D.A. A test of goodness of fit. J. Am. Stat. Assoc. 1954, 49, 765–769. [Google Scholar] [CrossRef]
- Schön, J. Physical Properties of Rocks: Fundamentals and Principles of Petrophysics; Developments in Petroleum Science Series; Elsevier: Amsterdam, The Netherlands, 2004. [Google Scholar]
- Mazars, J. A description of micro-macroscale damage of concrete structures. Eng. Fract. Mech. 1986, 25, 729–737. [Google Scholar] [CrossRef]
- Haecker, C.J.; Garboczi, E.; Bullard, J.; Bohn, R.; Sun, Z.; Shah, S.; Voigt, T. Modeling the linear elastic properties of Portland cement paste. Cem. Concr. Res. 2005, 35, 1948–1960. [Google Scholar] [CrossRef]
- Concrete Mesostructure Generation Using Python. Available online: https://pycmg.readthedocs.io/en/latest/ (accessed on 8 June 2021).
- Bessa, M.A.; Bostanabad, R.; Liu, Z.; Hu, A.; Apley, D.W.; Brinson, C.; Chen, W.; Liu, W.K. A framework for data-driven analysis of materials under uncertainty: Countering the curse of dimensionality. Comput. Methods Appl. Mech. Eng. 2017, 320, 633–667. [Google Scholar] [CrossRef]
- Bessa, M.A.; Glowacki, P.; Houlder, M. Bayesian machine learning in metamaterial design: Fragile becomes supercompressible. Adv. Mater. 2019, 31, 1904845. [Google Scholar] [CrossRef] [Green Version]
- Holla, V.; Vu, G.; Timothy, J.J.; Diewald, F.; Gehlen, C.; Meschke, G. Computational Generation of Virtual Concrete Mesostructures. Materials 2021, 14, 3782. [Google Scholar] [CrossRef]
- Soroushian, P.; Elzafraney, M.; Nossoni, A. Specimen preparation and image processing and analysis techniques for automated quantification of concrete microcracks and voids. Cem. Concr. Res. 2003, 33, 1949–1962. [Google Scholar] [CrossRef]
- Constantinides, G.; Ulm, F.J. The effect of two types of CSH on the elasticity of cement-based materials: Results from nanoindentation and micromechanical modeling. Cem. Concr. Res. 2004, 34, 67–80. [Google Scholar] [CrossRef]
- Nemat-Nasser, S.; Hori, H. Micromechanics: Overall Properties of Heterogeneous Materials, 2nd ed.; Elsevier: Amsterdam, The Netherlands, 1999. [Google Scholar]
- Belytschko, T.; Loehnert, S.; Song, J.H. Multiscale aggregating discontinuities: A method for circumventing loss of material stability. Int. J. Numer. Methods Eng. 2008, 73, 869–894. [Google Scholar] [CrossRef]
- Coenen, E.; Kouznetsova, V.; Bosco, E.; Geers, M. A multi-scale approach to bridge microscale damage and macroscale failure: A nested computational homogenization-localization framework. Int. J. Fract. 2012, 178, 157–178. [Google Scholar] [CrossRef]
- Linder, C.; Raina, A. A strong discontinuity approach on multiple levels to model solids at failure. Comput. Methods Appl. Mech. Eng. 2013, 253, 558–583. [Google Scholar] [CrossRef]
- Jones, R. A method of studying the formation of cracks in a material subjected to stress. Br. J. Appl. Phys. 1952, 3, 229. [Google Scholar] [CrossRef]
- Loo, Y. A new method for microcrack evaluation in concrete under compression. Mater. Struct. 1992, 25, 573–578. [Google Scholar] [CrossRef]
- Osorio, E.; Bairán, J.M.; Marí, A.R. Lateral behavior of concrete under uniaxial compressive cyclic loading. Mater. Struct. 2013, 46, 709–724. [Google Scholar] [CrossRef]
- Hu, G.K.; Weng, J. The connection between the double-inclusion model and the Ponte Casteneda-Willis, Mori–Tanaka and the Kuster-Toksoz models. Mech. Mater. 2000, 32, 495–503. [Google Scholar] [CrossRef]
- Zheng, Q.S.; Du, D.X. An explicit and universally applicable estimate for the effective properties of multiphase composites which accounts for inclusion distribution. J. Mech. Phys. Solids 2001, 49, 2765–2788. [Google Scholar] [CrossRef]
- Charpin, L.; Ehrlacher, A. Estimating the poroelastic properties of cracked materials. Acta Mech. 2014, 225, 2501–2519. [Google Scholar] [CrossRef] [Green Version]
- Saenger, E.H.; Gold, N.; Shapiro, S.A. Modeling the propagation of elastic waves using a modified finite-difference grid. Wave Motion 2000, 31, 77–92. [Google Scholar] [CrossRef]
- Kocur, G.K.; Saenger, E.H.; Vogel, T. Elastic wave propagation in a segmented X-ray computed tomography model of a concrete specimen. Constr. Build. Mater. 2010, 24, 2393–2400. [Google Scholar] [CrossRef]
- Saenger, E.H.; Kocur, G.K.; Jud, R.; Torrilhon, M. Application of time reverse modeling on ultrasonic non-destructive testing of concrete. Appl. Math. Model. 2011, 35, 807–816. [Google Scholar] [CrossRef]
Figure 1.
Standardised and optimised aggregate distributions for a concrete mix with an approximated AB16 aggregate distribution.
Figure 1.
Standardised and optimised aggregate distributions for a concrete mix with an approximated AB16 aggregate distribution.

Figure 2.
Stress–strain diagrams for longitudinal strain and lateral strain obtained from uniaxial compression tests on a cylindrical quartzitic specimen. The strain gauges failed before reaching the ultimate compressive strength of 368.0 MPa. The plot also shows the Poisson’s ratio obtained from the ratio of the lateral and the longitudinal strains.

Figure 3.
Determination of material parameters for concrete and cement paste: (a) polished concrete specimen with a maximum grain size of 16 mm before loading, (b) cracked concrete specimen with a strain gauge after the compressive load test, (c) polished hardened cement paste specimen before loading, (d) hardened cement paste specimen with strain gauge after the compressive load test.

Figure 4.
Schematic illustration of the multiscale computational homogenisation approach considered in this paper.
Figure 4.
Schematic illustration of the multiscale computational homogenisation approach considered in this paper.

Figure 5.
(Left) stress–strain relation of mortar subjected to uniaxial tension (top) and uniaxial compression (bottom). (Center) stiffness evolution due to the propagation of microcracks. (Right) growth of the volume fraction of three microcrack families. Microcrack propagation is modelled as the increase in microcrack radius according to the Griffith criterion.

Figure 6.
Simple 3D model structure characterised by a cube (size 3.1 cm) with one spherical inclusion at the center and the corresponding clustered microstructures corresponding to various numbers of clusters. The spherical inclusion has the radius of 0.64 cm and occupies a volume fraction of 4.582%. Each color represents a different cluster label.

Figure 7.
(a,b) Idealised concrete mesostructures considered in the second analysis. The numerical sample of size 5.05 cm is discretised by voxels. The aggregates are modelled using polyhedrons with an aspect ratio ranging from 1 to 1.5 and an average size of 10–15 mm. The inclusion phase occupies a volume fraction of 9.87%; (c–f) reduced microstructures with 36, 72, 108 and 288 clusters.

Figure 8.
Performance of the k-means-based reduced order scheme in numerical analyses of a simple microstructure subjected to uniaxial compression according to Figure 6. Left: stress–strain curves obtained from five different k-means based models, right: Relative error (measured w.r.t. the direct numerical simulation) of the computed axial stress obtained for a different number of clusters.

Figure 9.
Performance of the k-means-based reduced order scheme in numerical analyses of a simplified concrete meso-structure according to Figure 7 subjected to uniaxial compression. Left: stress–strain curves of four different k-means based reduced samples, right: relative error of the computed axial stress obtained for three different numbers of clusters (Results from 256 mortar clusters taken as reference results).

Figure 10.
Top left and right: microcracking regions, whose average stiffness is less than 20% of the initial stiffness, obtained from ROS simulations with = 32 and 256. Bottom left and right: visualisation of mortar damage in terms of the distribution of the relative secant stiffness () at strain = obtained from simulations with = 32 and 256.

Figure 11.
Box 1: Visualisation of the numerical concrete sample representing a specimen of size 10 cm (top), and qualitative comparison between slices of virtual and actual samples (bottom), Box 2: Cumulative volume distribution of aggregates (top) and size distribution of the quartzitic particles (bottom).

Figure 12.
Comparison of the calibrated stress–strain curve with the experimental data of a mortar sample (). The micromechanics based model predicts the initiation of microcracking in mortar sample at a strain level of .
Figure 12.
Comparison of the calibrated stress–strain curve with the experimental data of a mortar sample (). The micromechanics based model predicts the initiation of microcracking in mortar sample at a strain level of .

Figure 13.
Left and center: Visualisation of the clustered mesostructure of the virtual concrete specimen obtained from the k-means cluster algorithm, Right: One of the strain components () that was used to compute the clusters shown in the image on the left, the red color indicates high values of positive strain components, which correlates with microcracking.

Figure 14.
Top left: Stress–strain curves obtained from the simulation (blue line) and the experiment (black lines), Top right: Visualisation of damage distribution at a microcrack initiation state. From (A–F): Opening of vertically oriented microcracks in the mortar matrix at six different load levels (25.77, 37.05, 47.06, 55.88, 63.41, 73.71 MPa, red color indicates active microcracking regions).

Figure 15.
Top left: relative stiffness evolution under uniaxial compression of all mortar clusters in x- and z-directions. Top right: relative macroscopic secant stiffness of concrete under uniaxial compression at macroscopic scale. Bottom: volume fraction of microcracks, in all mortar clusters (left), and total volume fraction of microcrack in concrete samples (right).

Figure 16.
Predicted evolution of the apparent Poisson ratio with increasing load level.

Figure 17.
Schematic illustration of the IDD homogenisation scheme.

Figure 18.
Left: Computed stress–strain response of mortar subjected to uniaxial compression using the calibrated MIDD scheme (green) in comparison with the experimental range (grey) and calibrated Mori–Tanaka scheme (blue). Center: Evolution of stiffnesses in x and z-directions, respectively. Right: Evolution of microcrack volume fraction.

Figure 19.
Stress–strain response of concrete numerical sample obtained from Mori–Tanaka scheme (blue), modified IDD scheme (green), in comparison with the experimental range (grey).
Figure 19.
Stress–strain response of concrete numerical sample obtained from Mori–Tanaka scheme (blue), modified IDD scheme (green), in comparison with the experimental range (grey).

Table 1.
Composition of concrete standard AB16 used in the experiments.
| Type | Description | Amount | Density | Volume |
|---|---|---|---|---|
| [-] | [-] | [kg/dm] | [dm/m] | |
| w/c | 0.45 | |||
| Cement | CEM I 52.5 R | 350 [kg/m] | 310 | 112.9 |
| Plasticizer | 1.0 [m-%] | |||
| Air voids | 2.00 % | 0 | 20 | |
| Water | 157.5 [kg/m] | 1 | 157.5 | |
| Aggregate 0/2 | Quartz | 39.46 [%] | 2.67 | 280.02 |
| Aggregate 2/5 | Quartz | 12.18 [%] | 2.64 | 86.44 |
| Aggregate 5/8 | Quartz | 28.91 [%] | 2.64 | 205.13 |
| Aggregate 8/16 | Quartz | 19.45 [%] | 2.65 | 138.01 |
Table 2.
Experimental quantification of the concrete compositions according to standard AB16.
| Cement Matrix | Fine Aggregates | Coarse Aggregates | |||||||||||
|---|---|---|---|---|---|---|---|---|---|---|---|---|---|
| Size [mm] | - | 0.063 | 0.125 | 0.25 | 0.5 | 1 | 2 | 2.8 | 4 | 5.6 | 8 | 11.2 | 16 |
| Volume fraction [%] | 29.259 | 1.504 | 1.619 | 1.758 | 1.758 | 3.634 | 12.174 | 5.0626 | 5.146 | 6.743 | 16.606 | 2.904 | 11.832 |
| Total [%] | 29.259 | 22.448 | 48.292 | ||||||||||
| Total [%] | 29.259 | 70.741 | |||||||||||
Table 3.
Young’s Modulus, Poisson’s ratio, and the compressive strength of the quartzitic aggregates, mortar, and the concrete with an AB16 grading curve.
Table 3.
Young’s Modulus, Poisson’s ratio, and the compressive strength of the quartzitic aggregates, mortar, and the concrete with an AB16 grading curve.
| Material Parameter | Quartzitic Aggregate | Mortar | AB16 Concrete |
|---|---|---|---|
| Young’s Modulus E [GPa ] | 84.6 | 27.1 | 48.03 |
| Poisson’s ratio [-] | 0.12 | 0.19 | 0.15 |
| Compressive strength [MPa] | 368 | 80.3 | 64.4 |
Table 4.
Summary of parameters used for the analysis of a mortar REV subjected to uniaxial loading. The following sources have been used to determinate the parameters: —Experiment (Section 2), —[25], —[64].
| Material parameters | |||
| Young’s modulus of aggregates | 84.6 | GPa | |
| Poisson ratio of aggregates | 0.2 | ||
| Aggregates’ volume fraction | 0.35 | ||
| Model parameters | |||
| Microcrack’s initial radius (i = 1, 2, 3) | 0.017 | mm | |
| Microcrack’s initial half thickness | 0.001 | mm | |
| Microcrack’s density | 1/mm | ||
| Young’s modulus of cement paste solid | 44 | GPa | |
| Poisson ratio of cement paste solid | 0.25 | ||
| Mortar solid microscopic fracture energy | 6.88 | N/mm | |
| Numerical output | |||
| Young’s modulus of mortar REV | 26.9 | GPa | |
| Compressive strength of mortar REV | GPa | ||
| Tensile strength of mortar REV | MPa | ||
| Ratio between Compressive and Tensile strength | 14.86 | ||
Table 5.
Material parameters for the large quarzitic aggregates and the calibrated parameters for mortar, containing a volume fraction of fine quarzitic aggregates. The mortar matrix is assumed to contain a 8.3% volume fraction of initial microcracks with an initial aspect ratio of 23. In the investigated concrete sample, the material properties of the mortar matrix with a volume fraction of are determined by varying the volume fraction of aggregate accordingly in the Mori–Tanaka based homogenisation procedure, while keeping other parameters unchanged (group Model parameters). The following sources are used to determine the parameters: []—Experiment, [] aspect ratio is taken within the range measured in [69], —[24,70].
| Material parameters (from laboratory tests) | |||
| Young’s modulus of aggregates | 86.4 | GPa | |
| Poisson ratio of aggregates | 0.12 | ||
| Volume fraction of aggregates | 0.3034 | ||
| Model parameters | |||
| Microcrack initial radius (i = 1, 2, 3) | 0.023 | mm | |
| Microcrack initial half thickness | 0.001 | mm | |
| Microcrack’s density | 1/mm | ||
| Mortar solid microscopic fracture energy | 6.61 | N/mm | |
| Young’s modulus of cement paste solid | 49 | GPa | |
| Poisson ratio of cement paste solid | 0.23 | ||
| Homogenised parameters | |||
| Young’s modulus of mortar | 29.8 | GPa | |
| Poisson ratio of mortar | 0.124 | ||
| Compressive strength of mortar | MPa | ||
Table 6.
Homogenised elastic properties of the synthetic concrete sample in comparison with experimental data obtained from a uniaxial compression test.
Table 6.
Homogenised elastic properties of the synthetic concrete sample in comparison with experimental data obtained from a uniaxial compression test.
| Volume Fraction [%] | Average Modulus of Elasticity [GPa] | Poisson’s Ratio [-] | Anisotropy [-] | ||
|---|---|---|---|---|---|
| Model | Exp. | Model | Exp. | ||
| 47.74 | 50.311 | 48.03 | 0.124 | 0.152 | 1.003 |
Publisher’s Note: MDPI stays neutral with regard to jurisdictional claims in published maps and institutional affiliations. |
© 2021 by the authors. Licensee MDPI, Basel, Switzerland. This article is an open access article distributed under the terms and conditions of the Creative Commons Attribution (CC BY) license (https://creativecommons.org/licenses/by/4.0/).
Share and Cite
MDPI and ACS Style
Vu, G.; Diewald, F.; Timothy, J.J.; Gehlen, C.; Meschke, G. Reduced Order Multiscale Simulation of Diffuse Damage in Concrete. Materials 2021, 14, 3830. https://doi.org/10.3390/ma14143830
AMA Style
Vu G, Diewald F, Timothy JJ, Gehlen C, Meschke G. Reduced Order Multiscale Simulation of Diffuse Damage in Concrete. Materials. 2021; 14(14):3830. https://doi.org/10.3390/ma14143830
Chicago/Turabian StyleVu, Giao, Fabian Diewald, Jithender J. Timothy, Christoph Gehlen, and Günther Meschke. 2021. "Reduced Order Multiscale Simulation of Diffuse Damage in Concrete" Materials 14, no. 14: 3830. https://doi.org/10.3390/ma14143830
Note that from the first issue of 2016, this journal uses article numbers instead of page numbers. See further details here.