Aging and Curing Temperature Effects on Compressive Strength of Mortar Containing Lime Stone Quarry Dust and Industrial Granite Sludge

 , ,
, ,
Abstract
:1. Introduction
2. Materials and Methods
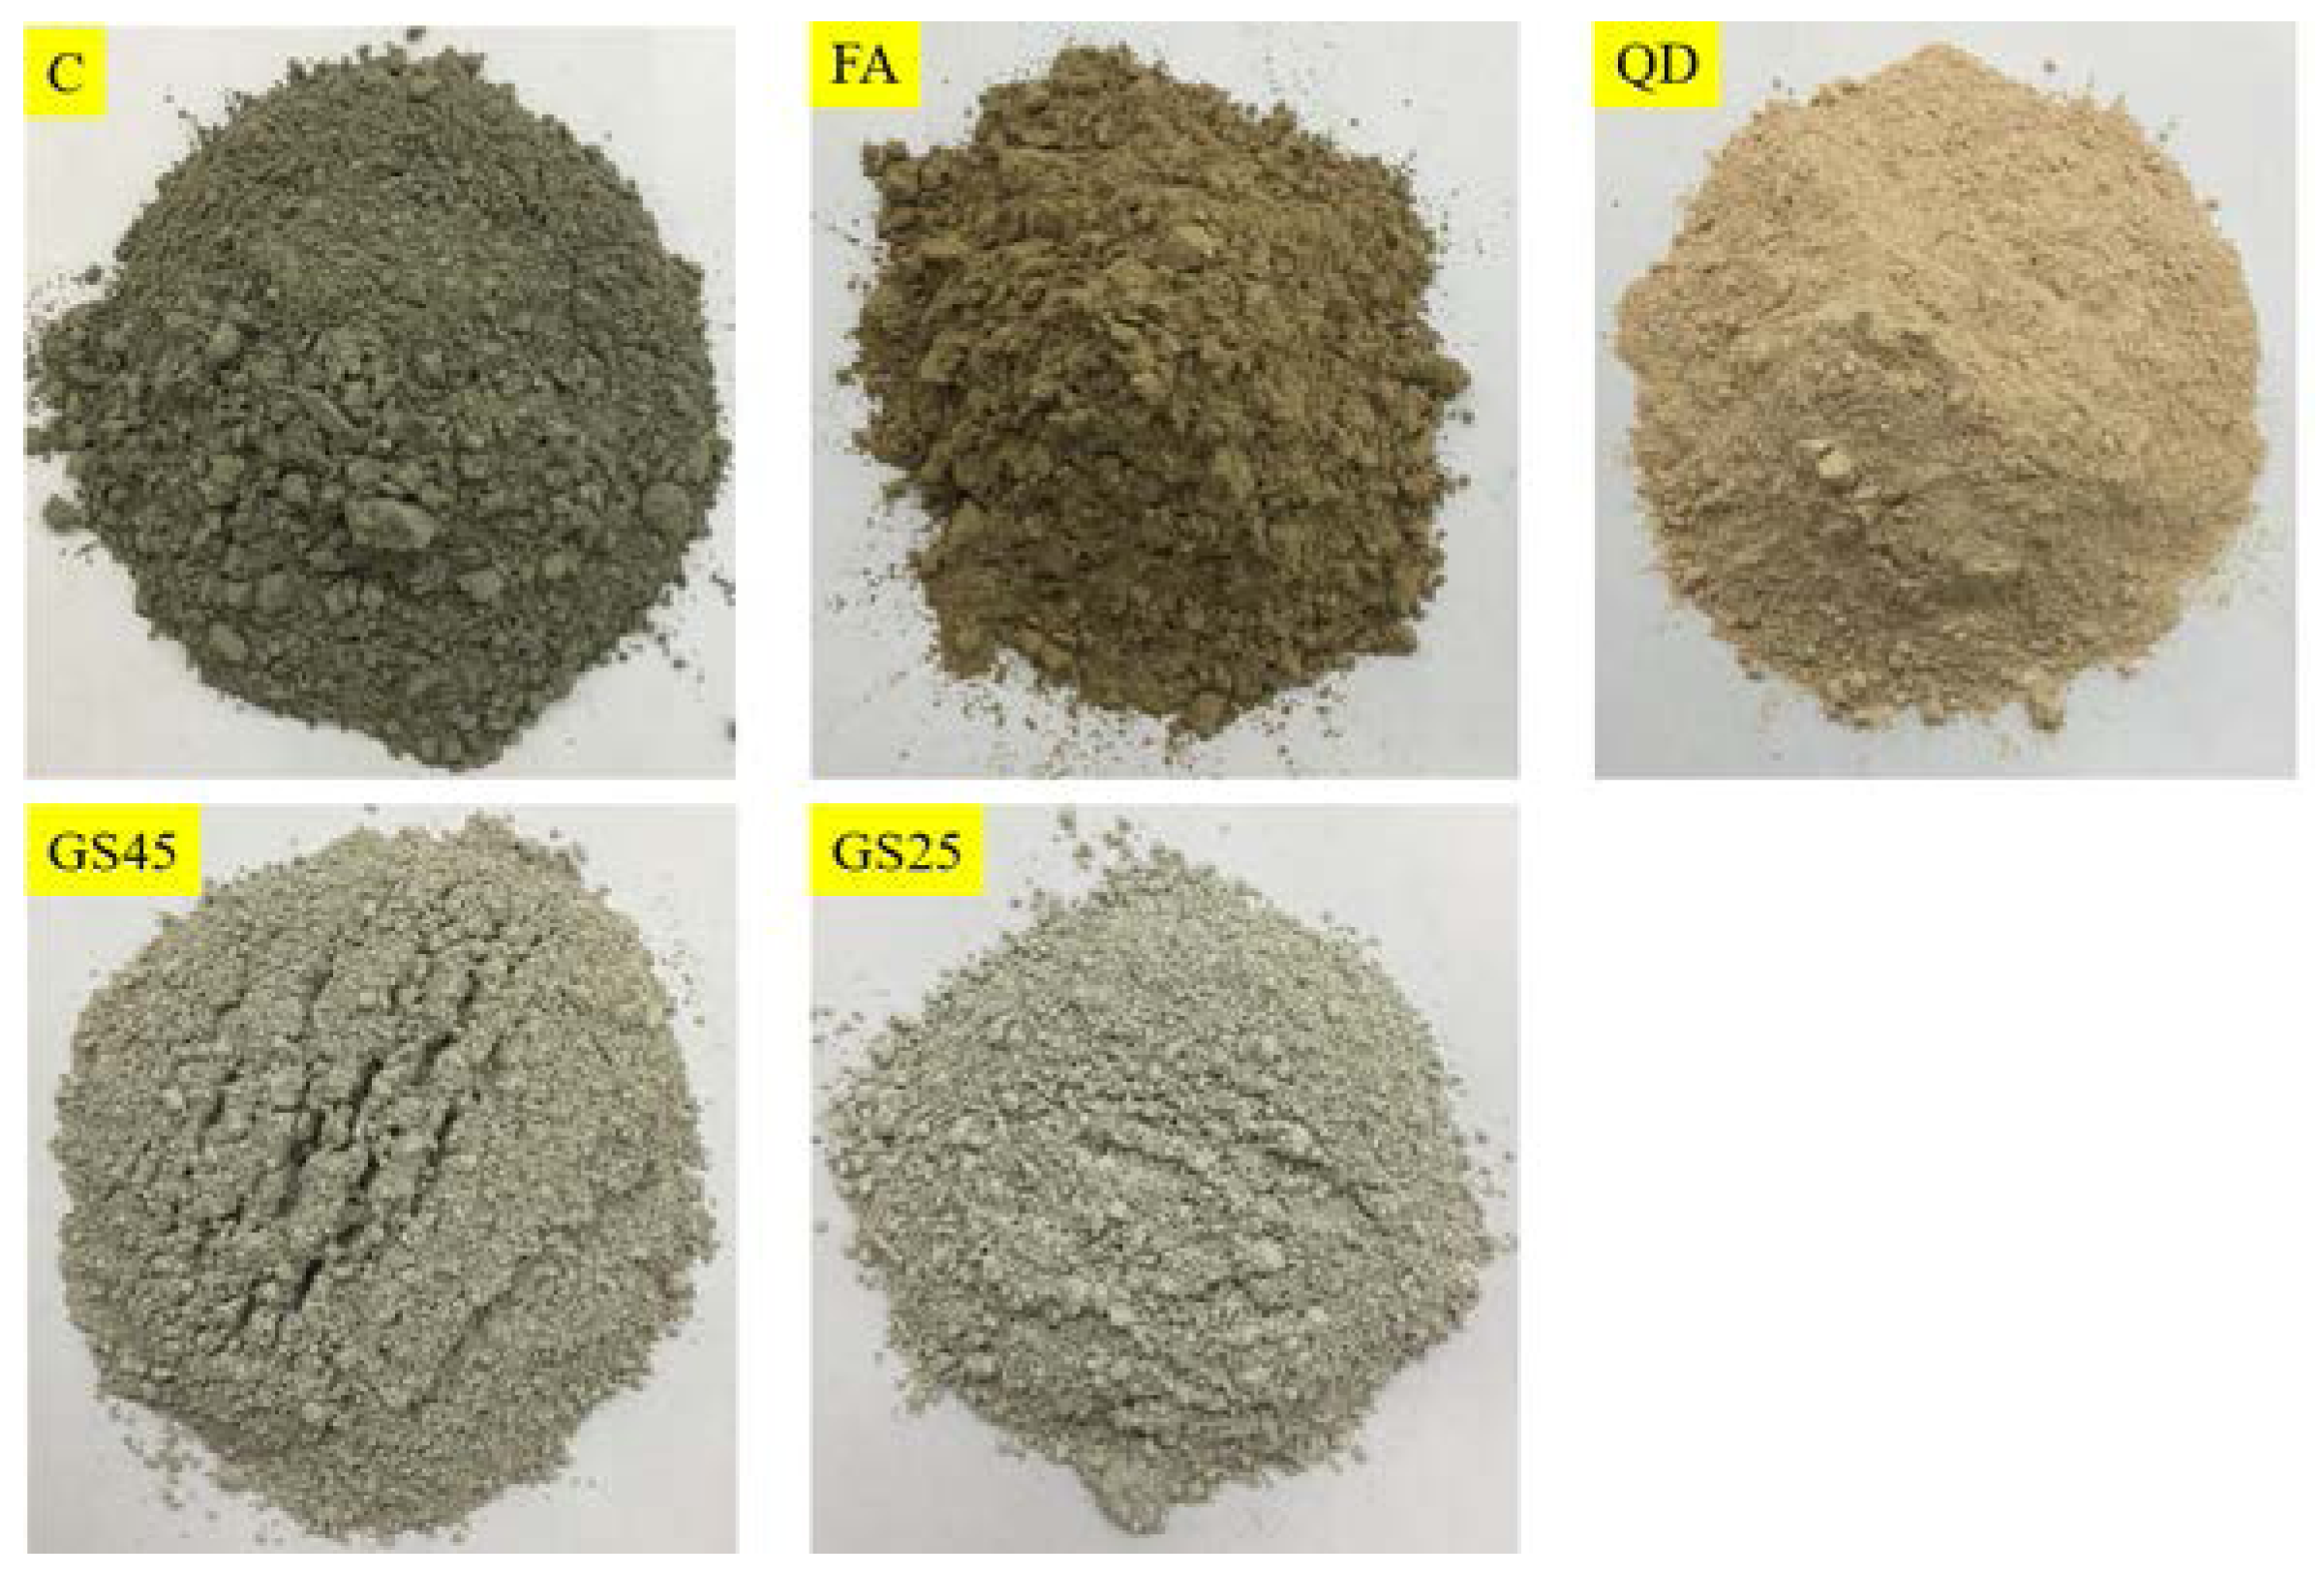
2.1. Materials
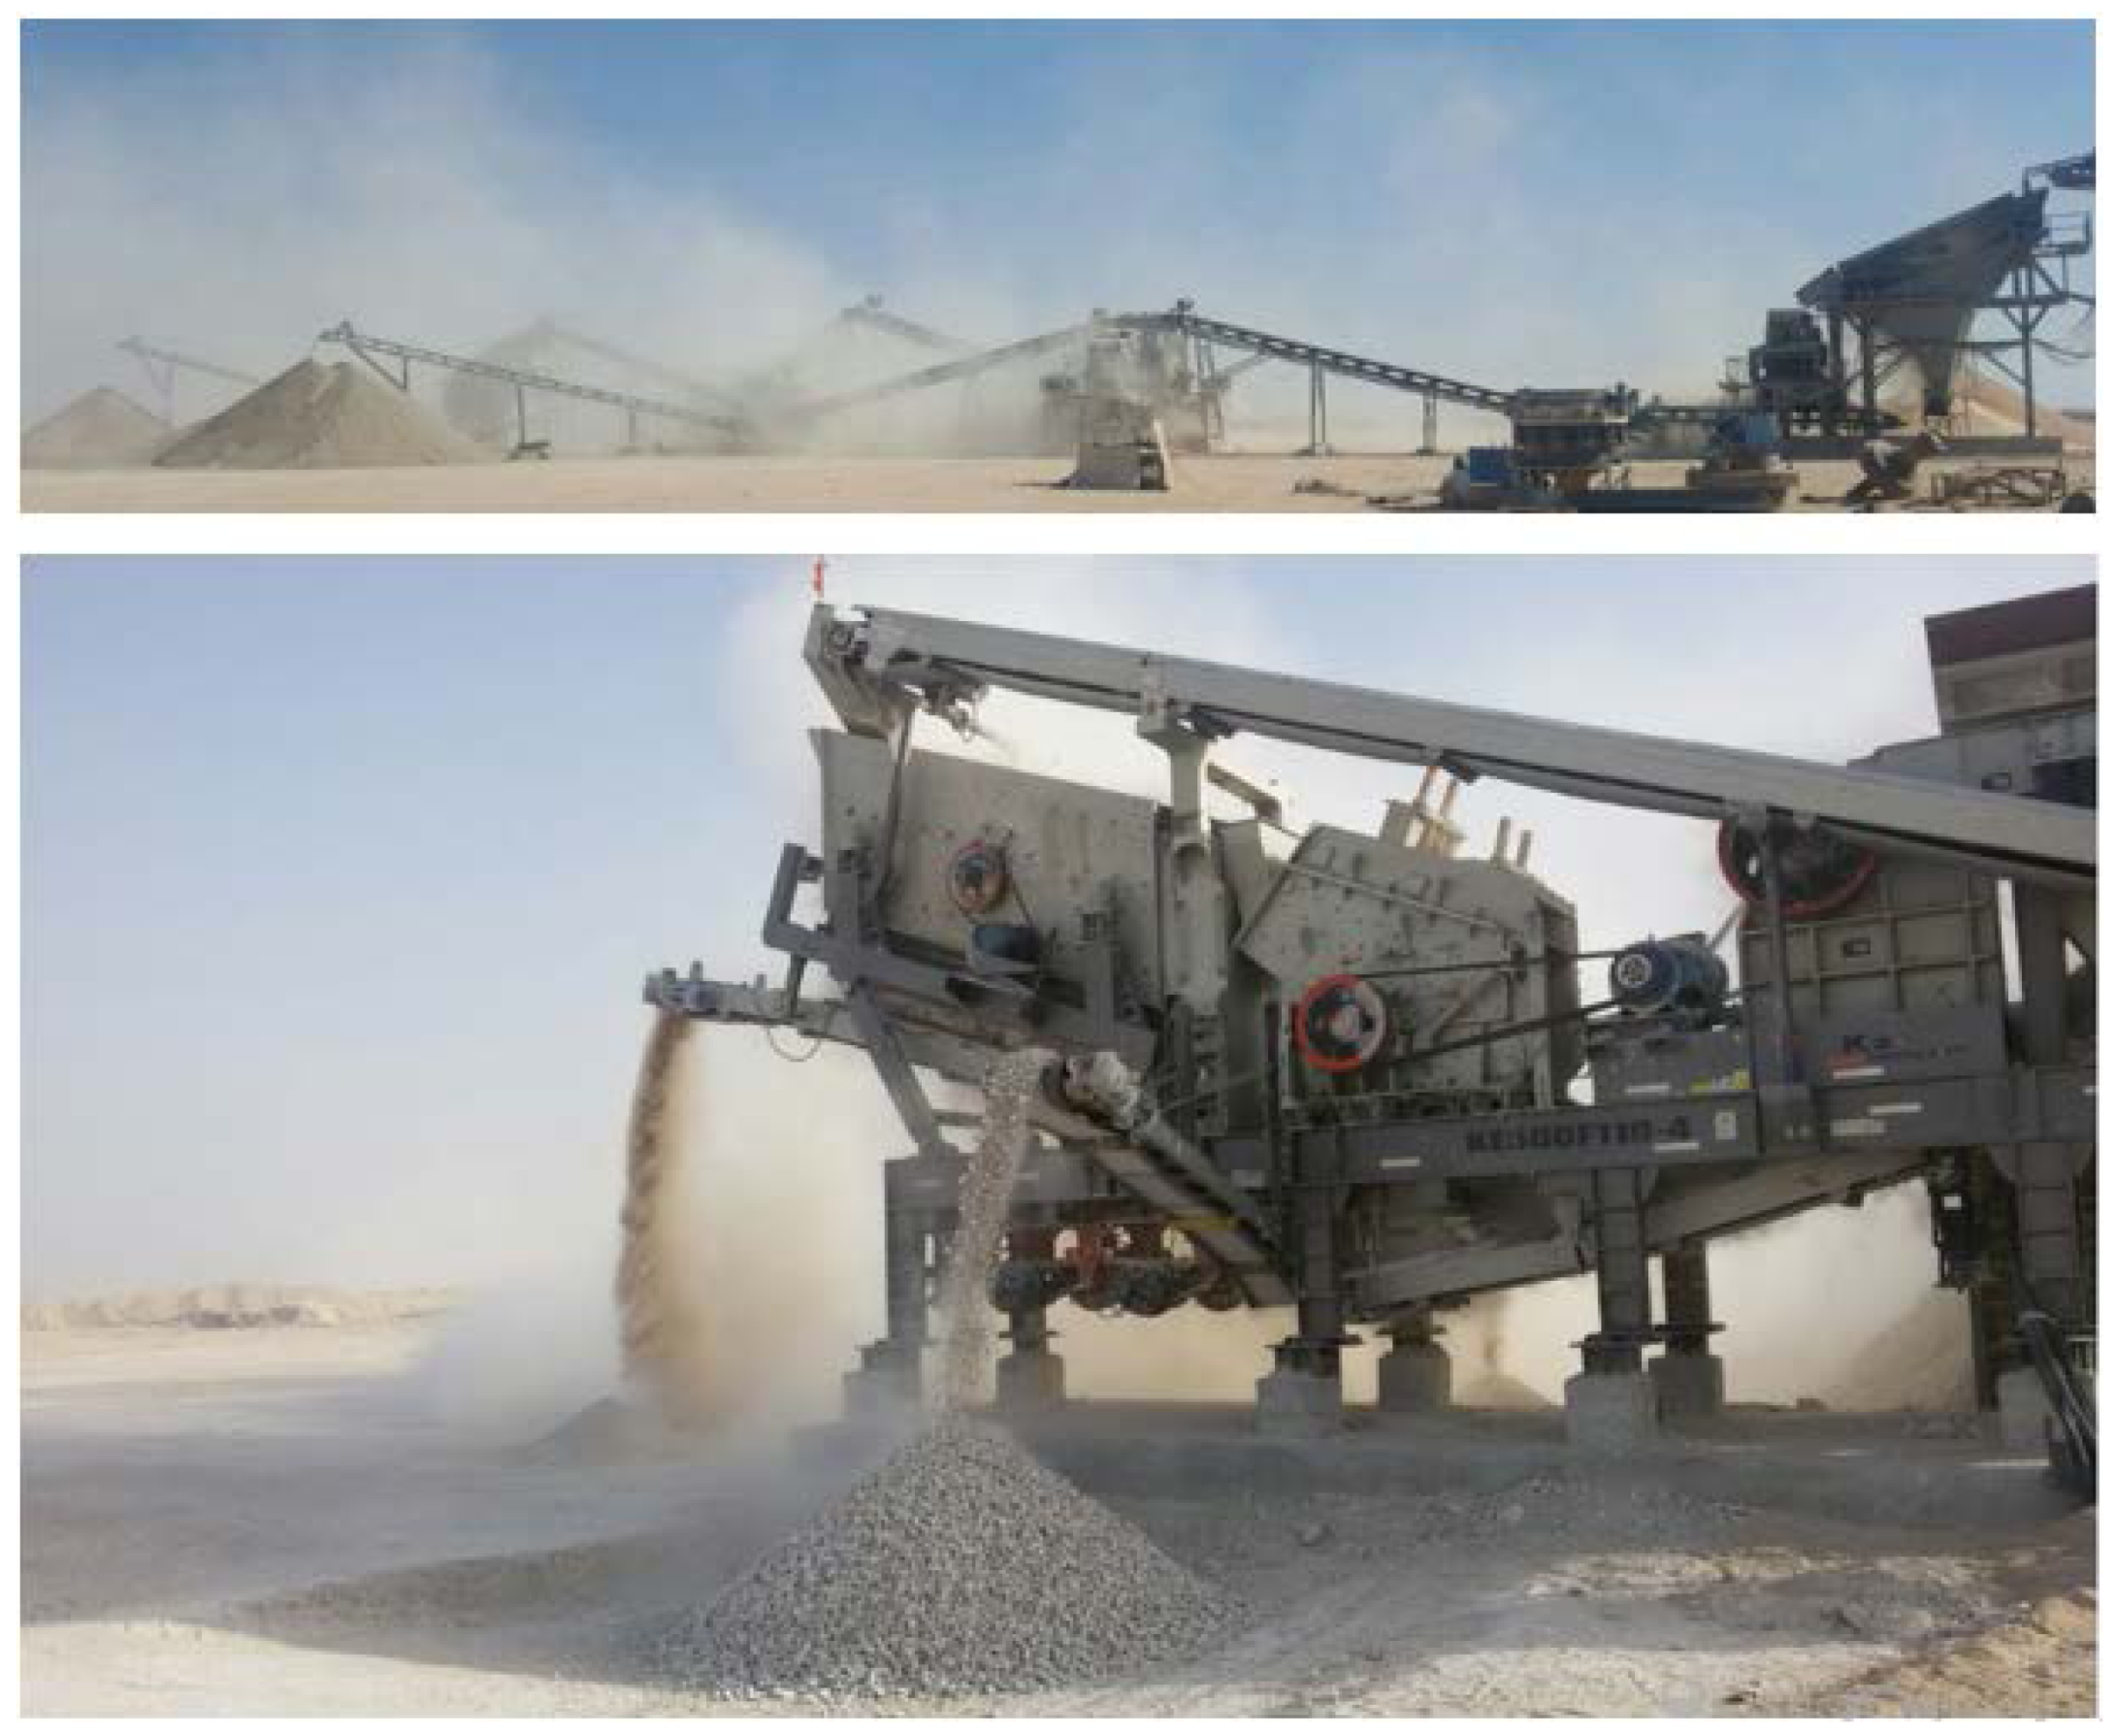
2.1.1. Quarry Dust
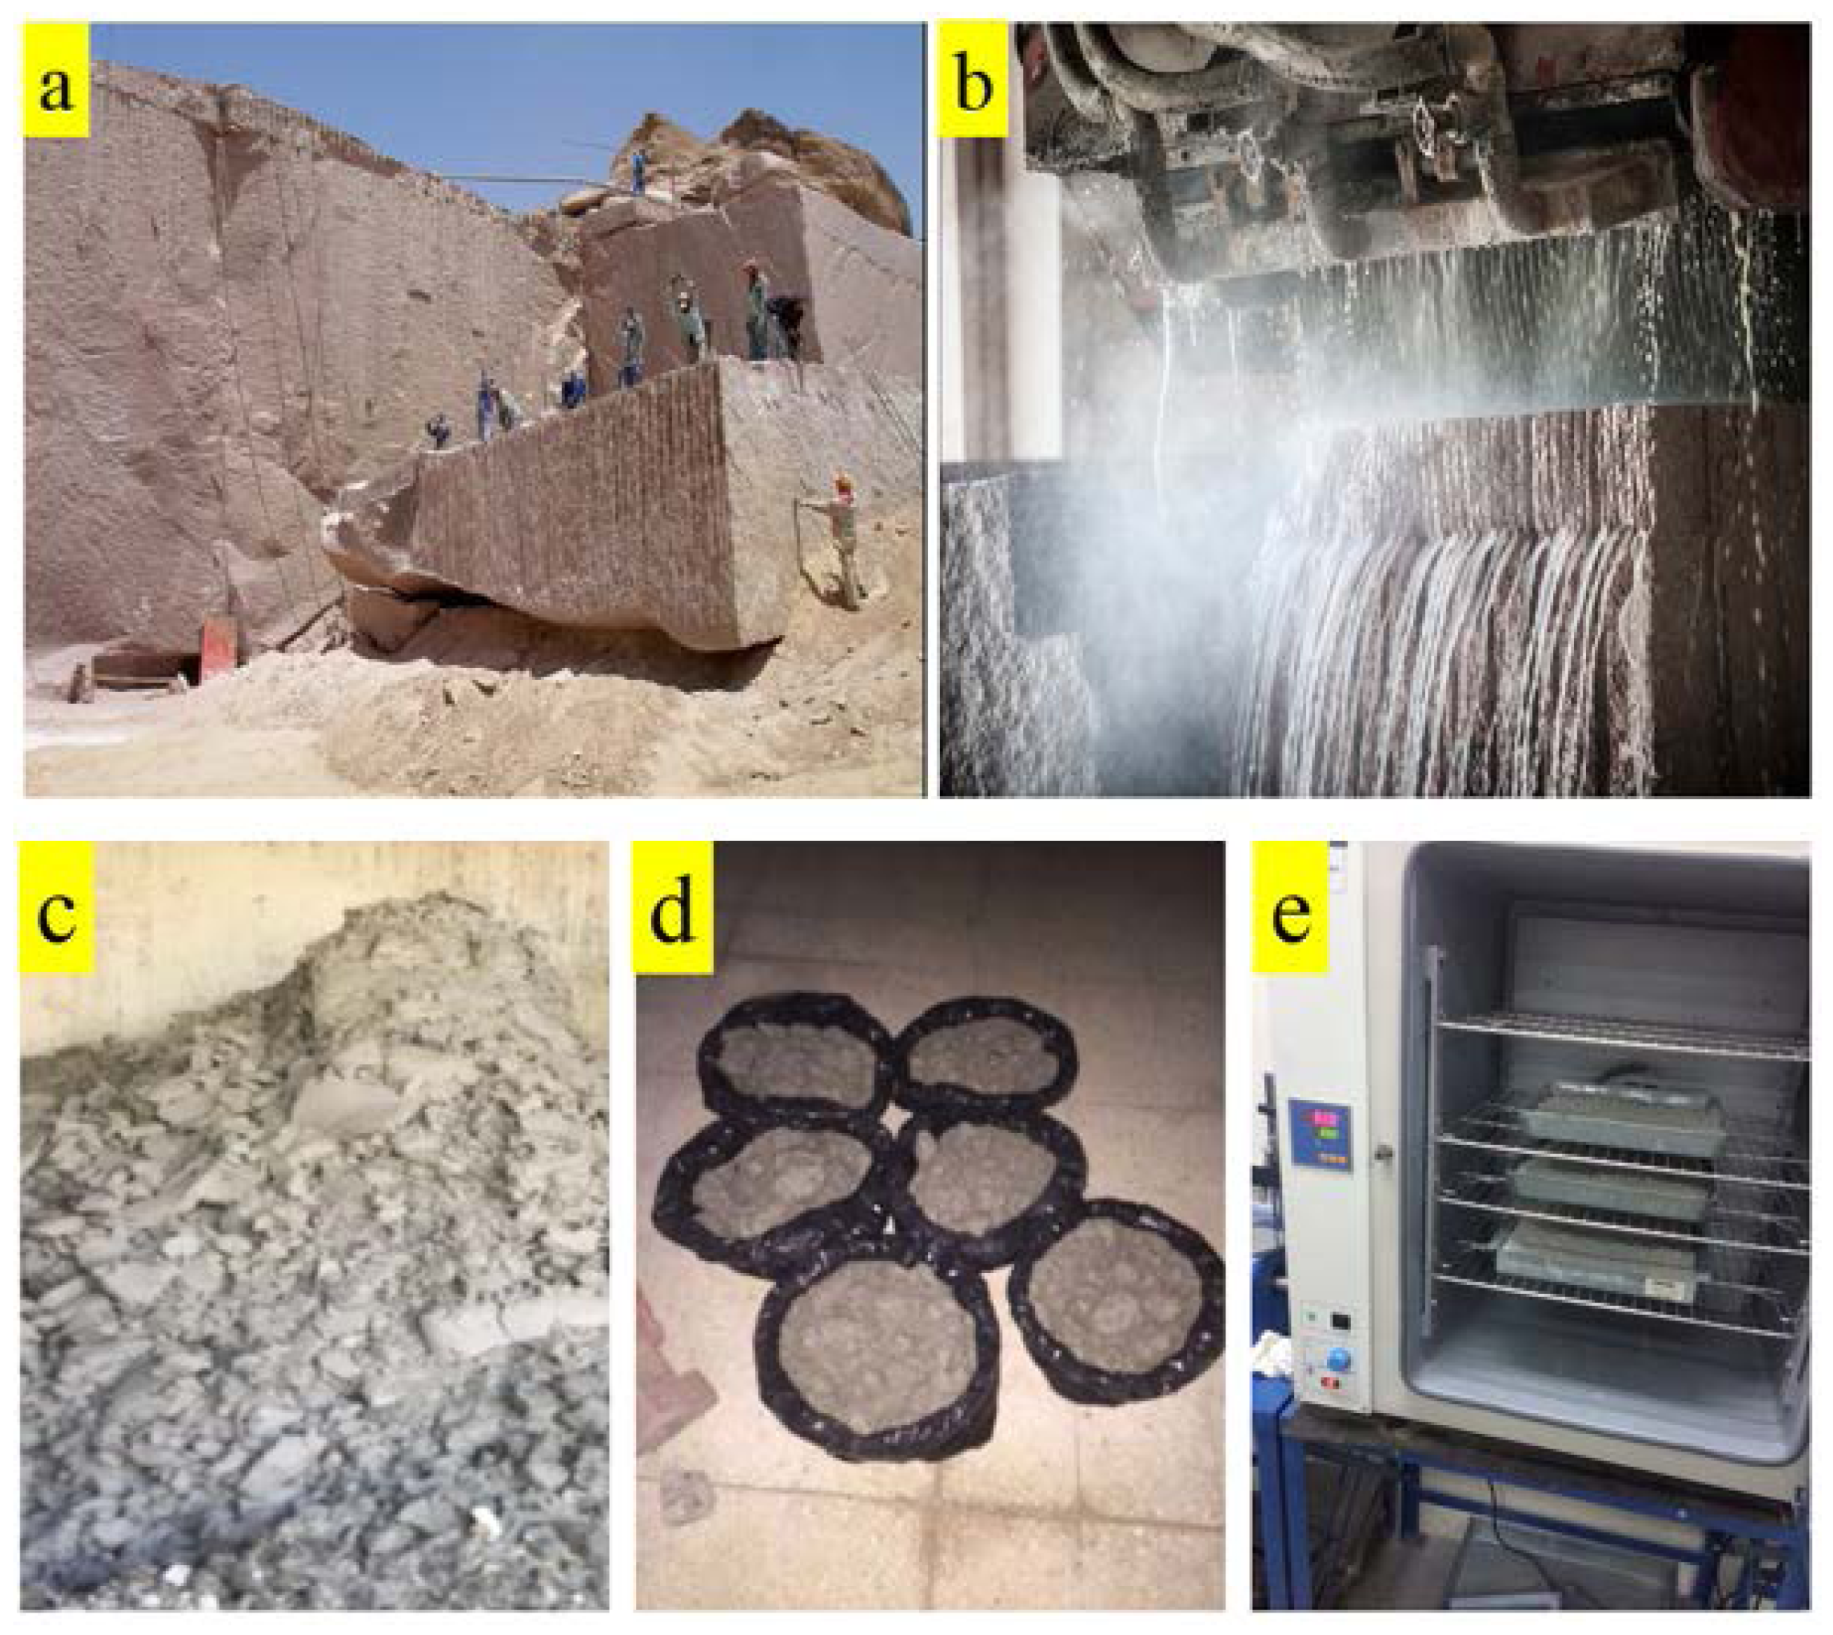
2.1.2. Granite Sludge
2.1.3. Fly Ash
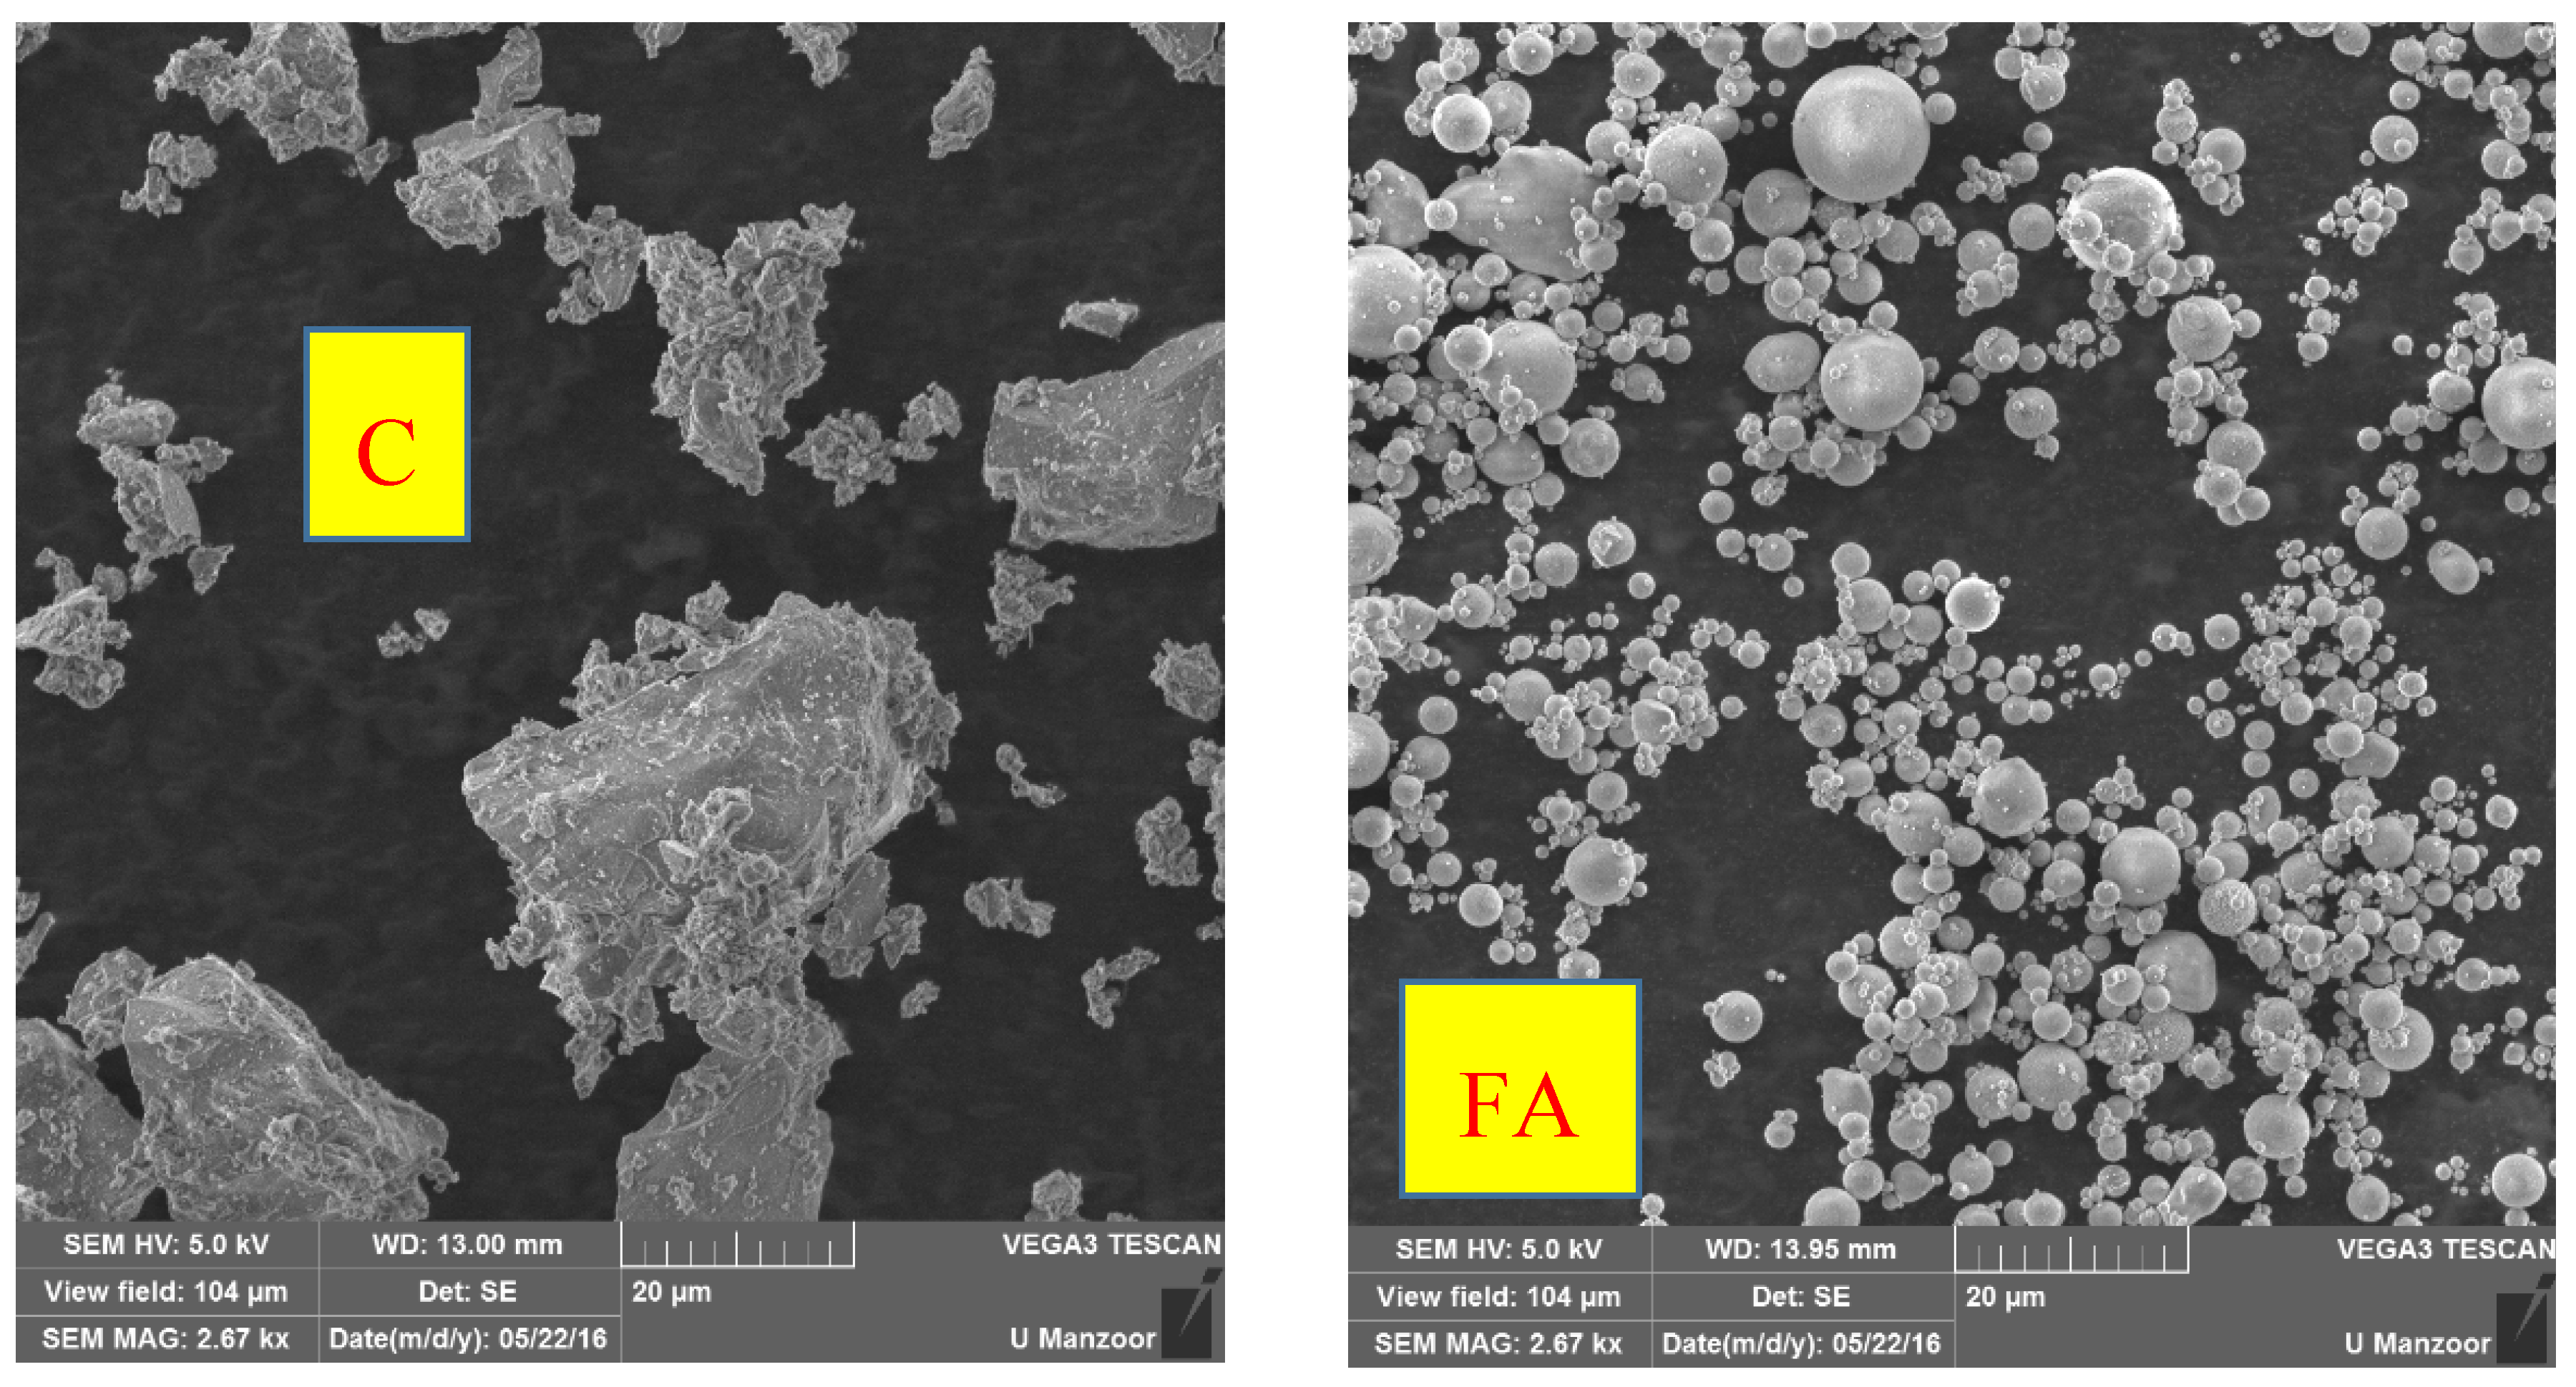
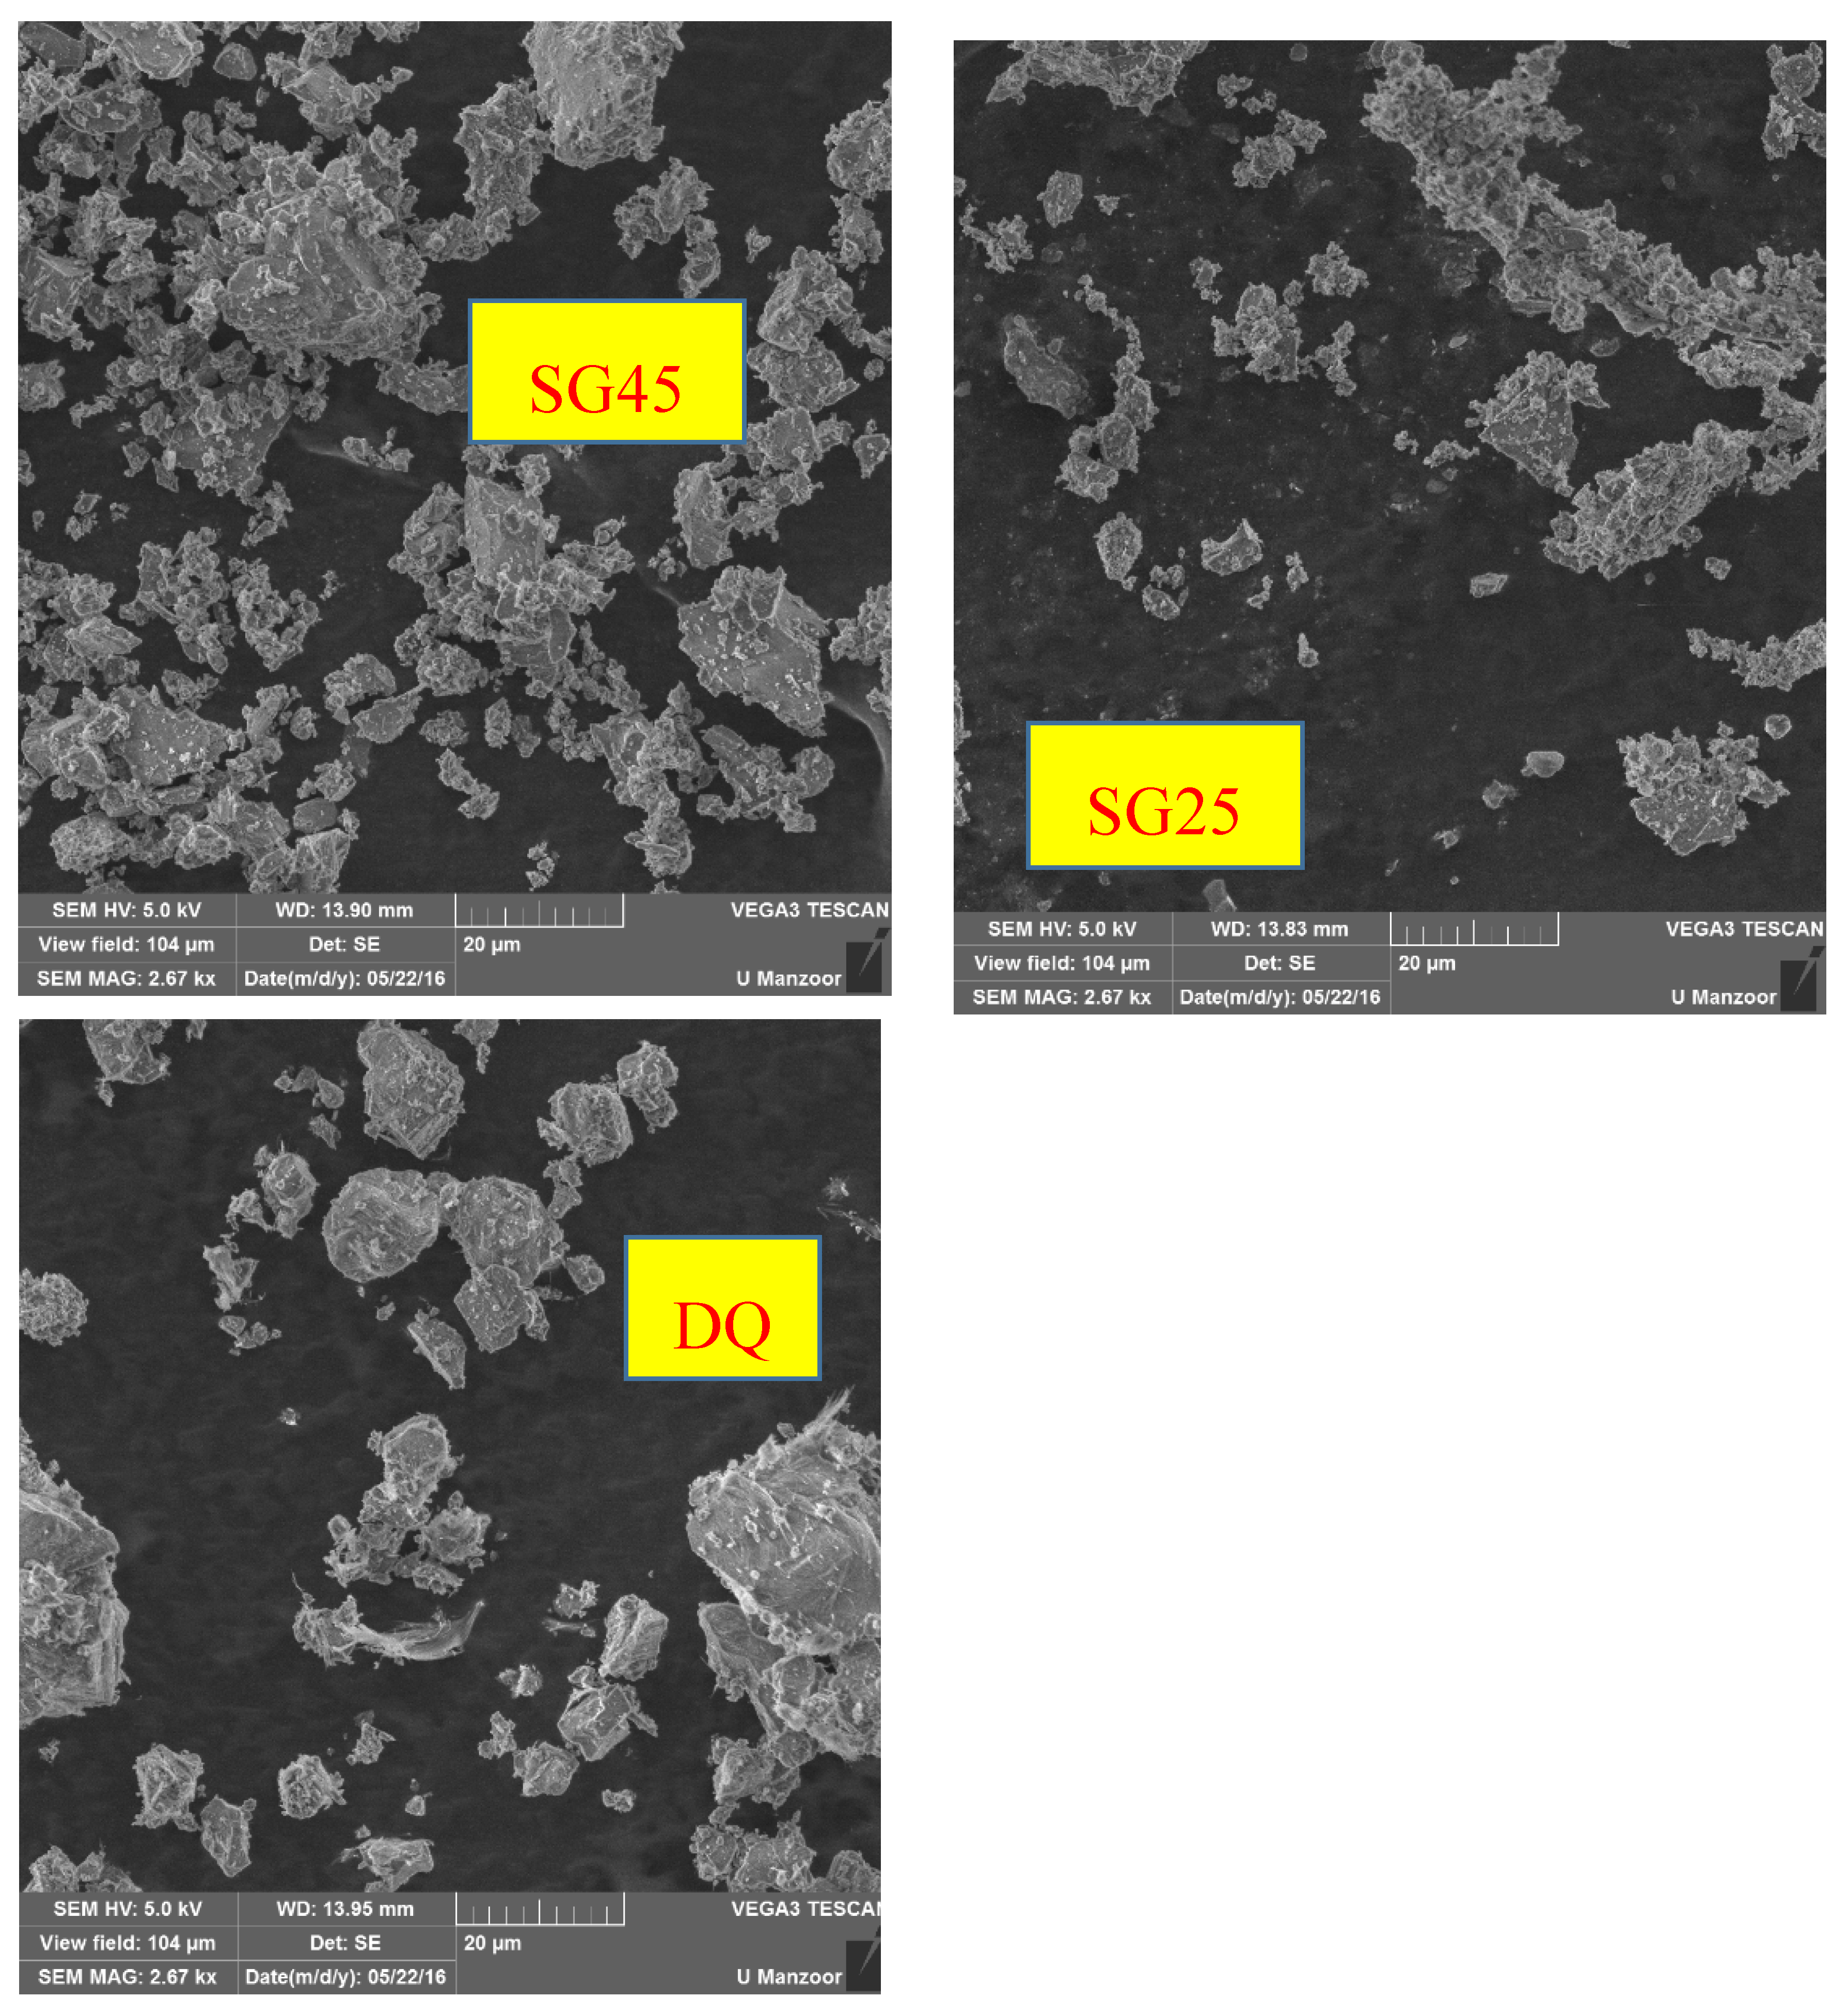
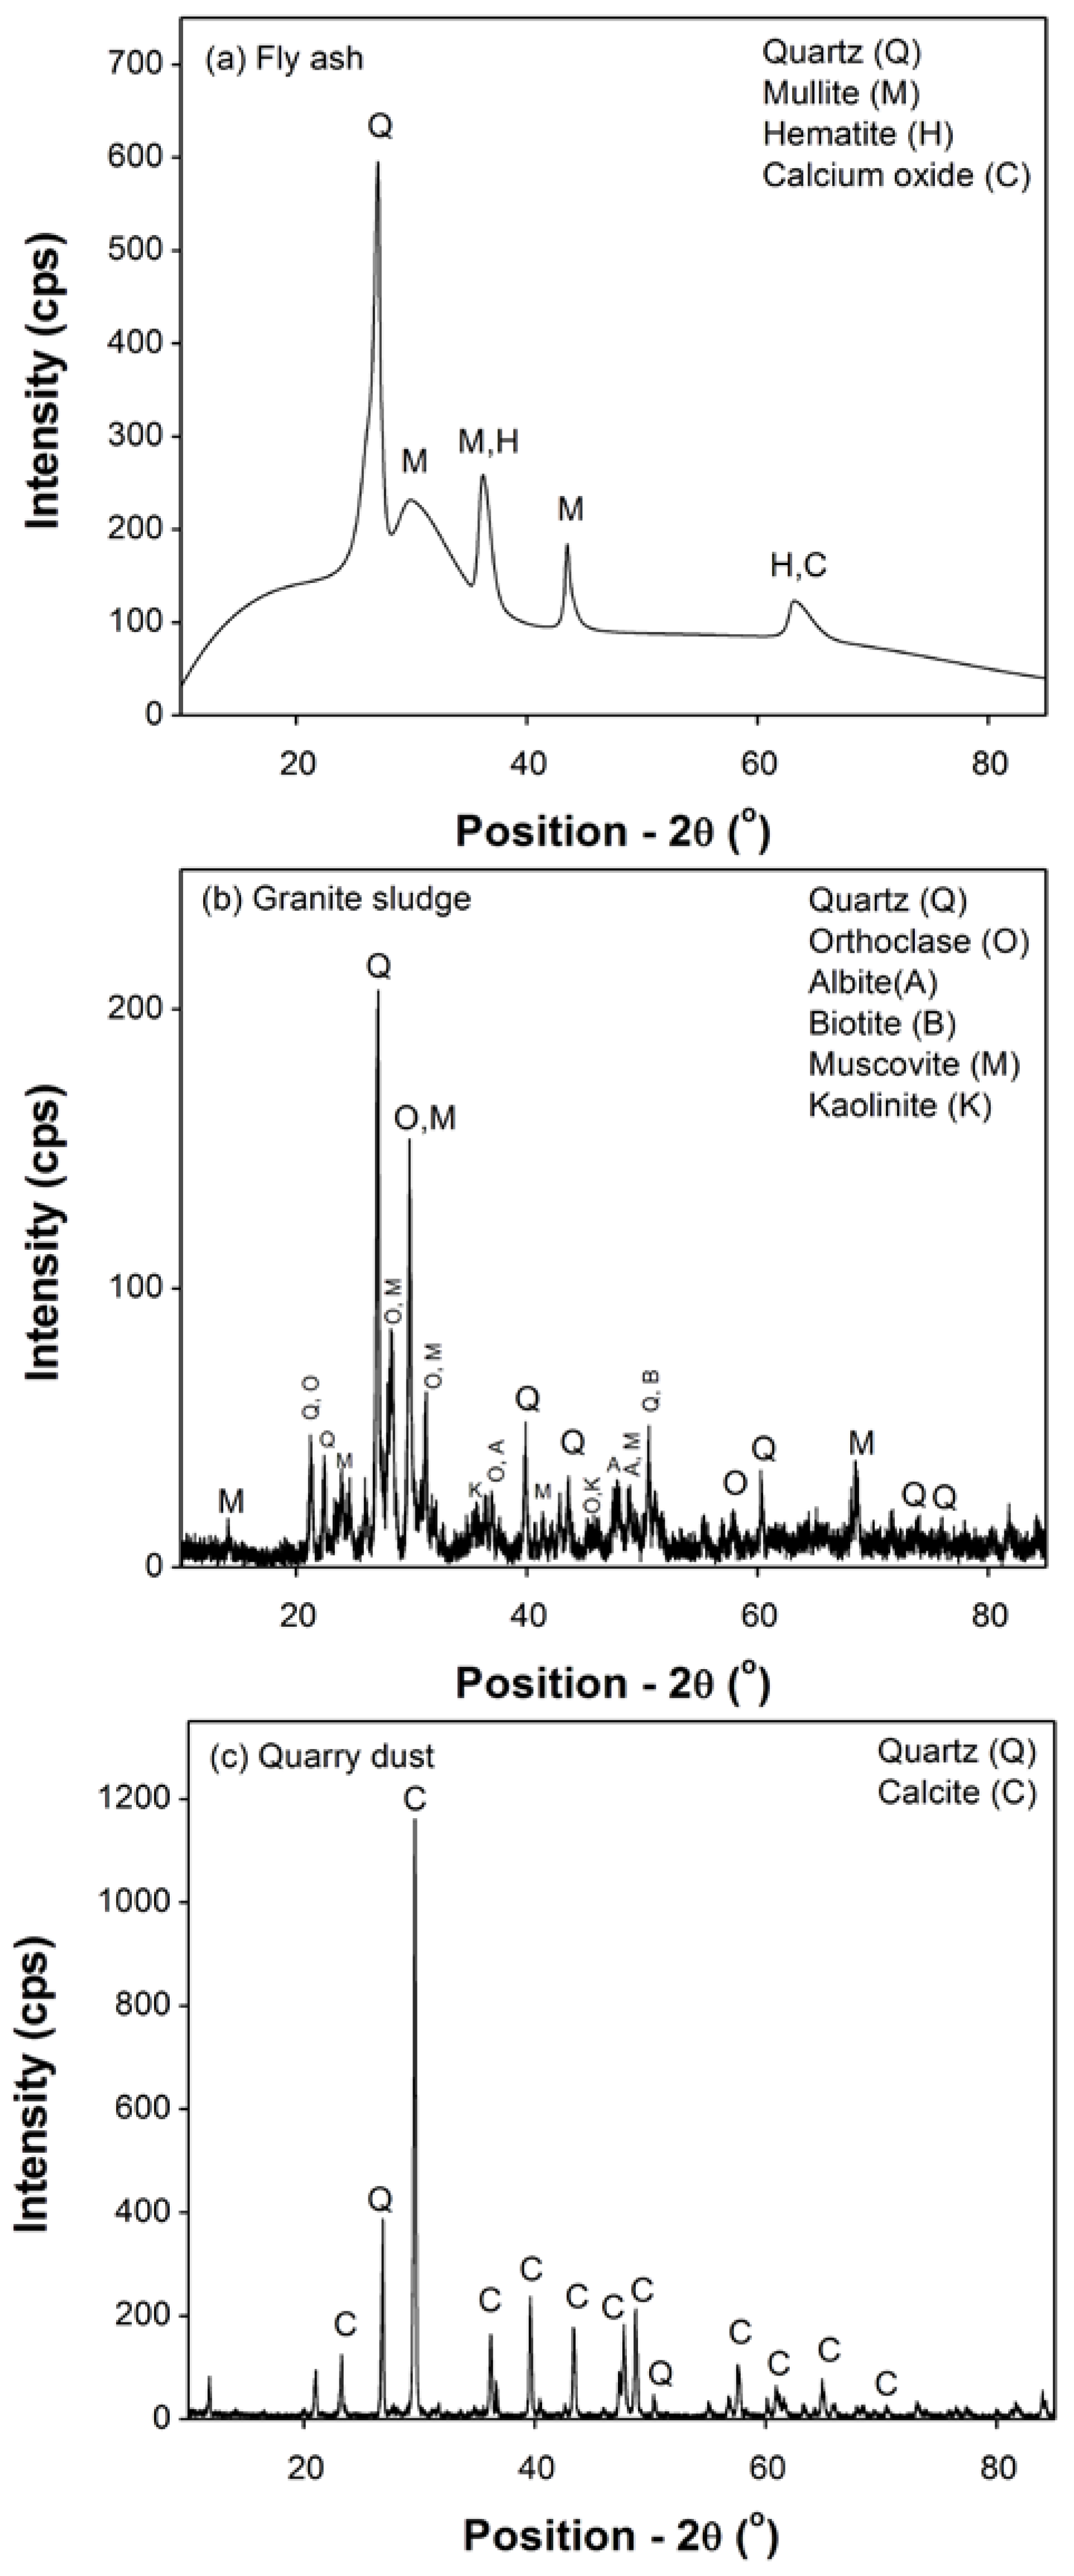
2.2. Particle Size Analyses, Scanning Electron Microscopy and X-ray Diffraction of Materials
2.3. Mix Proportions and Test Methods
2.3.1. Mix Proportions
2.3.2. Mortar Mixing
2.3.3. Casting and Specimen Preparation
2.3.4. Testing
3. Results and Discussions
3.1. Characteristics of GS and QD
3.2. Compressive Strength
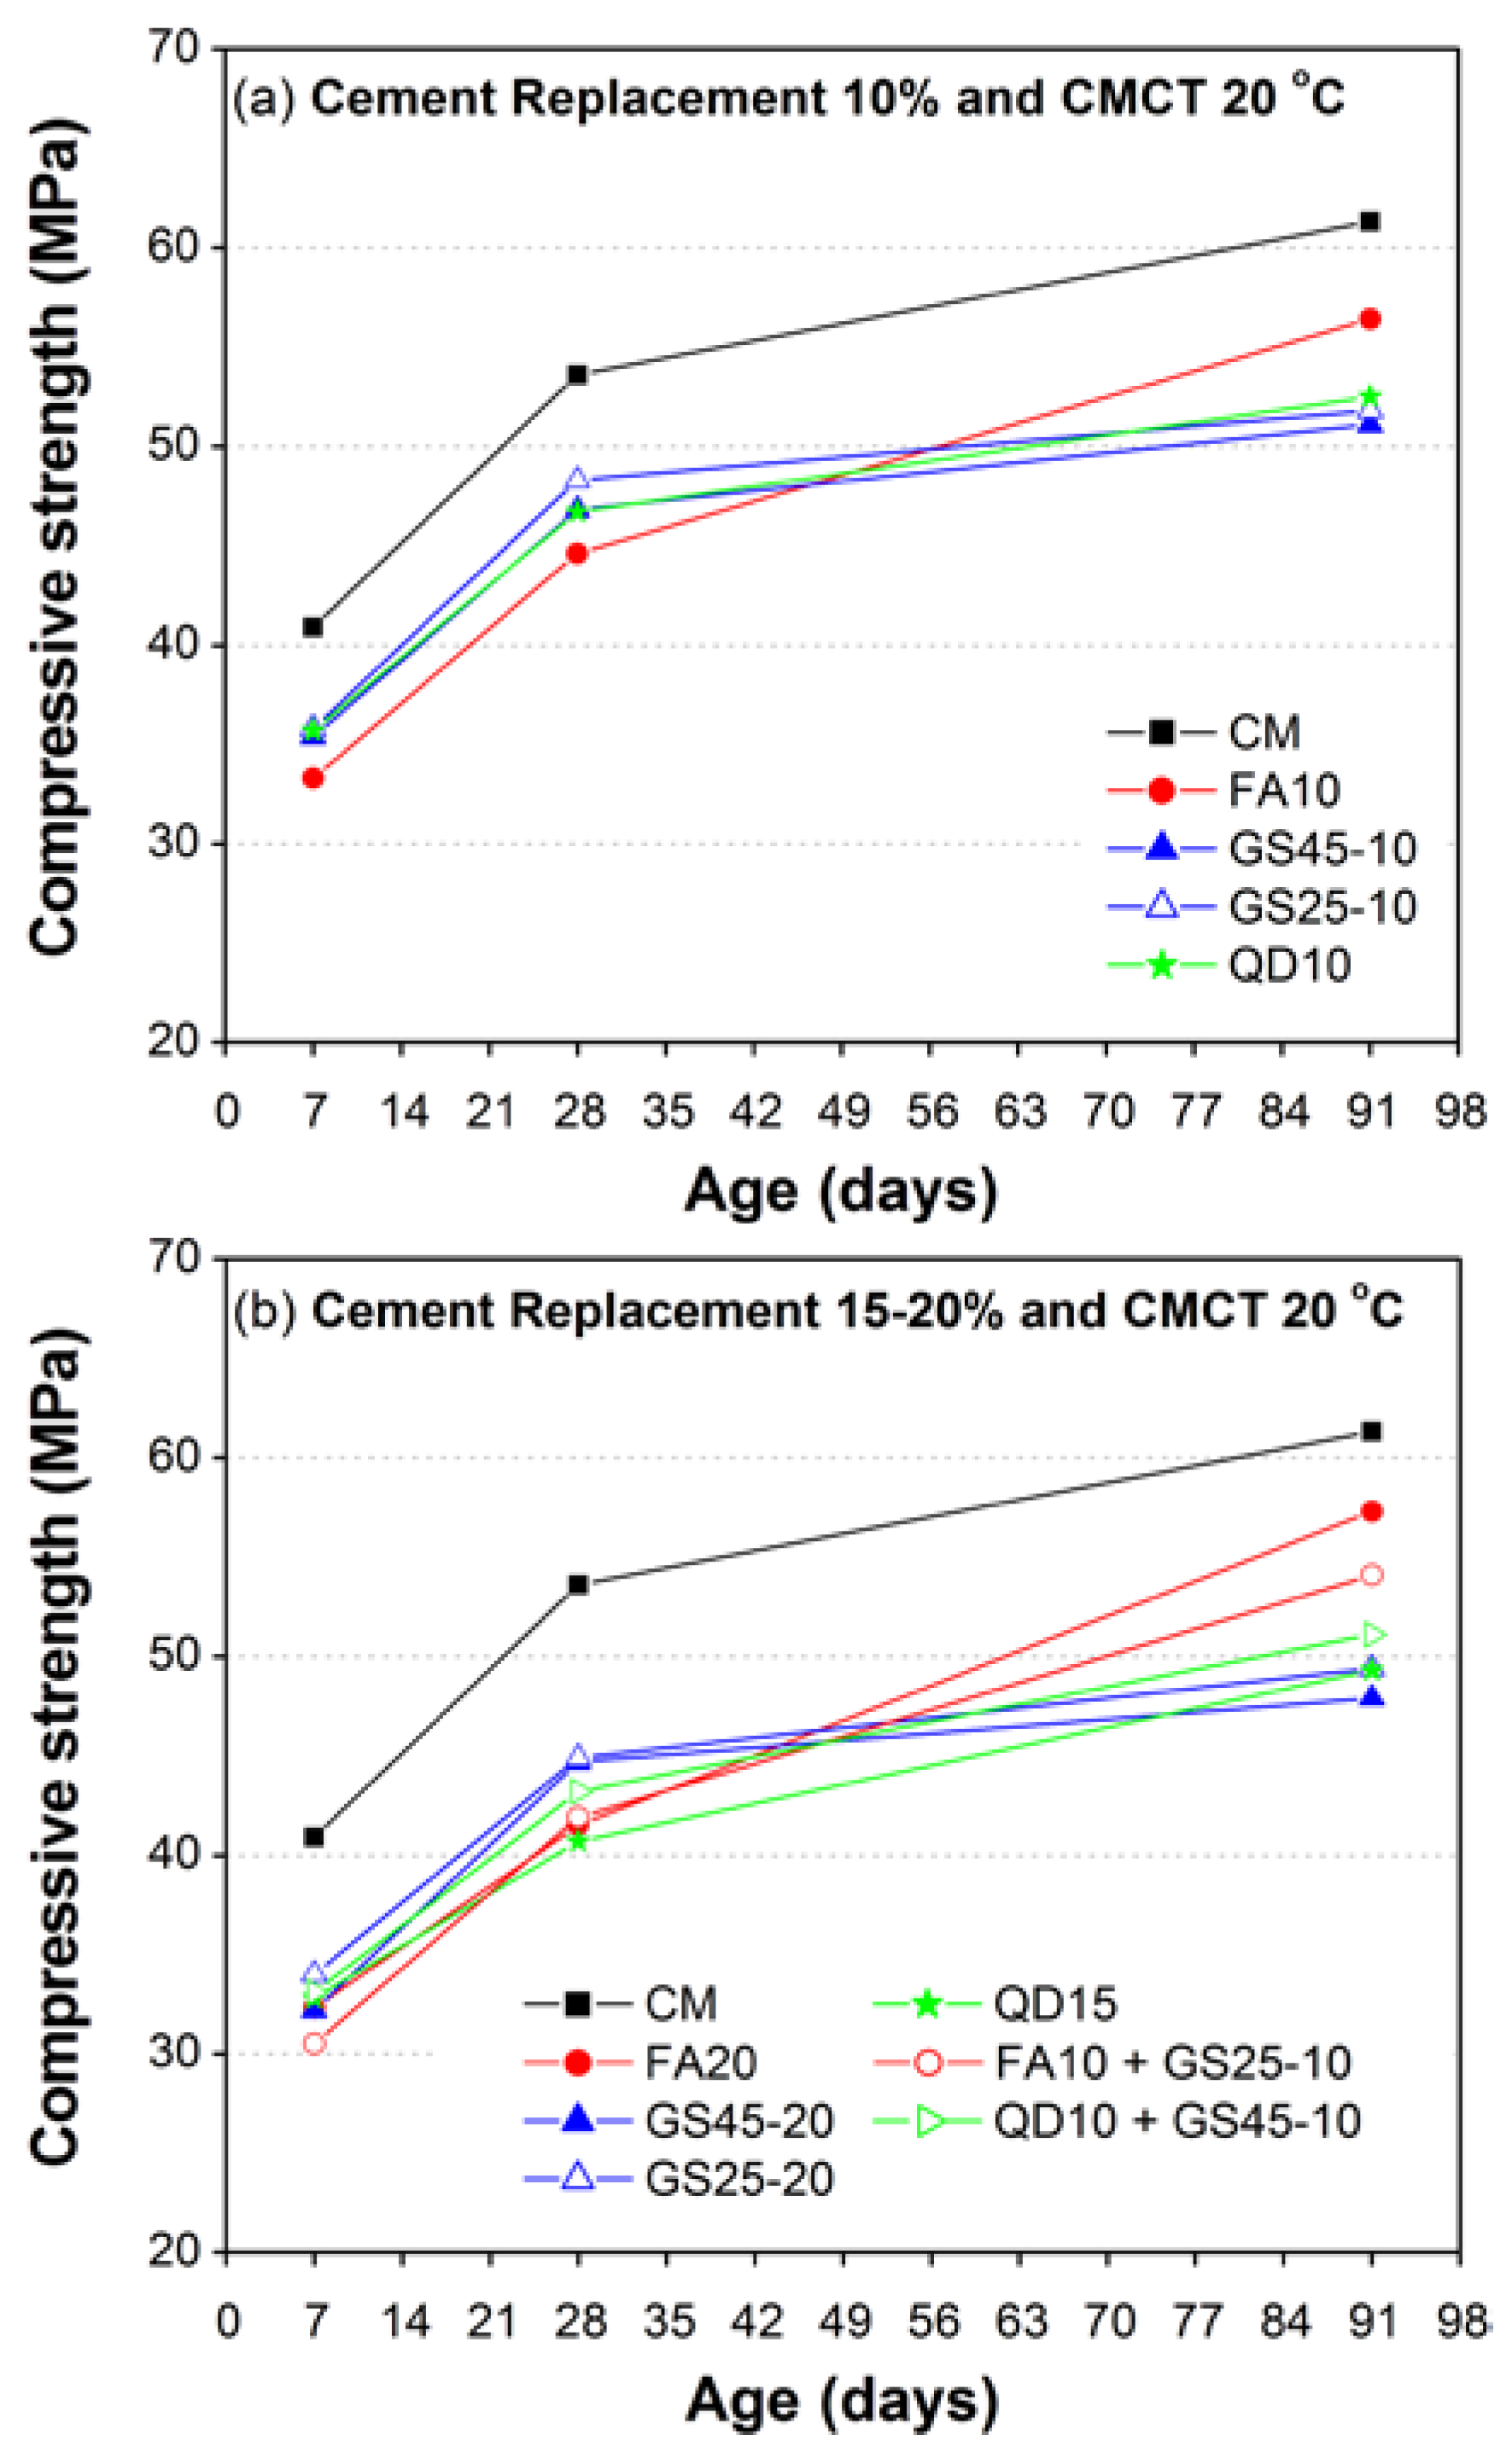
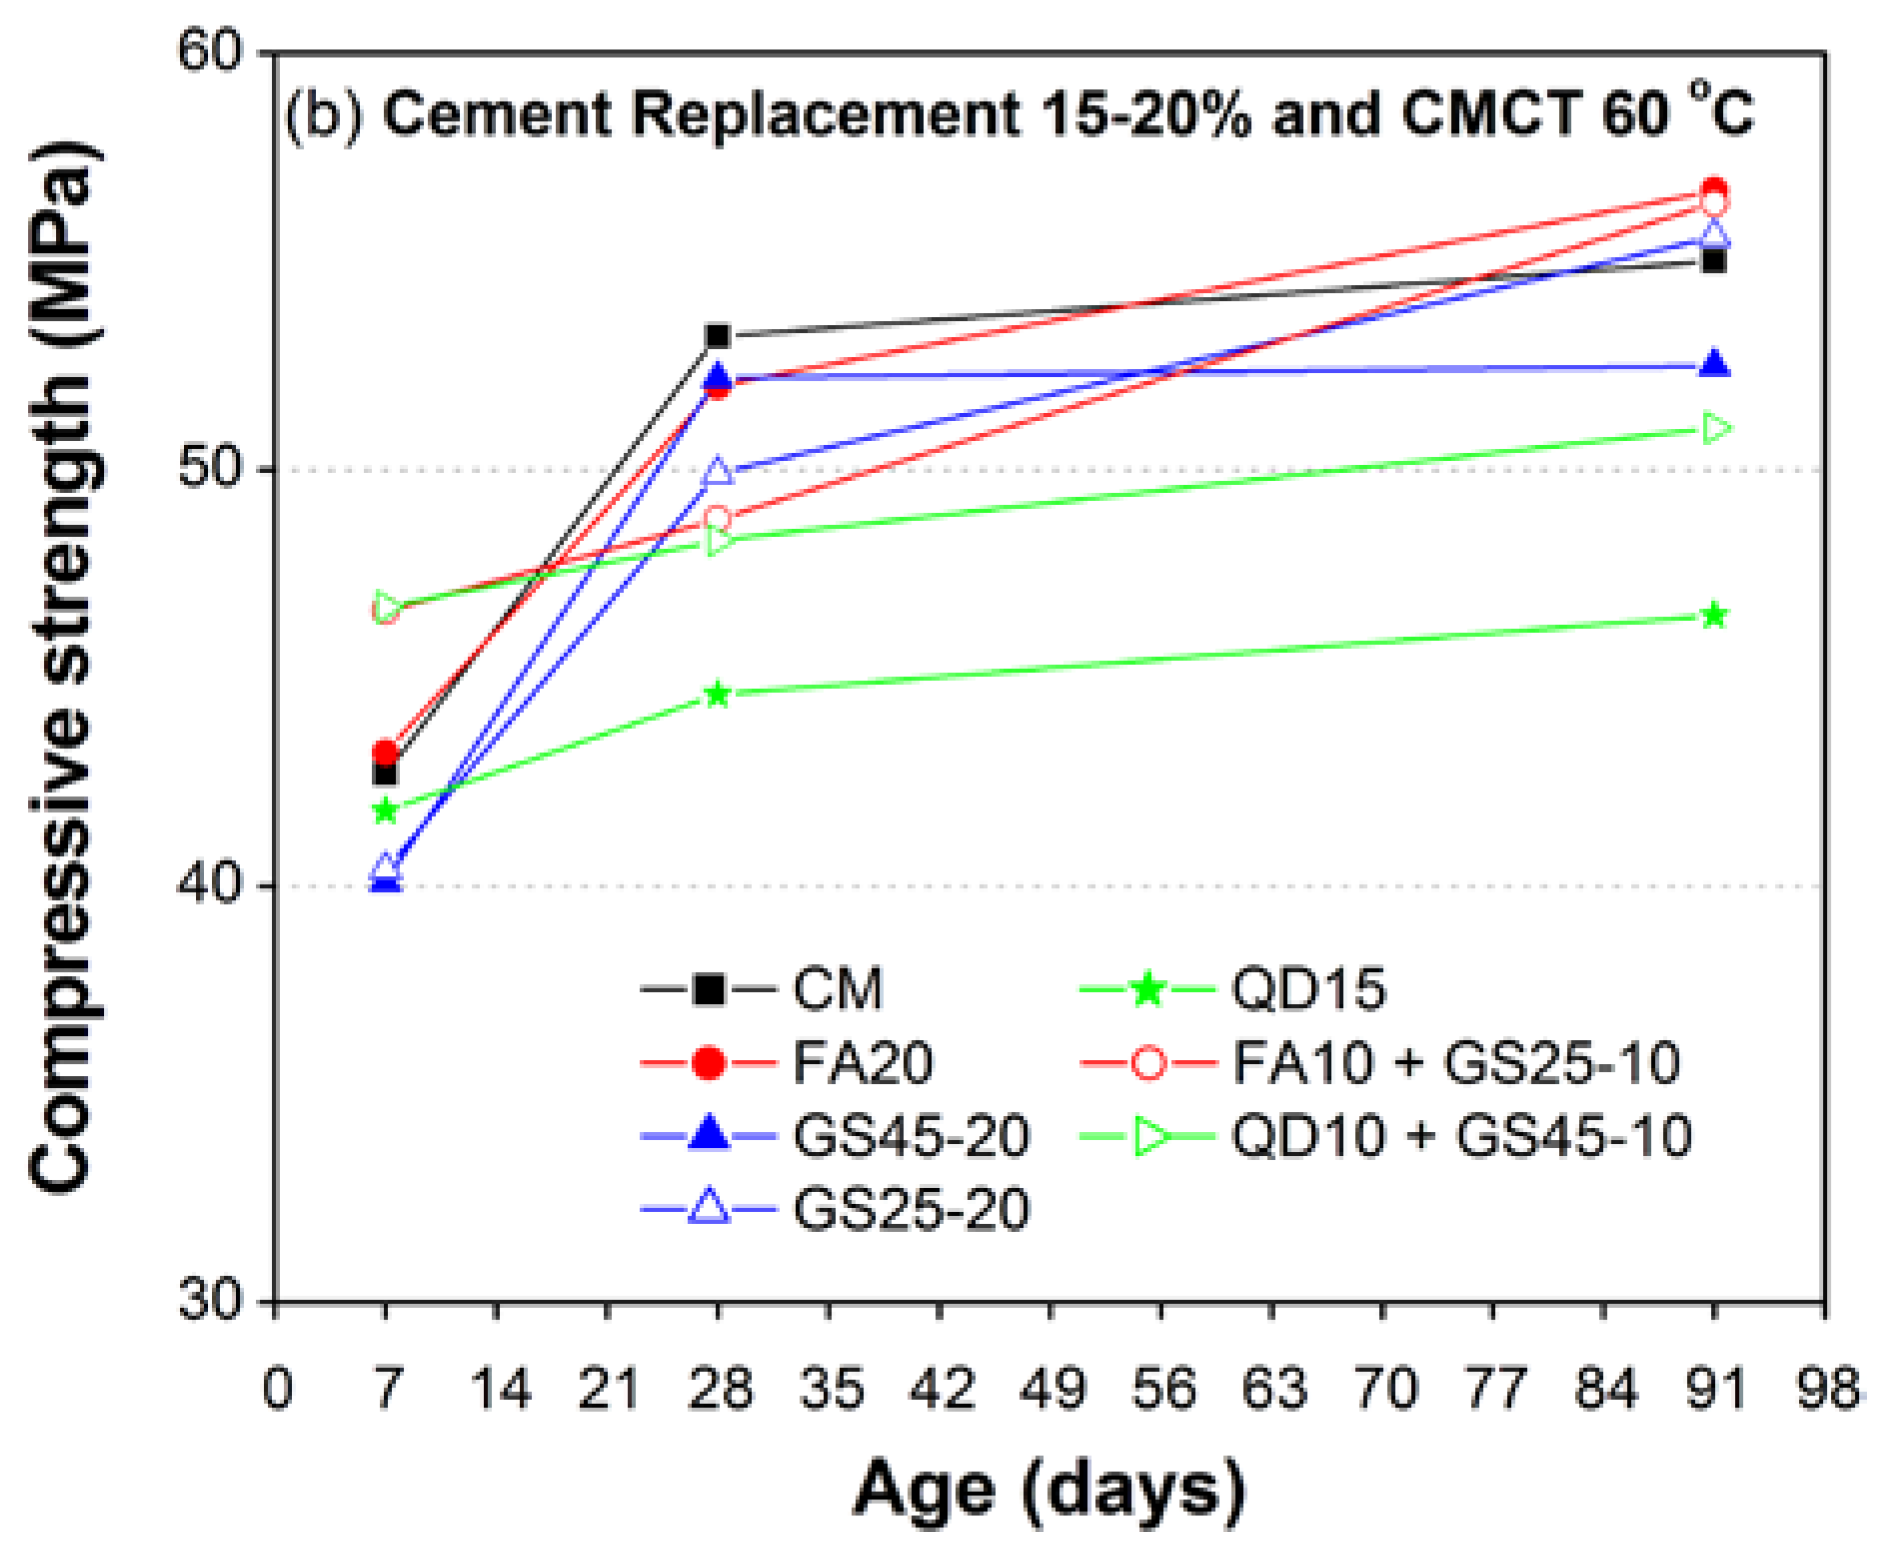
3.2.1. Effect of Percentage Replacement of Cement with GS, QD and FA
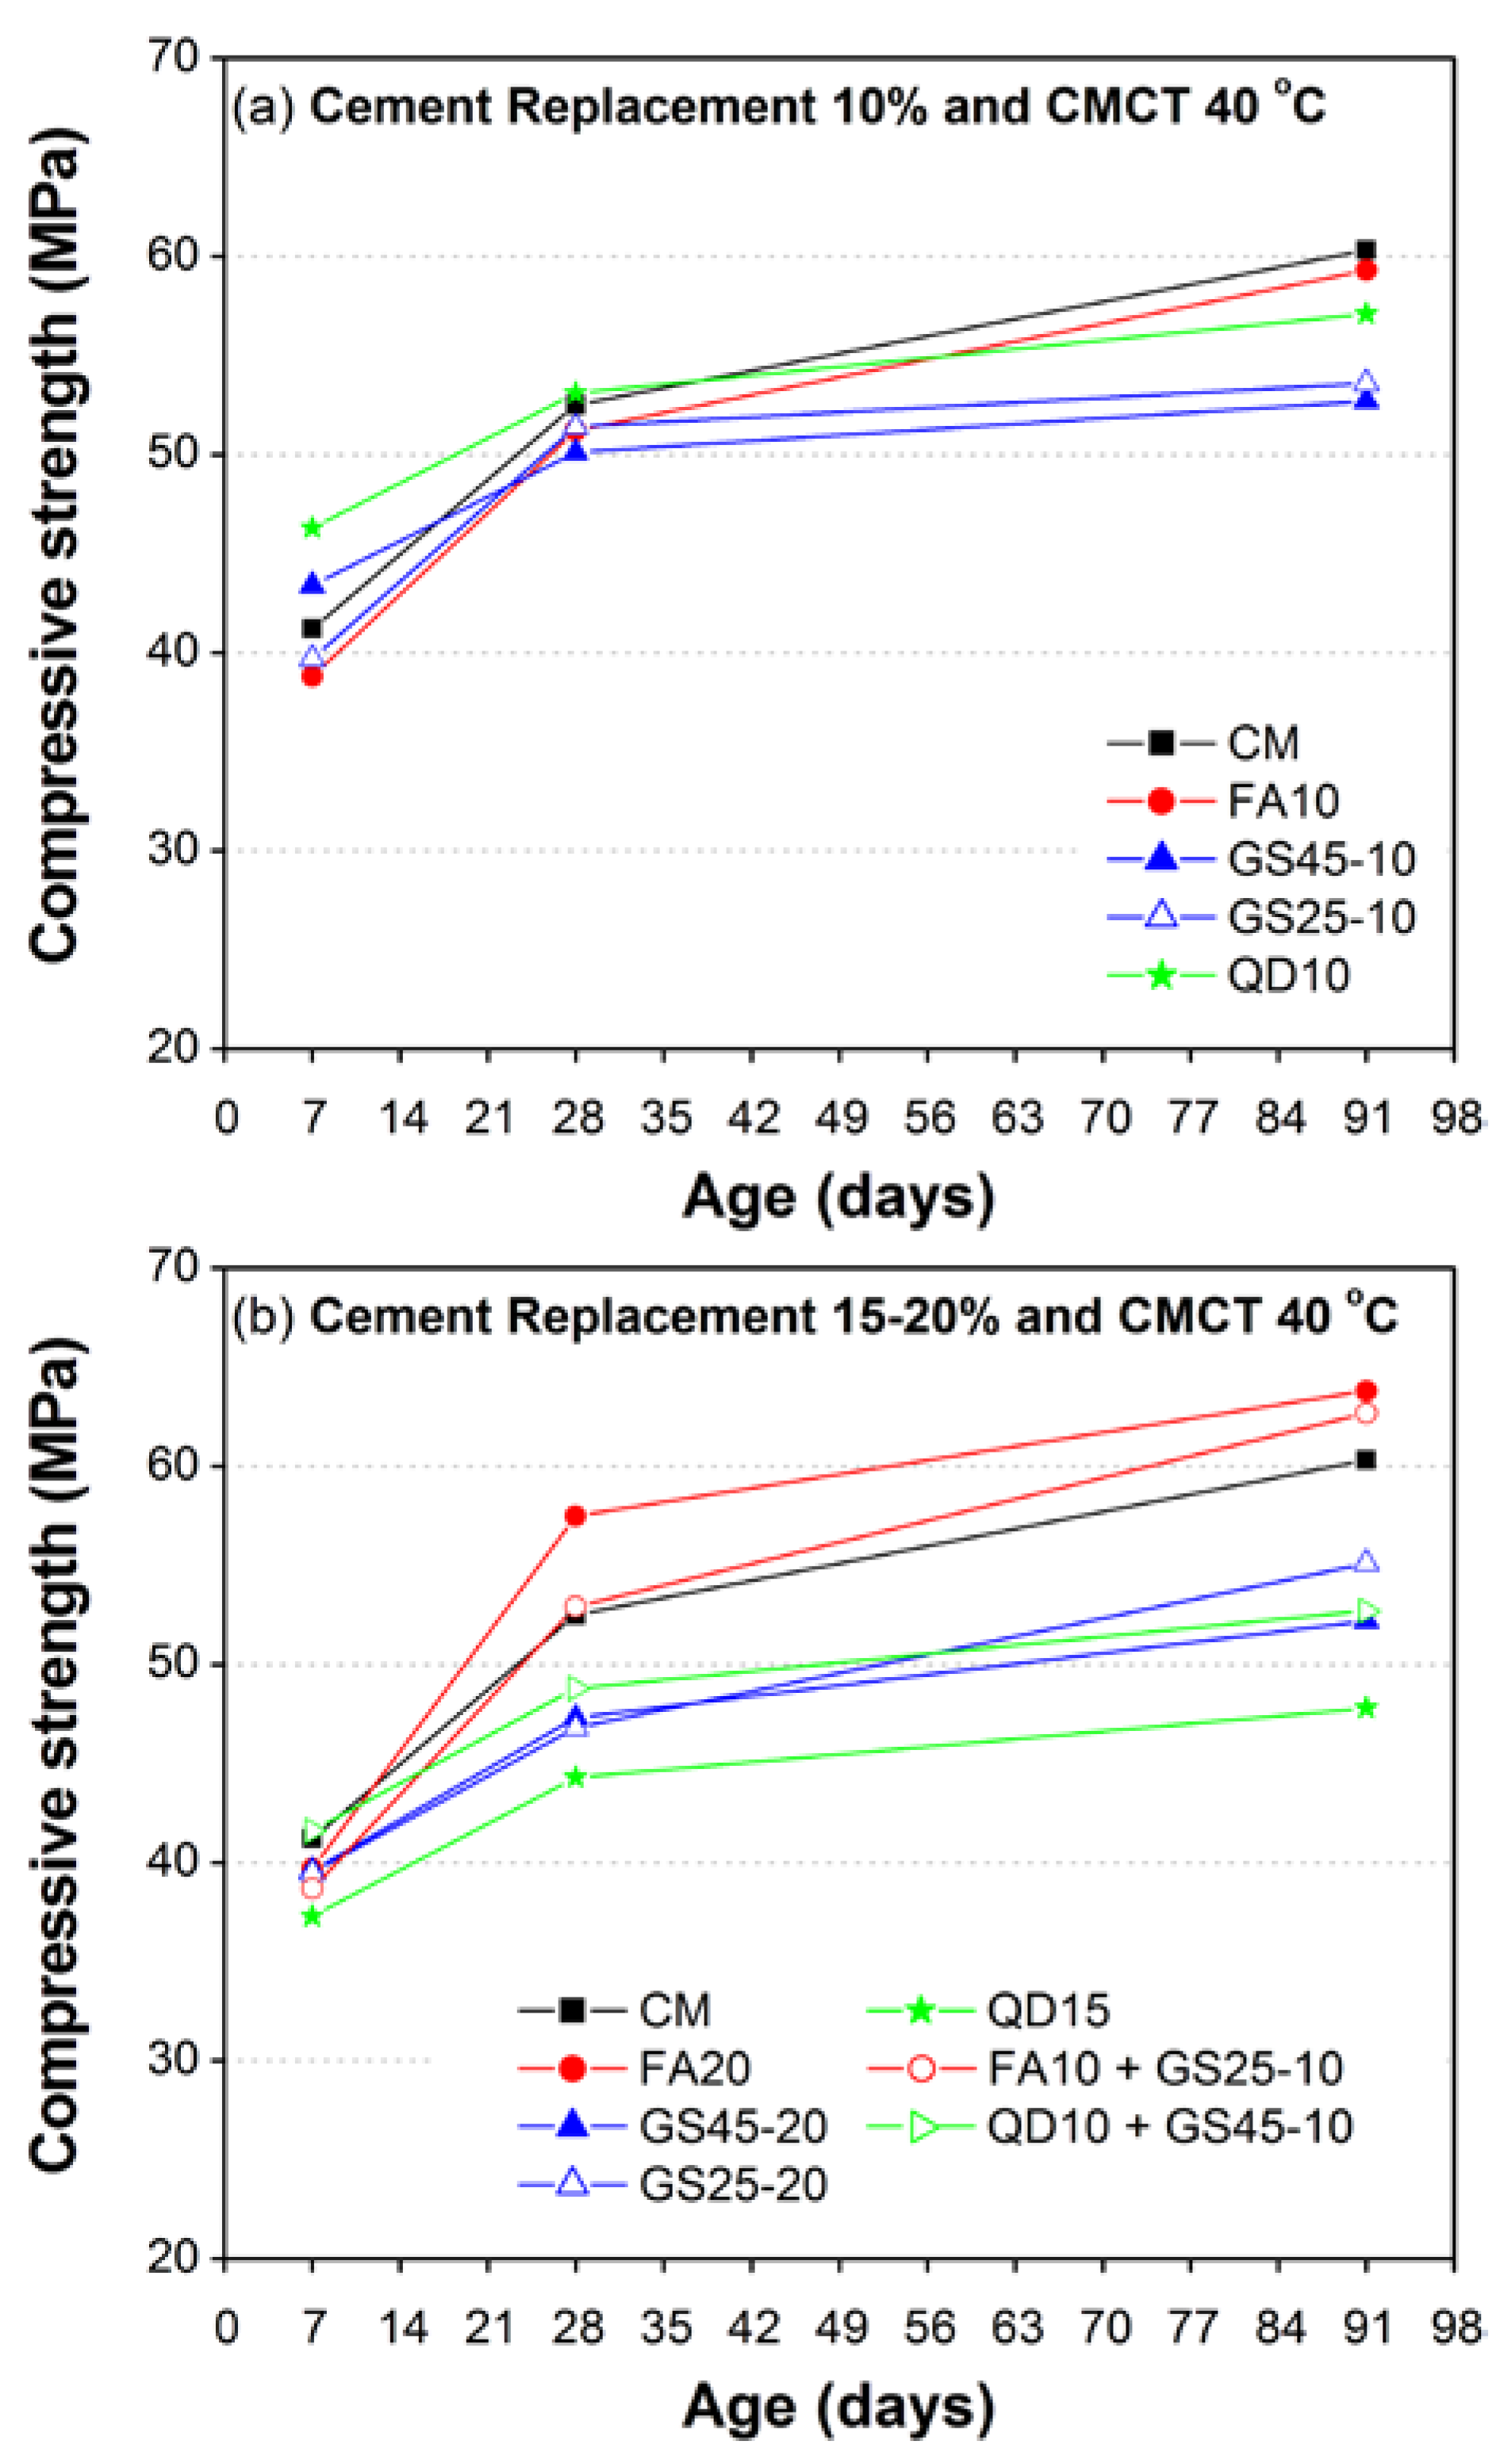
3.2.2. Effect of Curing Temperature on Compressive Strength Development
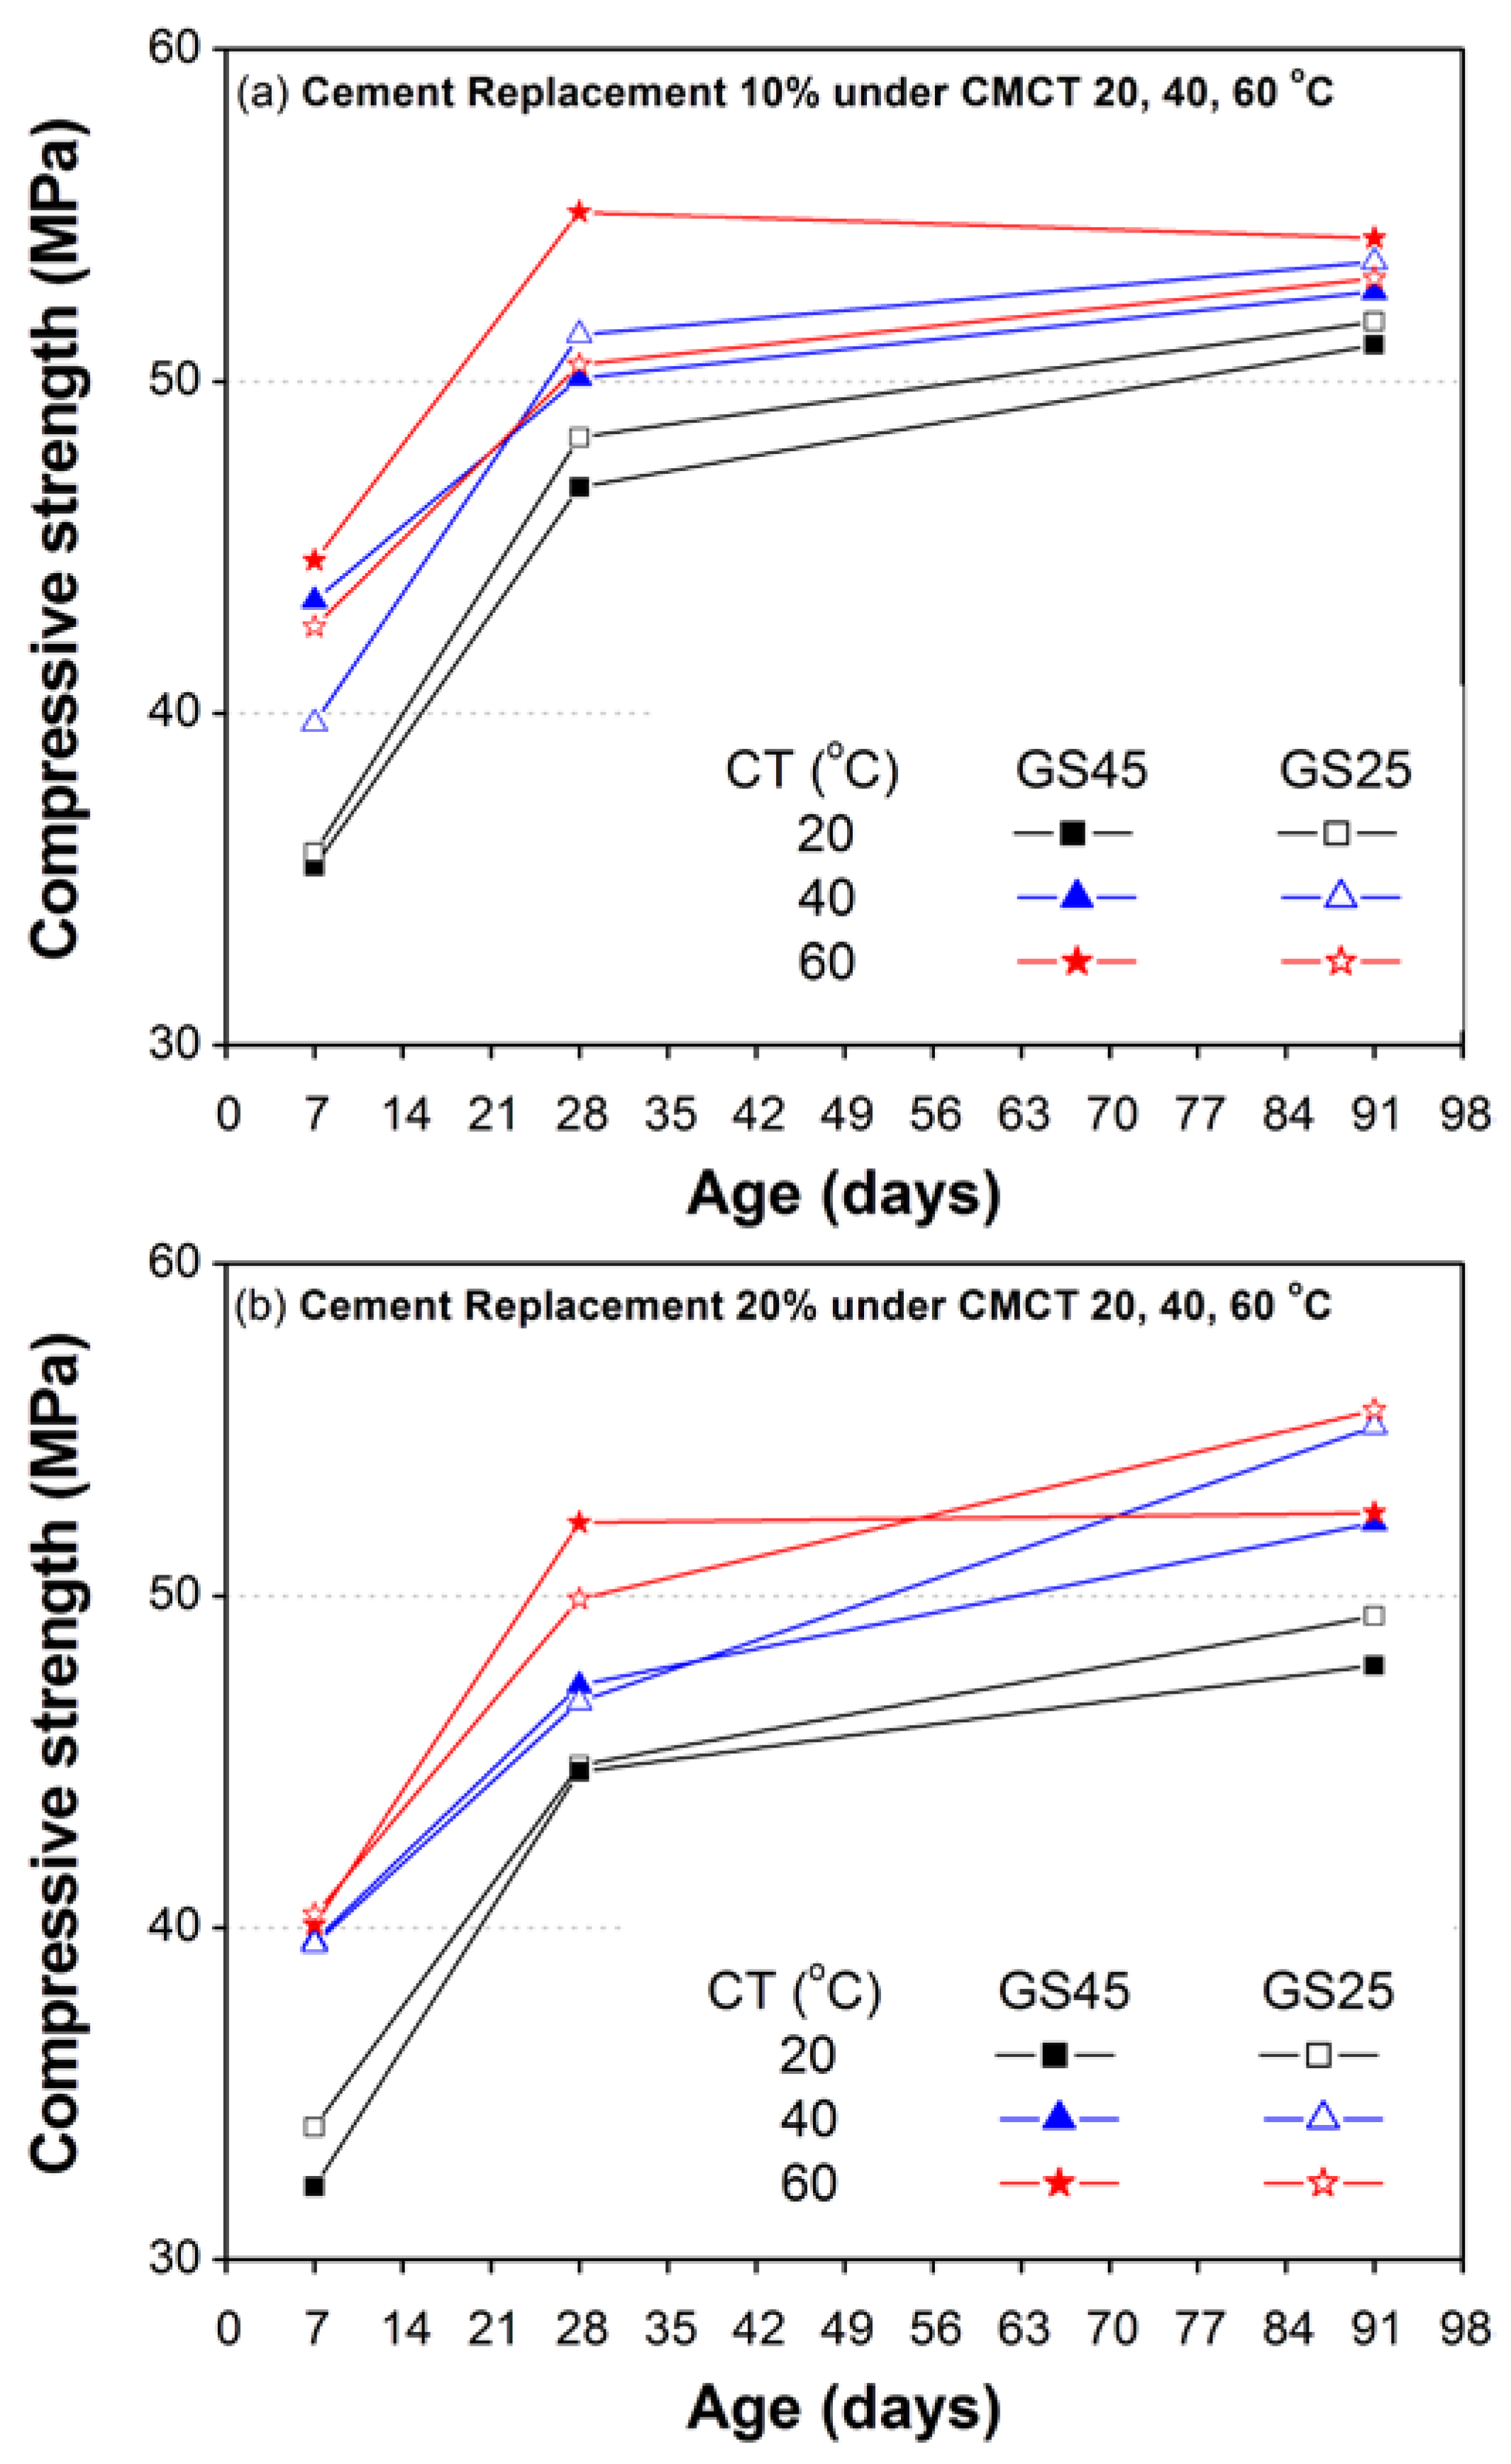
3.2.3. Effect of Fineness of GS with respect to Its Percentage Replacement with Cement, Aging and Curing Temperature
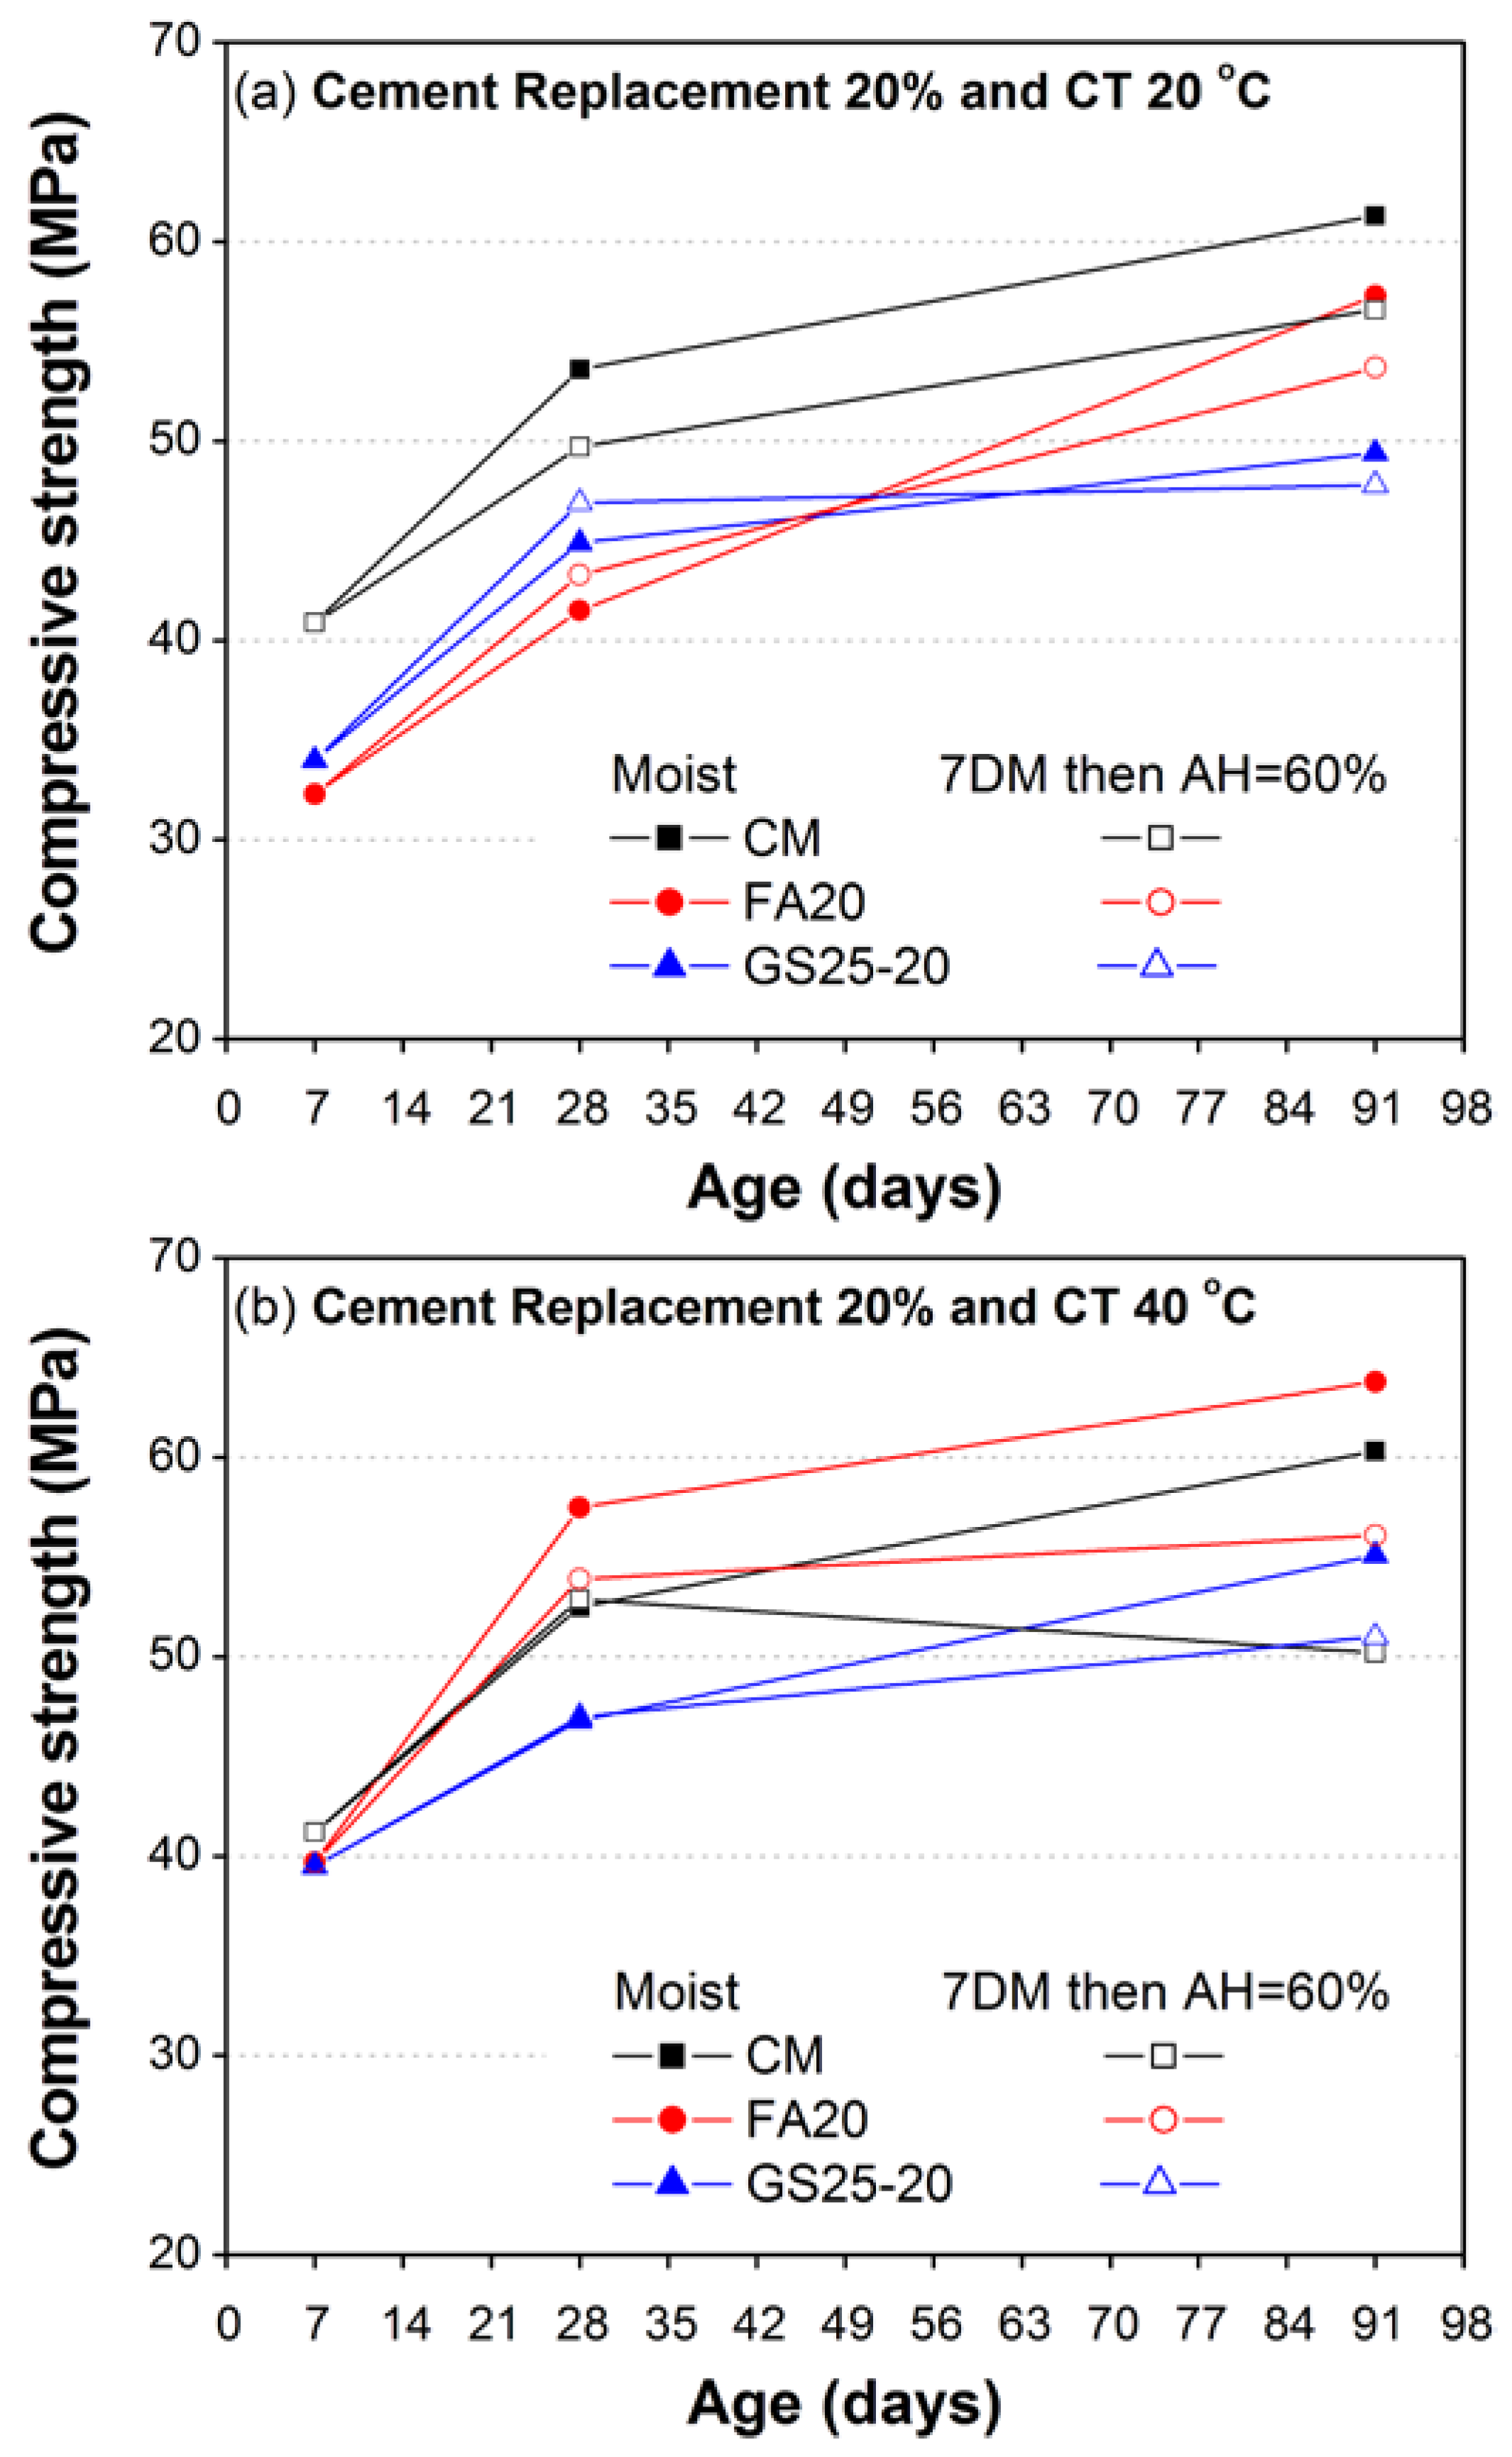
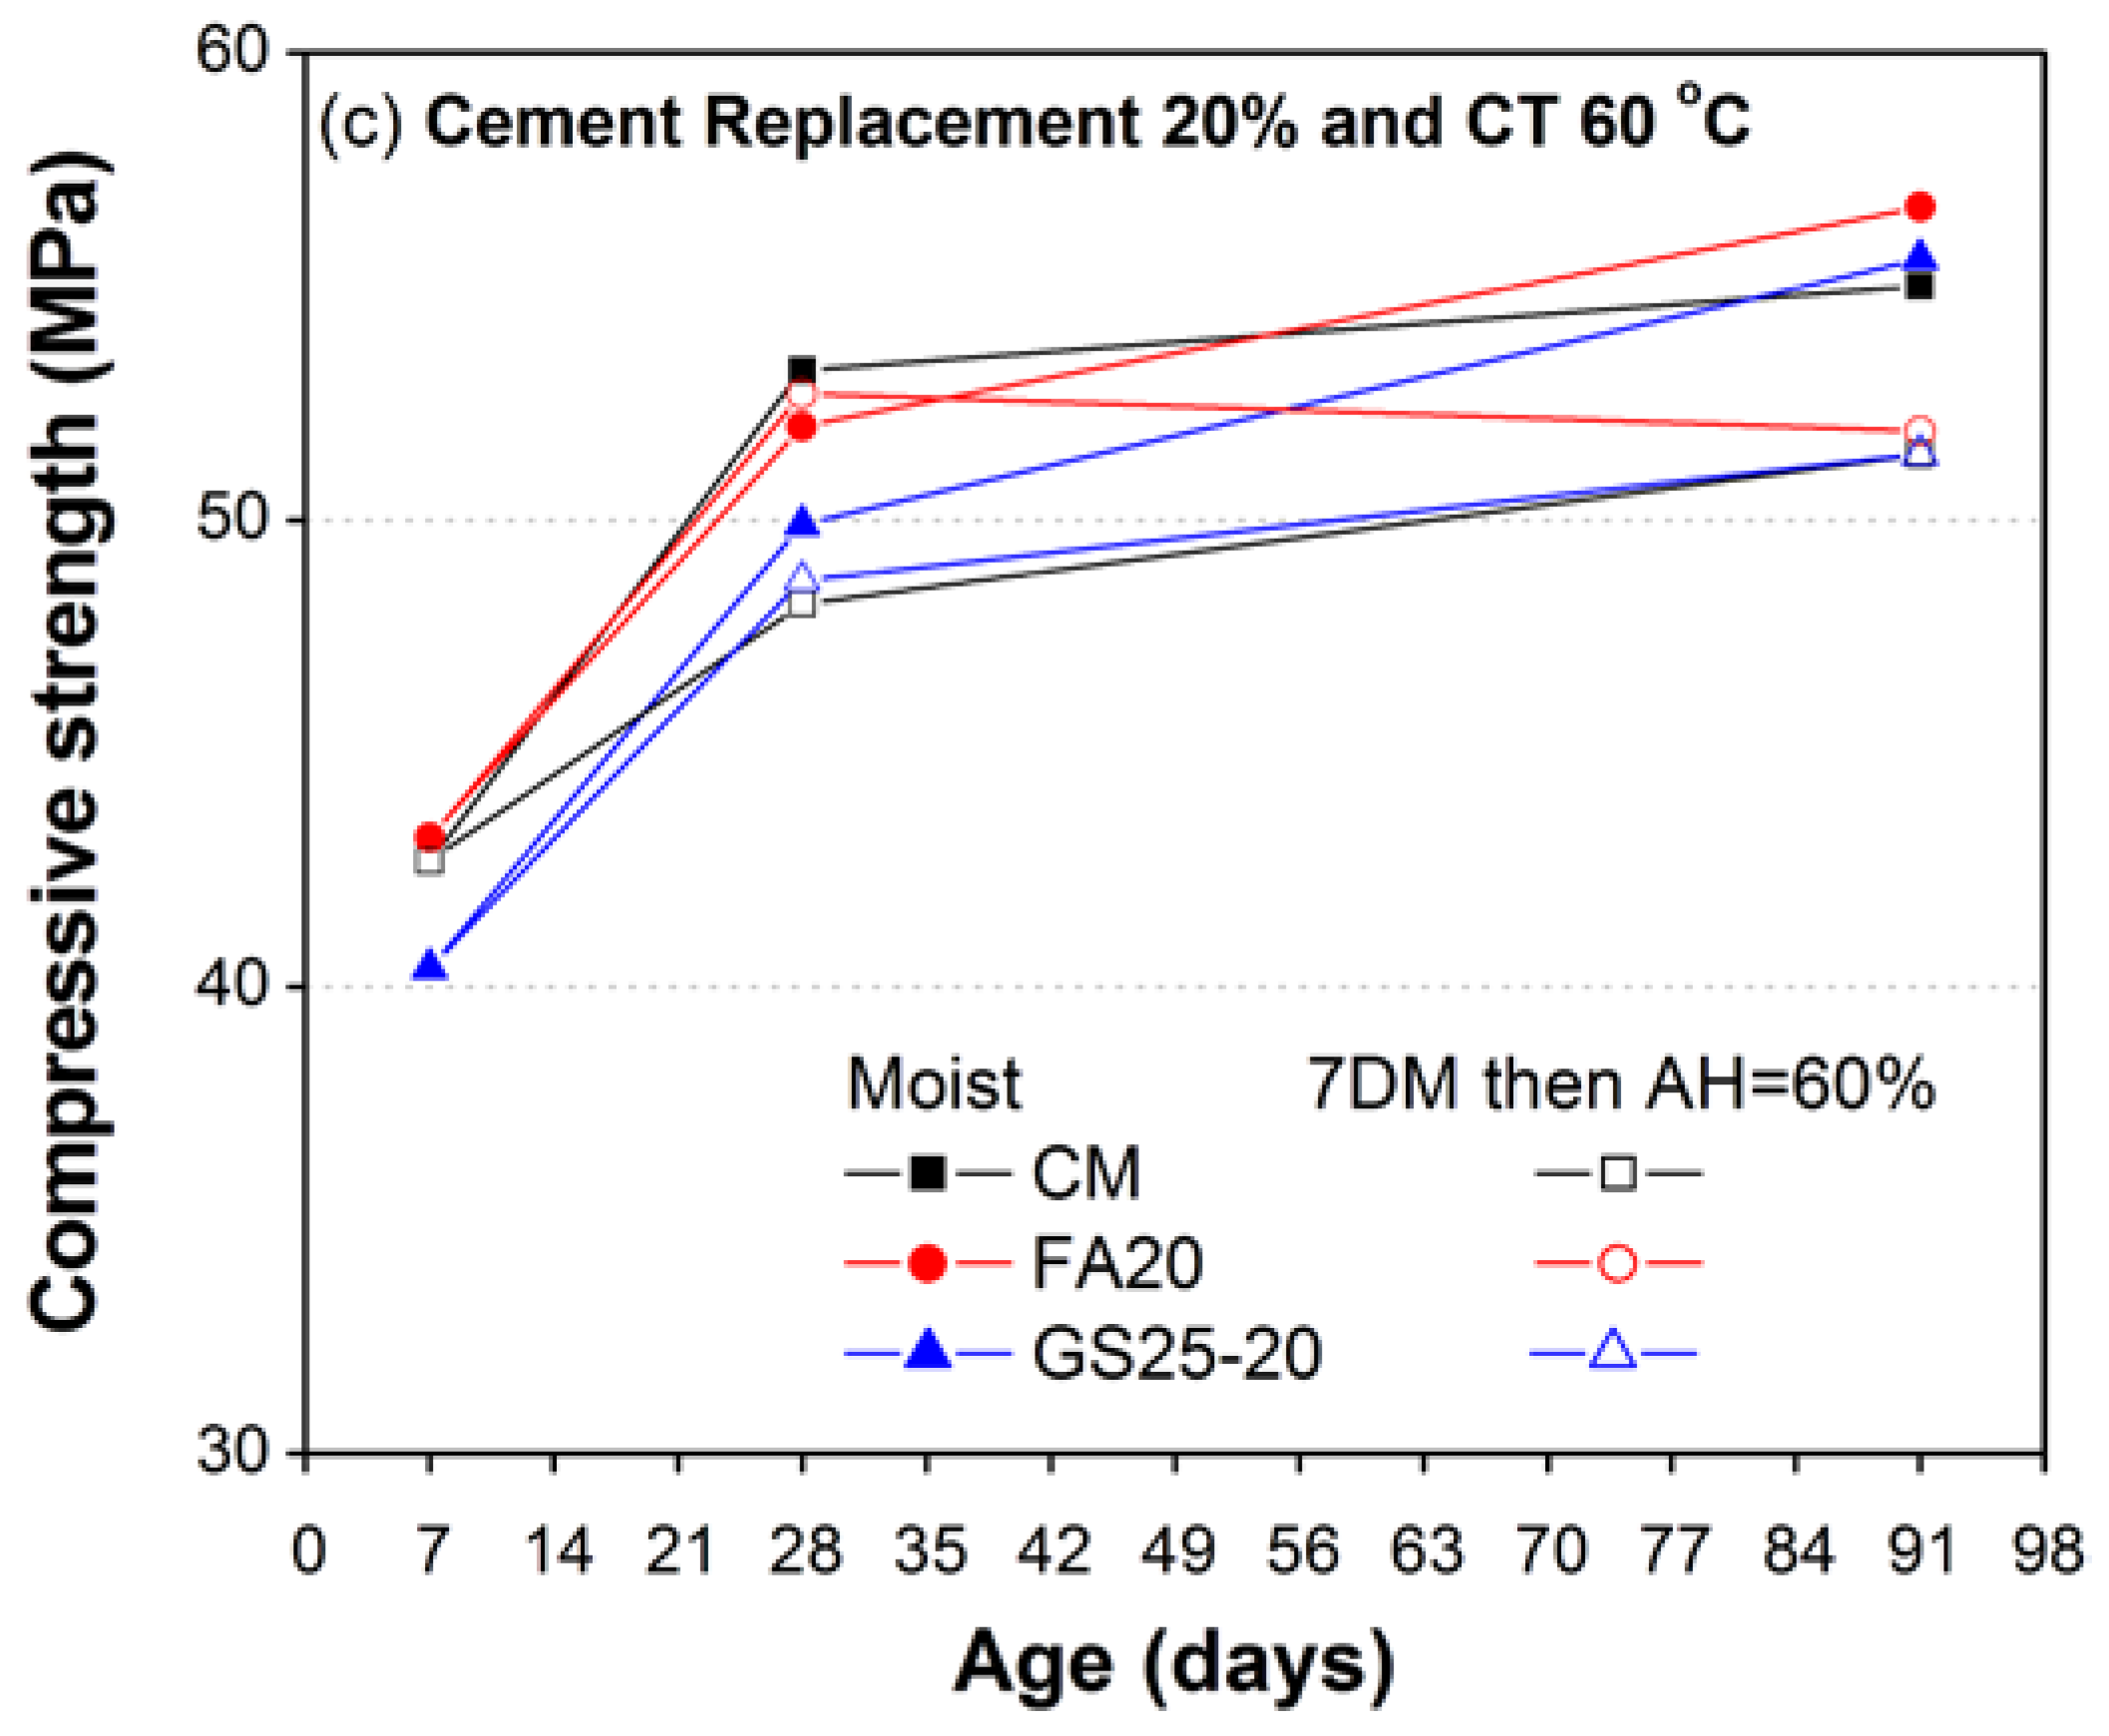
3.2.4. Effect of Continuous and Partial Moist Curing
4. Conclusions
- Under the normal curing conditions of temperature and moisture (20 °C and continuously moist cured), the compressive strength of mortar containing different percentages of waste materials as a substitution of cement (QD, GS, FA and their combinations) remained lower than that of CM at all ages. However, compressive strength slightly increased with increased fineness of GS.
- Unlike standard curing temperature, a significant influence of moderate and high curing temperatures (40 and 60 °C) was observed on the strength development of mortars containing GS. Specifically, the compressive strength of mortar containing 10% GS was comparable to CM or corresponding mortar containing FA up to 28 days and at all ages under moderately high (40 °C) and high curing temperatures (60 °C), respectively. This could be attributed to its increased hydration and pozzolanic reaction at early and later ages, respectively. Moreover, the compressive strength of mortar containing 20% GS was also found comparable to CM and corresponding FA mortar under high curing temperature (60 °C). A combination of 10% GS25 and 10% FA demonstrated comparable strength to CM and corresponding mortar containing FA. Consequently, the current results suggest that high fineness GS should be preferred to achieve better results in terms of strength, especially under high curing temperatures. It is recommended that the greater fineness of GS be achieved to investigate the influence of its high percentage replacement with cement in mortar, as well as in concrete incorporating local environmental conditions.
- The influence of moist and partially moist cuing was significant, as the compressive strength of CM and the mortars containing GS and FA with aging was found lower when subjected to partial moist curing (7DM) as compared to identical specimens subjected to continuous moist curing (CMC). Only at 28 days, the compressive strength of mortars containing FA20 and GS25-20 was higher under 7DM as compared to corresponding mortars cured under CMC. The reduction of strength under 7DM became more significant at later ages (91 days) under moderate and high curing temperatures (40 and 60 °C), as compared to corresponding mortar cured under a normal temperature of 20 °C.
- The results suggest that the CMC should be preferred, as it can be more beneficial in terms of gaining the maximum potential compressive strength of mortars regardless of the type of curing temperature (20, 40 or 60 °C). Specifically, under high casting or curing temperature conditions, the use of GS25-20 can be beneficial, as its 91 day compressive strength was almost identical to both CM and FA20, regardless of the type of curing condition.
Acknowledgments
Author Contributions
Conflicts of Interest
References
- Blankendaal, T.; Schuur, P.; Voordijk, H. Reducing the environmental impact of concrete and asphalt: A scenario approach. J. Clean. Prod. 2014, 66, 27–36. [Google Scholar] [CrossRef]
- Klee, H. The Cement Sustainability Initiative: Recycling Concrete-Summary; World Business Council for Sustainable Development (WBCSD): Geneva, Switzerland, 2009. [Google Scholar]
- U.S. Department of the Interior USGS. Mineral Commodity Summaries; U.S. Geological Survey: Reston, VA, USA, 2016.
- Rashad, A.M. An exploratory study on HVFA (high-volume fly ash) concrete incorporating silica fume subjected to thermal loads. J. Clean. Prod. 2015, 87, 735–744. [Google Scholar] [CrossRef]
- IEA-WBCSD, Cement Technology Roadmap 2009—Carbon Emissions Reductions up to 2050. Available online: https://www.iea.org/publications/freepublications/publication/Cement.pdf (accessed on 5 January 2017).
- Hemalatha, T.; Ramaswamy, A. A review on fly ash characteristics—Towards promoting high volume utilization in developing sustainable concrete. J. Clean. Prod. 2017, 147, 546–559. [Google Scholar] [CrossRef]
- Siddique, R. Utilization of silica fume in concrete: Review of hardened properties. Resour. Conserv. Recycl. 2011, 55, 923–932. [Google Scholar] [CrossRef]
- Ozbay, E.; Erdemir, M.; Durmuş, H.I. Utilization and efficiency of ground granulated blast furnace slag on concrete properties—A review. Constr. Build. Mater. 2016, 105, 423–434. [Google Scholar] [CrossRef]
- Prasara, J.; Gheewala, S.H. Sustainable utilization of rice husk ash from power plants: A review. J. Clean. Prod. 2016, in press, corrected proof. [Google Scholar] [CrossRef]
- Rana, A.; Kalla, P.; Verma, H.K.; Mohnot, J.K. Recycling of dimensional stone waste in concrete: A review. J. Clean. Prod. 2016, 135, 312–331. [Google Scholar] [CrossRef]
- Paris, J.M.; Roessler, J.G.; Ferraro, C.C.; DeFord, H.D.; Townsend, T.G. A review of waste products utilized as supplements to Portland cement in concrete. J. Clean. Prod. 2016, 121, 1–18. [Google Scholar] [CrossRef]
- Hanif, A.; Lu, Z.; Li, Z. Utilization of fly ash cenosphere as lightweight filler in cement-based composites—A review. Constr. Build. Mater. 2017, 144, 373–384. [Google Scholar] [CrossRef]
- Netinger, I.; Bjegovic, D.; Vrhovac, G. Utilisation of steel slag as an aggregate in concrete. Mater. Struct. 2011, 44, 1565–1575. [Google Scholar] [CrossRef]
- Colangelo, F.; Cioffi, R. Use of cement kiln dust, blast furnace slag and marble sludge in the manufacture of sustainable artificial aggregates by means of cold bonding pelletization. Materials 2013, 8, 3139–3159. [Google Scholar] [CrossRef]
- Colangelo, F.; Cioffi, R.; Liguori, B.; Iucolano, F. Recycled polyolefins waste as aggregates for lightweight concrete. Compos. Part B Eng. 2016, 106, 234–241. [Google Scholar] [CrossRef]
- Colangelo, F.; Cioffi, R. Mechanical properties and durability of mortar containing fine fraction of demolition wastes produced by selective demolition in South Italy. Compos. Part B Eng. 2017, 115, 43–50. [Google Scholar] [CrossRef]
- Aslam, M.; Shafigh, P.; Jumaat, M.Z. Oil-palm by-products as lightweight aggregate in concrete mixture: A review. J. Clean. Prod. 2016, 126, 56–73. [Google Scholar] [CrossRef]
- Abdulhay, G.J.; Al Zahrani, A.A.; Al Shihri, M.A.; Al Mourabet, M.O.W.; Al Rashed, M.A.; Al Onaizan, A.S. Ornamental Stone Minerals Map of the Kingdom of Saudi Arabia; Miscellaneous Map SGS-MM-3; Saudi Geological Survey: Jeddah, Saudi Arabia, 2005. [Google Scholar]
- Galetakis, M.; Soultana, A. A review on the utilization of quarry and ornamental stone industry fine by-products in the construction sector. Constr. Build. Mater. 2016, 102, 769–781. [Google Scholar] [CrossRef]
- Tennis, P.D.; Thomas, M.D.A.; Weiss, W.J. State-of-the-Art Report on Use of Limestone in Cements at Levels of up to 15%; Portland Cement Association: Skokie, IL, USA, 2011. [Google Scholar]
- Matschei, T.; Lothenbach, B.; Glasser, F.P. The role of calcium carbonate in cement hydration. Cem. Concr. Res. 2007, 37, 551–558. [Google Scholar] [CrossRef]
- Hooton, R.D.; Nokken, M.; Thomas, M.D.A. Portland-Limestone Cement: State-of-the-Art Report and Gap Analysis for CSA A 3000; Cement Association of Canada, University of Toronto: Toronto, ON, Canada, 2007. [Google Scholar]
- Lothenbach, B.; Le Saout, G.; Gallucci, E.; Scrivener, K. Influence of limestone on the hydration of Portland cements. Cem. Concr. Res. 2008, 38, 848–860. [Google Scholar] [CrossRef]
- Sprung, S.; Siebel, E. Assessment of the Suitability of Limestone for producing Portland limestone cement. ZKG Int. 1991, 44, 1–11. [Google Scholar]
- Heikal, M.; El-Didamony, H.; Morsy, M.S. Limestone-filled pozzolanic cement. Cem. Concr. Res. 2000, 30, 1827–1834. [Google Scholar] [CrossRef]
- Voglis, N.; Kakali, G.; Chaniotakis, E.; Tsivilis, S. Portland-Limestone Cements. Their Properties and Hydration Compared to those of Other Composite Cements. Cem. Concr. Compos. 2005, 27, 191–196. [Google Scholar] [CrossRef]
- Vuk, T.; Tinta, V.; Gabrovsek, R.; Kaucic, V. The effects of limestone addition, clinker type and fineness on properties of Portland cement. Cem. Concr. Res. 2001, 31, 135–139. [Google Scholar] [CrossRef]
- Bonavetti, V.; Donza, H.; Menendez, G.; Cabrera, O.; Irassar, E.F. Limestone filler cement in low w/c concrete: A rational use of energy. Cem. Concr. Res. 2003, 33, 865–871. [Google Scholar] [CrossRef]
- Schmidt, M. Cement with Interground Additives—Capabilities and Environmental Relief: Part 1. ZKG Int. 1992, 45, 87–92. [Google Scholar]
- Hawkins, P.; Tennis, P.D.; Detwiler, R.J. The Use of Limestone in Portland Cement: A State-of-the-Art Review; EB227; Portland Cement Association: Skokie, IL, USA, 2003. [Google Scholar]
- Lollini, F.; Redaelli, E.; Bertolini, L. Effects of Portland cement replacement with limestone on the properties of hardened concrete. Cem. Concr. Compos. 2014, 46, 32–40. [Google Scholar] [CrossRef]
- Kumar, A.; Oey, T.; Kim, S.; Thomas, D.; Badran, S.; Li, J.; Fernandes, F.; Neithalath, N.; Sant, G. Simple methods to estimate the influence of limestone fillers on reaction and property evolution in cementitious materials. Cem. Concr. Compos. 2013, 42, 20–29. [Google Scholar] [CrossRef]
- Marmol, I.; Ballester, P.; Cerro, S.; Monros, G.; Morales, J.; Sanchez, L. Use of granite sludge wastes for the production of coloured cement-based mortars. Cem. Concr. Compos. 2010, 32, 617–622. [Google Scholar] [CrossRef]
- Al-Hamaiedeh, H.D.; Khushefati, W.H. Granite sludge reuse in mortar and concrete. J. Appl. Sci. 2013, 13, 444–450. [Google Scholar] [CrossRef]
- Abukersh, S.A.; Fairfield, C.A. Recycled aggregate concrete produced with red granite dust as a partial cement replacement. Constr. Build. Mater. 2011, 25, 4088–4094. [Google Scholar] [CrossRef]
- Ramos, T.; Matos, A.M.; Schmidt, B.; Rio, J.; Sousa-Coutinho, J. Granitic quarry sludge waste in mortar: Effect on strength and durability. Constr. Build. Mater. 2013, 47, 1001–1009. [Google Scholar] [CrossRef]
- Bacarji, E.; Toledo Filho, R.D.; Koenders, E.A.B.; Figueiredo, E.P.; Lopes, J.L.M.P. Sustainability perspective of marble and granite residues as concrete fillers. Constr. Build. Mater. 2013, 45, 1–10. [Google Scholar] [CrossRef]
- Medina, G.; Saez del Bosque, I.F.; Frias, M.; Sanchez-de-Rojas, M.I.; Medina, C. Mineralogical study of granite waste in a pozzolan/Ca(OH)2 system: Influence of the activation process. Appl. Clay Sci. 2017, 135, 362–371. [Google Scholar] [CrossRef]
- ASTM-C618–15. Standard Specification for Coal Fly Ash and Raw or Calcined Natural Pozzolan for Use in Concrete. Available online: http://www.astm.org (accessed on 22 January 2017).
- ASTM C109/C109M-16a. Standard Test Method for Compressive Strength of Hydraulic Cement Mortars (Using 2-in. or [50-mm] Cube Specimens). Available online: http://www.astm.org (accessed on 22 January 2017).
- ASTM C150/C150M-16e1. Standard Specification for Portland Cement. Available online: www.astm.org (accessed on 22 January 2017).
- ASTM C125–16. Standard Terminology Relating to Concrete and Concrete Aggregates. Available online: www.astm.org (accessed on 22 January 2017).
- Al-Abidien, H.M.Z. Aggregates in Saudi Arabia: A survey of their properties and suitability for concrete. Mater. Struct. 1987, 20, 260–264. [Google Scholar] [CrossRef]
- Eskander, N.S.; Alfi, K.H.; Bayashoot, A.M.; Al-Fear, A.M.; Al-Madani, M.A. Identification of Potential Uses of Ornamental Stone Quarry Waste in the Ar Riyad Region, Kingdom of Saudi Arabia; Open-File Report No. SGS-OF-2005–13; Saudi Geological Survey: Jeddah, Saudi Arabia, 2006. [Google Scholar]
- Saudi Arabian Granite—Manufacturer of Natural Stones, including Granite, Slate, Marble, Sandstone and Limestone. Saudi Marble and Granite Co. Ltd., Riyadh, Kingdom of Saudi Arabia. Available online: http://www.smg.com.sa/ (accessed on 20 January 2017).
- Malhotra, V.M.; Mehta, P.K. High-Performance, High-Volume Fly Ash Concrete; Supplementary Cementing Materials for Sustainable Development, Inc.: Ottawa, ON, Canada, 2002. [Google Scholar]
- ISO 13320:2009. Particle Size Analysis—Laser Diffraction Methods. International Organization for Standardization, Geneva, Switzerland, 2009. Available online: https://www.iso.org/standard/44929.html (accessed on 9 June 2017).
- ASTM C305–14. Standard Practice for Mechanical Mixing of Hydraulic Cement Pastes and Mortars of Plastic Consistency. Available online: http://www.astm.org (accessed on 22 January 2017).
- ASTM C25–11e2. Standard Test Methods for Chemical Analysis of Limestone, Quicklime, and Hydrated Lime. Available online: http://www.astm.org (accessed on 29 May 2017).
- ACI Committee 232. Use of Fly Ash in Concrete; ACI 232.2R-96; American Concrete Institute (ACI): Farmington Hills, MI, USA, 1996. [Google Scholar]
- ASTM C311–16. Standard Test Methods for Sampling and Testing Fly Ash or Natural Pozzolans for Use in Portland-Cement Concrete. Available online: http://www.astm.org (accessed on 9 June 2017).
- Alexander, K.M.; Taplin, J.H. Concrete strength, cement hydration and the maturity rule. Aust. J. Appl. Sci. 1962, 13, 277–284. [Google Scholar]


| Sieve # | Sieve Size (mm) | Weight Retained (g) | Weight Retained (%) | Cumulative Passing (%) | Cumulative Retained (%) |
|---|---|---|---|---|---|
| 3/8 inch | 9.5 | 0 | 0 | 100 | 0 |
| No. 4 | 4.75 | 0 | 0 | 100 | 0 |
| No. 8 | 2.36 | 0 | 0 | 100 | 0 |
| No. 16 | 1.18 | 134 | 26.8 | 73.2 | 26.8 |
| No. 30 | 0.600 | 179 | 35.8 | 37.4 | 62.6 |
| No. 50 | 0.300 | 49 | 9.8 | 27.6 | 72.4 |
| No. 100 | 0.150 | 98.8 | 19.76 | 7.84 | 92.16 |
| Pan | - | 39.2 | 7.84 | 0 | - |
| Fineness Modulus (FM) = (0 + 0 + 0 + 26.8 + 62.6 + 72.4 + 92.16)/100 = 2.54 | |||||
| Item | C | FA | GS | QD |
| Physical properties | ||||
| Specific gravity (g/cm3) | 3.15 | 2.83 | 2.50 | 2.43 |
| Fineness (m2/kg) (Blain) | 344 | - | - | - |
| Fineness (m2/cc) by Microtrac S3500 | 0.5670 | 1.027 | 1.882 (GS45) 2.047 (GS25) | 0.1800 |
| Chemical properties (oxides, % by weight) | ||||
| SiO2 | 20.9 | 51.5 | 62.1 | 5.05 |
| Al2O3 | 5.18 | 24.3 | 12.4 | 0.45 |
| Fe2O3 | 3.04 | 8.87 | 9.80 | 0.18 |
| (SiO2 + Al2O3 + Fe2O3) * | - | 84.7 | 84.3 | - |
| CaO | 63.9 | 5.15 | 4.50 | 49.8 |
| MgO | 1.65 | 3.50 | 0.59 | - |
| Na2O | 0.10 | 2.38 | 3.30 | - |
| K2O | 0.52 | 1.47 | 4.40 | - |
| SO3 | 2.61 | 0.23 | 0.10 | - |
| LOI ** | 2.51 | 0.25 | 2.71 | 44.6 |
| Compounds (%) | ||||
| C2S | 52.1 | - | - | - |
| C3S | 19.6 | - | - | - |
| C3A | 8.17 | - | - | - |
| C4AF | 8.81 | - | - | - |
| Materials | Mean (μm) | Standard Deviation (μm) | d10 (μm) | d50 (μm) | d90 (μm) |
|---|---|---|---|---|---|
| Cement | 10.58 | 10.01 | 0.954 | 4.440 | 28.63 |
| FA | 5.840 | 4.000 | 0.694 | 1.819 | 13.59 |
| GS45 | 3.190 | 1.623 | 0.633 | 1.249 | 7.770 |
| GS25 | 2.932 | 1.823 | 0.563 | 0.985 | 7.350 |
| QD | 33.35 | 28.98 | 4.390 | 16.65 | 91.68 |
| Batch Quantities (g) for Nine 50-mm3 Mortar Specimens | |||||||
|---|---|---|---|---|---|---|---|
| Mix ID | Water (w) | Cement (c) | GS45 | GS25 | QD | FA | Sand (s) |
| Control Mortar (CM) | 364 | 750 | 0 | 0 | 0 | 0 | 2063 |
| 10% FA (FA10) | 364 | 675 | 0 | 0 | 0 | 75 | 2063 |
| 20% FA (FA20) | 364 | 600 | 0 | 0 | 0 | 150 | 2063 |
| 10% GS passing sieve 45 μ (GS45-10) | 364 | 675 | 75 | 0 | 0 | 0 | 2063 |
| 20% GS passing sieve 45 μ (GS45-20) | 364 | 600 | 150 | 0 | 0 | 0 | 2063 |
| 10% GS passing sieve 45 μ (GS25-10) | 364 | 675 | 0 | 75 | 0 | 0 | 2063 |
| 20% GS passing sieve 45 μ (GS25-20) | 364 | 600 | 0 | 150 | 0 | 0 | 2063 |
| 10% QD (QD10) | 364 | 675 | 0 | 0 | 75 | 0 | 2063 |
| 15% QD (QD15) | 364 | 638 | 0 | 0 | 112 | 0 | 2063 |
| FA10 + GS25-10 | 364 | 600 | 0 | 75 | 0 | 75 | 2063 |
| QD10 + GS45-10 | 364 | 600 | 75 | 0 | 75 | 0 | 2063 |
| Mix ID | Curing Moisture | Curing Temperature (°C) | ||||||||
|---|---|---|---|---|---|---|---|---|---|---|
| 20 | 40 | 60 | ||||||||
| Age (Days) | ||||||||||
| 7 | 28 | 91 | 7 | 28 | 91 | 7 | 28 | 91 | ||
| CM | M * | 40.9 | 53.6 | 61.3 | 41.2 | 52.5 | 60.3 | 42.7 | 53.2 | 55.0 |
| (0.9) *** | (1.9) | (3.1) | (1.4) | (2.4) | (6.6) | (2.6) | (1.2) | (1.6) | ||
| 7DM ** | 49.7 | 56.6 | 52.9 | 50.2 | 48.2 | 51.4 | ||||
| (4.2) | (1.6) | (3.2) | (1.9) | (5.3) | (2.3) | |||||
| FA10 | M | 33.3 | 44.6 | 56.4 | 38.8 | 51.2 | 59.3 | 38.2 | 51.2 | 55.1 |
| (0.7) | (2.1) | (0.8) | (3.1) | (6.2) | (3.7) | (1.5) | (2.1) | (1.2) | ||
| FA20 | M | 32.3 | 41.5 | 57.3 | 39.7 | 57.5 | 63.8 | 43.2 | 52.0 | 56.7 |
| (2.0) | (2.8) | (4.7) | (2.0) | (5.2) | (2.5) | (2.8) | (2.4) | (1.6) | ||
| 7DM | 43.3 | 53.7 | 53.9 | 56.1 | 52.7 | 51.9 | ||||
| (1.2) | (2.6) | (0.7) | (0.2) | (3.1) | (5.4) | |||||
| GS45-10 | M | 35.4 | 46.8 | 51.1 | 43.4 | 50.1 | 52.7 | 44.6 | 55.1 | 54.3 |
| (1.2) | (0.7) | (1.9) | (1.0) | (1.7) | (4.9) | (2.0) | (1.7) | (2.4) | ||
| GS45-20 | M | 32.2 | 44.7 | 47.9 | 39.6 | 47.3 | 52.2 | 40.1 | 52.2 | 52.5 |
| (0.5) | (1.9) | (2.2) | (1.0) | (5.0) | (1.1) | (0.8) | (1.6) | (3.0) | ||
| GS25-10 | M | 35.8 | 48.3 | 51.8 | 39.7 | 51.4 | 53.6 | 42.6 | 50.5 | 53.1 |
| (0.5) | (2.3) | (1.4) | (1.4) | (2.6) | (1.8) | (1.9) | (1.7) | (4.1) | ||
| GS25-20 | M | 34.0 | 44.9 | 49.4 | 39.5 | 46.8 | 55.1 | 40.4 | 49.9 | 55.6 |
| (0.4) | (1.9) | (1.6) | (0.3) | (1.5) | (3.2) | (0.6) | (0.8) | (1.5) | ||
| 7DM | 46.9 | 47.8 | 47.0 | 51.0 | 48.7 | 51.4 | ||||
| (2.3) | (4.6) | (3.7) | (6.8) | (2.3) | (1.8) | |||||
| QD10 | M | 35.7 | 46.7 | 52.5 | 43.8 | 48.7 | 51.3 | 44.8 | 48.7 | 47.2 |
| (0.2) | (1.5) | (3.2) | (2.4) | (0.4) | (2.0) | (2.8) | (2.2) | (0.4) | ||
| QD15 | M | 32.8 | 40.7 | 49.3 | 37.3 | 43.0 | 47.8 | 39.3 | 43.1 | 42.8 |
| (1.1) | (2.0) | (3.0) | (0.6) | (1.2) | (1.5) | (1.8) | (1.1) | (1.6) | ||
| FA10 + GS25-10 | M | 30.5 | 41.9 | 54.1 | 38.7 | 52.9 | 62.7 | 46.6 | 48.8 | 56.4 |
| (2.1) | (1.9) | (3.9) | (1.0) | (2.5) | (0.8) | (0.9) | (1.2) | (1.9) | ||
| QD10 + GS45-10 | M | 33.1 | 43.2 | 51.1 | 39.9 | 48.8 | 52.7 | 46.7 | 48.3 | 51.0 |
| (1.0) | (1.8) | (2.3) | (0.1) | (0.6) | (1.0) | (2.5) | (0.9) | (1.3) | ||
© 2017 by the authors. Licensee MDPI, Basel, Switzerland. This article is an open access article distributed under the terms and conditions of the Creative Commons Attribution (CC BY) license (http://creativecommons.org/licenses/by/4.0/).
Share and Cite
Amin, M.N.; Khan, K.; Saleem, M.U.; Khurram, N.; Niazi, M.U.K. Aging and Curing Temperature Effects on Compressive Strength of Mortar Containing Lime Stone Quarry Dust and Industrial Granite Sludge. Materials 2017, 10, 642. https://doi.org/10.3390/ma10060642
Amin MN, Khan K, Saleem MU, Khurram N, Niazi MUK. Aging and Curing Temperature Effects on Compressive Strength of Mortar Containing Lime Stone Quarry Dust and Industrial Granite Sludge. Materials. 2017; 10(6):642. https://doi.org/10.3390/ma10060642
Chicago/Turabian StyleAmin, Muhammad Nasir, Kaffayatullah Khan, Muhammad Umair Saleem, Nauman Khurram, and Muhammad Umar Khan Niazi. 2017. "Aging and Curing Temperature Effects on Compressive Strength of Mortar Containing Lime Stone Quarry Dust and Industrial Granite Sludge" Materials 10, no. 6: 642. https://doi.org/10.3390/ma10060642