Characterization of Lubricated Friction Behavior of Thermal Spray Steel Coatings in Comparison with Grey Cast Iron

Engineering Materials Program, Mechanical, Automotive and Materials Engineering Department, University of Windsor, 401 Sunset Ave., Windsor, ON N9B 3P4, Canada
*
Author to whom correspondence should be addressed.
Lubricants 2020, 8(1), 9; https://doi.org/10.3390/lubricants8010009
Submission received: 12 November 2019
/
Revised: 27 December 2019
/
Accepted: 7 January 2020
/
Published: 15 January 2020
Abstract
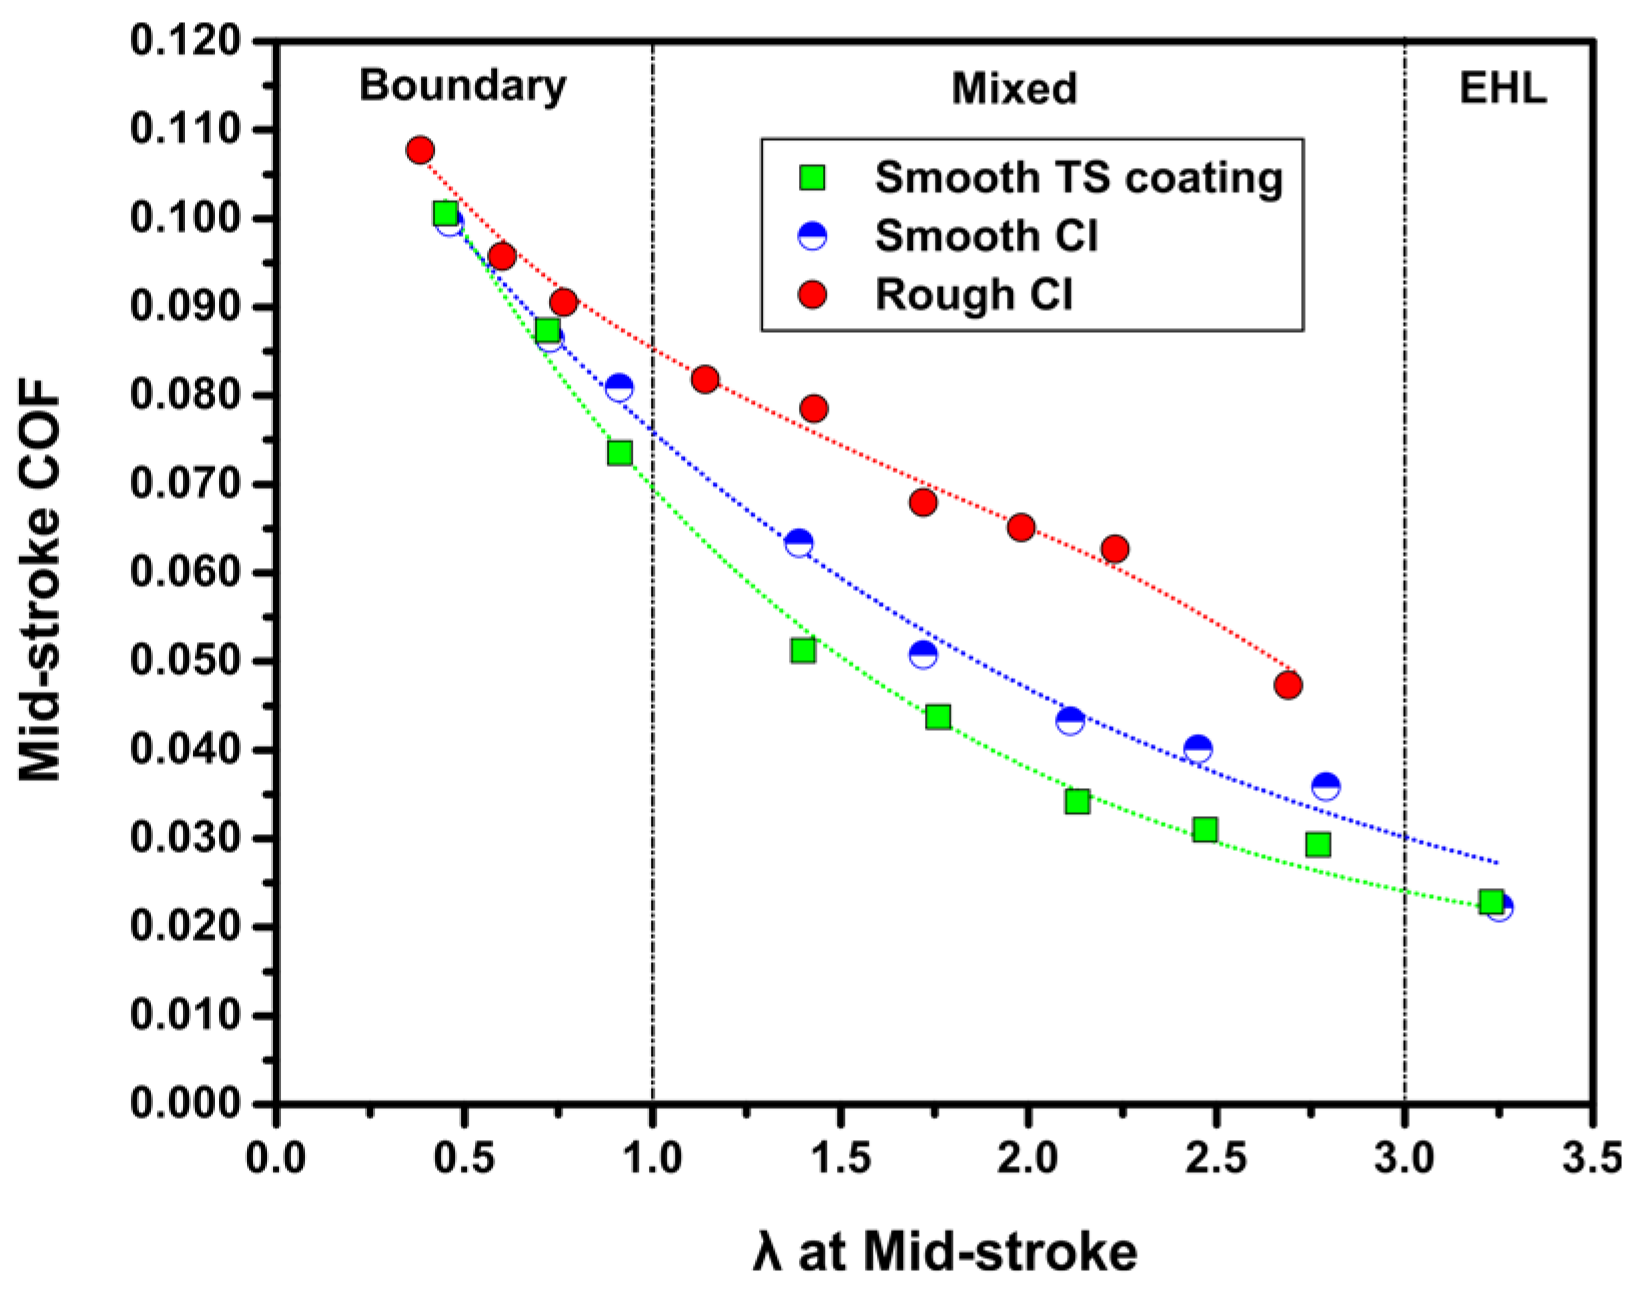
:This work examines friction properties of smooth-honed thermal spray (TS) low carbon steel coatings produced on an Al-9.0% Si alloy using a plasma transferred wire arc (PTWA) method and an AISI 1010 wire used as feedstock in comparison with the ASM type D grey cast iron (CI) samples subjected to the same (smooth) honing process. CI samples prepared using a standard honing process were also tested for comparison. Reciprocating sliding tests were performed using a Cameron–Plint tribometer against CrN-coated counterfaces within a speed range of 0.06–1.20 m/s covering the boundary and mixed lubrication conditions. Stribeck curves were constructed to show the coefficient of friction (COF) variations with the ratio (λ) of lubricant film thickness to composite surface roughness of TS and CI samples at the mid-stroke position where sliding speeds and surface roughnesses were measured. Examination of the Stribeck curves showed that the TS coated surfaces provided lower COF values compared to CI surfaces given the same smooth honing treatment, e.g., for λ = 2.7 a COF of 0.029 was observed for TS and 0.035 for CI, whereas conventional honing of CI provided a COF of 0.047 under the same condition. Metallographic evidence was given for the surface features and formation of tribolayers on the contact surfaces. The arithmetic mean heights of the surfaces, Sa measured after the tests remained similar for the smooth-honed TS and CI samples. The low COF values of the TS samples were discussed in terms of the surface pores generated during their manufacturing process, and the high oil retention depth ratio (Svk/Sk) of the TS coated surfaces due to the presence of these pores.
1. Introduction
Deposition of low carbon steel coatings on the inner walls of cylinder bores of hypoeutectic Al-Si engine blocks using thermal spray (TS) processes, including plasma transferred wire arc (PTWA), and high-velocity oxygen fuel (HVOF) spraying represents an emerging tribological method for vehicle mass reduction by replacing the conventional role of cast iron (CI) liners [1,2,3]. The PTWA spraying process produces a coating structure consisting of thin oxide (FeO) layers surrounding α-Fe splats [4]. The coating structure also incorporates microscopic pores, usually at a small volume fraction of 1–3% generated during rapid solidification of the splats, and they are generally regarded as metallurgical defects [5].
The surface roughness of engine cylinder bore surfaces is among the important parameters that control the lubricated friction and wear properties of internal combustion engines [6]. The surfaces of engine cylinder bores are honed to a precise surface finish to produce a sliding surface with low friction and high oil retention capability [7,8]. The arithmetic mean height (Sa) values of honed surfaces typically range from 0.12 µm to 1.20 µm, and the cylinder wall surfaces are usually ground to have continuous grooves with a cross-hatched pattern [9]. The oil retention achieved with a cross-hatch finish was considered to be beneficial in preventing scuffing under the boundary lubrication condition [10]. Ma et al. [11] found that under the boundary lubrication condition, increasing the roughness of honed iron liners prolonged the running-in stage of lubricated sliding followed by a steady-state stage with a higher coefficient of friction (COF). Morawitz et al. [8] studied the frictional responses of CI liners with standard-honed (Sa = 650 nm) and smooth-honed (Sa = 150 nm) surfaces subjected to sliding tests with speed changes, and reported that the transition from the mixed lubrication to the hydrodynamic lubrication regime occurred at a lower sliding speed on the smooth-honed CI liner. Similar observations were made on low carbon steel surfaces where friction reduction brought about by a low surface roughness was observed in the mixed lubrication regime, while in the boundary lubrication and the hydrodynamic lubrication regimes, the friction reduction effect of smooth surface was marginal [12]. Lou et al. [13] investigated the friction behavior of a rough-honed (Sa = 965 nm) TS coating, and their results showed that the transition from the boundary lubrication to the mixed lubrication regime occurred at a lower sliding speed when the roughness of TS coated surfaces was reduced due to extensive oxidational wear. Johansson et al. [14] studied the lubricated friction behavior of smooth-honed (Sa = 250 nm) TS coated liner and rough-honed (Sa = 650 nm) CI liner, and their results also revealed that compared with the rough CI liner surface, the smooth surface of TS coated liner achieved lower COF values under the boundary lubrication regime. Recently a mirror-like bore surface finish was applied to the TS coated cylinder bores that contributed to low sliding friction and reduced exhaust emission [15,16]. It was suggested that the use of TS coated cylinder bores with mirror-like surface finish could reduce fuel consumption by 2–4% [17]. The pores formed during production became more apparent after fine surface finish of the cylinder bore surfaces and were suggested to act as oil reservoirs during lubricated sliding [8,16].
The roles of artificially generated oil reservoirs such as the micro-dimples formed on the steel surfaces on the lubricated sliding friction behavior have been studied [18,19,20]. Rosenkranz et al. [18,19] studied the effect of micro-dimples on the lubricated friction behavior of journal bearings. It was found that the friction reduction effect due to the presence of micro-dimples was more prominent under the mixed lubrication regime, and the authors suggested that the generation of additional oil reservoirs that feed lubricant into the contact area could be beneficial in reducing friction especially at low sliding speeds. Kovalchenko et al. [20] studied the friction behavior of polished steel samples and micro-dimpled steel samples prepared by laser surface texturing. The results showed that compared with the polished steel surfaces, the dimpled steel samples with a similar level of surface roughness (Sa = 30 nm) exhibited lower COF values under the boundary and mixed lubrication conditions.
As the above review shows the importance of smooth surface finish on reducing friction is well established. As the TS coatings represent a new generation of cylinder bore coatings for lightweight Al-Si engine blocks, their frictional properties should be characterized by considering the effects of the honing process applied to their surfaces. This work aims at studying the variation of COF values of the smooth-honed TS coatings in comparison to CI liners subjected to the same smooth honing process as well as those subjected to the rough honing. The Cameron–Plint type of reciprocating lubricated sliding tests was conducted to measure the COF values at various test speeds, and the results were presented in the form of Stribeck diagrams in order to delineate the differences in COF values of TS coating and CI samples in the boundary and mixed lubrication regimes. The friction reduction mechanisms were studied by examining the evolution of surface roughness of the samples using surface profilometry and scanning electron microscopy, and the role of the surface pores formed during the manufacturing process of the low carbon steel TS coatings was considered in interpreting the low COF values of the smooth-honed TS coatings.
2. Experimental
2.1. Thermal Spray Steel Coating and Cast Iron Samples: Microstructures and Honing Patterns
The thermal spray (TS) steel coatings were produced using a plasma transferred wire arc (PTWA) process. Rotating low carbon steel (AISI 1010) wire was used as the feedstock. Coatings with a thickness of 260 ± 5 μm were deposited on the inner walls of cylinder bores of engine blocks that were cast from A380 Al alloy (Al-9.0% Si). Prior to coating deposition, the cylinder bore surfaces were machined in a dovetail pattern to provide mechanical interlocking between the TS coating and the bore surface, as shown in the backscattered electron (BSE) image of Figure 1a. The cross-sectional BSE image of the near top surface of the coating is shown in Figure 1b. The α-Fe splats were surrounded by FeO layers. The oxide volume fraction was 0.16 ± 0.02. A detailed description of the microstructure of TS coatings is given in Ref [21]. The porosity measured on the polished cross-sections, as the one shown in Figure 1b, was determined as 2.2 area % using image analyses (Image-Pro Plus) and quantitative metallography. A cross-sectional secondary electron (SE) image of ASM type D grey cast iron (CI) liner sample that was studied for comparison is shown in Figure 1c. Graphite flakes and MnS dispersoids, used as inoculants to enhance the nucleation of graphite [22], are observed in a pearlitic matrix showing a typical lamellar structure. The hardness values of TS coating and CI were measured on the polished cross-sections (Sa = 45 ± 5 nm) using a Vickers hardness tester (Buehler Micromet II) under an applied load of 0.49 N. TS coating had a hardness value of 370 ± 50 HV averaged from nine measurements compared with that of 235 ± 60 HV for the CI. A detailed study of mechanical properties and fracture mechanics of this type of TS steel coatings carried out using nano- and micro-indentation methods is presented in Ref [23].
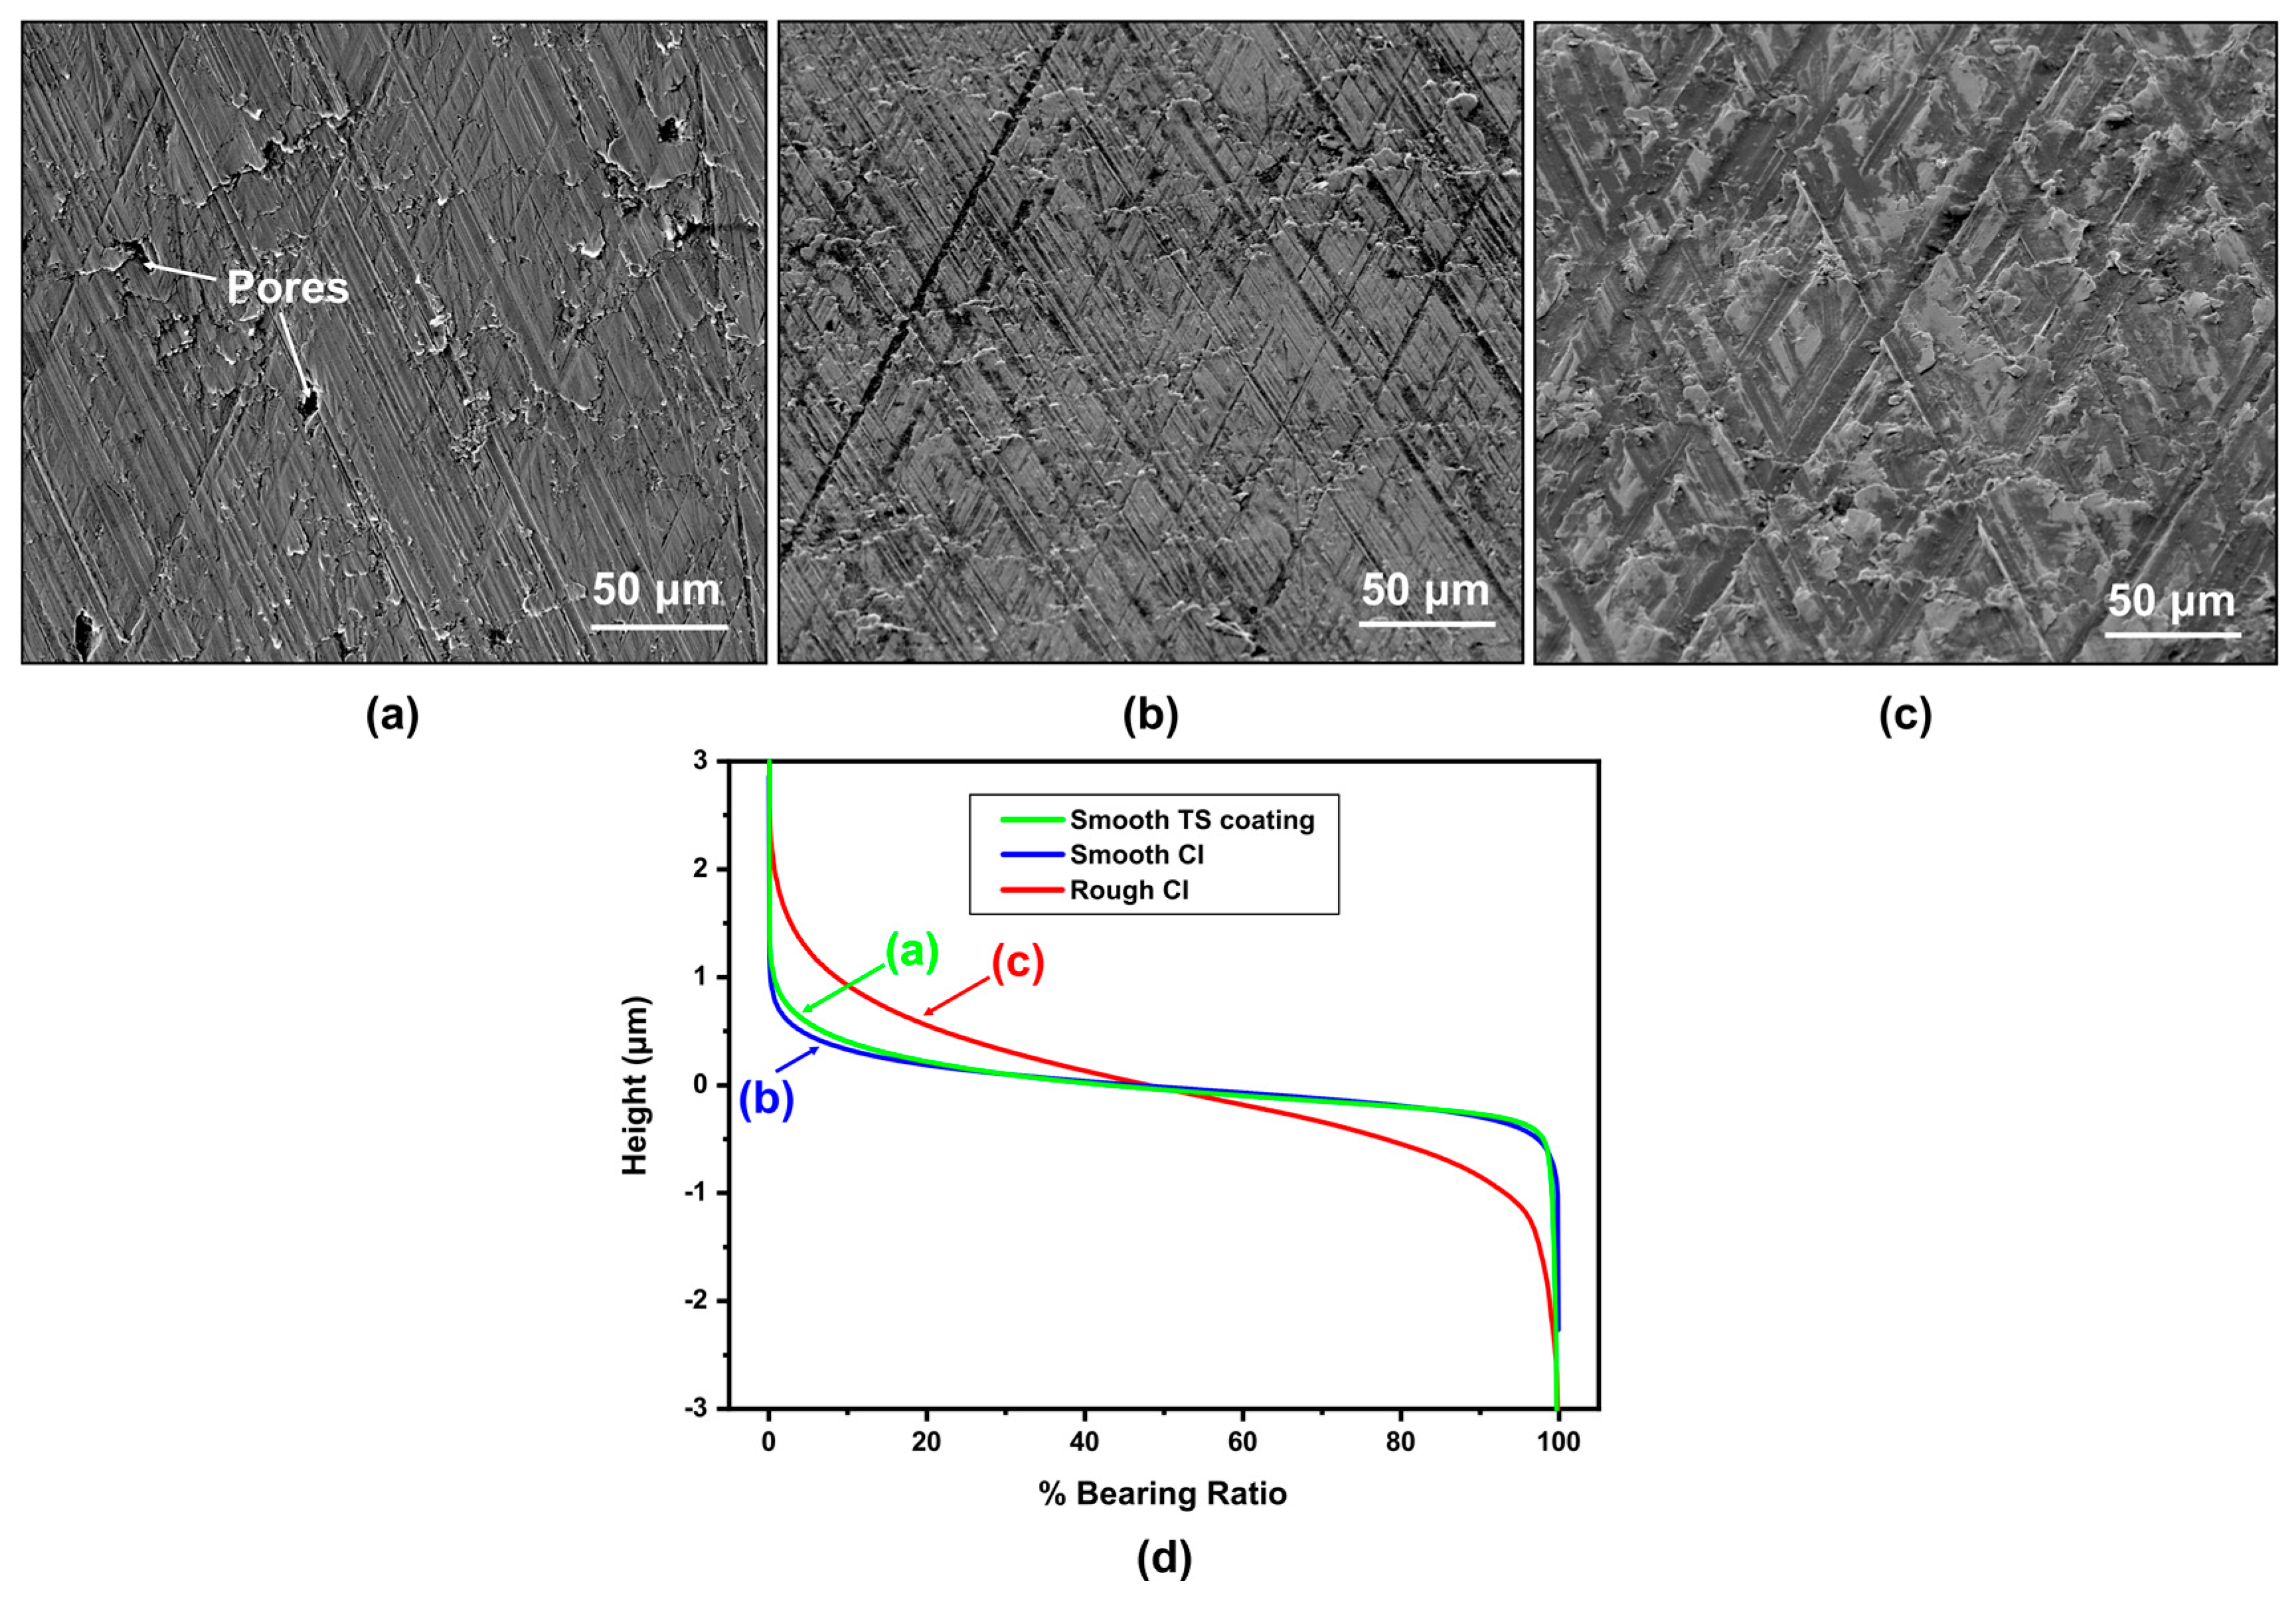
Honing patterns were generated on both TS coating and CI liner surfaces using cubic boron nitride (CBN) honing tools. Two types of honing processes, each resulting in a different roughness level were employed namely, the standard (rough) honing, and the smooth honing. Test samples subjected to the smooth honing are designated as smooth TS coating and smooth CI, while the CI liner that was subjected to the standard honing is designated as rough CI. Representative SE images of surface morphologies of smooth TS coating, smooth CI, and rough CI samples are shown in Figure 2a–c. All honed surfaces had crosshatched patterns that exhibited grooves extending in two directions with an angle of ~60° between them. The depth of grooves on the smooth TS coating and smooth CI surfaces varied in a range of 0.3–0.9 µm compared with 0.8–2.3 µm for the rough CI surfaces. The pores within the TS coating’s microstructure and on its surface are indicated in Figure 1b and Figure 2a.
The surface roughness parameters of the samples were measured from the 3D surface profiles taken using an optical profilometer (Wyko NT-1100) operated under the white light vertical-scanning interferometry (VSI) mode. The bearing ratio curves, known as the cumulative height distribution of sample surfaces, are shown in Figure 2d. The Sa values that were obtained by averaging nine measurements from areas similar to those shown in Figure 2a–c are listed in Table 1. The core-roughness depth (Sk), the reduced peak height (Spk), the reduced valley depth (Svk), and the material ratios (Smr1 and Smr2) as defined by ISO 25178 [24] are also listed in Table 1. It is worth noting that compared with the smooth CI (Svk = 283.7 ± 46.6 nm), the TS coating exhibited a higher Svk value (Svk = 613.9 ± 122.3 nm), although the same honing process was used on both samples. The higher value of Svk on TS coating surfaces was attributed to the presence of pores generated during the deposition process. To determine whether the pore size changed during sliding, the mean diameter of surface open pores was measured using surface profilometry and image analyses before and after the lubricated sliding tests.
2.2. Tribological Tests
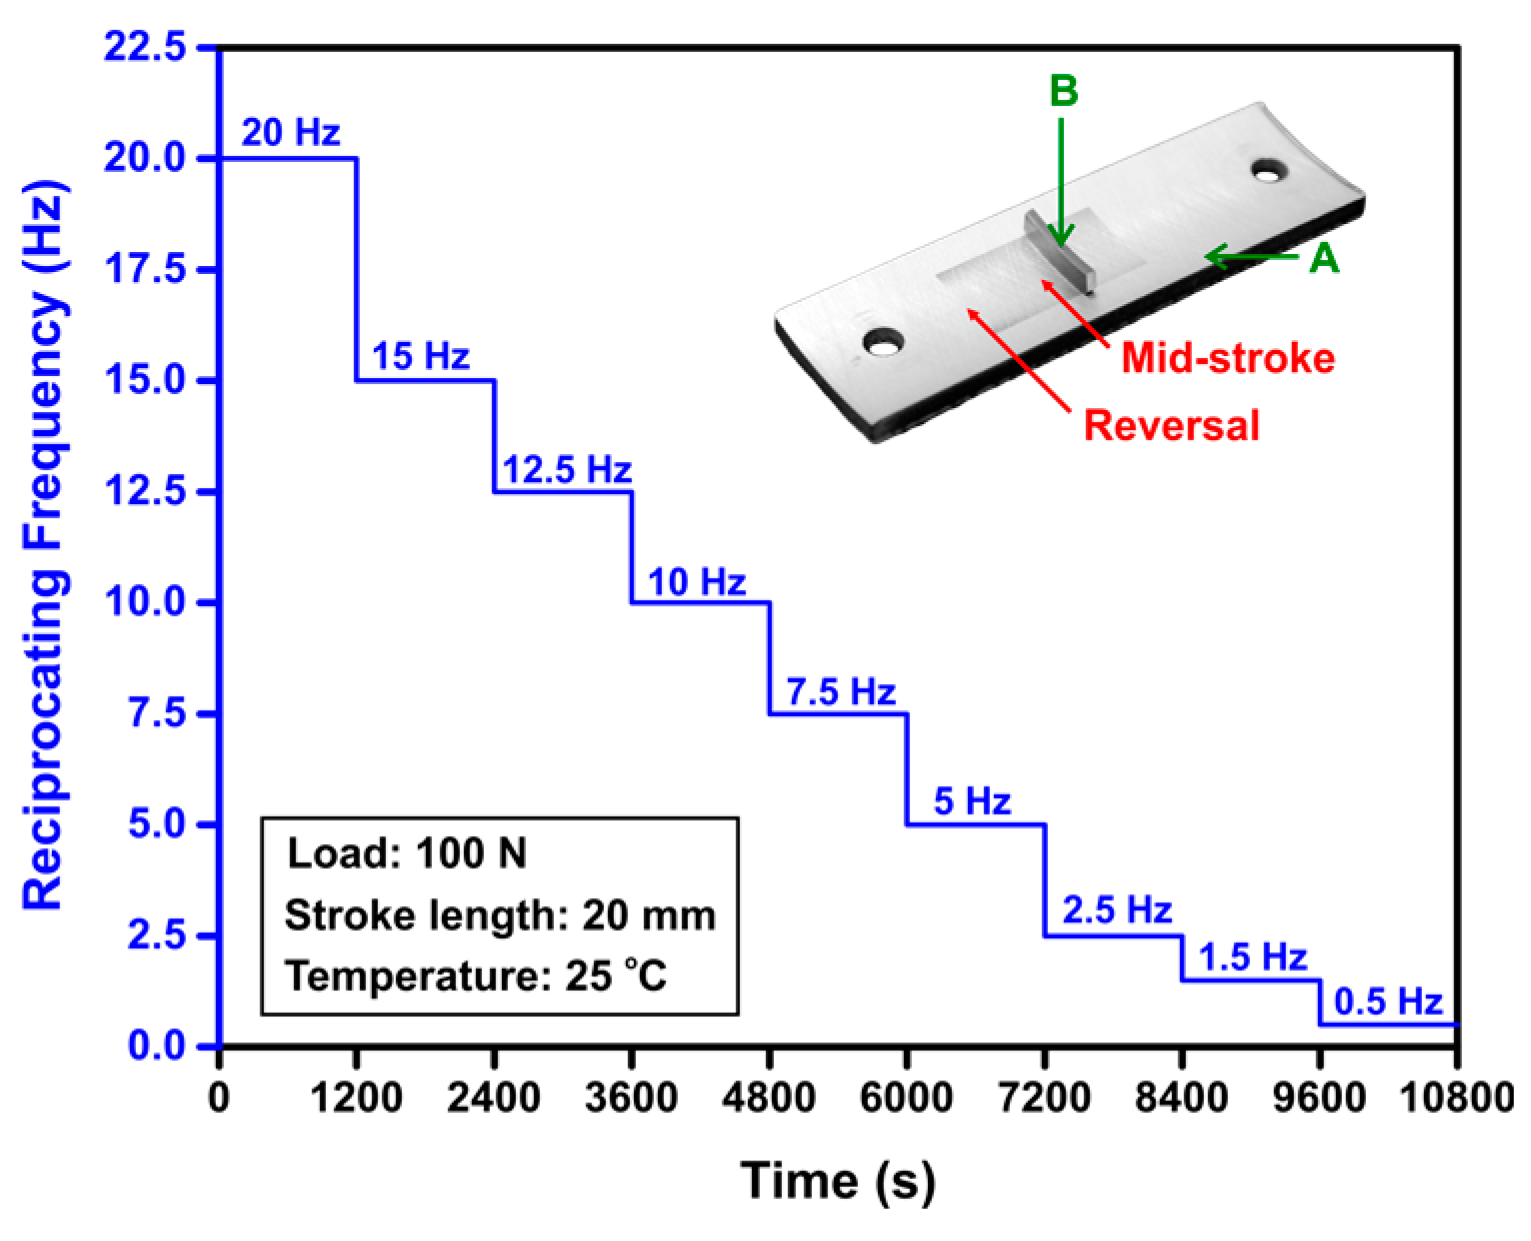
Sliding friction tests were conducted on smooth TS coating, smooth CI, and rough CI samples using a Cameron–Plint (TE 77) reciprocating tribometer at a constant load of 100 N corresponding to a contact pressure of 8.3 MPa. In selecting the applied load, the peak pressure experienced by the top compression ring (TCR) of a gasoline engine, which is typically around 10 MPa [25] was considered. A stroke length of 20 mm was used in the sliding tests conducted at 25 °C using a commercial engine oil SAE 5W30. The reciprocating frequency was reduced from 20 Hz to 0.5 Hz and produced mid-stroke sliding speeds varying from 1.20 m/s to 0.06 m/s. The method used for conducting sliding friction tests is described in Figure 3. A total of nine speed steps constituted a complete set of friction test where each speed step had a duration of 1200 s. 200 μL oil was applied to the surfaces of the samples prior to each test, and the same quantity of oil was added to the surfaces at the beginning of each constant speed step of the friction test. The oil temperature was continuously recorded using a K type thermocouple during the sliding friction tests, and the increase in oil temperature was found to be less than 2 °C. The purpose of stepwise decreasing the test speed was to gradually reduce the oil film thickness and accordingly the surface roughness of the bore/liner samples at the mid-stroke position as will be described in Section 3.2. The results were presented by plotting the mid-stroke COF as a function of the sliding speed. The lubrication regimes were demarcated by calculating the ratio (λ) of the minimum film thickness to the composite surface roughness of contact surfaces as indicated in Ref [13], and by plotting the COF variations for TS coating and CI samples against λ. The mid-stroke sliding speed was used for the estimation of oil film thickness, while the test samples’ surface roughness measured at the mid-stroke position after each test step was used for the calculation of composite surface roughness.
The counterfaces used were segments cut from an industry-standard CrN coated top compression ring, TCR, with an outer diameter of 74.0 mm and a thickness of 1.2 mm. The TCR segment with a cord length of about 10 mm and was put in contact with the test sample, as shown in the inset of Figure 3. Prior to the sliding tests, the counterface was clamped to the ring holder, while the test sample was fixed in the sample holder placed inside the lubricant reservoir using the two pin-holes shown in Figure 3. The ring holder was electrically isolated from the drive shaft and the sample holder on the Cameron-Plint tribometer and allowed a potential of about 50 mV to be applied across the contact using the Lunn–Furey electrical contact resistance circuit [26]. The instantaneous variation of the electrical contact potential between the sample and the counterface was recorded. The increase of contact potential was as an indicator of the formation of a sliding-induced non-conductive film (oil and oxide) on the contact surfaces [27]. The COF data was concurrently recorded at a frequency of 2000 Hz during the tests.
To characterize the wear behavior of TS coating and CI samples at different sliding speeds, sliding wear tests were conducted at three (mid-stroke) sliding speeds, namely at 1.20 m/s, 0.45 m/s and 0.06 m/s. The reciprocating frequencies were maintained at 20 Hz, 7.5 Hz and 0.5 Hz respectively to realize the designated speeds. The total test duration at each sliding speed was 3600 s, and the tests were briefly interrupted after every 1200 s to conduct wear measurements using the profilometry technique as described in Ref [28]. The volumetric wear loss at each sliding time was determined from the average of nine measurements taken at the mid-stroke region (10.0 mm × 1.2 mm) of the wear track. The wear coefficients (K) of TS coating and CI samples at different sliding speeds were calculated according to the Archard’s wear law [29]:
where W is the volume worn per unit sliding distance, L is the normal load, and H is the hardness.
The worn surface morphologies and the tribolayers that were formed on the contact surface during sliding were studied using a FEI Quanta 200 FEG SEM (Thermo Fisher Scientific, Hillsboro, OR, USA) equipped with an energy-dispersive X-ray EDAX (SiLi Detector) spectrometer operated at an acceleration voltage of 15 kV.
3. Results and Discussion
3.1. Friction Behavior of Thermal Spray Steel Coatings in Comparison with Cast Iron Liners
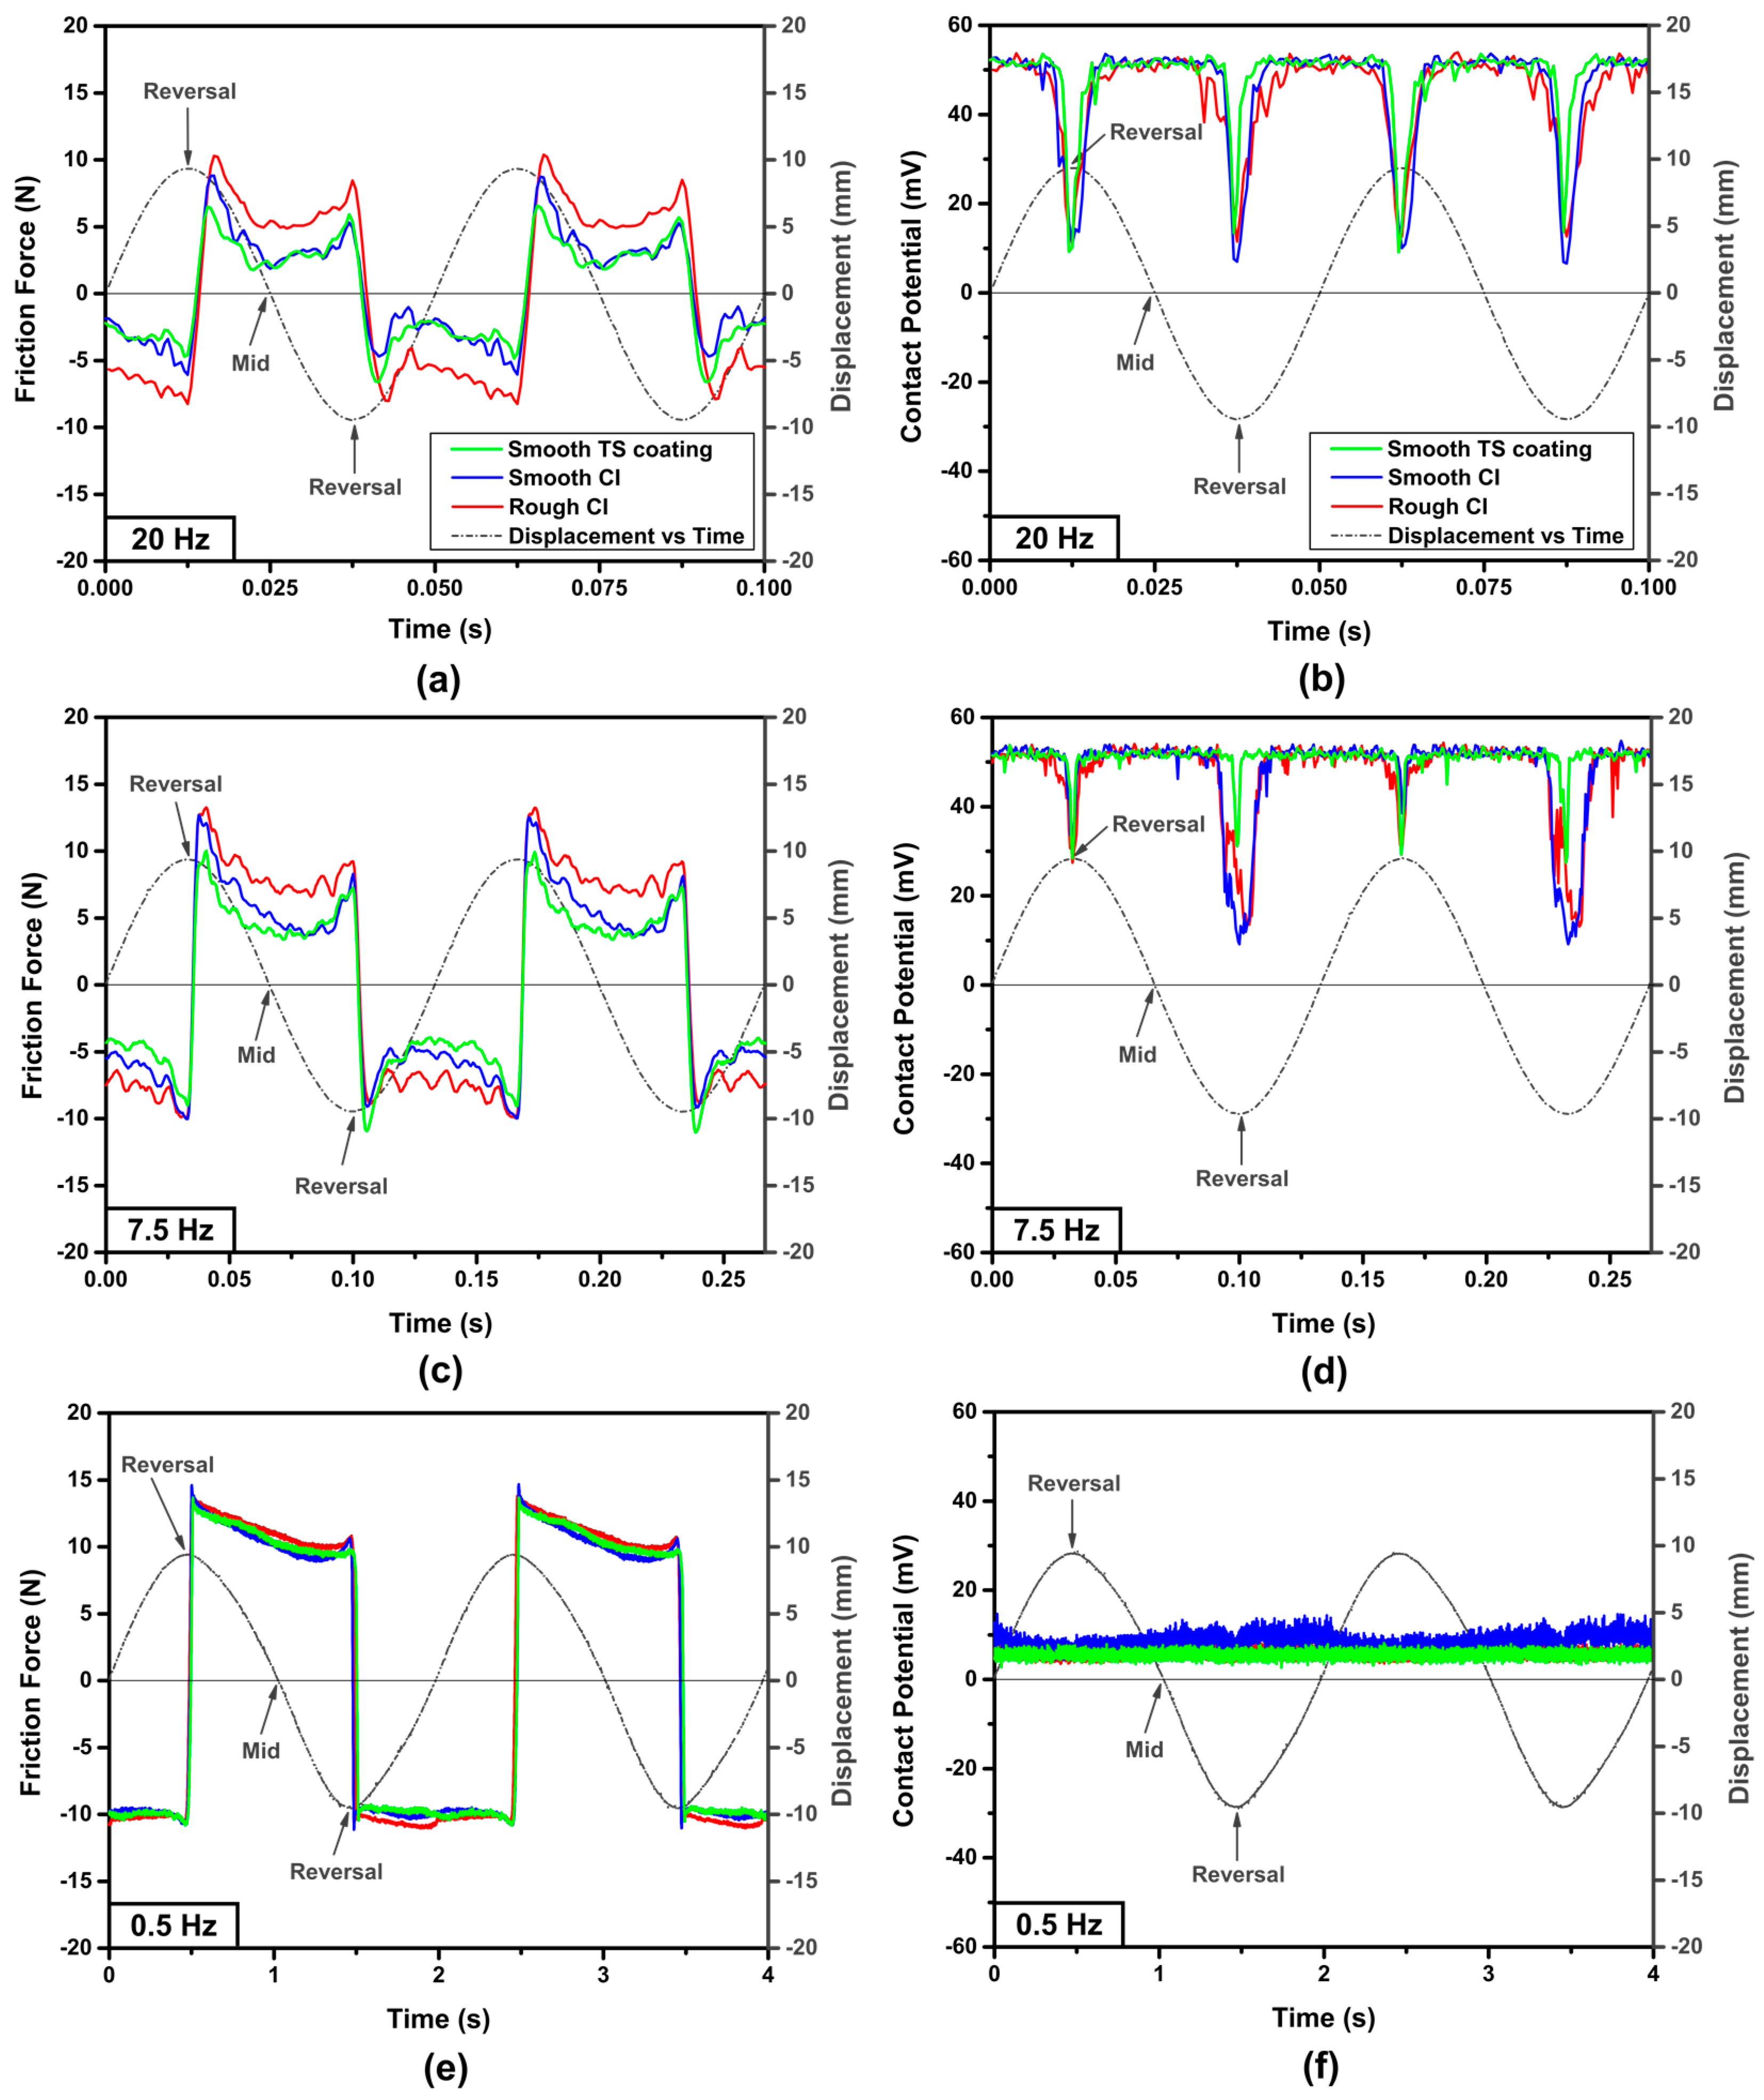
Typical variations of friction force as well as contact potential obtained at the reciprocating frequencies of 20 Hz, 7.5 Hz, and 0.5 Hz are shown in Figure 4a–f for two consecutive reciprocating cycles. The curves showing the ring displacement with the sliding time are included in each figure. One useful aspect of plotting the position of the counterface in these figures is to indicate the friction force and contact potential that corresponded to the mid-stroke position and the reversal positions at each cycle. By calculating the first derivatives of the displacement curves, the instantaneous sliding velocities were obtained. Accordingly, a mid-stroke speed of 1.20 m/s in Figure 4a,b (20 Hz), a mid-stroke speed of 0.45 m/s in Figure 4c,d (7.5 Hz), and a mid-stroke speed of 0.06 m/s in Figure 4e,f (0.5 Hz) were determined. The mid-stroke friction forces recorded during the sliding of the smooth TS coating sample were 2.3 N at 20 Hz (Figure 4a) and 4.4 N at 7.5 Hz (Figure 4c), which were lower than those of the smooth CI sample. In addition, the friction forces of rough CI sample were 4.7 N at 20 Hz (Figure 4a) and 7.9 N at 7.5 Hz (Figure 4c), which were higher compared with the smooth CI sample (and the smooth TS coating sample) tested at the same loading conditions. However, at a frequency of 0.5 Hz (Figure 4e), the mid-stroke friction force of rough CI sample was 10.8 N, similar to the values observed for the smooth CI (9.9 N) and the smooth TS coating (10.0 N) samples.
As the maximum sliding speed was reached at the mid-stroke position, a high contact potential of ~50 mV was observed, implying the possibility of formation of a thicker oil film at this position. Lower contact potentials of ~10 mV were observed at the reversal positions suggesting a breakdown of the oil film (Figure 4b,d). At the test step of 0.5 Hz, low contact potentials around 10 mV were observed at a constant level (Figure 4f), which would suggest formation of a thinner oil film compared to the tests at 7.5 Hz and 20 Hz (Figure 4b,d).
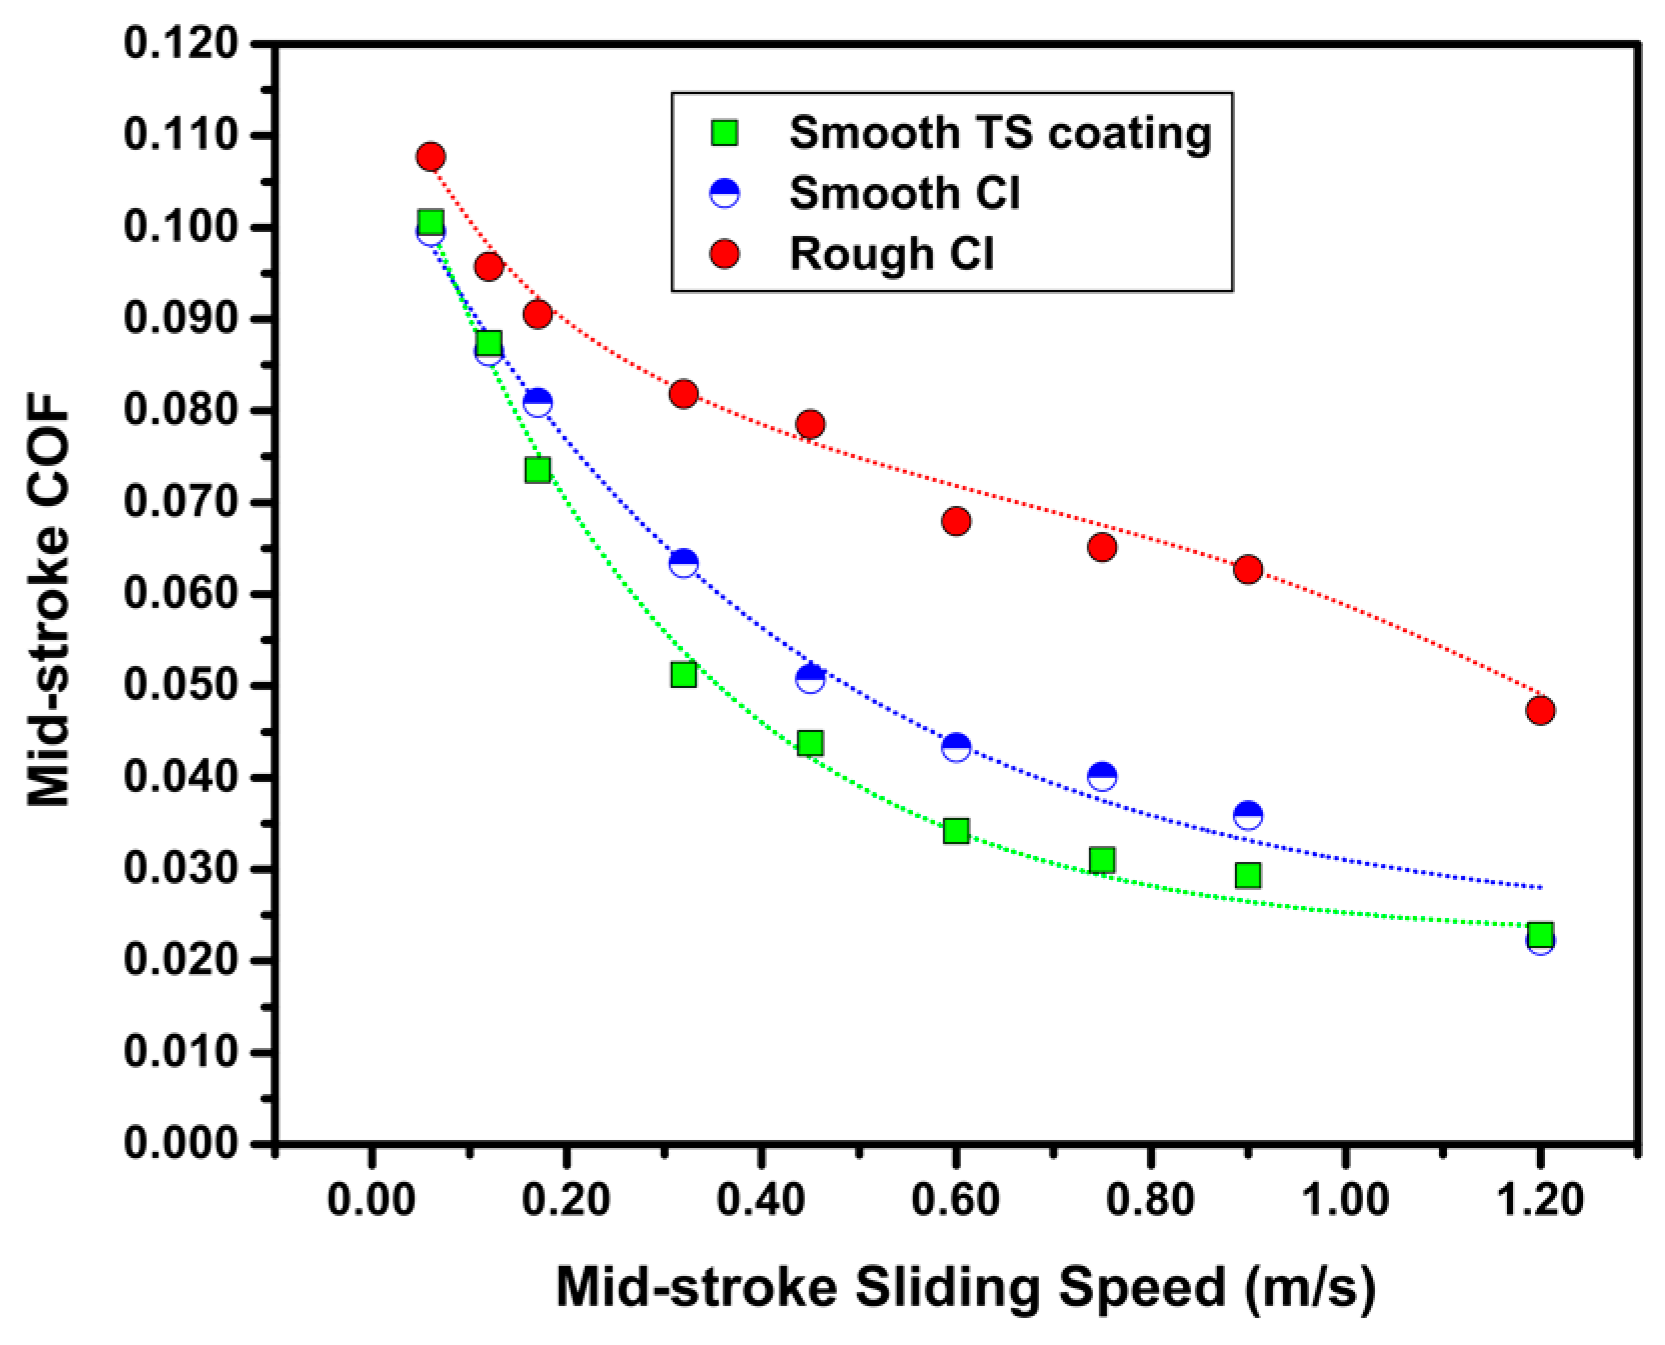
The variation of COF values calculated at the mid-stroke from the friction force data such as the ones shown in Figure 4a,c,e are shown in Figure 5 as a function of the instantaneous sliding speed at this location. The diagram indicates that the smooth-honed surfaces provided lower COF values in the entire range of sliding speed investigated. For the smooth TS coating sample, a COF value of 0.100 was obtained at a sliding speed of 0.06 m/s and a COF value of 0.023 at 1.20 m/s; whereas for the rough CI sample, a COF value of 0.108 at 0.06 m/s and a COF value of 0.047 at 1.20 m/s were obtained. More importantly, compared with the smooth CI sample, TS coating samples exhibited lower COF values at sliding speeds ≥0.20 m/s.
Another pertinent way of discussing the friction behavior of tested samples can be achieved by constructing Stribeck-type friction curves (Figure 6). The λ ratio would increase as a result of the increase of sliding speed and sometimes due to the sliding wear induced reduction of surface roughness. The Stribeck curves were constructed using the mid-stroke COF values plotted against the λ ratio calculated at the end of each test step again from the data obtained at the mid-stroke position. The different lubrication regimes can be demarcated with λ < 1 representing a boundary lubrication condition, 1 < λ < 3 indicating a mixed lubrication condition, and λ > 3 corresponding to an elastohydrodynamic lubrication (EHL) condition as shown in Figure 6. Examination of the Stribeck curves established for smooth TS coating, smooth CI and rough CI samples sliding against CrN-coated counterfaces shows that compared with rough CI sample, the smooth CI surfaces reduced the COF by 20–40% in the mixed lubrication regime and by 5–10% in the boundary lubrication regime. The smooth TS coatings, on the other hand, exhibited a reduction in COF by 10–20% in the mixed lubrication regime compared to the smooth CI sample. It is also noted that higher λ ratios were attained on the smooth-honed samples compared with the rough-honed samples at the same sliding speed. For example, a λ ratio of 3.2 for a smooth TS coating sample and a λ ratio of 3.3 for a smooth CI sample were obtained at a sliding speed of 1.20 m/s compared to a λ ratio of 2.7 for the rough CI sample. Thus, a transition from the mixed lubrication regime to the EHL regime occurred at a lower sliding speed on the smooth-honed surfaces. The friction reduction mechanisms will be further discussed by considering the surface properties of TS coating samples in Section 3.2.
3.2. Surface Roughness Evolution on Thermal Spray Steel Coatings and Cast Iron Liners
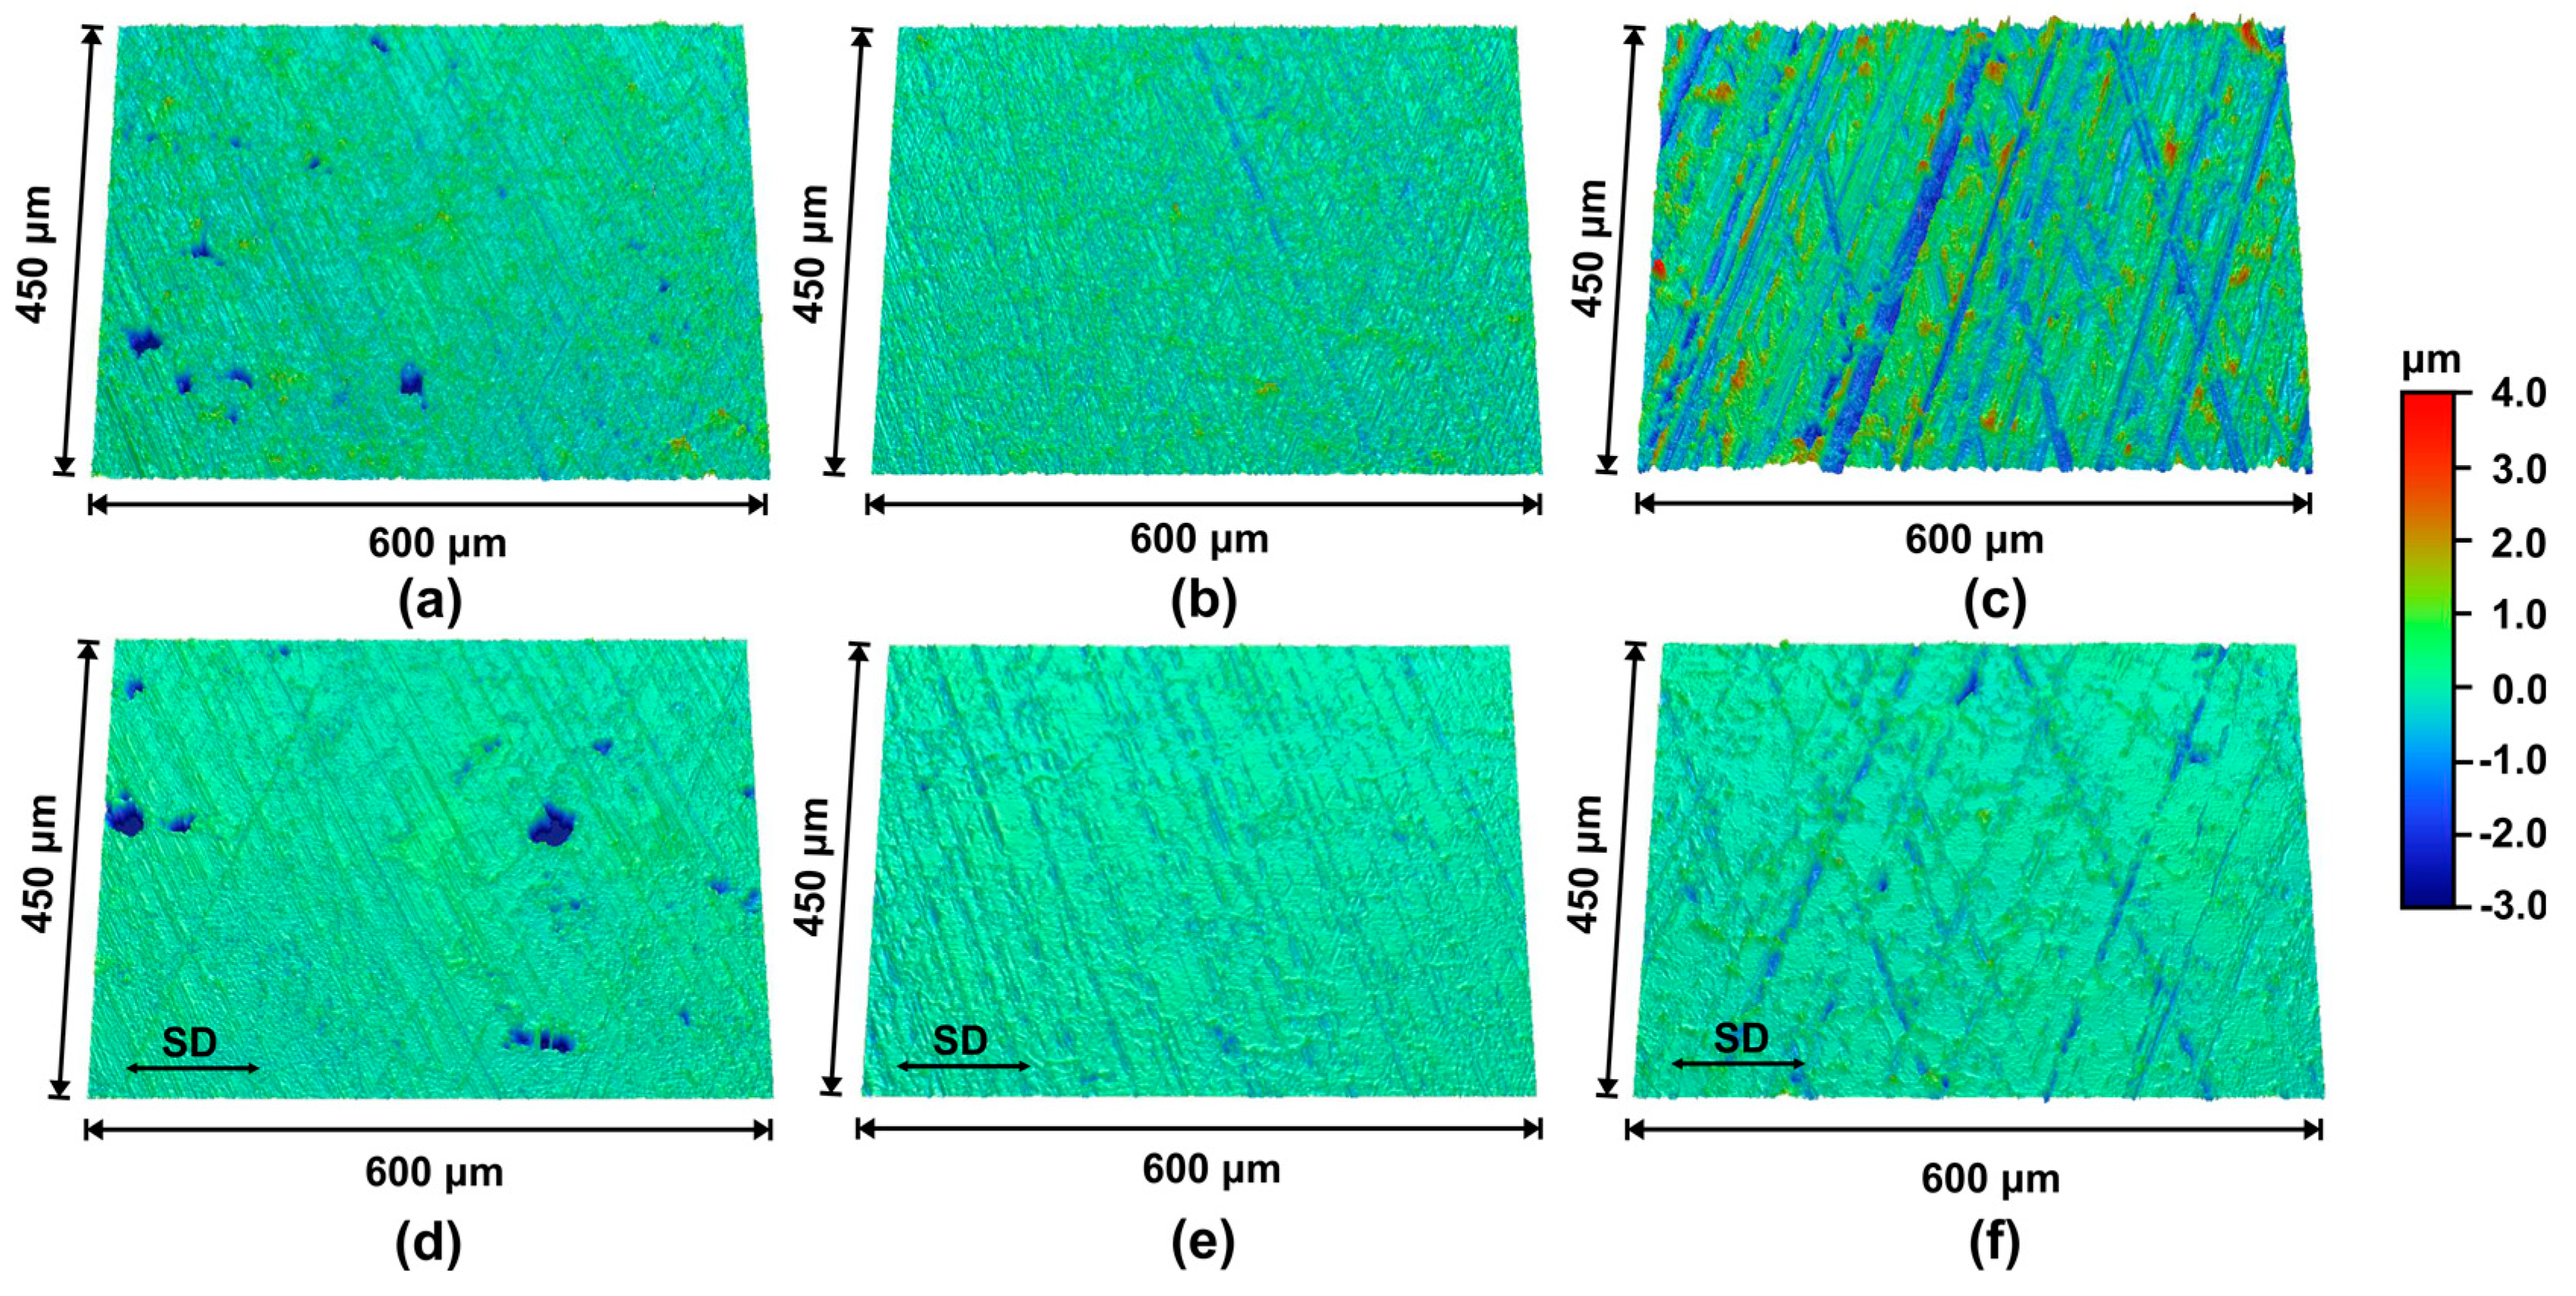
The 3D profilometry images showing the surface morphologies of samples prior to and after the completion of friction tests (at the reciprocating frequency of 0.5 Hz) are shown in Figure 7a–f. The TS coating sample, which initially had an average roughness (Sa) value of 210.4 ± 6.5 nm (Figure 7a), exhibited a decreased Sa value of 114.0 ± 18.8 nm (Figure 7d) after the friction test. The average depth of pores on the TS coating surface was measured as 3.2 ± 1.6 µm prior to the sliding test, and 3.5 ± 2.0 µm after the sliding test. Also, the mean diameter of these pores was measured as 7.4 ± 4.7 µm before the test, and 8.4 ± 6.0 µm after the test. The Sa of the smooth CI sample decreased from 199.0 ± 8.6 nm (Figure 7b) to 102.8 ± 5.9 nm (Figure 7e), and no surface pores were observed as expected. Sliding wear that occurred on the sample surfaces reduced the peak height of honing patterns, and accordingly, the surface roughness was reduced. The rough CI sample experienced a higher degree of wear compared with the smooth CI sample and the smooth TS coating sample, but the wear was still limited to the peaks of honing patterns. The Sa of the rough CI sample decreased from 536.2 ± 21.0 nm (Figure 7c) to 181.0 ± 31.1 nm (Figure 7f).
The wear coefficients of samples were determined at three specific sliding speeds as described in Section 2.2, and are listed in Table 2. Compared with a smooth CI sample, a smooth TS coating sample exhibited lower wear coefficients and accordingly higher wear resistance, especially at 0.06 m/s. Thus, a more gradual reduction in Sa could be expected for the smooth TS coating sample during the test steps corresponding to the boundary lubrication regime. Rough surfaces revealed higher wear coefficients at 1.20 m/s and 0.45 m/s, which would suggest a greater extent of asperity contact under the mixed lubrication regime. Consequently, a sharper decline in surface roughness could be experienced on the rough CI surfaces as the height difference between peaks and valleys was reduced as a result of sliding wear. The wear debris generated could affect the friction and wear behavior. However, the loading conditions applied to cylinder liner/bore material tribo-couples (including the rough CI sample) were selected such that sliding wear was operated under the ultra-mild wear conditions [28,30,31], which can be evident from the low wear coefficients listed in Table 2. As such, the effect of wear debris on lubricated sliding friction was negligible.
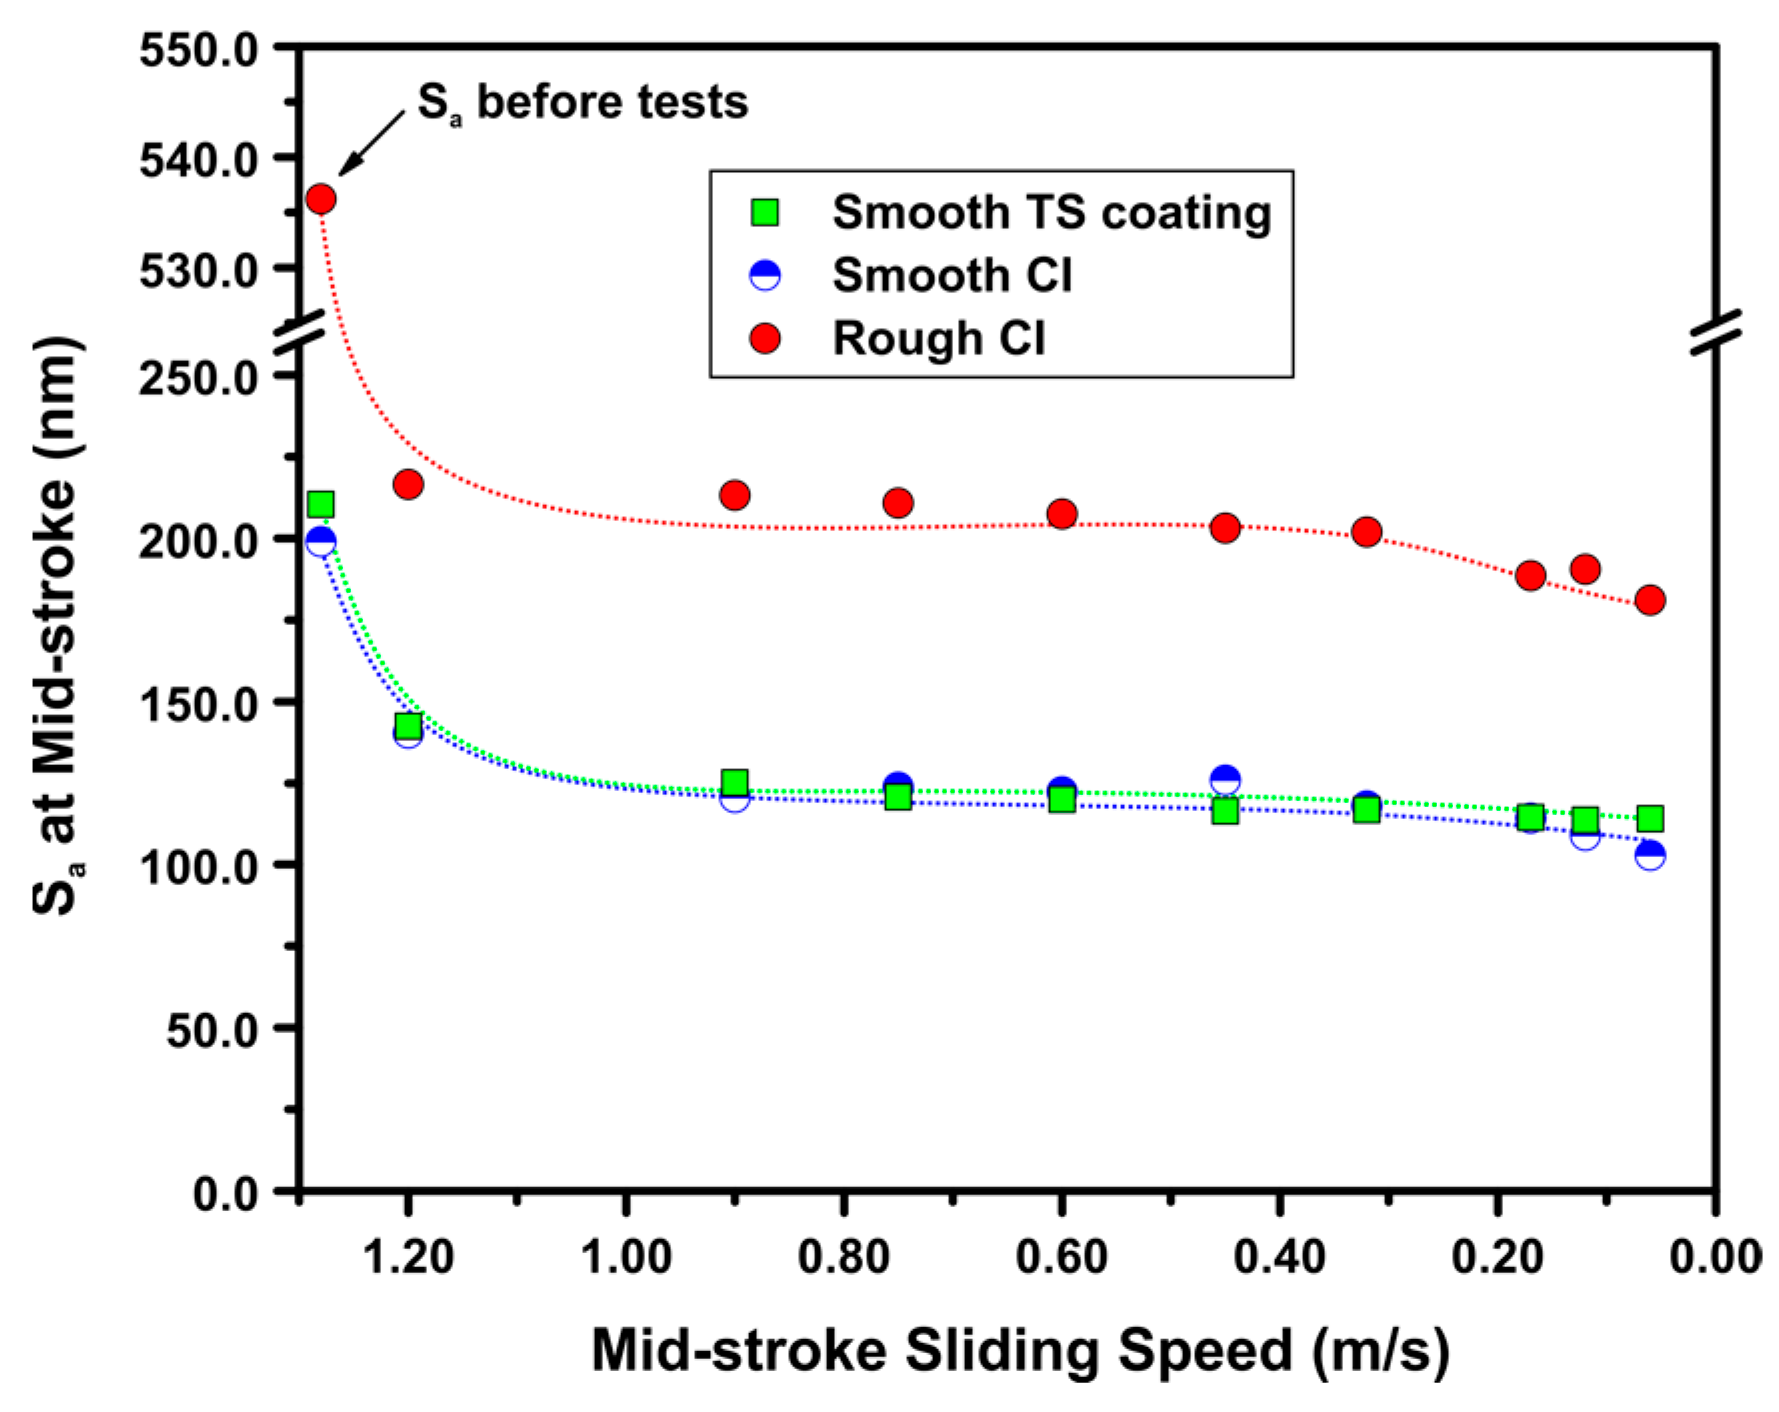
The change in the surface roughness on the test samples during stepwise friction tests is shown in Figure 8 by plotting Sa values against the mid-stroke sliding speed at each step of the test. For all the samples tested a sharp reduction in Sa was observed during the initial step (at a mid-stroke speed of 1.20 m/s) of the friction tests, then a plateau was reached at the intermediate test steps. The constant Sa region corresponded to a speed range between 0.90 m/s and 0.32 m/s. Another drop in Sa was noted after the mid-stroke speed decreased to 0.17 m/s, and this was due to the transition from the mixed lubrication to the boundary lubrication regime (Figure 6). It should be mentioned that the rough CI sample maintained the high Sa values throughout the entire friction tests, while the Sa levels of smooth CI and smooth TS coating samples were similar. Compared with the smooth CI sample, a higher degree of asperity contact, which was indicated by the higher surface roughness, was experienced on the rough CI sample surface during lubricated sliding under the mixed lubrication regime and contributed to those high COF values observed under this regime. Under the boundary lubrication regime, however, the breakdown of lubricating oil film, as suggested by the low levels of contact potential, led to extensive asperity contact on both the smooth and the rough CI samples; thus, the differences in COF values between these two samples shrunk.
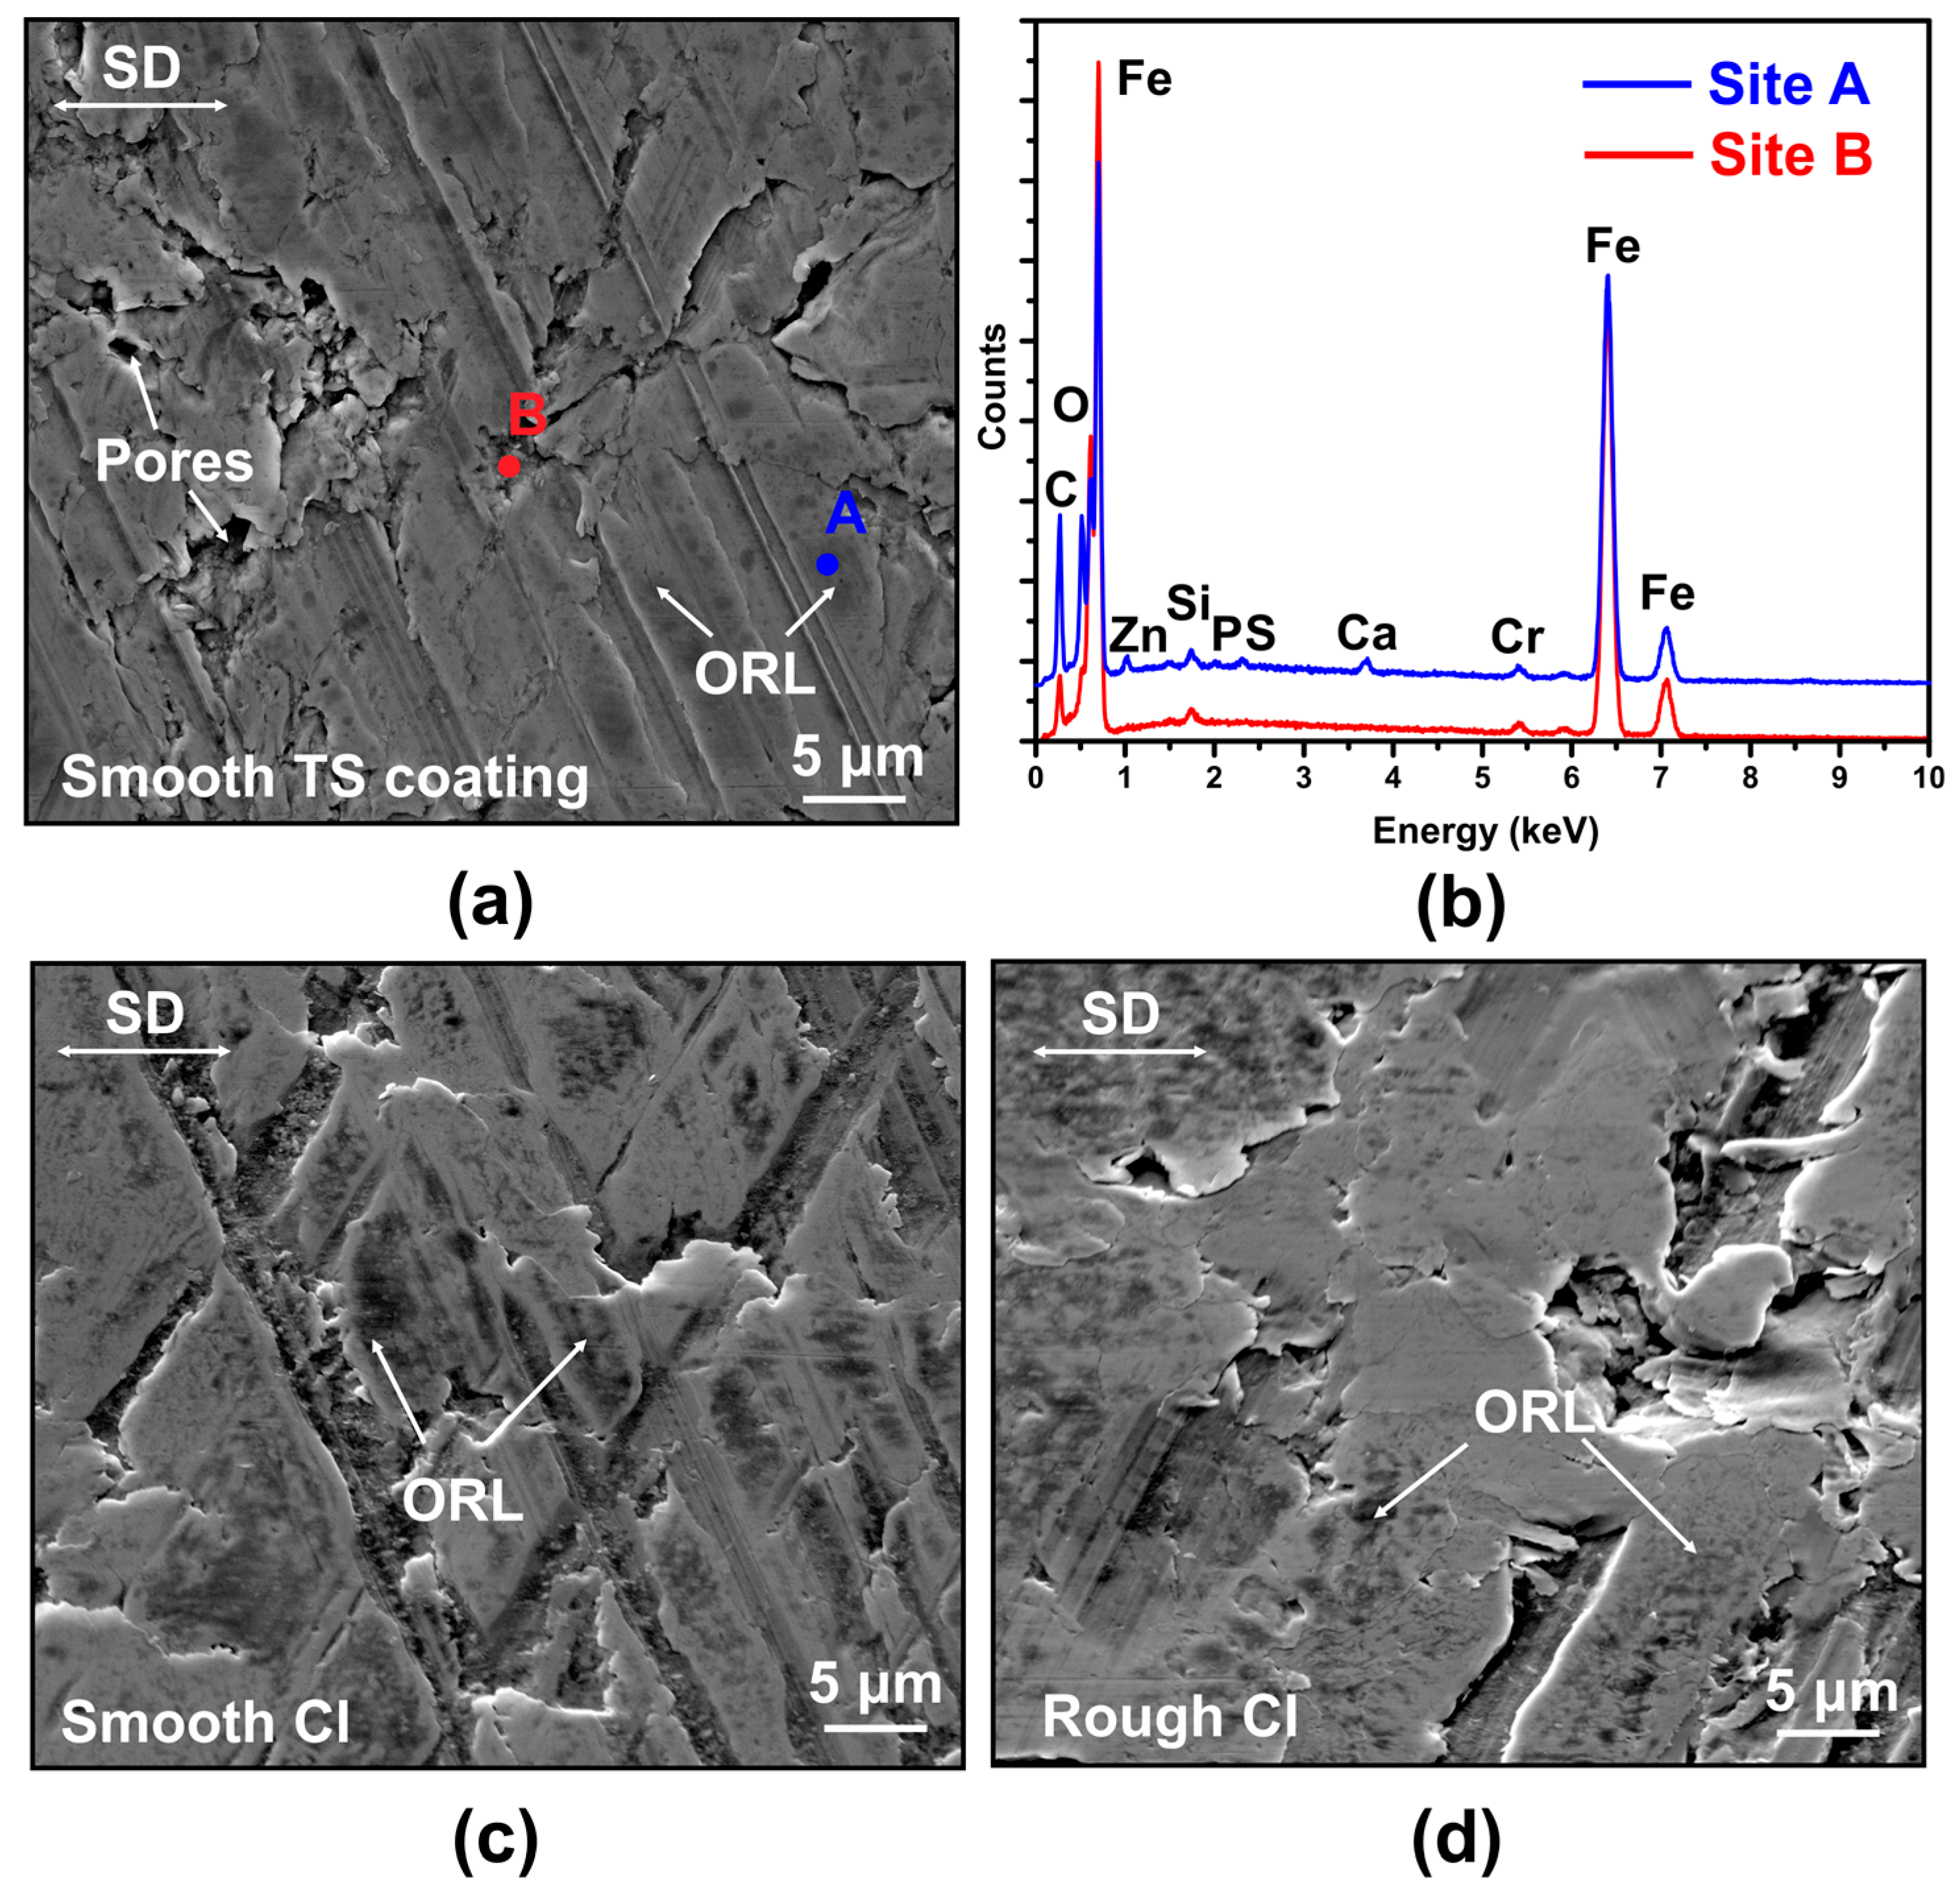
The secondary electron, SE, SEM image showing the morphology of the mid-stroke region of the wear track generated on the smooth TS coating sample as well as the corresponding energy-dispersive X-ray spectroscopy (EDS) analyses obtained from two specific locations after the sliding friction tests are shown in Figure 9a,b. The peaks of honing patterns on the TS coating sample were plastically deformed and flattened during the sliding contact with the counterface piston ring. It is also observed that tribolayers were formed, but these were not continuous, and they were in the form of isolated pockets dispersed within the contact areas. These tribolayers can also be referred to as oil residue layers (ORL) since they were generated as a result of sliding-induced decomposition of oil molecules (and zinc dialkyldithiophosphate, ZDDP) [32]. The elemental composition of ORL was revealed by the identification of the peaks that belonged to Zn, P, S and Ca in the EDS spectrum (Site A in Figure 9b), compared with the chemical compositions of the area where tribolayer was not formed that exhibited only Fe and O peaks (Site B in Figure 9b). The presence of P and S might suggest the incorporation of sulfide and phosphate particles in the ORL [13]. The SE images of the worn surfaces of smooth CI and rough CI samples after friction tests are shown in Figure 9c,d. Discontinuous tribolayers were also generated on both CI samples and had compositions similar to the ones formed on the TS coating sample. In summary, examination of the worn surfaces of all the test samples revealed tribolayers with similar morphology and composition. The low friction behavior of the TS coating sample will be further discussed by considering the effect of surface pores.
An important factor that should be taken into account in interpreting the variations in friction properties would be the oil retention capability of bore/liner surfaces. For the lubricated surfaces consisting of peaks and valleys with different depths, the volume of oil (Voil) retained in the valleys could be estimated using the following equation [33]:
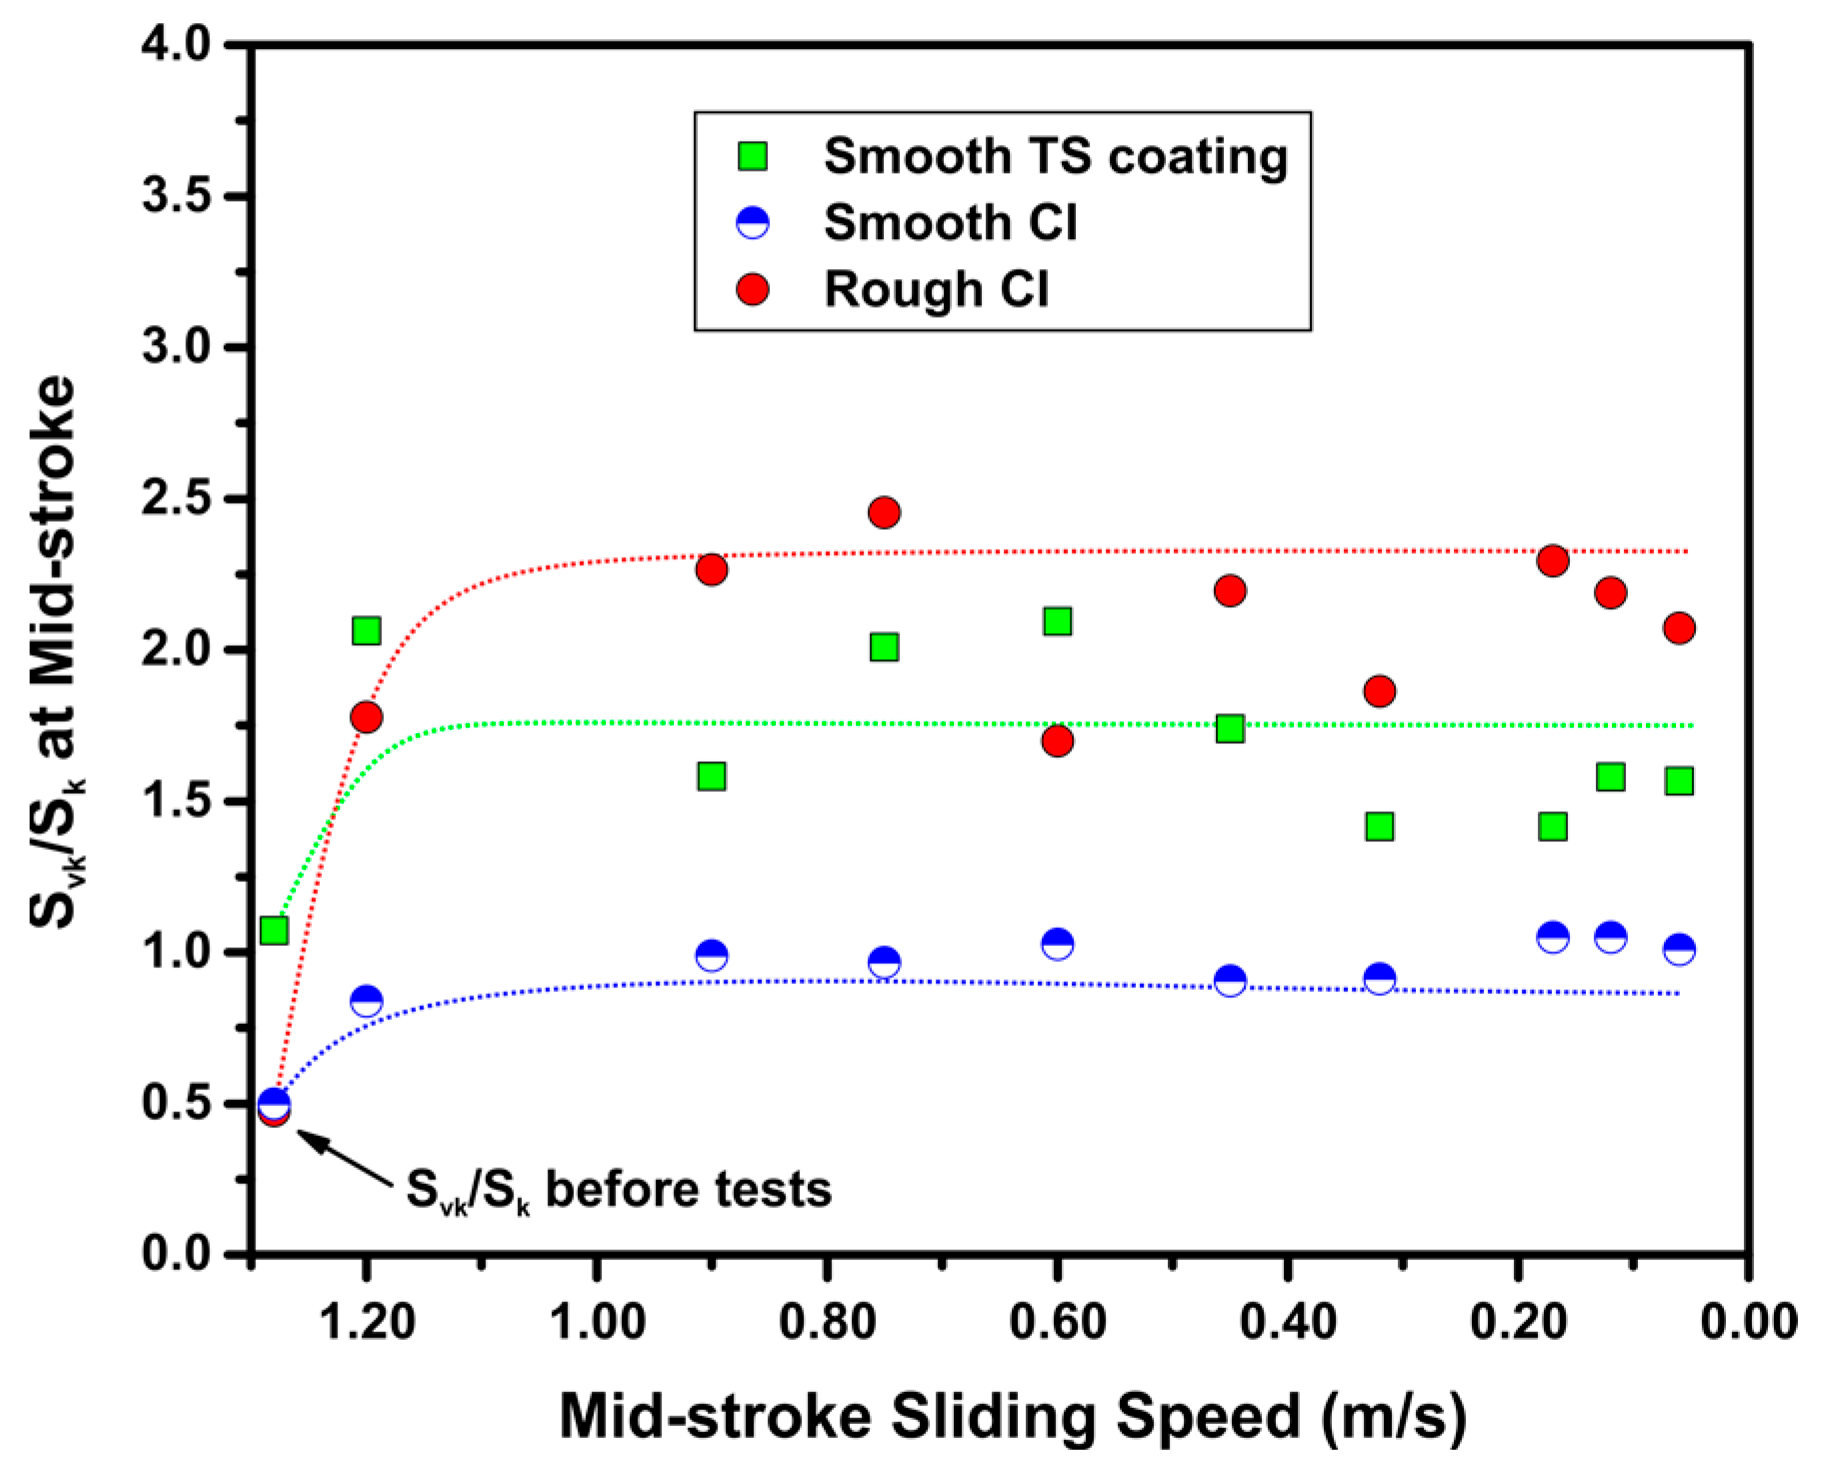
where Smr2 is the material ratio, and Svk is the reduced valley depth, which indicates the depth of the area in which fluid applied to the surface accumulates. Voil has the same units as Svk and designates the retained oil volume per unit surface area. Based on this relationship between Svk and Voil, a dimensionless parameter, Svk/Sk, could be developed to indicate the oil retention capability of a surface [34]. This parameter is referred to as the oil retention depth ratio. The oil retention depth ratios (Svk/Sk) of different contact surfaces were measured at the mid-stroke position at each sliding speed step of the friction tests. The relationship between Svk/Sk and sliding speed is shown in Figure 10. It can be observed that for all the samples tested, an increase in Svk/Sk was recorded during the initial sliding, followed by the stabilization of Svk/Sk as the tests progressed. The high value of Svk/Sk on the rough CI sample was expected as deeper honing grooves on this sample could retain a larger volume of oil [35]. However, the friction reduction effect induced by the high oil retention capability of rough CI surfaces was concealed by the high degree of asperity contact. It is also interesting to note that the TS coating sample exhibited higher oil retention capability compared to the smooth CI sample (with comparable Sa level) after the sliding tests. One possible interpretation is that the surface pores observed on TS coatings would increase the Svk. Consequently, it could be suggested that the pores, which are essentially considered as manufacturing defects, would act as additional oil reservoirs during lubricated sliding. This enhanced oil retention capability could potentially be an important factor for achieving a reduced COF of TS coated surfaces operating especially under the mixed lubrication regime [18,19,20].
4. Summary and Conclusions
The friction properties of TS coating samples were studied in comparison with CI liner samples honed to the same level of surface roughness by plotting Stribeck curves that depicted the COF variations with the λ ratio of lubricant film thickness to composite surface roughness at the mid-stroke position of the samples where sliding speeds and surface roughnesses were measured.
Examination of Stribeck curves has shown that the smooth CI surface (Sa = 199.0 ± 8.6 nm) reduced the COF by 20–40% in the mixed lubrication regime and by 5–10% in the boundary lubrication regime compared with the CI sample subjected to conventional honing resulting in a rougher surface (Sa = 536.2 ± 21.0 nm). The use of smooth TS coatings (Sa = 210.4 ± 6.5 nm) brought about a further friction reduction of 10–20% in the mixed lubrication regime compared with the smooth CI sample.
The oil retention depth ratio (Svk/Sk) of the TS coating surface was about 65% higher than that measured for the smooth CI surface. The open pores on the TS coating surface would enhance its oil retention capability during lubricated sliding, and the improved oil retention capability of smooth TS coating would be responsible for the friction reduction particularly under the mixed lubrication regime.
Thus from the tribological point of view, the pores generated during the thermal spray process, which are regarded as metallurgical defects as they may negatively influence the mechanical properties of coatings, can play a beneficial role in improving oil retention capability and reducing lubricated sliding coefficient of friction.
Author Contributions
Conceptualization, M.L. and A.T.A.; methodology, M.L.; investigation, M.L.; writing—original draft preparation, M.L.; writing—review and editing, M.L. and A.T.A.; supervision, A.T.A.; project administration, A.T.A.; funding acquisition, A.T.A. All authors have read and agreed to the published version of the manuscript.
Funding
This research was funded by the Natural Sciences and Engineering Research Council of Canada (NSERC) and General Motors Co. (GM).
Conflicts of Interest
The authors declare no conflict of interest.
References
- Bobzin, K.; Ernst, F.; Richardt, K.; Schlaefer, T.; Verpoort, C.; Flores, G. Thermal Spraying of Cylinder Bores with the Plasma Transferred Wire Arc Process. Surf. Coat. Technol. 2008, 202, 4438–4443. [Google Scholar] [CrossRef]
- Gand, B. Coating for Cylinder Surfaces in Aluminium Engine Blocks. MTZ Worldw. 2011, 72, 34–39. [Google Scholar] [CrossRef]
- Cole, G.S.; Sherman, A.M. Light Weight Materials for Automotive Applications. Mater. Charact. 1995, 35, 3–9. [Google Scholar] [CrossRef]
- Bobzin, K.; Ernst, F.; Zwick, J.; Schlaefer, T.; Cook, D.; Nassenstein, K.; Schwenk, A.; Schreiber, F.; Wenz, T.; Flores, G.; et al. Coating Bores of Light Metal Engine Blocks with A Nanocomposite Material Using the Plasma Transferred Wire Arc Thermal Spray Process. J. Therm. Spray Technol. 2008, 17, 344–351. [Google Scholar] [CrossRef]
- Deshpande, S.; Kulkarni, A.; Sampath, S.; Herman, H. Application of Image Analysis for Characterization of Porosity in Thermal Spray Coatings and Correlation with Small Angle Neutron Scattering. Surf. Coat. Technol. 2004, 187, 6–16. [Google Scholar] [CrossRef]
- Priest, M.; Taylor, C.M. Automotive Engine Tribology–Approaching the Surface. Wear 2000, 241, 193–203. [Google Scholar] [CrossRef]
- Jocsak, J. The Effect of Surface Finish on Piston Ring-Pack Performance in Advanced Reciprocating Engine Systems. Master’s Thesis, Massachusetts Institute of Technology, Cambridge, MA, USA, 2005. [Google Scholar]
- Morawitz, U.; Mehring, J.; Schramm, L. Benefits of Thermal Spray Coatings in Internal Combustion Engines, with Specific View on Friction Reduction and Thermal Management; SAE Technical Paper 2013-01-0292; SAE International: Warrendale, PA, USA, 2013. [Google Scholar]
- Barber, G.C.; Lee, J.C.; Ludema, K.C. Materials and Surface Finish Effects in the Breaking-In Process of Engines. J. Eng. Gas Turb. Power 1987, 109, 380–387. [Google Scholar] [CrossRef]
- Rao, V.D.N.; Kabat, D.M.; Cikanek, H.A.; Fucinari, C.A.; Wuest, G. Materials Systems for Cylinder Bore Applications-Plasma Spray Technology; SAE Technical Paper 970023; SAE International: Warrendale, PA, USA, 1997. [Google Scholar]
- Ma, S.; Liu, Y.; Wang, Z.; Wang, Z.; Huang, R.; Xu, J. The Effect of Honing Angle and Roughness Height on the Tribological Performance of CuNiCr Iron Liner. Metals 2019, 9, 487. [Google Scholar] [CrossRef] [Green Version]
- Emmens, W.C. Tribology of Flat Contacts and Its Application in Deep Drawing. Ph.D. Thesis, University of Twente, Enschede, The Netherlands, 1997. [Google Scholar]
- Lou, M.; White, D.R.; Banerji, A.; Alpas, A.T. Dry and Lubricated Friction Behaviour of Thermal Spray Low Carbon Steel Coatings: Effect of Oxidational Wear. Wear 2019, 432, 102921. [Google Scholar] [CrossRef]
- Johansson, S.; Frennfelt, C.; Killinger, A.; Nilsson, P.H.; Ohlsson, R.; Rosén, B.G. Frictional Evaluation of Thermally Sprayed Coatings Applied on the Cylinder Liner of A Heavy Duty Diesel Engine: Pilot Tribometer Analysis and Full Scale Engine Test. Wear 2011, 273, 82–92. [Google Scholar] [CrossRef]
- Ernst, P.; Distler, B. Optimizing the Cylinder Running Surface/Piston System of Internal Combustion Engines towards Lower Emissions; SAE Technical Paper 2012-32-0092; SAE International: Warrendale, PA, USA, 2012. [Google Scholar]
- Schommers, J.; Scheib, H.; Hartweg, M.; Bosler, A. Minimising Friction in Combustion Engines. MTZ Worldw. 2013, 74, 28–35. [Google Scholar] [CrossRef]
- Barbezat, G. Advanced Thermal Spray Technology and Coating for Lightweight Engine Blocks for the Automotive Industry. Surf. Coat. Technol. 2005, 200, 1990–1993. [Google Scholar] [CrossRef]
- Rosenkranz, A.; Szurdak, A.; Gachot, C.; Hirt, G.; Mücklich, F. Friction Reduction under Mixed and Full Film EHL Induced by Hot Micro-Coined Surface Patterns. Tribol. Int. 2016, 95, 290–297. [Google Scholar] [CrossRef]
- Grützmacher, P.G.; Rosenkranz, A.; Szurdak, A.; König, F.; Jacobs, G.; Hirt, G.; Mücklich, F. From Lab to Application-Improved Frictional Performance of Journal Bearings Induced by Single- and Multi-Scale Surface Patterns. Tribol. Int. 2018, 127, 500–508. [Google Scholar] [CrossRef]
- Kovalchenko, A.; Ajayi, O.; Erdemir, A.; Fenske, G.; Etsion, I. The Effect of Laser Surface Texturing on Transitions in Lubrication Regimes during Unidirectional Sliding Contact. Tribol. Int. 2005, 38, 219–225. [Google Scholar] [CrossRef]
- Banerji, A.; Lukitsch, M.J.; McClory, B.; White, D.R.; Alpas, A.T. Effect of Iron Oxides on Sliding Friction of Thermally Sprayed 1010 Steel Coated Cylinder Bores. Wear 2017, 376, 858–868. [Google Scholar] [CrossRef]
- Muhmond, H.M.; Fredriksson, H. Relationship between Inoculants and the Morphologies of MnS and Graphite in Gray Cast Iron. Metall. Mater. Trans. B 2013, 44, 283–298. [Google Scholar] [CrossRef] [Green Version]
- Sun, G.; Bhattacharya, S.; White, D.R.; McClory, B.; Alpas, A.T. Indentation Fracture Behavior of Low Carbon Steel Thermal Spray Coatings: Role of Dry Sliding-Induced Tribolayer. J. Therm. Spray Technol. 2018, 27, 1602–1614. [Google Scholar] [CrossRef]
- Geometrical Product Specifications (GPS)—Surface Texture: Areal—Part 2: Terms, Definitions and Surface Texture Parameters; ISO 25178-25172; International Organization for Standardization: Geneva, Switzerland, 2012.
- Obert, P.; Müller, T.; Füßer, H.J.; Bartel, D. The Influence of Oil Supply and Cylinder Liner Temperature on Friction, Wear and Scuffing Behavior of Piston Ring Cylinder Liner Contacts-A New Model Test. Tribol. Int. 2016, 94, 306–314. [Google Scholar] [CrossRef]
- Furey, M.J. Metallic Contact and Friction between Sliding Surfaces. ASLE Trans. 1961, 4, 1–11. [Google Scholar] [CrossRef]
- Kamps, T.; Walker, J.; Wood, R.; Lee, P.; Plint, A. Reciprocating Automotive Engine Scuffing Using A Lubricated Reciprocating Contact. Wear 2015, 332, 1193–1199. [Google Scholar] [CrossRef]
- Chen, M.; Meng-Burany, X.; Perry, T.A.; Alpas, A.T. Micromechanisms and Mechanics of Ultra-mild Wear in Al–Si Alloys. Acta Mater. 2008, 56, 5605–5616. [Google Scholar] [CrossRef]
- Archard, J.F.; Hirst, W. The Wear of Metals under Unlubricated Conditions. Proc. R. Soc. Lond. Ser. A Math. Phys. Sci. 1956, 236. [Google Scholar] [CrossRef]
- Schneider, E.W.; Blossfeld, D.H. Effect of Break-in and Operating Conditions on Piston Ring and Cylinder Bore Wear in Spark-ignition Engines; SAE Technical Paper 2004-01-2917; SAE International: Warrendale, PA, USA, 2004. [Google Scholar]
- Dienwiebel, M.; Pöhlmann, K.; Scherge, M. Origins of The Wear Resistance of AlSi Cylinder Bore Surfaces Studies by Surface Analytical Tools. Tribol. Int. 2007, 40, 1597–1602. [Google Scholar] [CrossRef]
- Banerji, A.; Lukitsch, M.J.; Alpas, A.T. Friction Reduction Mechanisms in Cast Iron Sliding against DLC: Effect of Biofuel (E85) Diluted Engine Oil. Wear 2016, 368, 196–209. [Google Scholar] [CrossRef]
- Blunt, L.; Jiang, X. Advanced Techniques for Assessment Surface Topography: Development of A Basis for 3D Surface Texture Standards; Kogan Page Science: London, UK, 2003. [Google Scholar]
- Ushijima, K.; Nanbu, T.; Chiba, N.; Watanabe, J. Toroidal-Type Continuously Variable Transmission for Automobiles. U.S. Patent No. 6,524,212, 25 February 2003. [Google Scholar]
- Grabon, W.; Pawlus, P.; Koszela, W.; Reizer, R. Proposals of Methods of Oil Capacity Calculation. Tribol. Int. 2014, 75, 117–122. [Google Scholar] [CrossRef]
Figure 1.
(a) Backscattered electron (BSE) image of the cross-section of thermal spray (TS) steel coated bore sample showing the dovetail shape interlocks between the TS coating and the A380 bore along the longitudinal direction of engine cylinders. (b) Cross-sectional BSE image of TS coating sample, and (c) cross-sectional secondary electron (SE) image of grey cast iron (CI) sample.

Figure 2.
Representative SE images showing the honed surface morphologies of (a) smooth TS coating sample, (b) smooth CI sample and (c) rough CI sample. (d) Bearing ratio curves based on initial surface roughness parameters for the samples tested.
Figure 2.
Representative SE images showing the honed surface morphologies of (a) smooth TS coating sample, (b) smooth CI sample and (c) rough CI sample. (d) Bearing ratio curves based on initial surface roughness parameters for the samples tested.

Figure 3.
Sliding friction test method used for smooth TS coating sample, smooth CI sample, and rough CI sample sliding against counterfaces made of CrN-coated top compression ring (TCR) segment with the reciprocating frequency decreasing stepwise from 20 Hz to 0.5 Hz. The tests were conducted at 100 N using SAE 5W30. The inset shows the typical morphology of the wear track that was formed on the test samples placed to the Cameron–Plint tribometer during the friction tests where A is the test sample (smooth TS coating, smooth CI, rough CI), and B is the counterface. The wear track dimensions were approximately 20 mm in length and 10 mm in width.

Figure 4.
Variations of friction forces and contact potentials in two consecutive reciprocating cycles at reciprocating frequencies of (a,b) 20 Hz, (c,d) 7.5 Hz and (e,f) 0.5 Hz for smooth TS coating sample, smooth CI sample and rough CI sample against CrN-coated TCR at 100 N using SAE 5W30.
Figure 4.
Variations of friction forces and contact potentials in two consecutive reciprocating cycles at reciprocating frequencies of (a,b) 20 Hz, (c,d) 7.5 Hz and (e,f) 0.5 Hz for smooth TS coating sample, smooth CI sample and rough CI sample against CrN-coated TCR at 100 N using SAE 5W30.

Figure 5.
Mid-stroke coefficient of friction (COF) plotted against mid-stroke sliding speed for smooth TS coating sample, smooth CI sample, and rough CI sample sliding against CrN-coated TCR at 100 N using SAE 5W30.
Figure 5.
Mid-stroke coefficient of friction (COF) plotted against mid-stroke sliding speed for smooth TS coating sample, smooth CI sample, and rough CI sample sliding against CrN-coated TCR at 100 N using SAE 5W30.

Figure 6.
Mid-stroke COF plotted against λ ratio at mid-stroke for smooth TS coating sample, smooth CI sample, and rough CI sample sliding against CrN-coated TCR at 100 N using SAE 5W30.
Figure 6.
Mid-stroke COF plotted against λ ratio at mid-stroke for smooth TS coating sample, smooth CI sample, and rough CI sample sliding against CrN-coated TCR at 100 N using SAE 5W30.

Figure 7.
Representative 3D profilometry images of (a) smooth TS coating sample, (b) smooth CI sample and (c) rough CI sample prior to stepwise friction tests; profilometry images at mid-stroke position of the wear tracks formed on (d) smooth TS coating sample, (e) smooth CI sample and (f) rough CI sample after stepwise friction tests. The friction tests were conducted as shown in Figure 3.

Figure 8.
Surface roughness (Sa) measured at the mid-stroke position plotted against the mid-stroke sliding speed for smooth TS coating sample, smooth CI sample and rough CI sample sliding against CrN-coated TCR at 100 N using SAE 5W30. The roughness measurements were conducted at the end of each speed step.

Figure 9.
(a) SE image taken at the mid-stroke position of the wear track formed on smooth TS coating sample after stepwise friction test with (b) corresponding energy-dispersive X-ray spectroscopy (EDS) analyses conducted at Sites A and B in (a). SE images were taken at the mid-stroke position of the wear tracks formed on (c) smooth CI sample, and (d) rough CI sample after stepwise friction tests. SD is short for sliding direction, and ORL is short for oil residue layer.

Figure 10.
Oil retention depth ratio (Svk/Sk, where Svk is reduced valley depth, and Sk is core-roughness depth) measured at mid-stroke position plotted against the mid-stroke sliding speed for smooth TS coating sample, smooth CI sample and rough CI sample sliding against CrN-coated TCR at 100 N using SAE 5W30. The measurements were conducted at the end of each speed step.


Table 1.
Surface roughness parameters of smooth thermal spray (TS) coating, smooth CI, and rough CI samples measured from 3D surface profiles. The average surface roughness (Sa) is the arithmetic mean of the absolute of the ordinate (height) values within a defined surface area; the core-roughness depth (Sk) is the distance between the highest and the lowest level of the core surface; the reduced peak height (Spk) is the average height of the protruding peaks above the core surface; the reduced valley depth (Svk) is the average depth of the protruding valleys below the core surface; the material ratios (Smr1 and Smr2) are the ratios of the areas of the material at the intersection line which separates the protruding peaks/valleys from the core surface to the evaluation area as defined in [24].
| Sa (nm) | Sk (nm) | Spk (nm) | Svk (nm) | Smr1 (%) | Smr2 (%) | |
|---|---|---|---|---|---|---|
| Smooth TS coating | 210.4 ± 6.5 | 572.3 ± 22.1 | 498.0 ± 51.4 | 613.9 ± 122.3 | 17.6 ± 1.2 | 93.2 ± 0.3 |
| Smooth CI | 199.0 ± 8.6 | 567.5 ± 34.5 | 396.7 ± 7.5 | 283.7 ± 46.6 | 14.1 ± 1.0 | 90.7 ± 1.0 |
| Rough CI | 536.2 ± 21.0 | 1640.2 ± 48.5 | 846.3 ± 65.7 | 782.6 ± 129.5 | 11.6 ± 1.2 | 90.1 ± 0.4 |
Table 2.
Wear coefficients of smooth TS coating sample, smooth CI sample and rough CI sample sliding against CrN-coated TCR at the specific mid-stroke speeds of 1.20 m/s, 0.45 m/s and 0.06 m/s at 100 N and for a total test duration of 3600 s using SAE 5W30.
Table 2.
Wear coefficients of smooth TS coating sample, smooth CI sample and rough CI sample sliding against CrN-coated TCR at the specific mid-stroke speeds of 1.20 m/s, 0.45 m/s and 0.06 m/s at 100 N and for a total test duration of 3600 s using SAE 5W30.
| 1.20 m/s | 0.45 m/s | 0.06 m/s | |
|---|---|---|---|
| Smooth TS coating | 9.04 × 10⁻⁹ | 2.42 × 10⁻⁸ | 2.98 × 10⁻⁷ |
| Smooth CI | 1.04 × 10⁻⁸ | 3.10 × 10⁻⁸ | 5.29 × 10⁻⁷ |
| Rough CI | 2.21 × 10⁻⁸ | 5.65 × 10⁻⁸ | 5.69 × 10⁻⁷ |
© 2020 by the authors. Licensee MDPI, Basel, Switzerland. This article is an open access article distributed under the terms and conditions of the Creative Commons Attribution (CC BY) license (http://creativecommons.org/licenses/by/4.0/).
Share and Cite
MDPI and ACS Style
Lou, M.; Alpas, A.T. Characterization of Lubricated Friction Behavior of Thermal Spray Steel Coatings in Comparison with Grey Cast Iron. Lubricants 2020, 8, 9. https://doi.org/10.3390/lubricants8010009
AMA Style
Lou M, Alpas AT. Characterization of Lubricated Friction Behavior of Thermal Spray Steel Coatings in Comparison with Grey Cast Iron. Lubricants. 2020; 8(1):9. https://doi.org/10.3390/lubricants8010009
Chicago/Turabian StyleLou, Ming, and Ahmet T. Alpas. 2020. "Characterization of Lubricated Friction Behavior of Thermal Spray Steel Coatings in Comparison with Grey Cast Iron" Lubricants 8, no. 1: 9. https://doi.org/10.3390/lubricants8010009
Note that from the first issue of 2016, this journal uses article numbers instead of page numbers. See further details here.