Mapping Land Cover Change over a 25-Year Period (1993–2018) in Sri Lanka Using Landsat Time-Series


1
School of Science, RMIT University, Melbourne, VIC 3000, Australia
2
Department of Export Agriculture, Faculty of Animal Science and Export Agriculture, Uva Wellassa University, Passara Road, Badulla 90000, Sri Lanka
*
Author to whom correspondence should be addressed.
Land 2020, 9(1), 27; https://doi.org/10.3390/land9010027
Submission received: 28 October 2019
/
Revised: 9 December 2019
/
Accepted: 16 December 2019
/
Published: 16 January 2020
(This article belongs to the Special Issue Land Cover/Land-Use Changes in South and Southeast Asia)
Abstract
:Land use and land cover change (LULCC) are dynamic over time and space due to human and biophysical factors. Accurate and up-to-date LULCC information is a mandatory part of environmental change analysis and natural resource management. In Sri Lanka, there is a significant temporal gap in the existing LULCC information due to the civil war that took place from 1983 to 2009. In order to fill this gap, this study presents a whole-country LULCC map for Sri Lanka over a 25-year period using Landsat time-series imagery from 1993 to 2018. The LandTrendr change detection algorithm, utilising the normalised burn ratio (NBR) and normalised difference vegetation index (NDVI), was used to develop spectral trajectories over this time period. A land cover change and disturbance map was created with random forest, using 2117 manually interpreted reference pixels, of which 75% were used for training and 25% for validation. The model achieved an overall accuracy of 94.14%. The study found that 890,003.52 hectares (ha) (13.5%) of the land has changed, while 72,266.31 ha (1%) was disturbed (but not permanently changed) over the last 25 years. LULCC was found to concentrate on two distinct periods (2000 to 2004 and 2010 to 2018) when social and economic stability allowed greater land clearing and investment opportunities. In addition, LULCC was found to impact forest reserves and protected areas. This new set of Sri Lanka-wide land cover information describing change and disturbance may provide a reference point for policy makers and other stakeholders to aid in decision making and for planning purposes.
1. Introduction
Land use and land cover change (LULCC) has been identified as a change driver worldwide [1], with the potential to adversely impact critical ecosystem services [2], including habitat fragmentation [2,3], depletion of biodiversity [4,5,6], decreasing land productivity [7,8], and changing climatic conditions [7,8,9,10,11]. As such, mapping and understanding LULCC has become a priority for many scientific disciplines and stakeholders across the planning, environmental and natural resource management areas [12,13].
South Asia is an economically developing region characterised by high (and growing) population density and sociocultural diversity [11]. This economically developing region is also at times politically unstable. These factors, when combined with ongoing climate variability, are likely to have had a significant impact on the LULCC in the region [14]. The already-high population is forecasted to exceed that of China by 2050, which may accelerate LULCC in some areas [11]. LULCC studies in this region can help to unveil land use change and its consequences. However, these types of studies are often hindered by a lack of historical records due to ongoing political and social unrest.
In Sri Lanka, the major issue in land cover change analysis is the absence of large-area LULCC studies. Available studies are highly localised and restricted to bitemporal comparisons [15,16,17,18,19]. However, it is evident that the country’s landscape has been evolving over a long period due to human (socioeconomic, political) and natural (biophysical) causes. Following the introduction of an open economic policy in the late 1970s, multiple socioeconomic and political changes have taken place. These have resulted in the establishment of multipurpose river basin development projects (e.g., the Mahaweli river basin development project of 1980–2018), implementation of transportation and highway development projects, agricultural expansion through irrigation and the emergence of new urban centres and expansion of existing ones [15,20]. A civil war also afflicted the country from 1980 to 2009. Northern and Eastern Sri Lanka was severely affected, and during some phases of the war, the entire country was affected and experienced negative economic development [21,22]. LULCC records for these periods are missing or extremely limited. When the 30 years of civil war came to an end in 2009, infrastructure development intensified all around the country. The LULCC occurring in this dynamic landscape is yet to be explored and quantified.
Satellite remote sensing is an ideal source for mapping LULCC, given its ability to provide consistent and repeatable measurements at a spatial scale appropriate for capturing both natural and human-induced phenomena (e.g., fires, disease, agriculture, urbanisation, deforestation) [2,23,24,25,26,27,28]. Following recent advances in computer technology (processing and storage) as well as data access through open source policies, remote sensing has become a key technology used when characterising landscape changes [29].
Data from the Landsat series of earth observing satellites, which have been imaging the Earth since the 1970s, became freely available to the public in 2008 [30,31,32,33,34] through the United States Geological Survey (USGS) website. Furthermore, they have been geometrically corrected and spatially aligned and are available in an analysis-ready format [30,34] via the Landsat Ecosystem Disturbance Adaptive Processing System (LEDAPS) algorithm [30]. LEDAPS is a process that converts raw Landsat (Thematic Mapper (TM) and Enhanced Thematic Mapper Plus (ETM+)) satellite data into surface reflectance (SR) products, removing much of the spectral variation caused by atmospheric effects (e.g., water vapour and aerosols) [13]. On the other hand, Landsat 8 (Operational Land Imager (OLI)) SR products are generated using the Landsat 8 Surface Reflectance Code (LaSRC) algorithm [35]. These developments have collectively increased the number of time-series applications in change detection studies from local to regional and global scales [2,30,36,37,38,39]. Multiple pixel-based time-series approaches have also been designed and tested in the last decade to detect LULCC at a high temporal scale [13,23,37,38,40,41,42,43,44,45,46,47]. Such innovations offer developing countries an opportunity for reconstructing LULCC in recent decades.
For Sri Lanka, the Landsat archive is available from 1988 onwards. As such, the objective of this paper is to construct an internally consistent, annual database of LULCC for the whole of Sri Lanka, using the freely available Landsat archive. Specifically, we aim to: (1) identify areas that have experienced LULCC during the time period 1993–2018 and (2) analyse detected large-scale changes in the context of socioeconomic and political events that impacted the country from 1993 to 2018. This study will help to overcome the information gap in LULCC mapping in the country caused by the civil war and associated lack of large-area LULCC data.
2. Materials and Methods
2.1. Study Area
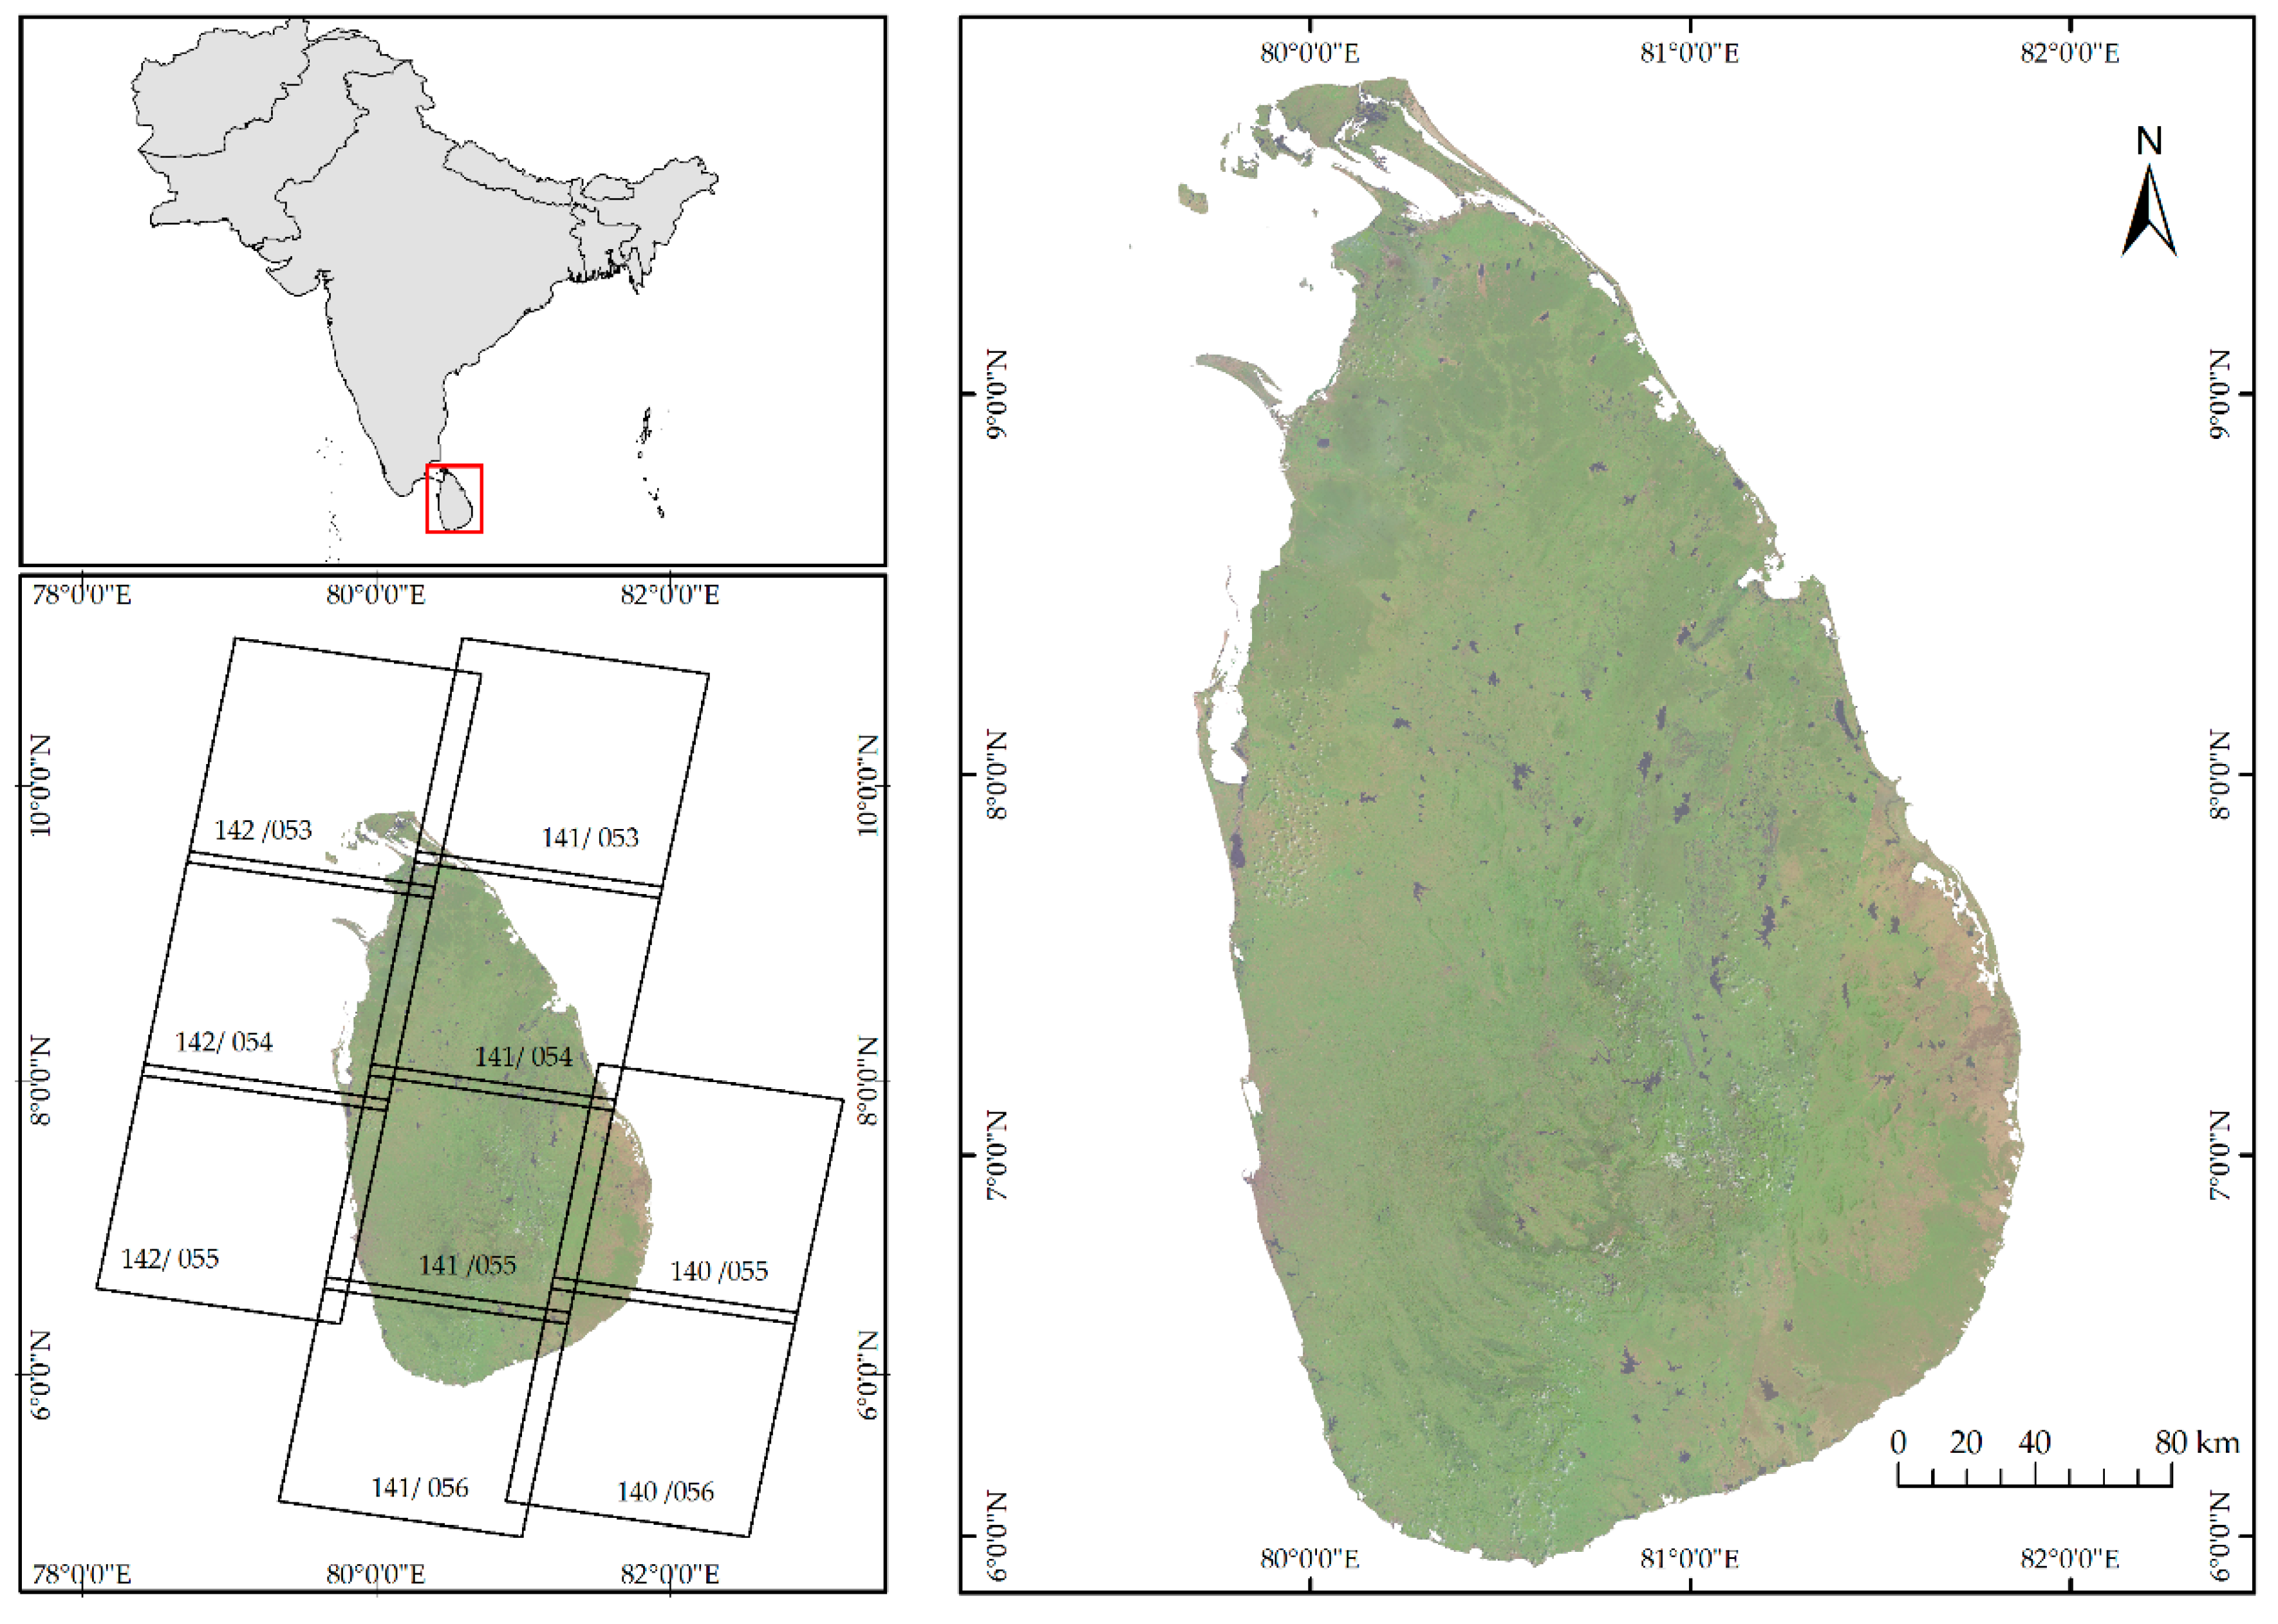
The island of Sri Lanka was used as the study area (Figure 1). Sri Lanka is a tropical island with a land extent of 6.5 million hectares (ha) (65,525 km2), located between 5°55′–9°51′ N latitude and 79°52′–81°51′ E longitude (WGS 84-UTM Zone 44N). Sri Lanka is densely populated, with 20.3 million people [48] who mostly reside in the southwestern portion of the island.
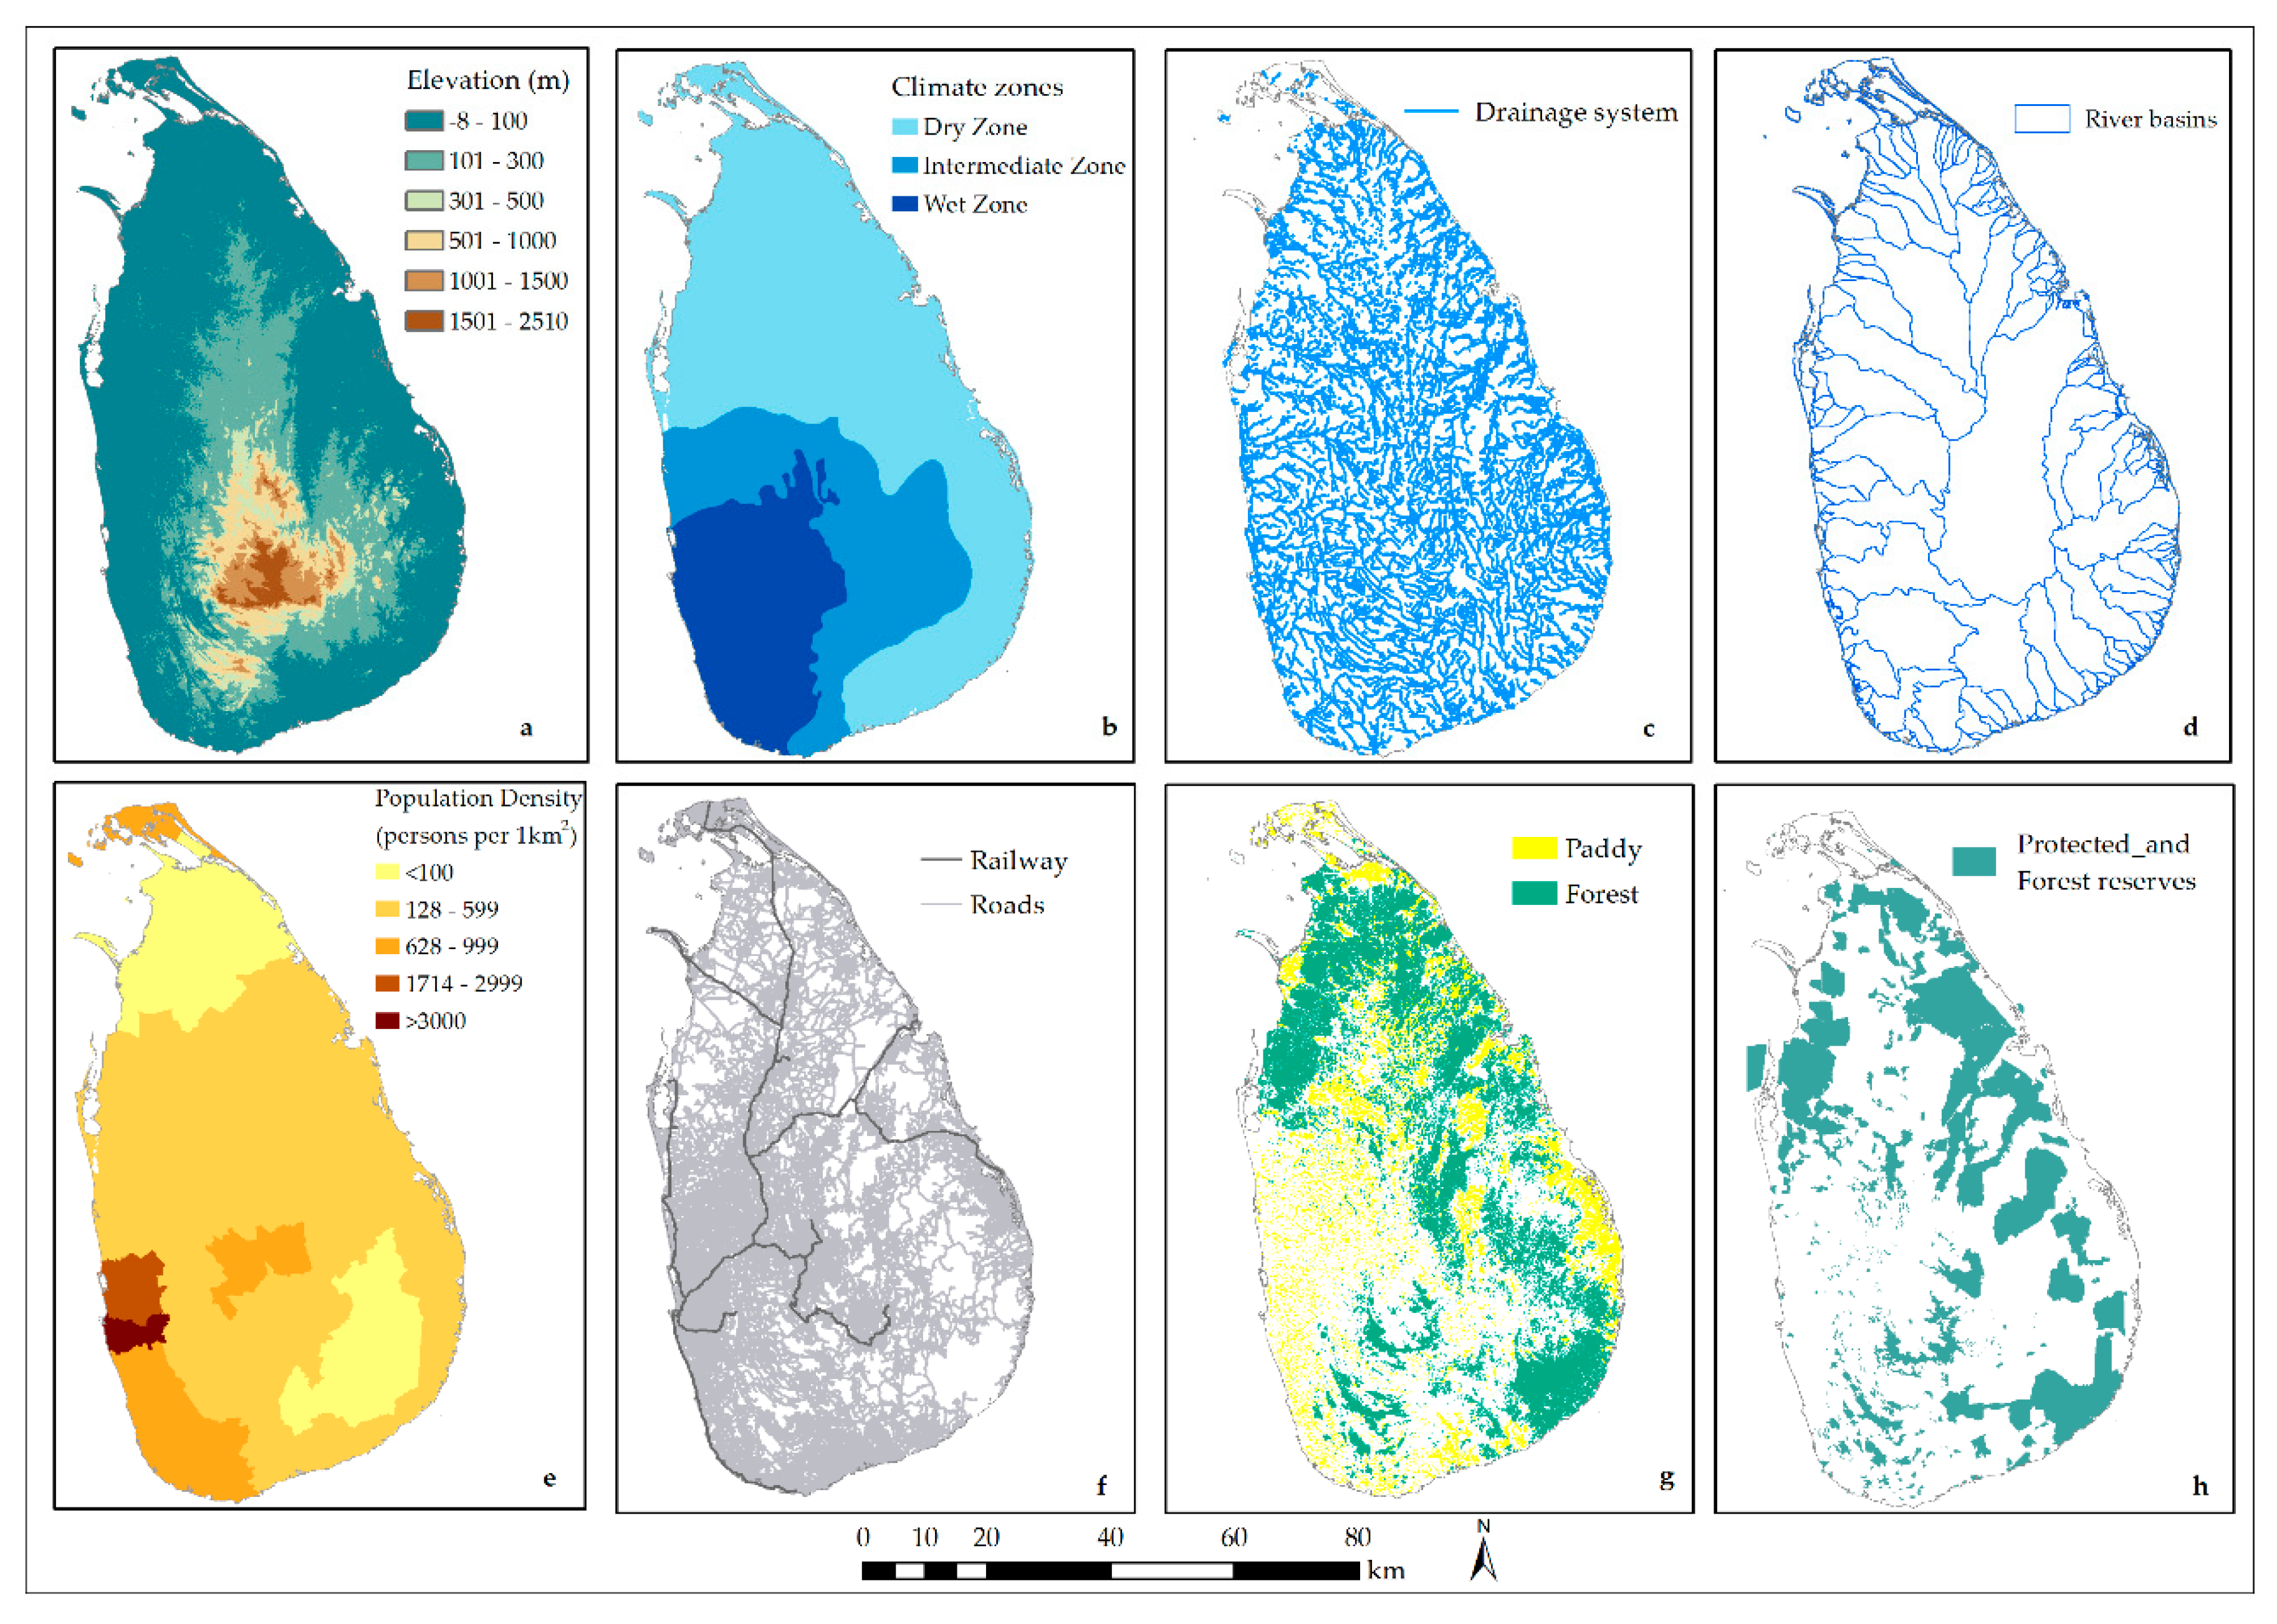
Sri Lanka has a unique and diverse landscape due to its mountainous topography and dense network of rivers. Topographically, the country has two distinct regions: the central highlands and lowland plains extending to the coastal zone. The elevation of the Central Highlands varies from 300 to 2500 m (Figure 2a). The central region also contains many complex topographical features such as ridges, mountains, plateaus, basins, valleys and escarpments. These topographical variations strongly influence the spatial patterns of wind, rainfall, temperature, relative humidity and other climatic elements. The country’s rainfall distribution varies from under 1000 mm per year (in the southeast and northwest) to over 2500 mm per year in the central mountainous region.
The climate in Sri Lanka is dominated by tropical and monsoonal attributes and consists of two distinct monsoon seasons: the southwest monsoon from May to September and the northeast monsoon from November to February [13]. Based on the mean annual rainfall distribution, three rainfall zones are defined (i.e., climate zones): wet zone (>2500 mm of rainfall), intermediate zone (2500–1750 mm) and dry zone (<1750 mm) (Figure 2b). Further, the Central Highlands act as a watershed for more than 100 major and minor rivers that flow in a radial pattern towards the sea (Figure 2c). Natural river basins have greatly influenced present-day land use in Sri Lanka (Figure 2d). The areas closest to the capital Colombo (western and southwestern areas) are more urban, with a higher density of human population (Figure 2e) and infrastructure (Figure 2f).
Land cover in Sri Lanka is dominated by agriculture; one-third of the total land area is covered by agricultural land use [15,20]. Rice paddy is the dominant form of agriculture, found all around the country except in the high mountains, coastal regions and the far north. Rice paddy is common in all these zones. Rice paddy lands have expanded into the dry zone, making use of new irrigation schemes. Paddy lands in the wet and intermediate zones are commonly found along riverbanks, even in highly urbanised areas (Figure 2g). Forest lands and their remnants are more common in the north–central and the northeastern (Figure 2g) part of the country, where the human population is sparse. It is in these areas that Sri Lanka maintains a high biodiversity and ecosystem diversity. Some of the forest areas are declared as protected areas to conserve biodiversity and, specifically, elephant habitats (Figure 2h).
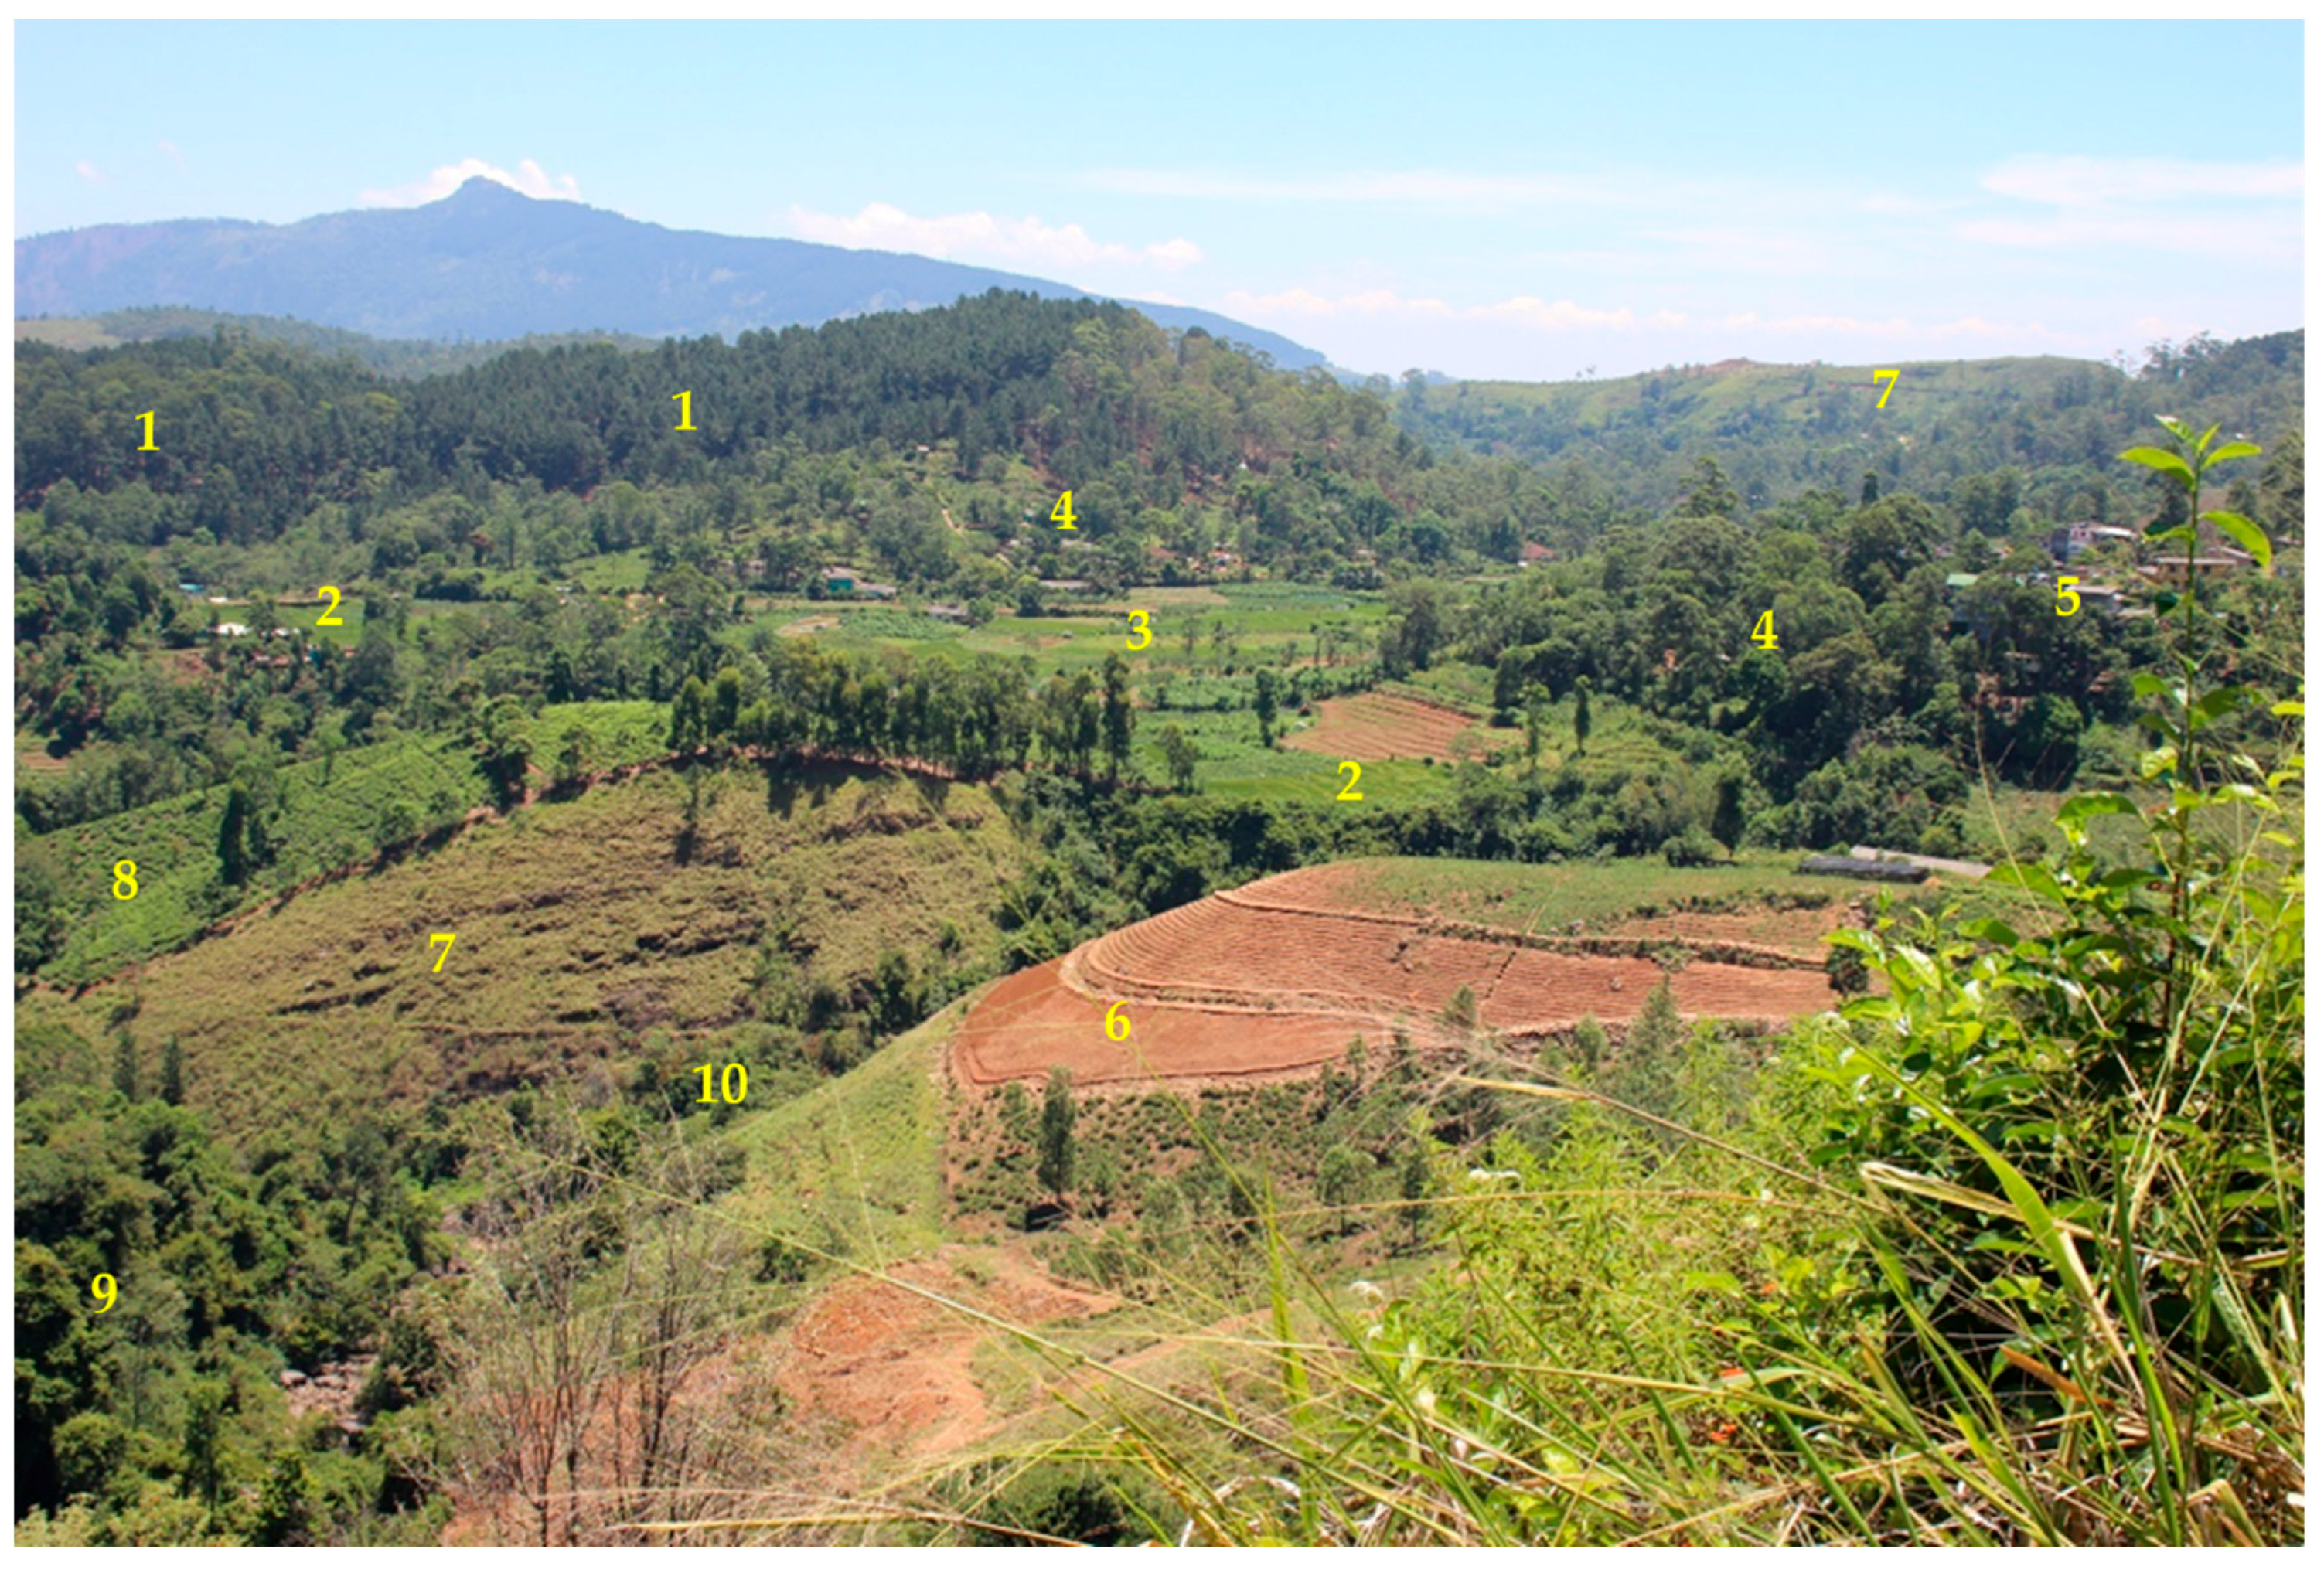
Plantation agriculture (commercial agriculture) consists mainly of tea, rubber, coconut and palmyra and occupies a considerable proportion of the country. Tea plantations are restricted to the western slopes of the Central Highlands, where rainfall is highest. In the west and the northwestern provinces, coconut plantations are common, while southwestern regions are dominated by rubber cultivation. Palmyra is restricted to the dry zone in the north, north–central and northeast regions [49]. Home gardens (homestead/gardens), a noncommercial form of agriculture also known as agroforestry systems, are common throughout the country. However, home gardens vary greatly based on climatic conditions and whether they are located in urban/non-urban areas. Examples of commonly occurring land cover types are shown in Figure 3.
2.2. Landsat Imagery and Spectral Indices
The overall methodology of this study is summarised in Figure 4. As the first step, all available Landsat TM, ETM+ and OLI surface reflectance products [56] from 1 January to 31 December for the years 1988–2018 were obtained from the USGS data archive. A total of 4440 Landsat images covering the nine Landsat tiles for Sri Lanka (Figure 1) were used. Fmask [57] was applied to remove clouds and shadow. After unsuccessfully attempting to create seasonal composites, for wet and dry periods, we decided instead to create annual median composites for each of the 28 years (1989 and 1990 were not used due to the poor quality of available imagery during these early years). The reason for the failure of season-based compositing was the high incidence of cloud and data dropouts (Scan Line Corrector (SLC) in Landsat 7 imagery). Subsequently, we opted to create annual composites. We then experimented with several spectral indices and transformations (these included Tasseled Cap components [27], the Normalised Burn Ratio or NBR and the Normalised Difference Vegetation Index or NDVI). NBR and NDVI were found to be the most sensitive to interannual change in a Sri Lankan context. NBR calculates the normalised difference in reflectance between the NIR and SWIR wavelengths as recorded by Landsat. NDVI calculates a similar ratio using the NIR and red portions of the electromagnetic spectrum (Table 1) [35]. Annual median composites for NBR [58] and NDVI were created in the R programming language using LandsatLinkr [59].
Next, the LandTrendr (Landsat-based detection of trends in disturbance and recovery) [29] algorithm was applied to detect change events that occurred across the landscape, which may be associated with LULCC. LandTrendr is a segmentation and fitting algorithm specifically developed for identifying vegetation changes using Landsat time-series data [29,60]. Examples of land cover transitions can be seen in Supplementary Materials (Figure S1). LandTrendr provides a range of analytical outputs that can be utilised in the prediction of land cover change [29]. In this study, we included several commonly used LandTrendr outputs in our LULCC model: the greatest disturbance year, greatest disturbance magnitude, disturbance duration, predisturbance value, post-disturbance value, recovery year, recovery magnitude and recovery duration (Figure 4). Several initial images are needed to begin to build a trend and detect any breaks (implying there has been a disturbance or change). Therefore, in this study, we analysed images from 1991–2018 and report changes from 1993 onwards.
2.3. Reference Data, Classification and Validation
A reference dataset is essential for the attribution of land cover change and its subsequent validation [17,61,62]. A random sample consisting of 2117 pixels, stratified according to administrative districts (eight) and major land cover classes (eight) [49,54], was created (Table 2). Reference pixels were interpreted and attributed using a multiple lines of evidence approach [63], which has proven to be more accurate than a single human interpretation approach [2,41,64,65]. Google Earth imagery, Landsat time-series trajectory, Landsat images and land use maps (2007) were used in the change identification and labelling process. Reference pixels were interpreted as either unchanged, disturbed but unchanged (e.g., water surfaces experiencing disturbances due to seasonal variations, i.e., dry and wet periods) or changed (implying there has been a conversion of one land use land cover class to another such as from forest to water) during the years for which imagery was available (1988–2018).
Random forest classification [66,67] was used to produce a map showing the distribution of the three classes (unchanged, disturbed but unchanged and changed). Predictor variables used as input into the random forest models included NBR trajectory, NDVI trajectory, seasonal rainfall, seasonal temperature (WorldClim Version2 [68]) and elevation (derived from Aster GDEM version 3) [50]. Multiple random forest models were generated, changing the number of variables available for splitting at each tree node (2, 3 or 4) and the number of trees (200, 300, 400, …, 1000) used. Each model was trained with 75% of the reference data, with the remaining 25% used to evaluate the classification outcomes. The model using 4 splitting variables and 500 trees produced the highest accuracy. Results for this model were evaluated based on the assessment of a confusion matrix created using the reference data.
3. Results
3.1. Reference Data, LULCC Map and Accuracy
Figure 5 shows a summary of interpreted reference pixels using a multiple lines of evidence approach. The general trend across all land cover categories, except water and urban classes, was that around 50% of reference pixels experienced change. The home garden class experienced the most change, with 81% having changed during the reporting period. The second most dynamic land cover was plantation, which changed by 70%. Forest and scrub pixels changed at a rate of 67% and 64%, respectively. The change rate of paddy was 17%, which is less than the other vegetation covers. Water and periurban pixels changed even less, and urban pixels remain unchanged (as expected).
An evaluation of the accuracy results of the classified land cover change created using random forest is presented in Table 3. The predicted land cover change classification achieved an overall accuracy of 94%. The ‘changed’ (implying a change in LULCC) and ‘unchanged’ (implying either not disturbed or changed) classes achieved a 99.78% and 91.71% producer’s accuracy and 84.28% and 99.89% user’s accuracy, respectively. The ‘disturbed’ (disturbed but no LULCC) class achieved the highest producer’s accuracy. The Kappa coefficient value is 0.94. The most important predictor variables were the NDVI predisturbance value, NBR disturbance magnitude, NDVI disturbance magnitude and precipitation (rainfall) seasonality (the relative importance of each variable is shown in Figure S2).
Cross-validation results of the predicted model are shown in Table 4. The model prediction achieved an overall accuracy of 94.14%. Unchanged and disturbed areas were predicted by the model with high accuracy. The predicted accuracy of the changed class was more moderate (80%).
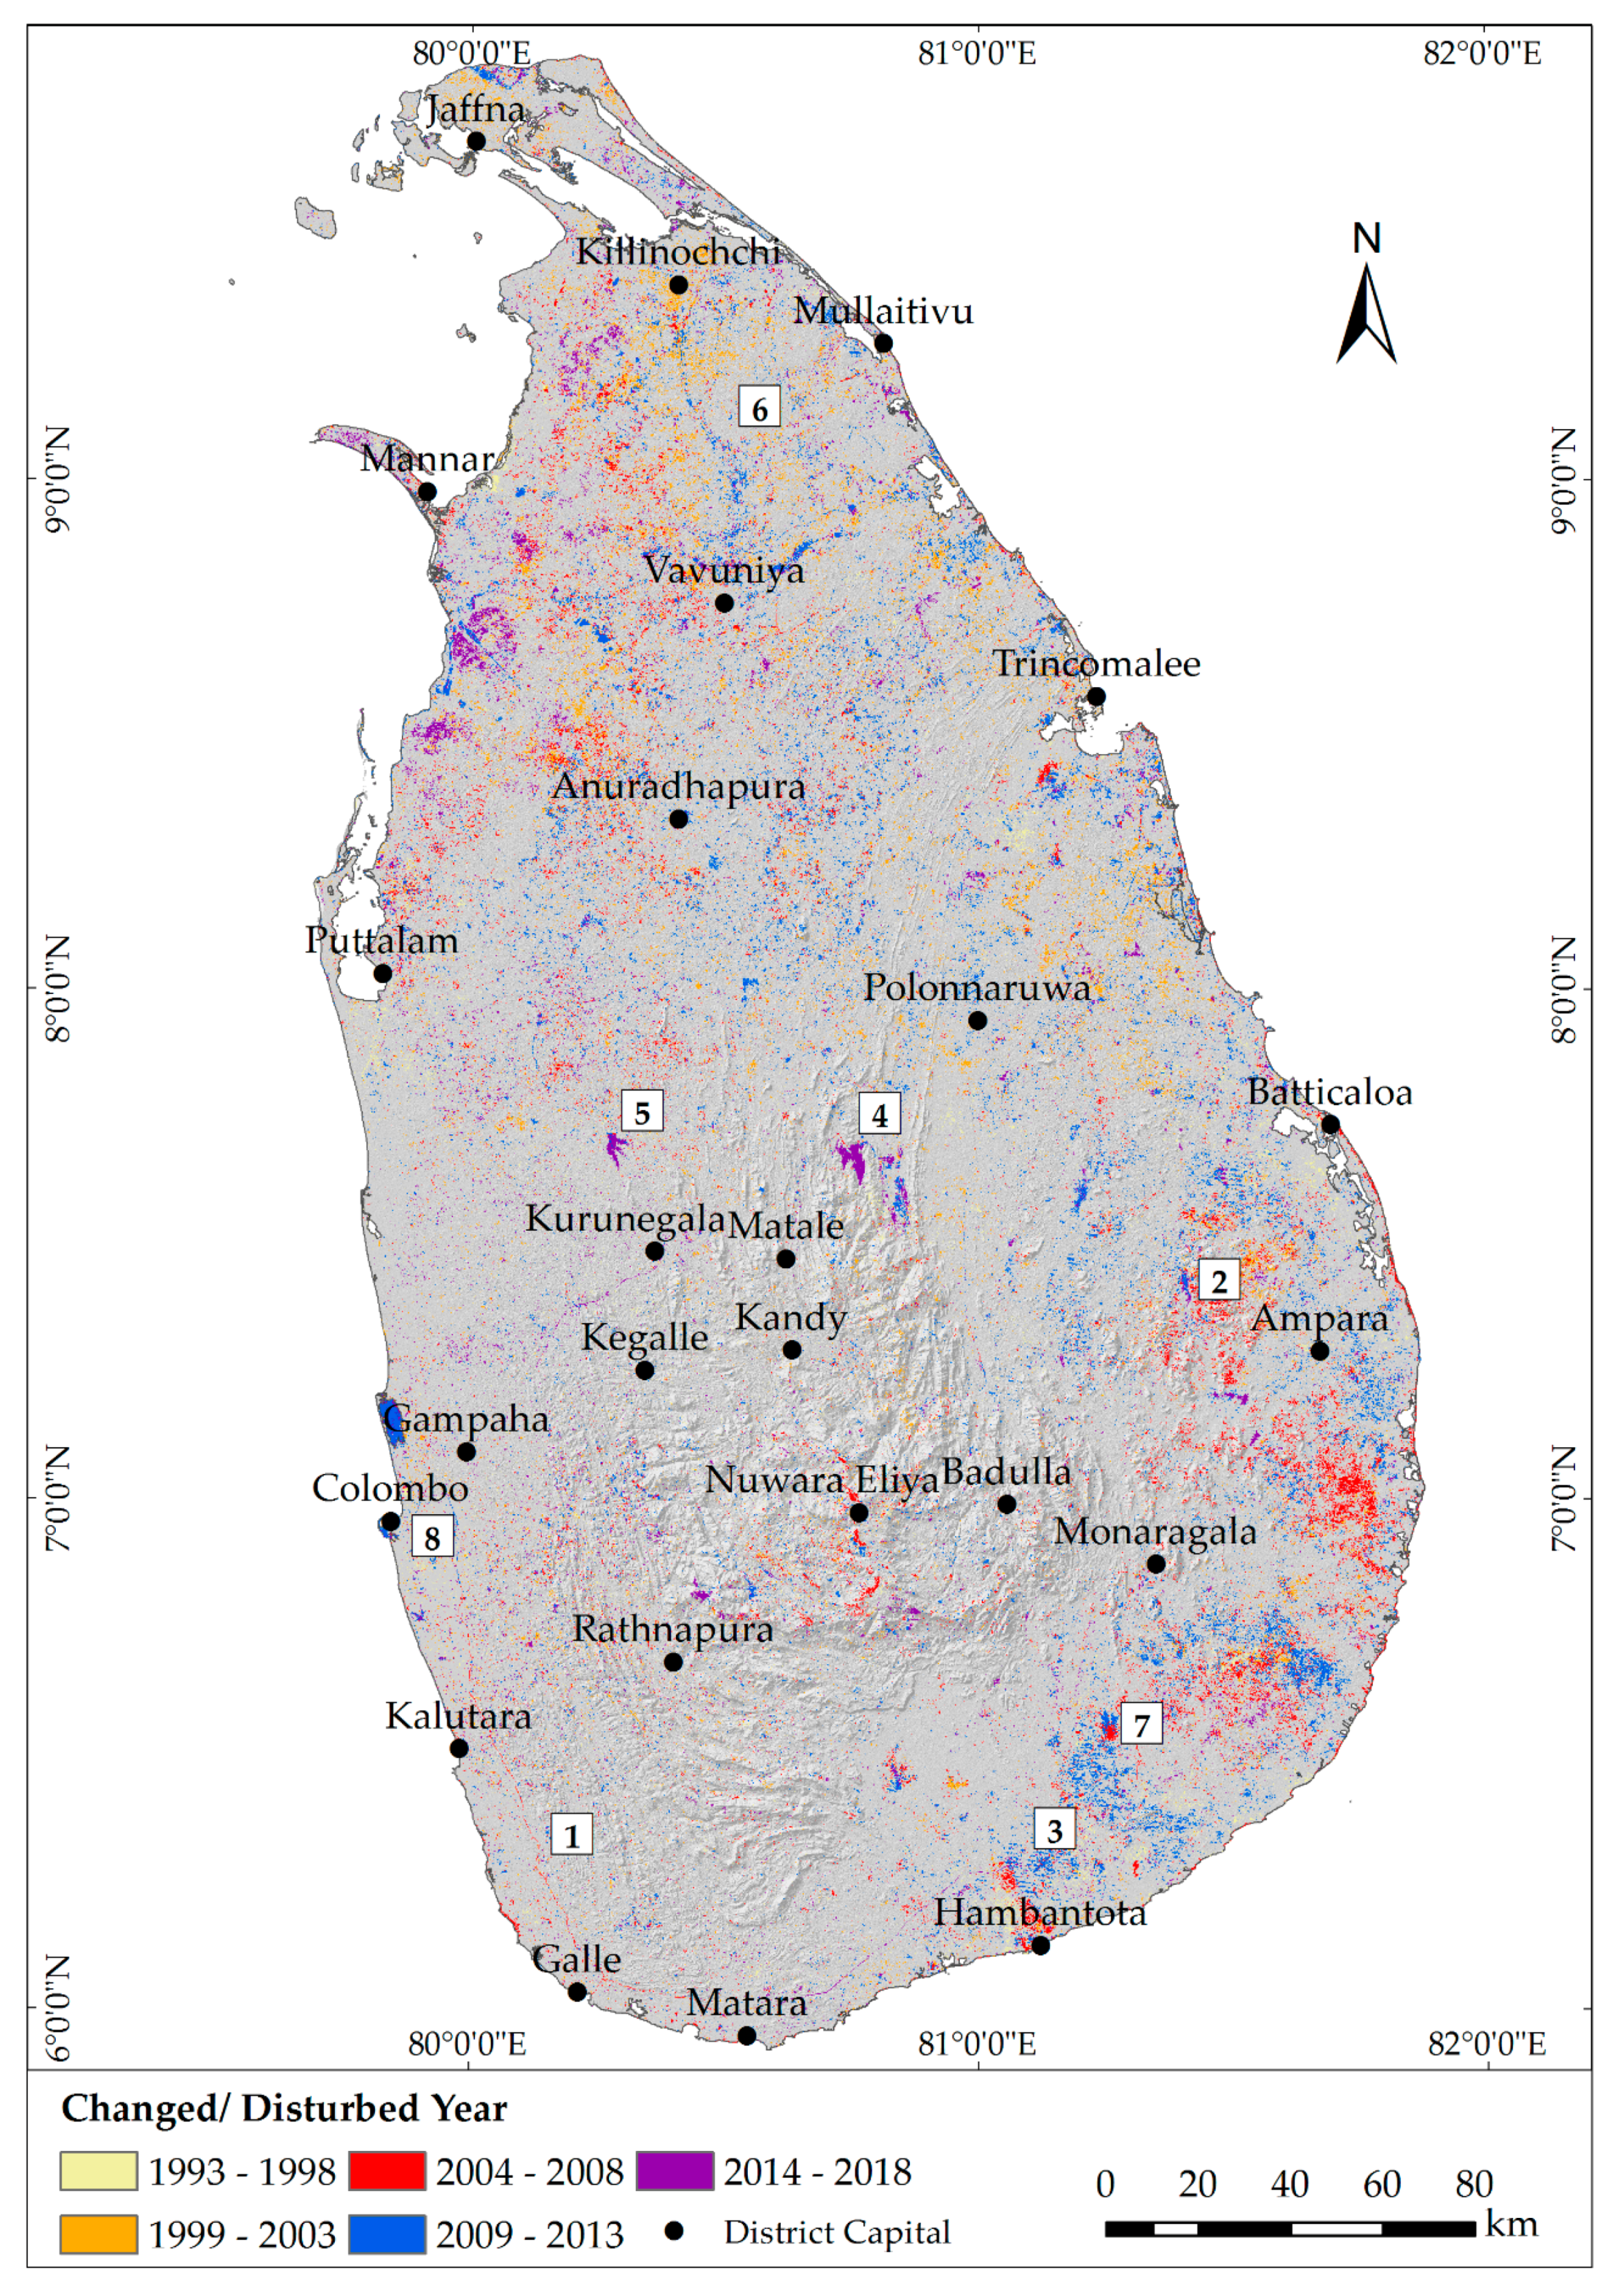
The predicted LULCC map is shown in Figure 6. It illustrates the spatial distribution of all the major land cover changes and disturbances that took place in Sri Lanka during the last 25 years. Figure 7 shows the years when disturbance and LULCC occurred, whereas Figure 8 provides a yearly summary of all LULCC detected in Sri Lanka, together with major sociopolitical events that occurred during the study period. Earlier years were removed due to incomplete time-series data, and since LandTrendr needs to initialise for a couple of years to attribute change correctly. Many of the changes can be matched with the major development projects and associated land cover changes in Sri Lanka during the 25-year study period, including the southern expressway (the first highway in Sri Lanka) and the railway line along the southern coastal belt (2006–2018), Rambakenoya reservoir (2008–2013), Mattala international airport (2009–2013), Moragahakanda reservoir project (2015–2018), Deduru Oya reservoir project (2013–2014), the Yaldewi railway line and A9 highway (2010–2013) and the Lunugamwehera reservoir project (2009-2013). A large proportion of the changes occurred after 2004 with further intensification subsequent to 2009 when the 30-year civil war was over. It is also clear that the changes after 2009 are more pronounced in regional Sri Lanka, that is, in areas far from Colombo (the capital of the country) (Figure 7).
3.2. LULCC and Protected Areas
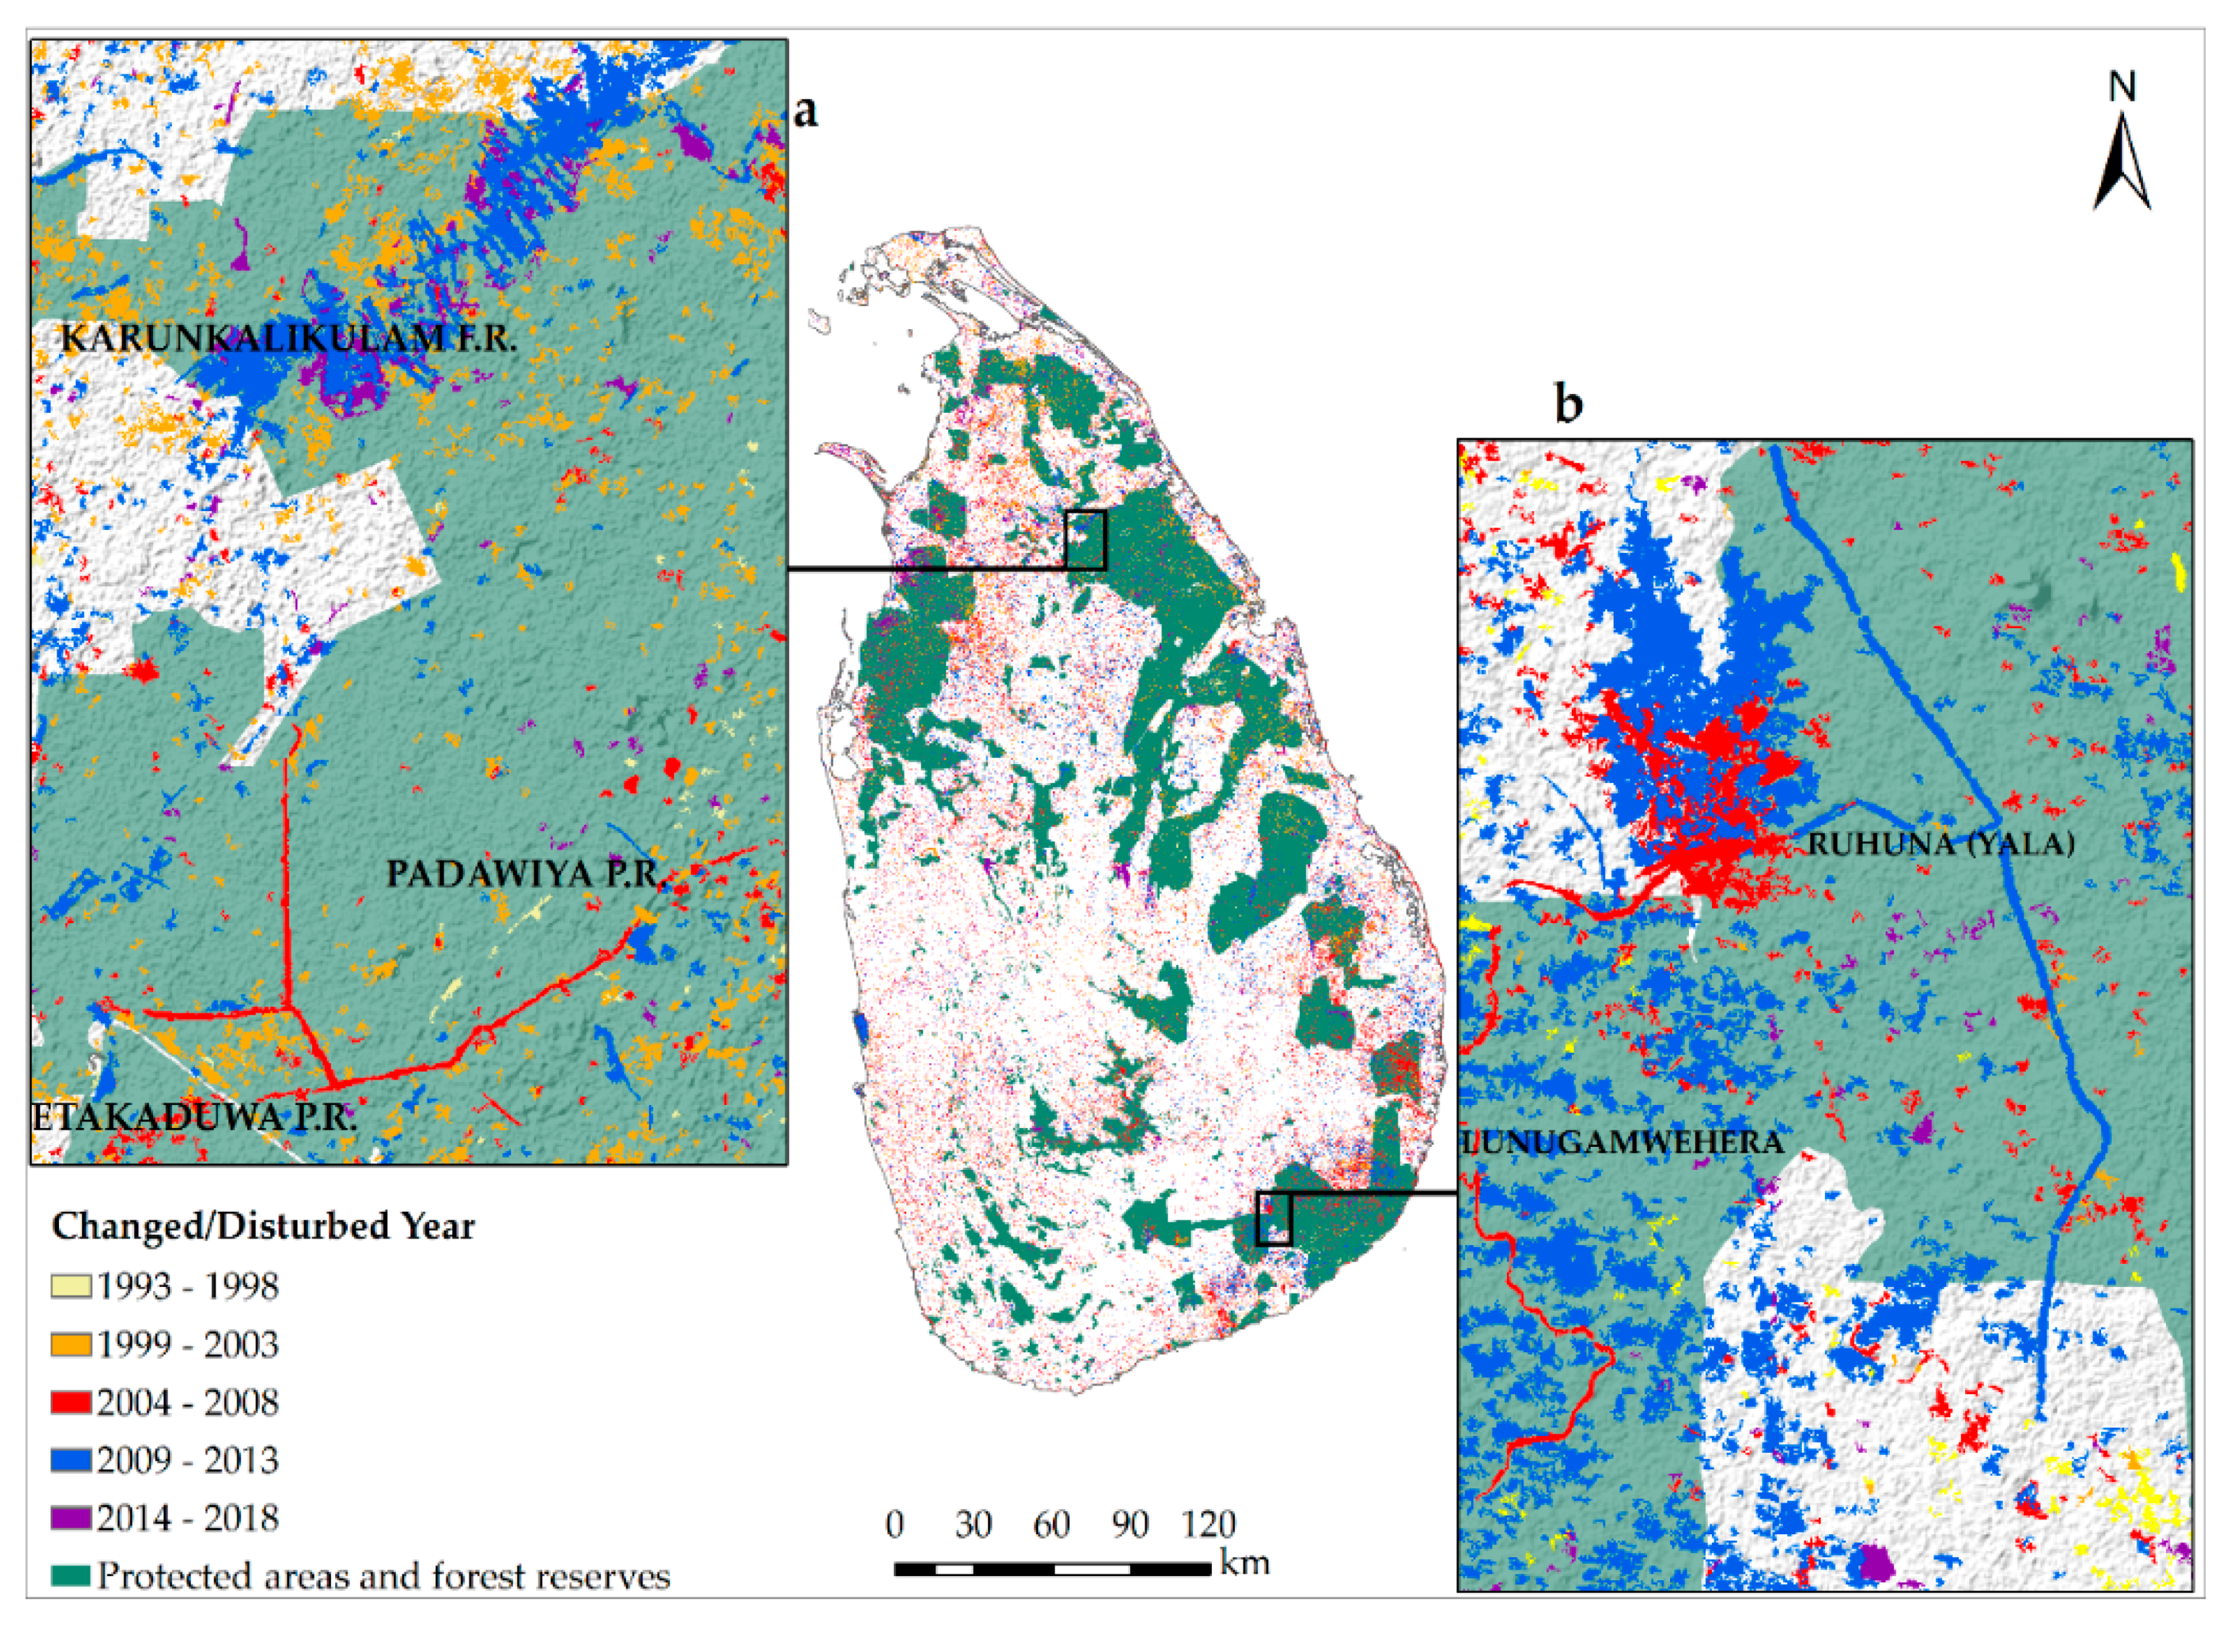
Figure 6 shows how LULCC has impacted protected areas in Sri Lanka. Many of the protected areas that are located in close proximity to district capitals have been notably impacted due to increasing human population pressure and urbanisation. Figure 9a illustrates a specific case study in which changes in a protected area were caused by the construction of a reservoir and a highway. Figure 9b shows another case study in which a forest reserve/protected area was impacted by forest clearance for agricultural expansion and highway construction.
4. Discussion
The main purpose of this study was to construct an internally consistent, annual database of LULCC for the whole of Sri Lanka, using the freely available Landsat archive [33], for the past 30 years. We found that during this period, 890,003 ha (13%) of the land area experienced change and a further 72,266 ha (1%) was disturbed (accuracy of 94.1%). These findings are consistent with other studies in Sri Lanka that have detected LULCC at local scales [17,18,19,69,70,71,72,73]. Many comparable time-series studies have been carried out using Landsat data, but they have been mainly restricted to vegetation change analysis in mid-latitude countries [2,6,12,23,28,29,38,64]. The few studies that have attempted time-series remote sensing in tropical regions concede it is a challenge given the high incidence of clouds [26,41,74,75,76,77,78].
Disturbed (but unchanged) areas were found to be mainly concentrated in the dry zone. These areas have a distinct dry period and are predominantly occupied by rice paddies, scrub and water surfaces (Figure 3). Water and rice paddies in the dry areas represent these temporary or ephemeral disturbance characteristics. For example, dry low-lying areas are highly sensitive to seasonal rainfall variations, flooding and drying up in the wet and dry seasons, respectively. Rice paddy lands exhibit similar characteristics due to seasonal cropping calendars based on monsoon rains. The inclusion of the ‛disturbance’ class is therefore seen as highly beneficial, because it allows for the separate analysis of these events and avoids the misinterpretation of permanent land cover ‘change.’
Our research found that over the thirty-year study period, most LULCC occurred in the northern, southeastern and eastern regions of Sri Lanka. LULCC during the 1990s concentrated in the north and some areas around Trincomalee and Batticaloa. This was likely due to open economic reforms, expansion of agricultural lands, population redistribution and infrastructure enhancements, which became more pronounced after 2009 [20,22]. LULCC between 2004 and 2008 was mostly evident along the southeastern region from Hambantota to Ampara and the northwestern portion of the island. Such changes were likely the result of land clearance for resettlement programs and agricultural land expansion. After the civil war finally ended in mid-2009, the government focused on enhancing the country’s infrastructure, especially via highway and reservoir construction (which is seen in Figure 4). Some transportation projects that enhanced the existing road/railway network captured in our results include the Southern Expressway from Colombo to Galle, which was opened to the public in 2011, and its continuation from Matara to Hambantota in recent years, as well as the Yaldewi railway line and A9 highway from Kandy to Jaffna (2010–2013) (Figure 4). A number of reservoirs were also detected, including Moragahakanda (2014–2018), Deduru Oya (2014), Lunugamwehera (2013–2014), Upper Kotmale (2011) and the Rambakenoya reservoir (2007–2013). After 2009, change was much more pronounced over regions that are farther from the capital. These recent infrastructure development programs and the war-free environment had significant impacts in terms of LULCC around new suburbs such as Hambantota [73], Monaragala, Ampara and Batticaloa. Additionally, the western region—where Colombo is located—expanded by reclaiming new land from the ocean, which has been one of the largest projects in the country, as well as by adding eastern suburban areas through expanding a new set of suburbs, which is consistent with recent studies. Subasingha et al. (2016) [17] and Fonseka et al. (2019) [79] detected a dramatic expansion of the Colombo metropolitan region between 2004 and 2016 and 1988 and 2016, respectively. Of note is that mountain areas, i.e., above 1500 m, have experienced limited LULCC, as these areas are harder to access [15].
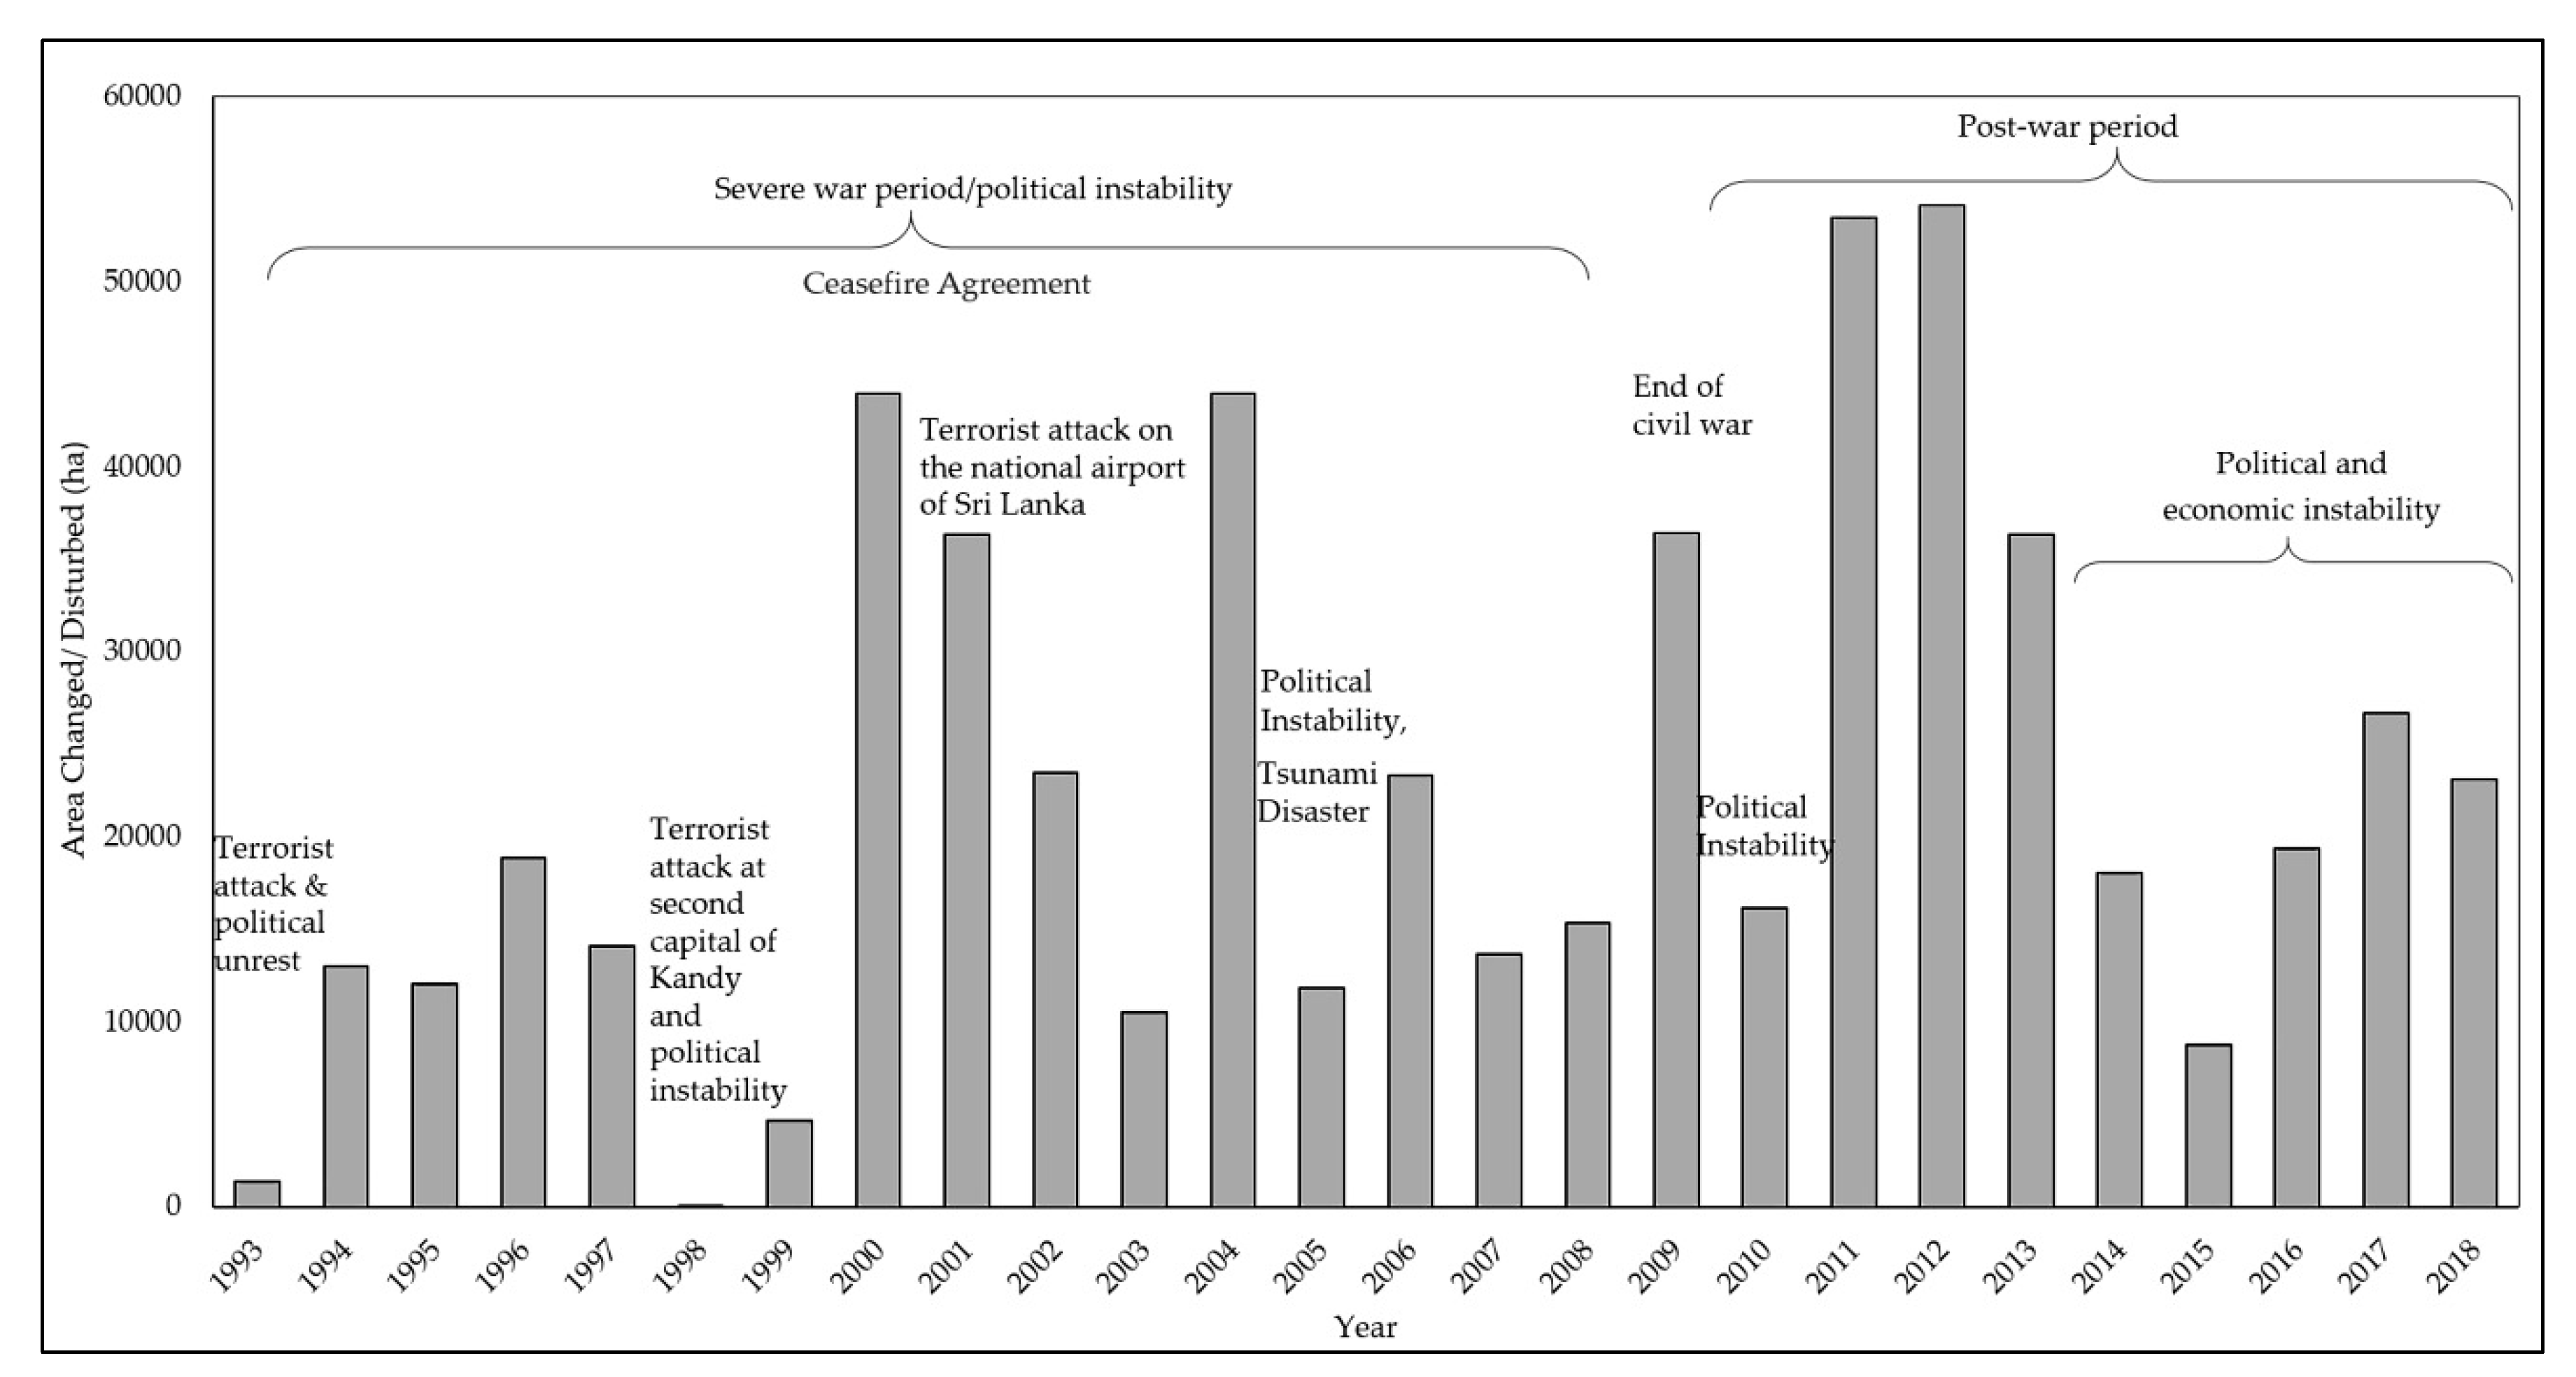
Considering the chronology of annual LULCC in Sri Lanka, as shown in Figure 5, the period starts in the early 1990s with relatively low annual change. This was due to political instability resulting from a state of emergency following the assassination of the president in 1993. Subsequently, a new series of infrastructure development programs were introduced under new leadership in 1994 and 1995, resulting in LULCC throughout the dry zone. The area under home gardens increased in many districts during this period, and forest cover dramatically dropped [80]. However, the 1990s were a particularly unstable period for Sri Lanka due to many sociopolitical crises, including a civil war.
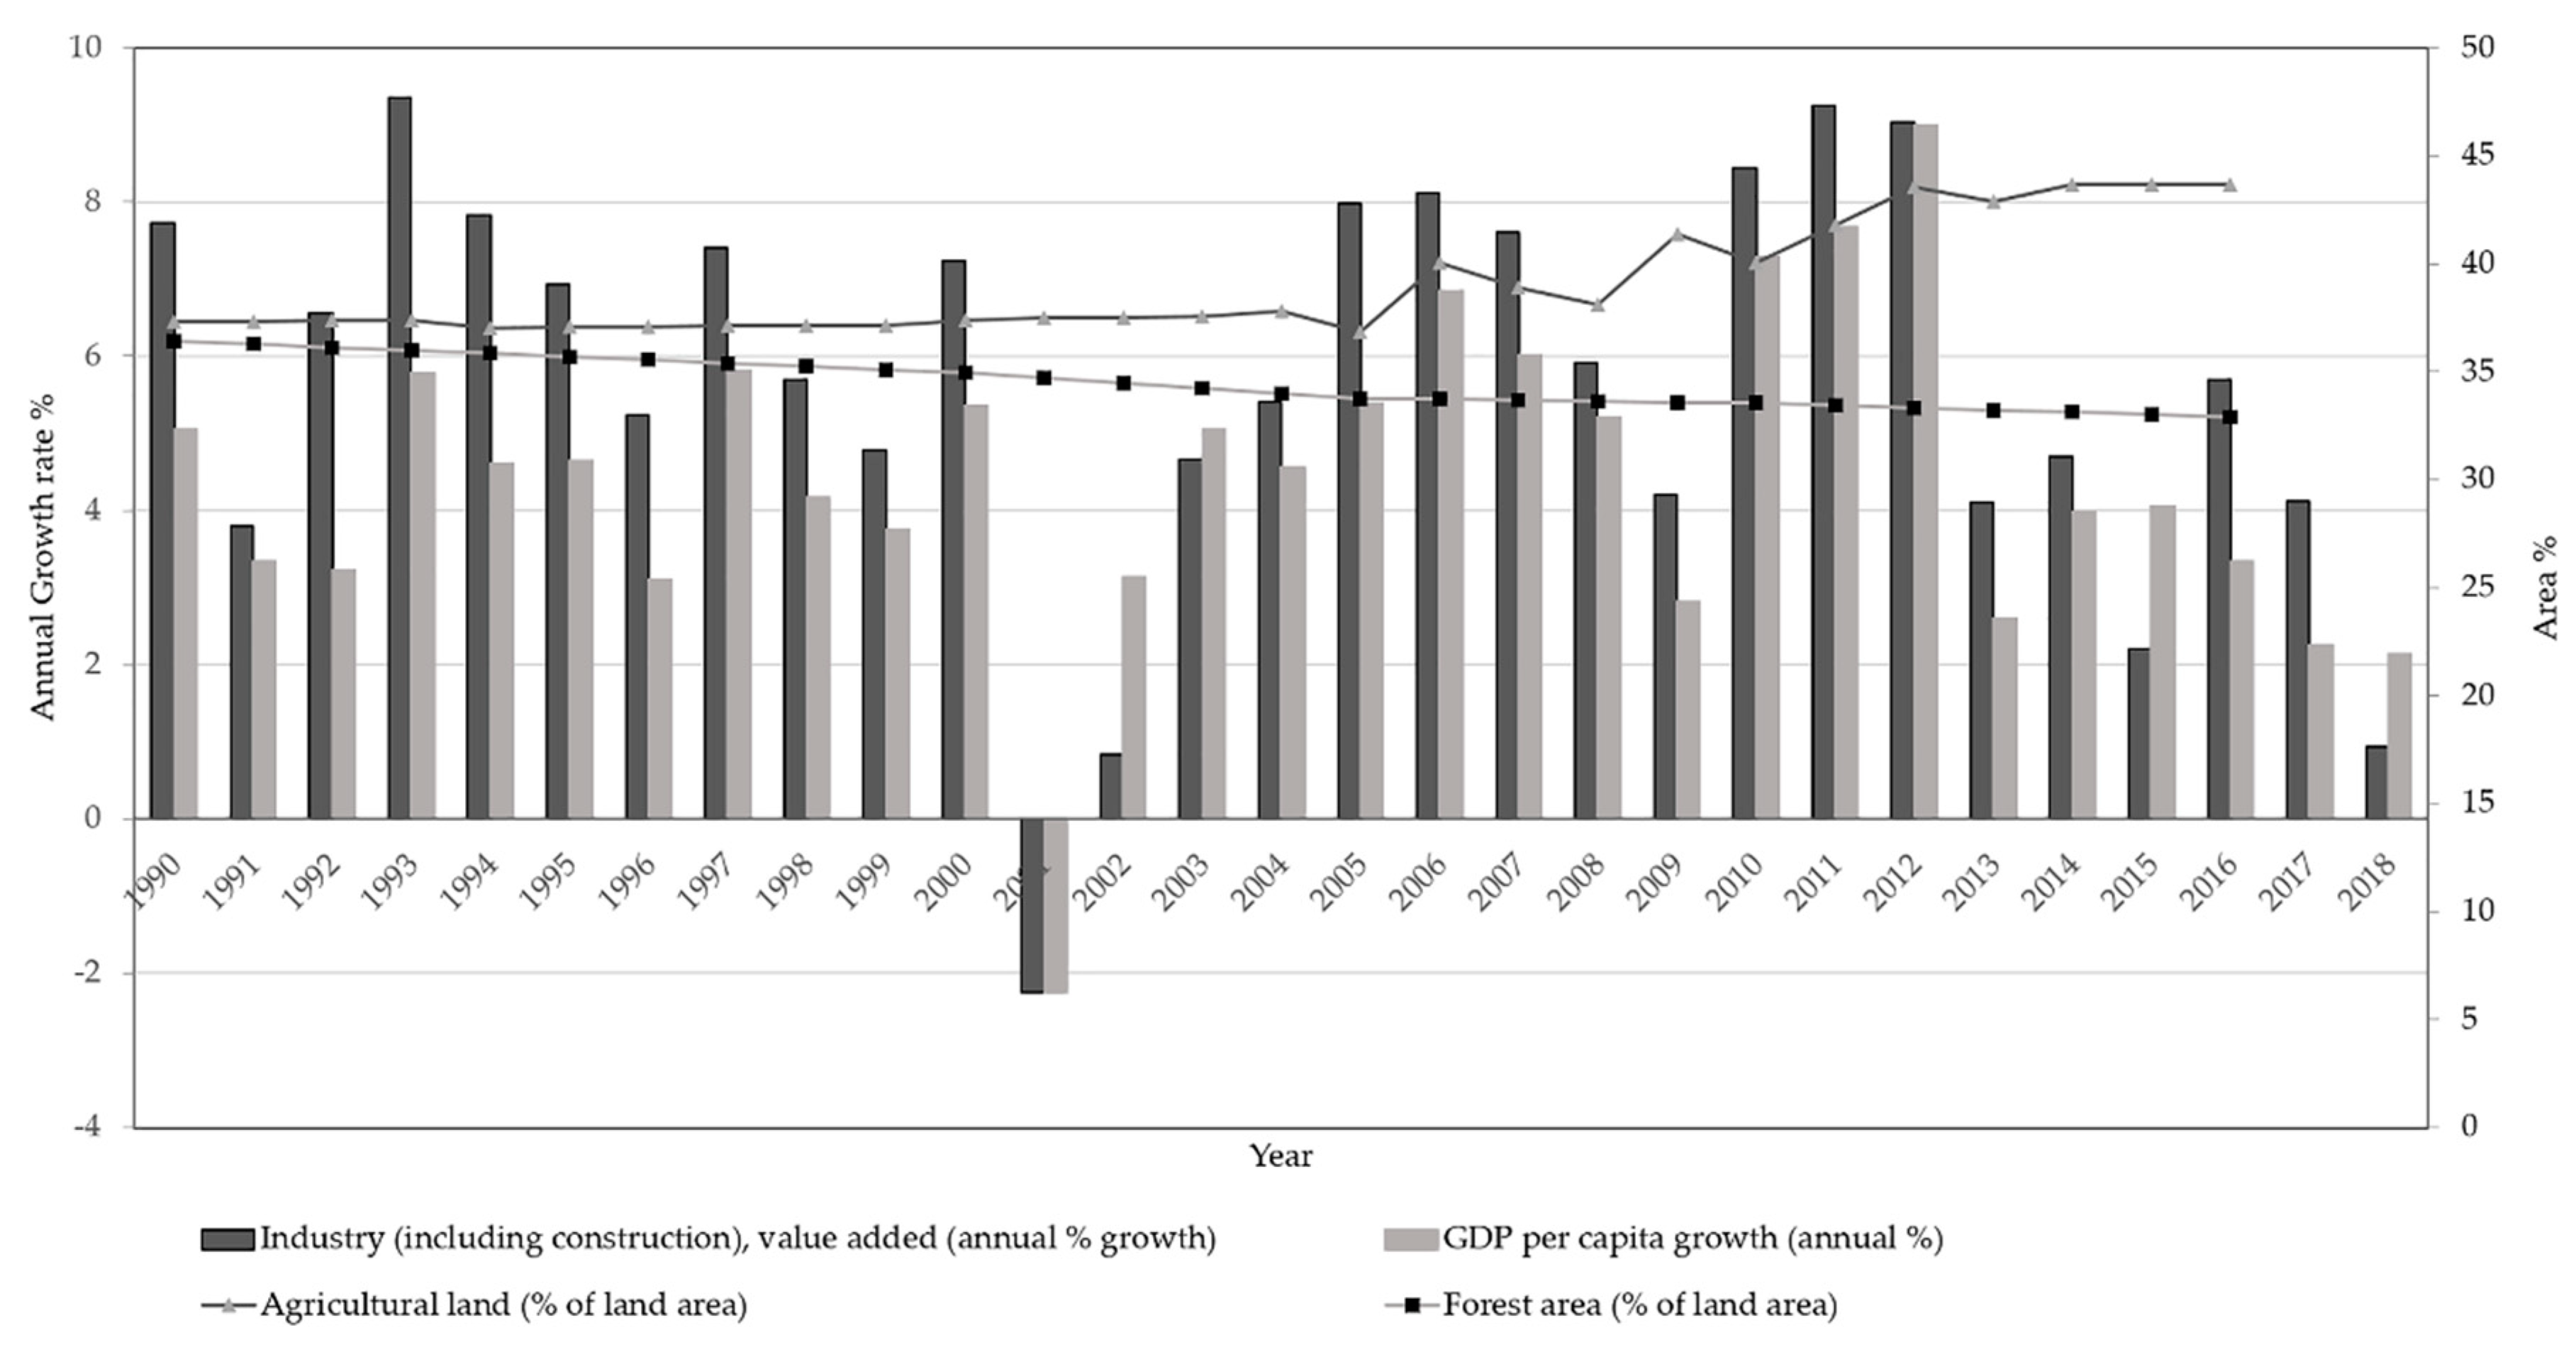
The initial phase of the civil war was characterised by low rates of LULCC (1993–1999). Following the ceasefire agreements in 2000, LULCC rose substantially, particularly due to agricultural expansion in certain areas. Hotspots of change can be seen around the northern regions of Anuradhapura, Vavuniya and Kilinochchi, east of Polonnaruwa, southeastern areas around Ampara and Hambantota, south of Colombo around Kalutara and Nuwara Eliya and south of Kandy. In 2001, a terrorist attack on the national airport of Sri Lanka destroyed much of the national airline’s fleet. This event and other destabilising factors had a negative effect on the economy, which experienced a negative per capita and industrial growth rate, thus affecting many infrastructure development activities and halting proposed development projects (Figure 7). As a result, 2002 experienced lower rates of change (Figure 10). This trend was exacerbated by two natural disasters in 2003 and 2004: a major flood and the catastrophic Indian Ocean Tsunami. The tsunami in December 2004 devastated the coastal region around the country and resulted in the loss of 35,000–40,000 lives [73]. Part of the affected coastline from Batticaloa to Ampara (about 50 km), Hambantota and Galle is captured in Figure 3. The year following this immense natural disaster, LULCC remained low, as attention focused on disaster recovery rather than new infrastructure projects.
By contrast, the 10-year post-war period following 2009 was politically stable and resulted in a notable increase in LULCC (Figure 5). Given that 80% of Sri Lanka’s land belongs to the state [15,45], change is primarily driven by major infrastructure investments. The significant drop in LULCCs in 1993, 1998–1999, 2005, 2010 and 2015 is directly connected to the political instability of the country (Figure 5). GDP (gross domestic production) is highly dependent on the political stability of a country, attracting more investment when it is stable [74]. Low rates of change seen in recent years (2015–2018) can result from ongoing internal political and economic crises. Nevertheless, some changes are still evident during this recent period (Figure 5). Examples include the establishment of the Moragahakanda reservoir project in the central region (2016–2018) aimed at rural development and hydropower generation [81], clearing of large patches of forest south of Mannar in the northwest and the reclamation of 269 ha of land from the ocean north of Colombo financed by the Colombo International Financial City project (2014–2018) (Figure 5).
When examining areas that have experienced change against the location of forest reserves and protected areas (Figure 3 and Figure 6), it is apparent that many of the protected areas are being impacted by ongoing LULCC [19,80,82]. These have evidently been impacted by multiple infrastructure projects (e.g., construction of reservoirs and roads). Figure 6a,b shows how some forest reserves located in the north–central region have been impacted by road construction and encroachment along roads, while protected areas in the southeast have experienced change due to reservoir and highway construction. Although beyond the scope of this study, changes in forest reserves and protected areas can lead to increasing fragmentation, which can negatively impact the biodiversity of the area [39,83].
A lack of historical LULCC information in Sri Lanka is currently an impediment to the effective implementation of environmental management and planning. The results presented in this paper show that time-series remote sensing using Landsat data can be used to detect LULCC in Sri Lanka. Some of the critical areas that could benefit from these new Earth observations of LULCC include biodiversity conservation and ecosystem management, watershed and water resource management, management of human–elephant conflict and conservation of elephant habitats, natural disaster management and national land use planning. Our study provides an internally consistent synoptic overview of the island state, a view that is historically absent for Sri Lanka for much of the 1990s and early 2000s.
5. Conclusions
This study presents the major land cover change characteristics of Sri Lanka using freely available Landsat time-series data from the last three decades. It provides the first internally consistent dataset on LULCC for Sri Lanka. We created a land cover change map for Sri Lanka incorporating NDVI and NBR LandTrendr metrics, temperature, rainfall and elevation using a random forest model. To achieve this, we created a reference dataset using a multiple lines of evidence approach, representing all major land cover classes, which enabled a holistic view of land cover change across the country. Major results include a high correlation between periods of political instability, war and changes in land use and land cover. LULCC tended to increase during politically stable years when the government implemented infrastructure development schemes and decrease during periods of conflict. Given that 80% of the land in Sri Lanka is state owned, this is perhaps unsurprising. It was also shown that significant LULCC occurred in protected areas. This change and disturbance map has the potential help land managers, nongovernment organisations (NGOs) and policy makers to prevent further disturbance within the ecologically sensitive areas. This study has proposed a time-series remote sensing analytical tool chain that can be used to map LULCC in highly dynamic tropical landscapes and fill a knowledge gap caused by factors ranging from political instability to poor cloud-free image availability.
Supplementary Materials
The following are available online at https://www.mdpi.com/2073-445X/9/1/27/s1, Figure S1: Examples of temporal change trajectories: A: Plantation changed to urban, B: Home garden changed to peri-urban and subsequently to urban, C: Forest changed to water, D: Peri-urban changed to urban, E: Rice paddy changed to water, F: Forest changed to urban, Figure S2: Variable importance graph prepared based on mean decrease accuracy of the random forest model.
Author Contributions
Conceptualisation, C.W.M.R., S.J. and M.S.-B.; Formal analysis, C.W.M.R.; Methodology, C.W.M.R., S.J. and M.S.-B.; Supervision, S.J. and M.S.-B.; Validation, C.W.M.R.; Visualisation, C.W.M.R.; Writing—original draft, C.W.M.R.; Writing—review and editing, S.J. and M.S.-B. All authors have read and agreed to the published version of the manuscript.
Funding
This research received no external funding.
Acknowledgments
The authors would like to thank the anonymous reviewers and editors for their time, constructive feedback and suggestions, which helped to improve the manuscript. They are also grateful to the USGS and their open data policy. They would also like to thank Samuel Hislop and Luke Wallace for valuable discussions regarding image analysis and modelling.
Conflicts of Interest
The authors declare no conflict of interest.
References
- Butchart, S.; Walpole, M.; Collen, B.; Van Strien, A.; Scharlemann, J.; Almond, R.; Baillie, J.E.; Bomhard, B.; Brown, C.; Bruno, J.; et al. Global biodiversity: indicators of recent declines. Science 2010, 328, 1164–1168. [Google Scholar] [CrossRef]
- Kennedy, R.E.; Yang, Z.; Braaten, J.; Copass, C.; Antonova, N.; Jordan, C.; Nelson, P. Attribution of disturbance change agent from Landsat time-series in support of habitat monitoring in the Puget Sound region, USA. Remote Sens. Environ. 2015, 166, 271–285. [Google Scholar] [CrossRef]
- De Giglio, M.; Allocca, M.; Franci, F. Multitemporal analysis of Landsat images to detect land use land cover changes for monitoring soil sealing in the Nola area (Naples, Italy). In Proceedings of the Earth Resources and Environmental Remote Sensing/GIS Applications VII, Edinburgh, UK, 26–29 September 2016. [Google Scholar]
- Li, M.S.; Mao, L.J.; Shen, W.J.; Liu, S.Q.; Wei, A.S. Change and fragmentation trends of Zhanjiang mangrove forests in southern China using multi-temporal Landsat imagery (1977–2010). Estuar. Coast. Shelf Sci. 2013, 130, 111–120. [Google Scholar] [CrossRef]
- Zoran, M.; Zoran, L.F.; Dida, A.; Dida, M.R. Climate changes and their impacts on Romanian mountain forests. In Proceedings of the Remote Sensing for Agriculture, Ecosystems, and Hydrology XIV Conference, Edinburgh, UK, 23 October 2012. [Google Scholar] [CrossRef]
- Kamwi, J.; Cho, M.; Kaetsch, C.; Manda, S.; Graz, F.; Chirwa, P. Assessing the Spatial Drivers of Land Use and Land Cover Change in the Protected and Communal Areas of the Zambezi Region, Namibia. Land 2018, 7, 131. [Google Scholar] [CrossRef] [Green Version]
- Vermote, E.; Justice, C.; Claverie, M.; Franch, B. Preliminary analysis of the performance of the Landsat 8/OLI land surface reflectance product. Remote Sens. Environ. 2016, 185, 46–56. [Google Scholar] [CrossRef]
- Souza-Filho, P.W.M.; de Souza, E.B.; Silva Júnior, R.O.; Nascimento, W.R., Jr.; Versiani de Mendonça, B.R.; Guimarães, J.T.F.; Dall’Agnol, R.; Siqueira, J.O. Four decades of land-cover, land-use and hydroclimatology changes in the Itacaiúnas River watershed, southeastern Amazon. J. Environ. Manag. 2016, 167, 175–184. [Google Scholar] [CrossRef]
- Shen, G.; Ibrahim, A.N.; Wang, Z.; Ma, C.; Gong, J. Spatial–temporal land-use/land-cover dynamics and their impacts on surface temperature in Chongming Island of Shanghai, China. Int. J. Remote Sens. 2015, 36, 4037–4053. [Google Scholar] [CrossRef]
- Park, J.K.; Um, D.Y. Time series analysis of land cover and land surface temperature change using remote sensing method in Seoul. Int. J. Appl. Eng. Res. 2015, 10, 39201–39207. [Google Scholar]
- Dissanayake, S.; Asafu-Adjaye, J.; Mahadeva, R. Addressing climate change cause and effect on land cover and land use in South Asia. Land Use Policy 2017, 67, 352–366. [Google Scholar] [CrossRef]
- Lu, D.; Hetrick, S.; Moran, E.; Li, G. Application of time series landsat images to examining land-use/land-cover dynamic change. Photogramm. Eng. Remote Sens. 2012, 78, 747–755. [Google Scholar] [CrossRef] [Green Version]
- Hansen, M.C.; Loveland, T.R. A review of large area monitoring of land cover change using Landsat data. Remote Sens. Environ. 2012, 122, 66–74. [Google Scholar] [CrossRef]
- Mitra, A.P.; Mitra, A.P.; Sharma, C. Global Environmental Changes in South Asia a Regional Perspective; Capital Pub. Co.: New Delhi, India, 2010. [Google Scholar]
- Mapa, R.; Kumaragamage, D.; Gunarathne, W.; Dassanayake, A. Land use in Sri Lanka: Past, present and the future. In Proceedings of the 17th World Congress of Social Science (WCSS), Bangkok, Thailand, 14–21 August 2002. [Google Scholar]
- Suthakar, K.; Bui, E.N. Land use/cover changes in the war-ravaged Jaffna Peninsula, Sri Lanka, 1984-early 2004. Singap. J. Trop. Geogr. 2008, 29, 205–220. [Google Scholar] [CrossRef]
- Subasinghe, S.; Estoque, R.C.; Murayama, Y. Spatiotemporal analysis of urban growth using GIS and remote sensing: A case study of the Colombo Metropolitan Area, Sri Lanka. ISPRS Int. J. Geo-Inf. 2016, 5, 197. [Google Scholar] [CrossRef] [Green Version]
- Hapugala, G. Projecting land use transitions in the Gin Catchment, Sri Lanka. Res. J. Environ. Earth Sci. 2013, 5, 473–480. [Google Scholar]
- Perera, K.; Tsuchiya, K. Experiment for mapping land cover and it’s change in southeastern Sri Lanka utilizing 250m resolution MODIS imageries. Adv. Space Res. 2009, 43, 1349–1355. [Google Scholar] [CrossRef]
- Näsström, R.; Mattsson, E. Country Report Sri Lanka:Land-Use Change and Forestry at the National and Sub-National Level (Focali Report); University of Gothenburg: Gothenburg, Sweden, 2011. [Google Scholar]
- The World Bank. World Development Indicators; GDP Per Capita Growth (Annual%). Available online: https://data.worldbank.org/indicator/NY.GDP.PCAP.KD.ZG?end=2017&locations=LK&start=1960&view=chart&year_high_desc=false (accessed on 20 November 2018).
- Athukorala, P.-C.; Ginting, E.; Hill, H.; Kumar, U. The Sri Lankan Economy: Charting a New Course; Asian Development Bank: Metro Manila, Philippines, 2017. [Google Scholar]
- Gómez, C.; White, J.C.; Wulder, M.A. Optical remotely sensed time series data for land cover classification: A review. ISPRS J. Photogramm. Remote Sens. 2016, 116, 55–72. [Google Scholar] [CrossRef] [Green Version]
- Yin, H.; Prishchepov, A.V.; Kuemmerle, T.; Bleyhl, B.; Buchner, J.; Radeloff, V.C. Mapping agricultural land abandonment from spatial and temporal segmentation of Landsat time series. Remote Sens. Environ. 2018, 210, 12–24. [Google Scholar] [CrossRef]
- Yang, Y.; Erskine, P.D.; Lechner, A.M.; Mulligan, D.; Zhang, S.; Wang, Z. Detecting the dynamics of vegetation disturbance and recovery in surface mining area via Landsat imagery and LandTrendr algorithm. J. Clean. Prod. 2018, 178, 353–362. [Google Scholar] [CrossRef]
- Jakimow, B.; Griffiths, P.; van der Linden, S.; Hostert, P. Mapping pasture management in the Brazilian Amazon from dense Landsat time series. Remote Sens. Environ. 2018, 205, 453–468. [Google Scholar] [CrossRef]
- Hislop, S.; Jones, S.; Soto-Berelov, M.; Skidmore, A.; Haywood, A.; Nguyen, H.T. Using Landsat Spectral Indices in Time-Series to Assess Wildfire Disturbance and Recovery. Remote Sens. 2018, 10, 460. [Google Scholar] [CrossRef] [Green Version]
- Nguyen, T.H.; Jones, S.D.; Soto-Berelov, M.; Haywood, A.; Hislop, S. A spatial and temporal analysis of forest dynamics using Landsat time-series. Remote Sens. Environ. 2018, 217, 461–475. [Google Scholar] [CrossRef]
- Kennedy, R.E.; Yang, Z.; Cohen, W.B. Detecting trends in forest disturbance and recovery using yearly Landsat time series: 1. LandTrendr—Temporal segmentation algorithms. Remote Sens. Environ. 2010, 114, 2897–2910. [Google Scholar] [CrossRef]
- Wulder, M.A.; White, J.C.; Loveland, T.R.; Woodcock, C.E.; Belward, A.S.; Cohen, W.B.; Fosnight, E.A.; Shaw, J.; Masek, J.G.; Roy, D.P. The global Landsat archive: Status, consolidation, and direction. Remote Sens. Environ. 2016, 185, 271–283. [Google Scholar] [CrossRef] [Green Version]
- Wulder, M.A.; White, J.C.; Goward, S.N.; Masek, J.G.; Irons, J.R.; Herold, M.; Cohen, W.B.; Loveland, T.R.; Woodcock, C.E. Landsat continuity: Issues and opportunities for land cover monitoring. Remote Sens. Environ. 2008, 112, 955–969. [Google Scholar] [CrossRef]
- Woodcock, C.E.; Allen, R.; Anderson, M.; Belward, A.; Bindschadler, R.; Cohen, W.; Gao, F.; Goward, S.N.; Helder, D.; Helmer, E. Free access to Landsat imagery. Science 2008, 320, 1011. [Google Scholar] [CrossRef] [PubMed]
- Zhu, Z.; Wulder, M.A.; Roy, D.P.; Woodcock, C.E.; Hansen, M.C.; Radeloff, V.C.; Healey, S.P.; Schaaf, C.; Hostert, P.; Strobl, P.; et al. Benefits of the free and open Landsat data policy. Remote Sens. Environ. 2019, 224, 382–385. [Google Scholar] [CrossRef]
- Wulder, M.A.; Loveland, T.R.; Roy, D.P.; Crawford, C.J.; Masek, J.G.; Woodcock, C.E.; Allen, R.G.; Anderson, M.C.; Belward, A.S.; Cohen, W.B.; et al. Current status of Landsat program, science, and applications. Remote Sens. Environ. 2019, 225, 127–147. [Google Scholar] [CrossRef]
- Department of the Interior U.S. Geological Survey. Product Guide:Landsat Surface Reflectance-Derived Spectral Indices. Available online: https://landsat.usgs.gov/sites/default/files/documents/si_product_guide.pdf (accessed on 18 February 2019).
- Vogelmann, J.E.; Gallant, A.L.; Shi, H.; Zhu, Z. Perspectives on monitoring gradual change across the continuity of Landsat sensors using time-series data. Remote Sens. Environ. 2016, 185, 258–270. [Google Scholar] [CrossRef] [Green Version]
- Zhu, Z. Change detection using landsat time series: A review of frequencies, preprocessing, algorithms, and applications. ISPRS J. Photogramm. Remote Sens. 2017, 130, 370–384. [Google Scholar] [CrossRef]
- Franklin, S.E.; Ahmed, O.S.; Wulder, M.A.; White, J.C.; Hermosilla, T.; Coops, N.C. Large Area Mapping of Annual Land Cover Dynamics Using Multitemporal Change Detection and Classification of Landsat Time Series Data. Can. J. Remote Sens. 2015, 41, 293–314. [Google Scholar] [CrossRef]
- Sudhakar Reddy, C.; Saranya, K.R.L.; Vazeed Pasha, S.; Satish, K.V.; Jha, C.S.; Diwakar, P.G.; Dadhwal, V.K.; Rao, P.V.N.; Krishna Murthy, Y.V.N. Assessment and monitoring of deforestation and forest fragmentation in South Asia since the 1930s. Glob. Planet. Chang. 2018, 161, 132–148. [Google Scholar] [CrossRef]
- Wohlfart, C.; Liu, G.; Huang, C.; Kuenzer, C. A River Basin over the course of time: Multi-temporal analyses of land surface dynamics in the Yellow River Basin (China) based on medium resolution remote sensing data. Remote Sens. 2016, 8, 186. [Google Scholar] [CrossRef] [Green Version]
- DeVries, B.; Verbesselt, J.; Kooistra, L.; Herold, M. Robust monitoring of small-scale forest disturbances in a tropical montane forest using Landsat time series. Remote Sens. Environ. 2015, 161, 107–121. [Google Scholar] [CrossRef]
- Julien, Y.; Sobrino, J.A.; Jiménez-Muñoz, J.C. Land use classification from multitemporal landsat imagery using the yearly land cover dynamics (YLCD) method. Int. J. Appl. Earth Obs. Geoinf. 2011, 13, 711–720. [Google Scholar] [CrossRef]
- Rogan, J.; Miller, J.; Stow, D.; Franklin, J.; Levien, L.; Fischer, C. Land-cover change monitoring with classification trees using Landsat TM and ancillary data. Photogramm. Eng. Remote Sens. 2003, 69, 793–804. [Google Scholar] [CrossRef] [Green Version]
- Verbesselt, J.; Hyndman, R.; Newnham, G.; Culvenor, D. Detecting trend and seasonal changes in satellite image time series. Remote Sens. Environ. 2010, 114, 106–115. [Google Scholar] [CrossRef]
- Yin, H.; Pflugmacher, D.; Kennedy, R.E.; Sulla-Menashe, D.; Hostert, P. Mapping Annual Land Use and Land Cover Changes Using MODIS Time Series. IEEE J. Sel. Top. Appl. Earth Obs. Remote Sens. 2014, 7, 3421–3427. [Google Scholar] [CrossRef]
- Zhu, Z.; Fu, Y.; Woodcock, C.E.; Olofsson, P.; Vogelmann, J.E.; Holden, C.; Wang, M.; Dai, S.; Yu, Y. Including land cover change in analysis of greenness trends using all available Landsat 5, 7, and 8 images: A case study from Guangzhou, China (2000–2014). Remote Sens. Environ. 2016, 185, 243–257. [Google Scholar] [CrossRef] [Green Version]
- Wulder, M.A.; Hobart, G.W.; Luther, J.E.; Hermosilla, T.; Griffiths, P.; Coops, N.C.; Hall, R.J.; Hostert, P.; Dyk, A.; Guindon, L. Pixel-based image compositing for large-area dense time series applications and science. Can. J. Remote Sens. 2014, 40, 192–212. [Google Scholar] [CrossRef] [Green Version]
- Department of Census Statistics Sri Lanka. Available online: http://www.statistics.gov.lk/PopHouSat/CPH2011/Pages/Activities/Reports/FinalReport/FinalReportE.pdf (accessed on 15 January 2018).
- Survey Department of Sri Lanka. The National Atlas of Sri Lanka; Government Press: Colombo, Sri Lanka, 2007.
- NASA/METI/AIST/Japan Spacesystems, and U.S./Japan ASTER Science Team. ASTER Global Digital Elevation Model V003. Available online: https://doi.org/10.5067/ASTER/ASTGTM.003 (accessed on 14 September 2018).
- Kadupitiya, H.K.; NaturalResources Management Centre-Department of Agriculture, Peradeniya, Sri Lanka. Personal communication, 2017.
- Kumarihamy, R.M.K.; Center for Environment Studies-University of Peradeniya, Peradeniya, Sri Lanka. Personal communication, 2019.
- Department of Census Statistics-Ministry of Policy Planning and Economic Affairs. Census of Population and Housing Sri Lanka. 2012. Available online: http://www.statistics.gov.lk/PopHouSat/CPH2011/Pages/Activities/Reports/FinalReport/FinalReportE.pdf (accessed on 14 February 2019).
- Chandrapala, A.G.; Natural Resources Management Centre - Department of Agriculture, Peradeniya, Sri Lanka. Personal communication, 2018.
- Department of Forest Conservation Sri Lanka. Digital Forest Cover Data; Department of Forest Conservation: Colombo, Sri Lanka, 2010.
- Masek, J.G.; Vermote, E.F.; Saleous, N.E.; Wolfe, R.; Hall, F.G.; Huemmrich, K.F.; Feng, G.; Kutler, J.; Teng-Kui, L. A Landsat surface reflectance dataset for North America, 1990–2000. IEEE Geosci. Remote Sens. Lett. 2006, 3, 68–72. [Google Scholar] [CrossRef]
- Zhu, Z.; Woodcock, C.E. Object-based cloud and cloud shadow detection in Landsat imagery. Remote Sens. Environ. 2012, 118, 83–94. [Google Scholar] [CrossRef]
- Barsi, A.J.; Lee, K.; Kvaran, G.; Markham, L.B.; Pedelty, A.J. The Spectral Response of the Landsat-8 Operational Land Imager. Remote Sens. 2014, 6, 10232–10251. [Google Scholar] [CrossRef] [Green Version]
- Braaten, J.D.; Cohen, W.B.; Yang, X. LandsatLinkr. Available online: http://dx.doi.org/10.5281/zenodo.807733 (accessed on 20 January 2019).
- Kennedy, R.E.; Braaten, J.; Yang, Z.; Nelson, P.; Duane, M. LandTrendr Version 3.0, Users Guide, Version 0.1. Available online: https://github.com/KennedyResearch/LandTrendr-2012/commit/33fe7fa64f89ea3b8224a41a1afe10714dba82aa#diff-aaa863aee325cdfc22274571af3c6a7a (accessed on 1 October 2017).
- Mu, X.; Hu, M.; Song, W.; Ruan, G.; Ge, Y.; Wang, J.; Huang, S.; Yan, G. Evaluation of Sampling Methods for Validation of Remotely Sensed Fractional Vegetation Cover. Remote Sens. 2015, 7, 15817. [Google Scholar] [CrossRef] [Green Version]
- Mellor, A.; Boukir, S.; Haywood, A.; Jones, S. Exploring issues of training data imbalance and mislabelling on random forest performance for large area land cover classification using the ensemble margin. ISPRS J. Photogramm. Remote Sens. 2015, 105, 155–168. [Google Scholar] [CrossRef]
- Soto-Berelov, M.; Haywood, A.; Jones, S.; Hislop, S.; Nguyen, T. Creating robust reference (training) datasets for large area time series disturbance attribution. In Remote Sensing: Time Series Image Processing; Weng, Q., Ed.; Taylor & Francis: Oxford, UK, 2018. [Google Scholar]
- Cohen, W.B.; Yang, Z.; Kennedy, R. Detecting trends in forest disturbance and recovery using yearly Landsat time series: 2. TimeSync-Tools for calibration and validation. Remote Sens. Environ. 2010, 114, 2911–2924. [Google Scholar] [CrossRef]
- Hermosilla, T.; Wulder, M.A.; White, J.C.; Coops, N.C.; Hobart, G.W. Regional detection, characterization, and attribution of annual forest change from 1984 to 2012 using Landsat-derived time-series metrics. Remote Sens. Environ. 2015, 170, 121–132. [Google Scholar] [CrossRef]
- Liaw, A.; Wiener, M. Classification and regression by randomForest. R News 2002, 2, 18–22. [Google Scholar]
- Eisavi, V.; Homayouni, S.; Yazdi, A.M.; Alimohammadi, A. Land cover mapping based on random forest classification of multitemporal spectral and thermal images. Environ. Monit. Assess. 2015, 187, 291. [Google Scholar] [CrossRef]
- Fick, S.E.; Hijmans, R.J. WorldClim 2: New 1-km spatial resolution climate surfaces for global land areas. Int. J. Climatol. 2017, 37, 4302–4315. [Google Scholar] [CrossRef]
- Sri Lanka—Land Use Land Cover LULC (Change) Mapping. Available online: https://datacatalog.worldbank.org/dataset/sri-lanka-land-use-land-cover-lulc-change-mapping (accessed on 2 January 2018).
- Lindström, S.; Mattsson, E.; Nissanka, S.P. Forest cover change in Sri Lanka: The role of small scale farmers. Appl. Geogr. 2012, 34, 680–692. [Google Scholar] [CrossRef]
- Gunawardena, G.M.; Takeuchi, W. Detection of land use/land cover change in war ravaged area in Sri Lanka using image fusion technique. In Proceedings of the 31st Asian Conference on Remote Sensing 2010, Hanoi, Vietnam, 1–5 November 2010; pp. 1590–1595. [Google Scholar]
- Illangasinghe, S.; Hewawasam, T. A Quantitative Assessment of the Impact of Deforestation on Soil Erosion Rates in Walawe and Kalu Ganga River Basins in Sri Lanka. In Proceedings of the First National Symposium on Natural Resources Management, Department of Natural Resources, Sabaragamuwa University, Belihuloya, Sri Lanka, 29–30 August 2009. [Google Scholar]
- Warnasuriya, T.W.S. Mapping land-use pattern using image processing techniques for Medium resolution satellite data: Case study in Matara District, Sri Lanka. In Proceedings of the 15th International Conference on Advances in ICT for Emerging Regions, Colombo, Sri Lanka, 24–26 August 2015; pp. 106–111. [Google Scholar]
- Takao, G.; Hamzah, K.A.; Faidi, A.M.; Omar, H. Tropical Forest Change Detection by a Trend Analysis of time Series Satellite Images. Available online: https://www.scopus.com/inward/record.uri?eid=2-s2.0-84925424487&partnerID=40&md5=a6926fdf288adb170f366b738dabe60f (accessed on 8 January 2018).
- Kiswanto; Tsuyuki, S.; Mardiany; Sumaryono. Completing yearly land cover maps for accurately describing annual changes of tropical landscapes. Glob. Ecol. Conserv. 2018, 13, e00384. [Google Scholar] [CrossRef]
- Rathnayake, C.W.M.; Simon, J.; Soto-Berelov, M. Identification of Major Trends and Patterns of Land Use and Land Cover Change (LULCC) in Sri Lanka using Landsat Time Series Imagery. In Proceedings of the Asian Conference on Remote Sensing (ACRS), Kuala Lumpur, Malaysia, 5 November 2018; pp. 29–38. [Google Scholar]
- Grogan, K.; Pflugmacher, D.; Hostert, P.; Kennedy, R.; Fensholt, R. Cross-border forest disturbance and the role of natural rubber in mainland Southeast Asia using annual Landsat time series. Remote Sens. Environ. 2015, 169, 438–453. [Google Scholar] [CrossRef]
- Liu, Q.; Li, X.; Hu, L. Image analysis and coummunity monitoring on coniferous forest dynamics in Changbai Mountain. Ying Yong Sheng Tai Xue Bao 2004, 15, 1113–1120. [Google Scholar] [PubMed]
- Fonseka, H.; Zhang, H.; Sun, Y.; Su, H.; Lin, H.; Lin, Y. Urbanization and Its Impacts on Land Surface Temperature in Colombo Metropolitan Area, Sri Lanka, from 1988 to 2016. Remote Sens. 2019, 11, 957. [Google Scholar] [CrossRef] [Green Version]
- Wikramanayake, E.; Buthpitiya, V. Integrated Spatial Planning and Analysis to Prioritize Biodiversity Conservation in Sri Lanka; Environmental Foundation (Guarantee) Limited & National Biodiversity Secretariat of Ministry of Mahaweli Development and Environment: Colombo, Sri Lanka, 2017.
- Samarakoon, M.T. Moragahakanda development project in Sri Lanka: Localization of development projects in rural and effects on communities. Arts Humanit. Open Access J. 2018. [Google Scholar] [CrossRef]
- Perera, K.; Tateishi, R. Supporting elephant conservation in Sri Lanka through MODIS imagery. In Proceedings of the SPIE Asia-Pacific Remote Sensing, Kyoto, Japan, 21 November 2012. [Google Scholar]
- Buultjens, J.; Ratnayake, I.; Gnanapala, A.; Aslam, M. Tourism and its implications for management in Ruhuna National Park (Yala), Sri Lanka. Tour. Manag. 2005, 26, 733–742. [Google Scholar] [CrossRef]
Figure 1.
Location of study area (top left—location of Sri Lanka in South Asia; bottom left—Landsat tiles (142/053, 142/054, 142/055, 141/053, 141/054, 141/055, 141/056, 140/055,140/056) of Sri Lanka; right, a composite image of Sri Lanka, 2017, coordinate reference system (CRS) WGS 84-UTM Zone 44N.

Figure 2.
Physical and cultural characteristics in Sri Lanka: (a) elevation [50], (b) climate zones, (c) drainage [51], (d) river basins [52], (e) population density as reported in 2012 [53], (f) railway and road network, (g) paddy and forest cover as reported in 2007 [54] and (h) protected areas as reported in 2010 [55].

Figure 3.
Image shows a heterogeneous landscape in the wet zone highlands. 1: Forest plantation, 2: Rice paddy, 3: Vegetable cultivation, 4: Home garden, 5: Periurban, 6: Recent land clearance for tea cultivation, 7: Scrub, 8: Tea plantation, 9: Natural forest and 10: Stream. Image captured by Chithrangani WM Rathnayake on 15/04/2019 at 7.1106966N, 80.75596E (Elevation: 1200 m).

Figure 4.
Diagram illustrating the workflow implemented in this study.

Figure 5.
Summary of reference pixels (2117) that experienced land cover change over the 1988 to 2018.
Figure 5.
Summary of reference pixels (2117) that experienced land cover change over the 1988 to 2018.

Figure 6.
Areas that experienced a disturbance and/or land use land cover change (LULCC) over the 1993 to 2018 period and the distribution of protected areas and forest reserves across Sri Lanka [55].
Figure 6.
Areas that experienced a disturbance and/or land use land cover change (LULCC) over the 1993 to 2018 period and the distribution of protected areas and forest reserves across Sri Lanka [55].

Figure 7.
Distribution of land cover changes and/or disturbances by defined periods (1993 to 2018). The numbers refer to examples of land cover diversification projects that occurred during the study period: 1. The southern expressway (the first highway in Sri Lanka) and the railway line, 2. Rambakenoya reservoir, 3. Mattala international airport, 4. Moragahakanda reservoir project, 5. Deduru Oya reservoir project, 6. Yaldewi railway line, 7. Lunugamwehera reservoir project and 8. Colombo International Financial City project.

Figure 8.
Annual total area changes/disturbances (ha) across all land cover classes and major historical events occurring in Sri Lanka from 1993 to 2018.
Figure 8.
Annual total area changes/disturbances (ha) across all land cover classes and major historical events occurring in Sri Lanka from 1993 to 2018.

Figure 9.
Two specific case studies of land cover change in protected areas: (a) Land cover change in Karunkalikulam and Padaviya: forest cleared for road construction during and after the war 2008–2018. (b) Deforestation followed by the construction of a reservoir and a road in 2008–2013 in Lunugamwehera National Park and Ruhuna (Yala) National Park.

Figure 10.
Annual growth rates of GNP (gross national production) per capita and value-added industry (including construction) in Sri Lanka from 1990 to 2018, area used for agricultural purposes and forested lands. Gross domestic production (GDP) annual growth [21]. Source: The World Bank, national account data.


Table 1.
Normalised Difference Vegetation Index (NDVI) and Normalised Burn Ratio (NBR) calculation formulas and Landsat bands used for deriving these.
Table 1.
Normalised Difference Vegetation Index (NDVI) and Normalised Burn Ratio (NBR) calculation formulas and Landsat bands used for deriving these.
| Index | Landsat 4–7 | Landsat 8 |
|---|---|---|
| NBR (NIR - SWIR)/(NIR + SWIR) | (Band 4 − Band 7)/ (Band 4 + Band 7) | (Band 5 − Band 7)/ (Band 5 + Band 7) |
| NDVI (NIR − R)/(NIR + R) | (Band 4 − Band 3)/ (Band 4 + Band 3) | (Band 5 − Band 4)/ (Band 5 + Band 4) [35] |
Table 2.
Distribution of sample pixels according to different land cover classes.
| Land Cover | Description | No. of Sample Pixels |
|---|---|---|
| Forest | Areas of natural forest | 306 |
| Home garden | Areas of homestead and gardens | 600 |
| Paddy | Areas of rice cultivation | 374 |
| Periurban | Areas of transforming to urban | 50 |
| Plantation | Areas of main plantation crops (tea, rubber, coconut, forest plantation and palmyra) | 467 |
| Scrub | Areas of shrubs, grass and barren lands | 145 |
| Urban | Areas of main towns, cities and buildups | 53 |
| Water | A body of water | 122 |
| Total | 2117 |
Table 3.
Accuracy assessment of land cover change classification.
| Class | Changed | Disturbed | Unchanged | Total | Producer’s Accuracy |
|---|---|---|---|---|---|
| Changed | 456 | 0 | 1 | 457 | 99.78 |
| Disturbed | 0 | 81 | 0 | 81 | 100 |
| Unchanged | 85 | 2 | 963 | 1050 | 91.71 |
| Total | 541 | 83 | 964 | 1588 | |
| User’s accuracy | 84.28 | 97.59 | 99.89 |
Table 4.
Cross-validation results of classification prediction.
| Prediction | Reference | ||||
|---|---|---|---|---|---|
| Changed | Disturbed | Unchanged | Sum | Accuracy | |
| Changed | 131 | 0 | 31 | 162 | 80.86 |
| Disturbed | 0 | 22 | 0 | 22 | 100 |
| Unchanged | 0 | 0 | 345 | 345 | 100 |
| Total | 131 | 22 | 376 | 529 | |
| Accuracy | 100 | 100 | 91.75 | 94.14 | |
© 2020 by the authors. Licensee MDPI, Basel, Switzerland. This article is an open access article distributed under the terms and conditions of the Creative Commons Attribution (CC BY) license (http://creativecommons.org/licenses/by/4.0/).
Share and Cite
MDPI and ACS Style
Rathnayake, C.W.; Jones, S.; Soto-Berelov, M. Mapping Land Cover Change over a 25-Year Period (1993–2018) in Sri Lanka Using Landsat Time-Series. Land 2020, 9, 27. https://doi.org/10.3390/land9010027
AMA Style
Rathnayake CW, Jones S, Soto-Berelov M. Mapping Land Cover Change over a 25-Year Period (1993–2018) in Sri Lanka Using Landsat Time-Series. Land. 2020; 9(1):27. https://doi.org/10.3390/land9010027
Chicago/Turabian StyleRathnayake, Chithrangani WM, Simon Jones, and Mariela Soto-Berelov. 2020. "Mapping Land Cover Change over a 25-Year Period (1993–2018) in Sri Lanka Using Landsat Time-Series" Land 9, no. 1: 27. https://doi.org/10.3390/land9010027
Note that from the first issue of 2016, this journal uses article numbers instead of page numbers. See further details here.