Article

Impacts of Public and Private Sector Policies on Soybean and Pasture Expansion in Mato Grosso—Brazil from 2001 to 2017

by
Michelle C. A. Picoli
1,*,†,
Ana Rorato
1,†,
Pedro Leitão
2,3,†,
Gilberto Camara
1,4,†,
Adeline Maciel
1,†,
Patrick Hostert
3,5,† and
Ieda Del’Arco Sanches
1
1
National Institute for Space Research (INPE), São José dos Campos 12227-010, Brazil
2
Department Landscape Ecology and Environmental Systems Analysis, Technisches Universität Braunschweig, 38106 Braunschweig, Germany
3
Geography Department, Humboldt-Universität zu Berlin, 12489 Berlin, Germany
4
Group on Earth Observations (GEO), CH-1211 Geneva, Switzerland
5
Humboldt-Universität zu Berlin, Integrative Research Institute on Transformations of Human-Environment Systems (IRI THESys), 10117 Berlin, Germany
*
Author to whom correspondence should be addressed.
These authors contributed equally to this work.
Submission received: 17 November 2019 / Revised: 15 December 2019 / Accepted: 18 December 2019 / Published: 13 January 2020

Abstract

:
Demand for agricultural exports in Brazil has stimulated the expansion of crop production and cattle raising, which has caused environmental impacts. In response, Brazil developed public policies such as the new Forest Code (FC) and supply chain arrangements such the Soy and the Cattle Moratoriums. This paper analyzes the effectiveness of these policies, considering the trajectories of agricultural expansion in the state of Mato Grosso in three years: 2005 (pre-moratorium and before the new FC), 2010 (post-moratorium and before the new FC) and 2017 (post-moratorium and post-new FC). Our analysis uses a detailed land use change data for both the Amazon and Cerrado biomes in Mato Grosso. In all the years considered, soybean expansion occurred in consolidated production areas and by conversion of pastures. Pasture expansion is influenced by existence of pastures nearby, by areas of secondary vegetation and deforestation. Our data and models show the effectiveness of public policies and private arrangements to reduce direct conversion from forests to crop production. However, our results also provide evidence that soybean expansion has caused indirect impacts by replacing pasture areas and causing pasture expansion elsewhere. Evidence from our work indicates that Brazil needs broader-ranging land use policies than what was done in the 2010s to be able to reach the land use goals stated in its Nationally Determined Contribution (NDC) to the Paris Agreement.

1. Introduction

Brazil is the world’s third biggest exporter of agricultural products, with 5.7% of global agricultural exports [1]. It is the second biggest producer of soybeans and is a large producer and exporter of sugar and ethanol, meat (poultry and beef), maize, and coffee. However, since crop production and cattle raising in Brazil have caused deforestation, land degradation, and biodiversity losses [2,3], Brazil needs public policies that balance economic gains from the land sector with environmental protection. For the best results, these policies should be evidence-based.
Public policies are sets of programs, laws, regulations, measures, and activities devised by the State (either directly or indirectly), including public or private entities. Despite differences between countries, current best practices emphasize improving the wellbeing of the population while preserving the environment for future generations. Furthermore, failures in public policies can have global consequences. Such is the case of land use policies. The future of the world’s natural biomes such as Amazonia depends on informed decisions that consider the impact of agriculture in environmental sensitive areas. These decisions have to be constantly updated with monitoring activities and qualified data analysis.
Given the need for informed decision-making in land use policies, this paper analyzes the trade-offs between production and protection in two biomes in Brazil that are particularly vulnerable to agricultural expansion: Amazonia and Cerrado. Amazonia is the biggest biome in Brazil, with an area of 420 million ha (Mha), and is home to 2500 tree species and 30,000 plant species [4]. Cerrado is the second biggest biome, with an area of 204 Mha which is about 20% of the Brazilian territory. A global biodiversity hotspot, the Cerrado biome has many endemic species; over 11,000 native plant species have been identified [4]. Both Amazonia and Cerrado have been under threat since the 1980s due to agricultural expansion. According to data from INPE (Brazil’s National Institute for Space Research), by 2019, the Amazon biome had lost about 20% of its tropical forest. Beuchle et al. [5] estimate that by 2010, Cerrado had lost 50% of its natural vegetation cover.
Two types of land use policies in Brazil address the environmental impacts of agricultural expansion: public actions based on a “command and control” strategy and private supply chain arrangements [6]. The “command and control” actions rely on law enforcement, especially the provisions of the Forest Code, which mandates levels of environmental protection for private lands. Brazil’s Forest Code was created in 1965 (Law no. 4.771, 15 September 1965) and amended in 2012 (Law no. 12.651, 25 May 2012). The Code determines that a proportion of natural vegetation in all private rural lands has to be preserved and forbids natural vegetation removal in sensitive areas such as hilltops and close to watersheds. The proportion of land that has to be preserved by private owners depends on the biome. In the forested areas of Amazonia, owners have to preserve 80% of their land; in the Cerrado, the proportion is 35%. Using the Forest Code as a basis for law enforcement, Brazil reduced deforestation in the Amazon biome by 80% from 2005 until 2010 [7]. However, there are doubts as to limits of a “command and control” policy that is not complemented with economic incentives [6].
Supply chain arrangements are incentive-based. Companies are expected to abide by legal or collective norms; in return, they improve their reputation with concerned customers and governments [8]. In Brazil, the Soy Moratorium is a good case of market-based policies aimed at promoting environmental protection. The Soy Moratorium is a voluntary agreement between industry, government, and civil society that forbids the purchasing of soybeans grown in the Amazon biome areas that have been deforested since 2008 [9]. Between 2004 and 2005, 30% of soybean expansion in Amazonia resulted from deforestation; in 2014, soybean expansion was responsible for 1% of land use conversion from forest [10]. The scientific consensus [10,11,12] is that the Soy Moratorium has had a positive effect on reducing direct conversion of forests into croplands.
The positive example of the Soy Moratorium has encouraged meat producers to follow. In 2009, driven by a Greenpeace campaign against illegal practices in slaughterhouses, four large meat-packers signed an agreement known as the Cattle Moratorium [13]. These companies banned from their supply chain livestock producers who converted forest areas to pastureland in Amazonia after October 2009. Despite the Soy and Cattle Moratorium and the enforcement of the new Forest Code, deforestation rates are still high. After falling from 2.7 Mha in 2004 to 0.7 Mha in 2009, deforestation rates from 2009 to 2018 have fluctuated around a mean of 0.6 Mha, with a minimum rate of 0.4 Mha in 2012 [14]. In 2019, deforestation rose significantly to close to 1 Mha. Understanding the persistence of high deforestation rates is a prime motivation for the current paper.
One possible cause of current deforestation is that “command-and-control” actions have limits in Brazil, because of different interests of the federal government and local municipalities. Most law enforcement actions in Amazonia are taken by federal government officials. In local municipalities, there is an entanglement of interests between elected officials and deforesters. Most times, actions of the federal government are not supported by local authorities, making it hard to reach a situation of zero illegal deforestation [15]. Furthermore, strong law enforcement actions of the 2000s and 2010s led to a political backlash. In Brazil’s 2018 elections, many of the affected farmers reacted by backing the right-wing candidate; since he was elected, the current Brazilian president has reduced the law enforcement actions of public agencies.
A second possible cause for the persistence of deforestation is the lack of effectiveness of market arrangements. While studies have shown that the Soy Moratorium has a positive effect on reducing direct conversion from forests to croplands [11], the impact of indirect conversion is not so well-studied. Indirect conversion refers to the replacement of pasture areas by croplands, leading to pasture expansion in forest areas. Such an analysis requires the availability of detailed data on different kinds of land use change.
Based on the above motivation, this paper seeks to contribute to the discussion of the effectiveness of public policies and market-based arrangements, analyzing agricultural expansion in the Brazilian state of Mato Grosso in three different years: 2005 (pre-moratorium and before the new Forest Code), 2010 (post-moratorium and before the new Forest Code), and 2017 (post-moratorium and post new Forest Code).
Mato Grosso is one of the world’s agricultural frontiers [12,16,17,18]. It is the third biggest state of Brazil, with an area of 90.3 Mha, and contains part of three Brazilian biomes: Cerrado, Amazon, and Pantanal. From 2006 to 2017, Brazil’s National Institute for Space Research (INPE) estimates that 4.1 million ha of natural forests of the Amazon biome in the State of Mato Grosso was clear cut. INPE also estimates that, from 2006 to 2017, over 2.8 Mha of natural cerrado vegetation was cleared in Mato Grosso. Between 2006 and 2017, soybean producing areas in Mato Grosso grew from 5.8 to 9.3 Mha, an increase of 59.5% [19]. Pastureland also increased from 22.1 to 23 Mha [20]. Understanding the key factors that determine the spatial patterns of soybean and pasture expansion can help to define public policies that reduce environmental vulnerability.
Previous studies of agricultural expansion dynamics in Mato Grosso have been constrained by their input data. Until recently, there were no publicly available datasets that provided detailed information on land use conversions on the whole state. To our best knowledge, the data set produced by the authors [21] is the first one to provide detailed land use change data for both the Amazonia and Cerrado biomes in the State of Mato Grosso for the period 2001 to 2017. Partly because of the lack of data, previous studies on agricultural dynamics in Mato Grosso focused on specific areas or on limited types of land use. Gollnow et al. [22] analyzed deforestation drivers along the BR-163 road, which crosses the States of Mato Grosso and Pará, using agricultural statistics at the municipality level [19]. By means of panel regression models, the authors found a weak but significant correlation between agricultural expansion (livestock and soybeans) and deforestation between 2001 and 2004. From 2005 onward, deforestation rates fell; the authors could no longer find a significant correlation between agricultural expansion and forest loss in their study region. Gusso et al. [23] studied direct conversion from forest to soybeans in the State of Mato Grosso from 2001 to 2013. The authors compared soybean expansion area, soy prices, and soy production costs. Their results suggest that expected profit influences soybean expansion in Mato Grosso.
The present paper contributes to broaden the discussion. Our analysis uses yearly maps of land use and cover change that account for direct and indirect conversions. In addition to direct change from natural vegetation to soybean and pasture, we also consider conversion in two steps, from forest to pasture and from pasture to soybeans. We estimate the relative importance of the main drivers of direct and indirect agricultural expansion in the State of Mato Grosso. The results help to evaluate the effectiveness of Brazilian land use policies.

2. Materials and Methods
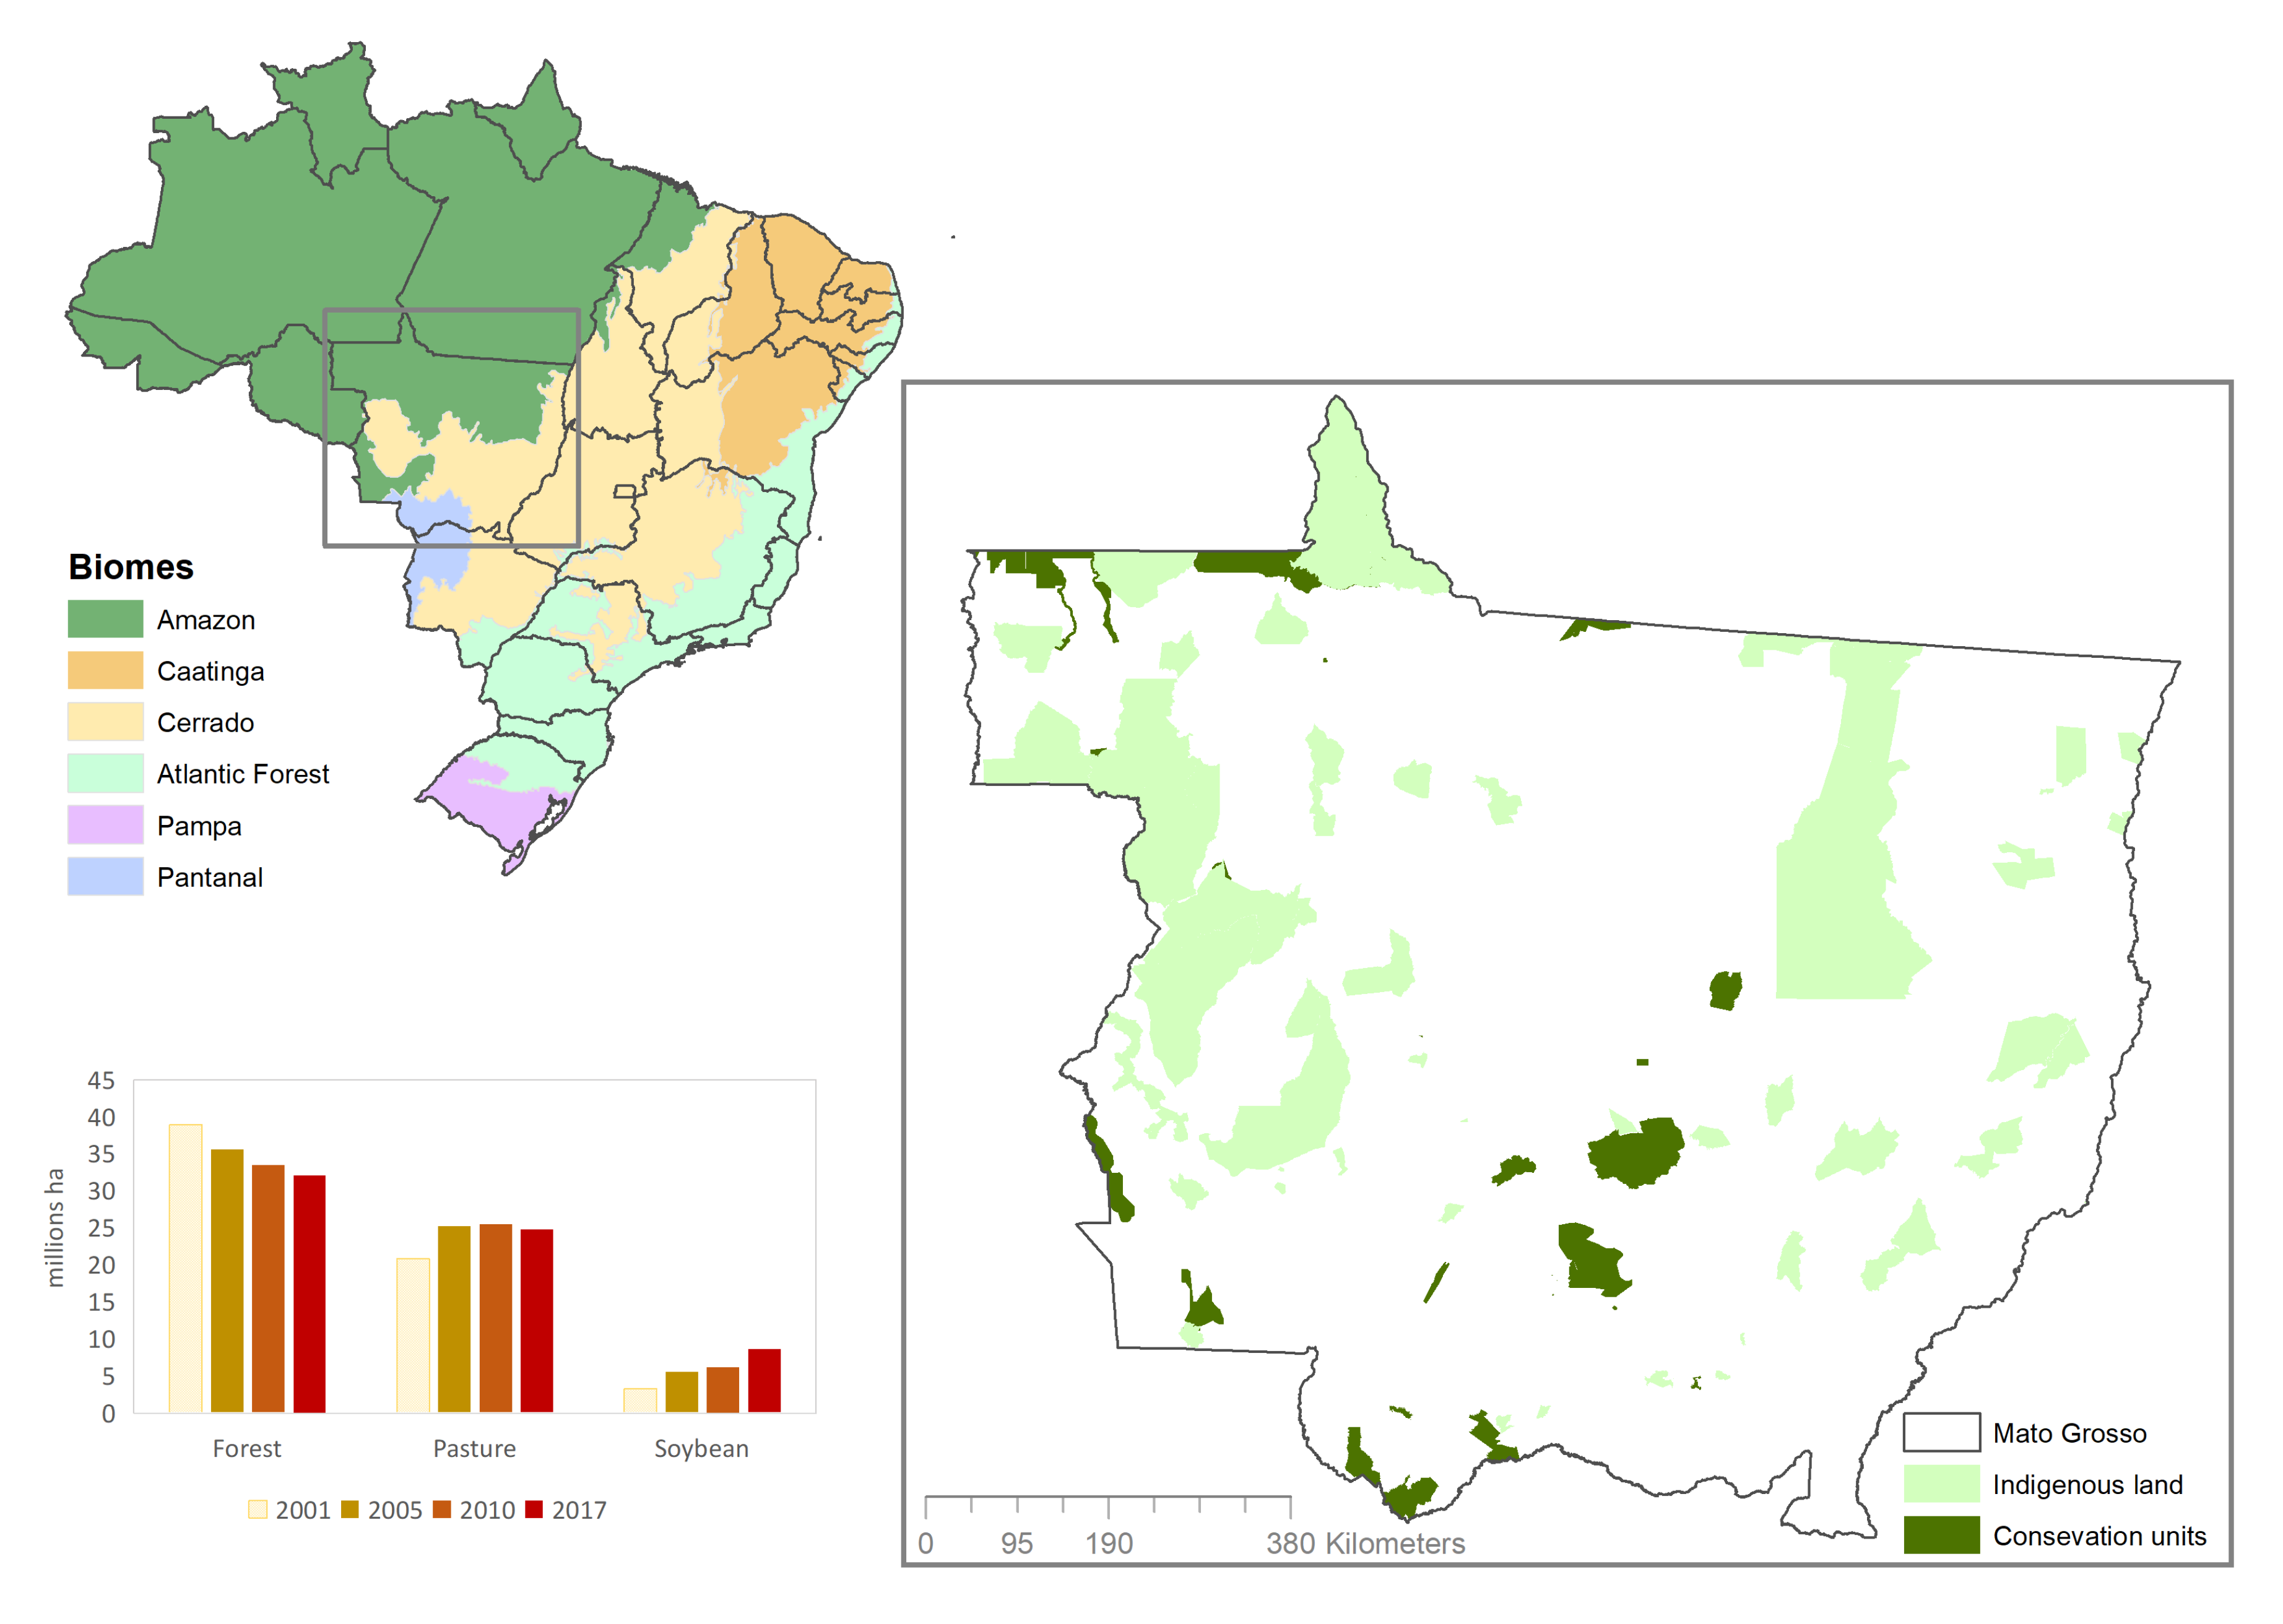
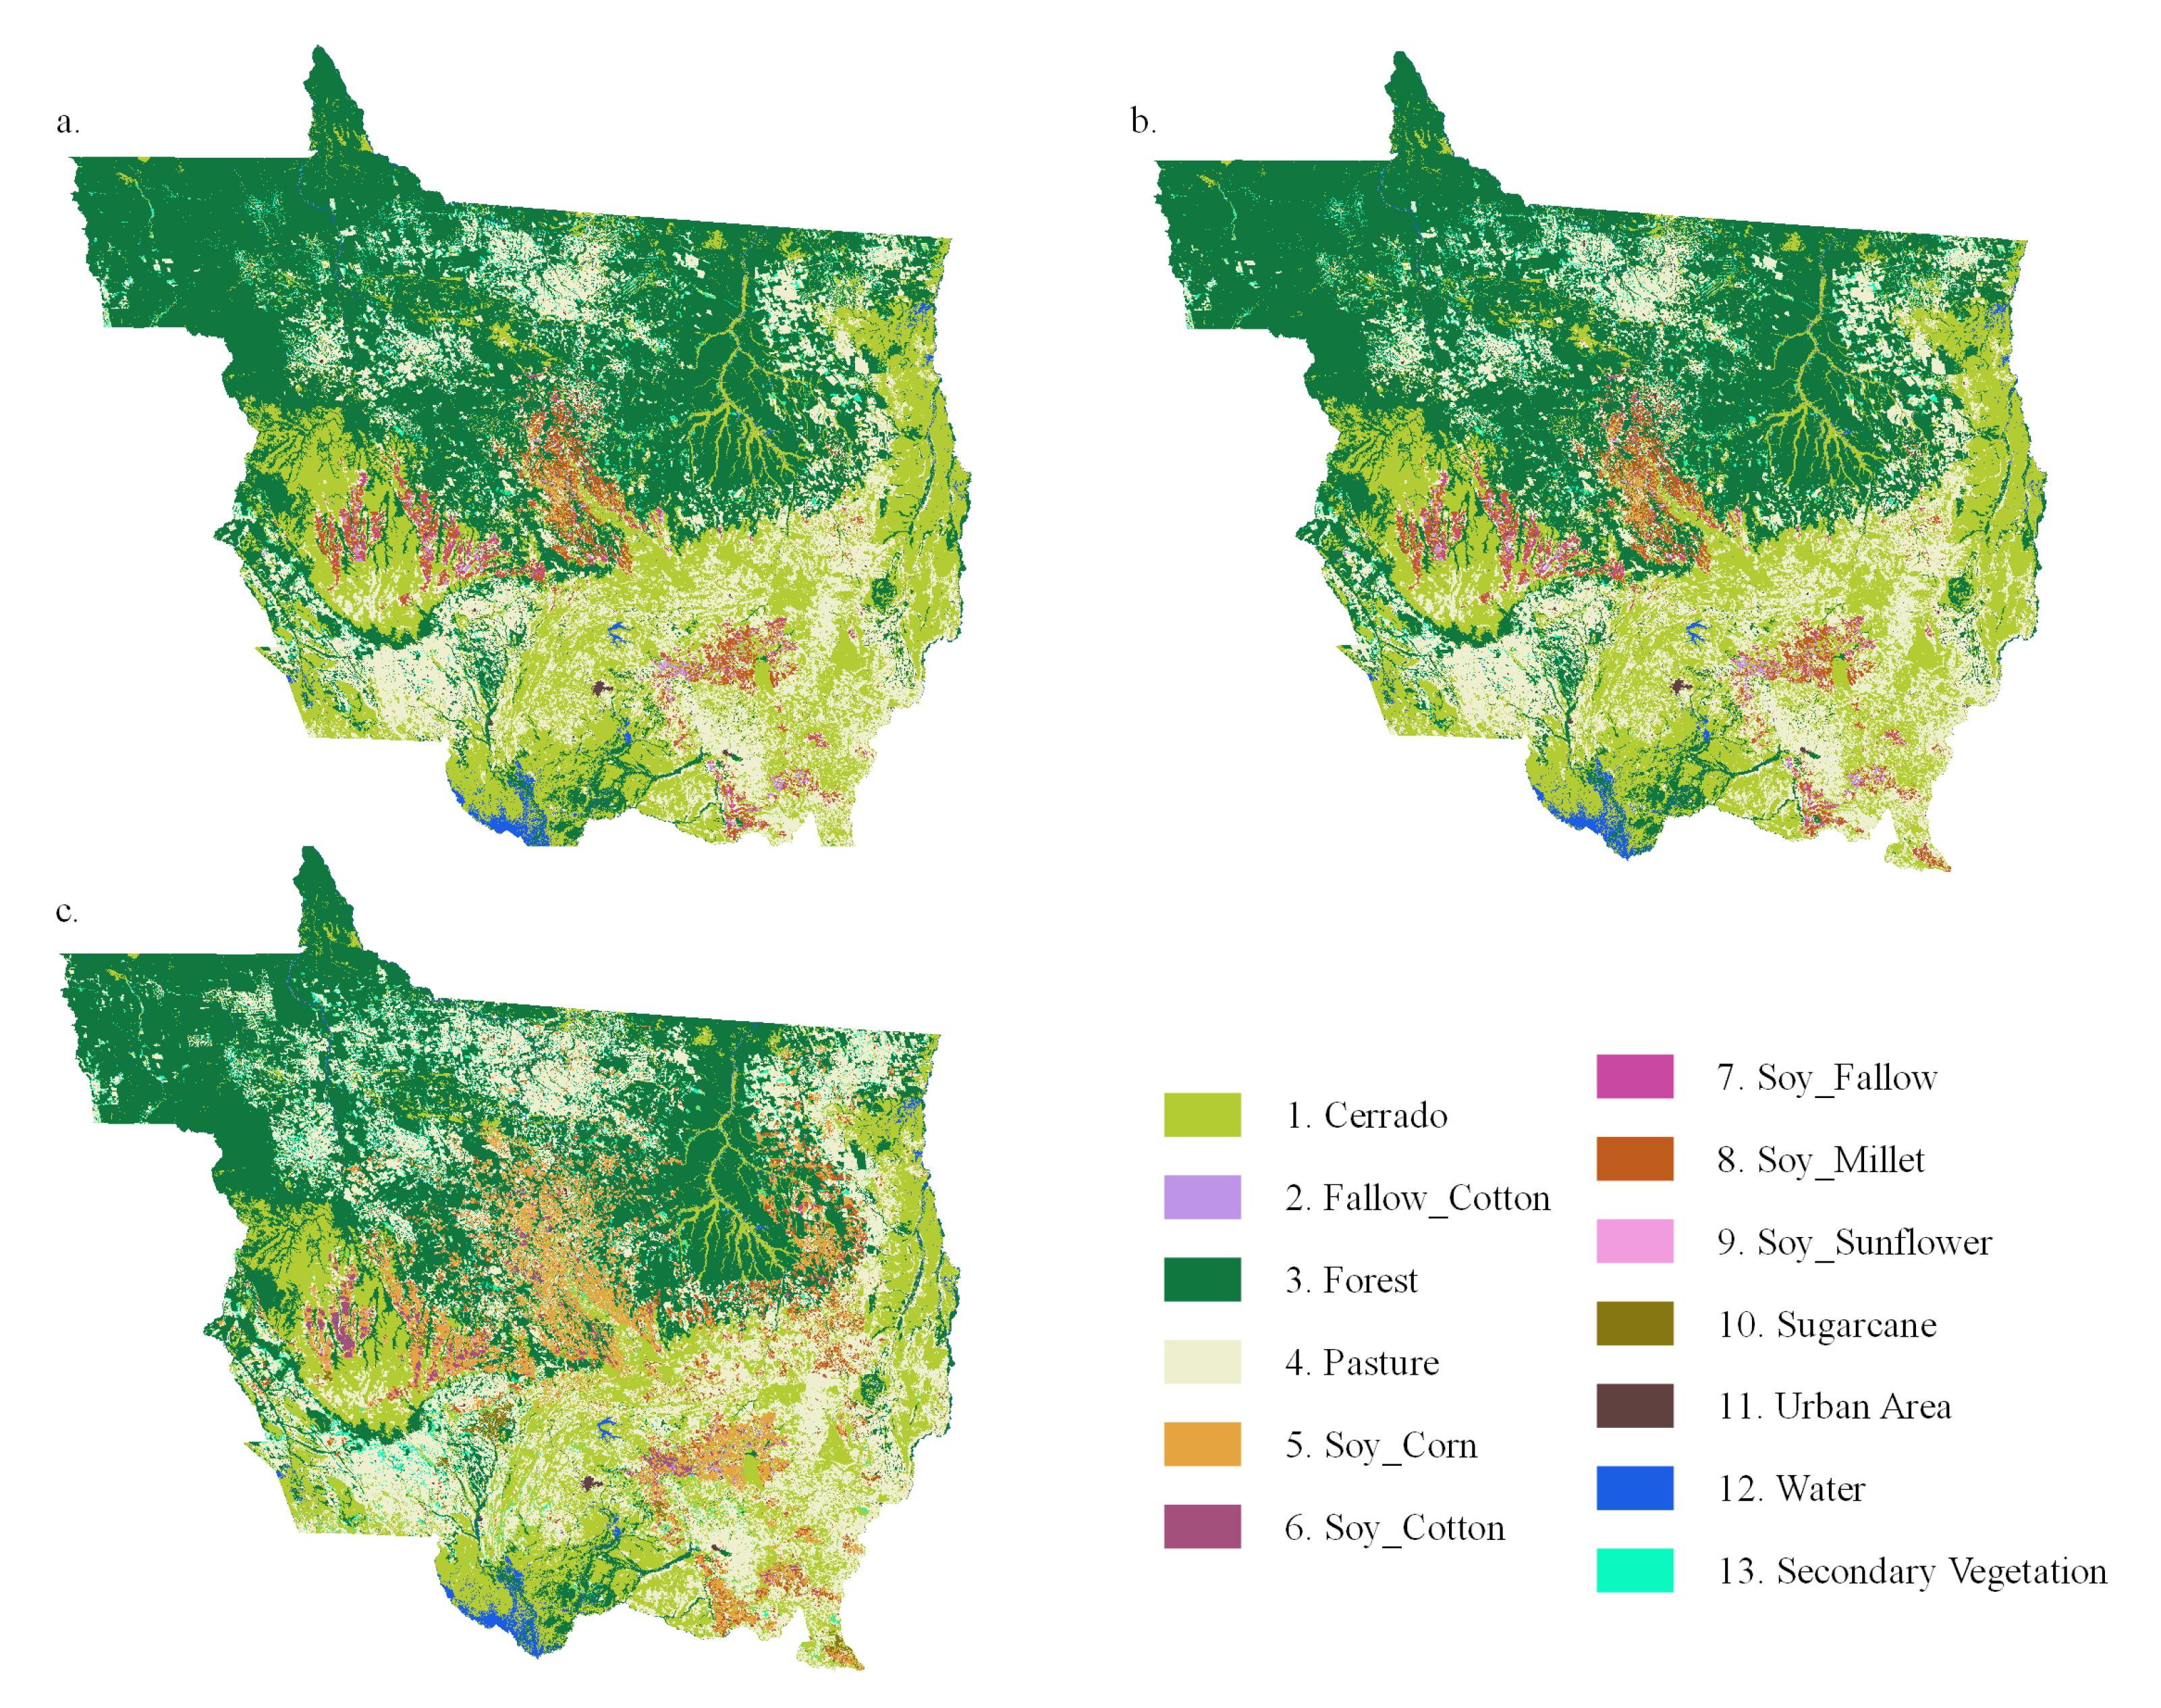
2.1. Study Area

The State of Mato Grosso is one of Brazil’s agricultural frontiers and is economically and ecologically important to Brazil. It is the country’s largest producer of soybean and has the largest cattle herd in Brazil [19,24]. It contains part of three high biodiversity biomes: Cerrado, Amazonia, and Pantanal. More than half of its area belongs to Amazonia (53%), while 40% is part of Cerrado and 7% part of Pantanal (Figure 1).

2.2. Land Use Dynamics in Mato Grosso and Its Drivers

Previous studies such as Spera et al. [17], Picoli et al. [18], and Zalles et al. [25] used remote sensing imagery to determine patterns of agriculture expansion in the State of Mato Grosso. These authors observed that agriculture in the Mato Grosso, especially soybeans, has expanded since 2001. In addition, there was also a change in the practice. In the early 2000s, soybean areas used mostly a single-cropping system; in recent years, most farmers have adopted a double-cropping system, producing two commercial crops in the same field during the same year. This trend is visible in Figure 2, which shows land use in the State of Mato Grosso in 2005, 2010, and 2017.
To identify the drivers of land use change, we selected 20 explanatory variables for each study period. These variables include economic attractiveness, environmental factors, access to markets, land use, and public policies (Table 1). Aguiar et al. [26] and Espindola et al. [27] argue that these kinds of variables help to explain differences in land use. We built a spatial database on a grid of 5 × 5 km cells for the entire study area for all potential explanatory variables and the land use and cover data from 2001 to 2017 [21].
The land use and land cover data produced by Camara et al. [21] use the MODIS-MOD13Q1 time series with four bands (normalized difference vegetation index, enhanced vegetation index, near-infrared, and mid-infrared) at a 250 m spatial resolution. For land use classification, the authors selected a support vector machine model, taking as input a multidimensional time series of the 23 instances of MODIS data per calendar year for all the bands. Land use classes included savanna, pasture, forest, soybeans, secondary vegetation, and deforestation [14,21]. Based on a 5-fold cross-validation, the overall accuracy of the classification of the training samples is estimated at 96%.
The economic variables express the attractiveness of new occupation areas; they include soybean price, yield (tons/ha), and number of cattle heads. The source for these data sets is the Brazilian Institute of Geography and Statistics (IBGE). Accessibility to markets variables uses Euclidean distances to dry ports, roads, hydrofoils, fridges (slaughterhouses), and soybean storage. The roads and hydrofoils maps were produced by the National Department of Transport Infrastructure (DNIT) in 2009. Dry port locations were provided by the Federal Revenue of Brazil. Soybean storage locations were provided by Brazilian Agricultural Research Corporation (EMBRAPA) in 2009. GISMAPS provided the fridge (slaughtherhouses) locations in 2017.
Public policy variables include indigenous lands, provided by the Brazilian National Foundation for Indigenous Peoples (FUNAI), and protected areas (conservation units), provided by the Brazilian Ministry of the Environment (MMA). Since our study aims to assess agricultural expansion, we calculated the percentage of these classes in each grid cell for the years prior to the ones under study. For deforestation, we included data for the two previous years, to allow enough time for a forest for agriculture conversion.
Environmental variables use the ERA-interim climate data from the European Centre for Medium-Range Weather Forecasts (ECMWF). We calculated the average rainfall for the months in the dry season (June, July, and August), and the average rainfall for the months in the wet season (January and February).

2.3. Exploratory Analyses and Selection of Variables

The study took soybean and pasture area expansion as dependent variables and the others as potentially explanatory. Based on exploratory data analysis, we found a nonlinear relationship between both dependent variables and independent ones. To minimize this effect, a logarithmic transformation was applied to distance variables, soybean price, soybean yield, number of cattle heads, and rainfall. Land use variables were expressed as percentages of area for each grid cell (5 × 5 km). Table 1 shows these variables. When two variables had a correlation coefficient greater than 0.5, we excluded one of them. Then, we applied an automatic linear forward stepwise regression to check the relationship between the dependent and exploratory variables and to eliminate nonsignificant variables.

2.4. Regression Modeling

Land use data were tested for global spatial dependence using Moran’s Index [29] and for local dependence using LISA (Local Indicators of Spatial Association) maps [30]. We found significant values of both global and local spatial autocorrelation for the dependent variables (soybean and pastureland expansion), thus indicating that a spatial regression model was more appropriate to explore the data than linear regression [31]. The spatial regression model explores global spatial autocorrelation patterns in the dataset, by including a new variable that measures spatial dependence [32].
We used spatial autoregressive models to investigate the impact of the explanatory variables in soybean and pasture expansion. In these models, the unknown spatial autocorrelation is assigned to the dependent variable Y [33]. The model becomes Y = ρ WY + X β + ϵ , where W is the spatial proximity matrix (the product WY captures the spatial dependence), ρ is the spatial autoregressive coefficient, β are the coefficients associated with the independent variables X, and ϵ is the random error. The null hypothesis of this model assumes the non-occurrence of spatial dependence ( ρ = 0) [31,34,35]. Assessment of model fit used the Akaike information criterion (AIC), which is more adequate for data with spatial dependence than the traditional R 2 (coefficient of determination) measure [36]. According to this criterion, models with the lowest AIC values have the best fits.

3. Results

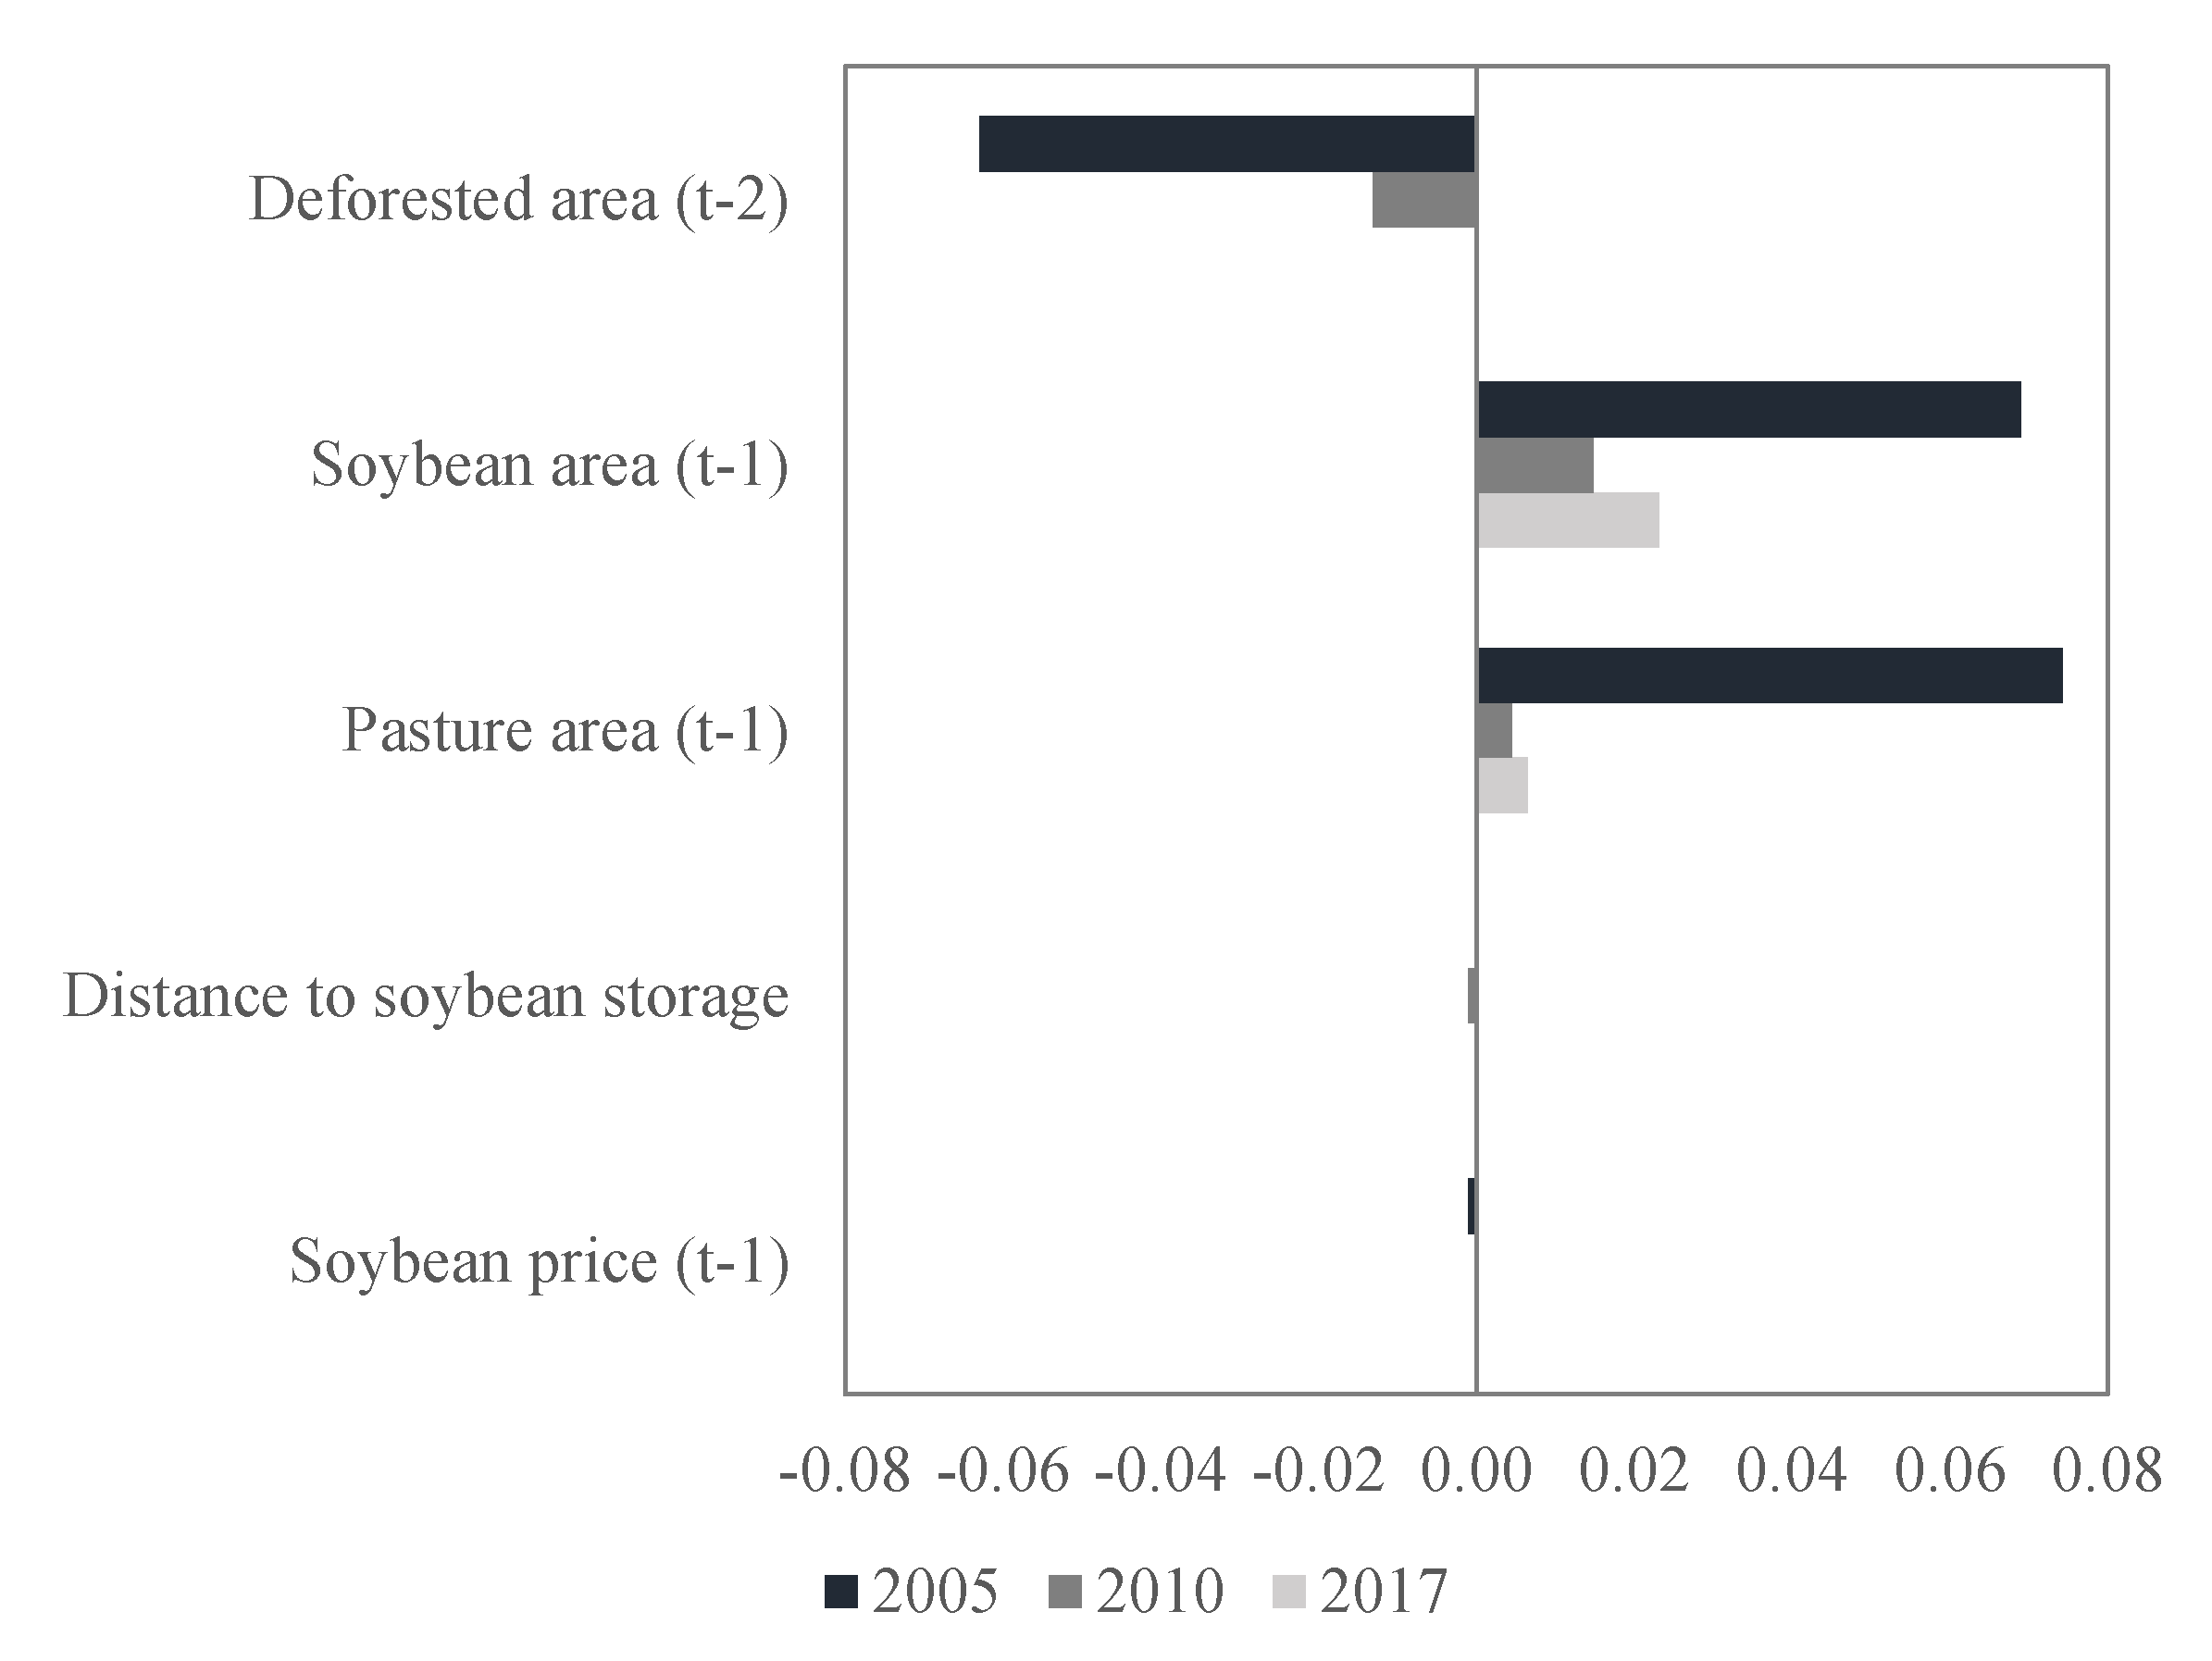
3.1. Soybean Expansion Drivers

Both the soybean expansion model and the pasture expansion model confirmed the hypothesis of spatial dependence. Moran Index values for the two models in all years were positive and significant (p ≤ 0.0001). There is also support for the hypothesis of the impact of public policies. The regression models for soybean expansion in 2005, 2010, and 2017 show changes in the patterns of crop expansion. Table 2 shows the estimated coefficients for soybean expansion models and their significance, enabling comparison of the drivers in 2005, 2010, and 2017. The AIC values indicate that the 2017 model has a better fit than the 2005 and 2010 ones.
The spatial autocorrelation coefficient ( ρ ) was significant and explained 62% of the soybean expansion for 2005, 61% for 2010, and 43% for 2017. This indicates that soybean expansion is a spatial diffusive process. Soybean farmers tend to concentrate in existing production areas. The influence of soybean and pasture areas in the previous year (t − 1) for soybean expansion is always positive in all years considered. However, the influence of crop extent and pasture area in the previous year (t − 1) was stronger in 2005 than in 2010 and 2017. In 2005, it accounted for 7% of new crop areas, dropping to 1.5% in 2010 and to 2.3% in 2017. As for soybean prices and distance to soybean storage, there was little change in their influence on crop expansion in the years considered.
Deforested area in the preceding year (t − 2) was relevant in the soybean expansion process in 2005 and 2010 (negative influence), but not significant in 2017 (p-value = 0.34). This result suggests that in 2005 and 2010, soybean expansion occurred far from the deforested areas of two years before, while in 2017, there was a positive effect.

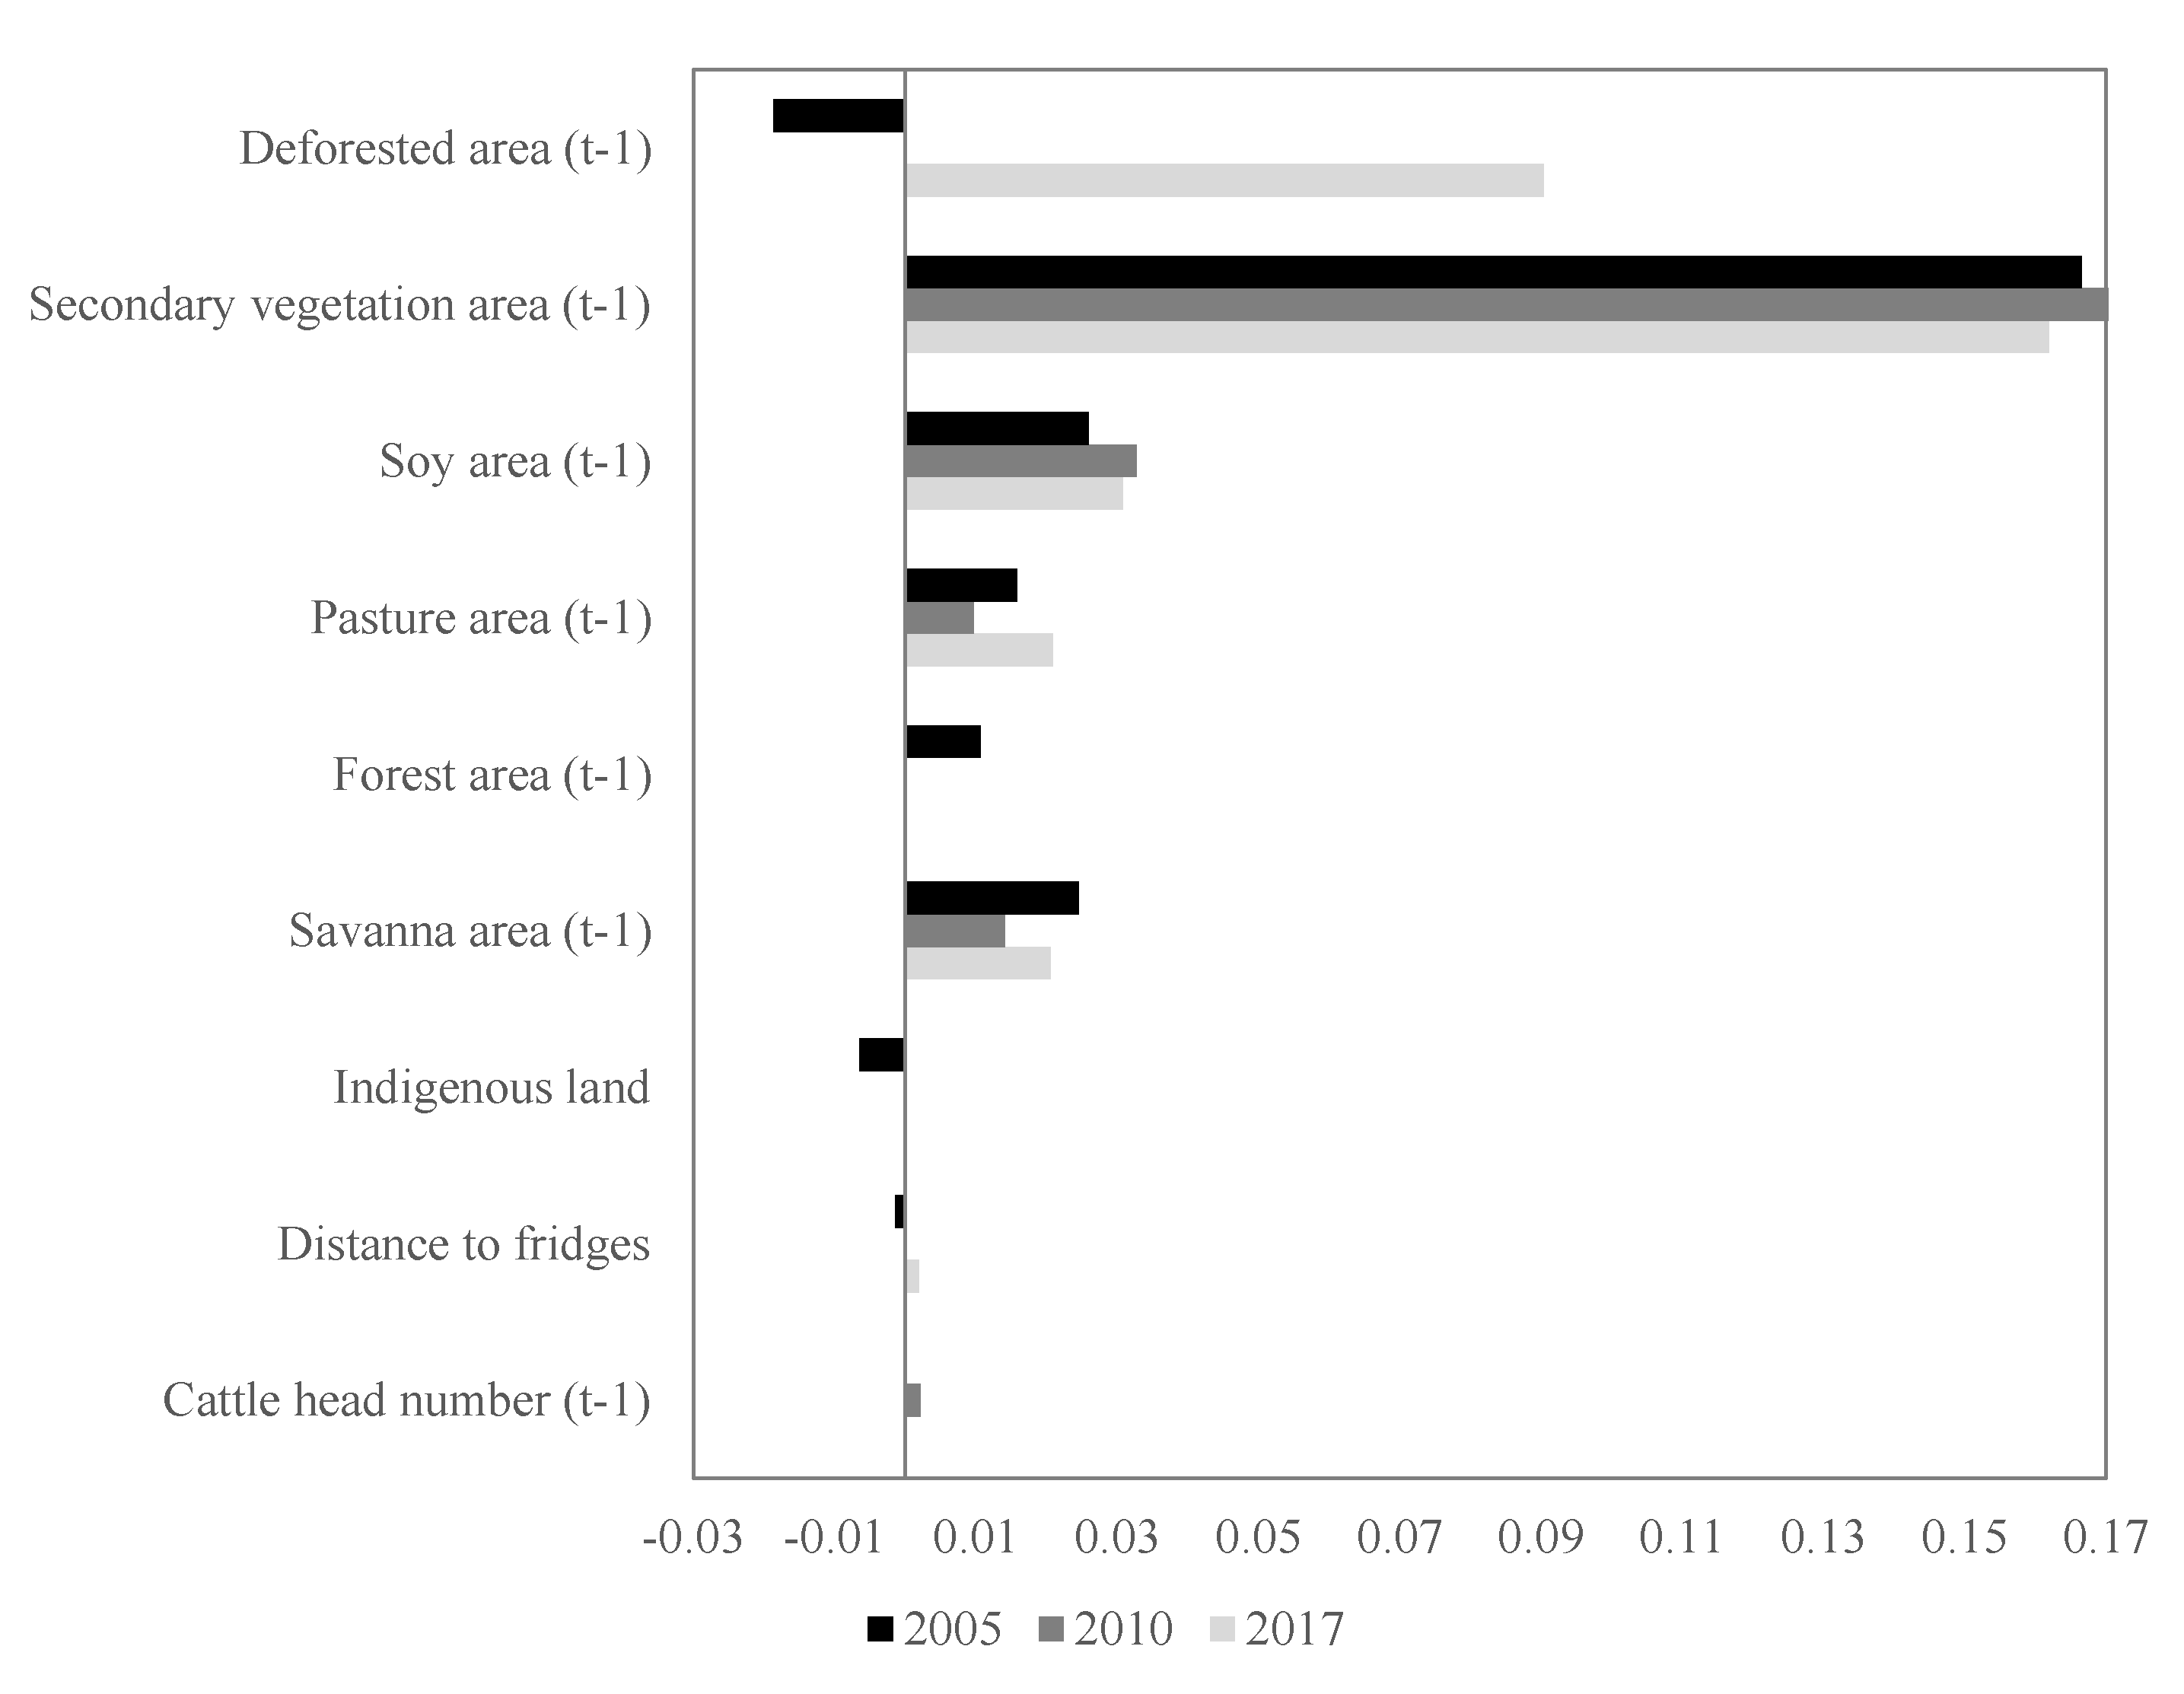
3.2. Pasture Expansion Drivers

Table 3 shows the coefficient values for the pasture expansion models for 2005, 2010, and 2017 and their respective level of significance. The AIC values show that the 2010 model has a better fit than the 2005 and 2017 models. Many land-use-related factors have a positive influence on pasture expansion in all years, based on their values in the previous year: savanna area, pasture area, soybean area, cattle heads, and secondary vegetation. Other drivers change their influence on different years: distance to fridges (slaughterhouses), indigenous land, forest area in the previous year, and deforestation in the previous year.
Effects of spatial dependence explain about 70% of pasture expansion in all models. This indicates that pasture expansion happens mostly via spatial diffusion. The second most influential driver for pasture expansion is secondary vegetation. Our hypothesis is that there is complex interplay between secondary vegetation and pasture. Some deforested areas are used for pasture, then abandoned or left fallow; these areas evolve into secondary vegetation and then are curt again for use as pasture. This hypothesis is supported by the work of Tyukavina et al. [37], who analyzed types and rates of forest disturbance in Brazilian Legal Amazon from 2000 to 2013. They concluded that from a total of 1.2 Mha of secondary forests cleared in the State of Mato Grosso from 2000 to 2013, 0.87 Mha (72%) were converted into pastures.

4. Discussion

4.1. Soybean Expansion

Figure 3 shows the coefficients for the main drivers of soybean expansion in the State of Mato Grosso in the three studied periods.
The amount of deforested area in 2003 (before the Soy Moratorium, the Cattle Moratorium, and the new Forest Code) had an inverse influence on soybean expansion in 2005. Deforestation in Mato Grosso was at its highest levels in 2003–2004, reaching 1.1 Mha. Most deforested areas in 2003 were concentrated in the northwest of the state and associated to pasture expansion, while soybean expansion in 2005 occurred in the central and southwest region [38]. In 2010 (post-Soy Moratorium, post-Cattle Moratorium, and pre-new Forest Code), deforestation from 2008 had an inverse influence on soybean expansion, albeit at a lower level. Deforested areas in 2008 remained concentrated in the northwest region of the State. Soybean expansion in 2010 occurred throughout the state, especially around the BR168 and BR158 roads. Both roads cross Mato Grosso from north to south; thus, soybean expansion areas were closer to deforestation areas in 2008 than in 2005. Deforestation in Mato Grosso in 2015 was the lowest in the years analyzed (0.16 Mha) [14]. The expansion of deforestation was in the same regions as in 2008, but at a smaller scale [14].
In 2017, there was no significant effect of deforestation from the previous two years in soybean expansion. This effect is most likely due to the Soy Moratorium. Based on the land use data, we observed that soybean expansion in Mato Grosso, after the Soy Moratorium and the new Forest Code, has resulted from conversion of pasture areas resulting from areas that were deforested before 2008. Such practices are allowed by the Soy Moratorium. Thus, consolidation of previous deforestation explains why soybean expansion areas were closer to deforested areas in 2015. Figure 2 shows that soybean area in 2017 had expanded to the northeast of Mato Grosso, near to the Xingu Indigenous Park. This finding corroborates the work of Macedo et al. [39] and Gibbs et al. [10], which observed that after the Soy Moratorium (2006–2012), soybean expansion in previously deforested areas in Amazonia was more than twice that in the Cerrado.
The soybean planted area in the previous year has a positive influence on soybean expansion. This is expected, since soybean expands in already established areas of crop production [40]. The spatial dependency of soybean expansion declines over the years (as seen in Figure 2), because of the expansion of the soybean areas to new areas in the northeast of Mato Grosso. This is confirmed by the reduction of the autoregression coefficient W and the soybean area in the previous year in the 2017 model, as shown in Table 2.
Pasture areas in the previous year have a direct influence on soybean expansion, especially in 2005. This corroborates the results of Macedo et al. [39], who studied a region in the northeast of Mato Grosso. There, 74% of new soybean areas replaced pastures from 2001 to 2005, reaching 91% from 2005 to 2009. The expansion of soybean production to previous pasture areas reflects the farmers’ attempt at increasing economic gains, while complying with the Soy Moratorium. This result is in line with studies that show the land markets in Amazonia have high liquidity [41], both through direct sales and lease agreements for temporary conversion of pastures to croplands [42]. Similarly, Zaiatz et al. [43] show that from 1986 to 2014, in the upper Teles Pires basin, deforested areas were first replaced by pasture and then by crops. Direct change from forest to crops was less frequent in this region. Thus, our study confirms at a larger scale (the whole of Mato Grosso) previous localized studies that point to indirect land conversion resulting from soybean expansion.
Accessibility to markets has been regarded as an important determinant of soybean expansion. In earlier studies [26,27], the market effect was captured by distances to ports, rivers, and cities. Our models include the distance to storage facilities as an additional measure of market accessibility. In contrast to earlier studies, results from our models show that distance to cities and to ports did not have a significant effect on crop expansion. We found the influence of distances to soybean storage facilities to be small but significant. In both the 2010 and 2017 models, distance to soybean storage had a negative effect on soybean expansion, i.e., crop expansion tended to happen near storage facilities. Such a finding is corroborated by reports from Mato Grosso Agricultural Economics Institute (IMEA) [44].
Soybean prices in the previous year have a small but significant influence on crop expansion. This finding is consistent with land use data that show a consistent expansion in soybean production in Mato Grosso in the models of the 2000s. Earlier studies on the matter show that soybean farmers are part of the emerging urban economies in Mato Grosso. Thus, they tend to invest in soybean production despite variations in international price, since they are integrated in local supply chains and have much invested capital in their farms [45]. Thus, the local incentives for soybean production prevail over price variability.

4.2. Pasture Expansion

Figure 4 shows the coefficients for the main drivers of pasture expansion in Mato Grosso in the three periods considered.
Deforestation in the previous year had a negative and significant influence on pasture expansion in 2005. A possible explanation combines land speculation in Amazonia and pasture expansion in the Cerrado biome. In the first half of the 2000s, deforestation in Mato Grosso was high, reaching 1.1 Mha in 2003–2004. Most forest cuts happened in the northeast and northwest of Mato Grosso. Researchers who have conducted field work in the area pointed out the effects of land speculation, where market actors will foresee land appreciation due to future agricultural expansion. These actors will carry out deforestation actions, with a view of selling or renting this land to ranchers or farmers later [46,47]. In this perspective, deforested areas are not immediately converted to pasture and croplands but are left fallow with an expectation of substantial gains in the future. A second factor that could explain the lack of influence of deforestation in pasture expansion in 2005 is the conversion of natural vegetation in the Cerrado biome to pasture. This conversion is verifiable in the land use change maps produced by the authors [21].
The impact of deforestation in the previous year on pasture expansion changed substantially in the 2017 model relative to 2005. In 2017, deforestation in Mato Grosso was much lower than in 2005. Arguably, there was more incentive for ranchers to make direct use of recently deforested land. Furthermore, data from INPE [14] and analysis by Schielein et al. [48] show a decrease in the average size of deforested areas in 2017 relative to 2005. Such a decrease in size is consistent with consolidation of the existing occupation, where forest areas within or near farms are cut for local expansion of pastures.
Secondary vegetation area in the previous year was the variable that most influenced the pasture expansion in Mato Grosso in the three periods. This result is consistent with both speculation and consolidation actions. In the case of land speculation, which we consider to be stronger in 2005 than in 2017, forest areas are cut for future rent appropriation [46,47]. If these clear cut areas are left unused, they will be covered by secondary vegetation. When the land is sold or rented, the new owner will then clear the area to use as pasture. As the agricultural frontier advanced in Mato Grosso from 2005 to 2017, consolidation became more relevant than speculation.
As argued by Schielein et al. [48], in established frontier areas, there is an incentive for consolidation. Cattle ranchers may have deforested more land in their farms than they initially used for pastures. Additionally, lack of suitable management leads to pasture degradation and its replacement by secondary vegetation [49]. Before the strong “command-and-control” actions by the Brazilian government started in 2004–2005, it was more cost-effective to deforest new areas than to restore degraded ones [46]. In the 2010s, large forest clearings were subject to strong law enforcement actions. By contrast, small clearings are harder to detect. Further, in 2017, the expected amnesty of the new Forest Code motivated farmers to reclaim areas in their properties that had been abandoned and left as secondary vegetation [48]. Thus, there is evidence that land speculation actions in 2005 and consolidation practices in 2010 and 2017 are associated to the positive and strong influence of secondary vegetation areas in pasture expansion.
Soybean and pasture areas in the previous year also had a direct influence on pasture expansion in the three periods studied. Spera et al. [17] observed that most of the areas best suited for soybean production had already been occupied by the early 2000s. They found evidence of cropland expansion in the 2000s to less favorable locations with were hotter, drier, and more isolated from agricultural infrastructure. The authors also identified abandoned agricultural areas in these locations [17]. These abandoned cropland areas are potential areas for pasture expansion.
In the Cerrado, all models show a direct conversion of savanna areas to pasture. In recent decades, more than 50% of the area previously covered by savanna in the Cerrado biome (approximately 200 Mha) has been converted into cropland and pastureland [50]. The area of natural vegetation that remained in this biome was 47% in 2010 [5].
The forest area in the previous year had a direct influence on pasture expansion in 2005 before the Moratorium agreements and the new Forest Code. In this period, there was a direct conversion from forest to pasture. In the pasture expansion models for 2010 and 2017, this driver was not significant. As observed by previous authors, this effect is most likely due to the implementation of the Cattle Moratorium and the new Forest Code [22,39,51]. These researchers point out that policy measures and market signals reduced illegal deforestation.
Indigenous lands were only significant to pasture expansion in 2005, when they had a negative influence. This shows the effectiveness of protected areas, even in years where deforestation is high. In 2010 and 2017, this variable was not significant in the models.
Although it had limited influence, distance to fridges (slaughterhouses) was significant in 2005 and 2017. We consider that small influence does not provide us with additional insights into actions leading to pasture expansion. As shown by Gibbs et al. [10], there have been considerable differences in the response of slaughterhouses to the Cattle Moratorium, which restricts the value of this variable to explain pasture expansion. The number of cattle heads in the previous year driver also had a small influence on the models (<0.002), but this one was always positive. The greater the number of cattle heads in the previous year, the greater the expansion of the pasture areas.

5. Conclusions

Spatially explicit analysis, when supported by detailed maps of land use change, improves understanding of the role of public and private policies and the actions of farmers and land speculators for soybean and pasture expansion in Mato Grosso. Our results provide a comprehensive assessment of the factors related to agricultural production in the State. They complement and corroborate previous research. Arguably, comparing different years is essential to evaluate the impacts of environmental policies. In this study, we found a direct relationship between pasture expansion and forest areas in the State of Mato Grosso in 2005. This is the period before the Soy and Cattle Moratoriums and before the new Forest Code. In 2010 and 2017, forest areas were not significantly correlated to pasture expansion, which suggests that public policies have an effect on preventing direct deforestation resulting from pasture expansion.
In 2017, previously deforested areas were relevant for pasture expansion in Mato Grosso. We also observed a significant expansion of soybean into pasture areas. In turn, pasture areas were expanding on areas of natural vegetation (savanna), secondary vegetation, and previously deforested areas. In agreement with recent studies, we consider that the Soy Moratorium, although valuable, has caused indirect impacts by replacing pasture areas and pushing ranchers to remove secondary vegetation and convert natural vegetation in the Amazon and Cerrado biomes.
We found that pasture expansion is associated to removal of natural vegetation in the Cerrado. Since only 8% of the Cerrado is protected by law, it is a vulnerable biome. In addition, public and private policies have focused on the Amazon biome, including the Action Plan for the Prevention and Control of Deforestation in the Legal Amazon (PPCDAm). As a result, the Cerrado biome has undergone intense land-use conversion due to the concentration of public policies in the Amazon biome. For this reason, in common with other researchers, we consider it relevant to extend the Soy and Cattle moratoriums to the Cerrado biome.
Our results indicate that Brazil needs improved strategies to contain deforestation. The Brazilian Nationally Determined Contribution (NDC) to the Paris Agreement has two important targets related to deforestation. Brazil wants to achieve zero illegal deforestation in Amazonia by 2030; it also expects to restore 12 Mha of forests in the same period. For such restoration to be viable, especially in Amazonia, secondary vegetation should be not be reconverted to agricultural use. This is only possible with the combination of reduction of soybean expansion in Amazonia, increased protection of the Cerrado, and pasture intensification in both biomes.
We conclude that for Brazil to reach the goals stated in its NDC submitted to the Paris Agreement, the country needs to revise its public policies and its market chain arrangements. Without policies that aim at land use intensification, especially for cattle ranching activities, Brazil will find it hard to keep its commitments.
Our study shows the challenges for a large country such as Brazil to achieve a fully sustainable agricultural production. On the positive side, our data and models show the effectiveness of public policies and private arrangements to reduce direct conversion from forests to crop production. For pasture expansion, data and models show a complex situation with different pathways of land use change. Pasture expansion can result from direct conversion of forest areas, expansion into the Cerrado biome, reconversion of secondary vegetation, or even replacement of low yield crop areas. Such detailed analysis was only possible because our land use data sets were more comprehensive than those used in previous studies. Therefore, we hope that the results of this paper encourage researchers and policy makers to make an effort to use detailed datasets that can elicit broad perspectives of the complexity of the transformations in Amazonia and Cerrado.

Author Contributions

Conceptualization, M.C.A.P., G.C., A.R., P.L., P.H., I.D.S., and A.M.; Methodology, M.C.A.P., G.C., A.R., P.L., and A.M.; Formal analysis, M.C.A.P., G.C., and P.L.; Investigation, M.C.A.P. and A.R.; Data curation, M.C.A.P. and P.L.; Writing—original draft preparation, M.C.A.P. and G.C.; Writing—review and editing, A.R., P.J.L., P.H., I.D.S., and A.M.; Supervision, G.C. and P.H.; Project administration, M.C.A.P., G.C., and P.H.; Funding acquisition, G.C. All authors have read and agreed to the published version of the manuscript.

Funding

This research was funded by the São Paulo Research Foundation (FAPESP) through the eScience Program grant 2014/08398-6. We also thank FAPESP for grants 2016/23750-3 and 2017/19812-6. We thank to Brazil Data Cube project, funded by the Amazon Fund through the financial collaboration of the Brazilian Development Bank (BNDES) and the Foundation for Science, Technology and Space Applications (FUNCATE) no. 17.2.0536.1. Funding was also provided by the RESTORE+ project, which is part of the International Climate Initiative (IKI), supported by the Federal Ministry for the Environment, Nature Conservation and Nuclear Safety (BMU) based on a decision adopted by the German Bundestag.

Conflicts of Interest

The authors declare no conflict of interest.

References

  1. Food and Agriculture Organization of the United Nations (FAO). The State of Agricultural Commodity Markets 2018. Agricultural Trade, Climate Change and Food Security; Technical Report; Food and Agriculture Organization of the United Nations (FAO): Roma, Italy, 2018; Available online: http://www.fao.org/3/I9542EN/i9542en.pdf (accessed on 13 May 2019).
  2. Sparovek, G.; Barreto, A.G.O.P.; Matsumoto, M.; Berndes, G. Effects of Governance on Availability of Land for Agriculture and Conservation in Brazil. Environ. Sci. Technol. 2015, 49, 10285–10293. [Google Scholar] [CrossRef]
  3. Lapola, D.M.; Martinelli, L.A.; Peres, C.A.; Ometto, J.P.H.B.; Ferreira, M.E.; Nobre, C.A.; Aguiar, A.P.D.; Bustamante, M.M.C.; Cardoso, M.F.; Costa, M.H.; et al. Pervasive transition of the Brazilian land-use system. Nat. Clim. Chang. 2014, 4, 27–35. [Google Scholar] [CrossRef] [Green Version]
  4. Ministry of the Environment–Brazil. Brazilian biomes, 2018. Available online: http://www.mma.gov.br/biomas/ (accessed on 10 June 2019).
  5. Beuchle, R.; Grecchi, R.; Shimabukuro, Y.; Seliger, R.; Eva, H.; Sano, E.; Achard, F. Land cover changes in the Brazilian Cerrado and Caatinga biomes from 1990 to 2010 based on a systematic remote sensing sampling approach. Appl. Geogr. 2015, 58, 116–127. [Google Scholar] [CrossRef]
  6. Nepstad, D.; McGrath, D.; Stickler, C.; Alencar, A.; Azevedo, A.; Swette, B.; Bezerra, T.; DiGiano, M.; Shimada, J.; Seroa da Motta, R.; et al. Slowing Amazon deforestation through public policy and interventions in beef and soy supply chains. Science 2014, 344, 1118–1123. [Google Scholar] [CrossRef] [PubMed]
  7. Assunção, J.; Gandour, C.; Rocha, R. Deforestation slowdown in the Brazilian Amazon: Prices or policies? Environ. Dev. Econ. 2015, 20, 697–722. [Google Scholar] [CrossRef] [Green Version]
  8. Hahn, R.W.; Stavins, R.N. Economic Incentives for Environmental Protection: Integrating Theory and Practice. Am. Econ. Rev. 1992, 82, 464–468. [Google Scholar]
  9. Soterroni, A.C.; Ramos, F.M.; Mosnier, A.; Fargione, J.; Andrade, P.R.; Baumgarten, L.; Pirker, J.; Obersteiner, M.; Kraxner, F.; Câmara, G.; et al. Expanding the Soy Moratorium to Brazil’s Cerrado. Sci. Adv. 2019, 5. [Google Scholar] [CrossRef] [Green Version]
  10. Gibbs, H.K.; Rausch, L.; Munger, J.; Schelly, I.; Morton, D.C.; Noojipady, P.; Soares-Filho, B.; Barreto, P.; Micol, L.; Walker, N.F. Brazil’s Soy Moratorium. Science 2015, 347, 377–378. [Google Scholar] [CrossRef]
  11. Rudorff, B.; Adami, M.; Aguiar, D.; Moreira, M.; Mello, M.; Fabiani, L.; Amaral, D.; Pires, B. The soy moratorium in the Amazon biome monitored by remote sensing images. Remote Sens. 2011, 3, 185–202. [Google Scholar] [CrossRef] [Green Version]
  12. Kastens, J.; Brown, J.; Coutinho, A.; Bishop, C.; Esquerdo, J. Soy moratorium impacts on soybean and deforestation dynamics in Mato Grosso, Brazil. PLoS ONE 2017, 12, e0176168. [Google Scholar] [CrossRef]
  13. Walker, N.F.; Patel, S.A.; Kalif, K.A.B. From Amazon Pasture to the High Street: Deforestation and the Brazilian Cattle Product Supply Chain. Trop. Conserv. Sci. 2013, 6, 446–467. [Google Scholar] [CrossRef] [Green Version]
  14. INPE. Amazon Deforestation Monitoring Project–PRODES. Available online: https://www.obt.inpe.br/prodes/ (accessed on 15 February 2018).
  15. Thaler, G.M. The Land Sparing Complex: Environmental Governance, Agricultural Intensification, and State Building in the Brazilian Amazon. Ann. Am. Assoc. Geogr. 2017, 107, 1424–1443. [Google Scholar] [CrossRef]
  16. Arvor, D.; Jonathan, M.; Meirelles, M.; Dubreuil, V.; Durieux, L. Classification of MODIS EVI time series for crop mapping in the state of Mato Grosso, Brazil. Int. J. Remote Sens. 2011, 32, 7847–7871. [Google Scholar] [CrossRef]
  17. Spera, S.A.; Cohn, A.S.; VanWey, L.K.; Mustard, J.F.; Rudorff, B.F.; Risso, J.; Adami, M. Recent cropping frequency, expansion, and abandonment in Mato Grosso, Brazil had selective land characteristics. Environ. Res. Lett. 2014, 9, 064010. [Google Scholar] [CrossRef] [Green Version]
  18. Picoli, M.C.A.; Camara, G.; Sanches, I.; Simões, R.; Carvalho, A.; Maciel, A.; Coutinho, A.; Esquerdo, J.; Antunes, J.; Begotti, R.A.; et al. Big earth observation time series analysis for monitoring Brazilian agriculture. ISPRS J. Photogramm. Remote. Sens. 2018, 145, 328–339. [Google Scholar] [CrossRef]
  19. Brazilian Institute of Geography and Statistics (IBGE). Municipal Agricultural Production. 2018. Available online: http://www2.sidra.ibge.gov.br/ (accessed on 15 June 2019).
  20. Brazilian Institute of Geography and Statistics (IBGE). Agricultural Census. 2018. Available online: https://sidra.ibge.gov.br/pesquisa/censo-agropecuario/censo-agropecuario-2017 (accessed on 15 June 2019).
  21. Camara, G.; Picoli, M.; Maciel, A.; Simoes, R.; Andrade, P.; Ferreira, K.; Begotti, R.; Sanches, I.; Carvalho, A.; Coutinho, A.; et al. Land cover change maps for Mato Grosso State in Brazil: 2001–2017 (version 3). 2019. Available online: https://doi.org/10.1594/PANGAEA.899706 (accessed on 5 March 2019).
  22. Gollnow, F.; Lakes, T. Policy change, land use, and agriculture: The case of soy production and cattle ranching in Brazil, 2001–2012. Appl. Geogr. 2014, 55, 203–211. [Google Scholar] [CrossRef]
  23. Gusso, A.; Ducati, J.R.; Bortolotto, V.C. Analysis of soybean cropland expansion in the southern Brazilian Amazon and its relation to economic drivers. Acta Amaz. 2017, 47, 281–292. [Google Scholar]
  24. Brazilian Institute of Geography and Statistics (IBGE). Municipal Livestock Research. 2018. Available online: https://sidra.ibge.gov.br (accessed on 15 June 2019).
  25. Zalles, V.; Hansen, M.C.; Potapov, P.V.; Stehman, S.V.; Tyukavina, A.; Pickens, A.; Song, X.P.; Adusei, B.; Okpa, C.; Aguilar, R.; et al. Near doubling of Brazil’s intensive row crop area since 2000. Proc. Natl. Acad. Sci. USA 2019, 116, 428–435. [Google Scholar] [CrossRef] [Green Version]
  26. Aguiar, A.; Camara, G.; Escada, I. Spatial statistical analysis of land-use determinants in the Brazilian Amazonia: Exploring intra-regional heterogeneity. Ecol. Model. 2007, 209, 169–188. [Google Scholar] [CrossRef]
  27. Espindola, G.; Aguiar, A.P.; Pebesma, E.; Camara, G.; Fonseca, L. Agricultural land use dynamics in the Brazilian Amazon based on remote sensing and census data. Appl. Geogr. 2012, 32, 240–252. [Google Scholar] [CrossRef]
  28. GISMAPS. Cold-Storage Building of Mato Grosso State. 2017. Available online: https://www.gismaps.com.br (accessed on 10 May 2019).
  29. Moran, P.A.P. Notes on Continuous Stochastic Phenomena. Biometrika 1950, 37, 17–23. [Google Scholar] [CrossRef] [PubMed]
  30. Anselin, L. Local indicators of spatial association - LISA. Geogr. Anal. 1995, 27, 91–115. [Google Scholar] [CrossRef]
  31. Camara, G.; Monteiro, A.M.; Druck, S.; Carvalho, M.S. Análise espacial de áreas (in Portuguese). In Análise espacial de dados geográficos (in Portuguese); Druck, S., Carvalho, C., Camara, G., Monteiro, A.M.V., Eds.; Embrapa: Brasília, Brazil, 2004; pp. 23–55. [Google Scholar]
  32. Bailey, T.C.; Gatrell, A.C. Interactive Spatial Data Analysis; Longman Scientific & Technical: Harlow Essex, UK, 1995. [Google Scholar]
  33. Bivand, R.S.; Pebesma, E.; Gomez-Rubio, V. Applied Spatial Data Analysis with R, 2nd ed.; Springer: New York, NY, USA, 2013. [Google Scholar]
  34. Anselin, L. Spatial econometrics. In A Companion to Theoretical Econometrics; Baltagi, B., Ed.; Basil Blackwell: Oxford, UK, 2001; pp. 310–330. [Google Scholar]
  35. Anselin, L. Exploring Spatial Data with GeoDaTM: A Workbook; University of Illinois: Champaign, IL, USA, 2005. [Google Scholar]
  36. Burnham, K.P.; Anderson, D.R. Multimodel Inference: Understanding AIC and BIC in Model Selection. Sociol. Methods Res. 2004, 33, 261–304. [Google Scholar] [CrossRef]
  37. Tyukavina, A.; Hansen, M.C.; Potapov, P.V.; Stehman, S.V.; Smith-Rodriguez, K.; Okpa, C.; Aguilar, R. Types and rates of forest disturbance in Brazilian Legal Amazon, 2000–2013. Sci. Adv. 2017, 3. [Google Scholar] [CrossRef] [PubMed] [Green Version]
  38. Arvor, D.; Meirelles, M.; Dubreuil, V.; Bégué, A.; Shimabukuro, Y.E. Analyzing the agricultural transition in Mato Grosso, Brazil, using satellite-derived indices. Appl. Geogr. 2012, 32, 702–713. [Google Scholar] [CrossRef] [Green Version]
  39. Macedo, M.N.; DeFries, R.S.; Morton, D.C.; Stickler, C.M.; Galford, G.L.; Shimabukuro, Y.E. Decoupling of deforestation and soy production in the southern Amazon during the late 2000s. Proc. Natl. Acad. Sci. USA 2012, 109, 1341–1346. [Google Scholar] [CrossRef] [Green Version]
  40. Morton, D.; DeFries, R.; Shimabukuro, Y.; Anderson, L.; Arai, E.; del Bon Espirito-Santo, F.; Freitas, R.; Morisette, J. Cropland expansion changes deforestation dynamics in the southern Brazilian Amazon. Proc. Natl. Acad. Sci. USA 2006, 103, 14637. [Google Scholar] [CrossRef] [Green Version]
  41. Informa Economics. ANUALPEC 2013: Brazilian Livestock Yearbook; IEG FNP Agribusiness Intelligence: São Paulo, Brazil, 2013. [Google Scholar]
  42. Cohn, A.S.; Gil, J.; Berger, T.; Pellegrina, H.; Toledo, C. Patterns and processes of pasture to crop conversion in Brazil: Evidence from Mato Grosso State. Land Use Policy 2016, 55, 108–120. [Google Scholar] [CrossRef]
  43. Zaiatz, A.P.S.R.; Zolin, C.A.; Vendrusculo, L.G.; Lopes, T.R.; Paulino, J. Agricultural land use and cover change in the Cerrado/Amazon ecotone: A case study of the upper Teles Pires River basin. Acta Amaz. 2018, 48, 168–177. [Google Scholar]
  44. Mato Grosso Institute of Agribusiness Economy (IMEA). Processo de expansão de área agrícola sobre área de pastagem em Mato Grosso. Available online: https://www.inputbrasil.org/wp-content/uploads/2017/11/relatorio-imea-input.pdf (accessed on 29 January 2018). (In Portuguese).
  45. Richards, P.; Pellegrina, H.; VanWey, L.; Spera, S. Soybean Development: The Impact of a Decade of Agricultural Change on Urban and Economic Growth in Mato Grosso, Brazil. PLoS ONE 2015, 4, 1–18. [Google Scholar] [CrossRef]
  46. Richards, P. What Drives Indirect Land Use Change? How Brazil’s Agriculture Sector Influences Frontier Deforestation. Ann. AAG 2015, 105, 1026–1040. [Google Scholar] [CrossRef] [PubMed] [Green Version]
  47. Miranda, J.; Börner, J.; Kalkuhl, M.; Soares-Filho, B. Land speculation and conservation policy leakage in Brazil. Environ. Res. Lett. 2019, 14, 045006. [Google Scholar] [CrossRef]
  48. Schielein, J.; Börner, J. Recent transformations of land-use and land-cover dynamics across different deforestation frontiers in the Brazilian Amazon. Land Use Policy 2018, 76, 81–94. [Google Scholar] [CrossRef]
  49. Aguiar, D.; Mello, M.; Nogueira, S.; Gonçalves, F.; Adami, M.; Rudorff, B. MODIS Time Series to Detect Anthropogenic Interventions and Degradation Processes in Tropical Pasture. Remote Sens. 2017, 9, 73. [Google Scholar] [CrossRef] [Green Version]
  50. Klink, C.; Machado, R. Conservation of the Brazilian cerrado. Conserv. Biol. 2005, 19, 707–713. [Google Scholar] [CrossRef]
  51. Gibbs, H.; Munger, J.; L’Roe, J.; Barreto, P.; Pereira, R.; Christie, M.; Amaral, T.; Walker, N. Did Ranchers and Slaughterhouses Respond to Zero-Deforestation Agreements in the Brazilian Amazon? Conserv. Lett. 2015, 9, 32–42. [Google Scholar] [CrossRef]
Figure 1. Left: Location of the State of Mato Grosso relative to Brazil and its biomes. Right: Indigenous lands and conservation units in the State of Mato Grosso. Chart: Forest, pasture, and soybean area in the State of Mato Grosso. Source: Chart based on Camara et al. [21] data.
Land 09 00020 g001
Figure 2. Classification map for the State of Mato Grosso in 2005, 2010, and 2017. Source: Camara et al. [21].
Land 09 00020 g002
Figure 3. Standardized regression coefficients for soybean expansion models of 2005, 2010, and 2017, significant at p ≤ 0.1.
Land 09 00020 g003
Figure 4. Standardized regression coefficients for pasture expansion models of 2005, 2010, and 2017, significant at p ≤ 0.1.
Land 09 00020 g004
Table 1. Potential explanatory variables of soybean and pasture expansion.
CategoryVariableUnitSource
Economic attractivenessSoybean price (log)thousand Reais *IBGE a
Soybean yield (log)tons/haIBGE a
Numbers of cattle (log)countIBGE a
Accessibility to marketsEuclidian distance to roads (log)kmDNIT b
Euclidian distance to dry ports (log)kmFRB c
Euclidian distance to hydrofoils (log)kmDNIT b
Euclidian distance to fridges (log)kmGISMAPS [28]
Euclidian distance to soybean storage (log)kmEMBRAPA d
Public policiesConservation unitspercentageMMA e
Indigenous landspercentageFUNAI f
Land useSavanna areapercentageCamara et al. [21]
Pasture areapercentageCamara et al. [21]
Forest areapercentageCamara et al. [21]
Soybean areapercentageCamara et al. [21]
Secondary vegetation areapercentageCamara et al. [21]
Deforestation areapercentageINPE g
EnvironmentRainfall (log)averageECMWF h
black
* Brazilian currency; a IBGE—Brazilian Institute of Geography and Statistics; b DNIT—National Department of Transport Infrastructure; c FRB—Federal Revenue of Brazil; d EMBRAPA—Brazilian agricultural research corporation; e MMA—Brazilian Ministry of the Environment; f FUNAI—Brazilian National Foundation for Indigenous Peoples; g INPE—National Institute for Space Research; h ECMWF—European Centre for Medium-Range Weather Forecasts.
Table 2. Spatial lag regression models for soybean expansion determinant factors.
S_EXP_2005S_EXP_2010S_EXP_2017
Spatial autocorrelation coef0.6188 ***0.6073 ***0.4258 ***
Constant0.0031 ***0.0006−0.0007 *
Soybean price (t − 1)−0.001 ***−0.00010.0002 *
Distance to soybean storage0.0003−0.0004 *−0.0002
Pasture area (t − 1)0.07423 ***0.0044 ***0.0065 ***
Soybean area (t − 1)0.0689 ***0.0148 ***0.0231 ***
Deforested area (t − 2)−0.0629 ***−0.01318 *0.02306
AIC−30,312.8−28,982.6−32,147.2
Significance levels: * p ≤ 0.1; ** p ≤ 0.05; *** p ≤ 0.01.
Table 3. Spatial lag regression models for pasture expansion determinant factors.
P_EXP_2005P_EXP_2010P_EXP_2017
Spatial autocorrelation coef0.7352 ***0.6980 ***0.7049 ***
Constant−0.0076−0.0170 ***−0.0138 **
Cattle head number (t − 1)0.00040.0021 ***0.0009
Distance to fridges−0.0014 ***0.00050.0019 ***
Indigenous land−0.0064 ***0.00040.0007
Savanna area (t − 1)0.0245 ***0.0140 ***0.0206 ***
Forest area (t − 1)0.0106 **−0.00020.0002
Pasture area (t − 1)0.0157 ***0.0097 ***0.0208 ***
Soy area (t − 1)0.0259 ***0.0327 ***0.0307 ***
Secondary vegetation area (t − 1)0.1666 ***0.1783 ***0.1619 ***
Deforestation (t − 1)−0.0187 ***0.00720.0904 **
AIC−35,867.6−39,101.8−35,292.7
Significance levels: * p ≤ 0.1; ** p ≤ 0.05; *** p ≤ 0.01.

