Article

Incorporation of Spatially Heterogeneous Area Partitioning into Vector-Based Cellular Automata for Simulating Urban Land-Use Changes

1
College of Civil Engineering, Nanjing Forestry University, Nanjing 210037, China
2
Anhui Province Key Laboratory of Physical Geographic Environment, Chuzhou 239004, China
3
Key Laboratory of Virtual Geographic Environment (Nanjing Normal University), Ministry of Education, Nanjing 210023, China
4
City Futures Research Centre, School of Built Environment, University of New South Wales, Sydney, NSW 2052, Australia
5
School of Geographic and Biologic Information, Nanjing University of Posts and Telecommunications, Nanjing 210023, China
*
Author to whom correspondence should be addressed.
Land 2023, 12(10), 1893; https://doi.org/10.3390/land12101893
Submission received: 22 August 2023 / Revised: 29 September 2023 / Accepted: 3 October 2023 / Published: 9 October 2023
(This article belongs to the Special Issue Spatial Optimization and Sustainable Development of Land Use)

Abstract

:
In cellular automata (CA) modeling, spatial heterogeneity can be delineated by geographical area partitioning. The dual constrained space clustering method is a prevalent approach for providing an objective and effective representation of differences within urban regions. However, previous studies faced issues by ignoring spatial heterogeneity, which could lead to an over- or under-estimation of the simulation results. Accordingly, this study attempts to incorporate spatially heterogeneous area partitioning into vector-based cellular automata (VCA), producing more accurate and reliable simulations of urban land-use change. First, an area partition strategy with DSC algorithm was employed to generate multiple relatively homogeneous sub-regions, which can effectively capture the spatial heterogeneity in the distribution of land-use change factors. Second, UrbanVCA, a brand-new VCA-based framework, was utilized for simulating land-use changes in distinct urban partitions. Finally, the constructed partitioned VCA model was applied to simulate rapid urban development in Jiangyin city from 2012 to 2017. The results indicated that the combination of DSC clustering and UrbanVCA model could obtain satisfying results as the average FoM values for the partitions and the entire study area exceeded 0.22. Furthermore, a comparative analysis of results from traditional area-partitioned CA models revealed that the proposed area partitioning approach had the potential to yield more accurate simulation outcomes as the FoM values were higher and SHDI and LSI metrics were closer to real-world observations, indicating its good performance in simulating fragmented urban landscapes.

1. Introduction

Urban growth is a complex and dynamic process, which is influenced by various factors, including natural, social, and economic factors [1]. “Spatial heterogeneity” refers to the non-uniform and complex distribution of land-use patterns. Rapid urban growth, in turn, leads to increasingly fragmented landscapes characterized by heightened spatial heterogeneity [2]. Cellular automata (CA) have emerged as effective tools for describing historical land-use transformations and forecasting prospective land scenarios, thus enhancing our comprehension of land-use dynamics [3,4]. Accordingly, it is crucial to integrate spatial heterogeneity into the CA model to yield accurate land-use simulation and prediction results.
According to the difference in the cells’ design, CA can be generally divided into two groups: raster cellular automaton and vector cellular automaton. In a raster urban CA model, geographic space can be described with regular units (often square) in a raster structure, which can facilitate subsequent computations by harnessing the extensive raster analysis functions available in GIS [5,6]. The unavoidable loss of detail induced by the raster data format motivated researchers to employ some irregular-shaped frameworks (e.g., land parcels) as the minimum space description modules, hereafter referred to as vector-based CA (VCA) [7,8]. Due to the inherent morphological advantage of vector cells, available VCA models have illustrated their considerable potential in simulating fine-scale urban growth, helping produce the model output more realistically [9,10].
Early VCA models were built using graph theory, which included Voronoi polygons [11] and Delaunay triangulation [12]. Nevertheless, VCA models rooted in graph theory may not entirely encompass real-world geographical objects due to their automated generation. As an enhancement to this spatial representation, the urban area was subdivided into various spatial units, such as land-use parcels, census blocks, and planning zones, which enhanced the model’s realism by establishing connections between land use and socioeconomic information. Among the different VCA models, those built upon land or cadastral parcels play a vital role in urban planning and provide a more realistic representation of ground objects. In brief, VCA models exhibit a substantial advantage in modeling land-use changes at a very fine scale [13]. Nevertheless, several issues in VCA models remain to be addressed. Firstly, the complexity increases due to the diversity of polygon shapes, leading to varying connections between neighboring cells. The neighborhood definitions in VCA models can be roughly classified into two categories: topology-based neighborhood and buffer-based neighborhood [10]. Dahal and Chow [14] defined 30 neighborhood configurations to evaluate parameter sensitivity in simulation results, revealing that VCA models with center-buffer neighborhoods can achieved the highest simulation accuracy. Additionally, urban land-use change is frequently characterized as an incremental and fragmented process, rather than an abrupt conversion of an entire land parcel from one land-use type to another within a short period [15]. Yao [8] introduced the dynamic land parcel subdivision-based vector cellular automaton (DLPS-VCA) framework. This framework efficiently simulates urban expansion, land parcel fragmentation, and land-use type transitions during urban development. Despite its advantages in urban simulation, the complex vector subdivision mechanism has limited the widespread use of DLPS-VCA.
In CA modeling, the concept of spatial heterogeneity can be captured by locally varying transition rules, spatially heterogeneous neighborhoods, and geographical area partitioning. To account for the spatially heterogeneous impacts of drivers on land-use change, researchers have employed local spatial statistical models, such as the spatial autoregressive (SAR) model and geographically weighted regression (GWR) [16], to derive the transition rules of the CA model by assigning weights to regression coefficients based on local proximity. Other studies adopted a hybrid modeling approach, such as GWANN [17] and ART-P-MAP [18], to describe a comprehensive exploration of the spatially heterogeneous driving forces influencing urban sprawl by coupling the spatial statistical model with the intelligent model. The neighborhood, as a critical internal component of the CA model, is notably influenced by spatial heterogeneity [19,20]. The most common types of neighborhood definitions are typically referred to as Von Neumann, Moore neighborhoods, and topology-based, buffer-based neighborhoods, where the size and shape of neighborhood is equivalent. This assumption obviously violates the spatial heterogeneity in reality, even with a well analysis of size sensitivity in related studies [21,22]. Recently, there have been some studies taking the distance–decay, multi-layer, and orientation weighted into account to investigate the influence of heterogeneous neighborhoods on individual cells [23,24]. These studies on heterogeneous neighborhoods have significantly contributed to the expansion of our knowledge regarding spatially varying interactions among adjacent cells.
Area partitioning in geographic space is another common strategy to address spatial heterogeneity in CA modelling [25,26]. By adopting a partitioning-based approach to acquire cell transition rules, the model’s ability to capture the similar patterns of land-use change evolution within each partition is notably improved, thereby leading to more precise and realistic representations of land-use dynamics. Area partitioning can be achieved through two primary methods: the administrative-based approach and the dual spatial clustering method. The former usually refers to administrative division such as administrative districts [27], planning zones [28], urban spatial structure [29], and other custom-defined units [30]. Although the administrative-based approach was simple and practical, these partitioning strategies mainly relied on empirical evidence, resulting in subjective outcomes and growing complexity with an increasing number of driving factors [31]. Furthermore, they may face challenges in capturing the inherent similarity characteristics of land-use changes, as they tend to overlook the spatial variations at micro scales [32]. Using the dual spatial clustering method, the entire cell space was segmented into several homogeneous regions considering both spatial proximity and attribute similarity, and then transformation rules were obtained for each partition individually. This process entails partitioning the cellular space based on the spatial heterogeneity characteristics of land-use change. They aimed to comprehensively account for the similarity in both spatial and attribute relations of land-use change. Therefore, they employed a clustering method to achieve the partitioning of the cellular space. As such, the conversion rules for each partition can effectively express the driving mechanism behind land-use changes. The existing dual spatial clustering algorithms, such as MK-means [33], SOM (self-organizing map) [26], and KDE (kernel density function) [29], were utilized for partitioning, providing an objective and effective representation of urban area differences with minimal human interference. Incorporating the non-uniform distribution of driving factors during the partitioning process, several limitations of these algorithms can be highlighted. First, land parcels are nonuniformly distributed with varying concentrations or dispersion [8]; the existing partitioning algorithms have difficulties in detecting clusters of irregular shapes and varying densities. Additionally, the results of these algorithms’ clustering can often be sensitive to noise. Second, attribute similarity measurements in these algorithms primarily relies on a binary predicate that utilizes Euclidean distance as the fundamental metric. However, in the face of uneven distributions in the attribute space, their inherent transitivity could lead to the continuous propagation and accumulation of differences between attribute values during the clustering process. As a result, the clustering results may fail to accurately reflect the transitional nature of geographical features in spatial distributions, eventually leading to over- or under-simulation results [34,35]. One dual spatial clustering algorithm, denoted as DSC, can handle both spatial proximity and attribute similarity in the presence of heterogeneity and noise [36]. The detection of these clusters is valuable for gaining insights into the localized patterns of geographical phenomena, and it has been successfully used for urban element identification and urban spatial structure analysis [37,38].
In view of the problems described above, this study attempts to incorporate spatially heterogeneous area partitioning into vector-based cellular automata (VCA), facilitating more accurate modeling of urban dynamics. First, an area partition strategy with DSC algorithm was employed to generate multiple relatively homogeneous sub-regions, which could effectively capture the geographic heterogeneity in the distribution of land-use change factors. Second, UrbanVCA, a brand-new vector CA-based framework to simulate the urban land-use change at the land parcel level, was adopted for the study [8,39]. By employing a set of pre-defined rules driving urban land-use changes, the UrbanVCA model can not only simulate the process of land fragmentation but also support a variety of machine learning algorithms to mine the probability of urban land-use changes. Finally, the constructed partitioned VCA model was applied to simulate rapid urban development in Jiangyin city, China, from 2012 to 2017. In addition, a comparison and analysis of traditional partitioned CA models were performed to validate the effectiveness of the proposed partitioned CA model using accuracy statistics and vector-based landscape indexes.

2. Study Area and Datasets

Jiangyin is located in the Jiangsu Province of China, situated at the northern end of the Yangtze River Delta (Figure 1). It is comprised of five districts: Central, Chengdong, Chengxi, Chengnan, and Chengdongnan, with a nearly 1.775 million residential population and a total area of 987.5 km2. In 2020, Jiangyin achieved a notable GDP of 411.375 billion yuan, affirming its standing as the second-ranked county-level city on the Chinese mainland (http://www.jiangyin.gov.cn/, accessed on 31 December 2020). Jiangyin city has experienced fast urbanization in the last two decades because the city has attracted significant direct foreign investment since the 1990s, leading to industrial development and an enhanced foundation. It is appropriate for a detailed analysis of neighborhood features due to its complex, fragmented land-use parcels, as well as its ongoing urban expansion and its size.
The cadastral parcel data of Jiangyin was acquired from planning bureaus between the years 2012 and 2017. Each land-use pattern map was further recategorized into eight groups based on the land-use/cover features in Jiangyin, including commercial (C), residential (R), industrial (I), public service (P), transportation (T), farm (F), village construction (V), and other lands (O). During the period from 2012 to 2017, there was a rapid occurrence of land-use changes in Jiangyin, with the number of land parcels increasing by 31.5% from 18,327 to 24,101. This observation suggests a noticeable fragmentation trend in the landscape.
In the wake of the early studies in CA modeling [27,29,40], several driving factors were introduced to provide a quantitative measure of the suitability for the occurrence of different land types, including topographical and geographical conditions, transportation factors, location factors, economic and population factors, some POI information, and government planning policy. Specially, the distance variables indicate accessibility to transportation and location factors using the “Euclidean Distance” tool within ARCGIS. The density of POI information was computed through the kernel density estimation (KDE) method. The primary data sets employed in this study were derived from Jiangyin urban master plan (2011–2030) (http://www.jiangyin.gov.cn/, accessed on 24 October 2012), Open Street Map (https://www.openstreetmap.org), Geospatial Data Cloud (http://www.gscloud.cn), and Resource and Environment Data Cloud Platform (http://www.resdc. cn, accessed on 25 December 2012) (see Supplementary Table S1). A stratified random sampling approach was employed to acquire 20% of the samples from the spatial variables for the determination of transition rules. As part of the data processing, all datasets underwent normalization, which standardized them within a common range from 0 to 1. Moreover, to ensure spatial consistency, all data were resampled to a uniform spatial resolution of 30 m (Figure 2).

3. Methodology

The proposed model contains three main parts (Figure 3): (1) input data; (2) area partitioning by DSC method; (3) UrbanVCA simulation. Firstly, the land parcels used for the DSC runs were abstracted into a Delaunay triangulation (DT) representation, where each parcel was represented by a node (i.e., centroid), and their neighboring relationships were defined through edges, establishing connections between pairs of centroids. DT containing two-level edge-length restrictions considering irregular distributions was adopted to establish spatial proximity relationships among land parcels. On this basis, an iterative clustering strategy utilizing information entropy (IE) was then employed. This strategy employed breadth-first search (BFS) to sequentially traverse kth-order neighbors for each land parcel, enabling the precise identification of clusters with similar attributes (i.e., driving factors of land-use change listed in Figure 2), while accounting for heterogeneity and noise. Secondly, a collection of urban development factors was gathered to train the transition potential map through UrbanVCA for each partitioned zone to simulate the urban land-use changes of Jiangyin, and various assessment metrics were employed to evaluate and compare the performance of different area partitioning models.

3.1. Spatially Heterogeneous Area Partitioning by DSC Method

DSC aims to address the challenges of heterogeneity and noise by incorporating both spatial proximity and attribute similarity [36]. In real-world scenarios, spatially adjacent clusters usually exist in a spatial dataset where the difference of observations in attribute distribution is homogeneous within each cluster but inhomogeneous between clusters. However, in the face of uneven distributions in the attribute space, attribute similarity measurements in these algorithms primarily relied on a binary predicate that utilizes Euclidean distance as the fundamental metric; their inherent transitivity could lead to the continuous propagation and accumulation of differences between attribute values during the clustering process. As a result, the clustering results may fail to accurately reflect the transitional nature of geographical features in spatial distributions, eventually leading to over- or under-simulation results (the validation of this point was demonstrated using both simulated and real-world data in [36]). The DSC algorithm primarily addresses the challenge of discovering homogeneous spatially adjacent clusters while dealing with between-cluster inhomogeneity and noise where those spatial points are described in the attribute domain. The detection of these clusters is valuable for gaining insights into the localized patterns of geographical phenomena. DSC methodology is initiated through the application of DT with edge-length constraints. This approach considers diverse geometric shapes, varying land parcel densities, and spatial noise to effectively establish spatial proximity relationships among the land parcels. Subsequently, an IE clustering strategy is devised to identify clusters that exhibit similar attributes. This approach enables adaptive and precise cluster detection while taking into account the existence of heterogeneity and noise.

3.1.1. Clustering Constrained by Spatial Proximity

Following the construction of the DT of the points (parcel centroids), the DSC algorithm proceeded to utilize global and local proximity criteria to partition the points into multiple spatial clusters. Through the application of global criteria, the long edges will be removed at the global level. This process can be expressed as follows:
G l o b a l _ L o n g E d g e s p = { e i e i G l o b a l M e a n + G l o b a l S D G l o b a l M e a n P a r t i a l M e a n p }
where Global_LongEdges(p) represents the set of long edges that need to be deleted at point p. GlobalMean refers to the average length of all edges in DT, PartialMean(p) denotes the average length of the edges directly connected to point p, and GlobalSD denotes the standard deviation of edge lengths in DT.
Subsequently, the local proximity constraint is applied to eliminate any remaining lengthy edges. The local process follows the following criteria:
F p = L o c a l S D p / L o c a l M e a n L e n g t h p L o c a l M e a n L e n g t h p = 1 d p i = 1 d p e i L o c a l S D p = i = 1 d p L o c a l M e a n L e n g t h p e i 2 d p
where Local_Mean_Length(p) represents the mean length of edges in N p , and   L o c a l S D p is the standard deviation of the lengths of edges in N p . d p denotes the number of edges incident to p, and e i is the length of edges in N p . The final spatial proximity comprises all connected mutation points for which F p γ .

3.1.2. Clustering Constrained by Attribute Similarity

DSC utilizes an attribute clustering method that relies on IE to classify the clustering results according to the attributes of the points (i.e., driving factors of land-use change listed in Figure 2). The attribute entropy represents the degree of similarity between the central point and the neighboring points within the first-order neighborhood. It can be computed using the following formula, where a higher value indicates a smaller difference between the central point and the connected points:
D A E n e i O = E o c n + 1 E o c = i = 1 n + 1 p i ln p i p i = v i j = 1 n + 1 v j
where D A E n e i O represents the attribute entropy of point O, and E o c represents the attribute similarity between point O and clustering cluster C . The clustering cluster C consists of n points { C 1 ,   C 2 ,   C 3 ,   ,   C n }, where point O represents the central point and cluster C is the set of points within the first-order neighborhood of point O . The driving factor values of each point in the cluster are denoted as { v 1 ,   v 2 ,   v 3 ,   ,   v n }, and the driving factor values of the central mutation point O is represented as v n + 1 .
After calculating the attribute entropy for each point, the point with the highest attribute entropy is selected as the starting point. Using Equation (3), the starting point is considered as the central point O , and each neighboring point is treated as a separate clustering cluster C . The attribute similarity E o c between the central point and each surrounding point is computed. The initial clustering cluster is formed by combining the mutation point O with the highest attribute entropy and the point with the maximum attribute similarity E o c among its surroundings. The candidate points are determined as the points within the first-order neighborhood of the initial clustering cluster. Equation (4) is employed to compute the E o c between each candidate point and the initial cluster:
θ = E o c E o c m a x E o c m a x = ln n + 1
where θ is the standardized variable; the maximum information entropy between mutation point O and the temporal cluster C, denoted as E o c m a x , is obtained by the hypothesis that the attribute values of the mutation points within temporal cluster C are equal. When θ is greater than the threshold, the mutation point O will be added into cluster C. If this exceeded the threshold, we allowed the mutation point O to be added to temporal cluster C . By choosing an appropriate value for θ , the PBM index is employed to achieve favorable outcomes. Achieving a high score for the PBM index confirms the acceptability of the result in terms of the attribute entropy measurement [41].
The cluster was iteratively expanded by repeating the steps of candidate selection until the first-order neighborhood of the cluster no longer contained similar points. Subsequently, the remaining points in the initial cluster were evaluated based on their   D A E n e i O values, and the point with the highest   D A E n e i O value was selected as the starting point for the second cluster. The aforementioned steps were repeated to group all points into different sub-clusters.

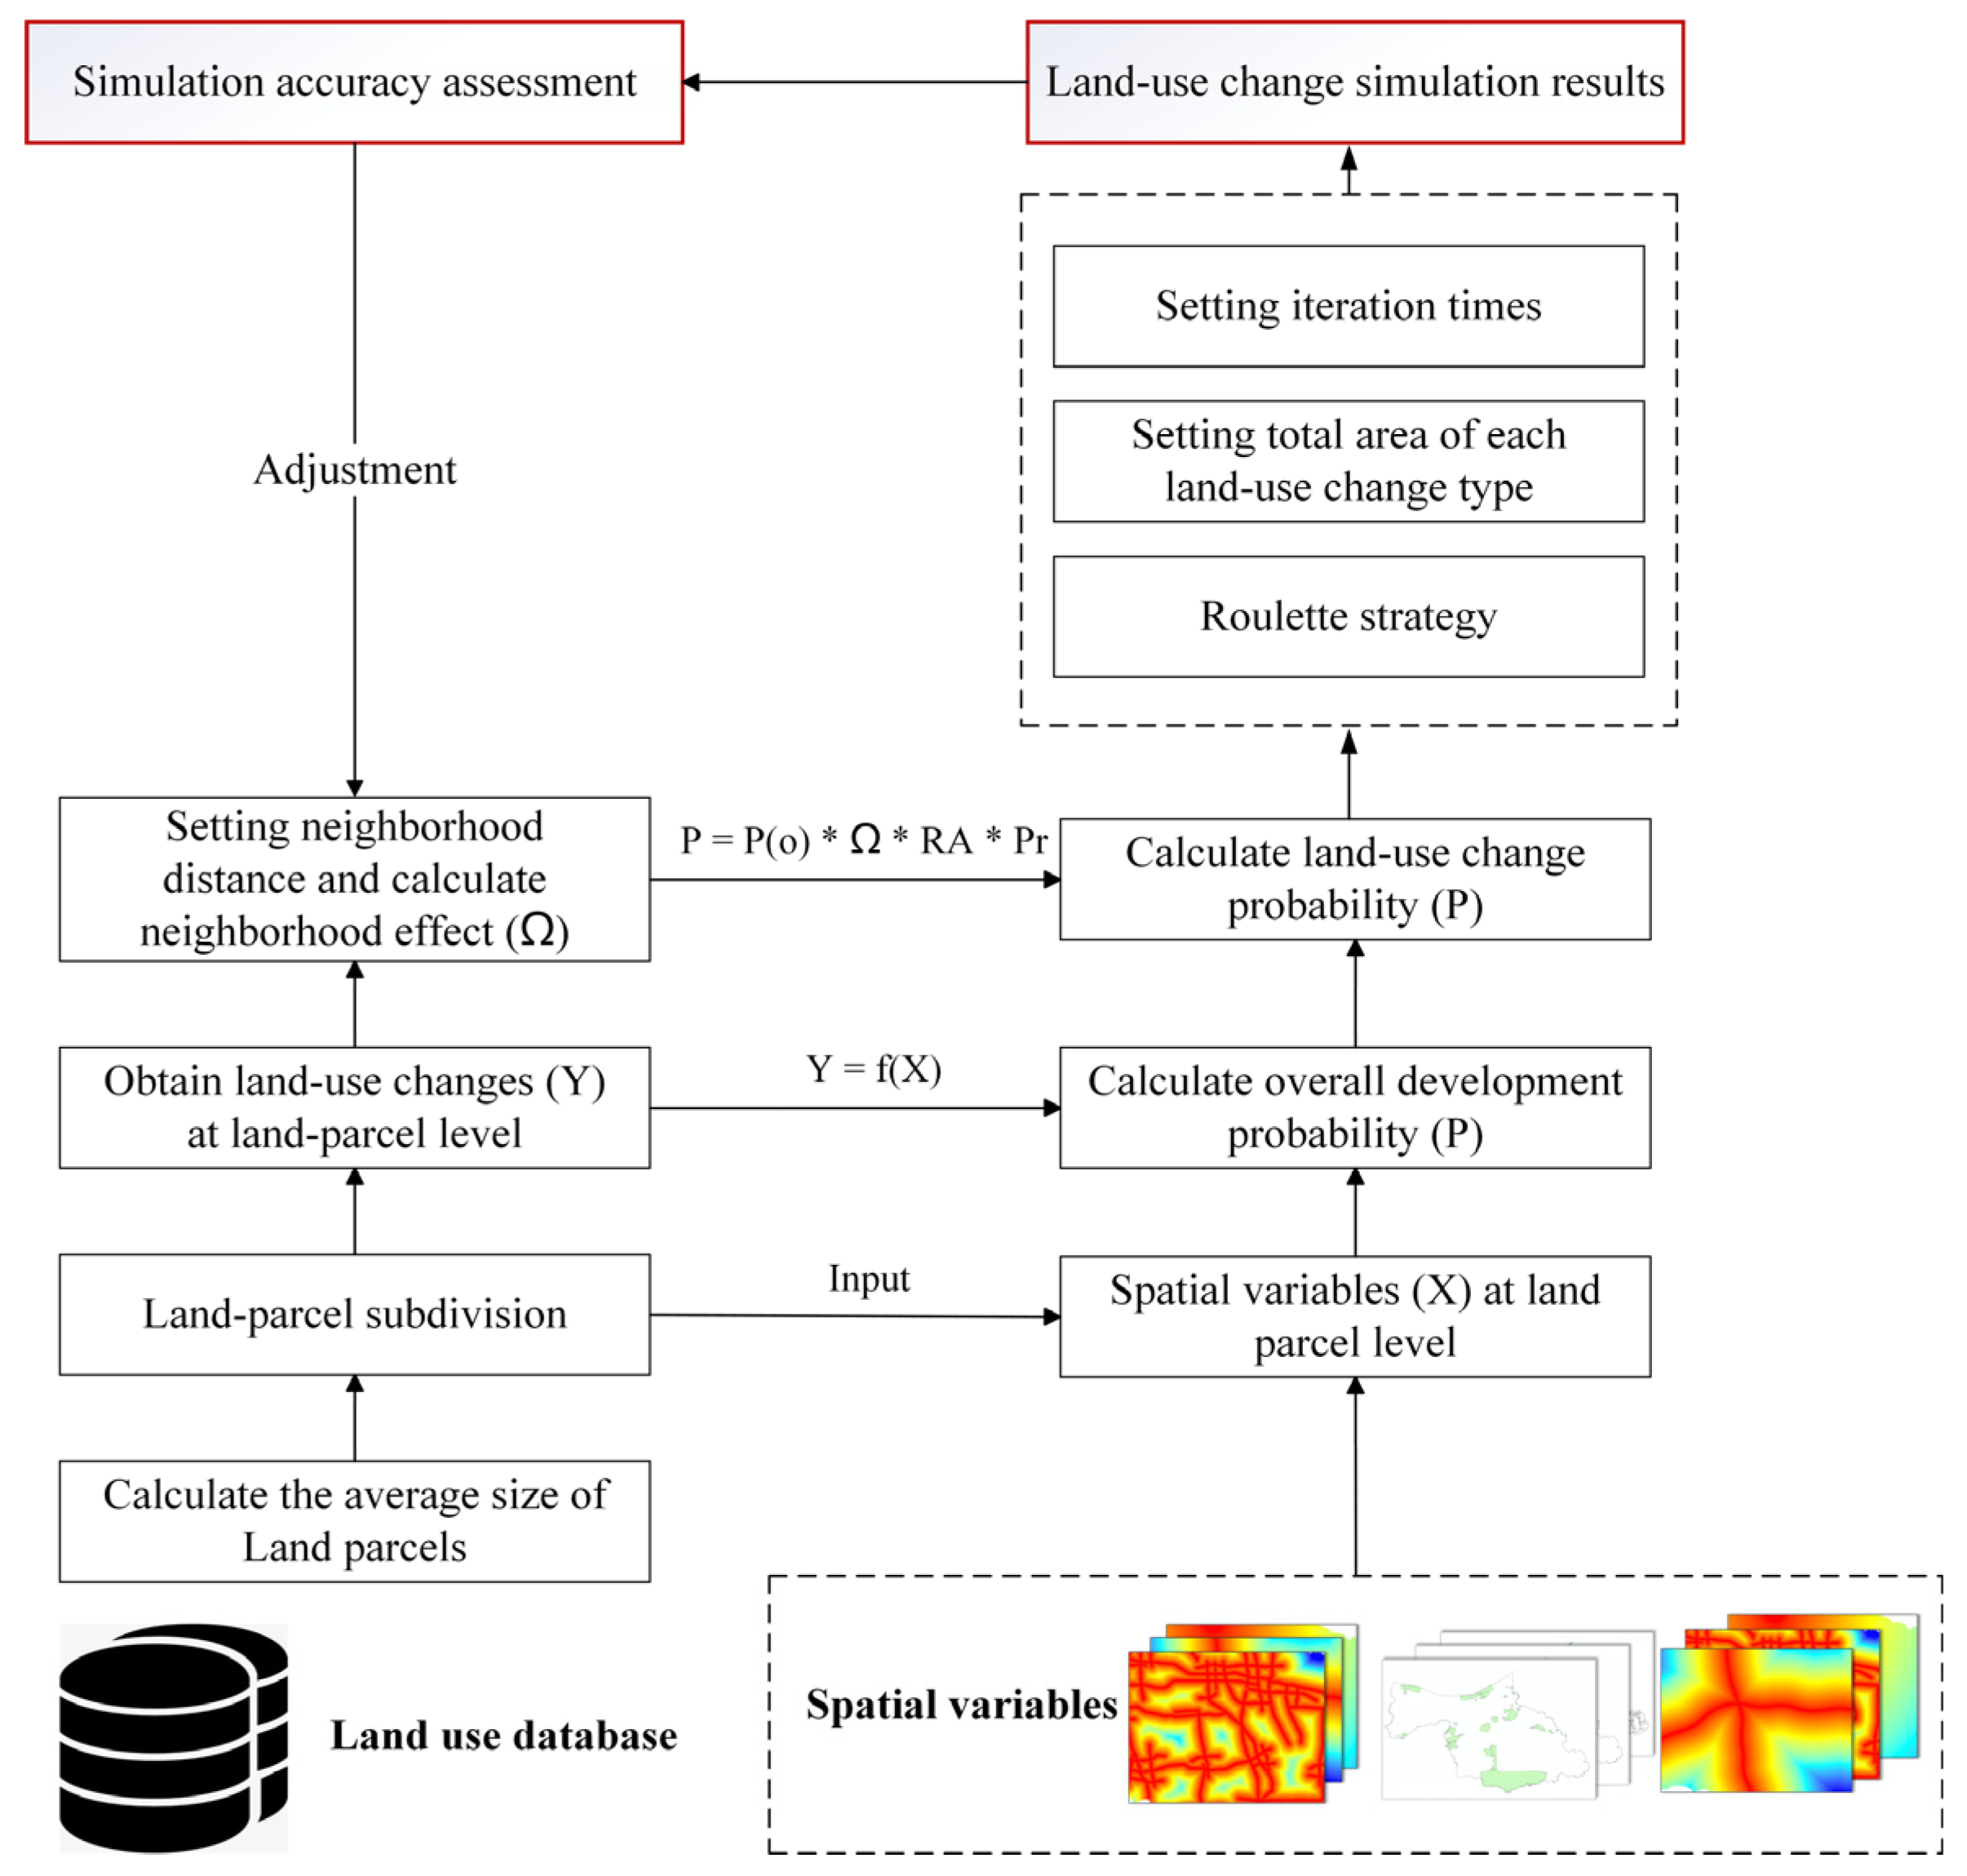
3.2. Urban Land-Use Change Simulation by UrbanVCA Model

UrbanVCA starts by utilizing a subdivision approach to establish the fundamental cellular unit as the minimum vector land parcel. In the context of this model, the segmented land-use parcels were characterized by the averages of spatial variables, denoted as X. These spatial variables served as the basis for defining probabilities of transformed land-use types, represented as Y . Subsequently, a model denoted as Y = f X is formulated. Ultimately, the probability of the segmented parcel transitioning into the specific land-use type in the initial year, denoted as Y i , served as the comprehensive suitability measure for land-use transformation when utilizing a VCA model (Figure 4).

3.2.1. Deriving the Minimum Vector Land Parcels

The use of raw land parcels as the primary simulation units poses a challenge due to their coarse granularity, which ultimately results in a significant reduction in simulation precision [39]. Thus, an appropriate land subdivision tool must be employed. The DLPS tool, which was developed by Yao [8], can divide land parcels into finer layouts according to the initial plots’ shape, size, and direction. The iterative and subdivision process continues until the area of each plot becomes smaller than the average area of the initial input plots (For more detailed information about data processing and execution, please refer to: https://www.urbancomp.net/archives/urbanvca-v2, accessed on 26 May 2022).

3.2.2. Mining the Urban Development Probability

After the subdivision of parcels through the DLPS module, the parcels were treated as fundamental units for simulation based on a VCA model. The urban developmental probability (P) of each cell was mainly determined by four factors: the land-use suitability ( P g ), constraint factor ( P c ), neighborhood effect ( Ω ), and random factor ( R A ). The probability of the i -th land parcel transitioning into the k-th type of land use at time t can be determined through the following calculation:
P i k , t = P g i k , t × Ω i , j t × P c i t × R A
The calibration of land-use suitability ( P g ) as defined in Equation (5) was carried out by employing a selection of geospatial variables outlined in Figure 2. The UrbanVCA provided a selection of three machine learning algorithms to obtain the overall suitability: logistic regression (LR), neural network (NN), and random forest (RF). Here, we employed the RF-based model to perform the calibration and estimation of land-use suitability. Compared with LR, it proves highly effective in addressing the issue of multicollinearity among spatial variables, rendering it highly efficient when dealing with tasks that involve fitting in high-dimensional spaces. In addition, the RF-based model is better suited for extracting a variety of transformation rules in different regions compared with NN. Therefore, the land-use suitability of the i -th land parcel transitioning into the k -th land-use type at time t can be expressed as follows:
P g i k , t = n 1 M I ( h n x = = Y k ) M
where i serves as an indicator for the ensemble of decision trees, with M representing the total number of decision trees. The vector x encompasses auxiliary spatial variables that are linked to the specific land parcel, and h n x indicates the predicted type of the n -th decision tree for vector x . The determination of the optimal number of decision trees involved iterative parameter adjustments, with comparison of the corresponding simulation accuracy results.
The fundamental units of VCA are irregular parcels, making it impossible to obtain the homogeneous neighborhoods commonly found in patch-based or raster-based CAs. Consequently, defining rules for VCA neighborhoods is both intricate and sensitive. In UrbanVCA, a centroid-based buffering rule was employed, which considered parcel area as a weight, facilitating the capture of actual parcel neighborhood effects ( Ω ), and thereby enhancing the accuracy of simulating diverse land-use types. Assuming that the j -th parcel is located within a buffer zone centered on the i -th parcel with a buffer range of d , and there are no physical barriers between the i -th and j -th parcels, the formula for the neighborhood effect of the j -th parcel on the i -th parcel at time t is as follows:
Ω i , j t = e d i , j / d S j / S i S m a x / S m i n
where e represents an exponential constant, while d i , j indicates the central distance between the i -th and j -th parcels. The variables S i and S j , respectively, represent the areas of the i -th and j -th parcels. Additionally, S m a x and S m i n denote the maximum and minimum parcel areas within the study area. Consequently, the formula expressing the neighborhood effect of the k-th land-use type on the i-th parcel at time t is as follows:
  Ω i k , t = j Ω i , j k , t i f   d i s i , j b u f f e r _ d   a n d   N o   R i v e r   b e t w e e n   i   a n d   j
Constraint factor ( P c ) refers to a specific land-use type that remains unchanged during the simulation process and does not transition into other land-use types. In this study, water area factor and ecological redline zones were considered as development-restricted areas. The constraint factor for the i -th parcel can be computed based on the following formula, where S i represents the suitability status of the parcel for development:
P c i t = 0   S i = restriction   development   area 1   S i = suitable   development   area
Taking into account the uncertainty inherent in the land-use change process, the random factor R A = 1 + ln y α was introduced, where α is a parameter ranging within (1, 10), and y represents a stochastic variable with values that falls within the range of 0 to 1.
By calculating the probabilities for the conversion of each land parcel into different land-use types, the conversions that exceeded the development thresholds and had the highest probabilities were chosen for execution. For specific land-use classes in this study, the development thresholds were determined by computing the average probabilities of transition from all non-built-up land parcels to these particular land-use classes.

3.3. Model Performance Assessment

In this study, the figure-of-merit (FoM) method was employed to assess the accuracy of the simulation results [42]. FoM serves as a valuable indicator used to gauge the consistency between the actual transition pattern and the simulated transition pattern, calculated as the ratio between the intersection and union of the actual change and simulated change as follows:
FoM = B/(A + B + C + D)
where A denotes the area undergoing change, which remains constant during the simulations. B represents the common area of change shared between the actual and the simulation results. C corresponds to the area where changes are observed in both the actual and simulated maps, even though the specific land-use change types may differ between them. D represents the area that remains constant in the actual map but experiences changes throughout the simulations.
According to previous studies [26,43,44], several landscape indices, including PD (patch density), LPI (largest patch index), LSI (landscape shape index), and SHDI (Shannon’s diversity index), were employed to assess how closely the patterns of the simulated results matched those of the actual scenario. PD plays a crucial role in describing landscape fragmentation. The higher the PD value, the more pronounced the landscape fragmentation becomes. LPI is determined by calculating the ratio between the area of the largest patch and the total landscape area, which quantifies the level of aggregation within the simulated landscape. A higher LPI value indicates a higher degree of aggregation within the simulated urban landscape. LSI provides a measure of the shape complexity of the landscape by quantifying the extent to which the shape of the simulated landscape deviates from that of a square with an equivalent area. The complexity of the shape of simulated urban patches increases with a higher LSI value. The SHDI is a metric that gauges the complexity and heterogeneity of various types of patches within a landscape. As SHDI increases, it tends to be a more uniform distribution of different patch types throughout the landscape. The landscape indices calculation process was performed using VecLI v3.0.0 software: https://www.urbancomp.net/archives/vecliv300, accessed on 18 September 2022.

4. Results and Discussions

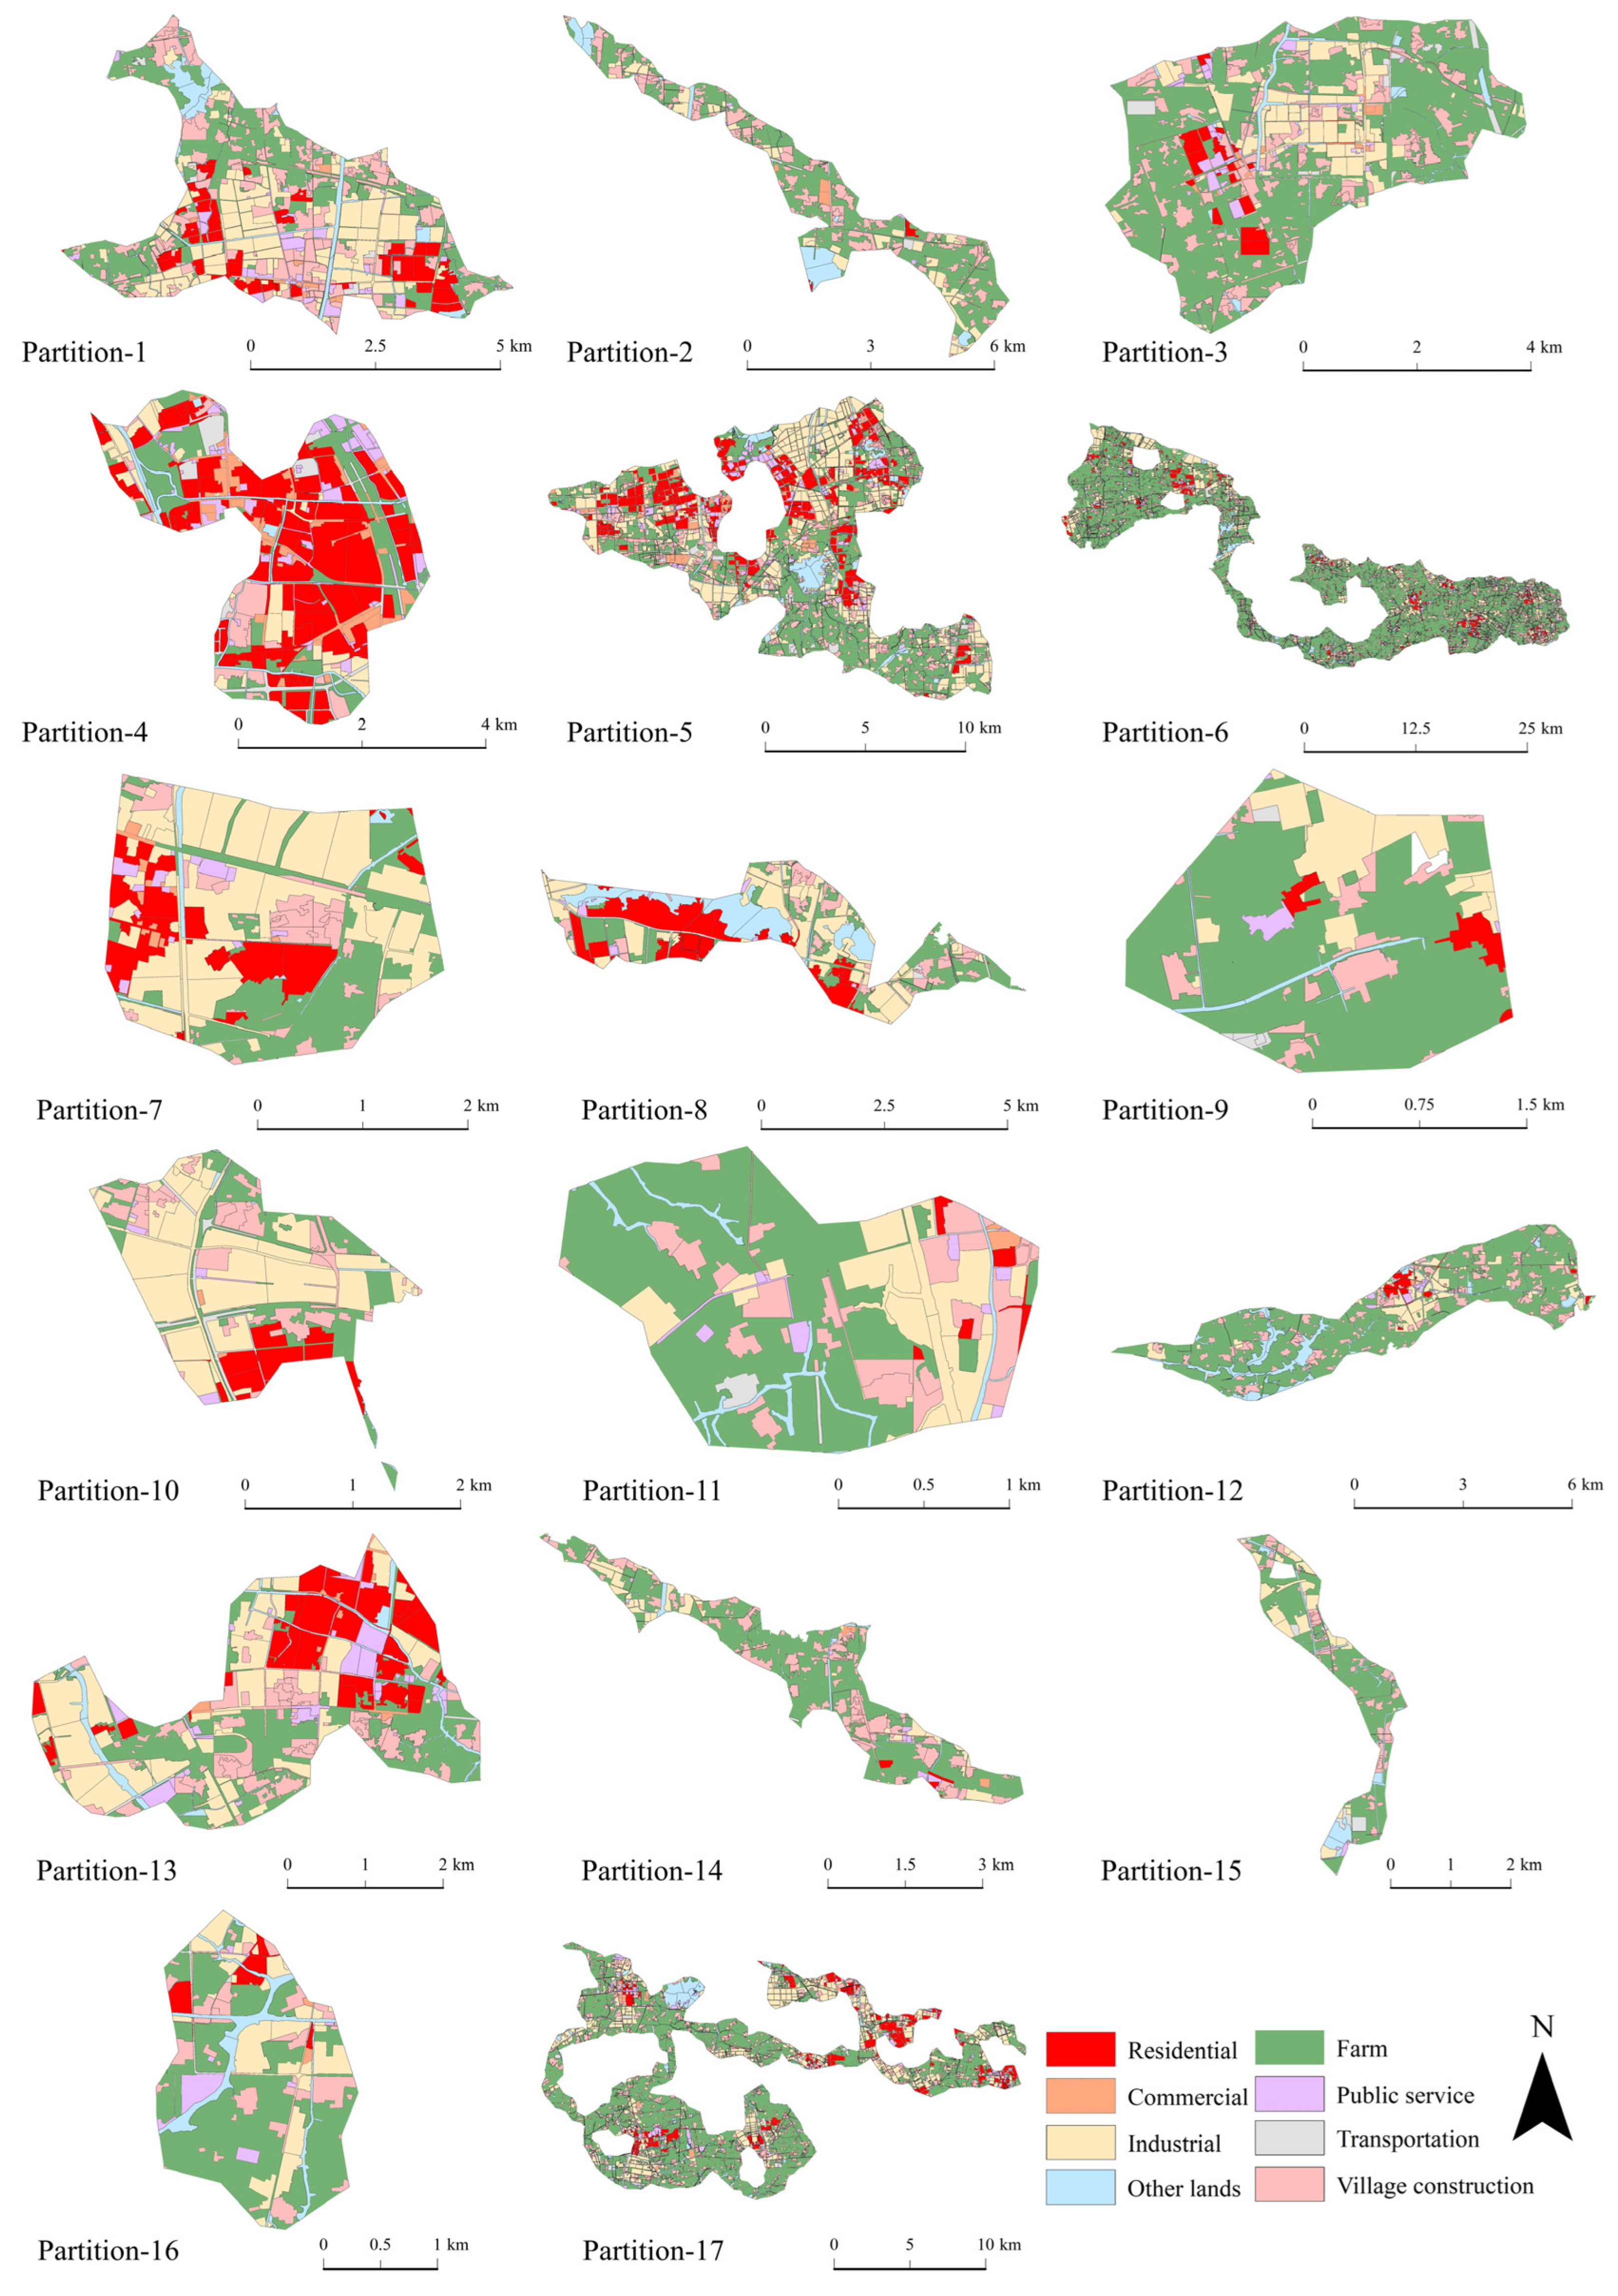
4.1. Area Partitioning Implementation

To partition the research area, we employed the DSC algorithm. The land parcels are represented using D T , revealing an uneven dispersion of points that densely cover the entire city (Figure 5a). In such instances where spatial datasets are irregularly distributed, the natural neighbors distinguished through D T are imperfect with varying densities. The constrained D T is firstly employed to model the spatially heterogeneous adjacency relationships among these points (Figure 5b). It entails the use of varying search radii, with larger radii applied to low-density regions and smaller radii to high-density regions. As a result, every node and edge can retain the essential data required for model execution, such as parcel land-use type, neighboring parcels, and parcel development factors. On this basis, high-order extension strategy is iteratively implemented to traverse kth-order neighbors for each parcel based on IE-based attribute similarity, enhancing the capability of DSC to handling multidimensional data into a number of clusters. In Figure 5c, the points of the same color indicate that they belong to the same clusters. Finally, a Delaunay-based shape reconstruction method, as outlined by Peethambaran and Muthuganapathy [45], was utilized to accurately identify the boundaries of 17 different zones (Figure 5d).

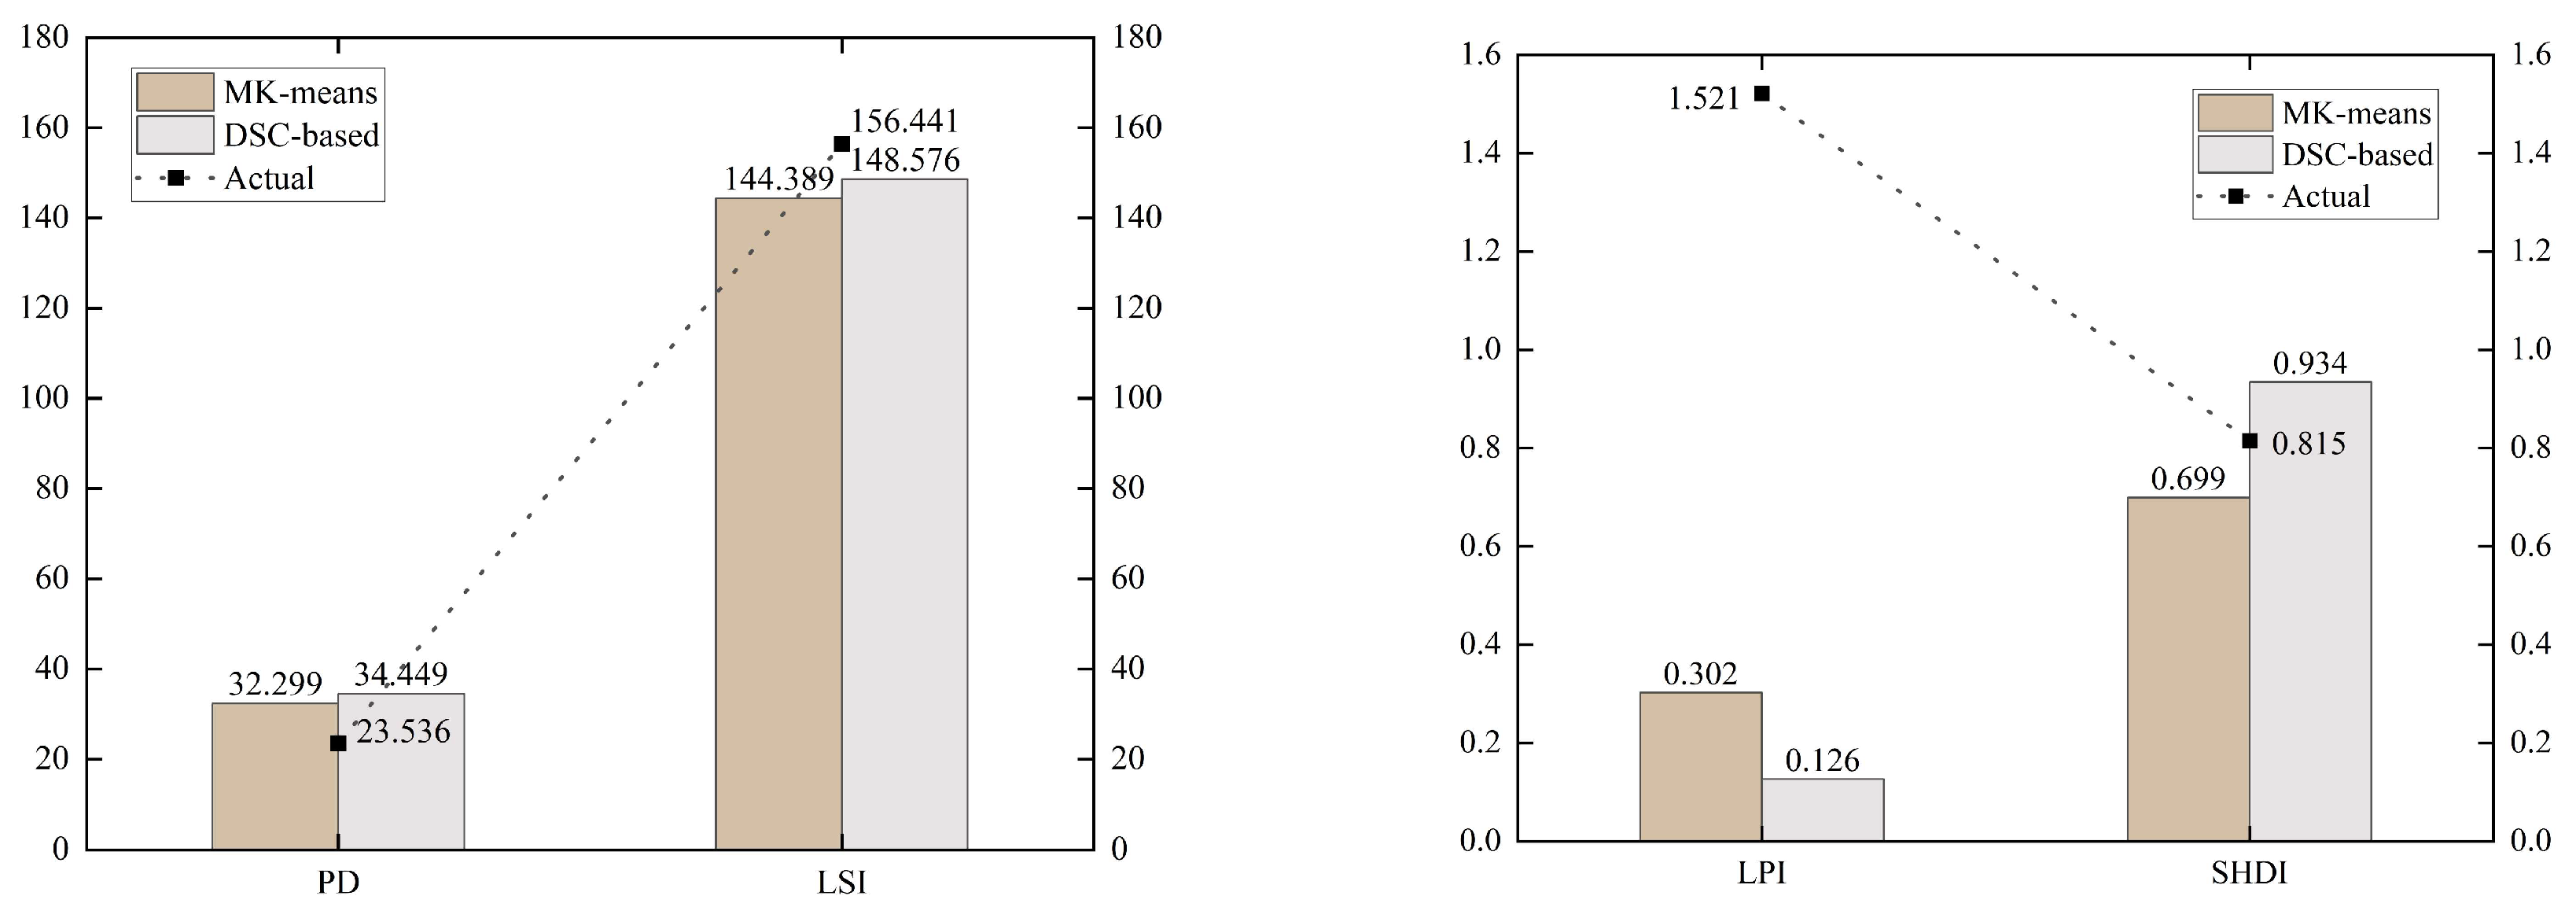
4.2. Spatial Stratified Heterogeneity Measurement

In this study, we employed Geodetector [46] to quantify the degree of spatial stratified heterogeneity using various area partitioning strategies. Spatial stratified heterogeneity (SH) is represented by the q value: a higher q value indicates greater SH, signifying the need to divide the entire sample into stratified samples for modeling. The q value falls within the range of (0, 1), where 0 indicates insignificant spatial stratification of heterogeneity, and 1 signifies a perfect spatial stratification of heterogeneity. Under different area partitioning strategies in this study, Mk-means-based zoning indicates a q value of 0.327 and administrative-based zoning indicates a q value of 0.241. DSC-based zoning has the largest q value of 0.748. This means that DSC-based zoning helps to divide the whole urban space into more homogeneous sub-region areas (Figure 6).

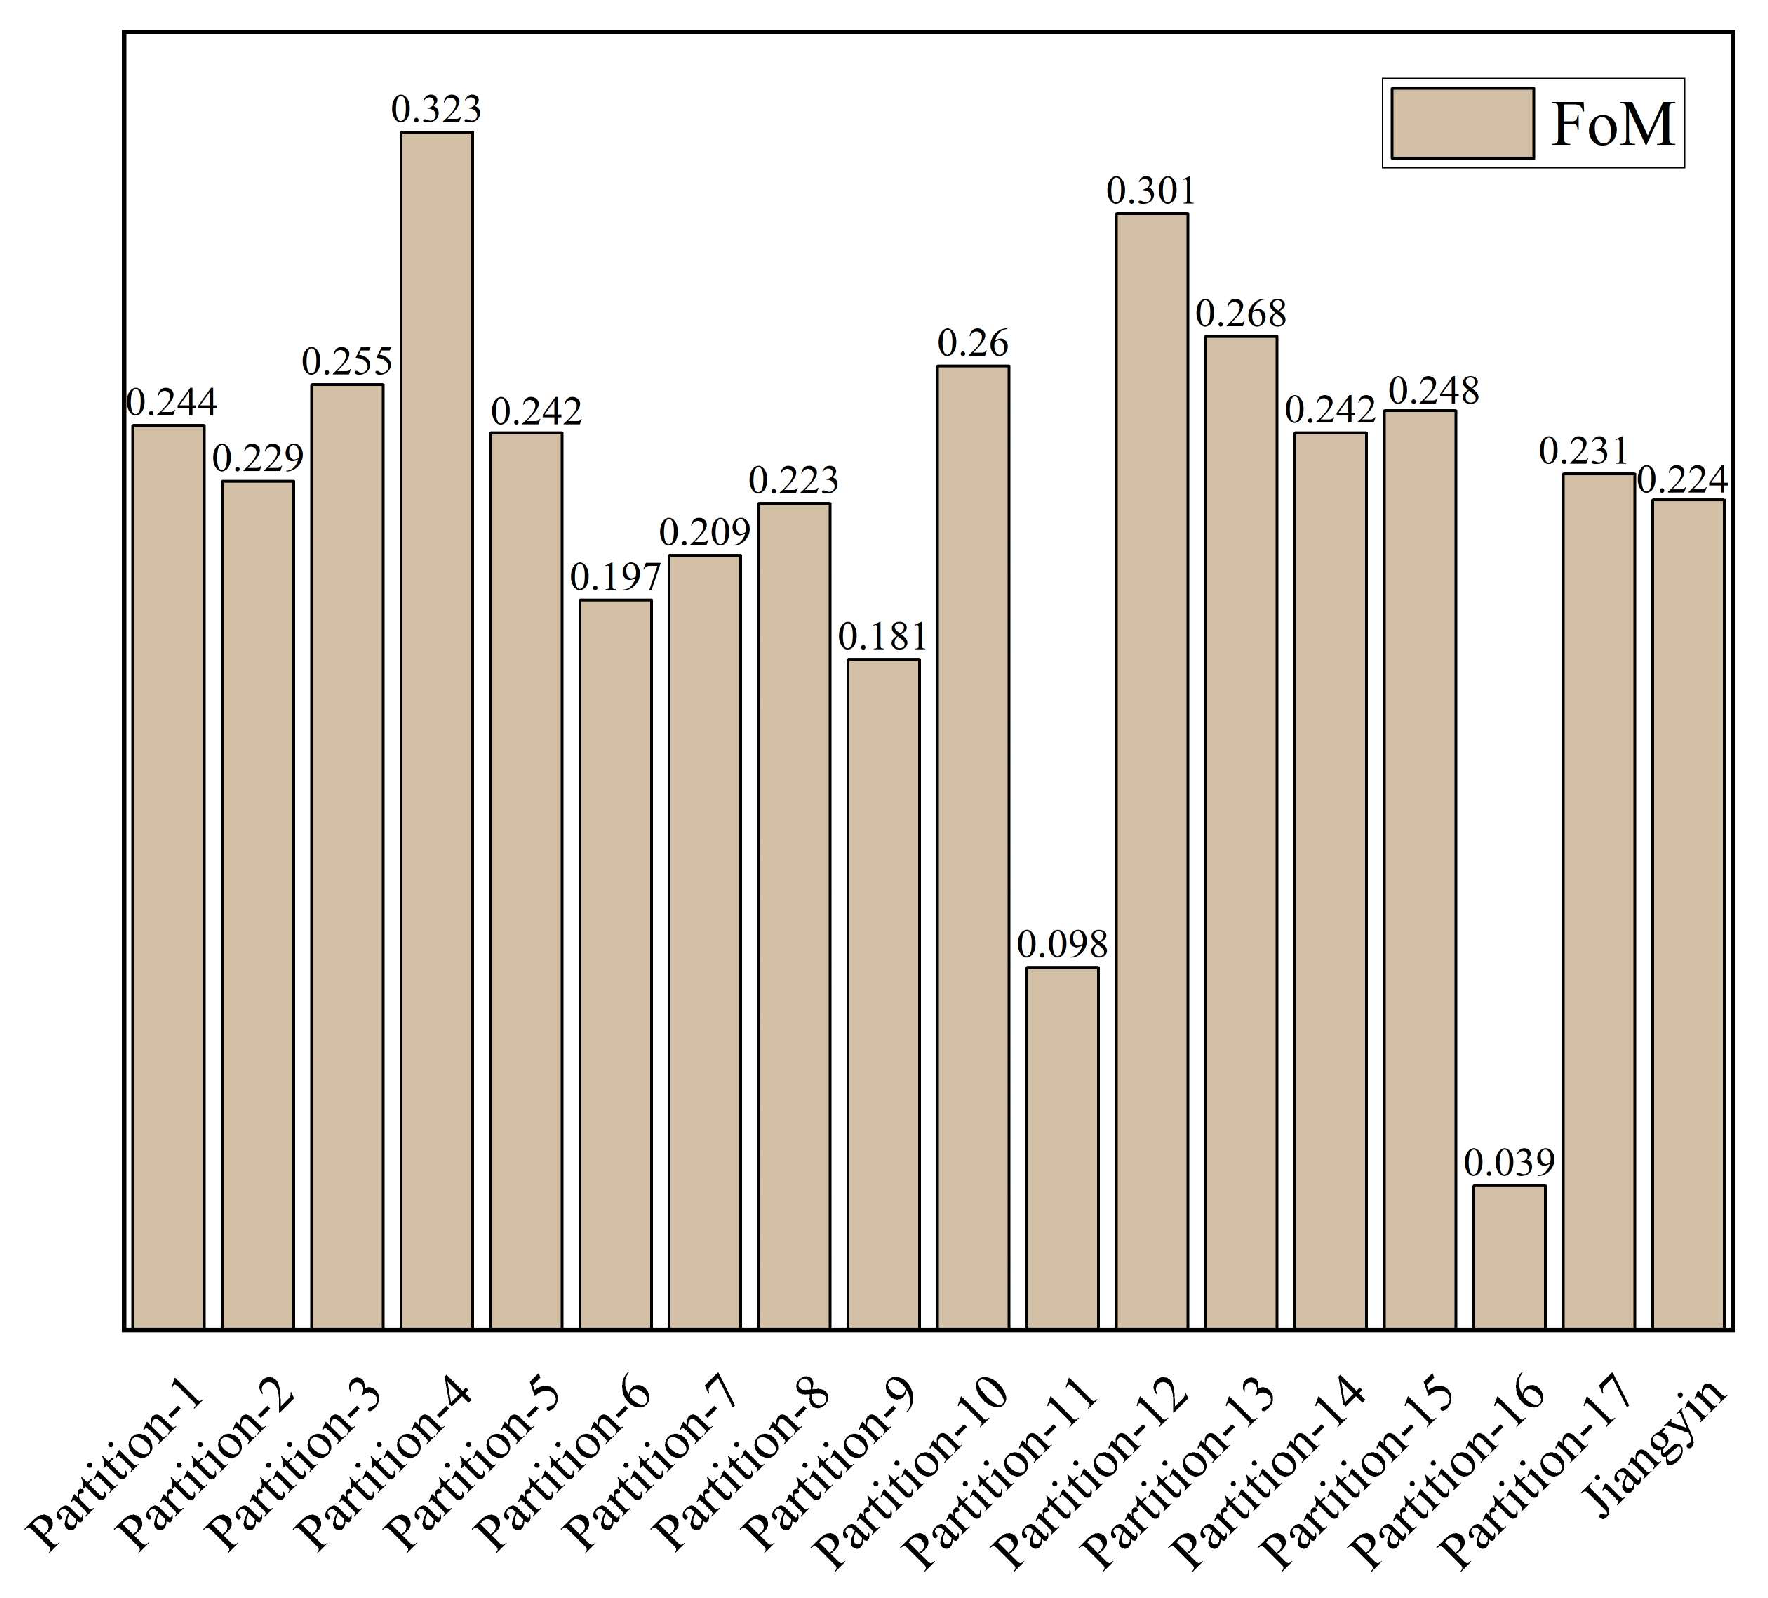
4.3. Urban Land-Use Changes Simulation

As described in the previous section, the transition rules were independently calculated with UrbanVCA in each partition. By using the DLPS tool, the initial 18,327 and 24,101 parcels from 2012 and 2017 have been respectively subdivided into 23,204 and 27,839 individual parcels. In the training of the RF model, we conducted a random selection of 60% of the data for training the model, reserving the remaining portion for cross-validation, to evaluate the model’s accuracy. Specially, we established 90 decision trees with a 30% utilization of OOB data. Cross-validation was carried out through boosted random sampling over 100 epochs to calculate the average accuracy, thereby ensuring the utmost reliability of the outcome. Through the configuration of the RF, we can derive the land-use transition probability for each parcel by integrating the spatial variables listed in Table 1 within the partitioned study area. Additionally, the optimal value of Ω was determined by the best simulation result according to the FoM metric. For the purpose of determining the optimal radius value, we established the search step as 100 m in the range (200, 900) to conduct simulation. In this study, the neighborhood distance was adjusted to 700 m, resulting in the highest simulation accuracy being achieved (Figure 7).
Transition rules for the partitioned CA model were determined by incorporating constraint factors, neighborhood effects, random factors, and land-use transition probabilities. Subsequently, the partitioned CA model was executed to simulate the evolution of urban land use in Jiangyin from 2012 to 2017, where the urban growth pattern in Jiangyin in 2017 was simulated. Figure 8 displays the FoM values of the simulation results in different partitions. The accuracy of each area was relatively high and the FoM of the whole study area was significantly larger than 0.22. Especially, the average FoM values for the partitions exceeded 0.22, except for partitions 11 and 16. The main reason for this is the significantly small number of land parcels in these two subzones, coupled with the absence of comprehensive land-use types. Among the numerous subzones, they constituted only a tiny fraction, leading to their notable low accuracy (0.098 and 0.039, respectively). These results indicated two key points: (1) The partition VCA model, which relies on DSC clustering and RF-based rule mining, is capable of achieving a high degree of accuracy in simulating land-use patterns for both individual subzones and the entire study area; (2) The DSC algorithm is well-suited for identifying clusters within datasets characterized by an uneven distribution of non-spatial attributes. Nevertheless, it has the potential to lead to an over-segmentation of urban space into numerous smaller areas, thereby affecting the accuracy of partition simulation.
Additionally, we conducted a comparison between the simulated results and the actual urban land use, as illustrated in Figure 9. This comparison specifically focuses on landscape indices within the study area. It can be observed in Figure 10 that the proposed framework can obtain acceptable results as the PD, LPI, LSI, and SHDI metrics are similar to the actual case. In a more detailed analysis, the PD values obtained in simulation results were typically higher than the actual values, leading to a significantly greater degree of land fragmentation, coupled with lower LPI values. This could be due to the increased landscape fragmentation caused by parcel subdivision, as well as an over-segmentation of the zoning scheme. Notably, the SHDI obtained from DSC clustering is higher than the actual land-use situation. This observation suggests that, when applying DSC, there is a tendency for different patch types to exhibit a balanced distribution within the landscape. This capability effectively illustrates landscape heterogeneity, particularly in capturing the non-uniform distribution of various patch types within the landscape.

4.4. Model Comparison and Assessment

4.4.1. Comparison of Simulation Using Administrative-Based Zoning

As described in the previous section, Jiangyin city was divided into five administrative districts: Chengdong, Chengxi, Chengnan, Chengdongnan, and the Central Zones. The UrbanVCA model was then employed to simulate each partition, and the simulation accuracy is presented in Table 1. Overall, the administrative-based approach demonstrated acceptable simulation performance. There remain differences between the proposed approach and the two models. As Figure 11 demonstrates, the results of the proposed area partitioning approach tend to be more fragmented than that achieved through administrative-based zoning, as characterized by both the PD and LPI metrics showing a great difference from the actual scenario. Nevertheless, the proposed area partitioning approach, taking spatial heterogeneity into account, has the potential to generate more accurate simulation results, as FoM values are higher and SHDI and LSI metrics are closer to real-world observations. Through details in Part 1, Part 2, and Part 3 (Figure 12), it is evident that the administrative-based zoning scheme displays cases of misclassifying agricultural land as residential land and rural construction land. In comparison, the simulation results obtained using DSC clustering came closest to representing the actual land-use situation. Furthermore, when considering the shapes of individual land parcels, they also closely resemble the real land use. These findings suggest that the administrative-based zoning scheme results in a higher degree of urban landscape aggregation and lower shape complexity, highlighting its effectiveness in simulating regular urban landscapes [47,48].

4.4.2. Comparison of Simulation Using Traditional Dual Spatial Clustering Zoning

For comparative purposes, we also introduced two typical dual spatial strategies: modified k-means (MK-means) [49] and DBSC [50]. The K-means method calculates the spatial distance of the clustering targets, while the MK-means algorithm not only focuses on the spatial clustering of the targets but also takes into account their attribute distance. Therefore, the MK-means algorithm uses a generalized Euclidean distance as the clustering metric, replacing the spatial distance used in the K-means method. The generalized Euclidean distance is defined as follows:
D p i , p j = w 1 D S p i , p j + w 2 D A p i , p j
In this equation, D(pi,pj) between pi and pj is calculated as the weighted sum of the normalized spatial distance DS(pi,pj) and non-spatial distance DA(pi,pj). The default values for the weights, w1 and w2, are both set to 0.5 [51].
The DBSC algorithm is a clustering method that identifies spatial clusters by modelling the spatial proximity and attribute similarity relationships among spatial objects with the help of constrained Delaunay triangulation (for more details, refer to [50]). The DBSC algorithm has proven to be efficient and applicable in detecting clusters characterized by irregular shapes and varying densities.
For the first experiment, the optimal value of K was also determined by the best simulation result according to the FoM metric. We conducted the clustering for five different values of k: 3, 4, 5, 6, and 7, and the k value was adjusted to 4, resulting in the highest simulation accuracy being achieved (i.e., FoM = 0.223). Figure 13 visually represents the partitioning results obtained through Mk-means, dividing the area into four sub-regions. Interestingly, these sub-regions exhibit a resemblance to the administrative divisions. This is primarily due to the challenge of the MK-means method in detecting clusters of arbitrary shapes and different densities. Moreover, the sensitive to noise parcels in the partition results could lead to systematic bias of simulated results [29]. Similar to the outcomes observed with the administrative zoning scheme, the MK-means method also presented instances of misclassification. It is detailed in Part 1, Part 2, and Part 3 (Figure 14) that while the MK-means zoning scheme effectively simulates the agricultural and public service land within the specified area, it still encounters instances of misclassifying certain agricultural land as other land-use types. Figure 15 displays the landscape metrics of the urban landscape, which were simulated using the three zoning schemes. The landscape metrics of the simulation results of MK-means are all positioned at a moderate level in comparison with that of the other two models. This suggests that the simulation accuracy of spatially heterogeneous area partitioning by different methods is DSC-based > Mk-means-based > administrative-based zoning.
For the second experiment, DBSC algorithm had difficulties in obtaining satisfactory results, where urban space was over-segmented into 2750 clusters (see Supplementary Figure S1). This is mainly attributed to the fact that the attribute similarity measurements in DBSC is treated as the Euclidean distance. Existing research has indicated that clustering methods developed for Euclidean scenarios can introduce systematic bias, leading to either an overestimation or underestimation of the clustering tendency [35]. Through the utilization of the information entropy clustering strategy, the DSC algorithm is able to identify appropriate indivisible clusters and mitigate the challenges associated with both over- and under-segmentation phenomena. The outcome demonstrates that the DBSC algorithm is unsuitable for datasets characterized by uneven attribute distributions.

5. Conclusions

Spatial planning in China not only encompasses individual regions but also requires the consideration of synergistic effects among different regions, resulting in distinctive interactive characteristics during the land evolution process [52]. Spatially heterogeneous area partitioning refers to the distribution and variations in various geographical features, conditions, and resources. These differences serve as the medium for interactions between different regions, influencing land-use decisions. By effectively utilizing information from spatial heterogeneity, planners can gain a more profound understanding of the structured development patterns in different regions. This aids in making spatial planning adjustments more effectively to promote balanced development across various regions, preventing excessive concentration or unreasonable dispersion of land use. These considerations hold significant practical importance for optimizing spatial planning at the urban level.
In CA modeling, spatial heterogeneity can be effectively characterized through geographical area partitioning. DSC is regarded as a suitable method to enhance the partition VCA model, as it can efficiently capture the spatial heterogeneity in the distribution of land-use change factors. We adopted the DSC clustering to produce multiple relatively homogeneous sub-regions, thereby strengthening the transition rules of the UrbanVCA model and accurately simulating the urban growth of Jiangyin city. Three comparisons of traditional partitioned models (i.e., administrative-based, Mk-means-based, and DBSC-based zoning) were conducted to validate the effectiveness and merits of the proposed partitioned CA model using FoM accuracy metric and several vector-based landscape indexes. The primary conclusions can be summarized as follows:
For spatial stratified heterogeneity assessment: In order to demonstrate the effectiveness and superiority of the DSC algorithm, we assessed this spatial heterogeneity by applying the q-statistic to the distribution of land-use change factors of the DSC zones.
Under different division strategies in this study, Mk-means-based zoning indicates a q value of 0.327 and administrative-based zoning indicates a q value of 0.241. DSC-based zoning has the largest q value of 0.748. This means that DSC-based zoning helps to divide the whole urban space into more homogeneous sub-region areas.
For accuracy assessment: The proposed DSC-based area partitioning approach can obtain satisfying results as the average FoM values for the partitions exceed 0.22. Despite the fact that the DSC method may result in an excessive subdivision of the study area into several small areas, the tiny size of these areas does not compromise the model’s ability to achieve the highest simulation accuracy. The administrative-based and MK-means-based zoning models demonstrated acceptable simulation performance. The MK-means algorithm faces challenges in accurately identifying the clusters of non-convex shapes and varying densities, resulting in partitioning results that visually resemble the administrative divisions. While both the DSC and DBSC methods tend to lead to an over-segmentation of urban space, the DBSC method, as opposed to DSC, utilizes a binary relation strategy for attribute clustering. This leads to an excessive over-segmentation of urban space, generating a considerable number of clusters and consequently causing systematic bias in simulation outcomes.
For landscape assessment: The fragmentation (i.e., PD index), aggregation (i.e., LPI index), shape complexity (i.e., LSI), and land heterogeneity (i.e., SHDI) of simulated urban landscape were conducted for the study region to evaluate the performance of different models. The results of the DSC-based area partitioning approach tend to be more fragmented compared with other models. The administrative-based zoning scheme results in the highest degree of urban landscape aggregation and lowest shape complexity, indicating its good performance in simulating regular urban landscapes. Meanwhile, the landscape metrics derived from the simulation results obtained using the MK-means approach are situated at a moderate level. Notably, the SHDI obtained from DSC clustering is closer to the actual land-use situation. This suggests that the DSC-based model can effectively portray landscape heterogeneity, particularly in capturing the non-uniform distribution of various patch types within the landscape.
In general, the simulation performance of spatially heterogeneous area partitioning by different methods is DSC-based > Mk-means-based > administrative-based zoning. DSC-based zoning indicates the largest q value, highlighting its effectiveness in capturing the spatial heterogeneity in the distribution of land-use change factors. MK-means-based and administrative-based zoning have advantages in capturing regular urban landscapes of urban growth. However, when considering the degree of spatial stratified heterogeneity, they fall short in comparison with DSC with lower q-values.
There remain certain limitations that require further attention and resolution. First, the DSC algorithm was utilized for partitioning, and the outcome indicated that the combination of DSC clustering and RF-based rule mining was appropriate. Future research concerning partitioned vector CA models should focus on their capacity to recognize and effectively model land-use patterns, dynamics, and sensitivity to spatial heterogeneity. For example, how to measure the landscape heterogeneity from different aspects to improve the performance of partitioned transition rules. Second, the state-of-the-art convolutional neural network (CNN)-VCA model has achieved remarkable simulation performance at the land parcel level, representing a substantial advancement within the domain of VCA models [40]. Future research can apply the combination of DSC and CNN-VCA to the urban growth modeling to further validate its advantages and potential benefits. Finally, it is crucial to note that our study focused on testing the applicability within a specific city. Currently, our recommendation is for researchers to utilize the GeoDetector tool (http://www.geodetector.cn/, accessed on 3 October 2023) to measure the degree of spatial stratified heterogeneity (SH) by different division strategies. This approach has already gained recognition among scholars from diverse fields as a quantitative foundation for partitioning decisions. Future research could expand the proposed model to other cities to further validate the findings of this study.

Supplementary Materials

The following supporting information can be downloaded at: https://www.mdpi.com/article/10.3390/land12101893/s1, Figure S1: DBSC clustering; Table S1: Spatial driving factors of land use change.

Author Contributions

J.Z. and J.Y. conceived and designed the experiments; M.Z. and J.N. performed the experiments and wrote the paper; Z.L. and Y.L. contributed to discussions and validation. All authors have read and agreed to the published version of the manuscript.

Funding

This research was funded by the National Natural Science Foundation of China (Grant No. 42101430), the Ministry of Education of Humanities and Social Science project (Grant No.22YJCZH130), the Foundation of Anhui Province Key Laboratory of Physical Geographic Environment (Grant No. 2022PGE006), the Natural Resource Science and Technology Plan Project supported by Natural Resources Department of Jiangsu Province (Grant No. 2023005), 2022 General Project of Philosophy and Social Science Research in Jiangsu Universities (2022SJYB0117), and the Foundation of Key Lab of Virtual Geographic Environment (Nanjing Normal University), Ministry of Education (Grant No. 2020VGE04, No. 2021VGE03).

Data Availability Statement

The data presented in this study can be obtained upon request from the corresponding author. Please be aware that the data are not publicly available, as they require approval from the Jiangyin Urban and Rural Planning and Design Institute.

Acknowledgments

The authors declare that they have no known competing financial interests or personal relationships that could have appeared to influence the work reported in this paper.

Conflicts of Interest

The authors declare no conflict of interest.

References

  1. Wang, H.; Guo, J.; Zhang, B.; Zeng, H. Simulating urban land growth by incorporating historical information into a cellular automata model. Landsc. Urban Plan. 2018, 214, 104168. [Google Scholar]
  2. Gao, C.; Feng, Y.; Tong, X.; Lei, Z.; Chen, S.; Zhai, S. Modeling urban growth using spatially heterogeneous cellular automata models: Comparison of spatial lag, spatial error and GWR. Comput. Environ. Urban Syst. 2020, 81, 101459. [Google Scholar]
  3. Li, X.; Liu, X. An extended cellular automaton using case-based reasoning for simulating urban development in a large complex region. Int. J. Geogr. Inf. Sci. 2006, 20, 1109–1136. [Google Scholar] [CrossRef]
  4. Liu, X.; Liang, X.; Li, X.; Xu, X.; Ou, J.; Chen, Y.; Li, S.; Wang, S.; Pei, F. A future land use simulation model (FLUS) for simulating multiple land use scenarios by coupling human and natural effects. Landsc. Urban Plan. 2017, 168, 94–116. [Google Scholar]
  5. Li, X.; Yeh, G. Neural-network-based cellular automata for simulating multiple land use changes using GIS. Int. J. Geogr. Inf. Sci. 2002, 16, 323–343. [Google Scholar] [CrossRef]
  6. Moreno, N.; Ménard, A.; Marceau, D.J. VecGCA: A vector-based geographic cellular automata model allowing geometric transformations of objects. Environ. Plan. B 2008, 35, 647–665. [Google Scholar] [CrossRef]
  7. Pinto, N.; Antunes, A.P.; Roca, J. Applicability and calibration of an irregular cellular automata model for land use change. Comput. Environ. Urban Syst. 2017, 65, 93–102. [Google Scholar]
  8. Yao, Y.; Liu, X.; Li, X.; Liu, P.; Hong, Y.; Zhang, Y.; Mai, K. Simulating urban land-use changes at a large scale by integrating dynamic land parcel subdivision and vector-based cellular automata. Int. J. Geogr. Inf. Sci. 2017, 31, 2452–2479. [Google Scholar]
  9. Zhu, J.; Sun, Y.; Song, S.; Yang, J.; Ding, H. Cellular automata for simulating land-use change with a constrained irregular space representation: A case study in Nanjing city, China. Environ. Plan. B 2020, 48, 1841–1859. [Google Scholar] [CrossRef]
  10. Guan, X.; Xing, W.; Li, J.; Wu, H. HGAT-VCA: Integrating high-order graph attention network with vector cellular automata for urban growth simulation. Comput. Environ. Urban Syst. 2023, 99, 101900. [Google Scholar]
  11. Shi, W.; Pang, M.Y.C. Development of voronoi-based cellular automata -an integrated dynamic model for geographical information systems. Int. J. Geogr. Inf. Sci. 2000, 14, 455–474. [Google Scholar] [CrossRef]
  12. Semboloni, F. The growth of an urban cluster into a dynamic self-modifying spatial pattern. Environ. Plan. B 2000, 27, 549–564. [Google Scholar] [CrossRef]
  13. Gonzále, P.; Gómez-Delgado, M.; Benavente, F. Vector-based cellular automata: Exploring new methods of urban growth simulation with cadastral parcels and graph theory. In Proceedings of the International Conference on Computer in Urban Planning and Urban Management (CUPUM), Cambridge, MA, USA, 7–10 July 2015. [Google Scholar]
  14. Dahal, K.; Chow, T. Characterization of neighborhood sensitivity of an irregular cellular automata model of urban growth. Int. J. Geogr. Inf. Sci. 2015, 29, 475–497. [Google Scholar] [CrossRef]
  15. Dahal, K.; Chow, T. A GIS toolset for automated partitioning of urban lands. Environ. Model. Softw. 2014, 55, 222–234. [Google Scholar] [CrossRef]
  16. Feng, Y.; Tong, X. Dynamic land use change simulation using cellular automata with spatially nonstationary transition rules. GISci. Remote Sens. 2018, 55, 678–698. [Google Scholar] [CrossRef]
  17. Zeng, H.; Zhang, B.; Wang, H. A hybrid modeling approach considering spatial heterogeneity and nonlinearity to discover the transition rules of urban cellular automata models. Environ. Plan. B 2023, 50, 1898–1915. [Google Scholar] [CrossRef]
  18. Gong, Z.; Thill, J.-C.; Liu, W. ART-P-MAP neural networks modeling of land-use change: Accounting for spatial heterogeneity and uncertainty. Geogr. Anal. 2015, 47, 376–409. [Google Scholar]
  19. Feng, Y.; Tong, X. Incorporation of spatial heterogeneity-weighted neighborhood into cellular automata for dynamic urban growth simulation. GISci. Remote Sens. 2019, 56, 1024–1045. [Google Scholar] [CrossRef]
  20. Zhang, B.; Hu, S.; Wang, H.; Zeng, H. A size-adaptive strategy to characterize spatially heterogeneous neighborhood effects in cellular automata simulation of urban growth. Landsc. Urban Plan. 2023, 229, 104604. [Google Scholar]
  21. Wu, H.; Li, Z.; Clarke, K.C.; Shi, W.; Fang, L.; Lin, A.; Zhou, J. Examining the sensitivity of spatial scale in cellular automata Markov chain simulation of land use change. Int. J. Geogr. Inf. Sci. 2019, 33, 1040–1061. [Google Scholar] [CrossRef]
  22. Ménard, A.; Marceau, D. Exploration of spatial scale sensitivity in geographic cellular automata. Environ. Plan. B 2005, 32, 693–714. [Google Scholar]
  23. Liao, J.; Tang, L.; Shao, G.; Su, X.; Chen, D.; Xu, T. Incorporation of extended neighborhood mechanisms and its impact on urban land-use cellular automata simulations. Environ. Model. Softw. 2016, 75, 163–175. [Google Scholar]
  24. Roodposhti, M.S.; Hewitt, R.J.; Bryan, B.A. Towards automatic calibration of neighbourhood influence in cellular automata land-use models. Comput. Environ. Urban Syst. 2020, 79, 101416. [Google Scholar]
  25. Ke, X.; Qi, L.; Zeng, C. A partitioned and asynchronous cellular automata model for urban growth simulation. Int. J. Geogr. Inf. Sci. 2016, 30, 637–659. [Google Scholar] [CrossRef]
  26. Qian, Y.; Xing, W.; Guan, X.; Yang, T.; Wu, H. Coupling cellular automata with area partitioning and spatiotemporal con-volution for dynamic land use change simulation. Sci. Total. Environ. 2020, 722, 137738. [Google Scholar]
  27. Xia, C.; Zhang, B. Exploring the effects of partitioned transition rules upon urban growth simulation in a megacity region: A comparative study of cellular automata-based models in the Greater Wuhan Area. GISci. Remote Sens. 2021, 58, 693–716. [Google Scholar]
  28. Lu, Y.; Laffan, S.; Pettit, C. A geographically partitioned cellular automata model for the expansion of residential areas. Trans. GIS 2022, 26, 1548–1571. [Google Scholar] [CrossRef]
  29. Yang, J.; Zhu, X.; Chen, W.; Sun, Y.; Zhu, J. Modeling land-use change using partitioned vector cellular automata while considering urban spatial structure. Environ. Plan. B 2023, 23998083231152887. [Google Scholar]
  30. Xu, Q.; Zhu, A.-X.; Liu, J. Land-use change modeling with cellular automata using land natural evolution unit. Catena 2023, 224, 106998. [Google Scholar]
  31. Kazemzadeh-Zow, A.; Zanganeh Shahraki, S.; Salvati, L.; Samani, N. A spatial zoning approach to calibrate and validate urban growth models. Int. J. Geogr. Sci. 2017, 31, 763–782. [Google Scholar] [CrossRef]
  32. Xu, Q.; Wang, Q.; Liu, J.; Liang, H. Simulation of Land-Use Changes Using the Partitioned ANN-CA Model and Considering the Influence of Land-Use Change Frequency. ISPRS Int. J. Geo-Inf. 2021, 10, 346. [Google Scholar]
  33. Ke, X.; Deng, X.; Liu, C. Interregional Farmland Layout Optimization Model Based on the Partition Asynchronous Cellular Automata: A Case Study of the Wuhan City Circle. Prog. Geogr. 2010, 29, 1442–1450, (In Chinese with English Abstract). [Google Scholar]
  34. Liu, Q.; Wu, Z.; Deng, M.; Liu, W.; Liu, Y. Network-constrained bivariate clustering method for detecting urban black holes and volcanoes. Int. J. Geogr. Inf. Sci. 2020, 34, 1903–1929. [Google Scholar]
  35. Zhu, J.; Sun, Y.; Chen, L.; Zhou, W.; Meng, Y. A spatial clustering method based on uneven distribution of non-spatial at-tributes—Identifying city commercial center. Geomat. Inf. Sci. Wuhan Univ. 2017, 42, 1697–1701, (In Chinese with English Abstract). [Google Scholar]
  36. Zhu, J.; Zheng, J.; Di, S.; Wang, S.; Yang, J. A dual spatial clustering method in the presence of heterogeneity and noise. Trans. GIS 2020, 24, 1799–1826. [Google Scholar]
  37. Yang, J.; Dong, J.; Sun, Y.; Zhu, J.; Huang, Y.; Yang, S. A constraint-based approach for identifying the urban–rural fringe of polycentric cities using multi-sourced data. Int. J. Geogr. Inf. Sci. 2021, 36, 114–136. [Google Scholar]
  38. Zhu, J.; Lang, Z.; Yang, J.; Wang, M.; Zheng, J.; Na, J. Integrating Spatial Heterogeneity to Identify the Urban Fringe Area Based on NPP/VIIRS Nighttime Light Data and Dual Spatial Clustering. Remote Sens. 2022, 14, 6126. [Google Scholar]
  39. Yao, Y.; Li, L.; Liang, Z.; Cheng, T.; Sun, Z.; Luo, P.; Ye, X. UrbanVCA: A vector-based cellular automata framework to simulate the urban land-use change at the land-parcel level. arXiv 2021, arXiv:2103.08538. [Google Scholar]
  40. Zhai, Y.; Yao, Y.; Guan, Q.; Liang, X.; Li, X.; Pan, Y.; Yue, H.; Yuan, Z.; Zhou, J. Simulating urban land use change by integrating a convolutional neural network with vector-based cellular automata. Int. J. Geogr. Inf. Sci. 2020, 34, 1475–1499. [Google Scholar]
  41. Pakhira, M.K.; Bandyopadhyay, S.; Maulik, U. Validity index for crisp and fuzzy clusters. Pattern Recognit. 2004, 37, 487–501. [Google Scholar]
  42. Pontius, R.; Boersma, W.; Castella, J.; Clarke, K.; de Nijs, T.; Dietzel, C.; Verburg, P. Comparing the input, output, and vali-dation maps for several models of land change. Ann. Reg. Sci. 2008, 42, 11–37. [Google Scholar] [CrossRef]
  43. Yin, H.; Kong, F.; Yang, X.; James, P.; Dronova, I. Exploring zoning scenario impacts upon urban growth simulations using a dynamic spatial model. Cities 2018, 81, 214–229. [Google Scholar]
  44. Tong, X.; Feng, Y. A Review of Assessment Methods for Cellular Automata Models of Land-Use Change and Urban Growth. Int. J. Geogr. Inf. Sci. 2020, 34, 866–898. [Google Scholar]
  45. Peethambaran, J.; Muthuganapathy, R. A non-parametric approach to shape reconstruction from planar point sets through Delaunay filtering. Comput.-Aided Des. 2015, 62, 164–175. [Google Scholar]
  46. Wang, J.-F.; Zhang, T.-L.; Fu, B.-J. A measure of spatial stratified heterogeneity. Ecol. Indic. 2016, 67, 250–256. [Google Scholar]
  47. Zhang, B.; Wang, H. Exploring the advantages of the maximum entropy model in calibrating cellular automata for urban growth simulation: A comparative study of four methods. GISci. Remote Sens. 2022, 59, 71–95. [Google Scholar]
  48. Zhang, Y.; Liu, X.; Chen, G.; Hu, G. Simulation of urban expansion based on cellular automata and maximum entropy model. Sci. China Earth Sci. 2020, 63, 701–712. [Google Scholar]
  49. Lin, C.-R.; Liu, K.-H.; Chen, M.-S. Dual clustering: Integrating data clustering over optimization and constraint domains. IEEE Trans. Knowl. Data Eng. 2005, 17, 628–637. [Google Scholar]
  50. Liu, Q.L.; Deng, M.; Shi, Y.; Wang, J.Q. A density-based spatial clustering algorithm considering both spatial proximity and attribute similarity. Comput. Geosci. 2012, 46, 296–309. [Google Scholar] [CrossRef]
  51. Liu, Y.; Wang, X.; Liu, D.; Liu, L. An adaptive dual clustering algorithm based on hierarchical structure: A case study of settlement zoning. Trans. GIS 2017, 21, 916–933. [Google Scholar]
  52. Guo, R.; Chen, D.; Fan, J. Territory spatial planning system and the convergence between different levels. Geogr. Res. 2019, 38, 2518–2526, (In Chinese with English Abstract). [Google Scholar]
Figure 1. Location of the study area.
Land 12 01893 g001
Figure 2. Maps of driving factors in this study.
Land 12 01893 g002
Figure 3. Flowchart of the partitioned VCA model for simulating urban land-use changes.
Land 12 01893 g003
Figure 4. The UrbanVCA framework.
Land 12 01893 g004
Figure 5. The area partitioning by DSC: (a) DT of land parcel centroids; (b) spatial proximity construction by DSC; (c) attribute similarity clustering by DSC; (d) 17 sub-regions.
Land 12 01893 g005
Figure 6. SH in three area partitioning strategies, ***: p < 0.01.
Land 12 01893 g006
Figure 7. The FoM of different neighborhood radii (unit: meters) via RF model.
Land 12 01893 g007
Figure 8. The FoM of different sub-regions and whole study area by proposed model.
Land 12 01893 g008
Figure 9. The simulation results of different sub-regions by the proposed framework.
Land 12 01893 g009
Figure 10. Landscape indices of the simulated results via the proposed model in the study area.
Land 12 01893 g010
Figure 11. Comparison of the simulated results by the DSC-based vs. administrative-based zoning.
Land 12 01893 g011
Figure 12. Details of actual and simulated (DSC-based and administrative-based zoning) land-use changes.
Land 12 01893 g012
Figure 13. The area partitioning result by Mk-means.
Land 12 01893 g013
Figure 14. Comparison of the simulated results by the DSC-based vs. Mk-means-based zoning.
Land 12 01893 g014
Figure 15. Details of actual and simulated (DSC-based and Mk-means-based zoning) land-use change.
Land 12 01893 g015
Table 1. The FoM of different sub-regions and whole study area by administrative-based zoning.
Comparison MethodSub-RegionFoM
Administrative-based zoningChengdong0.192221
Chengxi0.239187
Chengnan0.215116
Chengdongnan0.192636
Central0.256496
Jiangyin0.221000
Disclaimer/Publisher’s Note: The statements, opinions and data contained in all publications are solely those of the individual author(s) and contributor(s) and not of MDPI and/or the editor(s). MDPI and/or the editor(s) disclaim responsibility for any injury to people or property resulting from any ideas, methods, instructions or products referred to in the content.

