Article

Integration of GIS and Remote Sensing with RUSLE Model for Estimation of Soil Erosion

1
Symbiosis Institute of Geo-Informatics, Symbiosis International (Deemed University), Pune 411016, Maharashtra, India
2
Environmental Modeling Division, Max Planck Institute for Meteorology, Bundesstrasse 53, 20146 Hamburg, Germany
3
Department of Geography, Bhatter College, Dantan (Vidyasagar University), Paschim Medinipur 721426, West Bengal, India
4
Indian Institute of Tropical Meteorology, Pune 411008, Maharashtra, India
5
Prince Sultan Bin Abdulaziz International Prize for Water Chair, Prince Sultan Institute for Environmental, Water and Desert Research, King Saud University, Riyadh 11451, Saudi Arabia
6
Department of Agricultural Engineering, College of Food and Agriculture Sciences, King Saud University, Riyadh 11451, Saudi Arabia
7
Centre for Carbon, Water and Food, The University of Sydney, Camperdown, NSW 2570, Australia
8
Agricultural Engineering Research Institute (AEnRI), Agricultural Research Centre, Giza 12618, Egypt
*
Authors to whom correspondence should be addressed.
Land 2023, 12(1), 116; https://doi.org/10.3390/land12010116
Submission received: 22 November 2022 / Revised: 23 December 2022 / Accepted: 24 December 2022 / Published: 30 December 2022

Abstract

:
Globally, soil erosion is a significant problem contributing to nutrient loss, water quality degradation, and sand accumulation in water bodies. Currently, various climate factors are affecting the natural resources entire worldwide. Agricultural intensification, soil degradation, and some other human impacts all contribute to soil erosion, which is a significant issue. Management and conservation efforts in a watershed can benefit from a soil erosion study. Modeling can establish a scientific and accurate method to calculate sediment output and soil erosion below a variety of circumstances. The measured soil loss tolerance was compared to the risk of soil erosion (T value).In this study, GIS and remote sensing techniques have been integrated with the Revised Universal Soil Loss Equation (RUSLE) model to estimate soil loss in the Mayurakshi river basin of eastern India. To determine soil erosion-prone areas, rainfall, land use, and land cover maps, as well as a digital elevation model (DEM), were used as input. The annual soil loss in the basin area is estimated to be 4,629,714.8 tons. Accordingly, the study basin was categorized into five soil loss severity classes: very low (40.92%), low (49%), moderate (6.5%), high (2.4%) and very high (1.18%) risk classes. Soil erosion rates ranged from very slight to slight throughout the majority of the region. The section of the basin’s lower plain has been discovered to be least affected by soil loss. The results of study area can be helpful to conservation of soil management practices and watershed development program in the basin area.

1. Introduction

Soil erosion is a serious problem; however, developing countries are more susceptible to this problem because of the failure of their farmers to restore lost soil and nutrients [1,2]. The intensity of agriculture, land erosion and other ethnographic activities contribute to the erosion of soil [3]. Approximately 5334 million tons (1653 tons/sq km) of soil is detached annually due to agricultural and associated activities alone in India [4]. Soil erosion assessment in a reservoir or a basin can assist in conservation and planning with severe erosion [5]. Soil erosion is a global concern as it involves depleting nutrient-rich surface soil, greater flow through permeable subsurface and reduced water availability for the plants. Overall it affects the sustainable development goal and ecosystem services [6]. The Revised Universal Soil Loss Equation (RUSLE) model’s analysis of the soil erosion found in the study by Medhioub et al. [7] demonstrates how soil loss has a negative impact on crop productivity. Baskan et al. [8] incorporated the geostatistical techniques in soil erosion with a semi variogram expressing the spatial dependence between the neighboring observations. According to Khan et al. [9], significant amounts of soil erosion are caused by rills and gullies in the Yamuna River.
The study by Pal and Shit [10] applied this model to analyze the soil loss in the Jaipanda watershed in Bankura district of West Bengal and found the upper part of the basin area has higher soil loss due to exposed soil surface with the presence of large patches of open scrub and agricultural fallow, due to low soil erosion in the forest cover area. Ghosh and Maiti [11] studied the ecological susceptibility index to assess the morphological setup, ecology, bio-diversity, and linkages with the anthropogenetic factor in the Mayurakshi river. The hydrologic investigation has had been done for the drinking water supply in the lower plain of the Mayurakshi river in the Birbhum district of West Bengal [12]. The integrated remote sensing and GIS can incorporate a large volume of information from multidisciplinary data sources for the development and integrated water resource development plan in the Mayurakshi river basin [13]. Soil erosion is also the most severe problem in the country, with changing economic implications and food security [14]. The biophysical environment, including climatic conditions, soil particles, ground cover, and their interaction, is affected by soil erosion [15,16]. The slope length and the shape of the terrain significantly impact the runoff process. The areas with heavy rainfall and high elevation are susceptible to soil erosion [17]. Estimating soil loss and implementing optimal management practices is essential to the effectiveness of soil conservation planning. Assessing soil erosion risk using traditional approaches is costly and time-consuming [3]. GIS to integrate existing soil erosion models, remote sensing data, and field data looks to be an advantage for future studies [18]. Soil erosion is an obstacle in the path of sustainable development and needs attention for better management through proper planning [19].
Remote sensing and GIS technology associated with the soil erosion model can guide decisions for preventing and controlling soil erosion in the region [20,21].
Agriculture output is impacted by the world-wide issue of soil deterioration brought about by erosion. According to [22,23], erosion has a detrimental impact on the ecosystem by reducing plant water availability, generating nutrient losses, and increasing runoff. Approximately 0.90–0.95 mm of soil are lost from the ground surface annually due to soil erosion, which is estimated to be between 12 and 15 t ha per year globally [23]. As a result, interest in preserving and restoring soil resources has grown globally [24,25].
Soil erosion brings about a number of critical issues, including environmental degradation, socioeconomic issues, crop yield production, and food security issues, which intensify the effects of climate crisis, conflict, and mass migration [26,27,28]. There are many variables that contribute to soil loss, including rainfall, runoff, soil features, terrain, plantations, and soil cover [29]. Globally, crop productivity is reduced by 15–30% as a result of soil erosion from cultivated agriculture land ranging from 22 to 100 tons/ha/year [30].
There are several models applied for spatiotemporal predictions of soil loss severity mapping, including universal soil loss equation (USLE), modified universal soil loss equation (MUSLE), water erosion prediction project (WEPP), revised universal soil loss equation (RUSLE), and the erosion productivity impact calculator (EPIC). RUSLE is the most widely used model because it can calculate soil loss on an annual basis and is compatible with ArcGIS environment and satellite data [31,32].
The geospatial technology can incorporate a large volume of information from multidisciplinary data sources for the development and integrated water resource development plan in the Mayurakshi River basin [13]. The study’s main objective is to find out the soil loss of the basin area with the RUSLE model using GIS techniques. The soil loss equation’s subparts aim to include the topographic influence, rainfall erosivity, soil erodibility, cover management, etc. The proper management of the basin area can be done by minimizing the potential soil loss. This study is aimed to estimate the annual soil loss in the Mayurakshi River basin with a GIS-based RUSLE model.

2. Material and Methods
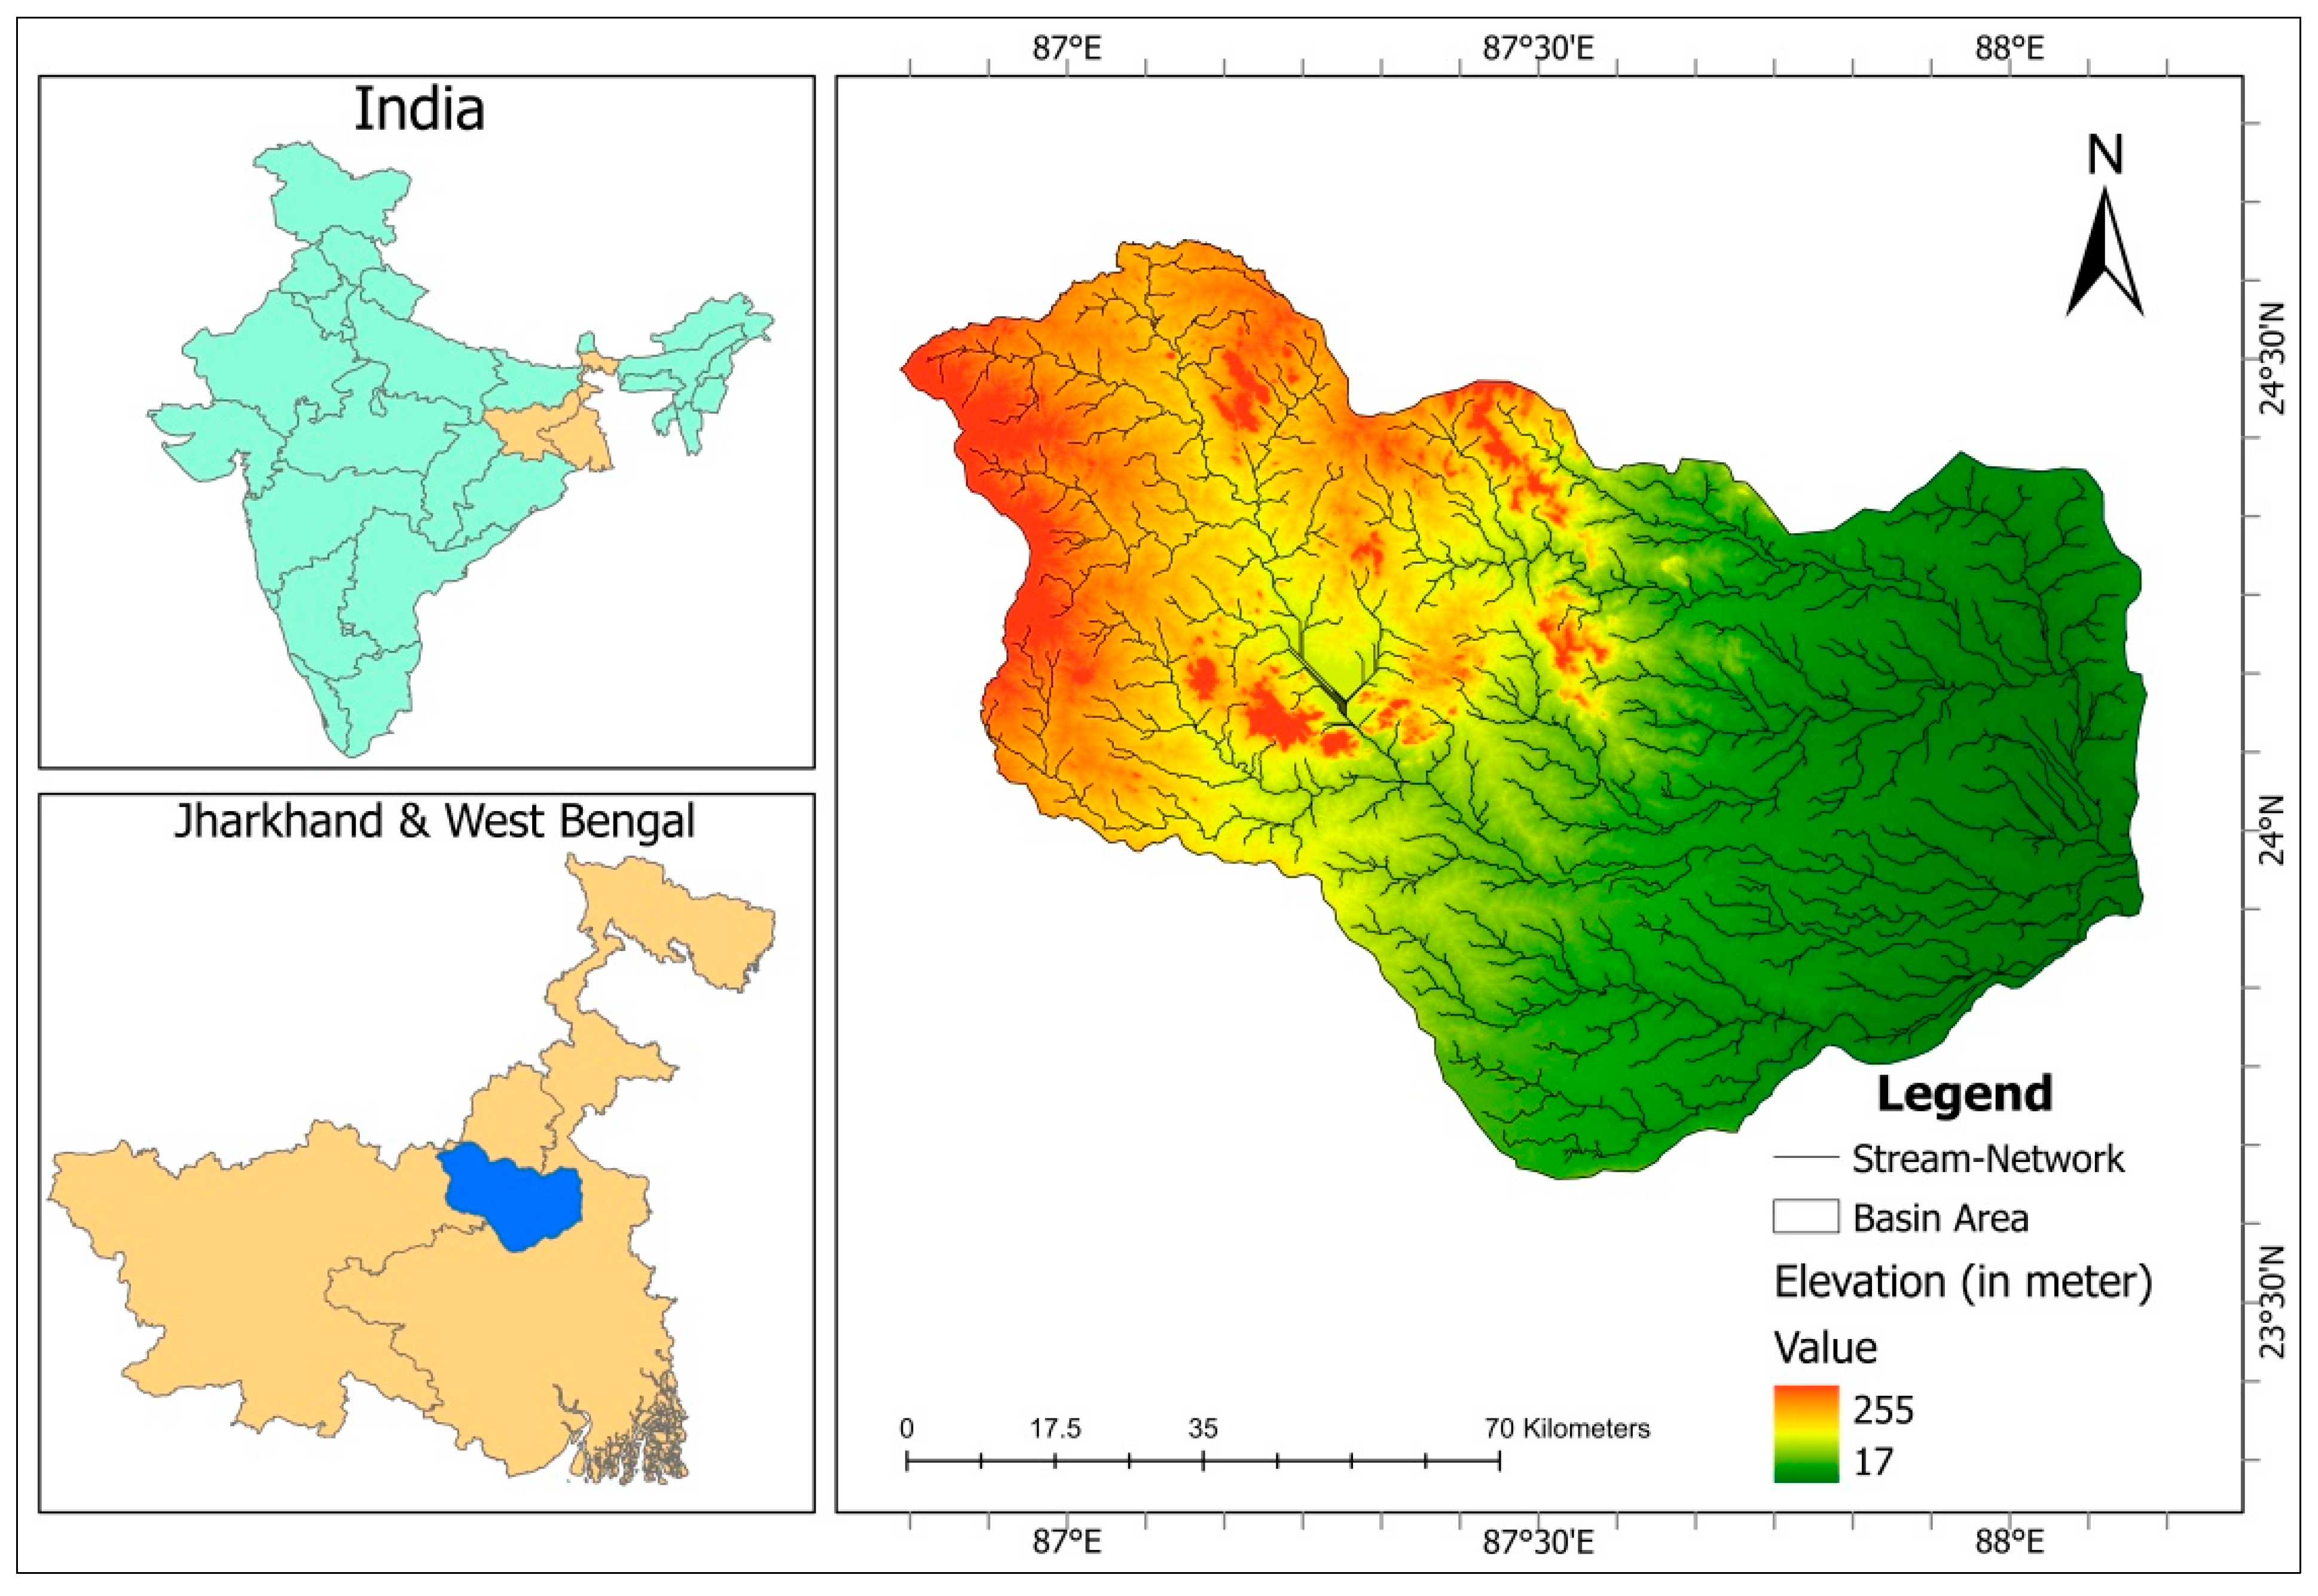
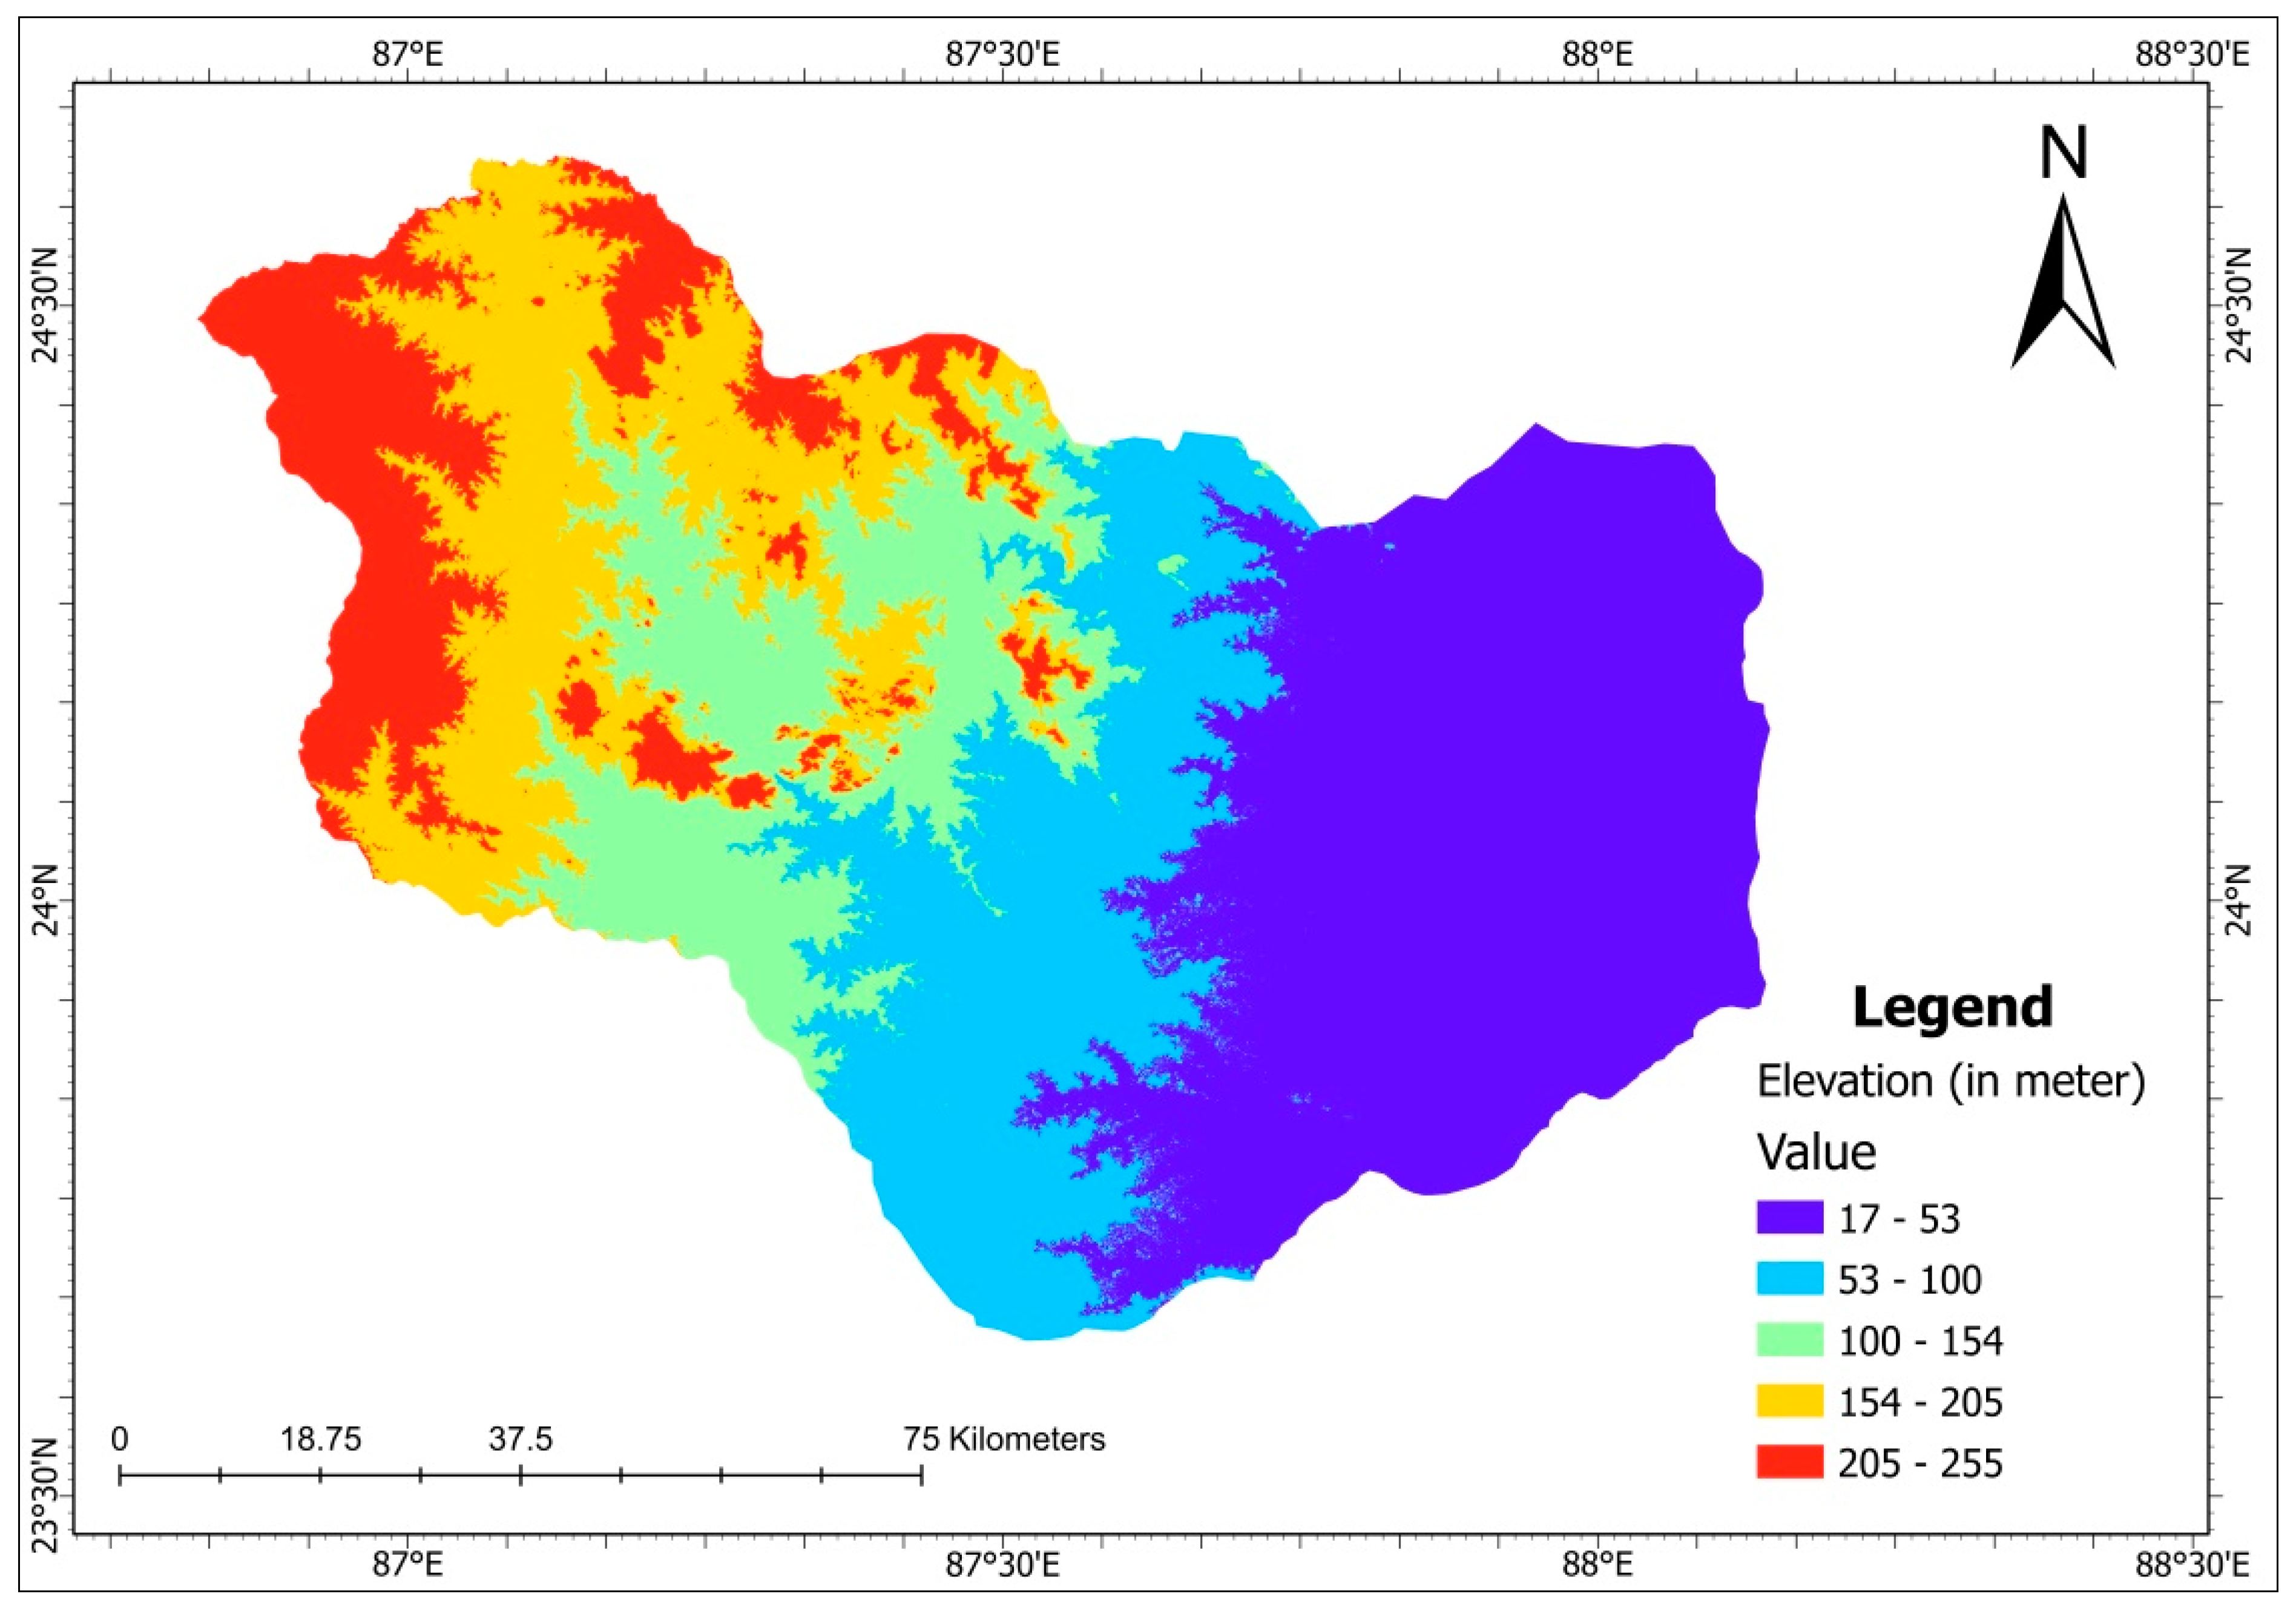
2.1. Study Area

The spatial extent of the Mayurakshi river basin extends from 23°37′43″ N–23°37′36″ N latitude to 86°50′16″ E–88°15′52″ E longitude covering a geographical area of 8596.4 sq km (Figure 1). Mayurakshi river basin is located in Jharkhand and the West Bengal state of India. Eventually, it merges with the Hooghly River in West Bengal after flowing through Jharkhand and Birbhum. The Mayurakshi River has four tributaries: Brahmani, Dwaraka, Bakreshwar, and Kopai. The floods in the Mayurakshi main river and its tributaries are frequent. The Massanjore dam in the middle of the river basin affects the river’s hydrological, sedimentological, and geomorphological conditions [21]. The research area’s annual average runoff volume is 51.77 mm, while the monsoon runoff volume is 507.68 mm. It has been noticed that pre-monsoon and monsoon water volume with suspended load and deposition within channel cause morphological change in the downstream. During the Pleistocene age, the area was composed of old sediments and fine clays from the Rajmahal trap, and through the Holocene era, there are pockets of alluvium.

2.2. Data Sources

The data for estimating soil loss with the RUSLE model has been collected from different sources (Table 1). The SRTM Digital Elevation (DEM) data has been collected from the USGS portal to extract the basin area and estimate the topographic influence of soil loss [28,29,30,31,32]. The satellite image of the IRS LISS III sensor is collected from the Bhuvan portal to show the land cover management. The Food and Agriculture Organization of the United Nations (FAO) created a digital soil map of the world from which data on soil erodibility is derived. The gridded rainfall data is obtained from the Indian Meteorological Department and spatially interpolated into grid points for the purpose of analyzing rainfall erosivity. As a result, the RUSLE model was chosen and used in the study area since it demands for a map of the land’s usage and cover, which can be created using remote sensing data, control strategies, and soil characteristics and qualities. Another benefit of choosing RUSLE is that it is simple to combine its parameters with GIS to improve analysis. The major objective of the current work is to combine the RUSLE model with the references of remote sensing and GIS approaches to evaluate the risk of erosion in the area. The technique explains the basic concepts, how to calculate the parameters of the RUSLE model, and how to estimate the parameters of the RUSLE model. Based on rainfall events, DEM, and soil type etc., the RUSLE model’s parameters have been estimated.

2.3. Extraction of the Basin Area

The extraction of the basin area was done from digital elevation using steps, such as fill the DEM, flow direction, flow accumulation, and basin preparation [20,21,22]. The elevation map shows the higher altitude above 200 m is present in the upper stream, and the lower altitude below 20 m is situated in the lower stream area at the confluence of the Mayurakshi and Bhagirathi Rivers (Figure 2). The flow direction shows the river channels are flowing from many orders from the upper to middle stream areas. A dam called Masanjor is visible in the middle region of the flow direction map. The large channels have the highest accumulation, according to the flow accumulation map.

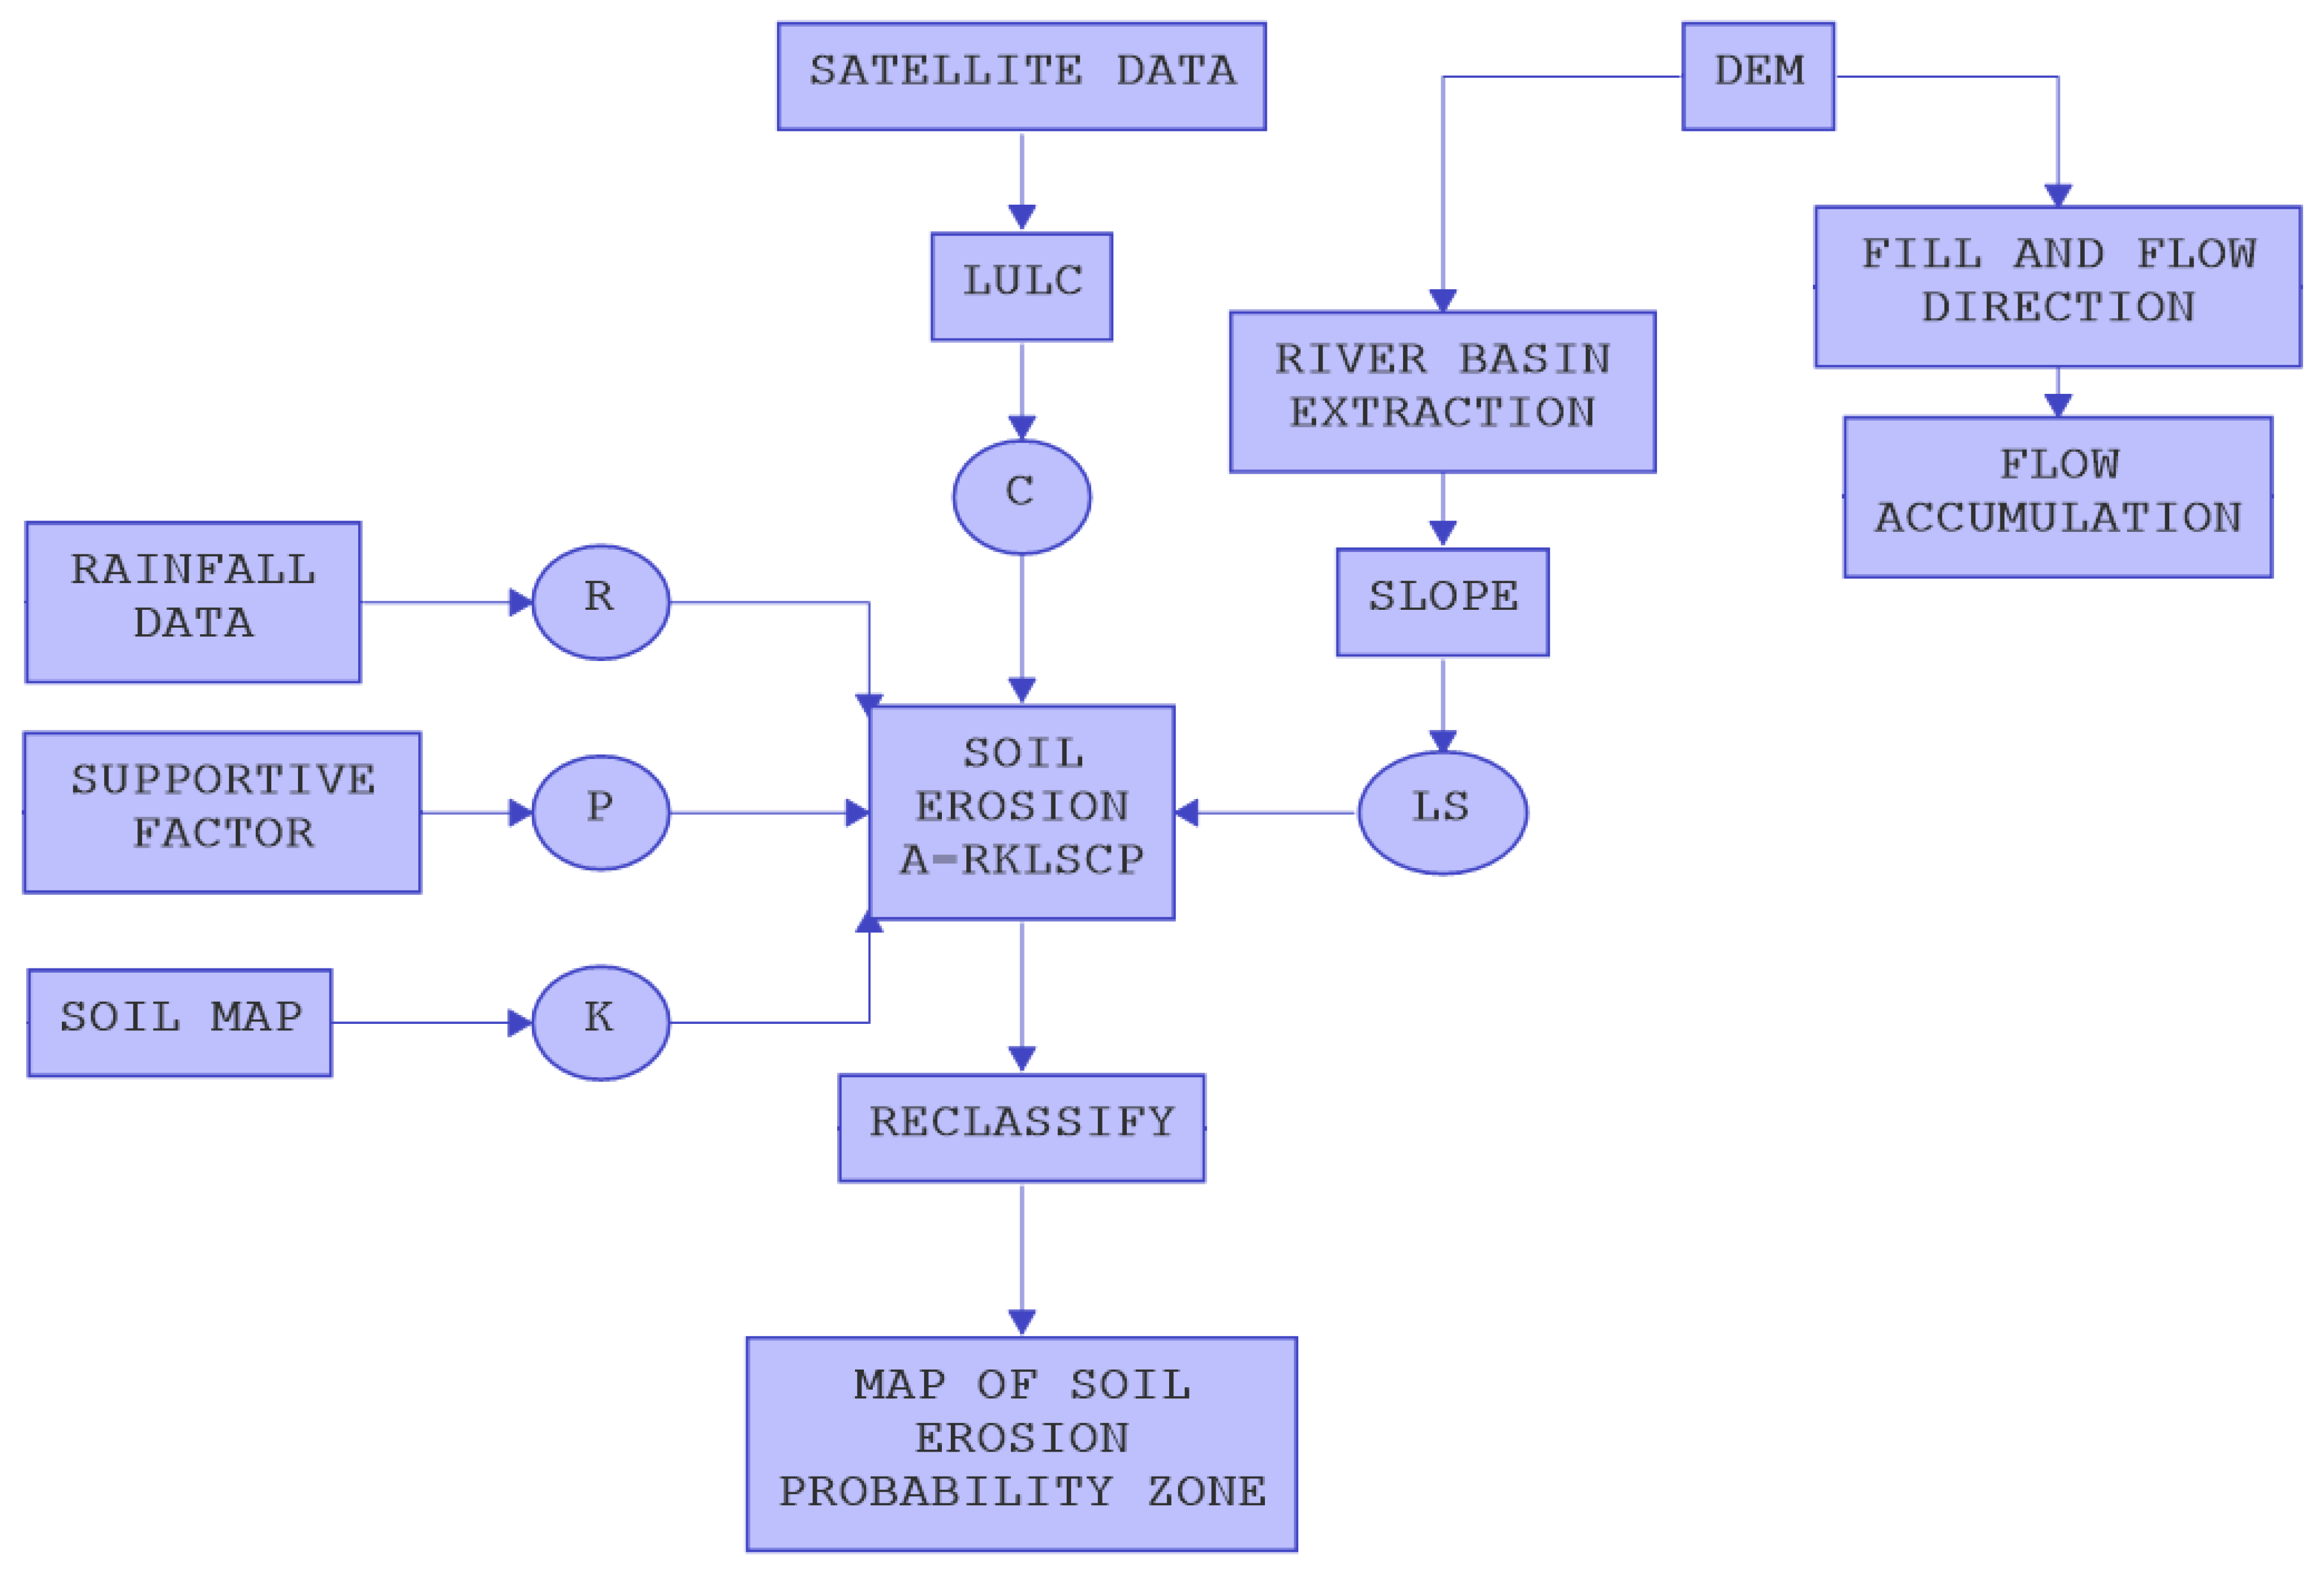
2.4. Parameters of Soil Loss

To determine the spatial distribution of soil erosion in the study area, the GIS environment has been used to apply the Revised Universal Soil Loss-RUSLE [21] model. The average annual erosion (A) is estimated from the RUSLE model derived from the factors, such as R, K, LS, C, and P. These factors include soil erodibility, length of slope, steepness of slope, LULC cover management, and support practice factors. In RUSLE, the soil erosion is calculated as follows:
A = R × K × LS × C × P
where A is the average soil erosion per unit area, R is rainfall-runoff erosivity factor, K is soil erodibility factor, L is slope length factor, S is slope steepness factor, C is stands for cover and management practice factor, and P is support practice factor.
The methodology adopted for the present study is shown in the flowchart (Figure 3).

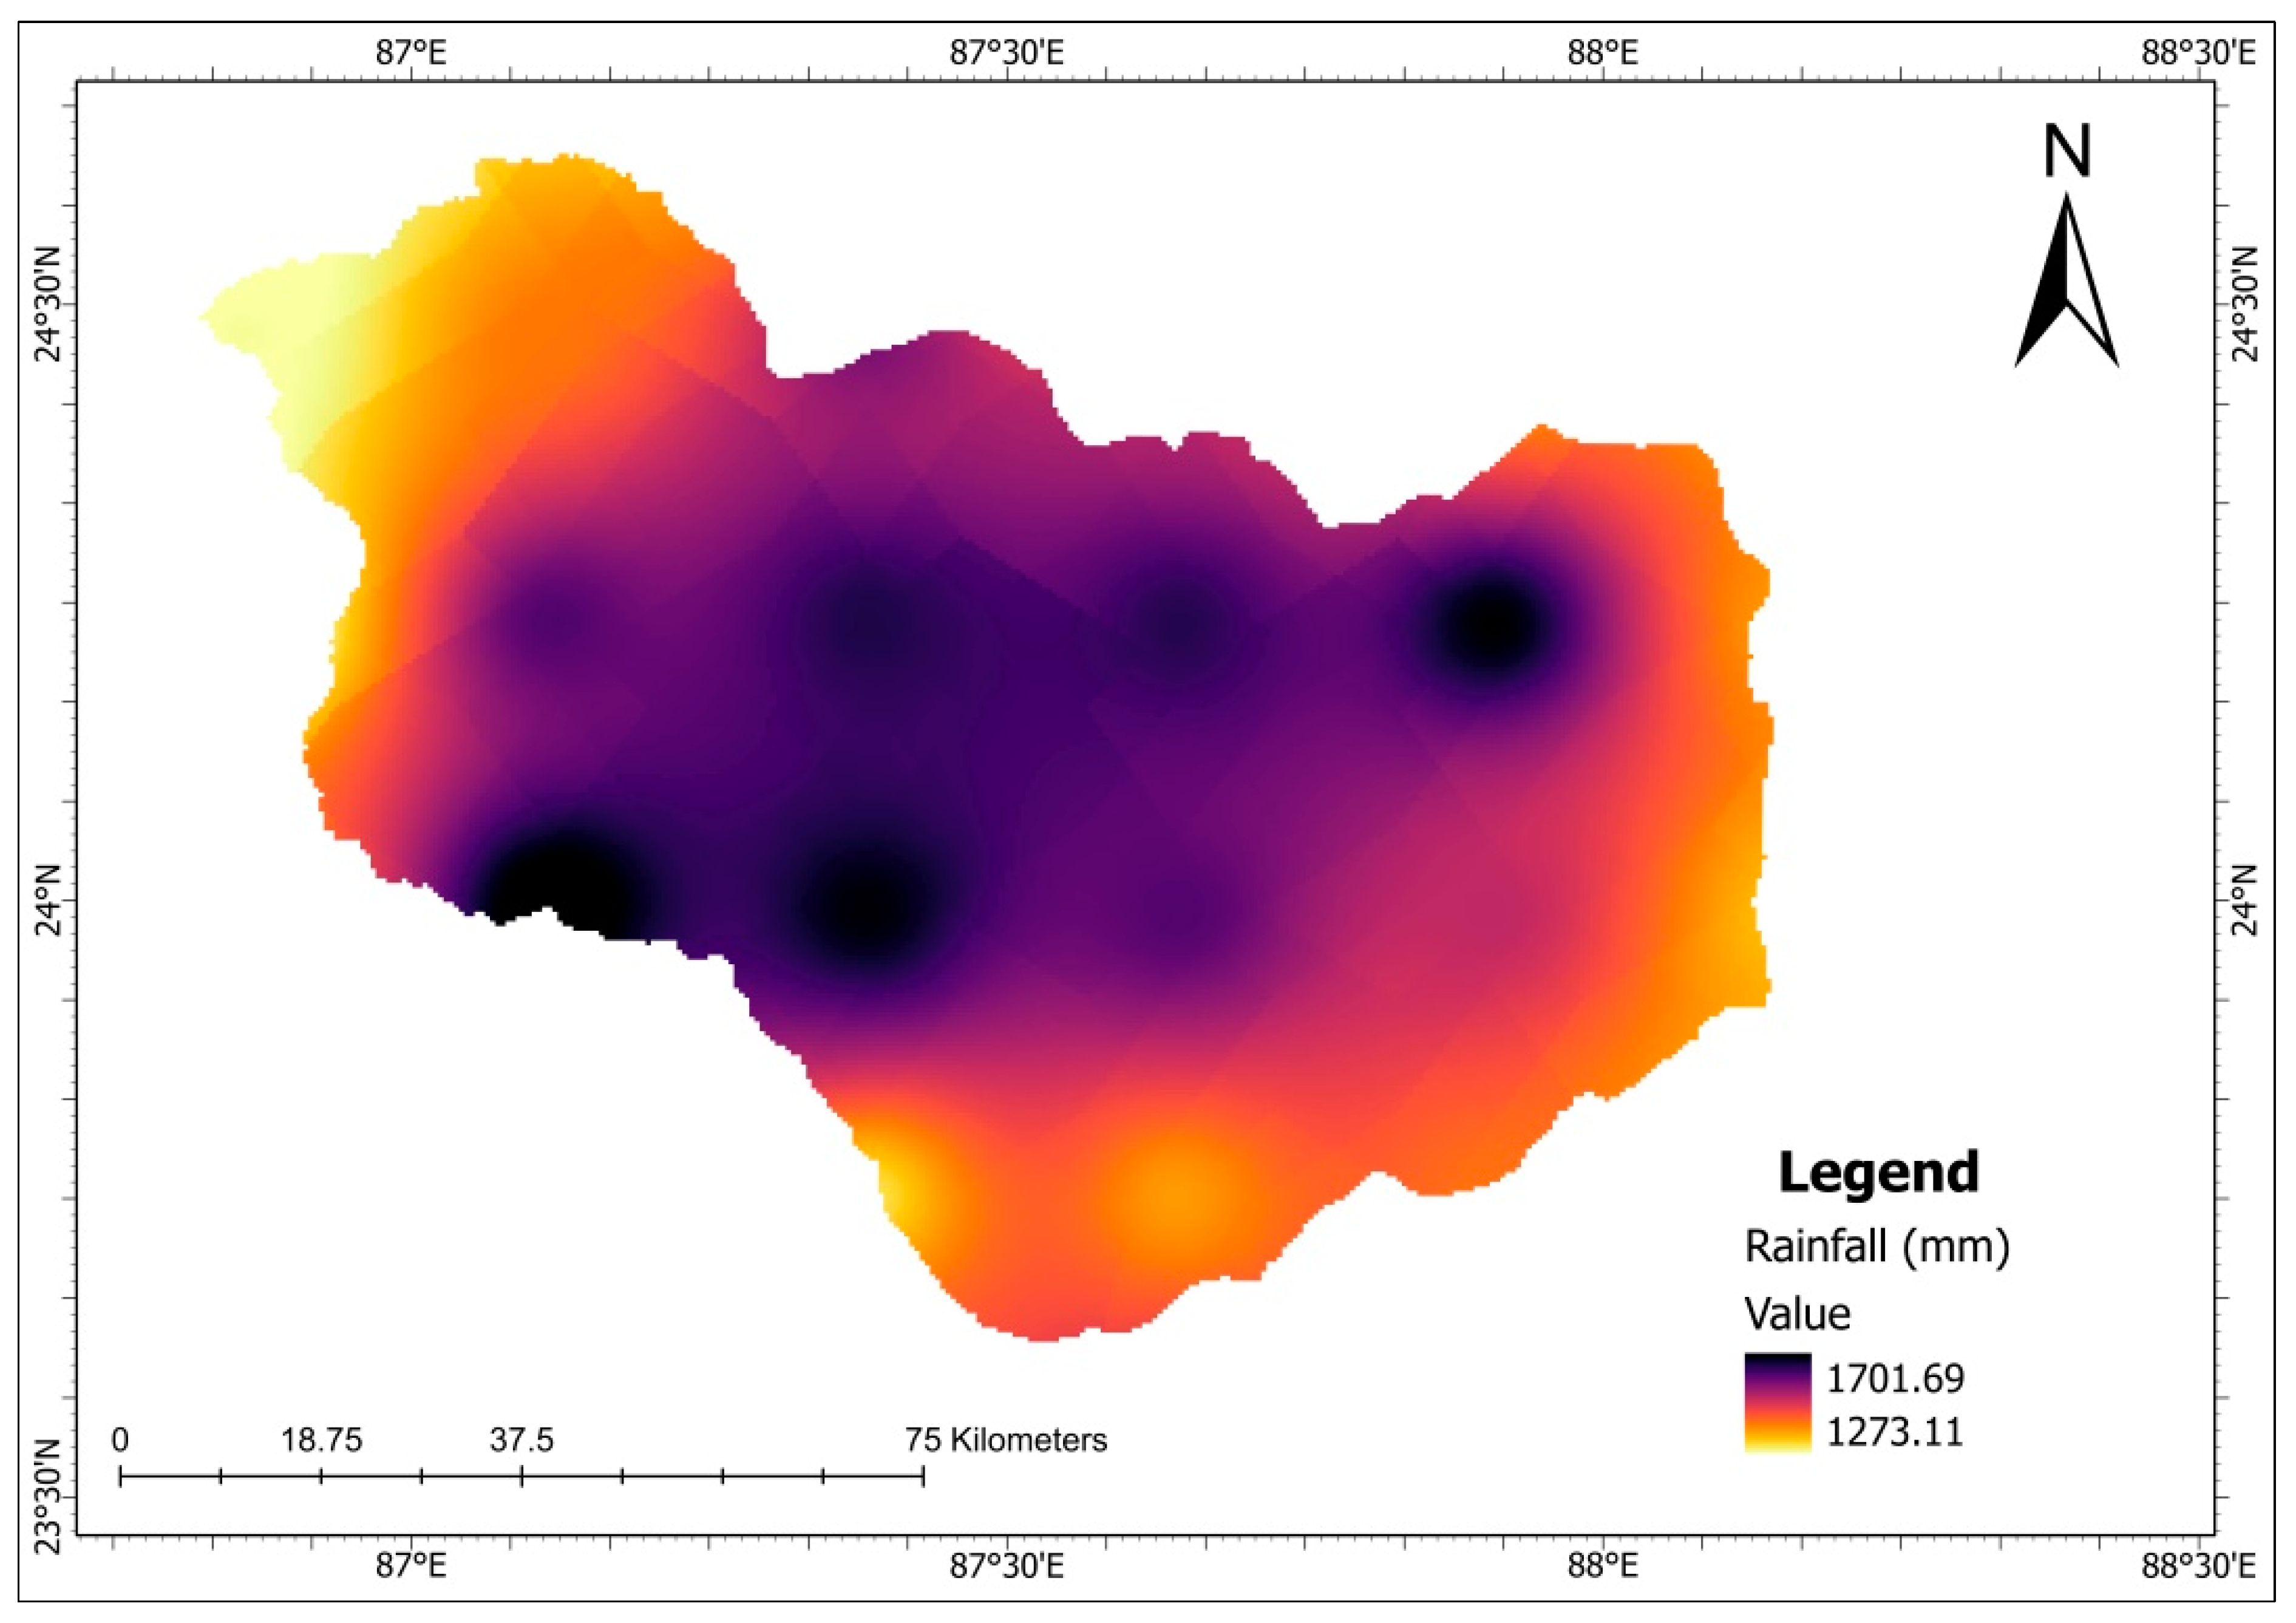
2.5. Rainfall Erosivity Factor (R)

The rainfall erosivity factor (R) defines rainfall intensity and occurs through different rainfall conditions leading to erosion. The R factor has been calculated from the data distributed across the basin area. The previous studies show that soil loss from an agriculture field is proportional to rainfall intensity and precipitation energy. Rainfall significantly influenced soil erosion as many studies have established the direct relationship between rainfall and soil erosion. The R factor quantifies the impact of runoff rate and the number of raindrops associated with the rainfall. The IMD portal’s freely available gridded rainfall data is used to create the rainfall map. For the Mayurakshi river basin, the rainfall map is produced using the inverse distance weighted (IDW) interpolation technique. The R factor is calculated using the equation shown below, as shown.
R a = 81.5 + 0.380   P a
where Ra is Average erosion index, P is Average rainfall (mm), and Subscript a stands for annual.

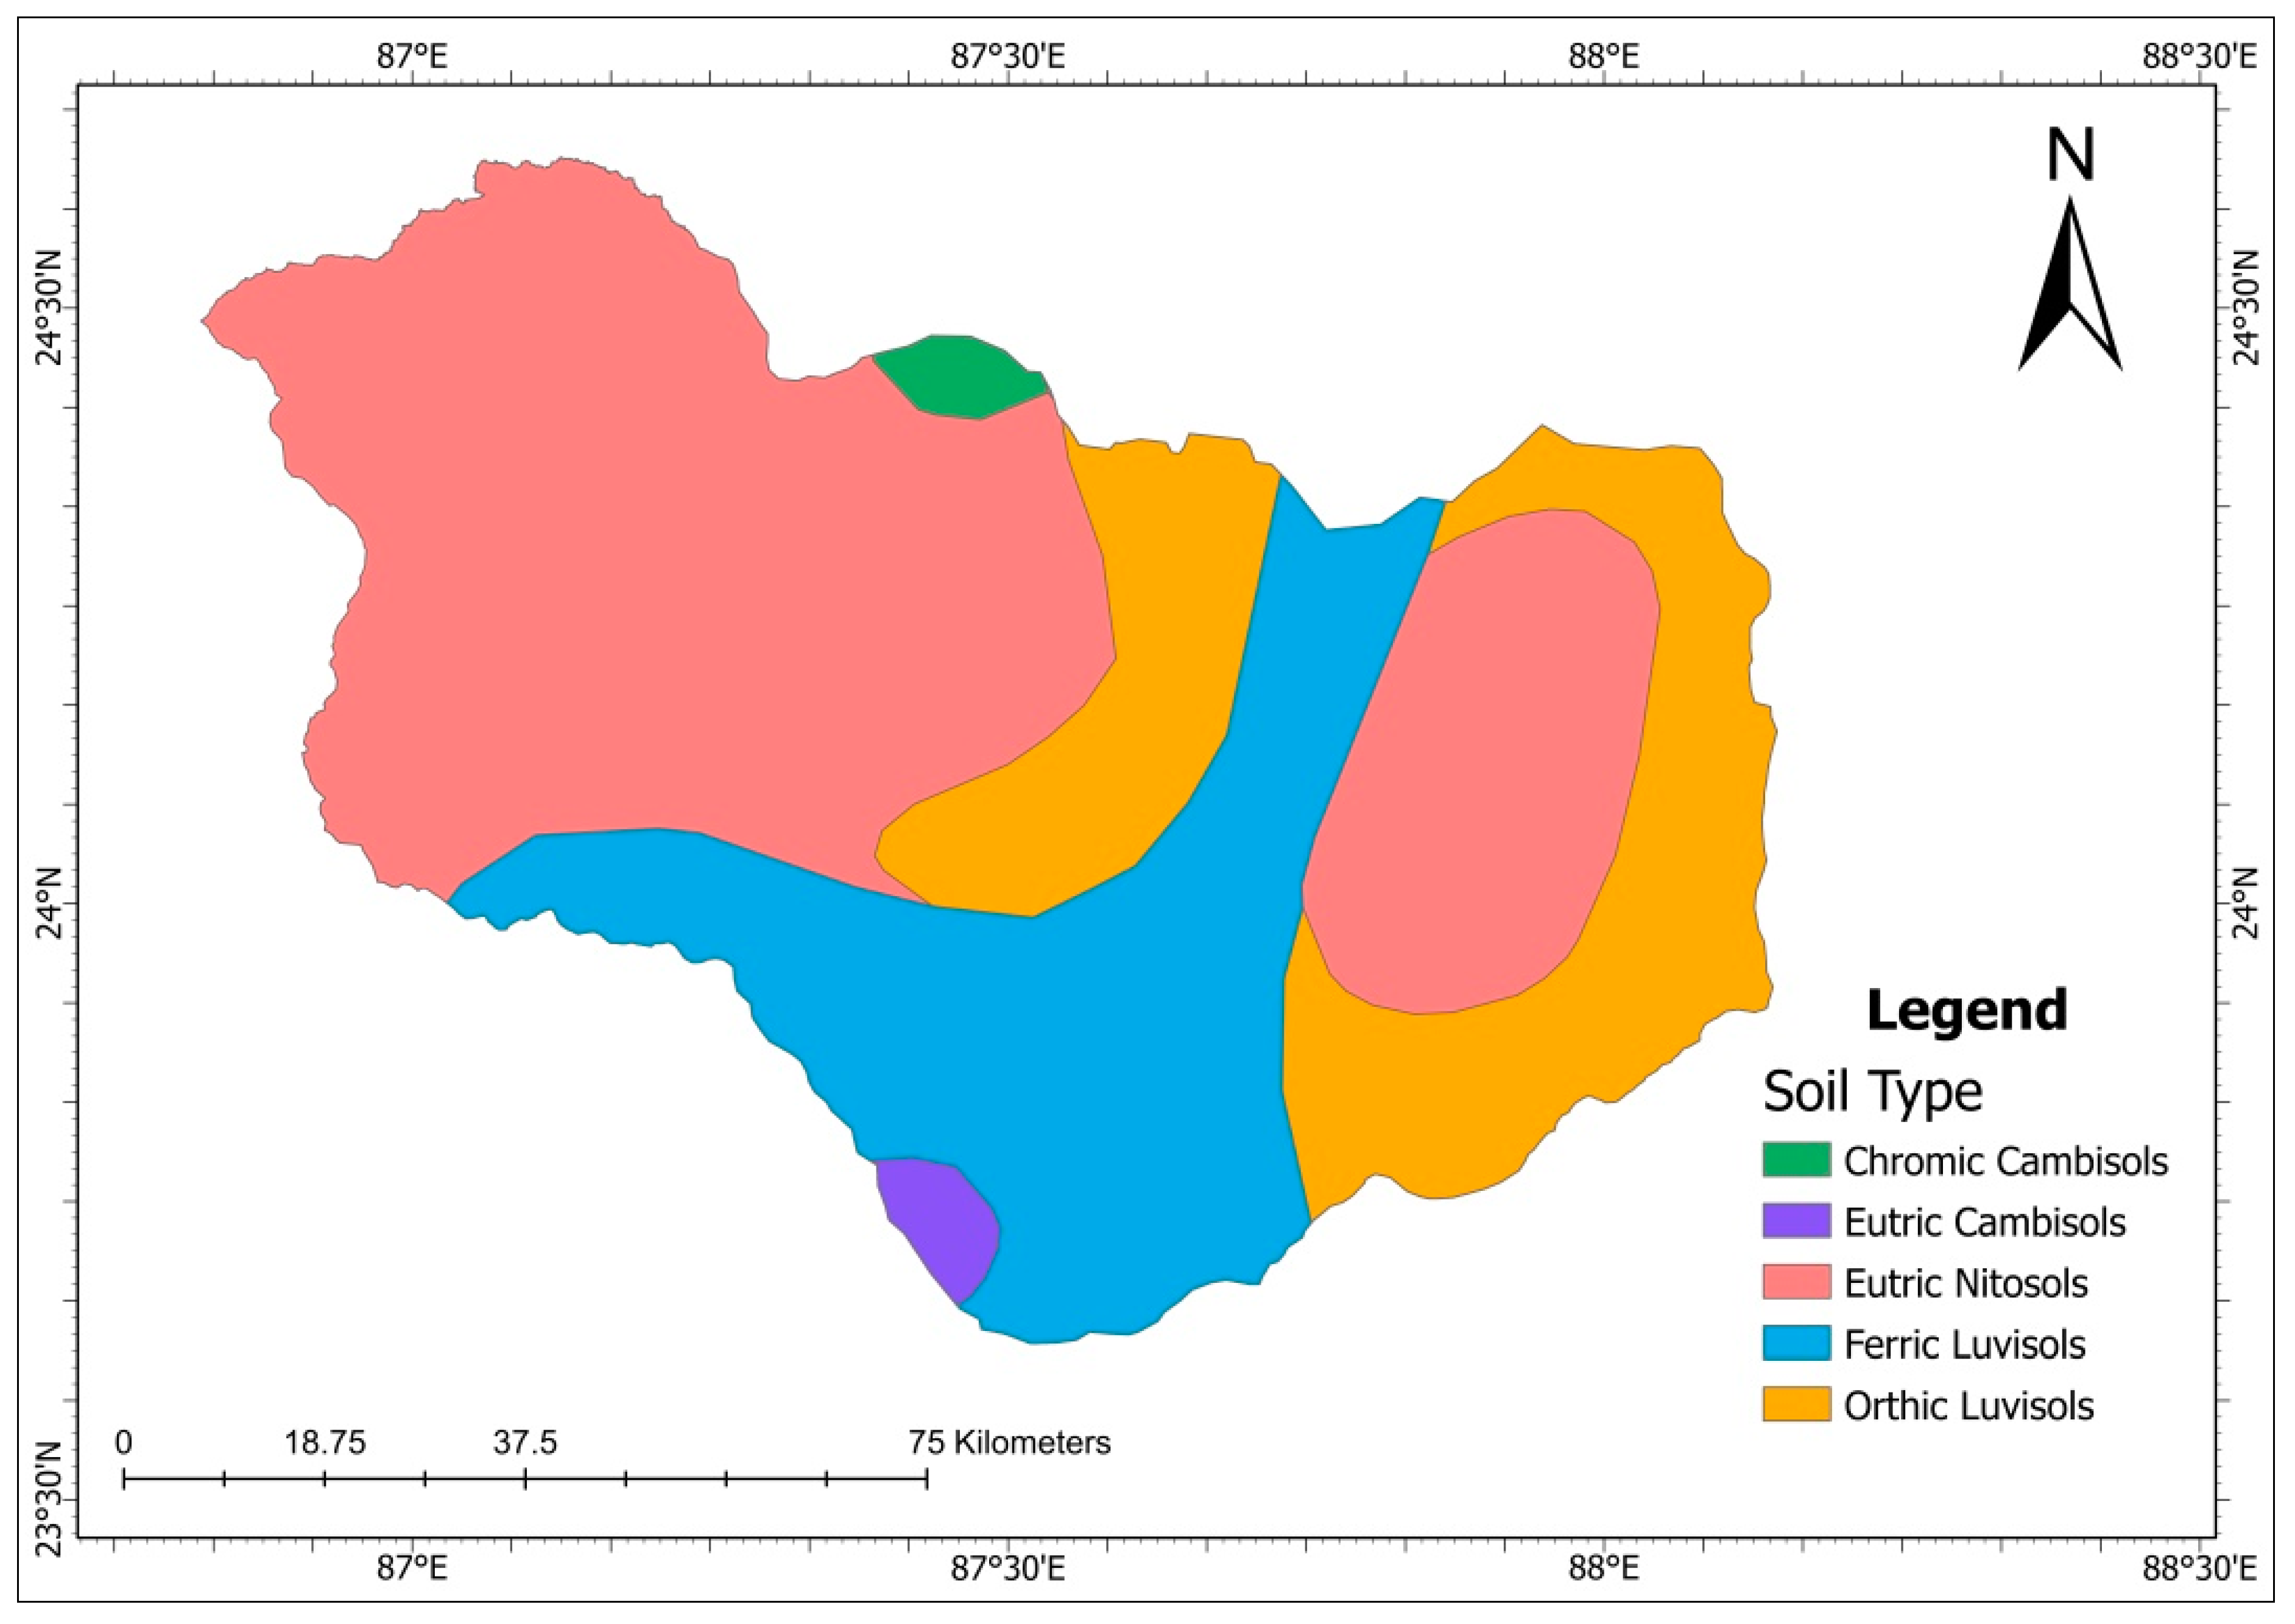
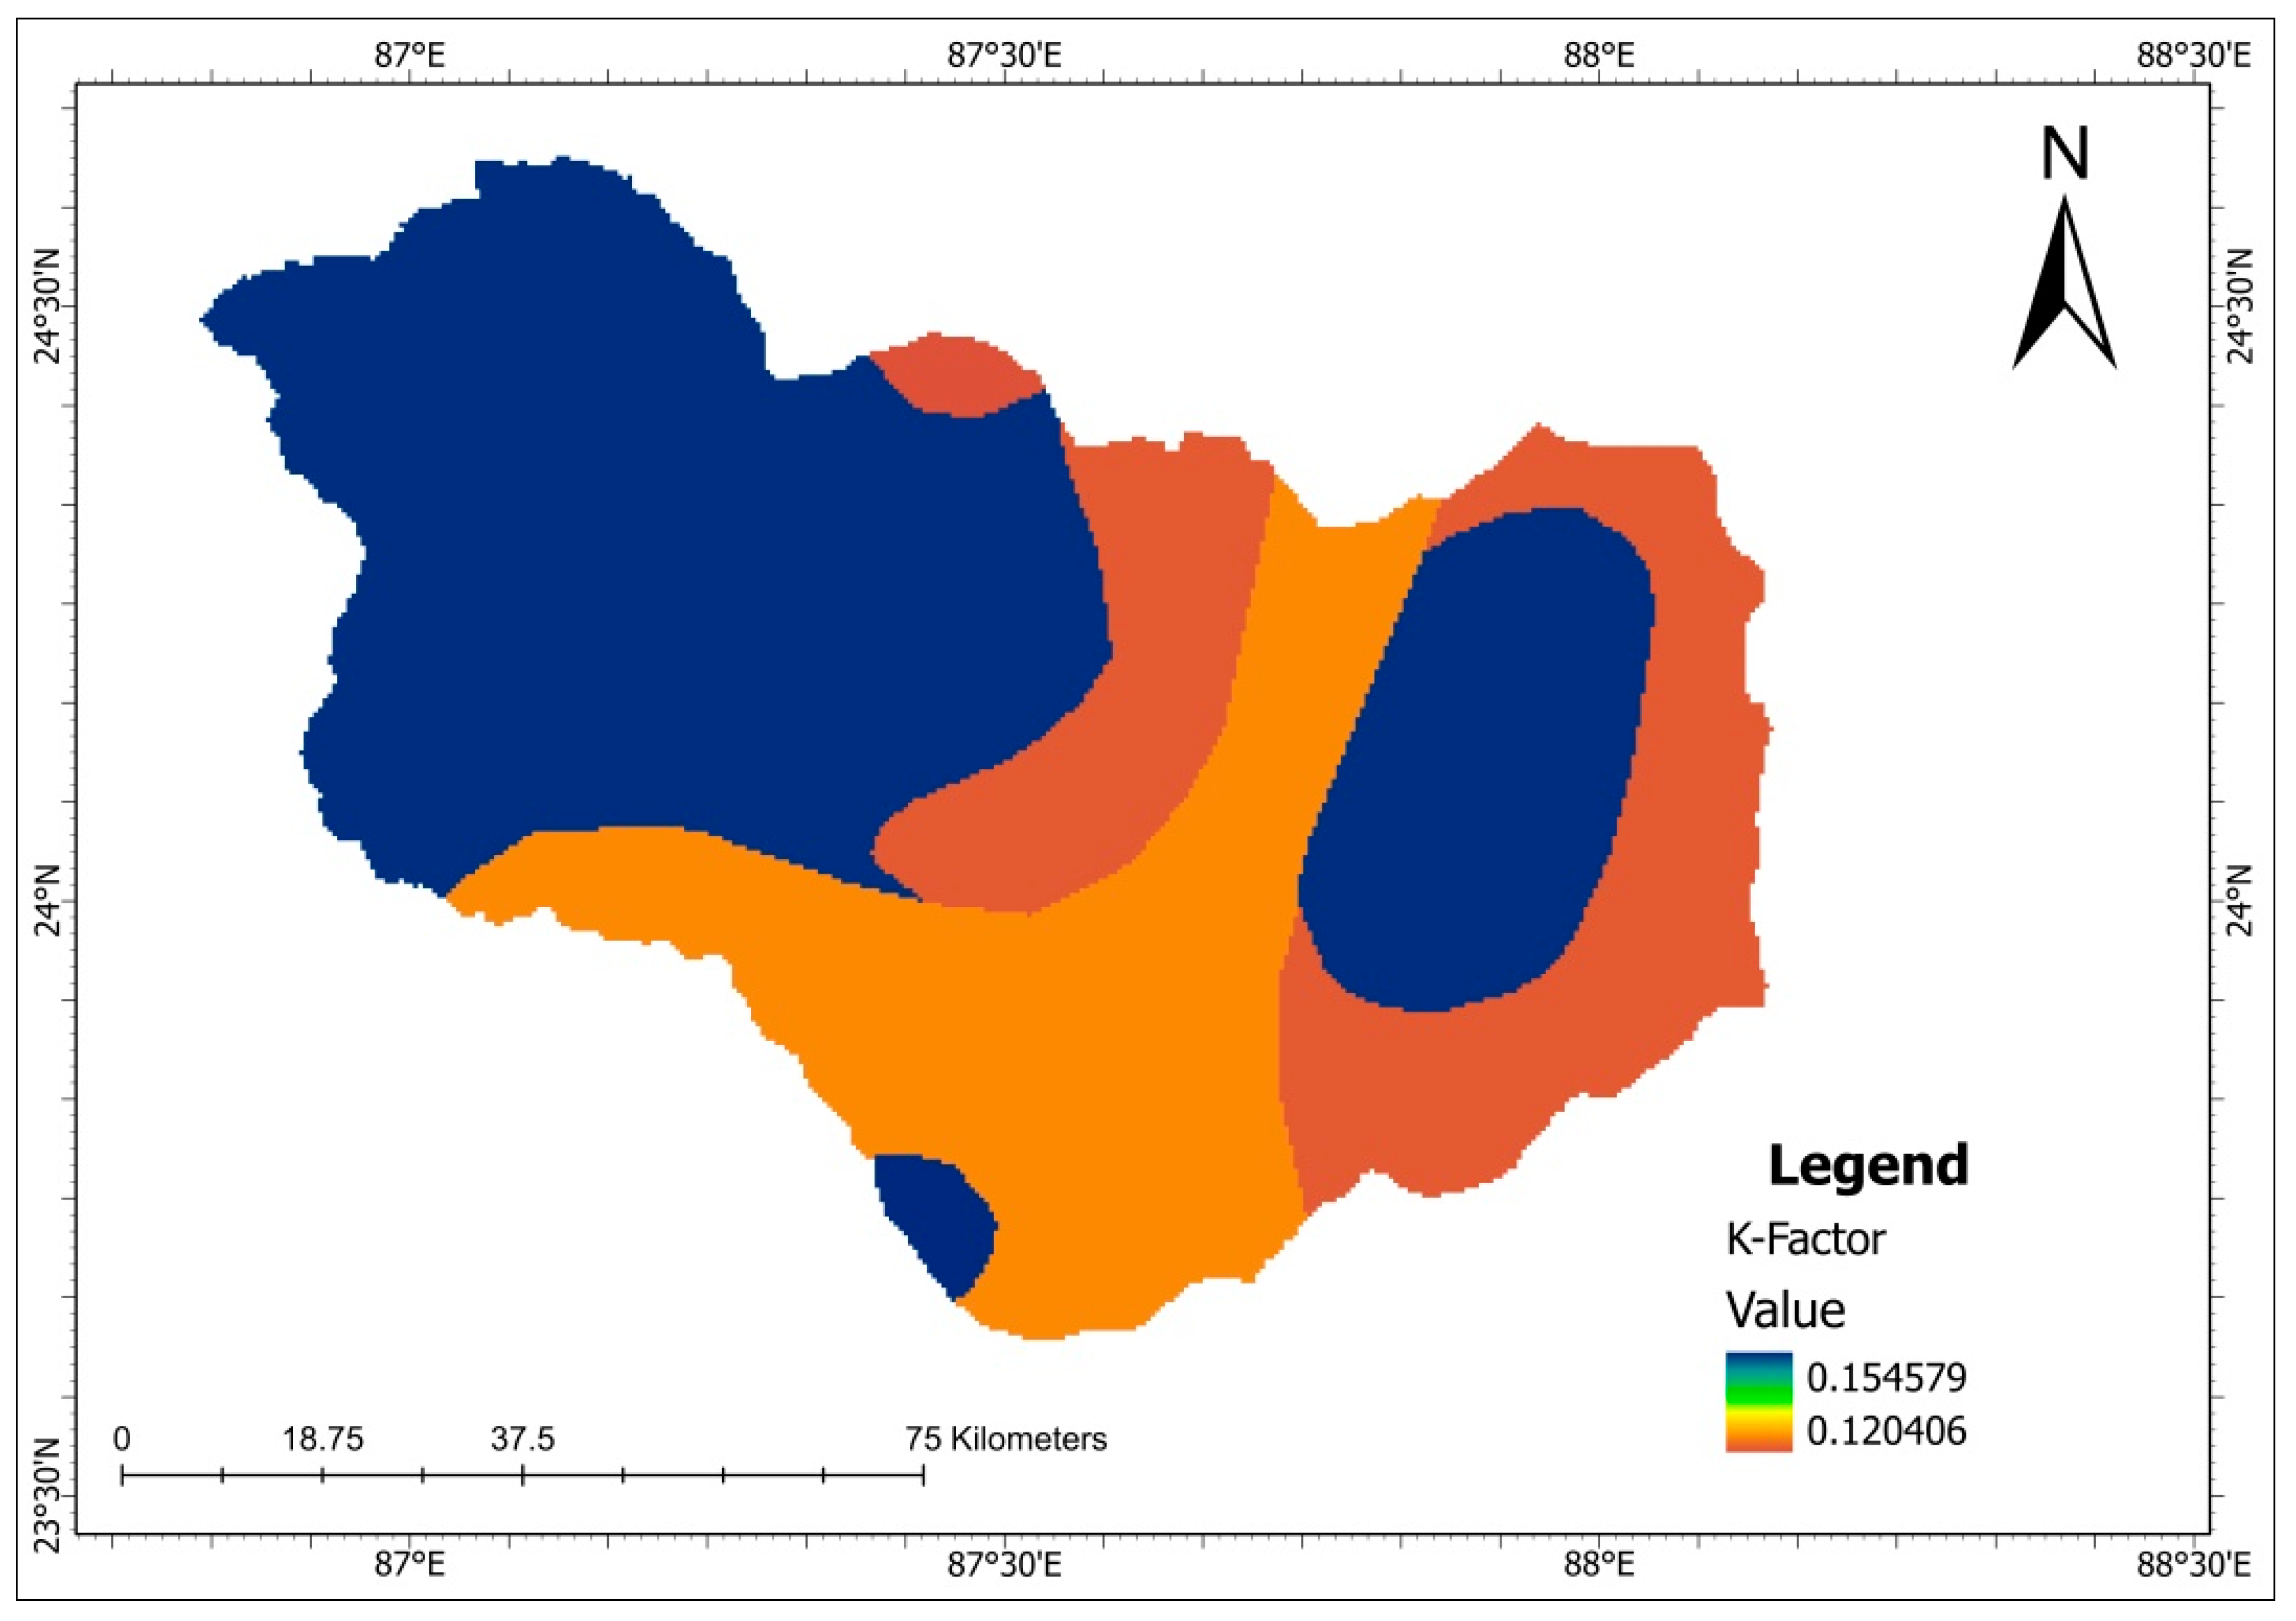
2.6. Soil Erodibility Factor (K)

The amount of soil erosion at the surface is indicated by the soil erodibility factor (K). Soil texture is the most crucial parameter to measure the K factor. Other factors are essential in determining the K factor in addition to soil permeability, organic matter, and soil structure. The value of K indicates the soil erosion rate per rainfall erosivity index (R). The FAO digital soil map was used to create the soil map for this study, and the K factor is calculated using the equation below:
K = 2.1 10 4   12 OM M 1.14 + 3.25   s 2 + 2.5   p 3 759.4
where K is soil erodibility (tons/Y/MJ/mm), OM is Percentage organic matter, s is soil structure code, p is Soil permeability code, M is a function of the primary particle size fraction given by the following formula,
M = %   Silt + %   Very   fine   sand × 100 %   clay
In general, sandy soil has a low k value for a high infiltration rate, and clay soil has a low k value showing resistance to the catchment area. Silt soil has the highest K value as it crusts highly and generates a high runoff rate and amounts.

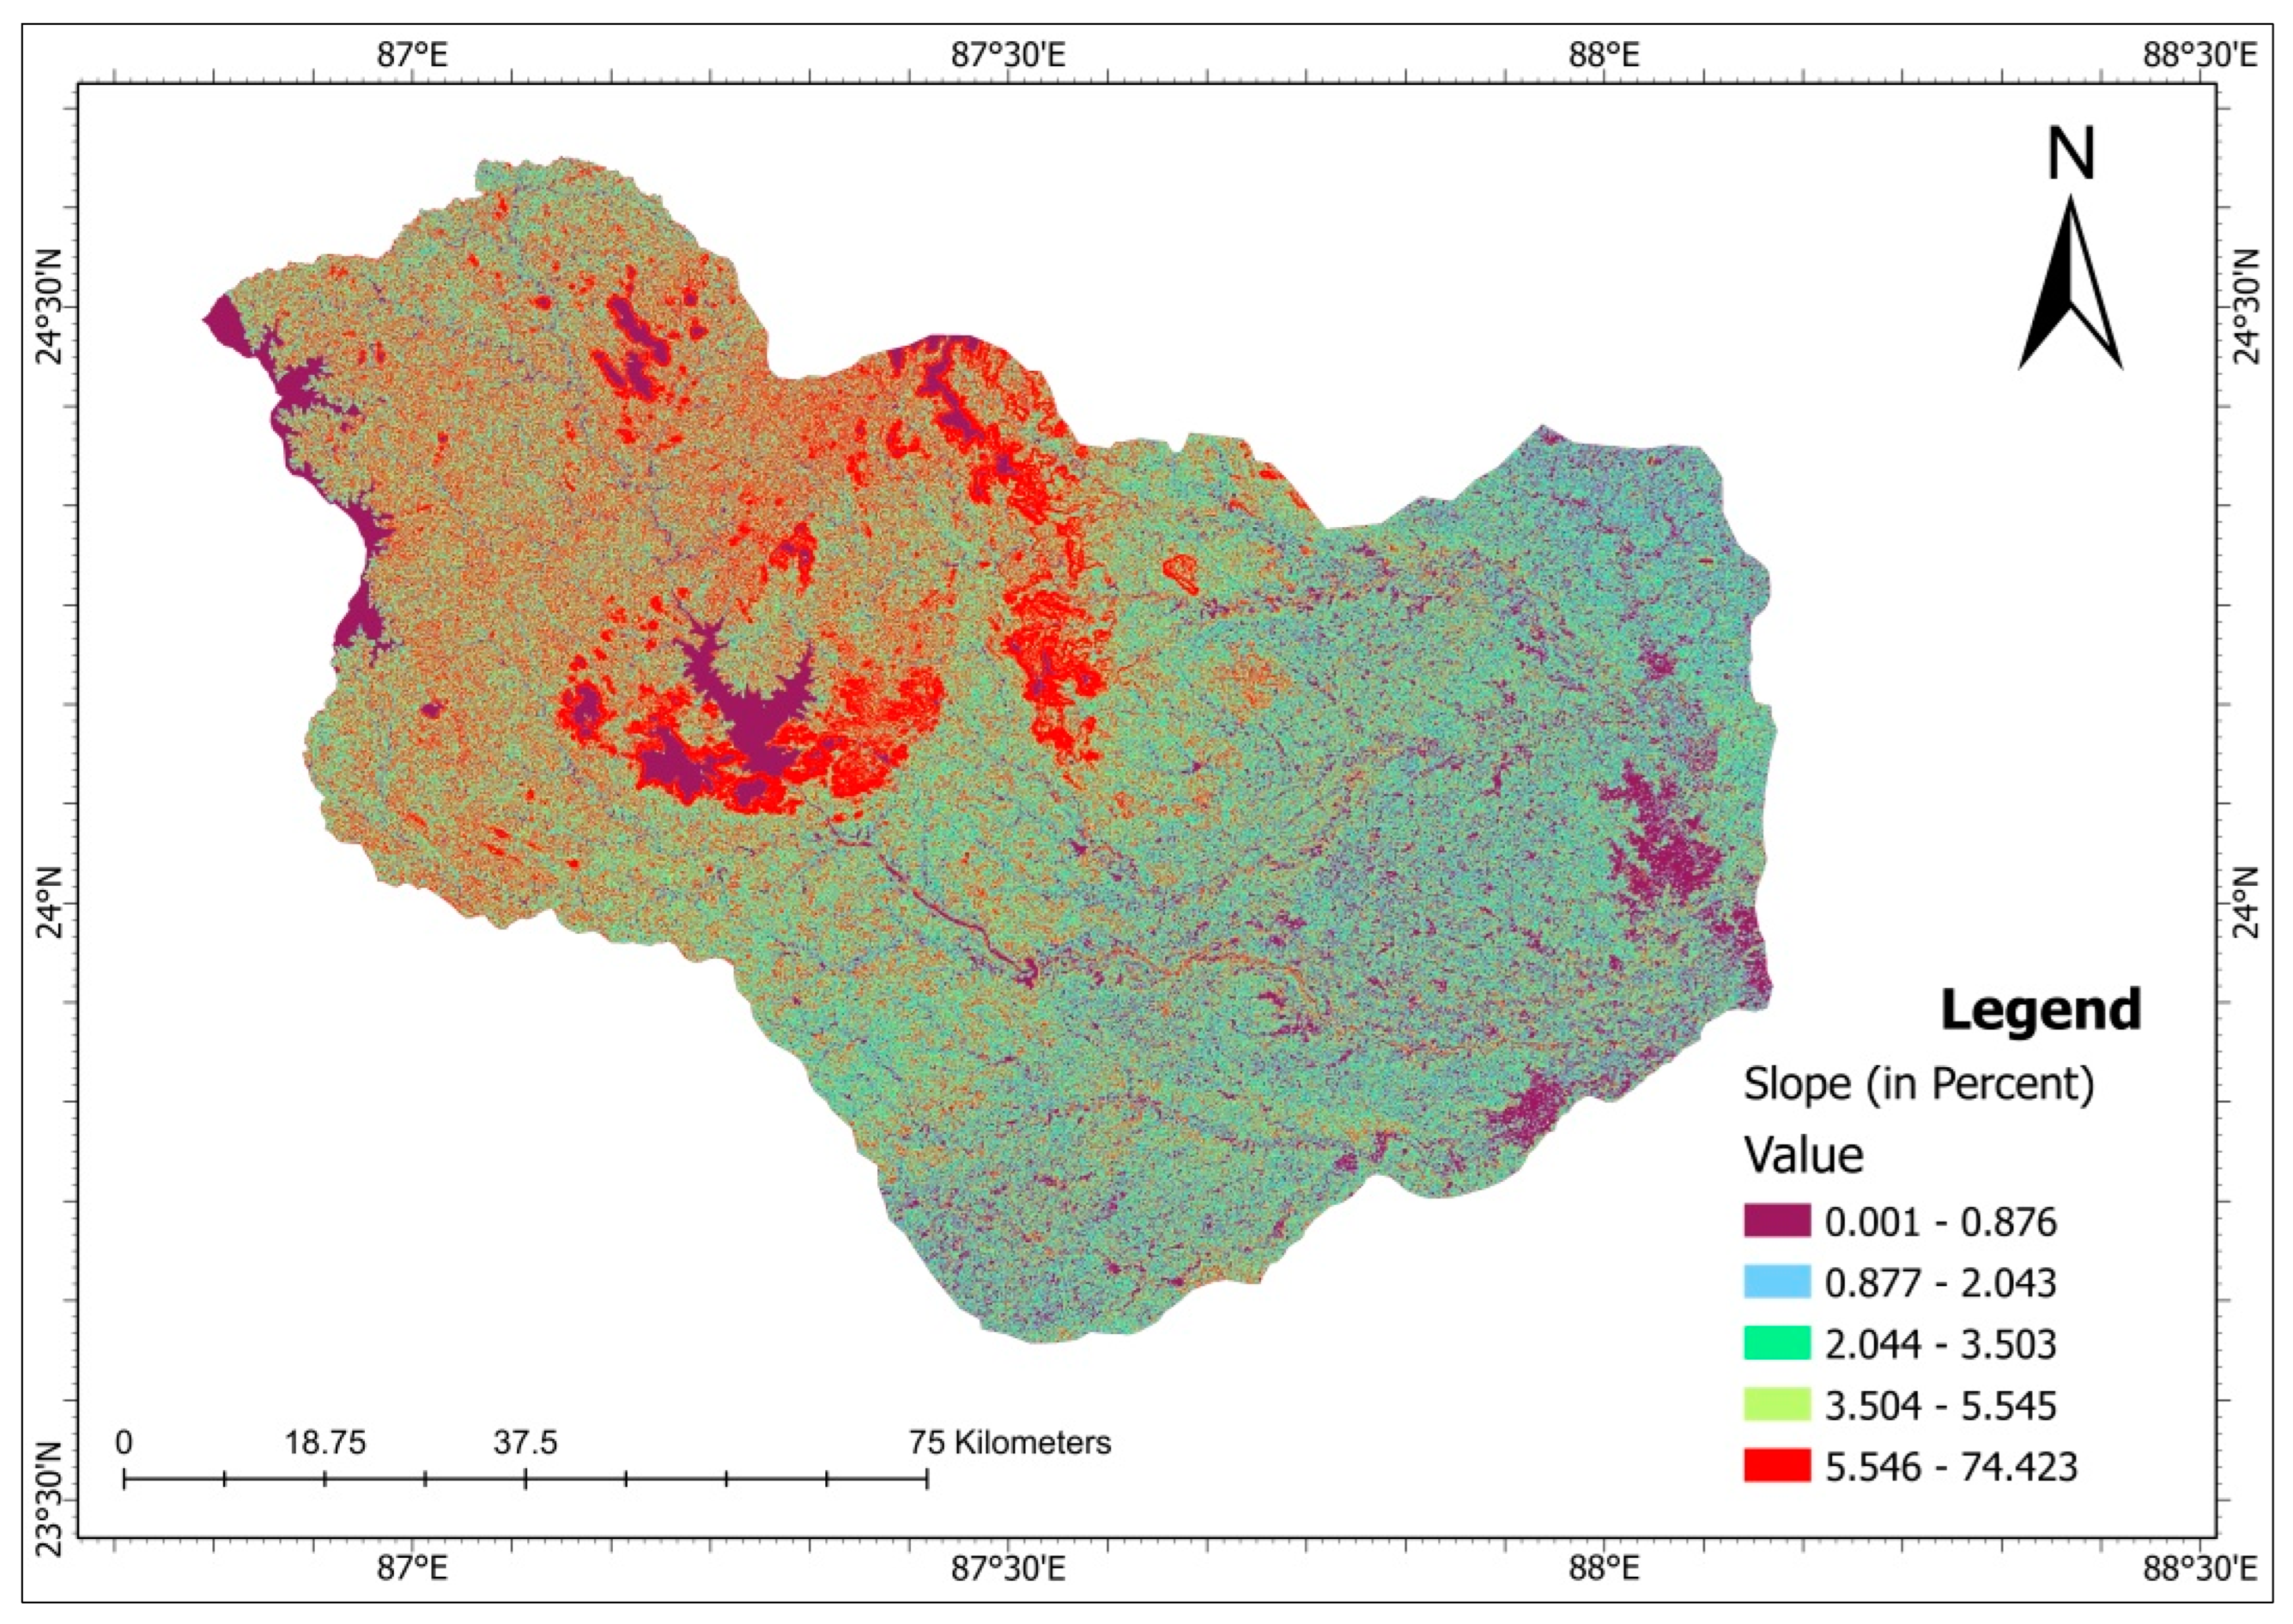
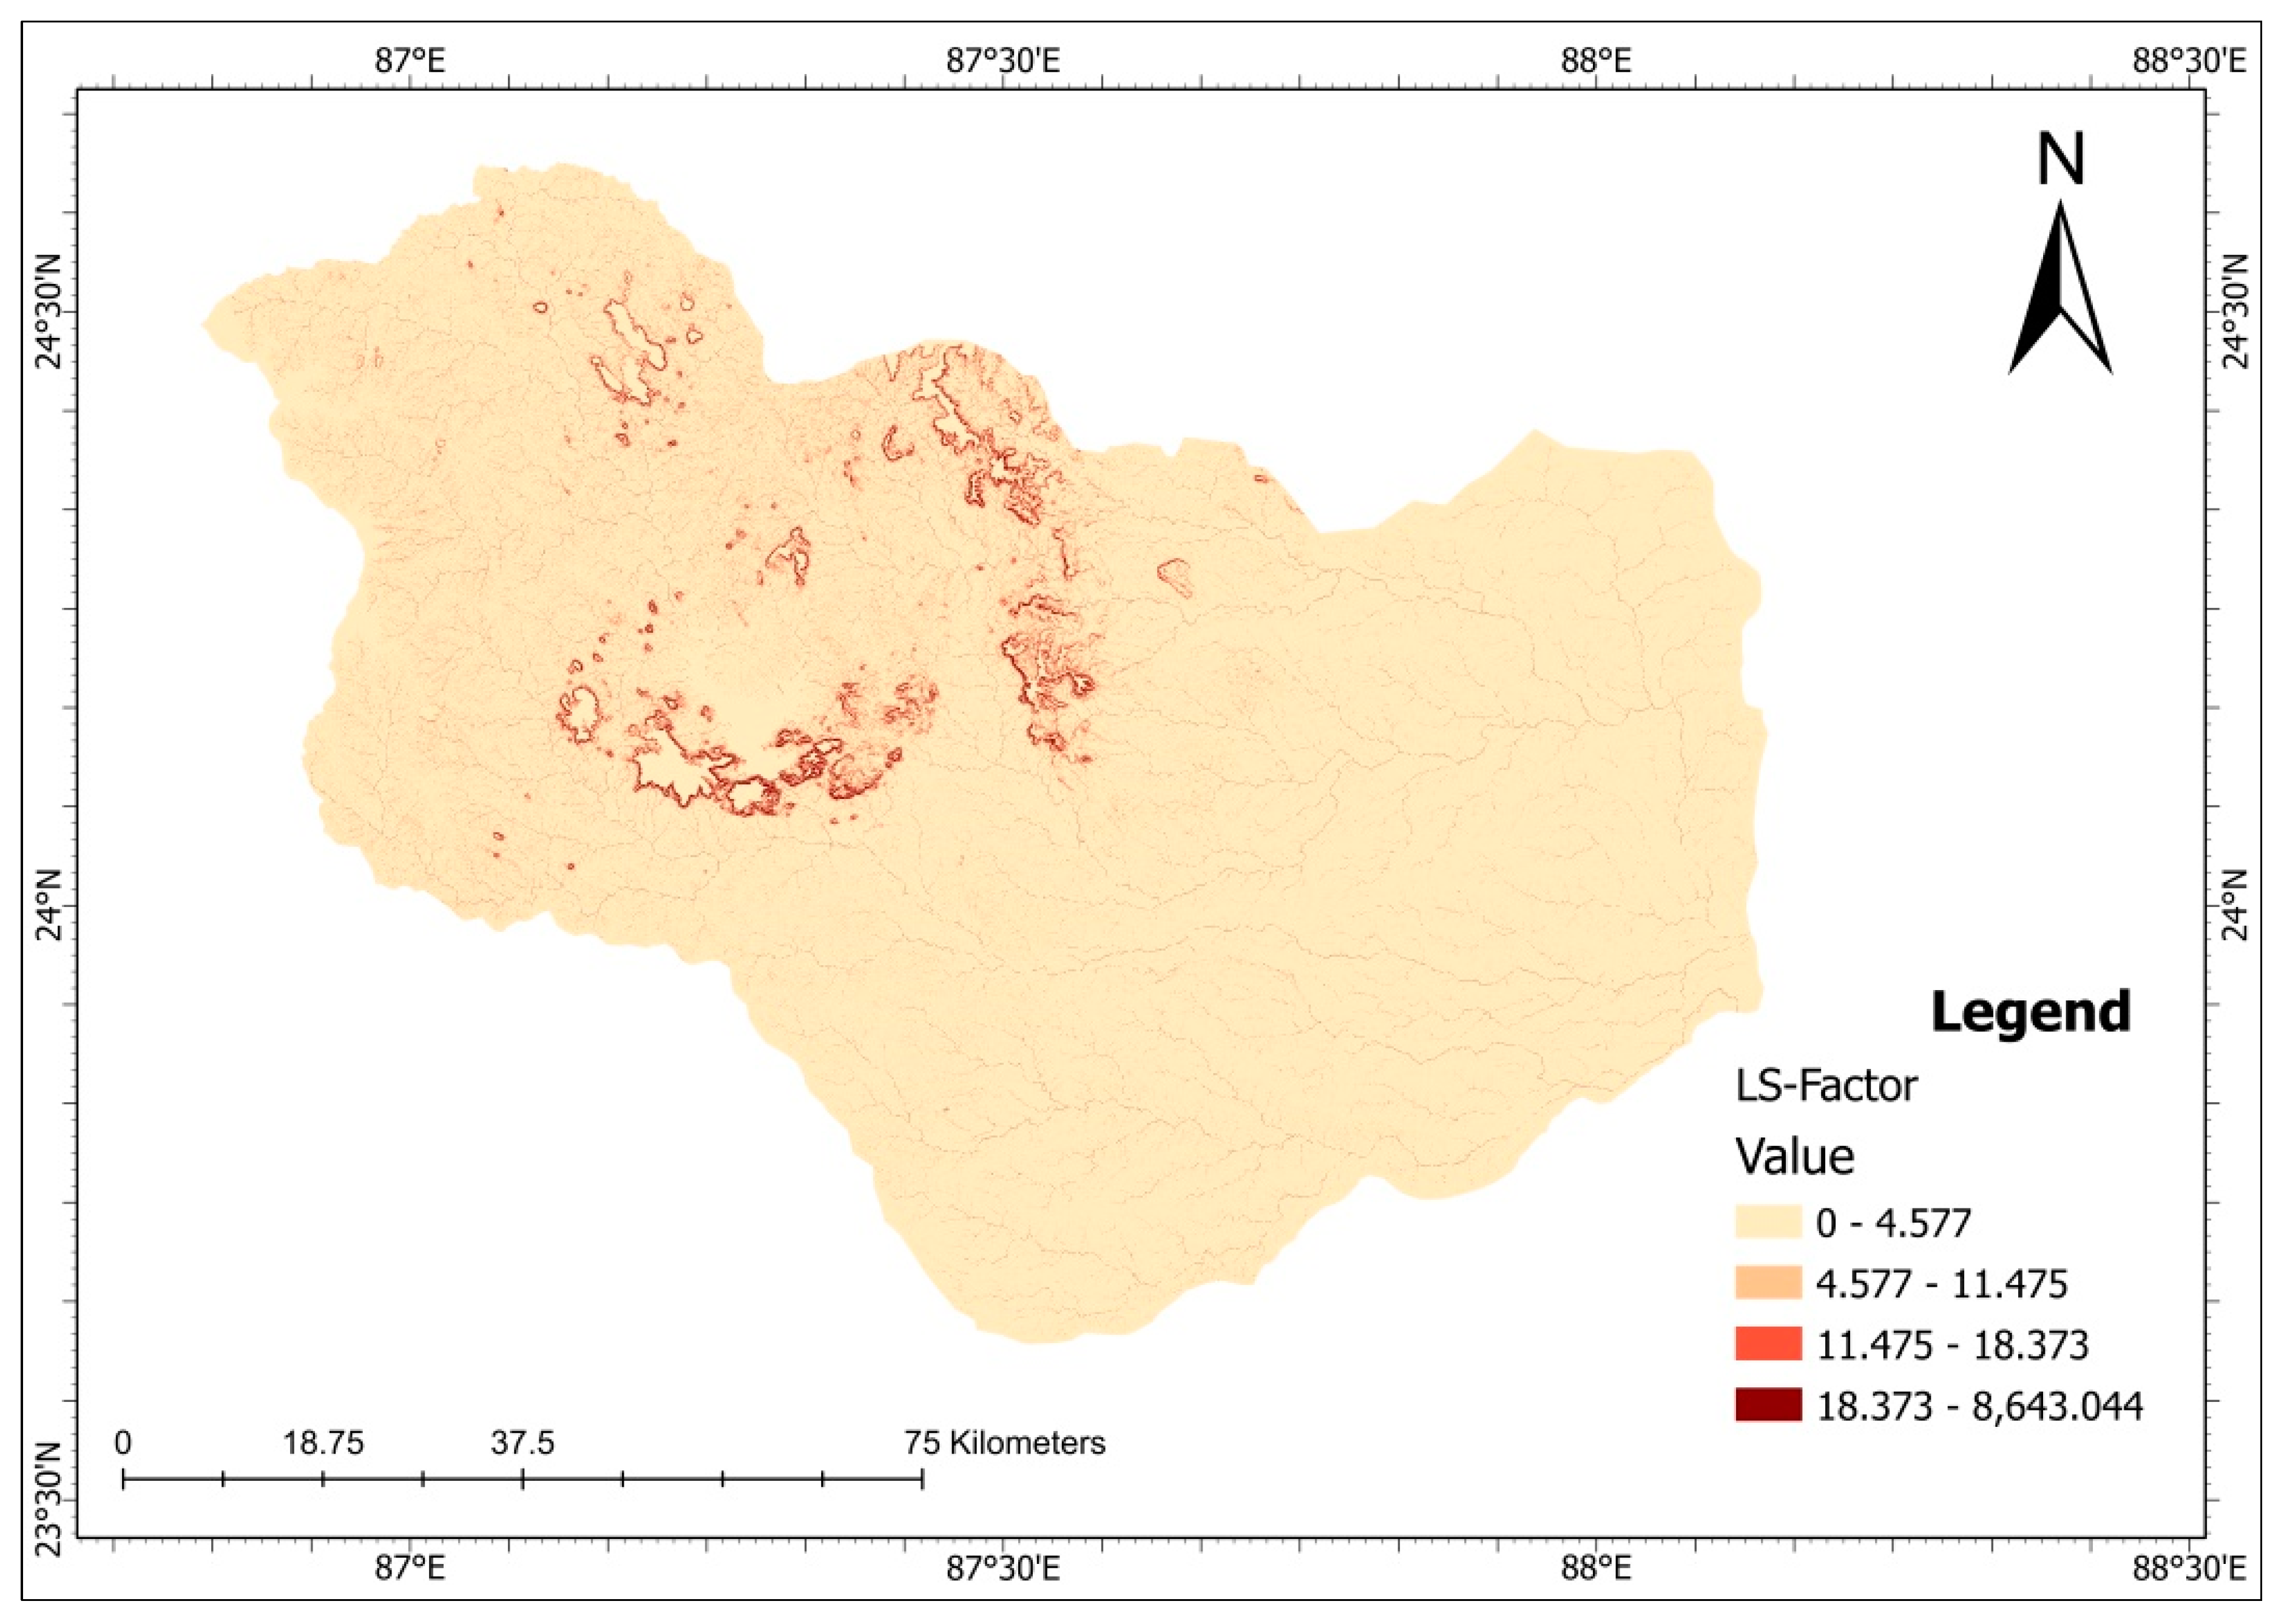
2.7. Topographic Factor (LS)

The topographic factor (LS) is calculated from the slope and flow accumulation. The slope length (L) factor has been derived using the given equation
L = ( λ / 22.13 ) m
where 22.13 is equal to the RUSLE unit plot length, m is a variable slope length exponent and λ is Horizontal distance between the origin of the overland flow and the point at which the slope gradient becomes so steep that deposition begins or surface runoff becomes accumulated in a defined channel.
In the present study, LS-factors were derived by using Shuttle Radar Topography Mission (SRTM) DEM data of the region using the spatial analyst extension of Arc GIS 9.3. We have rendered the slope in degrees and flow accumulation map from the SRTM DEM using the surface analysis and hydrology tools in the spatial analyst toolbox of ArcGIS. The flow accumulation corrected map is produced by assigning the value one to all the grids whose flow accumulation value is zero and keeping all the other values the same. In the ArcGIS environment, all trigonometric functions are being executed in radiance, with respect to that; the calculated degree slope map is converted into a slope radiance map in the raster calculator.

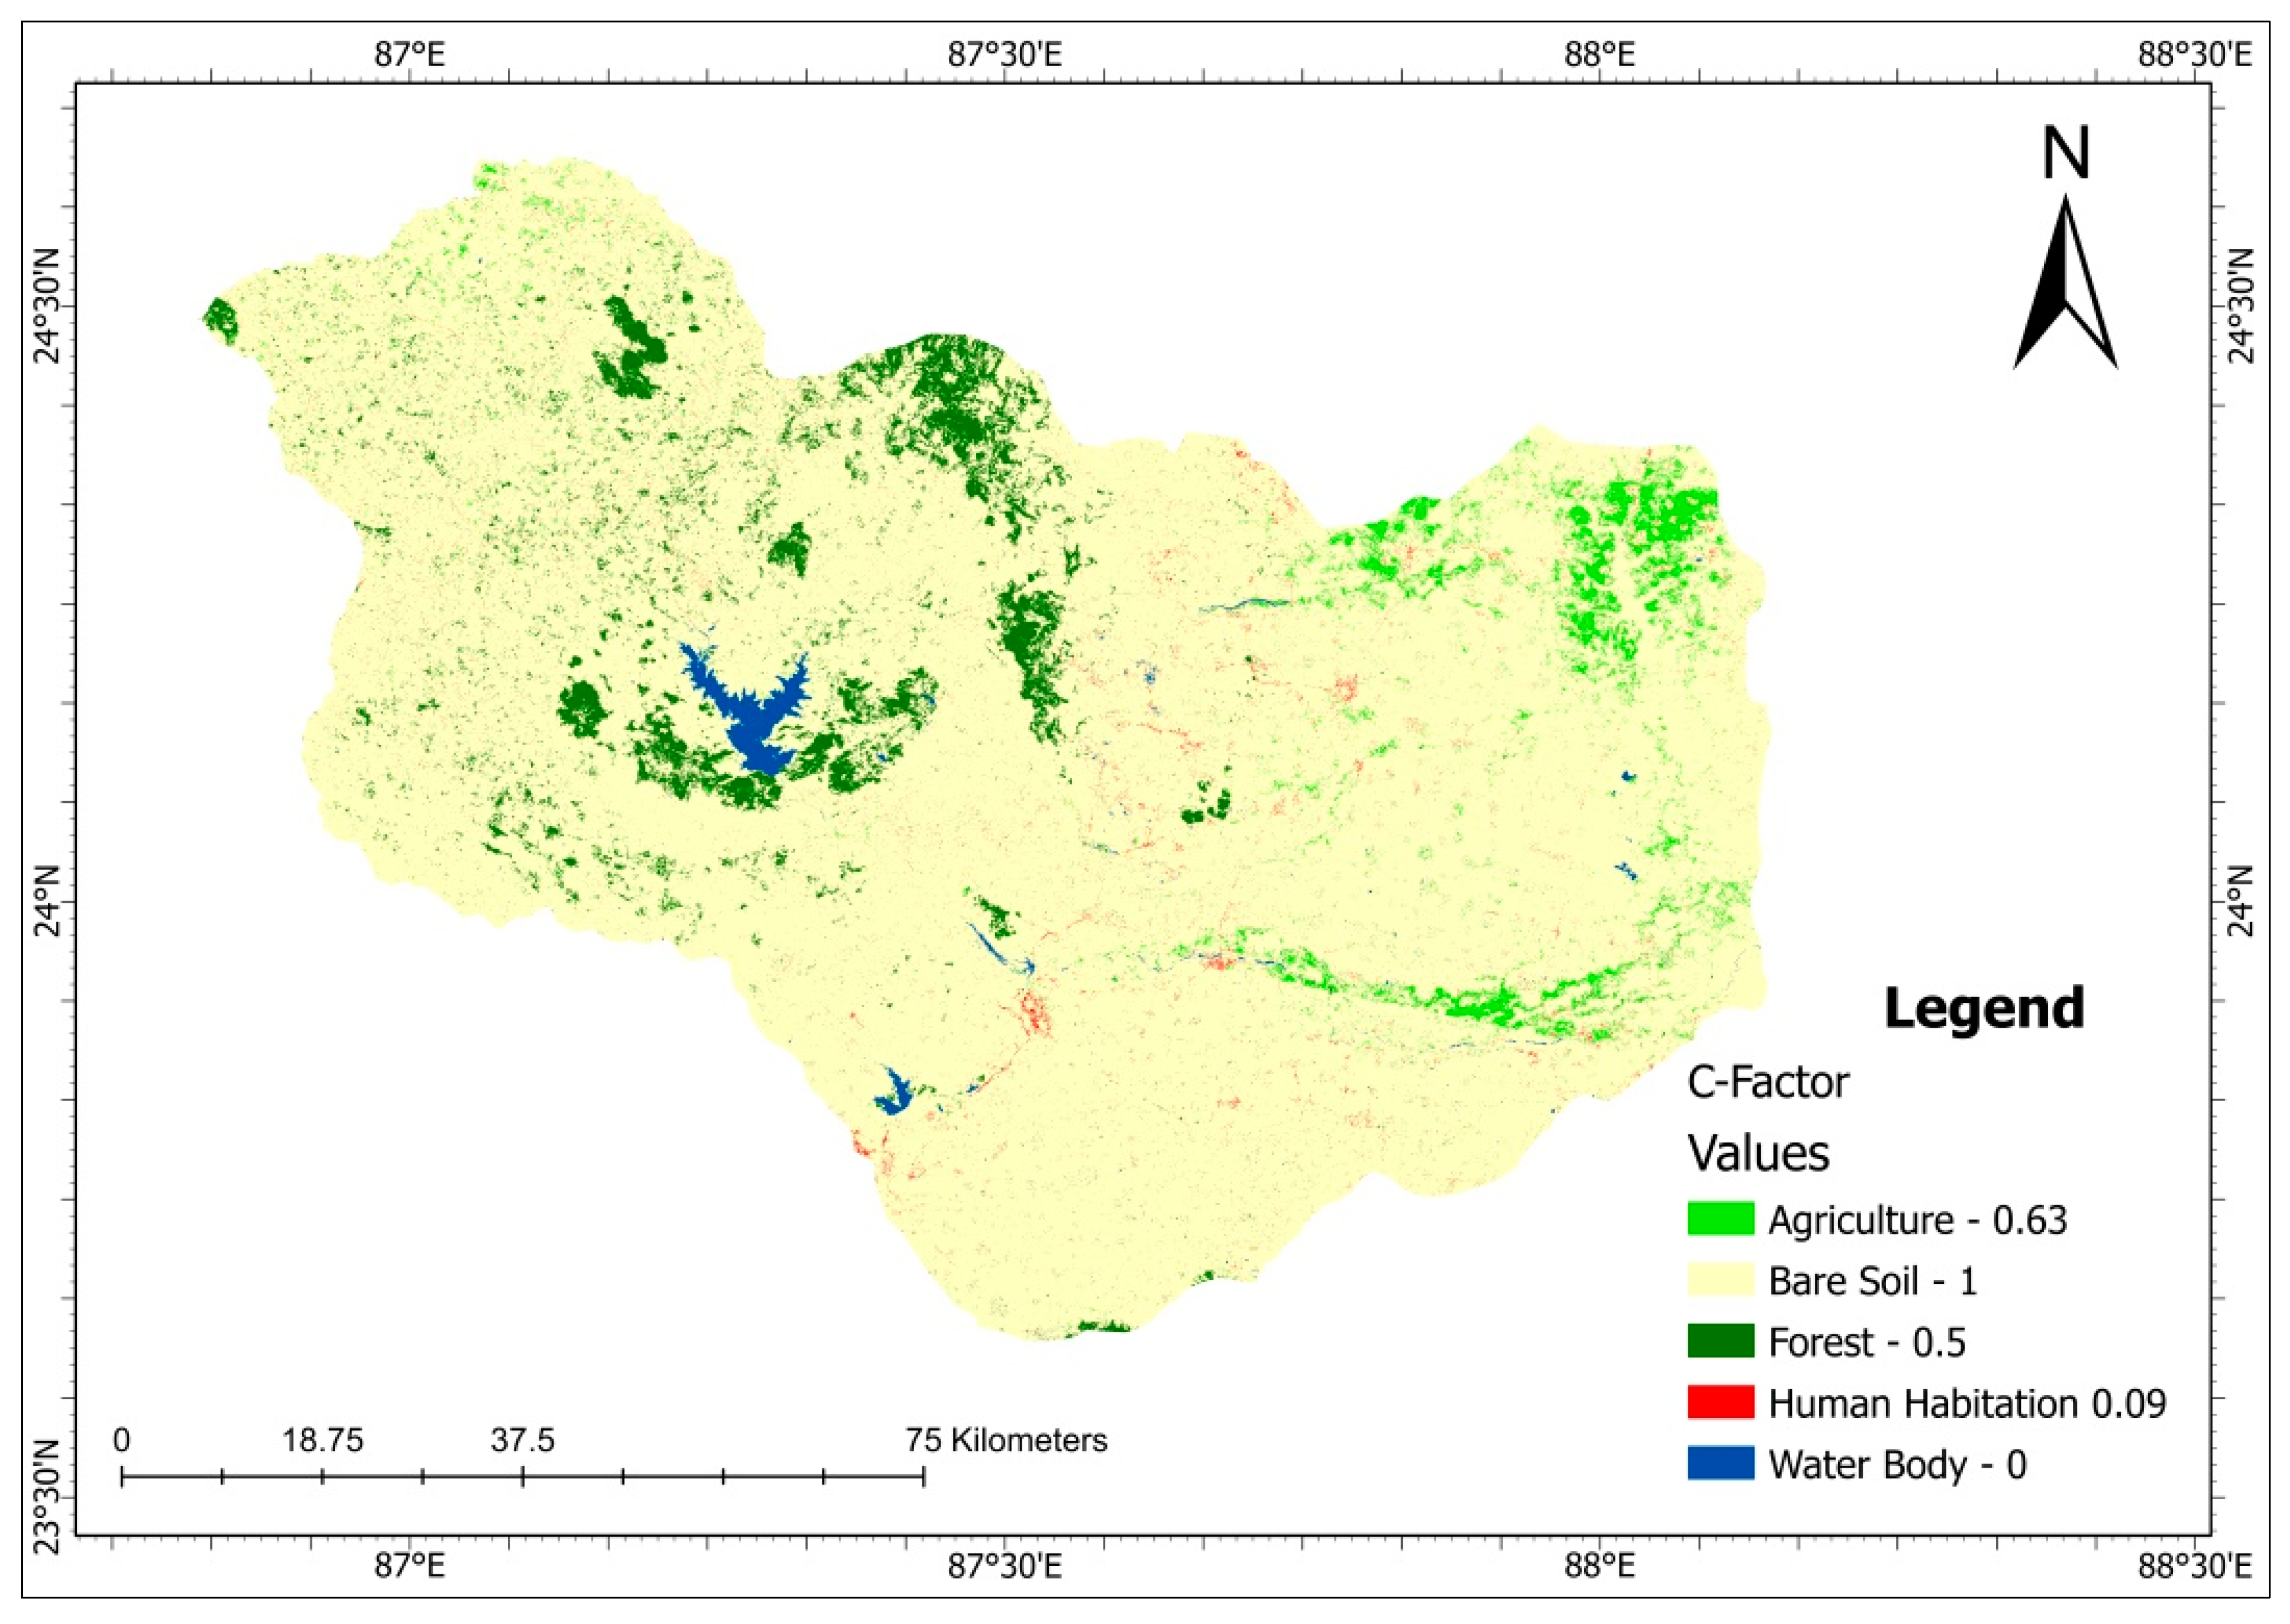
2.8. Cover Management Factor (C)

The C-factor is the most crucial parameter for crop management but is not present for all Indian crops. Thus, C-factor founded by Karaburun [22], was used to estimate the rate of soil erosion in agricultural fields. The ground covered by vegetation canopy reduces the rate of soil erosion in the forested area. According to Jabbar [23], crop cover is a potent tool for reducing the direct effect of rainfall on soil erosion, and he suggested that through the use of appropriate land reclamation techniques, bare land should be turned into agricultural land or a forest plantation.
The values of the C-factor depend on seasonal changes as it varies with different parameters, such as crop types, rainfall, agriculture practice, etc. The C-factor was calculated based on the study area’s LULC classification. The Mayurakshi river basin is classified into five dominant land cover classes: agriculture, bare soil, forest, settlement, and water bodies. Landsat-8 operation land imager sensors have been used to classify the river basin, and the maximum likelihood algorithm has been applied for the supervised classification. The overall accuracy of the classified image is 82.33%, and kappa statistics is 0.78.

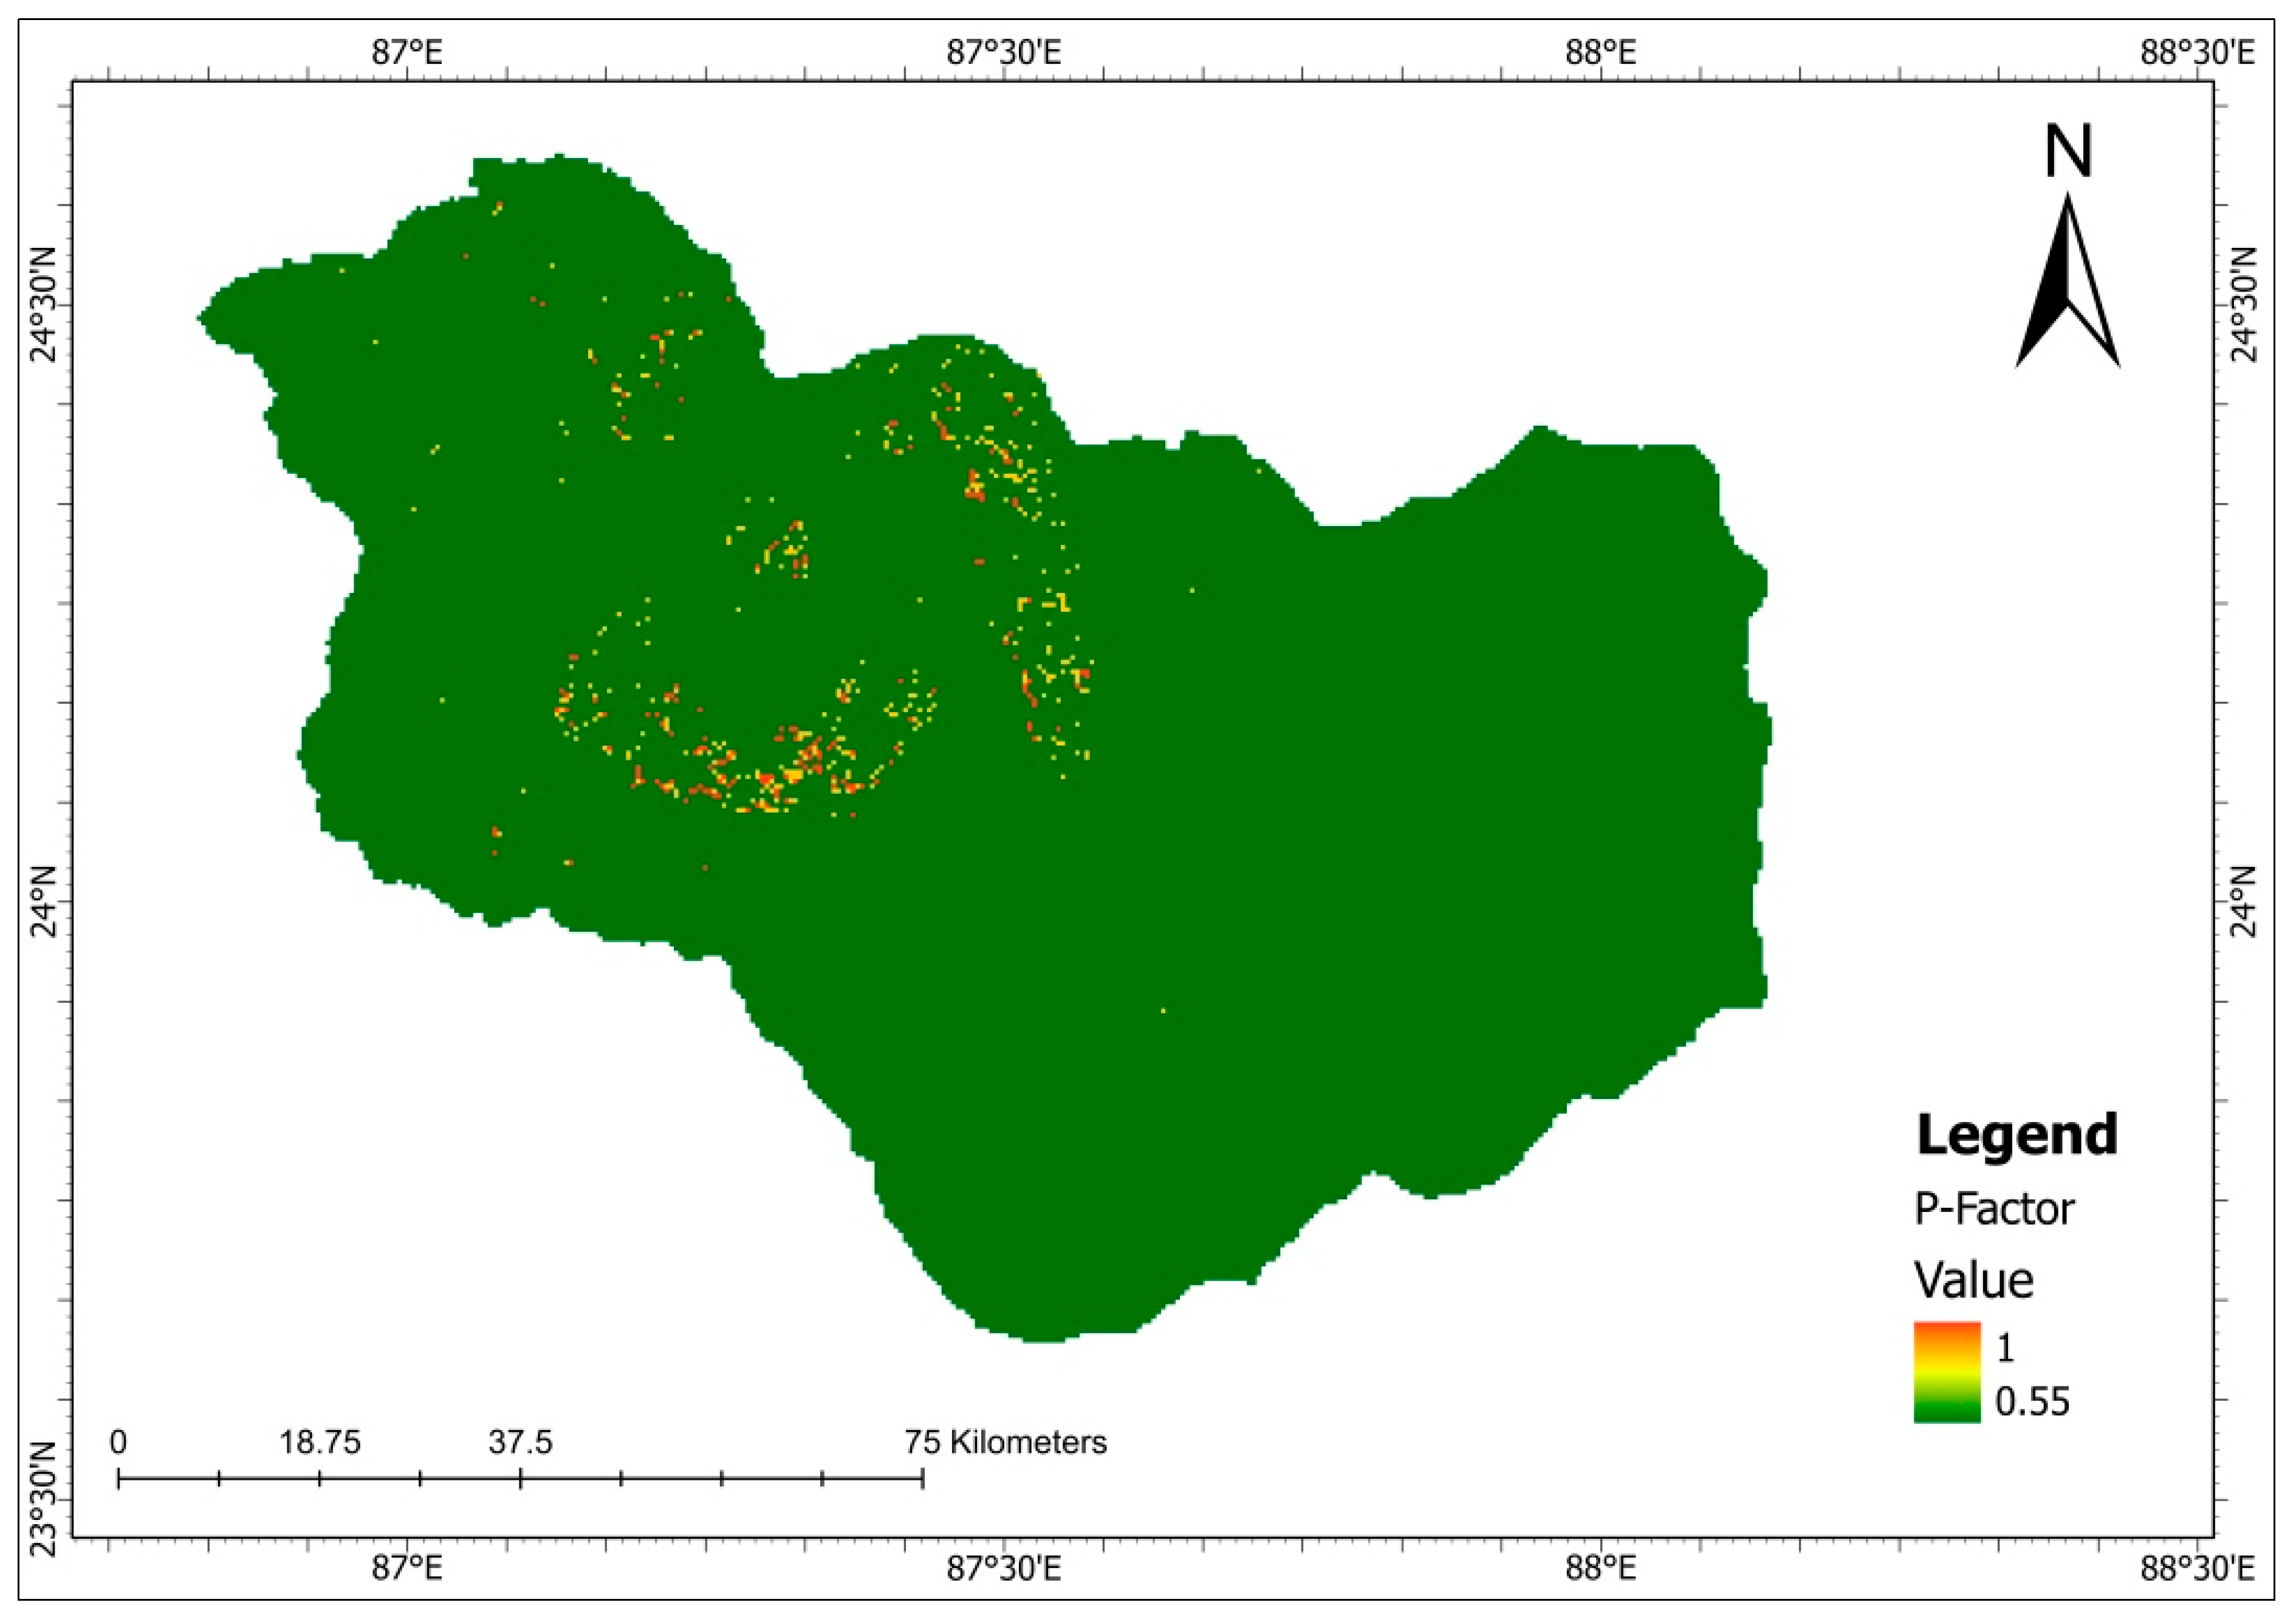
2.9. Conservation Support Practice Factor (P)

The conservation support practice factor (P) takes into account the beneficial effects of support practices by comparing the rate of soil loss from support practices up and down the slope to that of straight-row farming up and down. It decreases the runoff erosion potential by their influences on runoff concentration, the pattern of drainage, runoff velocity, and the runoff hydraulic forces on the soil. P-factor values for different land uses have been obtained from the standard table postulated by Haan et al. [24]. The values for different LULC classes have been crudely assigned in the raster calculator, and the P factor map has been prepared. P values range from 0 to 1, with higher values denoting ineffective conservation practices and lower values denoting effective conservation practices (Table 2).

3. Results and Discussion

3.1. Rainfall Erosivity Factor (R)

The relationship between precipitation and sediment yield is described by rainfall erosivity, which measures the force of raindrops on surfaces and the rate of related surface erosion [25]. Rainfall erosivity states the probable capability of raindrops to cause detachment of a soil particle, a process that is robustly reliant on rainfall intensity [26]. The rainfall map has been prepared from IMD gridded rainfall data of 2020 (Figure 4). The R factor values range from 675.51 to 911.23 (Figure 5). The central part of the basin has higher rainfall than the outer part throughout the year. In the upper reaches of the watershed, where the hills predominate, the erosive power is clearly visible. There is a positive relationship between rainfall distribution and erosivity factor, as rainfall decreases the erosive power of the same is decreased in the watershed (Figure 5).

3.2. Soil Erodibility Factor (K)

The rate of soil loss per unit of the rainfall erosion index is known as the soil erodibility factor (K). It is calculated on a typical soil plot and is often determined based on natural soil characteristics. This is a quantitative indicator of how easily soil particles can separate and be carried by surface runoff.
Although soil texture is a vital aspect affecting erodibility, geological formation, permeability, organic matter and soil structure also play a significant role in assessing the K factor. Based on rainfall-runoff erosivity (R) index, K values reflect soil loss rate. An erodibility value closer to 0 indicates less erosion prone soils; a value closer to 1 indicates more erosion prone soils. The Mayurakshi river basin is comprised of five different types of soil namely Chromic Cambisols, Eutric Cambisols, Ferric Luvisols, Orthic Luvisols, and Eutric Nitosols (Figure 6). The K values range from 0.120 to 0.154. Eutric Nitosols and Eutric cambisols have higher K values, while Ferric Luvisols have lower K values (Figure 7).

3.3. Topographic Factor (LS)

Determining slope length and steepness are a vital part of soil erosion prediction models [27]. In RUSLE, these factors represent topography’s effect on erosion. The topographic factor is represented by slope length and slope steepness on soil erosion. There is a high probability of soil erosion with a higher slope factor in the region.
The result from the study of the Mayurakshi River basin shows a higher slope in the middle of the valley (Figure 8). This topographic relation is well established with the erosional factor. The flow accumulation is also considered with the slope for the topographic factor. The topographic factor increases with an increase in the slope and flow accumulation (Figure 9).

3.4. Cover Management Factor (C)

In order to assess how effectively soil and vegetation management systems can prevent or reduce soil loss, the cover management factor (C) is always used. Higher vegetation is related to the low possibility of soil loss. The C factor has a range of 0 to 1, with higher values indicating greater soil erosion and lower values indicating greater soil particle compactness. Therefore, all the vegetated areas in the study area are depicted low C- values. Barren, fallow, and open bare lands without vegetation cover have shown higher C-factor values. The study region has the highest area under bare soil, indicating the highest probability of soil erosion (Figure 10). The area under agriculture is 2.59%, which is human-influenced land management through cropping. The area under forest is 4.85%, with a low risk of soil erosion.

3.5. Support Practice Factor (P)

The conservation practice resembles the support practice factor, which reflects the effects of practices on the reduction of surface runoff and consequently water-induced erosion [28]. The ratio between soil loss brought on by conservation practices and soil loss brought on by straight row farming up and down the slope is represented by the P factor, which shows the impact of support practices on the mean annual soil loss rate. The P factor shows the impact of conservation practices on the mean annual soil loss rate. The P factor, then, stands for the ratio of soil loss brought on by conservation practices to soil loss brought on by straight-row farming. The Mayurakshi basin has a high P-value for the northwestern and western side, situated in a high elevated area compared to the other basin region. The P values range from 0.55 to 1.0, with the highest value being given to areas with no conservation practices (Figure 11).

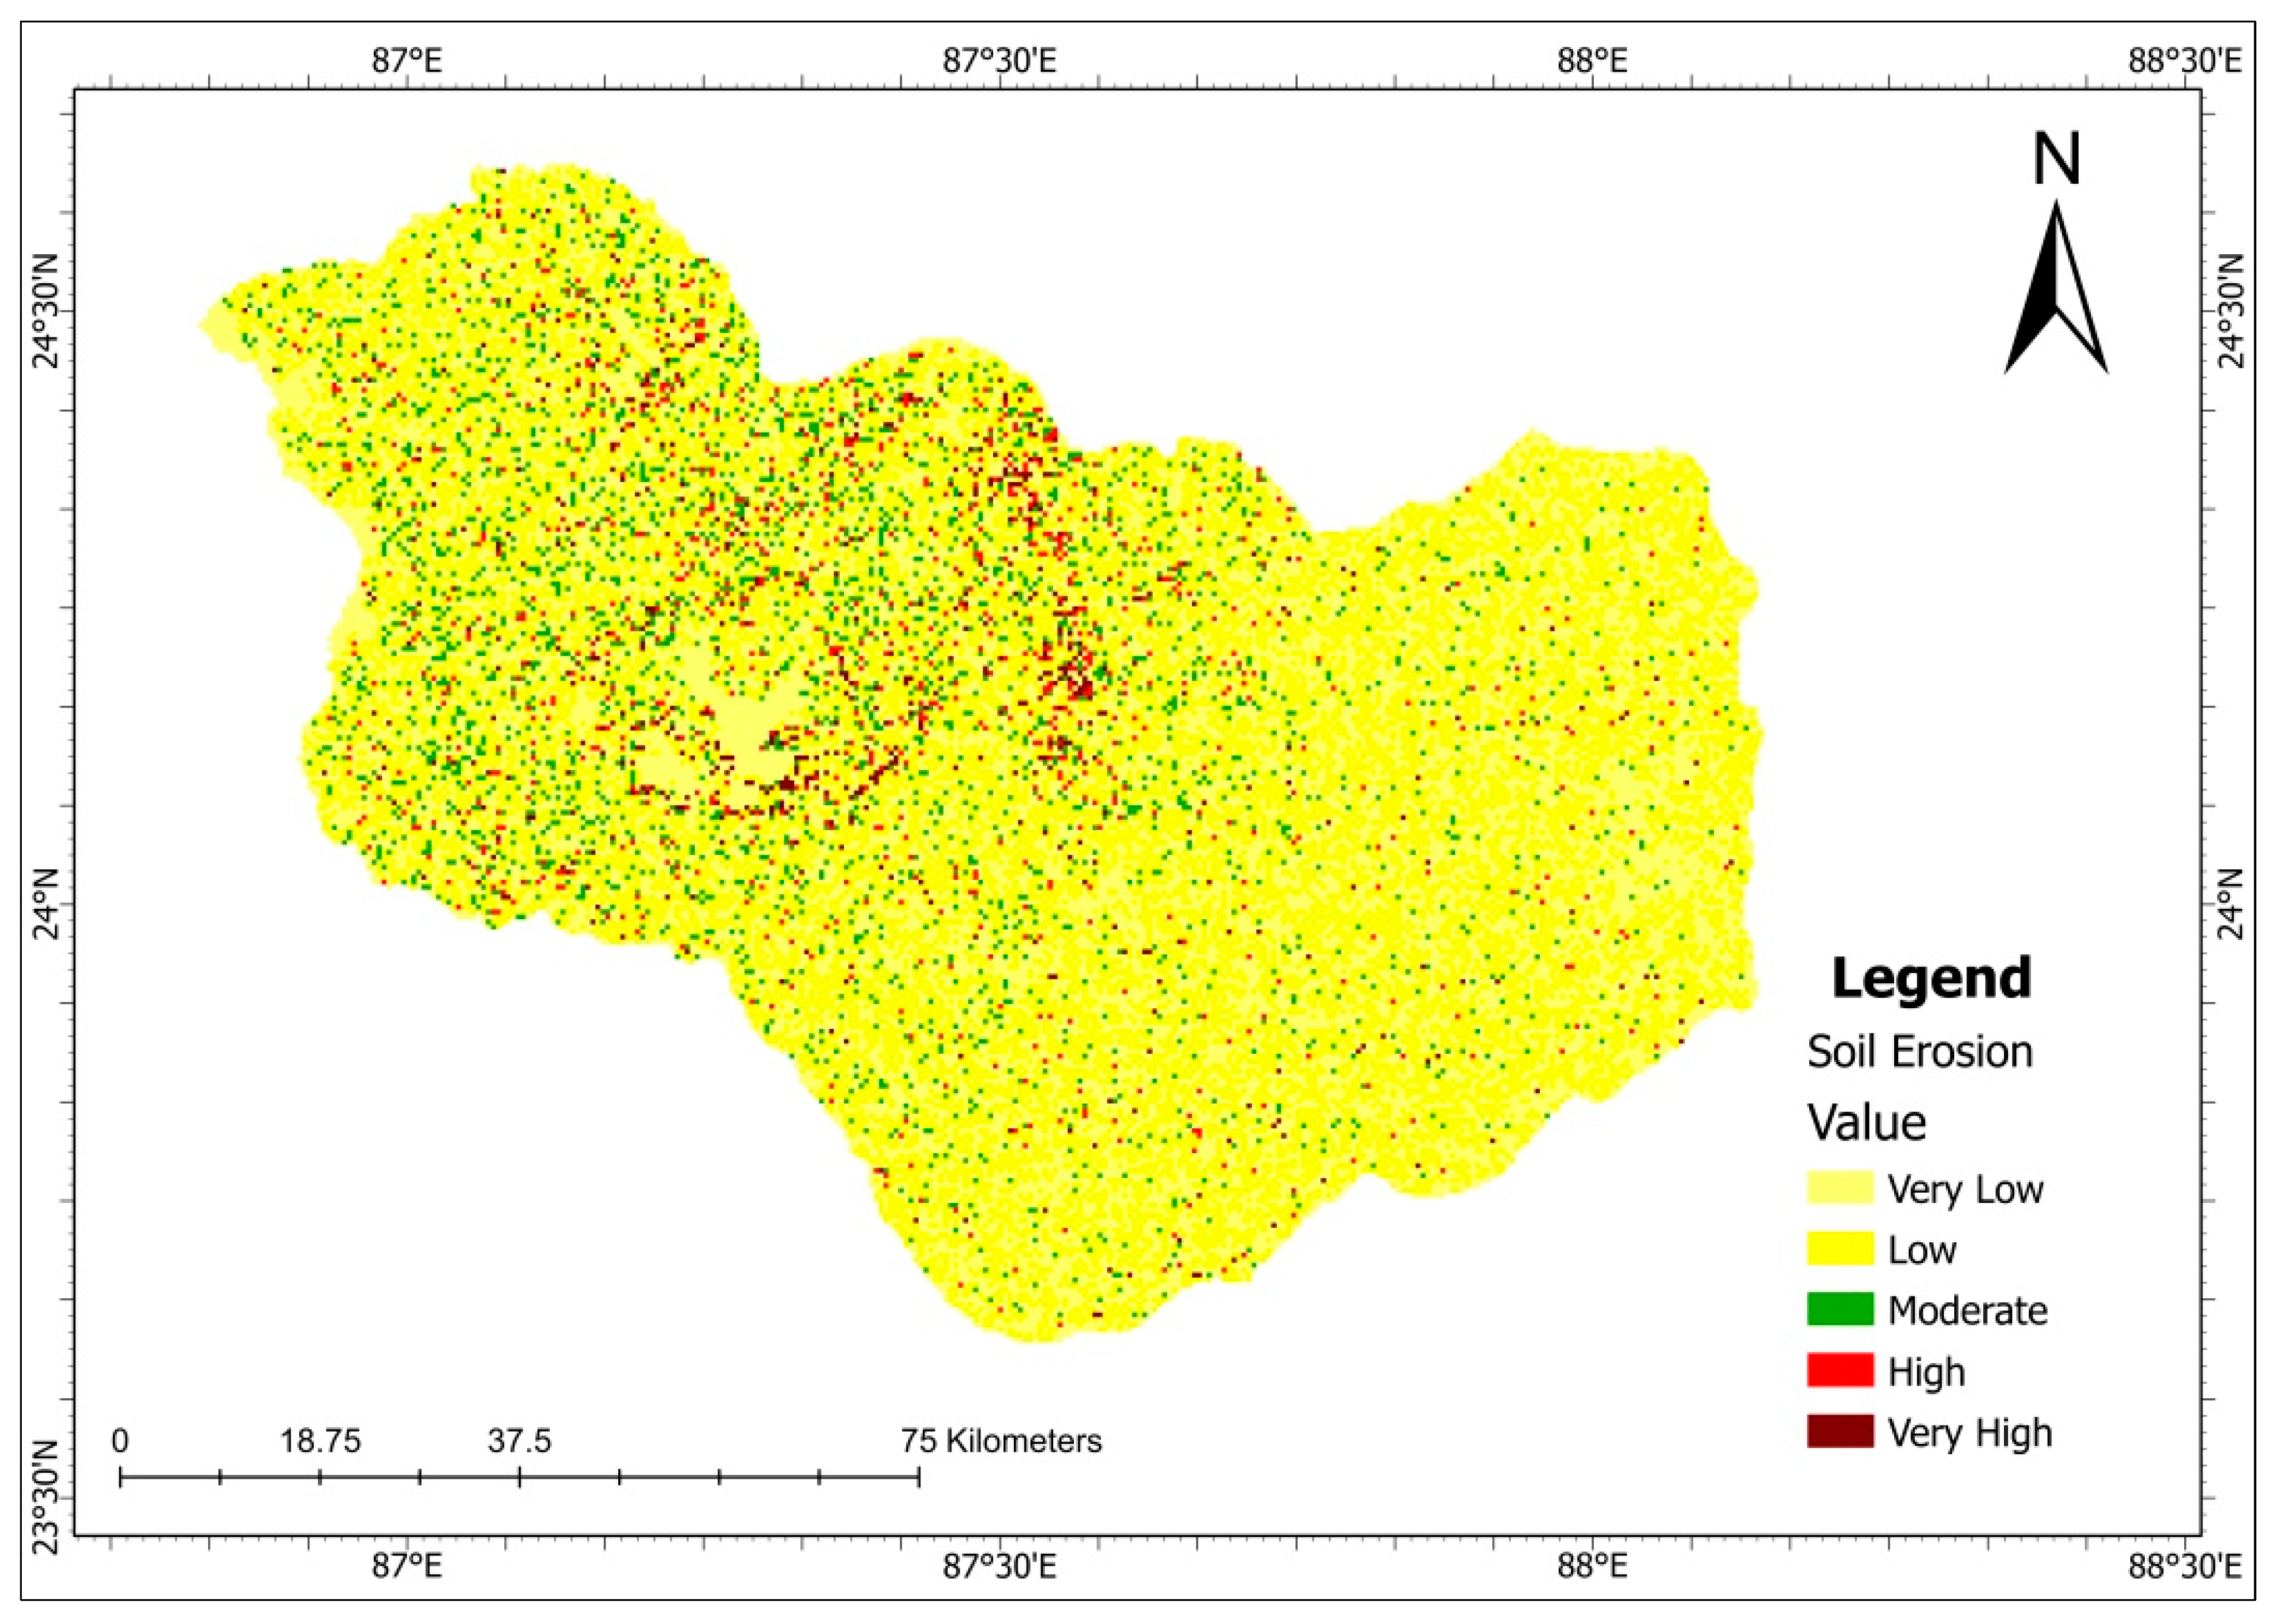
3.6. Potential Soil Erosion by RUSLE Model

The average annual soil loss was calculated using a raster calculator in a GIS environment by multiplying R, K, LS, C, and P factors. The RUSLE model results show that the upper streams of the Mayurakshi river basin are more affected by soil erosion than the lower basin area (Figure 12). This is mainly influenced by uneven topography and topographic factor. The areas near the dam with higher slopes are most vulnerable to soil erosion. The study region is located in the lower plain of the river Ganga, hence it is not very much affected by soil erosion The soil loss threat varies in the study area as topography changes, according to the spatial distribution of the soil erosion potential map. Based on the rate of erosion, soil loss in the study area can be divided into five categories: very low, low, moderate, high, and very high. Only 3.58 percent of the total area is at a high and very high risk of soil erosion, as shown in red color on the map. This area with significant soil erosion risk should be conserved with the highest priority. As indicated by the yellow color, 90% of the area has a lower risk of soil erosion (Figure 12). Based on RUSLE modeling, the Mayurakshi River basin loses 46,29,714.8 tons of soil annually.

4. Conclusions

Soil erosion in a river basin is often caused by natural factors (topography, rainfall, soil, and land cover) and human-induced factors (land use, support factor). In order to identify the soil erosion-prone zones for conservation planning in the Mayurakshi river basin, soil loss has been assessed at the pixel level using the RUSLE model. The areas in the middle of the valley are prone to soil erosion at a higher risk than the other region. The plains are relatively less affected by soil erosion. The empirical soil erosion model map shows the probability of soil erosion in regions with a very high (1.18%), high (2.4%), moderate (6.5%), low (49%), and very low (40.92%) category, respectively. The region of the Mayurakshi river basin is located in the lower plain, with the upstream in the plateau region. The upstream is mainly affected by soil erosion because of the topographic and land management factors. The lower stream is at a lower risk of soil erosion depicted in the model. Using the RUSLE model, we estimate annual soil losses in the Mayurakshi river basin to be 46,29,714.8 t/yr. As a result, it can be inferred that Remote Sensing, and GIS, in conjunction with the RUSLE model, play a crucial role in determining the input parameters for soil erosion modeling and resource management. Using these techniques, policymakers can develop management scenarios and determine the most efficient way to control soil erosion problems.

Author Contributions

Conceptualization, supervision, methodology, formal analysis, writing—original draft preparation, writing—review and editing, A.G., S.R. and S.T.; data curation, project administration, investigation, S.D., U.C. and C.B.P.; writing—review and editing, funding acquisition, A.A., A.A.A.-O., A.Z.D. and M.A.M. All authors have read and agreed to the published version of the manuscript.

Funding

This research was funded by the Deanship of Scientific Research, King Saud University through Vice Deanship of Scientific Research Chairs and by Research Chair of Prince Sultan Bin Abdulaziz International Prize for Water.

Institutional Review Board Statement

Not applicable.

Informed Consent Statement

Not applicable.

Data Availability Statement

Not applicable.

Acknowledgments

The authors extend their appreciation to the Deanship of Scientific Research, King Saud University for funding through the Vice Deanship of Scientific Research Chairs and to the Research Chair of Prince Sultan Bin Abdulaziz International Prize for Water.

Conflicts of Interest

The authors declare no conflict of interest.

References

  1. Benavidez, R.; Jackson, B.; Maxwell, D.; Norton, K. A review of the (Revised) Universal Soil Loss Equation ((R) USLE): With a view to increasing its global applicability and improving soil loss estimates. Hydrol. Earth Syst. Sci. 2018, 22, 6059–6086. [Google Scholar] [CrossRef] [Green Version]
  2. Kim, J.B.; Saunders, P.; Finn, J.T. Rapid assessment of soil erosion in the Rio Lempa Basin, Central America, using the universal soil loss equation and geographic information systems. Environ. Manag. 2005, 36, 872–885. [Google Scholar] [CrossRef] [PubMed]
  3. Ganasri, B.P.; Ramesh, H. Assessment of soil erosion by RUSLE model using remote sensing and GIS-A case study of Nethravathi Basin. Geosci. Front. 2016, 7, 953–961. [Google Scholar] [CrossRef] [Green Version]
  4. Prasannakumar, V.; Shiny, R.; Geetha, N.; Vijith, H.J.E.E.S. Spatial prediction of soil erosion risk by remote sensing, GIS and RUSLE approach: A case study of Siruvani river watershed in Attapady valley, Kerala, India. Environ. Earth Sci. 2011, 64, 965–972. [Google Scholar] [CrossRef]
  5. Abdo, H.; Salloum, J. Mapping the soil loss in Marqya basin: Syria using RUSLE model in GIS and RS techniques. Environ. Earth Sci. 2017, 76, 114. [Google Scholar] [CrossRef]
  6. Negese, A.; Fekadu, E.; Getnet, H. Potential Soil Loss Estimation and Erosion-Prone Area Prioritization Using RUSLE, GIS, and Remote Sensing in Chereti Watershed, Northeastern Ethiopia. Air Soil Water Res. 2021, 14, 1178622120985814. [Google Scholar] [CrossRef]
  7. Medhioub, E.; Bouaziz, M.; Bouaziz, S. Assessment of Soil Erosion by Water Using RUSLE, Remote Sensing and GIS in Gabes Coast-Southern Tunisia: Study Case of Oued El Sourrag Watershed. In Euro-Mediterranean Conference for Environmental Integration; Springer: Cham, Switzerland, 2017; pp. 1805–1806. [Google Scholar]
  8. Baskan, O.; Cebel, H.; Akgul, S.; Erpul, G. Conditional simulation of USLE/RUSLE soil erodibility factor by geostatistics in a Mediterranean Catchment Turkey. Environ. Earth Sci. 2010, 60, 1179–1187. [Google Scholar] [CrossRef]
  9. Khan, A.; Govil, H. Evaluation of potential sites for soil erosion risk in and around Yamuna River flood plain using RUSLE. Arab. J. Geosci. 2020, 13, 707. [Google Scholar] [CrossRef]
  10. Pal, S.C.; Shit, M. Application of RUSLE model for soil loss estimation of Jaipanda watershed, West Bengal. Spat. Inf. Res. 2017, 25, 399–409. [Google Scholar] [CrossRef]
  11. Ghosh, A.; Maiti, R. Soil erosion susceptibility assessment using logistic regression, decision tree and random forest: Study on the Mayurakshi river basin of Eastern India. Environ. Earth Sci. 2021, 80, 328. [Google Scholar] [CrossRef]
  12. Sikdar, P.K.; Dey, S.; Ghosal, U.; Chakraborty, S. Development and Management of Base Flow of a Sand-dominated Alluvial Aquifer of a Large Ephemeral River for Drinking Water Supply in Semi-arid and Fluoride Affected Areas: Example of the River Mayurakshi, Birbhum District, West Bengal, India. J. Geol. Soc. India 2019, 94, 249–259. [Google Scholar] [CrossRef]
  13. Chowdary, V.M.; Ramakrishnan, D.; Srivastava, Y.K.; Chandran, V.; Jeyaram, A. Integrated water resource development plan for sustainable management of Mayurakshi watershed, India using remote sensing and GIS. Water Resour. Manag. 2009, 23, 1581–1602. [Google Scholar] [CrossRef]
  14. Sidi Almouctar, M.A.; Wu, Y.; Zhao, F.; Dossou, J.F. Soil Erosion Assessment Using the RUSLE Model and Geospatial Techniques (Remote Sensing and GIS) in South-Central Niger (Maradi Region). Water 2021, 13, 3511. [Google Scholar] [CrossRef]
  15. Ahmed, G.B.; Shariff, A.R.M.; Balasundram, S.K.; Abdullah, A.F.B. Estimation of soil loss in Seremban, Malaysia using GIS and remote sensing technique. IOP Conf. Ser. Earth Environ. Sci. 2018, 169, 012062. [Google Scholar] [CrossRef]
  16. Uddin, K.; Murthy, M.S.R.; Wahid, S.M.; Matin, M.A. Estimation of Soil Erosion Dynamics in the Koshi Basin Using GIS and Remote Sensing to Assess Priority Areas for Conservation. PLoS ONE 2016, 11, e0150494. [Google Scholar] [CrossRef] [Green Version]
  17. Thapa, P. Spatial estimation of soil erosion using RUSLE modeling: A case study of Dolakha district, Nepal. Environ. Syst. Res. 2020, 9, 15. [Google Scholar] [CrossRef]
  18. Adediji, A.; Tukur, A.M.; Adepoju, K.A. Assessment of revised universal soil loss equation (RUSLE) in Katsina area, Katsina state of Nigeria using remote sensing (RS) and geographic information system (GIS). Iran. J. Energy Environ. 2010, 1, 255–264. [Google Scholar]
  19. Kumar, S.; Hole, R.M. Geospatial modelling of soil erosion and risk assessment in Indian Himalayan region—A study of Uttarakhand state. Environ. Adv. 2021, 4, 100039. [Google Scholar] [CrossRef]
  20. Pal, S. Impact of Massanjore dam on hydro-geomorphological modification of Mayurakshi river, Eastern India. Environ. Dev. Sustain. 2016, 18, 921–944. [Google Scholar] [CrossRef]
  21. Karaburun, A. Estimation of C factor for soil erosion modeling using NDVI in Buyukcekmece watershed. Ozean J. Appl. Sci. 2010, 3, 77–85. [Google Scholar]
  22. Jabbar, M.T. Application of GIS to estimate soil erosion using RUSLE. Geo-Spat. Inf. Sci. 2003, 6, 34–37. [Google Scholar] [CrossRef] [Green Version]
  23. Haan, C.T.; Barfield, B.J.; Hayes, J.C. Design Hydrology and Sedimentology for Small Catchments; Elsevier: Amsterdam, The Netherlands, 1994. [Google Scholar]
  24. Meusburger, K.; Steel, A.; Panagos, P.; Montanarella, L.; Alewell, C. Spatial and temporal variability of rainfall erosivity factor for Switzerland. Hydrol. Earth Syst. Sci. 2012, 16, 167–177. [Google Scholar] [CrossRef]
  25. Duarte, L.; Teodoro, A.C.; Gonçalves, J.A.; Soares, D.; Cunha, M. Assessing soil erosion risk using RUSLE through a GIS open source desktop and web application. Environ. Monit. Assess. 2016, 188, 351. [Google Scholar] [CrossRef] [PubMed]
  26. Liu, B.Y.; Nearing, M.A.; Risse, L.M. Slope gradient effects on soil loss for steep slopes. Trans. ASAE 1994, 37, 1835–1840. [Google Scholar] [CrossRef]
  27. Rahaman, S.A.; Aruchamy, S.; Jegankumar, R.; Ajeez, S.A. Estimation of annual average soil loss, based on RUSLE model in Kallar watershed, Bhavani basin, Tamil Nadu, India. ISPRS Ann. Photogramm. Remote Sens. Spat. Inf. Sci. 2015, 2, 207–214. [Google Scholar] [CrossRef] [Green Version]
  28. Chakrabortty, R.; Pal, S.C.; Sahana, M.; Mondal, A.; Dou, J.; Pham, B.T.; Yunus, A.P. Soil erosion potential hotspot zone identification using machine learning and statistical approaches in eastern India. Nat. Hazards 2020, 104, 1259–1294. [Google Scholar] [CrossRef]
  29. Taye, G.; Vanmaercke, M.; Poesen, J.; van Wesemael, B.; Tesfaye, S.; Teka, D.; Nyssen, J.; Deckers, J.; Haregeweyn, N. Determining RUSLE P- and C-factors for stone bunds and trenches in rangeland and cropland, North Ethiopia. Land Degrad. Dev. 2018, 29, 812–824. [Google Scholar] [CrossRef]
  30. Singh, G.; Panda, R.K. Grid-cell based assessment of soil erosion potential for identification of critical erosion prone areas using USLE, GIS and remote sensing: A case study in the Kapgari watershed, India. Int. Soil Water Conserv. Res. 2017, 5, 202–211. [Google Scholar] [CrossRef]
  31. Fiener, P.; Dost’al, T.; Kr’asa, J.; Schmaltz, E.; Strauss, P.; Wilken, F. Operational USLE-based modelling of soil erosion in Czech Republic, Austria, and Bavaria–differences in model adaptation, parametrization, and data availability. Appl. Sci. 2020, 10, 3647. [Google Scholar] [CrossRef]
  32. Tsegaye, L.; Bharti, R. Soil erosion and sediment yield assessment using RUSLE and GIS-based approach in Anjeb watershed, Northwest Ethiopia. SN Appl. Sci. 2021, 3, 582. [Google Scholar] [CrossRef]
Figure 1. Location map of Mayurakshi river basin.
Land 12 00116 g001
Figure 2. Elevation map of the study area.
Land 12 00116 g002
Figure 3. Methodology flowchart of the study.
Land 12 00116 g003
Figure 4. Rainfall map of study area.
Land 12 00116 g004
Figure 5. Rainfall Erosivity Factor (R) map.
Land 12 00116 g005
Figure 6. Soil map (derived from FAO soil).
Land 12 00116 g006
Figure 7. Soil erodibility factor (K) map.
Land 12 00116 g007
Figure 8. Slope map of the study area.
Land 12 00116 g008
Figure 9. Topographic Factor (LS) map.
Land 12 00116 g009
Figure 10. Cover management factor (C) map.
Land 12 00116 g010
Figure 11. Support Practice Factor (P) map.
Land 12 00116 g011
Figure 12. Soil erosion probability map.
Land 12 00116 g012
Table 1. Overview of data source.
Sl. No.Data TypeSourceDescription
1.Digital elevation modelhttps://earthexplorer.usgs.gov/ (accessed on 27 October 2020)SRTM DEM
2.Satellite imagewww.bhuvan.nrsc.gov.in (accessed on 13 October 2020)LISS-3 image
3.Soil dataFAO, UNDigital soil map of the world
4.Rainfall dataIndian Meteorological
Department, India
Rainfall Data (2020)
Table 2. LULC wise Conservation Practice value.
LU/LC ClassConservation Practice (P)
Agriculture0.6
Forest0.8
Fallow Land1
River0.1
Water Bodies0
Medium Scrub and Trees0.8
Open Scrub0.9
Open Mixed Forest0.9
Settlement0.4
Barren Land1
Disclaimer/Publisher’s Note: The statements, opinions and data contained in all publications are solely those of the individual author(s) and contributor(s) and not of MDPI and/or the editor(s). MDPI and/or the editor(s) disclaim responsibility for any injury to people or property resulting from any ideas, methods, instructions or products referred to in the content.

