Ecosystem Service Use and the Motivations for Use in Central Parks in Three European Cities


1
Computational Landscape Ecology, Helmholtz Centre for Environmental Research—UFZ, 04318 Leipzig, Germany
2
CERNAS, Agrarian Technical School, 3045-601 Coimbra, Portugal
3
Environmental Management Laboratory, Mykolas Romeris University, 08303 Vilnius, Lithuania
*
Author to whom correspondence should be addressed.
Land 2021, 10(2), 154; https://doi.org/10.3390/land10020154
Submission received: 14 January 2021
/
Revised: 29 January 2021
/
Accepted: 30 January 2021
/
Published: 3 February 2021
(This article belongs to the Section Urban Contexts and Urban-Rural Interactions)
Abstract
:The majority of Europeans live in cities, where parks as components of Urban Green Spaces (UGSs) play an important role in well-being and the provision of ecosystem services (ES). UGSs are especially relevant for the implementation of the United Nations (UN) Agenda 2030 Sustainable Development Goals “Good health and wellbeing” (Goal 3) and “Sustainable cities and communities” (Goal 11). This study focused on ES use and users’ motives, which were surveyed during visits at central parks in the cities Leipzig, Coimbra and Vilnius. Park visitors used 17 different ES, dominated by physical interactions such as walking or biking, followed by experiential and aesthetical ES and ES linked to social relations. Age of visitors, cultural setting and distance to homes influenced ES use in the parks differently in each city, limiting the transferability of park—user behaviour or motivations across different spatial and cultural contexts. Results also indicate that aligning sustainability objectives and usability, good accessibility of urban parks plays a central role and encourages the use of non-motorized or public transport for park visits. Concrete information about UGS user motivation and behaviour generated in this and similar studies contributes to convert the UN Agenda 2030 strategies at the municipal level into sustainability and user-oriented design and management of UGS.
1. Introduction
As in other world regions, the majority of Europeans prefer to live in cities, rather than in the countryside or in villages [1]. This leads to the fact that in their daily lives, citizens experience nature frequently in the form of urban nature, which is often anthropogenically modified, contributing to an estrangement from “real” nature [2,3]. Urban nature comprising urban green space (UGS) elements such parks, gardens, brownfields or forests, provides biodiversity and important ecosystem services (ES) contributing to human health, well-being and the quality of urban life [4,5,6,7,8]. Recent studies demonstrate the broad range of UGS development in European cities [9], some of them suggesting that per capita UGS availability and nature-based recreation opportunities are expected to decrease in many cities until 2050 [10,11,12]. Additionally, due to the limited amount of land resources, most governments and municipalities try to avoid sealing ever more land, focusing on a strategy of simultaneous (re)densification of urban housing in combination with developing UGS (through upgrading and connecting sites) [13,14]. In growing cities, UGS is urgently needed to provide biodiversity and ES to increase resilience against climate change and extreme events and provide adequate and equitable facilities for the wellbeing of multiple urban social groups contributing to the United Nation’s Sustainable Development Goals “Good health and wellbeing” (Goal 3) and “Sustainable cities and communities” (Goal 11) [15,16,17,18]. To assess these multiple UGS-related challenges, science, policy and administration need information on their ES potential, ES demand and especially on actual ES use.
Many studies have been focusing on green spaces at regional and national scales to assess ES potential and demand [19,20,21,22], partial ES, such as recreation [23,24,25], or ES preferences [26,27]. The focus on the local scale, UGS has been far more limited and recent studies analyse potential ES in peri-urban areas [28], recreational ES in cities [29,30], provisioning ES in urban forests [31] and social valuation of regulating and cultural ES in an urban forest [32]. Urban parks are key components of UGS both because they are prominent places in which urban citizens relate with nature in cities [33] and because of the wide number of regulating and cultural ES they provide when compared to other UGS types [34]. Furthermore, a very limited number of studies mapped the actual use of provisioning, regulating and cultural ES, for example, via directly observing or interviewing visitors of specific a UGS [35,36,37]. The reason for stressing these subtle differences is that on the one hand ES potential, motivations to use ES, stated ES preferences and on the other hand actual use may substantially differ. As such, all types of information including cross-country and cross-city comparative studies, as well as an expansion to a wider range of ES, are needed to improve our understanding of human-nature interactions in urban environments and to enable adequate and sustainable UGS management and planning [38,39].
The demand for ES and, consequently, its use, is influenced by different sets of factors [39]. These factors may refer to availability and size (spatial factors), or green and grey features of the various UGS types. Availability describes the location of the UGS, its proximity to peoples’ homes and accessibility [40]. Urban parks which are accessible and close to home are used more frequently [41,42]. Other influencing factors having an effect on visitor motivation and UGS use are grey facilities for different activities (benches, sport facilities, trails), maintenance as well as green features such as large trees, tree cover and landscape elements [36,43,44]. Another important group of factors is related to socio-demographic characteristics of potential UGS users including different cultural settings and personal backgrounds such as age, gender or education, which can affect ES demand and the use of UGS [45,46]. The combination of factors may affect users’ motivations and preferences, shape urban ES demands and influence the (dis)satisfaction with available UGS [42,47,48].
Only a few previous studies, however, compare different UGS users, their motives and preferences for mostly cultural ES in multiple cities [49,50,51]. Previous studies demonstrate that ES use, activities and user motives in UGS show some universal patterns, confirming the importance of naturalness and greenness of UGS for recreation across different cultural settings and age groups in Asia, Europe and North America [46,52,53,54,55]. While many of the studies addressing user ES preferences focus on the assessment of cultural ES [50,56,57], we argue that a broader range of provisioning, regulating and cultural ES needs to be studied to better understand ES user behaviour to derive recommendations for the management and design of multifunctional UGS. Comparative studies, simultaneously assessing driving factors, a broad range of ES uses, motives and perceptions of different user groups across Europe (or other regions) such as Terkenli et al. [58], are currently lacking and the study presented here intends to contribute to filling this research gap [59].
In this paper, we integrate the analysis of spatial (distance to people’s home) and socio-demographic (age group, cultural setting) factors to assess their influence for ES uses and the motivations across the central parks in three European cities.
To answer the questions above, we interviewed 860 visitors of central urban parks in the three European cities: Coimbra (Portugal), Leipzig (Germany) and Vilnius (Lithuania). Results provide new insights into urban human-nature relationships of different user groups in these European cities and may contribute to support nature and user-oriented sustainable management and planning of UGS.
2. Material and Methods
2.1. Case Studies and Study Sites
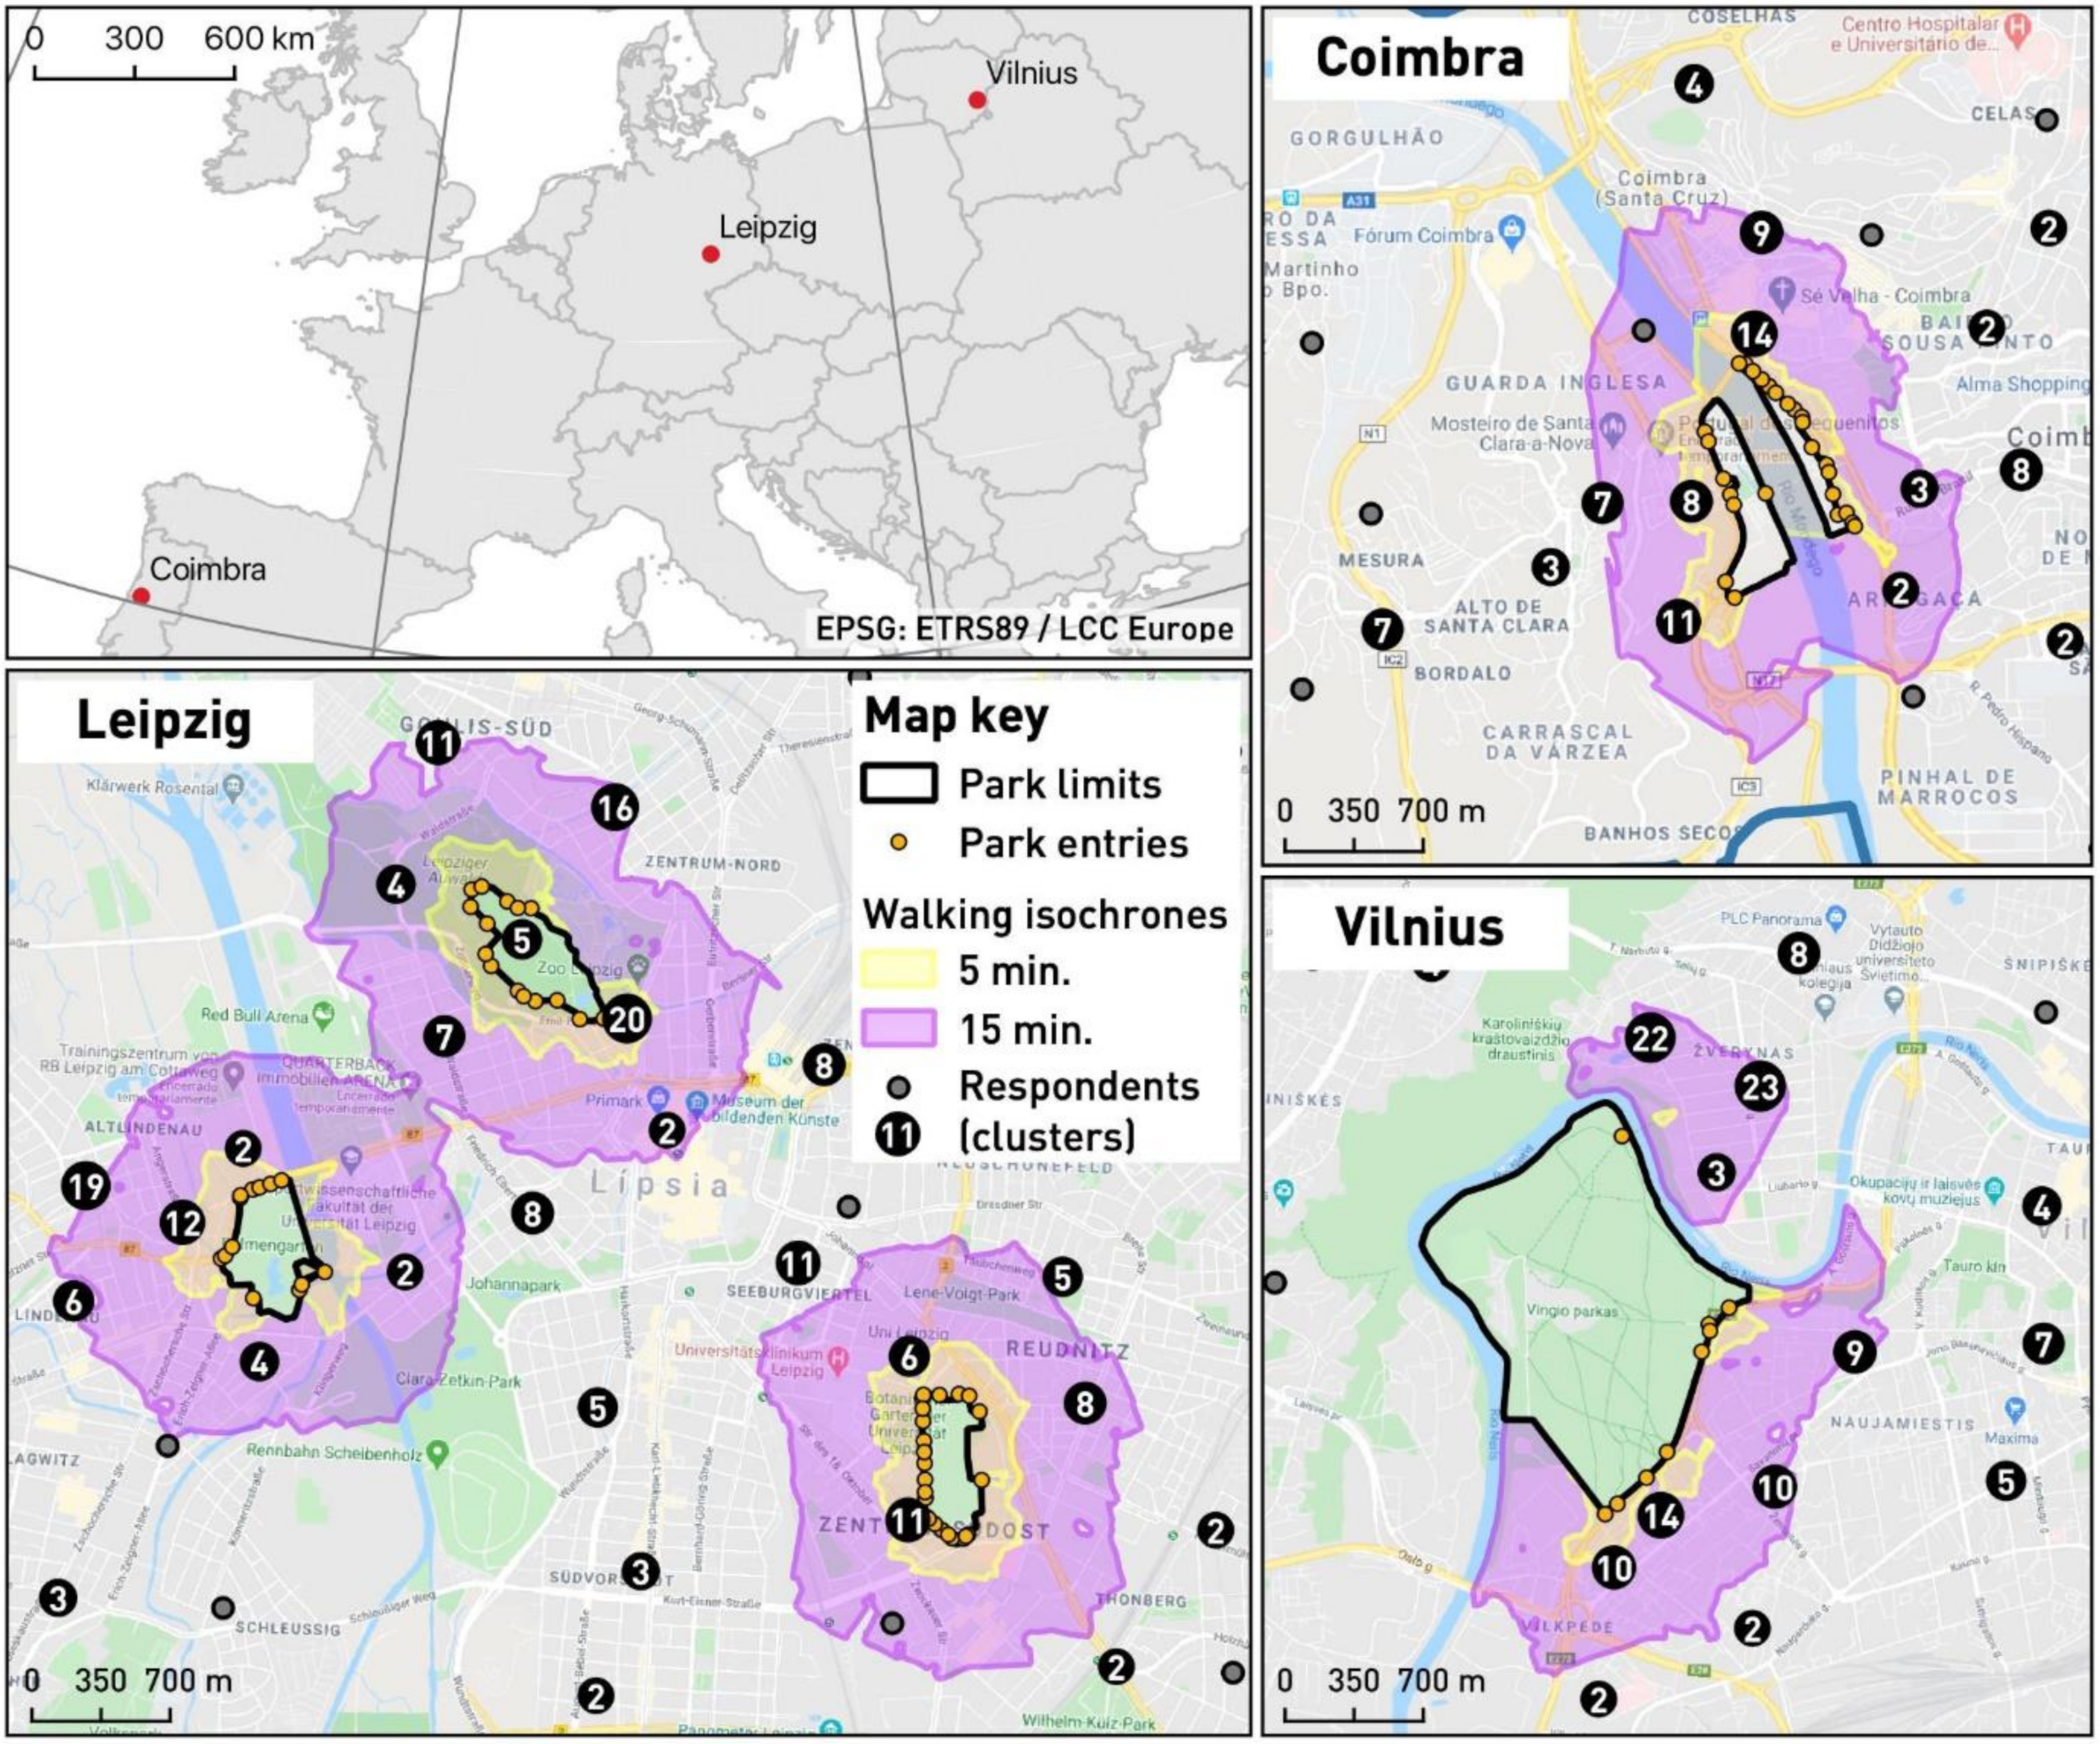
The three cities are case studies of the BiodivERsA funded project UrbanGaia evaluating UGS performance in order to maintain, manage and create resilient and functioning green and blue infrastructure in cities. Within the project, an indicator framework for the evaluation of UGS’s multiple benefits was developed and the implementation (potential) in city governments was assessed [60]. In a comparative analysis, the present study complements the findings on performance indicators by analysing actual ecosystem service use in key UGSs of three European cities. The three cities represent a range of climates, socio-economic and cultural conditions in South-western, Central and North-eastern Europe (Table 1). All interviews with users were carried out in central urban parks, that is, all in the same UGS type. In Coimbra and Vilnius, the role of UGS is covered by single, large public parks, while in Leipzig the role is covered by three smaller central parks (Figure 1). All analysed parks are located near the city centres, accessible by foot, public and individual transport, and provide resting and picnic opportunities, sports facilities and playgrounds. Parks in all three cities include monuments or statues, as well as freshwater elements, but only in Coimbra are boating facilities available.
2.1.1. Coimbra
Located in the Mediterranean hot summer climate zone [61], Coimbra is the biggest city in the Portuguese Centro region. Its population has been slowly declining since 2001, following the national trend. The old city centre is very compact, and the urban area itself has a rather small area of UGS. Its medieval centre is surrounded by several areas of expansion, accompanied by a variety of UGS representing the preferences of different generations for leisure, recreation and relations to nature, including one of the oldest botanical gardens worldwide. The river Mondego plays a major role in the connection and implementation of the urban green and blue infrastructure of the city.
2.1.2. Leipzig
Leipzig is located in the state of Saxony in the eastern part of Germany, with a warm moderate continental climate [61]. After massive population losses following the German reunification in 1990, the trend turned in 2012, nowadays Leipzig being one of the fastest growing cities in Germany, with currently ~2% population growth p.a. [62]. Thousands of brownfields are (often unofficially) used as additional or alternative areas providing ES and physical space for activities, reducing the increasing pressure on public parks and other UGS [35,36]. During recent years, park authorities increasingly collaborated with citizens’ initiatives sharing space and supporting cultural, integration and gardening activities such as the edible city.
2.1.3. Vilnius
The capital of Lithuania, Vilnius registers a humid continental climate [61]. It is the only growing city in the country [63] with stable growth every year since 2011 [64]. According to the upcoming city master plan, the majority of the city will be covered with some type of green spaces, such as parks and urban forests [65]. More than 17% of the city is protected.
2.2. Survey Design and Assessment of Ecosystem Services
In each city, we aimed at interviewing 200–300 park users, interviewed in four time slots from 8 to 11 (morning), 11 to 14 (noon), 14 to 17 (afternoon) and 17to 20 (evening). The interviews were carried out under fair weather conditions (no rain) covering each time slot at least twice.
The survey was based on the participatory mapping approach of the smartphone application MapNat which was adapted and amplified during the UrbanGaia project (http://urbangaia.eu/MapNat (accessed on 1 February 2021)). The smartphone app is designed as a citizen science tool in which people can locate their use of ES [66,67]. In both the app and the survey, we used the term “use of nature” instead of ES to avoid difficulties with scientific terminology. Selectable ES are influenced by “classical” functional or nature-oriented categorizations such as the Common International Classification of Ecosystem Services (CICES) and Nature’s Contributions to People (NCP) [68,69].
For the purpose of this paper, we established a paper-based survey in each local language including questions about the actually used ES, and motivation of ES use in the specific urban park (see Supplementary Materials Table S1 for the English version of the survey). At the end of the survey, respondents were asked for socio-demographic data (age, gender, place of residence or place of work if asked during breaks). The ES list and categorisation used in the survey was based on the ES list implemented in the MapNat app.
2.3. Data Analysis
All survey data were digitised, translated into English and processed with R (version 3.6.1). Results were then analysed with the following statistical procedures implemented in different R packages. All descriptive statistics are visualised with the “ggplot2” package [70].
To describe the influence of the proximity of UGS towards ES use, we calculated travel time of each respondent from their place of residence or work. The analysis of travel time to assess the areas located in 5-min and 15-min walking distance to park entrances was performed with QGIS plugin QNEAT3, using Geofabrik OSM road network data for all three cities. Walking distances of 300 m and 900 m, corresponding to approximately 5 min and 15 min walking time, are values which are considered in the context of access to UGS [71,72,73]. Respondents were grouped into age groups: Kids and young adults (14 y–30 y), adults (31 y–64 y) and older visitors (seniors) (65 + y) following Jim and Chen [74].
Non-parametric Kruskal–Wallis one-way analysis of variance was applied followed by pairwise comparisons with the Wilcoxon rank sum from the “dplyr” package in R to test differences in distances travelled between cities. Chi-square tests of independence including their Pearson’s residuals for each factor level were applied to test differences for motivation categories and means of transport between age groups as well as between the three cities.
3. Results
Below we present results of the assessment of actual ES use and motivation of visitors of different age and city, as well as the spatial factor distance, including the means of transport used for the park visits.
3.1. ES Use in Cities
Participants stated the use of 12 different ES in Coimbra, 15 ES in Leipzig and 7 ES in Vilnius (Table 2). Most ES were assessed in all three cities except boating, only available in Coimbra, and gardening, only in Leipzig. Physical interactions such as walking (the dog) or biking were predominant ES uses in all parks: over 80% of all uses in both Coimbra and Vilnius, and 61% in Leipzig. A smaller proportion of citizens in all parks made use of experiential and aesthetical ES (over 11% of total use) or used the parks for social relations (6.5% of all uses). While three out of four ES groups (experiential and aesthetical ES, physical interactions and social relations) were reported from all three cities, the use of regulating (e.g. shade provision or noise reduction), as well as provisioning ES (e.g. using plants for food), were only reported from Leipzig (16% of uses).
3.2. ES Use of Different Age Groups
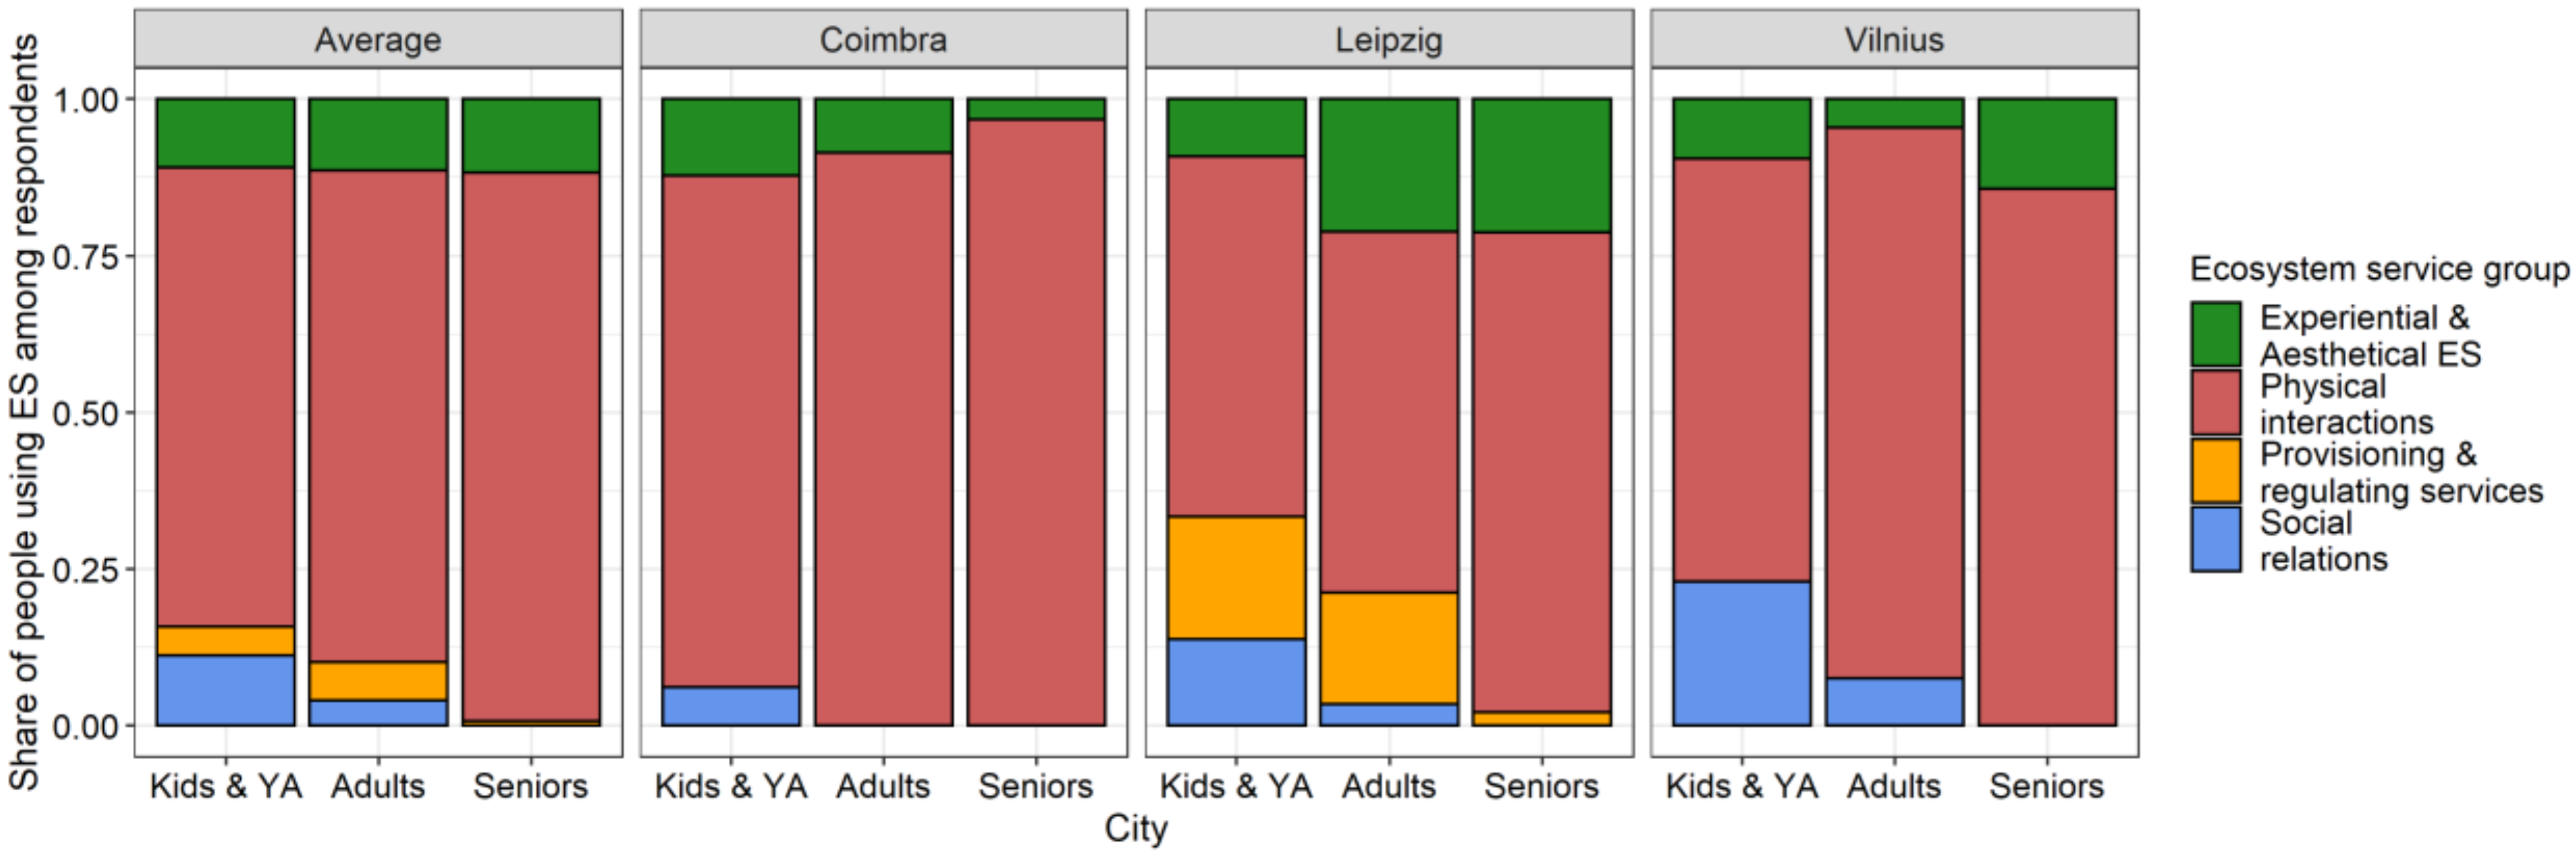
Physical interactions were the predominant ES use in all age groups across the three European cities (Figure 2): the highest degree was seen in Coimbra, followed by Vilnius and Leipzig. In Coimbra mainly younger people were interested in aesthetical use, contrasting the mainly older proportion of park users in Leipzig and the young and older in Vilnius. A third group comprising provisioning and regulating ES was mainly used by young and middle-aged citizens in Leipzig, but almost neglected by elders and not used at all in the other cities. In all three cities, younger people reported park use for social relations much more often than adults and older persons.
3.3. Distances Travelled by Park Visitors and Means of Transport Used
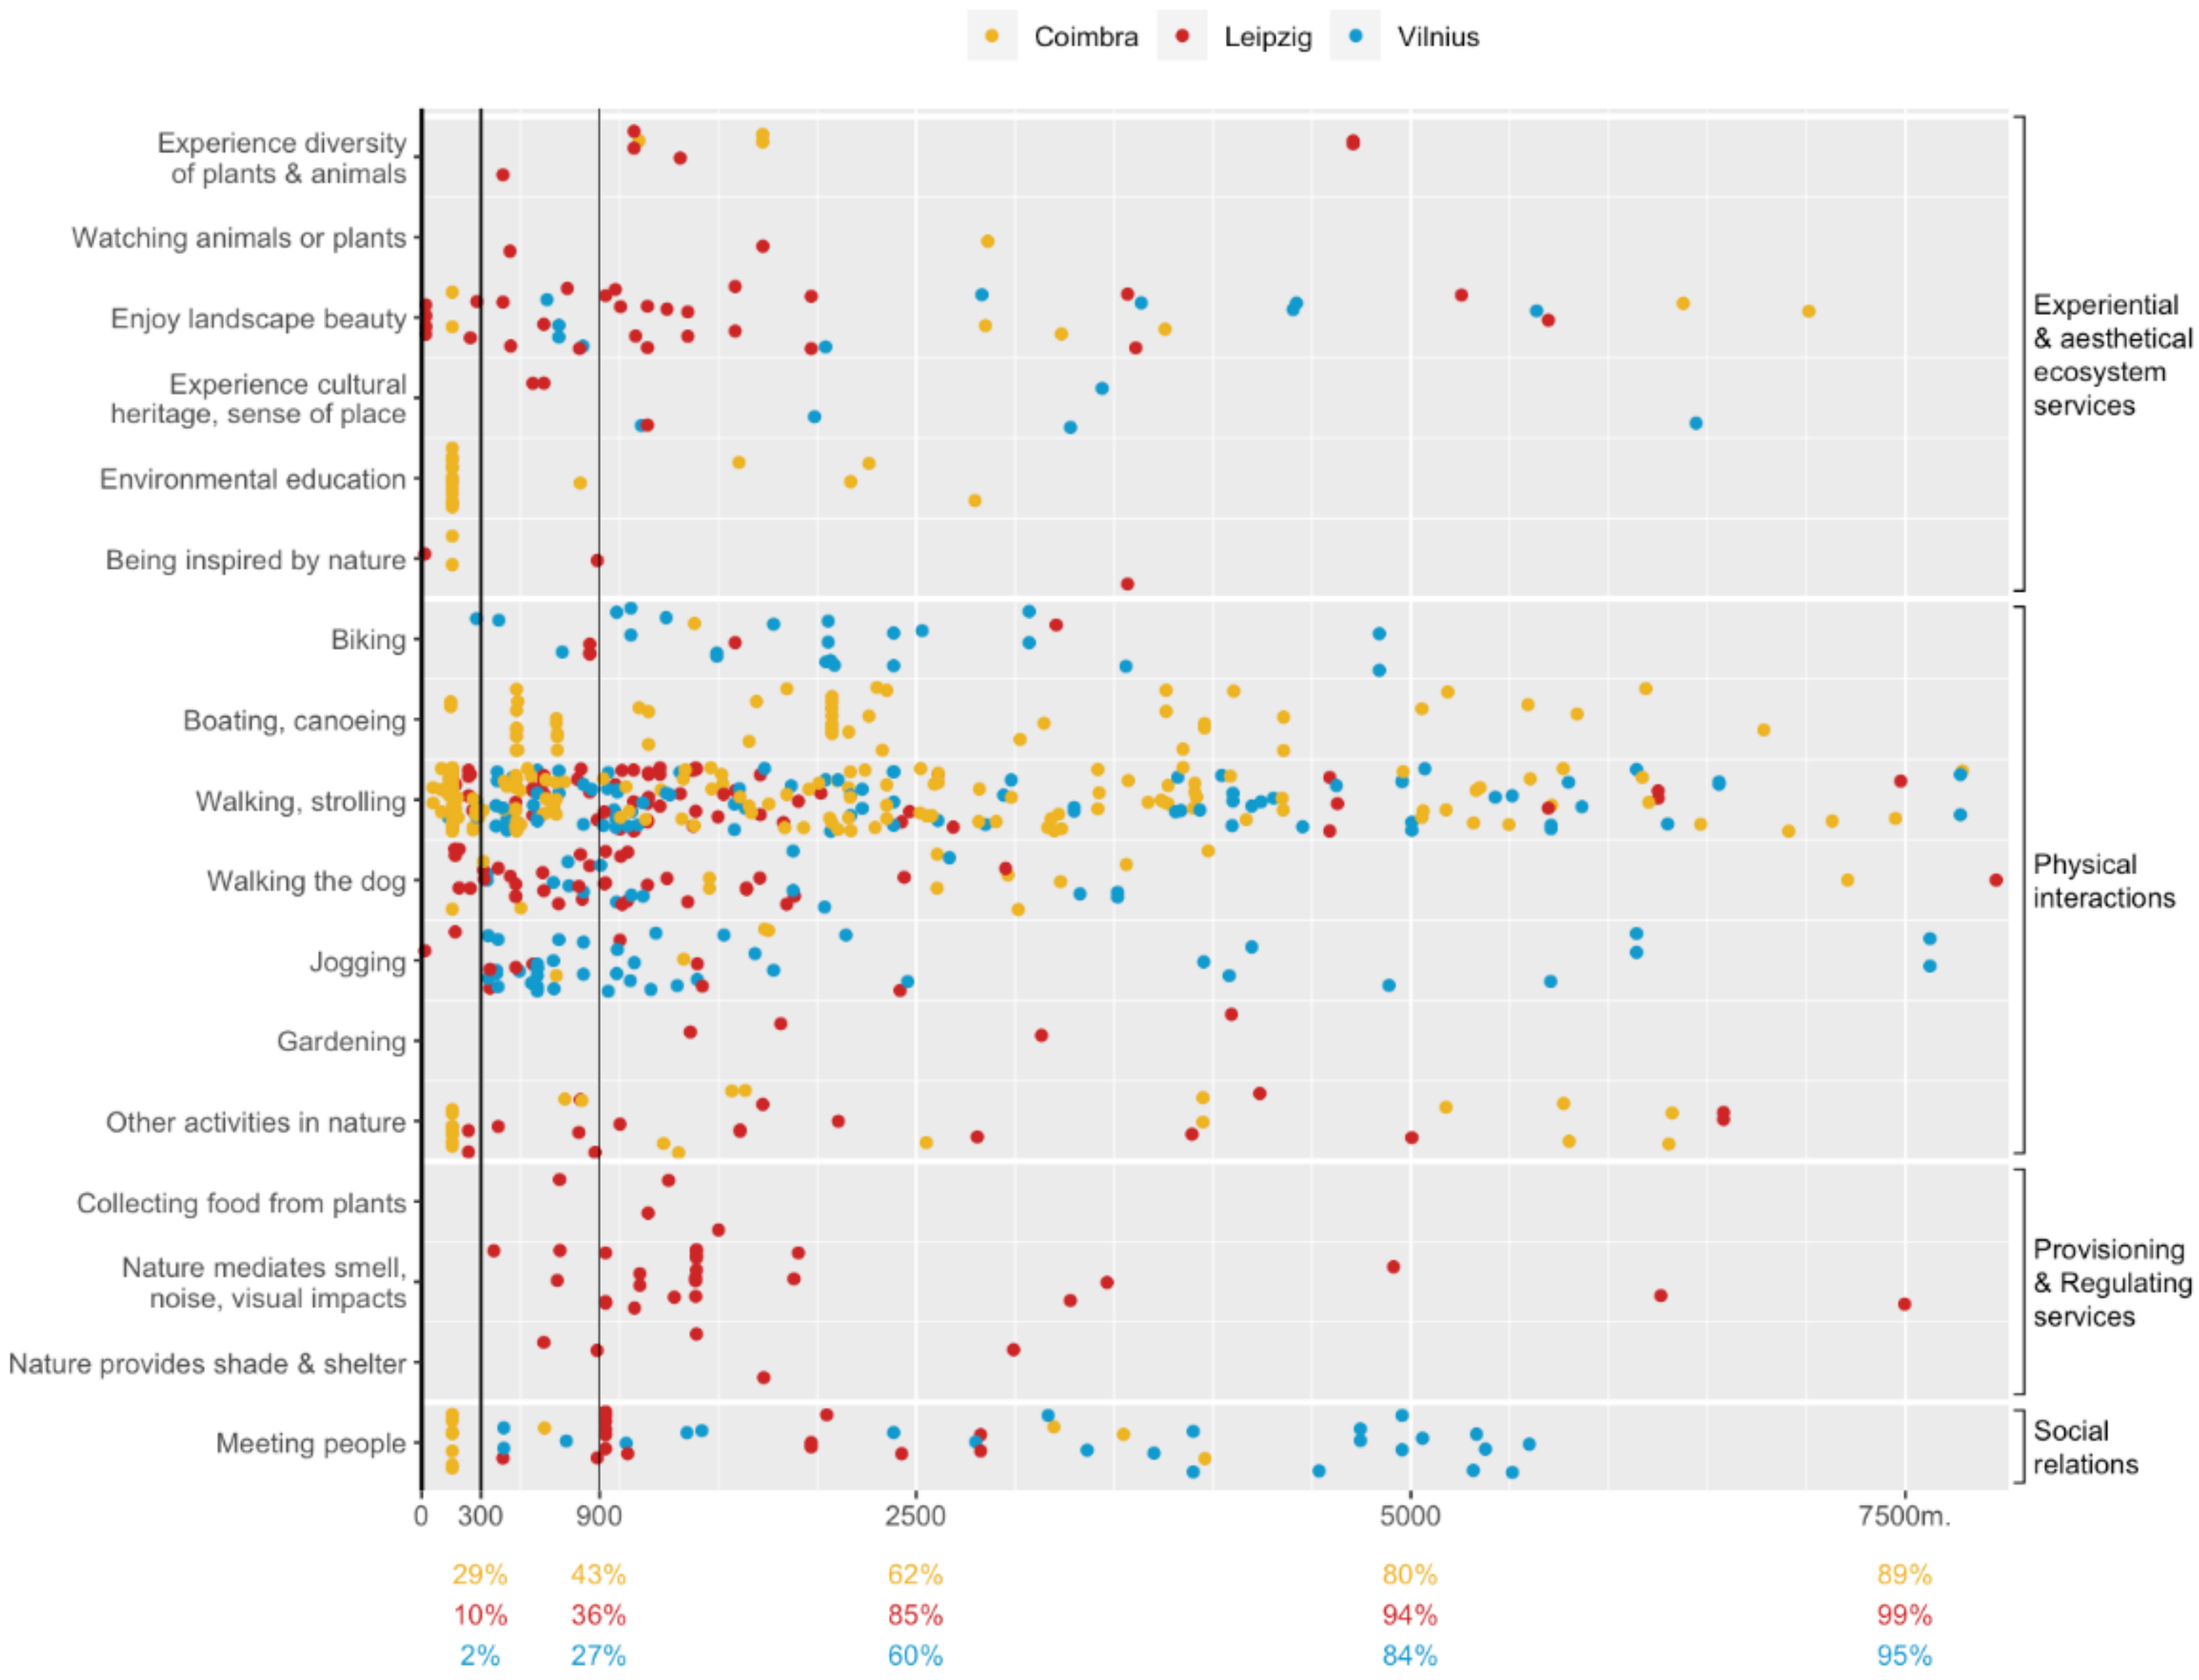
Travel distances of park users showed differences and common patterns between ES uses as well as between cities. A Kruskal–Wallis test showed a significant difference between cities (p < 0.001) in the average distances travelled. Pairwise comparisons show that respondents from Vilnius travelled significantly larger distances than visitors in Leipzig and Coimbra. In Coimbra and Leipzig, at least one-third of visitors travelled 900 m or less, while in Vilnius most park users travelled 0.9 km to 5 km. At least 60% of visitors in all three cities travelled up to 2.5 km, while at least 90% travelled up to 5 km to reach their destination. At the ES level, differences were analysed qualitatively because several ES were either not relevant in all cities (e.g., environmental education, gardening) or had numbers too low for statistical analysis (e.g., diversity of plants or inspired by nature). For most ES uses, including major activities such as walking (the dog), Vilnius and Leipzig visitors seemed to prefer short distances (Figure 3). Citizens seeking noise reduction, enjoying landscape beauty or gardening travelled larger distances in Leipzig, similar to citizens enjoying physical interaction or seeking social relations in Vilnius.
Most citizens in all three cities used individual transportation to reach the parks, and only a minority used public transport (ranging from 6% in Coimbra to 10% in Leipzig and Vilnius). Walking was the dominant way of accessing the parks in the three cities, but with a significant difference between Leipzig—almost 70% of users arrived by foot—and the other two cities—less than 50% arrived by foot. Chi-square test reveals significant differences in means of transport specified by respondents (p < 0.001). The number of people arriving by car was considerably higher in Coimbra, while the number of people arriving by foot or bike was much lower compared to the other cities (see Pearson’s residuals in Supplementary Materials Table S2). Mostly cars were used to cover larger distances, followed by public transport, being the second most common means of transportation, although only 7% of the users in Leipzig arrived by car, compared to 28% in Vilnius and 46% in Coimbra. A very prominent difference between cities was bikers, mostly absent in Coimbra (0.3%), but representing considerable proportions of users in Leipzig (14%) and Vilnius (13%). Non-motorized means like bikes and walking were mostly used for distances up to 5 km, walking dominating up to 900 m, corresponding to 15-min walking time (see Figure 1 for 5-min and 15-min walking isochrones). See Supplementary Materials Figure S1.
3.4. Motivation of Users and Factors Influencing Motivation
3.4.1. Motivations in Cities
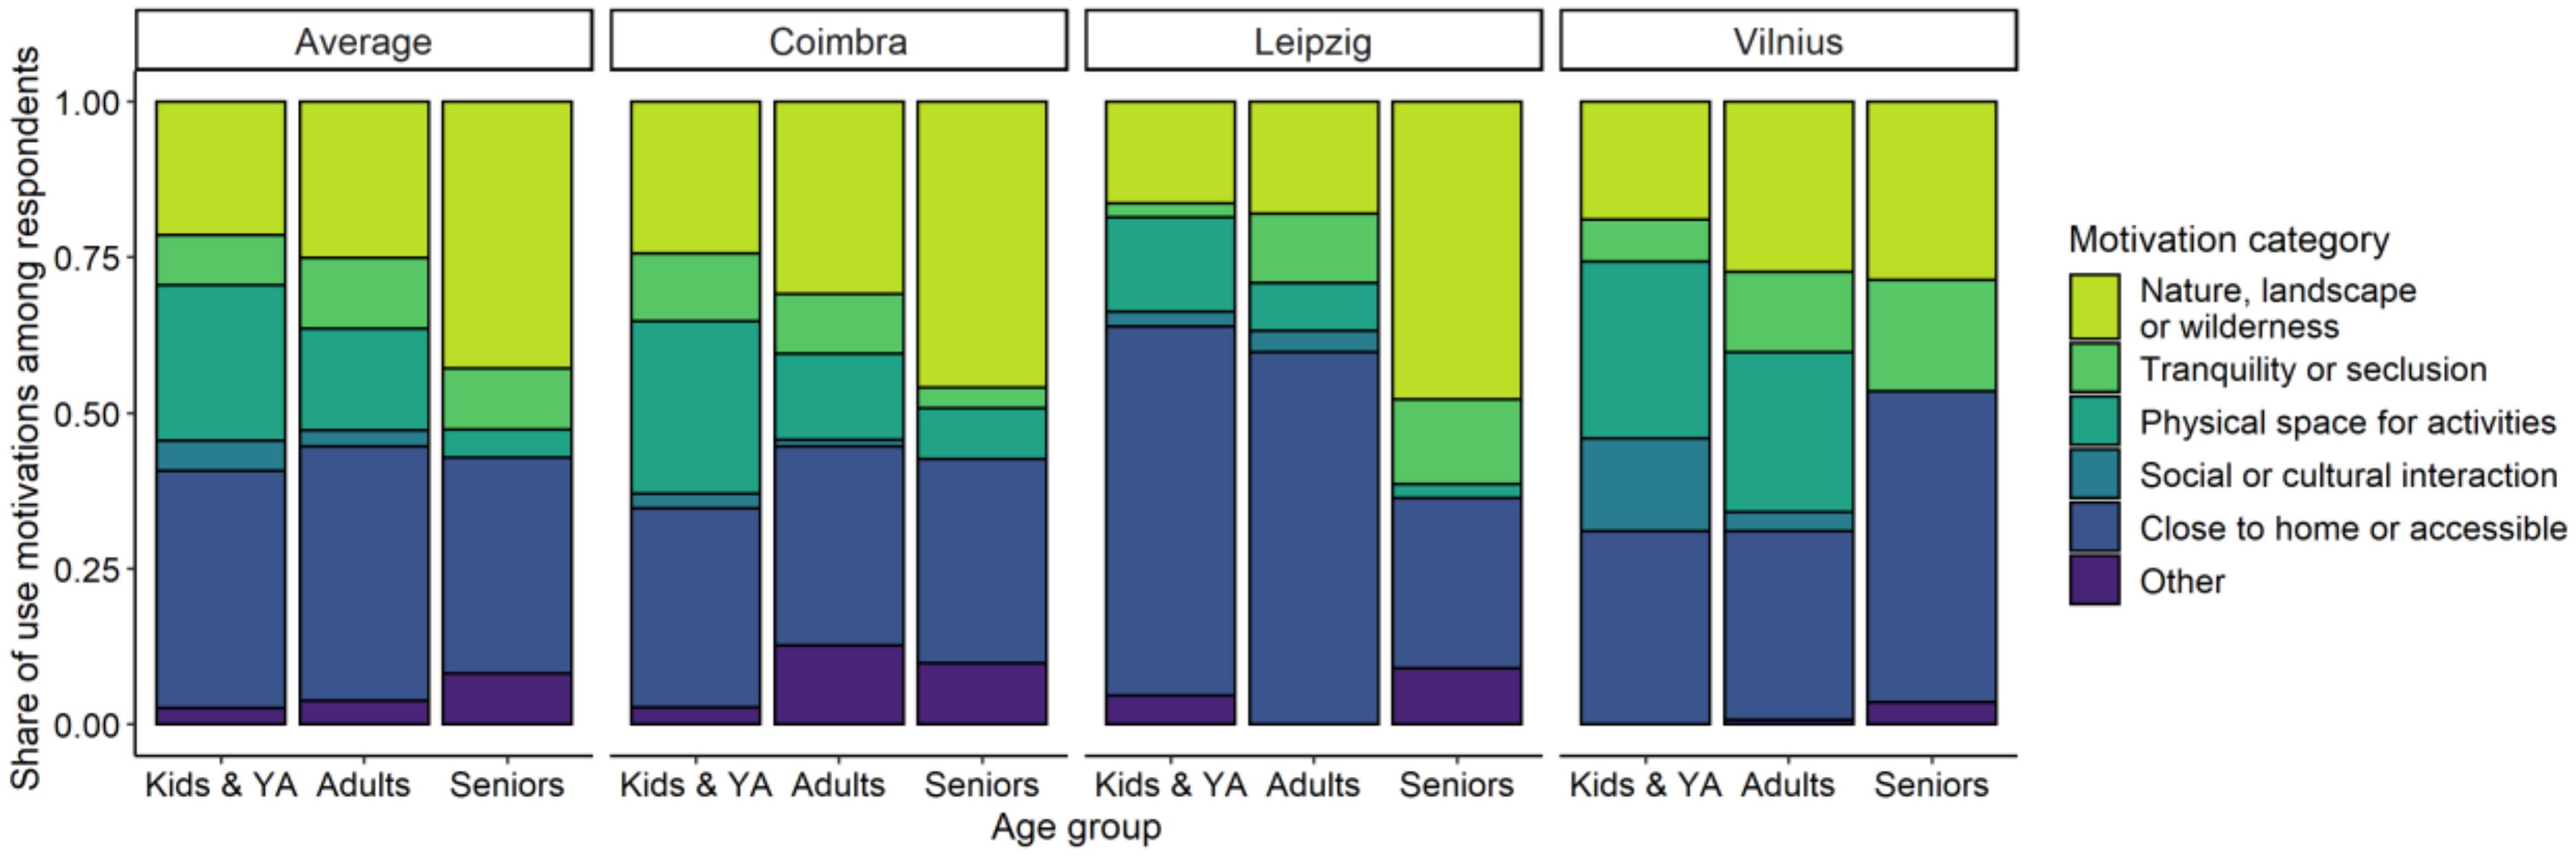
Park users were asked for their motivations for choosing this park for the specified ES. Unlike ES use dominated by physical interactions, no dominant motivation for ES use was identified. As Figure 4 and the results of the chi-square test illustrate, motivations for park visits significantly varied (p < 0.001) between the three cities. The motivation category “close to home or accessible” was especially prominent in Leipzig and “social or cultural interactions” in Vilnius (Supplementary Materials Table S3).
3.4.2. Motivations of Different Age Groups
Overall, the most frequent motivation was proximity (close to home or accessible) mentioned by young and adult Leipzig park visitors, and by seniors in Vilnius. The availability of physical space for activities motivated more younger than older users, while for motivations related to nature, landscape or wilderness, it was the other way round, that is, older visitors were a lot more motivated by these aspects. The chi-square test confirms these findings with significant results (p < 0.001), showing highest variation between age groups for the two motivation categories “nature, landscape or wilderness” and “physical space for activities” (Supplementary Materials Table S4). The motivation “tranquillity or seclusion” seemed to be important for adults and seniors in Vilnius and Leipzig, but less in Coimbra. The authors were surprised that the motivation “social or cultural interaction” played a minor role for young adults and adult visitors (except for young adults in Vilnius) and was almost neglected by seniors.
4. Discussion
4.1. Approach
In this study, we focused on parks covering broad socio-environmental gradients in Europe [50,58] playing a central role in each city while providing a high degree of common park features to ensure comparability (e.g., location, size, landscape elements). We argue that integrative approaches linking the assessment of influencing factors with the assessment of user motivations and use of UGS can substantially contribute to increasing our understanding of ES and UGS use, also transferable to rural or natural environments.
4.2. Urban ES Uses and Factors Influencing Them
Consistent with similar studies [74], park visitors in our analysis overall used 17 different ES, with physical interactions being predominant. While only two physical interactions were exclusive to one of the cities (“boating” in Coimbra and “gardening” in Leipzig), total numbers of ES used in each city showed clear differences, with visitors in Vilnius using less different ES (7) than visitors in Coimbra (12) and Leipzig (15). As park features were comparable, we assume cultural preferences for (or against) the use of specific ES in different parts of Europe. It was surprising that only in Leipzig 16% of visitors mentioned the use of provisioning and regulating ES. This may to a smaller degree be related to the gardening facilities at Palmengarten as part of the “edible city” approach initiated by NGOs [75] and supported by the park administration, facilities not available in Coimbra and Vilnius. However, to a larger degree, we assume cultural preferences in combination with a demand for shade due to the very hot summers of 2018 and 2019 [76], which were less pronounced in Vilnius and Coimbra.
We expected physical interactions to be the most pronounced ES use in the kids and young adults age group and the appreciation of experiential and aesthetical ES to be favoured by seniors. Similar results were reported by Ode Sang et al. [77] who identified that ES related to physical activities, like running, jogging or cycling in UGS decreased with age. In our study, however, physical interactions were most pronounced in the seniors’ age group. The high proportion was mainly characterised by walking activities and resulted from the fact that seniors were less interested than expected in experiential and aesthetical ES, and not at all in social relations. Jim and Chen [74] identified preferences of three age groups for park landscapes and the strongest preference of young adults for a “naturalistic-ecological” style but did not link these preferences to actual ES use. While in this study physical interactions were the predominant ES use, these strong ES preferences were only partly reflected in the stated motivations for park visits, which were dominated by the distance/proximity of UGS motivation.
Previous studies have shown that proximity is a key factor motivating citizens to visit parks or other UGS types [78,79,80], which is consistent with the main motivation for visits “close to home” identified in this study in all three cities, though with large differences between age groups. As shorter distances were mostly covered by foot, biking or public transport, it is considered an advantageous planning and management strategy to maximise UGS availability within 5-to 15-min walking distance either via (increased) accessibility or new UGS locations. However, Vilnius for example, completely lacks park entrances in the north-west and much of the south-west, decreasing accessibility and options for short walking distances, whereas in Coimbra and Leipzig parks are accessible from multiple directions (see Figure 1). Increasing park accessibility may considerably contribute to reducing the use of cars and related emissions for visiting urban parks. Consistent with the main ES uses presented in this study, Kaczynski, Potwarka and Saelens [43] also reported from Ontario, Canada and Campbell, Svendsen, Sonti and Johnson [30] from New York City, NY, USA, physical activities to be the predominant park use, but contrastingly mainly influenced by park facilities enabling the intended use, while the factor distance or proximity played a minor role for users in Ontario, but not in New York City. Furthermore, Zhang et al. [81] reported proximity to retail areas having a positive effect on park visits for walking in a study in Greater London.
Beyond the factor proximity, seniors in this study were clearly more motivated by “nature, landscape or wilderness”, and “tranquillity”, while children and young adults focused more on “space for physical activities”, especially in Coimbra and Vilnius, confirming results from Amsterdam, The Netherlands [53]. Contrastingly, from Guangzhou, China, Shan [46] reported the main motives “to exercise” and “social interaction” for seniors > 60 years, suggesting cultural differences in motives for park visits and ES use between China and Europe.
While we observed differences in ES use of different age groups, it is noteworthy that in none of the cities did the analysis of gender revealed any differences in ES use between genders (data not shown). This result was unexpected as previous studies of ES use in UGS clearly indicated differences according to gender [46,77].
In addition to climate change, in many cities in Europe and elsewhere, challenges for planners and park authorities arise from ongoing urbanisation and densification as well as broad and potentially conflicting user demands increasing the need for (new) urban green infrastructure (UGI) [82]. Our results show that good accessibility and short distances between home or office and parks strongly influence the means of transport towards non-motorised forms and the use of public transport, consistent with findings of Elldér et al. [83]. Applying this knowledge, for example, in Vilnius, accessibility could be improved by providing additional entrances via bridges for pedestrians and bikers where possible in the northern sectors, to reduce road traffic and facilitate non-motorised park visits (see Figure 1; note that the North-West is a protected area, prohibiting bridges there). Thus, knowledge about user motivations, their means of transport applied in an adapted city planning would result in a win-win-win for the environment, users and planners. This and similar opportunities in other cities contribute not only to the sustainability transformation of urban traffic [83] but also to increased UGS-accessibility of under-supplied neighbourhoods, contributing to SDGs 3 and 11.
Furthermore, multiple ES uses occurred in all parks with physical interactions dominating park visits, but despite mostly similar park attributes, use and users of other ES seem to differ across Europe. We interpret this and similar comparative studies as starting points to assess patterns of ES use and users in UGS, but results in Europe and elsewhere also point to the difficulty in transferring results about ES use and user motivations to parks in other cities and world regions [84]. Our findings seem to go in line with those of McCormack et al. [85] and Schipperijn et al. [86] suggesting that the design of UGS must meet local specific characteristics in order to offer preferred ES and benefits for their users.
4.3. Methodological Issues and Practical Application
From a methodological perspective, our findings suggest that motivations or stated preferences of use, may only partly reflect the range of activities or ES uses of park visitors, and may thus provide insufficient or misleading information for planning and park management or—in a broader sense—UGS management. While on one hand, this finding seems to imply more efforts and higher costs to generate reliable information, we argue that on the other hand, trustworthy and reliable information generated, for example, in in situ surveys enables cost-efficient user and target-oriented park or other UGS planning and management in cities in Europe and elsewhere [87]. The second methodological focus was on establishing datasets linking spatial and socio-demographic factors [59] known to influence ES use [74] and simultaneously assess the motivations of ES users related to their actual ES use [35,36]. Thus, to generate reliable data relevant for spatial management and planning, as well as for specifying the role of UGS in the development of urban sustainability concepts. The advantage over indirect methods of assessing potential ES is that the spatial and socio-demographic data of park visitors are spatially and temporally explicit, that is, directly related to their actual use of specific ES.
The second applied aspect analyses the use and application of guiding concepts such as Green Infrastructure (GI) promoted by the European Commission and the Sustainable Development Goals of the United Nations. Strategic documents at municipal level increasingly address and link urban green and other sustainability aspects including health and wellbeing, local climate, traffic and other factors (e.g. masterplan green in Leipzig: [88], upcoming masterplan in Vilnius: [89], intermunicipal climate adaption plan in Coimbra: [90]). Although the GI concept and its relevance for sustainability and planning in urban environments have been published by the European Commission already in 2013 [82], it seems that the (urban) GI concept—here addressed as UGS—trickled much slower from European to municipal levels and urban planning and management than the Sustainable Development Goals (SDGs), which were published two years later [18]. The municipal documents analysed for this study explicitly refer to the agenda 2030 of the SDGs, while only Leipzig documents refer to the (urban) GI concept. Thus, in addition to scientific insights, concrete information about UGS user motivation and behaviour generated in this and similar studies contributes to convert UN Agenda 2030 strategies into sustainability and user-oriented design and management of urban green spaces.
5. Conclusions and Outlook
In the challenging context of climate change and ongoing urbanisation and urban densification, in situ surveys can reveal place-specific motivations and ES uses citizens associate to local parks in Europe and elsewhere. Our results suggest that further integrative comparative studies assessing ES use are not only urgently needed to broaden our knowledge about uses and users of urban parks and other types of UGS, but they are fundamental for the design and management of performant UGS at the local level to ensure their effectiveness in different cities and regions, and to contribute to intended sustainability transformations to achieve UN Agenda 2030 goals (SDGs 3, 11).
Specifically increasing availability of UGS via accessibility or new UGS locations would not only reduce visitors’ motorized individual transport and emissions contributing to SDG objectives (SDGs 3, 11, 13) but also contribute to increasing environmental equity, providing improved environmental quality via UGS-related health and well-being effects for currently under-supplied neighbourhoods (SDG 3, 10).
Supplementary Materials
The following are available online at https://www.mdpi.com/2073-445X/10/2/154/s1, Table S1: Survey about the use of nature in city parks, Table S2: Pearson’s residuals for Chi-square test of independence for means of transport for the three cities, Table S3: Pearson’s residuals for Chi-square test of independence for motivation categories of different age groups, Table S4: Pearson’s residuals for Chi-square test of independence for motivation categories of the three cities, Figure S1: Means of transport and travelled distances of respondents from urban parks in three European cities.
Author Contributions
Conceptualization, J.P. (Jörg Priess) and J.P. (Julia Palliwoda); methodology, J.P. (Jörg Priess) and J.P. (Julia Palliwoda); software, J.P. (Julia Palliwoda) and L.V.P.; validation, all; formal analysis, all; data curation, I.M., J.P. and L.V.P.; writing—original draft preparation, J.P. (Jörg Priess); writing—review and editing, all; visualization, J.P. (Julia Palliwoda) and L.V.P.; supervision, J.P. (Jörg Priess); funding acquisition, J.P. (Jörg Priess). All authors have read and agreed to the published version of the manuscript.
Funding
This study has been conducted within the BiodivERsA funded project UrbanGaia (I.M.: grant agreement No. S-BIODIVERSA-17-17-1 from the Research Council of Lithuania; L.V.P.: grant agreement No. BIODIVERSA/0008/2015; J.P. (Jörg Priess) and J.P. (Julia Palliwoda): grant agreement No. 01LC1616A).
Institutional Review Board Statement
Ethical review and approval were waived for this study, due to the fact that survey data were collected and used in a strictly anonymized fashion and no personal data besides age, gender and postcode of the place of residence were collected in the survey. The conformity of the survey with national laws and regulations was checked and approved by the legal department of the Helmholtz Centre for Environmental Research after pre-test in August 2018 with special foci on (i) ensuring anonymity of interview partners, (ii) minimum age of interview partners and (iii) correctly addressing gender.
Informed Consent Statement
Informed consent was obtained from all interviewees involved in the study.
Data Availability Statement
The main dataset generated in this study is publicly available (https://osf.io/f632g/ (accessed on 1 February 2021); doi:10.17605/OSF.IO/F632G).
Conflicts of Interest
The authors declare no conflict of interest.
References
- United Nations. World Urbanization Prospects 2018. Highlights; Department of Economic and Social Affairs, Population Division: New York, NY, USA, 2019. [Google Scholar]
- Miller, J.R. Biodiversity conservation and the extinction of experience. Trends Ecol. Evol. 2005, 20, 430–434. [Google Scholar] [CrossRef]
- Dunn, R.R.; Gavin, M.C.; Sanchez, M.C.; Solomon, J.N. The pigeon paradox: Dependence of global conservation on urban nature. Conserv. Biol. 2006, 20, 1814–1816. [Google Scholar] [CrossRef]
- European Environment Agency. Spatial Analysis of Green Infrastructure in Europe; European Environment Agency: Luxembourg, 2014. [Google Scholar]
- Millennium Ecosystem Assessment. Ecosystems and Human Well-Being: Synthesis; Island Press: Washington, DC, USA, 2005. [Google Scholar]
- Breuste, J.; Schnellinger, J.; Qureshi, S.; Faggi, A. Urban Ecosystem services on the local level: Urban green spaces as providers. Ekologia 2013, 32. [Google Scholar] [CrossRef] [Green Version]
- The Nature Conservancy. Bigger, Faster, Smarter. Conservation Reimagined. Annual Report; The Nature Conservancy: Arlington County, VI, USA, 2018; Available online: https://www.nature.org/content/dam/tnc/nature/en/documents/2018_AR_Complete.pdf (accessed on 1 December 2020).
- Parker, J.; Simpson, G.D. A Theoretical Framework for Bolstering Human-Nature Connections and Urban Resilience via Green Infrastructure. Land 2020, 9, 252. [Google Scholar] [CrossRef]
- Baycan-Levent, T.; Vreeker, R.; Nijkamp, P. A Multi-Criteria Evaluation of Green Spaces in European Cities. Eur. Urban Reg. Stud. 2009, 16, 193–213. [Google Scholar] [CrossRef]
- Lavalle, C.; Zulian, G. UI—Nature Based Recreation Opportunities (LUISA Platform REF2014); European Commission: Brussels, Belgium, 2015; Joint Research Centre (JRC) [Dataset]; Available online: http://data.europa.eu/89h/jrc-luisa-ui-recreation-potential-ref-2014 (accessed on 1 September 2020).
- Lavalle, C.; Vallecillo, S.; Aurambout, J.-P. UI—Amount of Green Infrastructure per Capita (LUISA Platform REF2014); European Commission: Brussels, Belgium, 2015; Joint Research Centre (JRC) [Dataset]; Available online: http://data.europa.eu/89h/jrc-luisa-ui-green-infrastructure-ref-2014 (accessed on 1 September 2020).
- Colding, J.; Gren, Å.; Barthel, S. The Incremental Demise of Urban Green Spaces. Land 2020, 9, 162. [Google Scholar] [CrossRef]
- Bundesamt für Naturschutz. Doppelte Innenentwicklung—Perspektiven für das Urbane Grün; Empfehlungen für Kommunen: Bonn, Germany, 2020. [Google Scholar]
- BMUB—Bundesministerium für Umwelt, N.u.n.S. Was Ist “Doppelte Innenentwicklung”. Available online: https://www.bmu.de/faq/was-ist-doppelte-innenentwicklung/#:~:text=Das%20Leitbild%20der%20doppelten%20Innenentwicklung,zu%20vernetzen%20und%20qualitativ%20aufzuwerten. (accessed on 1 May 2020).
- Pincetl, S.; Gearin, E. The Reinvention of Public Green Space. Urban Geogr. 2013, 26, 365–384. [Google Scholar] [CrossRef]
- Benton-Short, L.; Keeley, M.; Rowland, J. Green infrastructure, green space, and sustainable urbanism: Geography’s important role. Urban Geogr. 2017, 40, 330–351. [Google Scholar] [CrossRef]
- McPhearson, T.; Andersson, E.; Elmqvist, T.; Frantzeskaki, N. Resilience of and through urban ecosystem services. Ecosyst. Serv. 2015, 12, 152–156. [Google Scholar] [CrossRef]
- United Nations. Sustainable Development Goals: 17 Goals to Transform Our World. Available online: https://www.un.org/sustainabledevelopment/sustainable-development-goals/ (accessed on 1 January 2021).
- Depellegrin, D.; Pereira, P.; Misiunė, I.; Egarter-Vigl, L. Mapping ecosystem services potential in Lithuania. Int. J. Sustain. Dev. World Ecol. 2016, 23, 441–455. [Google Scholar] [CrossRef]
- Aziz, T.; Van Cappellen, P. Comparative valuation of potential and realized ecosystem services in Southern Ontario, Canada. Environ. Sci. Policy 2019, 100, 105–112. [Google Scholar] [CrossRef]
- Grima, N.; Singh, S.J. The self-(in)sufficiency of the Caribbean: Ecosystem services potential Index (ESPI) as a measure for sustainability. Ecosyst. Serv. 2020, 42. [Google Scholar] [CrossRef]
- Müller, F.; Bicking, S.; Ahrendt, K.; Kinh Bac, D.; Blindow, I.; Fürst, C.; Haase, P.; Kruse, M.; Kruse, T.; Ma, L.; et al. Assessing ecosystem service potentials to evaluate terrestrial, coastal and marine ecosystem types in Northern Germany—An expert-based matrix approach. Ecol. Indic. 2020, 112. [Google Scholar] [CrossRef]
- Paracchini, M.L.; Zulian, G.; Kopperoinen, L.; Maes, J.; Schägner, J.P.; Termansen, M.; Zandersen, M.; Perez-Soba, M.; Scholefield, P.A.; Bidoglio, G. Mapping cultural ecosystem services: A framework to assess the potential for outdoor recreation across the EU. Ecol. Indic. 2014, 45, 371–385. [Google Scholar] [CrossRef] [Green Version]
- Scholte, S.S.K.; Daams, M.; Farjon, H.; Sijtsma, F.J.; van Teeffelen, A.J.A.; Verburg, P.H. Mapping recreation as an ecosystem service: Considering scale, interregional differences and the influence of physical attributes. Landsc. Urban Plan. 2018, 175, 149–160. [Google Scholar] [CrossRef]
- García-Díez, V.; García-Llorente, M.; González, J.A. Participatory Mapping of Cultural Ecosystem Services in Madrid: Insights for Landscape Planning. Land 2020, 9, 244. [Google Scholar] [CrossRef]
- Wright Wendel, H.E.; Zarger, R.K.; Mihelcic, J.R. Accessibility and usability: Green space preferences, perceptions, and barriers in a rapidly urbanizing city in Latin America. Landsc. Urban Plan. 2012, 107, 272–282. [Google Scholar] [CrossRef]
- Arnberger, A.; Eder, R. Are urban visitors’ general preferences for green-spaces similar to their preferences when seeking stress relief? Urban For. Urban Green. 2015, 14, 872–882. [Google Scholar] [CrossRef]
- Leitao, I.A.; Ferreira, C.S.S.; Ferreira, A.J.D. Assessing long-term changes in potential ecosystem services of a peri-urbanizing Mediterranean catchment. Sci. Total Environ. 2019, 660, 993–1003. [Google Scholar] [CrossRef]
- Fischer, L.K.; Honold, J.; Botzat, A.; Brinkmeyer, D.; Cvejić, R.; Delshammar, T.; Elands, B.; Haase, D.; Kabisch, N.; Karle, S.J.; et al. Recreational ecosystem services in European cities: Sociocultural and geographical contexts matter for park use. Ecosyst. Serv. 2018, 31, 455–467. [Google Scholar] [CrossRef]
- Campbell, L.K.; Svendsen, E.S.; Sonti, N.F.; Johnson, M.L. A social assessment of urban parkland: Analyzing park use and meaning to inform management and resilience planning. Environ. Sci. Policy 2016, 62, 34–44. [Google Scholar] [CrossRef]
- Hurley, P.T.; Emery, M.R. Locating provisioning ecosystem services in urban forests: Forageable woody species in New York City, USA. Landsc. Urban Plan. 2018, 170, 266–275. [Google Scholar] [CrossRef] [Green Version]
- Lagbas, A.J. Social valuation of regulating and cultural ecosystem services of Arroceros Forest Park: A man-made forest in the city of Manila, Philippines. J. Urban Manag. 2019, 8, 159–177. [Google Scholar] [CrossRef]
- Andersson, E.; Barthel, S.; Borgstrom, S.; Colding, J.; Elmqvist, T.; Folke, C.; Gren, A. Reconnecting cities to the biosphere: Stewardship of green infrastructure and urban ecosystem services. Ambio 2014, 43, 445–453. [Google Scholar] [CrossRef] [Green Version]
- Haase, D.; Frantzeskaki, N.; Elmqvist, T. Ecosystem services in urban landscapes: Practical applications and governance implications. Ambio 2014, 43, 407–412. [Google Scholar] [CrossRef]
- Pueffel, C.; Haase, D.; Priess, J.A. Mapping ecosystem services on brownfields in Leipzig, Germany. Ecosyst. Serv. 2018, 30, 73–85. [Google Scholar] [CrossRef]
- Palliwoda, J.; Banzhaf, E.; Priess, J.A. How do the green components of Urban Green Infrastructure influence the use of Ecosystem Services? Examples from Leipzig, Germany. Landsc. Ecol. 2020, 35, 1127–1142. [Google Scholar] [CrossRef] [Green Version]
- Misiune, I.; Julian, J.P.; Veteikis, D. Pull and push factors for use of urban green spaces and priorities for their ecosystem services: Case study of Vilnius, Lithuania. Urban For. Urban Green. 2020. [Google Scholar] [CrossRef]
- Kabisch, N.; Qureshi, S.; Haase, D. Human–environment interactions in urban green spaces—A systematic review of contemporary issues and prospects for future research. Environ. Impact Assess. Rev. 2015, 50, 25–34. [Google Scholar] [CrossRef]
- Hegetschweiler, K.T.; de Vries, S.; Arnberger, A.; Bell, S.; Brennan, M.; Siter, N.; Olafsson, A.S.; Voigt, A.; Hunziker, M. Linking demand and supply factors in identifying cultural ecosystem services of urban green infrastructures: A review of European studies. Urban For. Urban Green. 2017, 21, 48–59. [Google Scholar] [CrossRef] [Green Version]
- Cortinovis, C.; Geneletti, D. A framework to explore the effects of urban planning decisions on regulating ecosystem services in cities. Ecosyst. Serv. 2019, 38. [Google Scholar] [CrossRef]
- Schipperijn, J.; Stigsdotter, U.K.; Randrup, T.B.; Troelsen, J. Influences on the use of urban green space—A case study in Odense, Denmark. Urban For. Urban Green. 2010, 9, 25–32. [Google Scholar] [CrossRef]
- Björk, J.; Albin, M.; Grahn, P.; Jacobsson, H.; Ardö, J.; Wadbro, J.; Östergren, P.-O.; Skärbäck, E. Recreational values of the natural environment in relation to neighbourhood satisfaction, physical activity, obesity and wellbeing. J. Epidemiol. Community Health 2008, 62, e2. [Google Scholar] [CrossRef]
- Kaczynski, A.T.; Potwarka, L.R.; Saelens, B.E. Association of park size, distance, and features with physical activity in neighborhood parks. Am. J. Public Health 2008, 98, 1451–1456. [Google Scholar] [CrossRef]
- Dade, M.; Mitchell, M.; Brown, G.; Rhodes, J. The effects of urban greenspace characteristics and socio-demographics vary among cultural ecosystem services. Urban For. Urban Green. 2020, 49. [Google Scholar] [CrossRef]
- Gómez-Baggethun, E.; Barton, D.N. Classifying and valuing ecosystem services for urban planning. Ecol. Econ. 2013, 86, 235–245. [Google Scholar] [CrossRef]
- Shan, X.-Z. Socio-demographic variation in motives for visiting urban green spaces in a large Chinese city. Habitat Int. 2014, 41, 114–120. [Google Scholar] [CrossRef]
- Kuldna, P.; Poltimäe, D.H.; Tuhkanen, H. Perceived importance of and satisfaction with nature observation activities in urban green areas. J. Outdoor Recreat. Tour. 2020, 29, 100227. [Google Scholar] [CrossRef]
- Kremer, P.; Hamstead, Z.; Haase, D.; McPhearson, T.; Frantzeskaki, N.; Andersson, E.; Kabisch, N.; Larondelle, N.; Rall, E.L.; Voigt, A.; et al. Key insights for the future of urban ecosystem services research. Ecol. Soc. 2016, 21. [Google Scholar] [CrossRef] [Green Version]
- Zwierzchowska, I.; Hof, A.; Ioja, I.C.; Mueller, C.; Ponizy, L.; Breuste, J.; Mizgajski, A. Multi-scale assessment of cultural ecosystem services of parks in Central European cities. Urban For. Urban Green. 2018, 30, 84–97. [Google Scholar] [CrossRef]
- Bertram, C.; Rehdanz, K. Preferences for cultural urban ecosystem services: Comparing attitudes, perception, and use. Ecosyst. Serv. 2015, 12, 187–199. [Google Scholar] [CrossRef]
- Schetke, S.; Qureshi, S.; Lautenbach, S.; Kabisch, N. What determines the use of urban green spaces in highly urbanized areas? Examples from two fast growing Asian cities. Urban For. Urban Green. 2016, 16, 150–159. [Google Scholar] [CrossRef]
- Gobster, P.H.; Westphal, L.M. The human dimensions of urban greenways: Planning for recreation and related experiences. Landsc. Urban Plan. 2004, 68, 147–165. [Google Scholar] [CrossRef]
- Chiesura, A. The role of urban parks for the sustainable city. Landsc. Urban Plan. 2004, 68, 129–138. [Google Scholar] [CrossRef]
- Bijker, R.A.; Sijtsma, F.J. A portfolio of natural places: Using a participatory GIS tool to compare the appreciation and use of green spaces inside and outside urban areas by urban residents. Landsc. Urban Plan. 2017, 158, 155–165. [Google Scholar] [CrossRef] [Green Version]
- Özgüner, H. Cultural Differences in Attitudes towards Urban Parks and Green Spaces. Landsc. Res. 2011, 36, 599–620. [Google Scholar] [CrossRef]
- Plieninger, T.; Dijks, S.; Oteros-Rozas, E.; Bieling, C. Assessing, mapping, and quantifying cultural ecosystem services at community level. Land Use Policy 2013, 33, 118–129. [Google Scholar] [CrossRef] [Green Version]
- Riechers, M.; Barkmann, J.; Tscharntke, T. Perceptions of cultural ecosystem services from urban green. Ecosyst. Serv. 2016, 17, 33–39. [Google Scholar] [CrossRef]
- Terkenli, T.S.; Bell, S.; Tošković, O.; Dubljević-Tomićević, J.; Panagopoulos, T.; Straupe, I.; Kristianova, K.; Straigyte, L.; O’Brien, L.; Živojinović, I. Tourist perceptions and uses of urban green infrastructure: An exploratory cross-cultural investigation. Urban For. Urban Green. 2020, 49. [Google Scholar] [CrossRef]
- Turner, V.K.; Kaplan, D.H. Geographic perspectives on urban sustainability: Past, current, and future research trajectories. Urban Geogr. 2018, 40, 267–278. [Google Scholar] [CrossRef]
- Carmen, R.; Jacobs, S.; Leone, M.; Palliwoda, J.; Pinto, L.; Misiune, I.; Priess, J.A.; Pereira, P.; Wanner, S.; Ferreira, C.S.; et al. Keep it real: Selecting realistic sets of urban green space indicators. Environ. Res. Lett. 2020, 15. [Google Scholar] [CrossRef]
- AM Online Projects. CLIMATE-DATA.ORG. Available online: https://de.climate-data.org/europa/ (accessed on 10 December 2020).
- Stadt Leipzig. Ortsteilkatalog 2018 (Municipal Statistics 2018); Amt für Statistik und Wahlen: Leipzig, Germany, 2019. (In German) [Google Scholar]
- Burneika, D.; Ubarevičienė, R.; Pociūtė, G.; Kriaučiūnas, E. The Impact of Vilnius City on the Transformation Trends of the Sparsely Populated EU East Border Region. Ethn. Stud. 2013, 2, 49–68. [Google Scholar]
- Stat Dep. Official Statistics Portal, Lithuania. Available online: https://osp.stat.gov.lt/en/web/guest/statistiniu-rodikliu-analize?hash=4e941b06-cdb6-453a-9ae0-e87a0ad521ee#/ (accessed on 1 July 2020).
- Grabauskas, M. Vilnius City Master Plan. In Current Status of Natural Environment; Elsevier B.V.: Amsterdam, The Netherlands, 2017. [Google Scholar]
- Priess, J.A.; Elger, R.; Hauck, J. The ESM-App—A new smartphone application to map ecosystem services. In Proceedings of the 7th International Congress on Environmental Modelling and Software, San Diego, CA, USA, 15—19 June 2014. [Google Scholar]
- Priess, J.A.; Kopperoinen, L. Citizen Science. In Ecosystem Service Mapping; Burkhard, B., Maes, J., Eds.; PENSOFT: Sofia, Bulgaria, 2016. [Google Scholar]
- Haines-Young, R.; Potschin, M. Common International Classification of Ecosystem Services (CICES): Consultation on Version 4, August–December 2012. In EEA Framework Contract No EEA/IEA/09/003; Centre for Environmental Management, University of Nottingham: Nottingham, UK, 2013; 34p. [Google Scholar]
- Díaz, S.; Demissew, S.; Carabias, J.; Joly, C.; Lonsdale, M.; Ash, N.; Larigauderie, A.; Adhikari, J.R.; Arico, S.; Báldi, A.; et al. The IPBES Conceptual Framework—Connecting nature and people. Curr. Opin. Environ. Sustain. 2015, 14, 1–16. [Google Scholar] [CrossRef] [Green Version]
- Wickham, H. ggplot2: Elegant Graphics for Data Analysis; Springer: New York, NY, USA, 2016. [Google Scholar]
- Barbosa, O.; Tratalos, J.A.; Armsworth, P.R.; Davies, R.G.; Fuller, R.A.; Johnson, P.; Gaston, K.J. Who benefits from access to green space? A case study from Sheffield, UK. Landsc. Urban Plan. 2007, 83, 187–195. [Google Scholar] [CrossRef]
- Liang, H.; Chen, D.; Zhang, Q. Walking accessibility of urban parks in a compact megacity. Proc. Inst. Civ. Eng. Urban Des. Plan. 2017, 170, 59–71. [Google Scholar] [CrossRef]
- Wüstemann, H.; Kalisch, D. Towards a National Indicator for Urban Green Space Provision and Environmental Inequalities in Germany: Method and Findings; Collaborative Research Center 649—Economic Risk, Humboldt University of Berlin: Berlin, Germany, 2016; Volume 2016-022. [Google Scholar]
- Jim, C.Y.; Chen, W.Y. Perception and attitude of residents toward urban green spaces in Guangzhou (China). Environ. Manag. 2006, 38, 338–349. [Google Scholar] [CrossRef]
- Stadt Leipzig. Leipziggruen 2020: Essbare Stadt. Available online: http://www.leipziggruen.de/de/uberblick_essbare_stadt2019.asp (accessed on 1 June 2020). (In German).
- DWD—Deutscher Wetterdienst. Temperaturanaomalie 1881–2019. Available online: https://www.dwd.de/DE/klimaumwelt/aktuelle_meldungen/200103/temperatur_d_2019_langfristig.html?nn=344870 (accessed on 1 June 2020).
- Ode Sang, Å.; Knez, I.; Gunnarsson, B.; Hedblom, M. The effects of naturalness, gender, and age on how urban green space is perceived and used. Urban For. Urban Green. 2016, 18, 268–276. [Google Scholar] [CrossRef]
- Lin, B.B.; Fuller, R.A.; Bush, R.; Gaston, K.J.; Shanahan, D.F. Opportunity or orientation? Who uses urban parks and why. PLoS ONE 2014, 9, e87422. [Google Scholar] [CrossRef] [Green Version]
- Akpinar, A. How is quality of urban green spaces associated with physical activity and health? Urban For. Urban Green. 2016, 16, 76–83. [Google Scholar] [CrossRef]
- Zlender, V.; Ward Thompson, C. Accessibility and use of peri-urban green space for inner-city dwellers: A comparative study. Landsc. Urban Plan. 2017, 165, 193–205. [Google Scholar] [CrossRef] [Green Version]
- Zhang, X.; Melbourne, S.; Sarkar, C.; Chiaradia, A.; Webster, C. Effects of green space on walking: Does size, shape and density matter? Urban Stud. 2020, 57, 3402–3420. [Google Scholar] [CrossRef]
- European Commission. Communication from the Commission to the European Parliament, the Council, the European Economic and Social Committee and the Committee of the Regions. Green Infrastructure (GI)—Enhancing Europe’s Natural Capital. Available online: https://eur-lex.europa.eu/legal-content/EN/TXT/?uri=celex%3A52013DC0249 (accessed on 1 October 2020).
- Elldér, E.; Haugen, K.; Vilhelmson, B. When local access matters: A detailed analysis of place, neighbourhood amenities and travel choice. Urban Stud. 2020. [Google Scholar] [CrossRef]
- ChiehLu, L. Quality of life: The perspective of urban park recreation in three Asian cities. J. Outdoor Recreat. Tour. 2020, 29. [Google Scholar] [CrossRef]
- McCormack, G.R.; Rock, M.; Toohey, A.M.; Hignell, D. Characteristics of urban parks associated with park use and physical activity: A review of qualitative research. Health Place 2010, 16, 712–726. [Google Scholar] [CrossRef]
- Schipperijn, J.; Bentsen, P.; Troelsen, J.; Toftager, M.; Stigsdotter, U.K. Associations between physical activity and characteristics of urban green space. Urban For. Urban Green. 2013, 12, 109–116. [Google Scholar] [CrossRef]
- Elderbrock, E.; Enright, C.; Lynch, K.A.; Rempel, A.R. A Guide to Public Green Space Planning for Urban Ecosystem Services. Land 2020, 9, 391. [Google Scholar] [CrossRef]
- Stadt Leipzig. Masterplan Grün. Available online: https://www.leipzig.de/freizeit-kultur-und-tourismus/parks-waelder-und-friedhoefe/masterplan-gruen/ (accessed on 1 April 2020).
- Vilnius Municipality. The Upcoming Master Plan of the Territory of Vilnius City Municipality. Available online: https://vilnius.lt/wp-content/uploads/2020/02/Vilniaus_BP_Sprendiniai_Aiskinamasis_rastas_tvirtinti_2020_02_04.pdf (accessed on 1 November 2020).
- Loureiro, J.; Castro, P.; Alves, F.; Figueiredo, A. Plano Intermunicipal de Adaptação às Alterações Climáticas da CIM-RC. Available online: https://climagir.cim-regiaodecoimbra.pt/application/views/assets/documentos/piaac-cim-rc.pdf (accessed on 1 November 2020).
Figure 1.
Map of case study sites, with park entrances and 5 min (300 m) and 15 min (900 m) walking distance isochrones (clusters: respondents living in the same neighbourhood; the number indicates the number of respondents).
Figure 1.
Map of case study sites, with park entrances and 5 min (300 m) and 15 min (900 m) walking distance isochrones (clusters: respondents living in the same neighbourhood; the number indicates the number of respondents).

Figure 2.
Share of ecosystem service group uses per city.

Figure 3.
Distribution of answers by ecosystem services and by distance to parks.

Figure 4.
Motivations for park visits by city.


Table 1.
Cities and study sites.
| Coimbra (Portugal) | Leipzig (Germany) | Vilnius (Lithuania) | |
|---|---|---|---|
| Area of the city (km2) | 50 | 299 | 401 |
| Global UGBI proportion 1, 2 | 34% | 28% | 61% |
| ‘Green urban areas’ proportion 1,3 | 5.2% | 8.0% | 7.5% |
| ‘Forests’ proportion 1 | 15.5% | 4.2% | 33.3% |
| Inhabit. (thousands) | 105 | 600 | 547 |
| Name of parks | Parque Verde do Mondego | Friedenspark, Palmengarten, Rosengarten | Vingis Park |
| Size of parks (ha) | 26.9 | 60.3 (18.0 + 21.0 + 21.3) | 175.8 |
| Tree coverage (%) | 22.9 | 65.7, 56.5, 16.3 | 90.1 |
| Landscape structure 4 | 5 | 4; 5; 5 | 5 |
| Area (ha) of available alternative green space 1 within 300 m and 900 m distance | 65.5 (300 m) 22.7 (900 m) | 133.7 (300 m) 144.0 (900 m) | 20.1 (300 m) 52.1 (900 m) |
| Year of field study 5 | 2019 | 2018 | 2019 |
1 Values calculated based on Land Use Land Cover data from Copernicus Urban Atlas 2012. 2 For the global area of urban green blue infrastructure—UGBI—we considered forest areas, herbaceous vegetation areas, sports areas, water and wetland areas. 3 “Green urban areas” from Copernicus Urban Atlas include gardens and parks. 4 Diversity of landscape components (1–7: presence/absence of grassland, trees, shrubs, water elements, flowerbeds, gardens, ruderal grassland). 5 The survey method was developed, tested and applied in Leipzig 2018 and translated, tested and applied in Coimbra and Vilnius 2019.
Table 2.
Frequency and proportion of ES use in three European cities. ES percentages are calculated for each ES group separately; ES groups are calculated as percentages of total ES use per city and on average (in grey).
Table 2.
Frequency and proportion of ES use in three European cities. ES percentages are calculated for each ES group separately; ES groups are calculated as percentages of total ES use per city and on average (in grey).
| Ecosystem Service | Number and Proportion of Respondents in: | Ecosystem Service Group | |||||
|---|---|---|---|---|---|---|---|
| Coimbra | Leipzig | Vilnius | |||||
| # | % | # | % | # | % | ||
| Experience diversity of plants & animals | 4 | 11% | 6 | 14% | - | - | Experiential & Aesthetical ecosystem services |
| Watching animals or plants | 1 | 3% | 3 | 7% | - | - | |
| Enjoy landscape beauty | 10 | 28% | 29 | 66% | 11 | 65% | |
| Environmental education | 19 | 53% | - | - | - | ||
| Experience cultural heritage, sense of place | - | - | 3 | 7% | 6 | 35% | |
| Being inspired by nature | 2 | 6% | 3 | 7% | - | - | |
| ES group-total | 36 | 10% | 44 | 17% | 17 | 7% | 11.3% (average) |
| Biking | 1 | 0% | 5 | 3% | 24 | 13% | Physical interactions |
| Boating, canoeing | 53 | 17% | - | - | - | - | |
| Walking, strolling | 222 | 70% | 73 | 46% | 105 | 55% | |
| Walking the dog | 13 | 4% | 38 | 24% | 18 | 9% | |
| Jogging | 6 | 2% | 10 | 6% | 43 | 23% | |
| Gardening | - | - | 8 | 5% | - | - | |
| Other activities in nature | 24 | 8% | 24 | 15% | - | - | |
| ES group-total | 319 | 87% | 158 | 61% | 190 | 81% | 77.6% (average) |
| Collecting food from plants | - | - | 4 | 10% | - | - | Provisioning and regulating ecosystem services |
| Nature mediates smell, noise, visual impacts | - | - | 31 | 78% | - | - | |
| Nature provides shade & shelter | - | - | 5 | 13% | - | - | |
| ES group-total | 0 | - | 40 | 16% | 0 | - | 4.7% (average) |
| Meeting people | 13 | 100% | 16 | 100% | 27 | 100% | Social relations |
| ES group-total | 13 | 4% | 16 | 10% | 27 | 10% | 6.5% (average) |
| Total | 368 | 258 | 234 | ||||
| Number of different ES used | 12 | 15 | 7 | ||||
Publisher’s Note: MDPI stays neutral with regard to jurisdictional claims in published maps and institutional affiliations. |
© 2021 by the authors. Licensee MDPI, Basel, Switzerland. This article is an open access article distributed under the terms and conditions of the Creative Commons Attribution (CC BY) license (http://creativecommons.org/licenses/by/4.0/).
Share and Cite
MDPI and ACS Style
Priess, J.; Pinto, L.V.; Misiune, I.; Palliwoda, J. Ecosystem Service Use and the Motivations for Use in Central Parks in Three European Cities. Land 2021, 10, 154. https://doi.org/10.3390/land10020154
AMA Style
Priess J, Pinto LV, Misiune I, Palliwoda J. Ecosystem Service Use and the Motivations for Use in Central Parks in Three European Cities. Land. 2021; 10(2):154. https://doi.org/10.3390/land10020154
Chicago/Turabian StylePriess, Jörg, Luis Valença Pinto, Ieva Misiune, and Julia Palliwoda. 2021. "Ecosystem Service Use and the Motivations for Use in Central Parks in Three European Cities" Land 10, no. 2: 154. https://doi.org/10.3390/land10020154
Note that from the first issue of 2016, this journal uses article numbers instead of page numbers. See further details here.