Governance, Nature’s Contributions to People, and Investing in Conservation Influence the Valuation of Urban Green Areas


1
Nelson Institute for Environmental Studies, University of Wisconsin Madison,550 North Park Street, Madison, WI 53706, USA
2
US Forest Service, Pacific Southwest Research Station, 4955 Canyon Crest Dr., Riverside, CA 92507, USA
3
Urban Management and Development Program, School of Political Science, Government and International Relations, Universidad del Rosario, Cra 6 No. 12C-13, Bogotá 111711, Colombia
*
Author to whom correspondence should be addressed.
Land 2021, 10(1), 14; https://doi.org/10.3390/land10010014
Submission received: 30 November 2020
/
Revised: 22 December 2020
/
Accepted: 23 December 2020
/
Published: 27 December 2020
(This article belongs to the Special Issue Urban Ecosystem Services II: Toward a Sustainable Future)
Abstract
:There is little information concerning how people in the Global South perceive the benefits and costs associated with urban green areas. There is even less information on how governance influences the way people value these highly complex socio-ecological systems. We used semi-structured surveys, statistical analyses, and econometrics to explore the perceptions of users regarding governance and the benefits and costs, or Ecosystem Services (ES) and Ecosystem Disservices (ED), provided by Neotropical green areas and their willingness to invest, or not, for their conservation. The study area was the El Salitre sub-watershed in Bogota, Colombia, and 10 different sites representative of its wetlands, parks, green areas, and socioeconomic contexts. Using a context-specific approach and methods, we identified the most important benefits and costs of green areas and the influence of governance on how people valued these. Our modelling shows that air quality and biodiversity were highly important benefits, while water regulation was the least important; despite the sub-watershed’s acute problems with stormwater runoff. In terms of costs, the feeling of insecurity due to crime was related to poor levels of maintenance and infrastructure in the studied green areas. Perceived transparency, corruption, and performance of government institutions influenced people’s Unwillingness to Invest (UTI) in green space conservation. Results show that socioeconomic backgrounds, government performance, and environmental education will play a role in the value or importance people place on the benefits, costs, and UTI in conservation efforts in urban green areas. Similarly, care is warranted when directly applying frameworks and typologies developed in high income countries (i.e., ES) to the unique realities of cities in the Global South. Accordingly, alternative frameworks such as Nature’s Contributions to People is promising.
1. Introduction
The link between human well-being and urban green areas, forests, parks, wetlands, and other natural and semi-natural ecosystems in cities has been well established [1,2] Several studies have valued multiple benefits using a diverse set of case studies, methods, and ecosystem service frameworks like the Millennium Ecosystem Assessment, The Economics of Ecosystem and Biodiversity, and others [3]. These have classified and defined urban ecosystem services as well as reviewed methods for their valuation. A similar body of literature has also discussed ecosystem disservices, or the social, environmental, and economic costs that these detrimental ecosystem functions have on people’s well-being [4,5,6].
This urban ecosystem service–disservice literature has primarily used case studies in contexts such those of Europe and the United States to explore these functions as well as the links between citizens and the benefits from green spaces [7,8,9] Similarly, several urban ecological functions result in a suite of disservices and costs including: Human injuries and infrastructure damage from vegetation debris and growth, wildlife nuisance, allergies, and maintenance costs, among others [6,10,11]. More recently, because cities are complex socio-ecological systems, other socioeconomic functions—in addition to ecological ones—are being included in the assessment of urban ecosystem disservices and can include: Fear of crime and tree fall, unpleasing aesthetics, diseases from remnant natural areas (i.e., wetlands) and foregone property premiums to name a few [6,7,12]. Despite this, there is much less information on how people in the Global South perceive benefits [13,14,15,16], and even less so on ecosystem disservices and if conventional urban ES/ED typologies are relevant for green areas of the Global South [17,18].
More recently, the Intergovernmental Panel on Biodiversity and Ecosystem Services has proposed the Nature’s Contributions to People (NCP) framework or “the positive contributions, or benefits, and occasionally negative contributions, losses or detriments, that people obtain from nature” to complement the ecosystem service framework; particularly in places like the Global South [16]. Although NCP “goes further by explicitly embracing concepts associated with other worldviews on human–nature relations and knowledge systems” [16], the concept has sparked a lively debate in the ecosystem service community; see [18] and responses therein to the article. Despite this recent NCP versus ecosystem services controversy, the terms “benefits” and “costs” as related to urban green areas have a long history of use and application dating back to the early 1990s [1] before the advent and frequent use of these other metaphors [17].
Other studies regularly use geospatial and statistical methods to understand the supply of these ecosystem services and benefits in cities [19,20]. Surveys are also regularly used to better understand the perception residents have towards urban ecosystem services [6,15]. Some of these studies use psychometric scales and methods [15], as well as stated preferences and econometrics, to determine value [6,21]. Fewer studies have, however, measured the role that governance, perceived corruption, and policy processes have in influencing people’s willingness to pay to conserve the ecosystems providing such benefits [22,23]. Similarly, the realities of inequity, weak governance, perceived corruptions, and lack of resources is systematically omitted in stated preference studies in low–middle income countries [21].
These processes and dynamics between actors or stakeholders, governments, and the management and planning of these benefits are key elements that link the supply and demand for benefits [24]. These policy processes, or governance, of ecosystem benefits has been looked at using several lenses including: Political ecology [25,26], urban and rural forest management [27,28], biodiversity [22,24], program evaluation, and the urban ecosystem services framework [8,9,11,29]. However, most of these urban context studies are predominantly from high income countries such as those of North America, Europe, and Australia [17].
The concept of governance has many definitions and applications, and has been described as “an emergent, often complex decision making process” [30]. Huang, C.W. et al. [24] define effective governance as a process that “facilitates the development and implementation of law, regulations, and institutions that have a role in the management of land resources”. Although generally used as a means to describe the processes used by governments to include the governed or society in the decision making process (state-centered), it can also include community and market sectors and situations where actors take a prominent role in the co-management of ecosystems (society-centered; [25,27]). Governance as such includes processes and interactions that organize power relations, influences, interests, and government performance and transparency into the decision making process in order to determine socioeconomic and environmental benefits [28].
Lawrence, A., et al. [28] and Launay, G.C. et al. [31] emphasize the role of measuring these processes, their applications, and outcomes in terms of evaluating the effectiveness in assuring good governance. Kenward, R.E. et al. [22] and Huang, C.W. et al. [24] investigated the performance of governance strategies and context in achieving successful biodiversity conservation outcomes and supplies of ecosystem services. However, Turnhout, E. et al. [26] argue that an increased focus on measuring transparency, efficiency, and effectiveness can lead to an “impoverished understanding of biodiversity itself”. Examples of frameworks, models, and discourses related to governance in regards to urban and peri-urban forests are discussed in detail in [28,32].
However, few studies discuss what good governance is in regards to urban ecosystems in cities of the Global South [13,20,33]. Lockwood [34] defines “good governance”, which encompasses: Legitimacy, transparency, accountability, inclusiveness, fairness, connectivity, and resilience, while [31] promoting criteria such as transparency, corruption, and government performance when evaluating proper governance in Latin American countries. According to Barrett, C.B. et al. [35], the inverse of transparency, or corruption, in regards to natural resources is regularly used as an explanation for environmental degradation. Indeed, in low and middle income countries, perceptions of corruption influence how people value and access environmental benefits in both urban and rural settings [21]. Yet, corruption comes in many forms, levels, and scales, and the causal effects and relationships between corruption and natural resource use and condition can be complex [35].
The above studies document how people perceive and value urban ecosystem services in several cities [1,12], and the role of good governance and willingness to pay for conserving biodiversity and ecosystems [9,24,33,36]. However, as previously mentioned, less known is how people in places such as Latin America perceive this urban benefit-cost bundle and how context-specific realities such as lack of transparency, perceived corruption, and inequity affect people´s willingness to invest in conserving the ecosystems that provide these services [17,20]. Indeed, even the relevance and direct application of the ecosystem service framework in places such as the Global South have recently been questioned [13,18].
This study explores how people perceive the benefits, costs, and the influence of governance on their willingness to invest—or not—to conserve urban green areas. We surveyed representative areas in an urbanized sub-watershed in Bogota, Colombia. Specifically, we have three different study objectives. First, we assess how people perceive urban benefits and costs in an urban sub-watershed in Latin America. Second, we assess how socioeconomic factors affect perceptions. Third, we explore the influence of the different dimensions of governance (e.g., perceived corruption, transparency, government performance) on people´s willingness to invest for the conservation of the green areas and wetlands providing these benefits and costs (i.e., Ecosystem Services–Ecosystem Disservices (ES–ED)). So as to avoid the ecosystem service versus NCP controversy [18], we use the terms urban “benefits” and “costs” as defined by Dwyer et al. [1] in our study and analyses; but we do discuss the relevance of these metaphors (i.e., ES, ED, and NCP) in our Discussion and Conclusion with a focus on the promising use of NCP.
2. Materials and Methods
2.1. Study Area
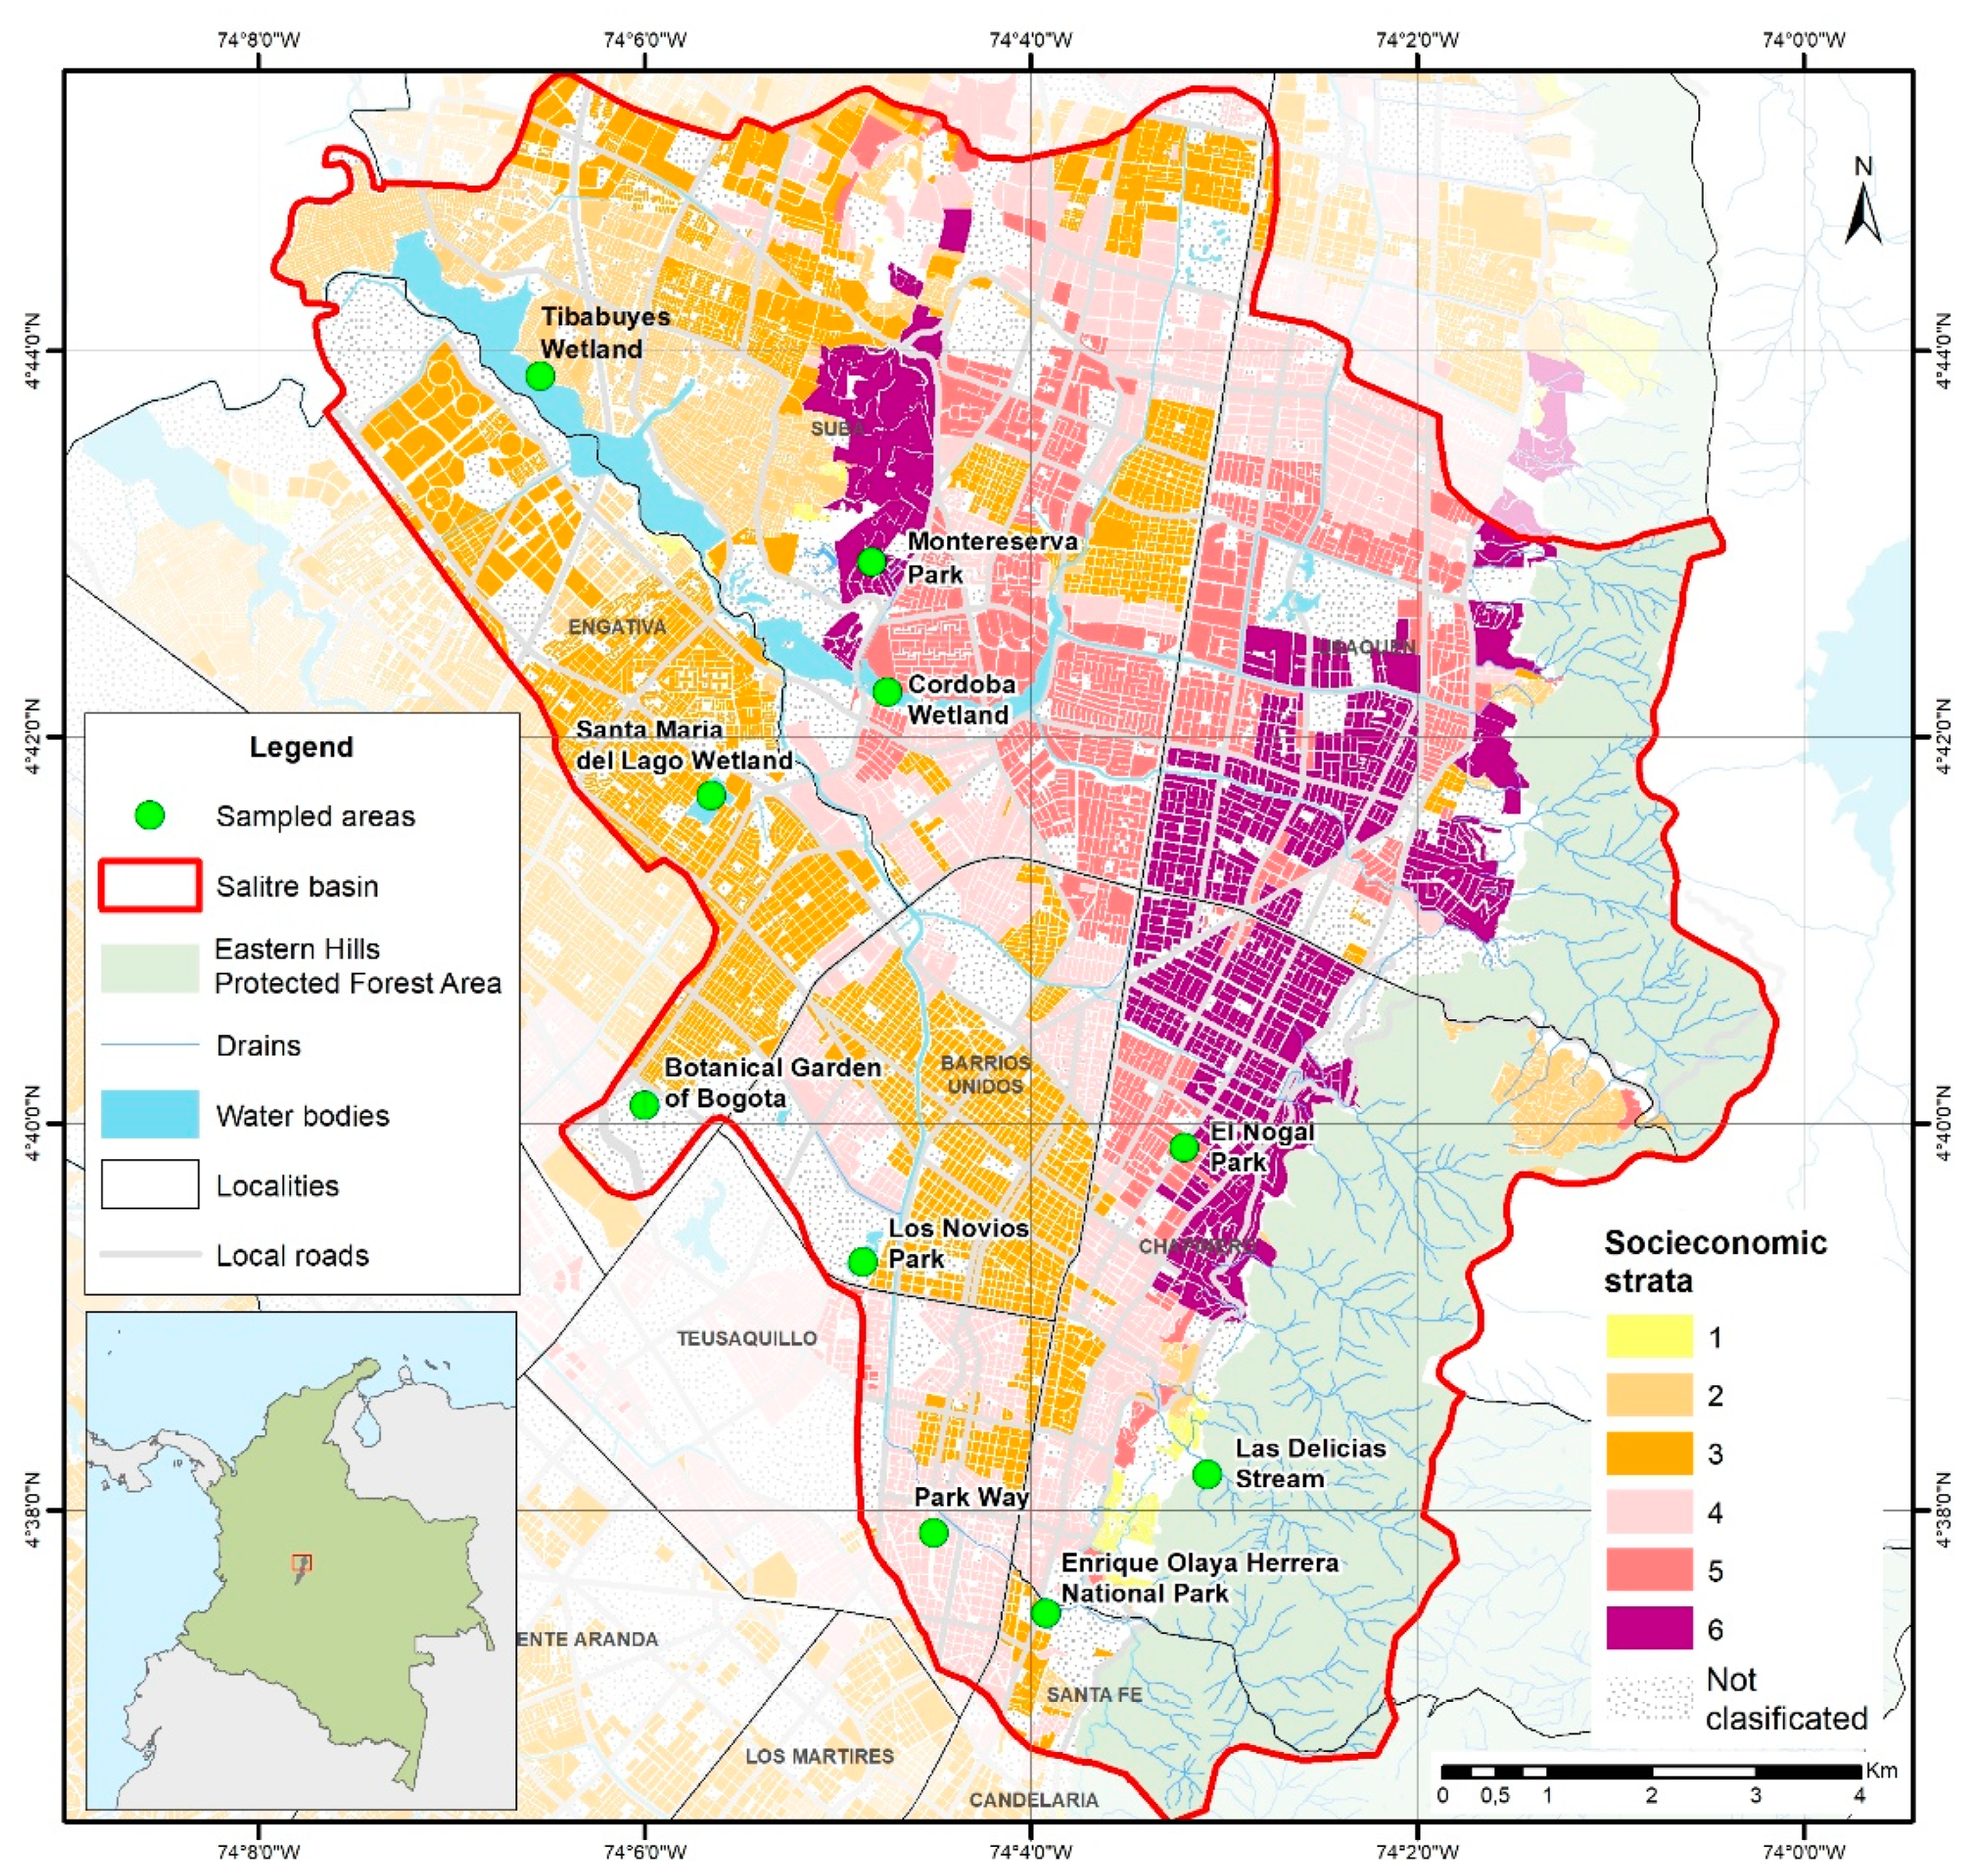
The study area was the El Salitre urban sub-watershed in Bogotá, Colombia (Figure 1). Bogotá is located at 2600 m in elevation and has a subtropical highland climate temperature that varies between 7–17 degrees C, and total average annual rainfall is about 825 mm [37]. The study´s sub-watershed encompasses the localities of Usaquén, Santa Fé, Chapinero, Teusaquillo, Barrios Unidos, Engativá, and Suba, and within these are 1894 different neighborhoods encompassing 11,791 has. Although the sub-watershed does encompass a large portion of the adjacent Eastern Hills Protected Forest Area (i.e., Reserva Forestal Protectora Bosque Oriental de Bogotá) to the east of Bogota, the study was done entirely in the urban portion. The El Salitre River is mostly channelized in this urban portion and is often referred to as the Arzobispo, Quebrada Molinos, Rio Callejas, and La Sirena streams or drainage channels. There are four officially designated wetlands and approximately 175 different parks and water bodies within the watershed. In all, 3 wetlands, 5 parks, and 2 green areas were selected for sampling the sub-watershed (Table 1).
The sub-watershed also encompasses all the different sub-neighborhood level socioeconomic strata that characterize Bogota. Bogota is divided into six different designated socioeconomic strata, that were designed to subsidize utility payments and infrastructure based on resident’s average income, and thus are a measure of a residential zone´s income status; socioeconomic strata 1 being the lowest income and 6 the highest. These strata are correlated with green space cover and subsequent ecosystem service provision and benefits [38]. Bogota has a high population and building density and as such, the sub-watershed poses several socio-political and environmental realties typical of medium income Latin American cities. For example, sewage pollution discharges into the wetlands and streams in the forest reserve are common [39]. Urbanized areas near wetlands also experience frequent flooding, and informal settlements—both high and low income—are sporadically being established in the foothills and are characterized by high impervious surfaces and inadequate waste management [39].
Air and water pollution concentrations are also high along transportation land uses and stream channels. Streams, as previously mentioned, are channelized and made impervious to deal with excess stormwater and effluents [37,38]. Specific neighborhoods in the study sub-watershed such as Engativá and Suba are characterized by high rates of criminal activity [27,40]. Thus, given the complexity of sampling in densely populated areas with disparate socioeconomic realities and access and safety issues, we were not able to use other standardized methods for selecting urban sites that are frequently used in places such a Europe [41]. Instead, we selected 10 different and representative sites based on safety and access and we use these to represent the sub-watershed´s different socioeconomic strata and land uses (Table 1).
2.2. Survey Instrument
We used a semi-structured, in-person survey consisting of 18 different questions that assessed people´s perception and value for different urban benefits and costs as well as respondent’s demographic and socioeconomic backgrounds (Appendix A). Questions were a combination of closed and open-ended items. In the survey, the first part of the questionnaire was about socioeconomic strata, gender, age, and education level. In a second section, we measured people´s awareness about the watershed’s ecology in terms of their ability to recognize key ecological information by asking 4 questions about: Ecological health, different species, the existence of established wetlands, and an extensive forest reserve to the east of the city (Figure 1). Accordingly, employees of the Jardin Botanico de Bogota and students from the Universidad del Rosario surveyed people’s perception towards climate change and their Willingness to Invest to conserve and restore the ten different green areas and wetlands we used in the study. In all, we surveyed 500 different people, or 50 respondents per site. Approximately 75% of the people who were approached participated in taking the survey and signed an informed consent form.
Based on [1,4,12,16,19,20], we analyzed 8 different benefits and 8 costs that have been reported to influence people´s perception and values regarding urban green and nature in cities. We also include crime-related costs [40] and poverty alleviation–income generating benefits [14] that are not accounted for in ecosystem service typologies [16,18]; but were important to the citizenry. We have found from previous experience that survey respondents in this study area do not distinguish among cognitively complex and technically difficult processes regularly used in ES frameworks such as “ecological functions”, “ecosystem services and disservices”, and “economic benefits”. Rather, they simply recognize them as “benefits and costs”. Thus, we also include crime related ED and poverty alleviation–income generating benefits that are not accounted for in typologies developed in high income countries such as those associated with the “ecosystem service cascade” [16]. Thus, we emphasize that the more scientific and technical terms ES and ED were posed as “benefits and costs” in the instrument to better communicate with respondents. However, in the following methods, results, and discussion sections, they are presented as ES, ED, and NCP to better contextualize and discuss relative to other relevant literature and studies.
2.3. Statistical and Econometric Analysis
Survey responses were in the form of dichotomous questions and Likert scales that were used to statistically characterize the survey population and their responses using two approaches (Appendix A; [15]). First, we summarized respondent´s socioeconomic strata, gender, age, and education level. Graphical analyses were used to identify trends and patterns in responses towards benefits and costs. Then an ordinary least squares (OLS) regression with robust standard errors: 1. Explored the variables that can influence perception towards different benefits and costs, and 2. identified variables for a subsequent analysis using a more predictive model. Following the work of [42], the following regression model (Equation (1)) accounted for the social–cultural dimensions of benefits (Bij):
where corresponds to the number of benefits identified by each individual surveyed in three categories: Provision, environmental, and cultural. This variable was modelled according to three types of sites: Parks, wetlands, and green areas. The independent variable was the environmental awareness of each individual; is the sense of security; is a dichotomic variable that takes the value of 1 when the individual has a university degree, and 0 when the individual has a lower degree than a university degree; is a 3 by 1 vector of control variables. This vector includes the following variables: Age, a dichotomous variable if the individual is from Bogotá, and another dichotomous variable if the individual is aware of climate change.
Second, we used survey responses and most of the variables from our OLS model in a logistic regression to econometrically assess the effects of Weak Governance (Weak_governance) on respondent’s Unwillingness to Invest (UTI) using Equation (2). Per Colombian program evaluation standards [31], a response of not willing to invest (i.e., UTI) included the following reasons for not doing so: 1. Perception of corruption or that funds will not be used appropriately, 2. conservation of green areas and wetlands is already paid for in taxes, 3. the respondents already pay too much tax, and 4. it is the government´s responsibility to conserve green areas. We recoded people´s Unwillingness to Invest as the dependent variable UTI = 1; conversely, UTI = 0 if people were Willing to Invest.
Thus, based on [31] and [34], the Weak_governance variable in Equation (2) was 1 if there was a perception of weak governance and 0 otherwise. The X in Equation (1) is a vector representing the socioeconomic variables that were used as controls. We used Gender = 1 for female, and Age was a categorical variable. Strata were recorded according to respondent´s socioeconomic strata (1, 2,….6). In order to avoid perfect collinearity with the intercept of the model, stratum 1 was the omitted variable, as was Salitre if the respondent was from this locality and the city of Bogotá. Five of the 500 respondents did not respond to the UTI question, therefore we used 495 responses for this analysis. Logistic regression estimates were reported using Odds Ratios. Both regression models and all statistical analyses were done using the Stata Version 12 software.
3. Results
3.1. Socioeconomic Characteristics
The majority of the respondents (68%) were between 18–45 years in age, and 55% were male (Table 2). About 32% had a university level education, and only 2.4% had post-graduate studies. Fifty % were in the middle-income strata (Strata 3 and 4), while 20% were in the lower income strata (Strata 1 and 2).
3.2. Perceptions of Benefits and Costs
We found that air purification was the most frequently identified benefit as opposed to water regulation and quality (Table 3). Most notably, flooding regulation was the least identified benefit in all three wetlands. In parks and green areas, air purification was the most identified benefit, but respondents did identify provisioning benefits in parks, however, similar to wetlands, flood regulation and water quality were the least mentioned in both parks and green areas (Table 3).
Overall respondents identified 11 different costs in the watershed (Table 4.). Two of the wetlands, Tibabuyes and Córdoba wetland, and two parks, Montereserva and Parque Nacional, had the most costs identified. Respondents in the Cordoba and Tibabuyes wetlands, for example, reported crime and lack of maintenance and drug use. The Las Delicias Riparian area, the Botanical Garden of Bogotá, and the Nogal Park were the areas with least amount of costs reported. Overall, drug use was the main cost reported in parks. Since crime is a frequently reported problem or ecosystem disservice reported in other international literature [1,4,22], we here forth focus on this specific cost in subsequent analyses. The Cordoba (70%) and Santa Maria del Lago (94%) wetlands were reported as the safest places—in regards to crime—as opposed to the Tibabuyes wetland, which was the most insecure, as only 8% of respondents considered it safe (Figure 2).
It appears that respondent’s perceptions regarding costs from urban ecosystems do affect their identification of benefits, and thus there appears to be a trade-off in the respondent’s sense of wellbeing when they feel unsafe relative to the benefits they perceive. In general, the areas identified as safest were those that had the greatest number of benefits identified. Conversely, in sites that were the least secure, respondents identified the least number of benefits in wetlands, parks, and green areas (Figure 2 and Table 3).
3.3. Factors Influencing Perceptions towards Benefits
Our OLS model shows that in general, environmental awareness coincided with a recognition of a greater number of environmental and cultural benefits (Table 5). Those with advanced degrees and that felt a greater sense of security, or lack of crime, also identified a greater number of environmental and cultural benefits. There was however no relationship between being born in Bogotá and the ability to identify benefits in the sub-watershed. In terms of respondents surveyed in parks, those with greater levels of education identified a statistically significant greater number of different environmental benefits. In wetlands, respondents: With more education, born in Bogota, and with more awareness about the local environment and climate change effects identified a greater number of environmental and cultural benefits. However, of those surveyed, respondents greater than 60 years old were those that identified the greatest number of environmental benefits (Table 5).
3.4. Factors Influencing the Conservation of Bogota´s Green Areas and Wetlands
Overall, 97% of respondents do consider that conserving the watershed’s wetlands and natural areas would improve the wellbeing of people living in their proximity. Forty-seven % felt that air quality improvement was the main benefit, followed by health and wellbeing (27%) and recreational activities (16%). However, when subsequently asked their WTI for an additional fee in their monthly utility bill to “protect and restore Bogotá’s natural areas”, 57% responded positively while 43% responded no. When asked why they were not willing to invest, 17% said that they already pay taxes and that this is the government´s responsibility, and an additional 16% said that they would not invest because of misuse of funds (i.e., corruption). However, of those that were WTI, 16% was because of improvement in wellbeing and protection of biodiversity (11%).
3.5. The Role of Governance and Unwillingness to Invest for Ecosystem Services
We found that WGOV was positively related and significant at all levels to a respondent´s UTI. According to the Odds Ratio, the chance of UTI for conservation was 31 times greater if the respondent perceived WGOV as opposed to strong governance (Table 6). When accounting for other socioeconomic variables, Odds Ratios show that if the respondent perceives WGOV, the UTI for conservation is 38 times greater than when perceiving strong governance (Table 7). The model shows that the control variables are not significant, however, WGOVC was very robust. Gender, age, and being born in Bogota were not significant, and the only significant related variables were for respondents in Strata 2 (upper lower income). That is, the Odds of UTI in strata 2 is 3.1, while for strata 6 (highest income) it is only 0.7.
4. Discussion
Below we will discuss and interpret our findings relative to the relevant literature; thus we will use the term “benefit” and “cost” [1] as synonymous with ecosystem service and disservices, respectively. Later we will discuss the relevance of the NCP framework to our analysis [16,18]. Overall, our findings are similar to those of many other studies in that cultural and environmental benefits were the most identified by respondents, specifically, air quality, aesthetics, well-being, and recreation [43]. Ecosystem service studies in more rural contexts in middle and low-income countries have found that people focus on provisioning ecosystem services or benefits as defined in this study [14,44]. In contrast, in our study these were the least reported. Other studies in natural areas and wetlands in Colombia have also reported that people primarily identify regulation and cultural ecosystem services [45]. However, we do note that water regulation and purification were the least reported benefits in the sub-watershed as opposed to air quality regulation, which was the most frequently reported ES in the study. Shade, as opposed to other studies, was also not a top benefit [6]; but “biodiversity” was also highly valued. Interestingly, we note that these two are considered “ecological structure or functions” in the “ecosystem service cascade” framework—not benefits per se [3,4]. Interestingly, Bogotá’s economic activities and topographic, high elevation, and precipitation characteristics, do not make air quality and temperature regulation issues as pressing as other Latin American cities; however, the city suffers regularly from floods and stormwater problems [38].
Overall, respondents from lower socio-economic strata perceived fewer benefits than those from higher income strata. Accordingly, one would surmise that these respondents spend less time in Bogota’s green areas, but Scopelliti, M. el al. [15] found that it was low and high socioeconomic strata residents that spent the least time in Bogota´s urban parks. Regardless, our weak governance results seem to indicate that lower income respondents do not feel that they are, or should, participate in the decision-making processes. Our results also show that socioeconomics does play a role in the perception towards benefits. Some specific relationships between socioeconomic factors and the identification of benefits have been reported in [46] and [42].
Although income and education are related, there is an obvious relationship between education and environmental awareness, particularly in regards to the hydrological functions. Allendorf, T. D. et al. [47] found that education level does indeed affect how people perceive ecosystem services. Our results were similar; where people with the highest level of education perceived more benefits than those without. One of the most insightful findings was the relationship between “wellbeing” and ecological structure-function-form in that the better maintained green areas were also those that were “safest” in terms of crime and where the majority of benefits were identified. Similarly, the majority of respondents were aware that there would be a loss in their wellbeing if these green areas were lost to land use change. Other research in Bogota has shown that public areas with increased tree-shrub-palm density and heights as well as tree plantings were related to lower incidences of crime and greater provision of benefits [19,38].
Based on Colombian program evaluation criteria [31] for principles and performance outcomes for good governance [34], our survey and modelling found that the perception of governance regarding public expenditures was playing an influential role in the WTI for benefits. Particularly, perceived weak governance was statistically related to people’s UTI in conserving green areas. This finding suggests that transparency, performance, and perceived corruption of government institutions can and will influence buy in and the value citizens place on the benefits from urban ecosystems [33,34]. Furthermore, the effect of governance on the UTI for benefits was not homogeneous across all socio-economic strata. Notably, respondents in Stratum 2 identified a weakness in governance, and this affected their subsequent odds of not investing for conservation–benefits related initiatives; this was on average three times greater than individuals from higher socio-economic strata. Although income and education were related [48], there is an obvious relationship between education and environmental awareness in particular to the hydrological functions and other co-benefits [13,49].
The perception of weak or strong governance on watershed and ecosystem management, conservation, and urban ecosystem services—or benefits as defined in this study—has been previously studied by [21,23,26,28,35]. Based on this literature and our findings, one of the main contributions of this study is that we have identified an influence of weak governance (i.e., lack of transparency, perceived corruption, and poor government performance) on how society values the urban green space benefits from Neotropical urban green areas and watersheds. Such information is key for improved governance, effective conservation, and sustainable provision of benefits to society [24,50].
Our literature review shows how governance is a complex metaphor, and that it has many definitions and is used in the context of urban ES and biodiversity studies; yet few studies have actually attempted to measure it and how it can influence urban benefits-costs, biodiversity, NCP or Nature-based Solutions [24,29]. Thus, to provide for a measure of governance, our study measured governance as consisting of: Transparency, corruption, and government performance. Our measure also incorporated aspects of Launay G.C. et al. [31] and Lockwood, M.’s [34] definitions of good governance as encompassing: Legitimacy, transparency, accountability, inclusiveness, fairness, connectivity, and resilience. Accordingly, we found that our corruption and transparency variables can be used as proxies for perceived corruption, and that funds intended for green area conservation might not be used appropriately as perceived by respondents. Similarly, our tax payment variables accounted for legitimacy, accountability, and government performance (i.e., trust). As such, we found that although residents pay taxes, many respondents are seeing fewer direct benefits (Table 6). Additional variables regarding the government´s responsibility for maintaining green areas accounted for the lack of inclusiveness, fairness, and overall transparency (Table 6). We found that even though respondents knew that the public areas they used and pay taxes for—and subsequently received benefits from them—they indicated a lack of confidence and poor government performance that inevitably affected their response.
We recognize that our use of “socio-economic and ecological processes”, “ES/ED”, and “benefits and costs” does not match the conventional ES typology and framework. Additionally, we note that we did not randomly sample individual sites in the watershed and that our sample size could have been greater. There will also be bias in our results because the surveyor did not randomly survey individuals or specific places in each site. Similarly, concepts such as governance and costs as pointed out by our literature review are complex metaphors to define and measure. Environmental values, resource conflicts, power relationships, green infrastructure types, and structure will also affect how people perceive benefits-cost bundles [20]; these were not studied though. However, given security and access issues and our review of the relevant literature, we feel that our approach and modelling results do provide initial insights into the role of perception and the role of governance on urban green area benefits and costs in a major Latin America city.
Future research could study the perceptions towards benefits and costs and the effect of other field and in situ cognitive measurements of green space and forest structure and composition. As indicated by a reviewer, the opportunity exists for also including other questions as explanatory variables in our models for better understanding citizen opinions of these functions such as perceptions regarding costs, difference dimension of governance, or other environmental and social capital factors and how they affect the valuation of benefits. Indeed, other biophysical factors such as size and density of green areas per neighborhood could also affect human well-being [2]. Similarly, using other methods from environmental psychology and experimental economics could also offer other causal insights as well. That said, the approach used in our study to measure benefits and effects of weak governance and institutional transparency can be used in adopting and improving ecosystem service-governance frameworks such as those proposed by [13,51], and [24] to Latin American socio-ecological systems and their contexts [20]. Implications can also be made regarding the relevance and application of “Nature-Based Solutions” or a more culturally and context relevant approach such as the recently proposed “NCP”; a particularly promising metaphor (Table 3) [18].
Indeed, management and governance of the wetlands and green areas in Bogotá as a public resource does require accounting for such multiple and complex issues and language [3,50]. Our findings, for example, also show the importance of focusing environmental education efforts and topics on certain demographic groups. Although people were knowledgeable about the environment, biodiversity, and nature and its benefits, there was a notable lack of awareness regarding the important hydrological benefits provided by the watershed’s green areas. As such, there is an opportunity to educate the public about the existence and benefits of the positive ecological processes provided by wetlands and parks for the protection of lives and property in Bogotá. Finally, based on our study area and findings, in order to get buy in from society in conservation efforts, it is essential that public institutions improve their perceived lack of transparency an performance [31,33,34,35].
Sarkki, S. et al. [51] proposed different types of “governance services” for different arenas (i.e., policy, markets, society, science) as a way to understand ecosystem service dynamics and incorporate them into management and planning frameworks. Falk, T. et al. [36] also proposed that governance types need to be adapted according to specific benefit types and institutions. Therefore, key to linking well-being with governance and policy uptake is to identify a given society´s perceptions and values concerning the benefits and costs from green areas [24,50]. However, much of this ecosystem services-governance literature presents concepts, conceptual frameworks, and case studies primarily from countries in the Global North and wildland, rural ecosystem-based contexts [16,24,33]. However, our findings add to the emerging ecosystem services, NCP, and governance literature in that we: Addressed socio-ecological dynamics for low-middle income contexts, measured governance using evaluation metrics, and informed how policy processes and incentives can affect citizen´s UTI in green space and wetland conservation.
5. Conclusions
Our findings provide very basic and useful, yet overlooked, information and guidelines for managers, educators, policy makers, and local planners. In particular, urban park and wetland users can identify the various benefits from urban nature. However, as in the case of water regulation, information needs to be targeted and context-specific. That is, in surveyed wetlands, people perceived that air quality was more important than water regulation. Despite the fact that flooding and water quality problems are much more acute problems in the sub-watershed than air quality issues. Additionally, we found that conventional ES typologies and frameworks developed in high income countries need to be adjusted and adapted in order to match the realities on the Global South. The NCP or Nature-Based Solutions approaches as such provide fertile grounds for future use and application in places such as Latin America cities.
Similarly, people’s perception of crime and the overall lack of maintenance and infrastructure influenced the overall benefit’s they identified from green areas. This was particularly evident with respondents from lower socio-economic neighborhoods. So, people with different education and socioeconomic levels do weigh the tradeoffs of personal security and perceived lack of governance against the conservation and provision benefits of and from these areas in different ways. In particular, costs such as crime and litter did affect them, but detrimental ecosystem structures and their negative functions are easily addressed in a relatively low-cost manner and can effectively influence how people perceive these urban benefits. Thus, it is important for planners to consider safety and maintenance of wetlands and parks because basic simple management, maintenance, and planning activities can play a role in people´s perception and probably in attitudes and investment of public resources towards those areas.
Accordingly, conservation and effective management of wetlands, parks, and green areas is key, and citizens can indeed identify the benefits versus the costs of conserving them. In order to provide long-term benefits from urban ecosystems, effective governance processes and environmental education efforts based on the premise that humans are integral parts of social–ecological systems is key. The perception of good governance is regularly considered important in this link, but the perceived lack of transparency will be a limiting factor in people´s buy in and willingness to invest in and maintain the necessary ecological structure that provides the most benefits and minimizes costs. Accordingly, lack of governance processes and trust towards the institutions developing and implementing them will affect the effectiveness of existing planning and management goals.
The benefits and costs of urban green areas—be they referred to as ecological processes, biodiversity, ES, ED, NCPs, or nature-based solutions, are key in improving the social, economic, and environmental well-being of citizens; regardless of the metaphor used. Participatory management and planning of urban green areas requires information on how the different segments of society perceive both the benefits and costs of urban socio-ecosystem functions. Thus, effective institutional capacities and transparent state and non-state centered processes require information on what the different actors perceive about not only ES/ED, but of the governance and policy processes inherent in delivering the supply of benefits—and the mitigation of costs—from wetlands and green areas. Indeed, where good governance is absent, “bottom up” initiatives by citizens are one means to move towards improving the well-being of people living in urban and peri-urban areas of the Global South; regardless of what metaphors scientists from the Global North desire to use to describe these benefits and costs.
Author Contributions
Conceptualization, A.P.-G. and F.J.E.; methodology, F.J.E. and A.P.-G.; formal analysis, A.P.-G., F.C., and F.J.E.; writing—original draft preparation, A.P.-G. and F.J.E.; writing—review and editing, F.J.E., A.P.-G., and F.C. All authors have read and agreed to the published version of the manuscript.
Funding
This research received no external funding.
Data Availability Statement
The data presented in this study are available on request from A.P.-G. and the corresponding author. The data are not publicly available due to personal data and contact information collected as part of the survey.
Acknowledgments
We thank the Jardin Botánico de Bogotá- José Celestino Mutis for funding and leading this project particularly Carlos Fonseca, José Lopez, Catalina Lopera, and Maribel Vasquez for their assistance and coordination of field crews. We are also grateful to the Universidad del Rosario´s Biology Program’s undergraduate Socio-ecological Systems class for their valuable contribution to this work. In particular, we thank Mari Paula Otero, Sara Pedraza, Andrea Aragon, Daniel A Quevedo, and Nubia Vazquez.
Conflicts of Interest
The authors declare no conflict of interest.
Appendix A

Table A1.
Table listing response variables, units, and data types for the survey instrument presented in Supplementary Material A. Note: Only analyzed responses and variables are presented.
Table A1.
Table listing response variables, units, and data types for the survey instrument presented in Supplementary Material A. Note: Only analyzed responses and variables are presented.
| Question | Response Variable | Data Type/Units | How Data Were Analyzed |
|---|---|---|---|
| Is this place offering any benefits? | Awareness of ecosystem functions | Yes/No | Dichotomous variable 1 = This place is offering benefits. 0 = This place is not offering benefits. |
| Which of the following benefits is this place offering? | Perceptions of Ecosystem Services: Regulation:
| Categorical | Variables for each ES Category. Regulation: Number of ES identified in this category. Cultural: Number of ES identified in this category. Provisioning: Number of ES identified in this category. |
| Which are the most important benefits for you? | Items in #2 were assigned an importance 1; being the most important | Ranking | This variable was not used for the statistical analyzes. |
| Would losing these benefits affect you? | Perceptions of benefits | Yes/No | Dichotomous variable. 1=People consider that losing of these benefits affect them. 0 = People consider that losing of these benefits affects them. |
| What problems does this place present? | Perception of Ecosystem Disservices Environmental
| Categorical | Variables for each EDS |
| Is this place safe? | Perception of security | Yes/No | Dichotomous variable 1 = Safe 0 = Unsafe |
| Do you believe that protecting natural areas improves the wellbeing of people living nearby? | Perceptions of benefits | Yes/No | Dichotomous variable 1 = Improvement of wellbeing 0 = No Improvement |
| Do you think urbanization affects quality of water and flooding? | Perception of urbanization’s effects on water regulation benefits | Yes/No | Dichotomous variable. 1 = Urbanization affects quality of water. 0 = Urbanization has no affects on quality of water. |
| Can you identify 3 trees, palms, or plants in this place? | Biodiversity awareness | Yes/No | Dichotomous variable. This variable was used to create the environmental awareness variable. We used the polychronic command in Stata to perform the new variable. 1 = At least 1 plant was identified 0 = None |
| Are you aware of Reserva Forestal Protectora Bosque Oriental de Bogotá? | Policy awareness | Yes/No | Dichotomous variable. This variable was used to create the environmental awareness variable. We used the polychronic command in Stata to perform the new variable. 1 = People are aware of the Reserva Forestal Bosque Oriental 0 = People are not aware of the Reserva Forestal Bosque Oriental. |
| Is this reserve important for Bogotá’s citizens’ wellbeing? | Policy awareness | Yes/No | Dichotomous variable 1 = Reserve important for Bogotá’s citizens’ wellbeing 0 = Reserve is not important |
| Can you name wetlands that are located in Bogota? | Names of wetlands mentioned by respondents: | Categorical | Dichotomous variable. This variable was used to create the environmental awareness variable. We used the polychronic command in Stata to perform the new variable. 1 = At least 1 wetland is identified 0 = None |
| Humedales de Bogotá | |||
| Humedal Juan Amarillo o Tibabuyes | |||
| Humedal Córdoba | |||
| Humedal La Conejera | |||
| Humedal de Santa María del lago | |||
| Humedal El burro | |||
| Humedal de Jaboque | |||
| Humedal La vaca | |||
| Humedal Torca-Guaymaral | |||
| Humedal Tibanica | |||
| Humedal de Capellanía | |||
| Humedal Salitre | |||
| Humedal La Florida | |||
| Humedal Chicú | |||
| Humedal Libélula | |||
| Humedal de Techo | |||
| Humedal Laguna de Chinará | |||
| Humedal Techo | |||
| Humedales Autopista Norte | |||
| Complejo de humedales El Tunjo | |||
| Humedal Capellanía | |||
| Humedal Chiguasuque | |||
| Humedal El Salitre | |||
| Humedal Timiza | |||
| Are you willing to invest an additional amount in monthly utilities for programs that protect and recover natural areas in Bogotá? | Willingness to pay:
| Categorical Colombian Pesos (COP) | Dichotomous variable that was used to create Unwillingness to Invest (UTI). If UTI = 1; conversely, UTI = 0 if people were willing to pay. |
| Why are you willing to invest or not? | Governance responses
| Categorical | Variable used to create weak governance if response was: 1. Perception of corruption or funds not used appropriately, 2. Conservation of green areas and wetlands is already paid for in taxes, 3. The respondents already pay too much tax, and 4. It is the government´s responsibility to conserve green areas. |
| Do you believe that climate change is happening? | Climate change awareness | Yes/No | Dichotomous variable. 1 = Believe in Climate change 2 = Do not believe in Climate change |
References
- Nowak, D.J.; Dwyer, J.F. Understanding the benefits and costs of urban forest ecosystems. In Urban and Community Forestry in the Northeast; Springer: Dordrecht, The Netherlands, 2007; pp. 25–46. [Google Scholar]
- Valente, D.; Pasimeni, M.R.; Petrosillo, I. The role of green infrastructures in Italian cities by linking natural and social capital. Ecol. Indic. 2020, 108, 105694. [Google Scholar] [CrossRef]
- Haase, D.; Larondelle, N.; Andersson, E.; Artmann, M.; Borgström, S.; Breuste, J.; Gomez-Baggethun, E.; Gren, Å.; Hamstead, Z.; Hansen, R.; et al. A quantitative review of urban ecosystem service assessments: Concepts, models, and implementation. Ambio 2014, 43, 413–433. [Google Scholar] [CrossRef] [PubMed] [Green Version]
- Escobedo, F.J.; Kroeger, T.; Wagner, J.E. Urban forests and pollution mitigation: Analyzing ecosystem services and disservices. Environ. Pollut. 2011, 159, 2078–2087. [Google Scholar] [CrossRef] [PubMed]
- Lyytimäki, J.; Petersen, L.K.; Normander, B.; Bezák, P. Nature as a nuisance? Ecosystem services and disservices to urban lifestyle. Environ. Sci. 2008, 5, 161–172. [Google Scholar] [CrossRef] [Green Version]
- Soto, J.R.; Escobedo, F.J.; Khachatryan, H.; Adams, D.C. Consumer demand for urban forest ecosystem services and disservices: Examining trade-offs using choice experiments and best-worst scaling. Ecosyst. Serv. 2018, 29, 31–39. [Google Scholar] [CrossRef]
- Andersson, E.; Barthel, S.; Ahrné, K. Measuring social–Ecological dynamics behind the generation of ecosystem services. Ecol. Appl. 2007, 17, 1267–1278. [Google Scholar] [CrossRef] [Green Version]
- Ernstson, H.; Barthel, S.; Andersson, E.; Borgström, S.T. Scale-crossing brokers and network governance of urban ecosystem services: The case of stockholm. Ecol. Soc. 2010, 15, 28. [Google Scholar] [CrossRef]
- Kabisch, N. Ecosystem service implementation and governance challenges in urban green space planning—The case of Berlin, Germany. Land Use Policy 2015, 42, 557–567. [Google Scholar] [CrossRef]
- Lyytimäki, J.; Sipilä, M. Hopping on one leg–The challenge of ecosystem disservices for urban green management. Urban For. Urban Green. 2009, 8, 309–315. [Google Scholar] [CrossRef]
- Andersson, E.; McPhearson, T.; Kremer, P.; Gomez-Baggethun, E.; Haase, D.; Tuvendal, M.; Wurster, D. Scale and context dependence of ecosystem service providing units. Ecosyst. Serv. 2015, 12, 157–164. [Google Scholar] [CrossRef]
- Haase, D.; Frantzeskaki, N.; Elmqvist, T. Ecosystem Services in Urban Landscapes: Practical Applications and Governance Implications. Ambio 2014, 43, 407–412. [Google Scholar] [CrossRef] [PubMed]
- Balooni, K.; Gangopadhyay, K.; Kumar, B.M. Governance for private green spaces in a growing Indian city. Landsc. Urban Plan. 2014, 123, 21–29. [Google Scholar] [CrossRef]
- Daw, T.M.; Brown, K.; Rosendo, S.; Pomeroy, R. Applying the ecosystem services concept to poverty alleviation: The need to disaggregate human well-being. Environ. Conserv. 2011, 38, 370–379. [Google Scholar] [CrossRef] [Green Version]
- Scopelliti, M.; Carrus, G.; Adinolfi, C.; Suárez-Cáceres, G.; Colangelo, G.; Lafortezza, R.; Panno, A.; Sanesi, G. Staying in touch with nature and well-being in different income groups: The experience of urban parks in Bogotá. Landsc. Urban Plan. 2016, 148, 139–148. [Google Scholar] [CrossRef]
- Pascual, U.; Balvanera, P.; Díaz, S.; Pataki, G.; Roth, E.; Stenseke, M.; Watson, R.T.; Dessane, E.B.; Islar, M.; Kelemen, E.; et al. Valuing nature’s contributions to people: The IPBES approach. Curr. Opin. Environ. Sustain. 2017, 26–27, 7–16. [Google Scholar] [CrossRef] [Green Version]
- Escobedo, F.J.; Giannico, V.; Jim, C.Y.; Sanesi, G.; Lafortezza, R. Urban forests, ecosystem services, green infrastructure and nature-based solutions: Nexus or evolving metaphors? Urban For. Urban Green. 2019, 37, 3–12. [Google Scholar] [CrossRef]
- Dıaz, S.; Pascual, U.M.; Stenseke, B.; Martın-López, R.T.; Watson, Z.; Molnár, R.; Hill, K.M.; Chan, I.A.; Baste, K.A.; Brauman, S.; et al. Assessing nature’s contributions to people: Recognizing culture, and diverse sources of knowledge, can improve assessments. Science 2018, 359, 270–272. [Google Scholar]
- Carriazo, F. Arborización y crimen urbano en Bogotá. IDEAS. 2017. Documentos CEDE 015286, Universidad de los Andes - CEDE. Available online: https://ideas.repec.org/p/col/000089/015286.html (accessed on 26 December 2020).
- Dobbs, C.; Escobedo, F.J.; Clerici, N.; De La Barrera, F.; Eleuterio, A.A.; MacGregor-Fors, I.; Reyes-Paecke, S.; Vásquez, A.; Camaño, J.D.Z.; Hernández, H.J. Urban ecosystem Services in Latin America: Mismatch between global concepts and regional realities? Urban Ecosyst. 2019, 22, 173–187. [Google Scholar] [CrossRef]
- Chaudhry, P.; Singh, B.; Tewari, V.P. Non-market economic valuation in developing countries: Role of participant observation method in CVM analysis. J. For. Econ. 2007, 13, 259–275. [Google Scholar] [CrossRef]
- Kenward, R.E.; Whittingham, M.J.; Arampatzis, S.; Manos, B.D.; Hahn, T.; Terry, A.; Simoncini, R.; Alcorn, J.; Bastian, O.; Donlan, M.; et al. Identifying governance strategies that effectively support ecosystem services, resource sustainability, and biodiversity. Proc. Natl. Acad. Sci. USA 2011, 108, 5308–5312. [Google Scholar] [CrossRef] [Green Version]
- Kreye, M.M.; Adams, D.C.; Escobedo, F.J.; Soto, J.R. Does policy process influence public values for forest-water resource protection in Florida? Ecol. Econ. 2016, 129, 122–131. [Google Scholar] [CrossRef] [Green Version]
- Huang, C.-W.; McDonald, R.I.; Seto, K.C. The importance of land governance for biodiversity conservation in an era of global urban expansion. Landsc. Urban Plan. 2018, 173, 44–50. [Google Scholar] [CrossRef]
- Perkins, H.A. Out from the (Green) shadow? Neoliberal hegemony through the market logic of shared urban environmental governance. Politi Geogr. 2009, 28, 395–405. [Google Scholar] [CrossRef]
- Turnhout, E.; Neves, K.; De Lijster, E. ‘Measurementality’ in Biodiversity Governance: Knowledge, Transparency, and the Intergovernmental Science-Policy Platform on Biodiversity and Ecosystem Services (Ipbes). Environ. Plan. A Econ. Space 2014, 46, 581–597. [Google Scholar] [CrossRef]
- Bell, S.; Hindmoor, A. Governance without government? The case of the forest stewardship council. Public Adm. 2011, 90, 144–159. [Google Scholar] [CrossRef]
- Lawrence, A.; De Vreese, R.; Johnston, M.; Bosch, C.C.K.V.D.; Sanesi, G. Urban forest governance: Towards a framework for comparing approaches. Urban For. Urban Green. 2013, 12, 464–473. [Google Scholar] [CrossRef]
- Connolly, J.J.; Svendsen, E.S.; Fisher, D.R.; Campbell, L.K. Organizing urban ecosystem services through environmental stewardship governance in New York City. Landsc. Urban Plan. 2013, 109, 76–84. [Google Scholar] [CrossRef]
- Van Den Bosch, C.C.K.; Rodbell, P.; Salbitano, F.; Sayers, K.; Villarpando, S.J.; Yokohari, M. The changing governance of urban forests. Unasylva 2018, 69, 37–42. [Google Scholar]
- Launay-Gama, C.; Pachón, M. Prácticas de evaluación de la gobernanza en América Latina; Universidad de Los Andes: Bogotá, Colombia, 2011. [Google Scholar]
- Atmiş, E.; Batuhan Günşen, H.; Yücedağ, C.; Lise, W. Factors affecting the use of urban forests in Turkey. Turk. J. For. 2017, 18, 1–10. [Google Scholar] [CrossRef] [Green Version]
- Shackleton, R.T.; Angelstam, P.; Van Der Waal, B.; Elbakidze, M. Progress made in managing and valuing ecosystem services: A horizon scan of gaps in research, management and governance. Ecosyst. Serv. 2017, 27, 232–241. [Google Scholar] [CrossRef]
- Lockwood, M. Good governance for terrestrial protected areas: A framework, principles and performance outcomes. J. Environ. Manag. 2010, 91, 754–766. [Google Scholar] [CrossRef] [PubMed]
- Barrett, C.; Gibson, C.; Hoffman, B.; Mccubbins, M. The complex links between governance and biodiversity. Conserv. Biol. 2006, 20, 1358–1366. [Google Scholar] [CrossRef] [PubMed] [Green Version]
- Falk, T.; Spangenberg, J.H.; Siegmund-Schultze, M.; Kobbe, S.; Feike, T.; Kuebler, D.; Settele, J.; Vorlaufer, T. Identifying governance challenges in ecosystem services management—Conceptual considerations and comparison of global forest cases. Ecosyst. Serv. 2018, 32, 193–203. [Google Scholar] [CrossRef]
- Piña, W.H.A.; Martínez, C.I.P. Urban material flow analysis: An approach for Bogotá, Colombia. Ecol. Indic. 2014, 42, 32–42. [Google Scholar] [CrossRef]
- Escobedo, F.J.; Clerici, N.; Staudhammer, C.L.; Corzo, G.T. Socio-ecological dynamics and inequality in Bogotá, Colombia’s public urban forests and their ecosystem services. Urban For. Urban Green. 2015, 14, 1040–1053. [Google Scholar] [CrossRef]
- Meza, C.A. Crossroads and Conflict. Urbanization, Conservation and Rurality in the Eastern Mountains of Bogotá. Rev. Colomb. Antropol. 2008, 44, 439–480. [Google Scholar] [CrossRef]
- Escobedo, F.J.; Clerici, N.; Staudhammer, C.L.; Feged-Rivadeneira, A.; Bohorquez, J.C.; Tovar, G. Trees and Crime in Bogota, Colombia: Is the link an ecosystem disservice or service? Land Use Policy 2018, 78, 583–592. [Google Scholar] [CrossRef]
- Wurster, D.; Artmann, M. Development of a Concept for Non-monetary Assessment of Urban Ecosystem Services at the Site Level. Ambio 2014, 43, 454–465. [Google Scholar] [CrossRef] [Green Version]
- Martín-López, B.; Iniesta-Arandia, I.; García-Llorente, M.; Palomo, I.; Casado-Arzuaga, I.; Del Amo, D.G.; Gómez-Baggethun, E.; Oteros-Rozas, E.; Palacios-Agundez, I.; Willaarts, B.; et al. Uncovering Ecosystem Service Bundles through Social Preferences. PLoS ONE 2012, 7, e38970. [Google Scholar] [CrossRef] [Green Version]
- Dobbs, C.; Hernández-Moreno, Á.; Reyes-Paecke, S.; Miranda, M.D. Exploring temporal dynamics of urban ecosystem services in Latin America: The case of Bogota (Colombia) and Santiago (Chile). Ecol. Indic. 2018, 85, 1068–1080. [Google Scholar] [CrossRef]
- Agbenyega, O.; Burgess, P.J.; Cook, M.; Morris, J. Application of an ecosystem function framework to perceptions of community woodlands. Land Use Policy 2009, 26, 551–557. [Google Scholar] [CrossRef] [Green Version]
- Ricaurte, L.F.; Olaya-Rodríguez, M.H.; Cepeda-Valencia, J.; Lara, D.; Arroyave-Suárez, J.; Finlayson, C.M.; Palomo, I. Future impacts of drivers of change on wetland ecosystem services in Colombia. Glob. Environ. Chang. 2017, 44, 158–169. [Google Scholar] [CrossRef]
- Hartter, J.; Goldman, A. Local responses to a forest park in western Uganda: Alternate narratives on fortress conservation. Oryx 2010, 45, 60–68. [Google Scholar] [CrossRef] [Green Version]
- Allendorf, T.D.; Yang, J. The role of ecosystem services in park–people relationships: The case of Gaoligongshan Nature Reserve in southwest China. Biol. Conserv. 2013, 167, 187–193. [Google Scholar] [CrossRef]
- García-Suaza, A.F.; Guataquí, J.C.; Guerra, J.A.; Maldonado, D. Beyond the Mincer equation: The internal rate of return to higher education in Colombia. Educ Econ. 2014, 22, 328–344. [Google Scholar] [CrossRef]
- Kadykalo, A.N.; López-Rodriguez, M.D.; Ainscough, J.; Droste, N.; Ryu, H.; Ávila-Flores, G.; Le Clec’H, S.; Muñoz, M.C.; Nilsson, L.; Rana, S.; et al. Disentangling ‘ecosystem services’ and ‘nature’s contributions to people’. Ecosyst. People 2019, 15, 269–287. [Google Scholar] [CrossRef] [Green Version]
- Acey, C. Managing wickedness in the Niger Delta: Can a new approach to multi-stakeholder governance increase voice and sustainability? Landsc. Urban Plan. 2016, 154, 102–114. [Google Scholar] [CrossRef]
- Sarkki, S. Governance services: Co-producing human well-being with ecosystem services. Ecosyst. Serv. 2017, 27, 82–91. [Google Scholar] [CrossRef]
Figure 1.
The El Salitre urban sub-watershed in Bogota, Colombia, and its socioeconomic strata and ten sample sites.
Figure 1.
The El Salitre urban sub-watershed in Bogota, Colombia, and its socioeconomic strata and ten sample sites.

Figure 2.
Number of responses towards the perception of levels of a cost in the form of high crime (Unsafe) and low crime (Safe) in 10 different green areas and wetlands in the El Salitre sub-watershed in Bogotá, Colombia.
Figure 2.
Number of responses towards the perception of levels of a cost in the form of high crime (Unsafe) and low crime (Safe) in 10 different green areas and wetlands in the El Salitre sub-watershed in Bogotá, Colombia.

Table 1.
Ten different sites characterizing three different green area types in the urban sub-watershed of El Salitre, Bogota Colombia.
Table 1.
Ten different sites characterizing three different green area types in the urban sub-watershed of El Salitre, Bogota Colombia.
| Site | Socioeconomic Strata | Use |
|---|---|---|
| Wetlands | ||
| Tibabuyes—Juan Amarillo | 2 | Largest wetland in Bogota (223 has) |
| Córdoba | 5 | 40-hectare wetland with the highest number of registered bird species |
| Santa María del Lago | 3 | 11-hectare wetland with high visitor use and water quality |
| Parks | ||
| Parque Nacional Enrique Olaya Herrera | 3 | 283-hectare recreational park bordering an extensive forest reserve to the east of Bogota |
| Parque de los Novios | 3 | 23-hectare recreational park with a large lake in the center |
| Parque El Nogal | 5 | 3100 m2 recreational park in a residential and business district |
| Park Way | 4 | Linear, recreational park 30 m in width extending for about 9 city blocks |
| Parque Montereserva | 6 | Recreational green space adjacent to multi-story residential buildings |
| Green areas | ||
| Jardín Botánico de Bogotá | 3 | Municipal botanical garden |
| Quebrada las delicias | 1 | Conservation riparian area at the edge of forest reserve to the east of Bogota |
Table 2.
Socioeconomic characteristics of respondents in the El Salitre sub-watershed in Bogota, Colombia.
Table 2.
Socioeconomic characteristics of respondents in the El Salitre sub-watershed in Bogota, Colombia.
| Socioeconomic Characteristics | N | Mean | Std. Dev. |
|---|---|---|---|
| Age (years) | |||
| <18 | 500 | 9.60% | 0.2949 |
| 18–30 | 500 | 44.60% | 0.4976 |
| 31–45 | 500 | 24.20% | 0.4287 |
| 46–60 | 500 | 14.40% | 0.3514 |
| >60 | 500 | 7.20% | 0.2587 |
| Gender | |||
| Female | 500 | 44.80% | 0.4978 |
| Male | 500 | 55.20% | 0.4978 |
| Education | |||
| None | 500 | 0.40% | 0.0635 |
| Preschool-Primary | 500 | 11.31% | 0.3170 |
| Secondary | 500 | 42.82% | 0.4983 |
| Technical | 500 | 10.30% | 0.3043 |
| Professional-Technological | 500 | 32.32% | 0.4681 |
| Specialization/Masters/ Postgraduate | 500 | 2.42% | 0.1539 |
| Doctorate | 500 | 0.2% | 0.0449 |
| Socioeconomic Strata | |||
| 1-Lower | 500 | 10% | 0.3003 |
| 2-Upper lower | 500 | 10% | 0.3003 |
| 3-Lower middle | 500 | 30% | 0.4587 |
| 4-Middle | 500 | 20% | 0.4004 |
| 5-Upper middle | 500 | 20% | 0.4004 |
| 6-Upper class | 500 | 10% | 0.3003 |
N, Number; Std. Dev., Standard Deviation.
Table 3.
Perception towards benefits in 10 different green areas and wetlands in the El Salitre sub-watershed. Note: We integrate both the ecosystem services and nature’s contribution to people (NCP) metaphors to better represent Bogota, Colombia’s context and what citizens value from ecosystems and nature.
| Wetlands | Parks | Green Areas | |||||||||
|---|---|---|---|---|---|---|---|---|---|---|---|
| Ecosystem Services/NCP | Benefits | Córdoba | Santa María del Lago | Tibabuyes | Montereserva | Park Way | Los Novios | El Nogal | Parque Nacional | Quebrada las Delicias | Jardín Botánico |
| Provision | Food | 0% | 0% | 0% | 2% | 0% | 0% | 0% | 0% | 0% | 0% |
| Shadow | 0% | 0% | 0% | 0% | 4% | 0% | 0% | 0% | 0% | 0% | |
| Regulation | Air purification | 96% | 100% | 66% | 90% | 80% | 98% | 94% | 88% | 90% | 100% |
| Water purification | 64% | 54% | 32% | 50% | 38% | 46% | 28% | 50% | 84% | 66% | |
| Climate regulation | 48% | 80% | 34% | 62% | 62% | 66% | 72% | 64% | 74% | 72% | |
| Flood mitigation | 32% | 62% | 22% | 52% | 34% | 50% | 30% | 44% | 42% | 42% | |
| Biodiversity | 54% | 90% | 48% | 68% | 66% | 78% | 82% | 84% | 84% | 90% | |
| Cultural | Sense of well-being | 78% | 84% | 58% | 80% | 80% | 86% | 92% | 94% | 92% | 92% |
| Aesthetics | 72% | 82% | 76% | 78% | 80% | 90% | 84% | 94% | 90% | 94% | |
| Recreation | 88% | 80% | 62% | 66% | 64% | 92% | 90% | 90% | 86% | 88% | |
| Employment | 0% | 0% | 0% | 0% | 2% | 0% | 0% | 2% | 0% | 0% | |
Table 4.
Perception towards costs in 10 different green areas and wetlands in the El Salitre sub-watershed. Note: We integrate both the ecosystem disservices and problems from nature metaphors to better represent Bogota, Colombia’s context and what citizens least value from ecosystems and nature.
Table 4.
Perception towards costs in 10 different green areas and wetlands in the El Salitre sub-watershed. Note: We integrate both the ecosystem disservices and problems from nature metaphors to better represent Bogota, Colombia’s context and what citizens least value from ecosystems and nature.
| Wetlands | Parks | Green areas | |||||||||
|---|---|---|---|---|---|---|---|---|---|---|---|
| Ecosystem Disservices | Costs | Córdoba | Santa María del Lago | Tibabuyes | Montereserva | Park Way | Los Novios | El Nogal | Parque Nacional | Quebrada las Delicias | Jardín Botánico |
| Environmental | Falling branches and trees | 30% | 30% | 18% | 28% | 24% | 22% | 20% | 30% | 34% | 4% |
| Trash and refuse | 28% | 24% | 76% | 42% | 28% | 24% | 18% | 52% | 36% | 4% | |
| Invasive vegetation | 0% | 0% | 0% | 0% | 0% | 0% | 0% | 0% | 4% | 0% | |
| Pet excrement | 2% | 2% | 0% | 0% | 0% | 2% | 6% | 0% | 0% | 0% | |
| Insects or rats | 24% | 28% | 50% | 32% | 26% | 28% | 16% | 12% | 4% | 0% | |
| Financial | Maintenance costs | 18% | 10% | 14% | 24% | 16% | 32% | 18% | 10% | 0% | 4% |
| Lack of maintenance | 40% | 56% | 62% | 44% | 32% | 34% | 14% | 54% | 26% | 2% | |
| Illicit drug sales and use | 32% | 26% | 82% | 40% | 40% | 34% | 54% | 60% | 24% | 2% | |
| Social | Crime | 44% | 12% | 84% | 34% | 52% | 10% | 14% | 76% | 56% | 2% |
| Fear | 32% | 14% | 42% | 36% | 26% | 36% | 22% | 40% | 6% | 2% | |
| Rhinitis or allergies | 6% | 14% | 32% | 38% | 8% | 22% | 14% | 18% | 4% | 2% | |
| Other | None | 32% | 22% | 0% | 24% | 6% | 22% | 8% | 0% | 16% | 82% |
Table 5.
Ordinary least squares regression model for socioeconomic factors that influence the environmental, cultural, and provision benefits identified in the El Salitre watershed (Robust standard errors in parenthesis) *** p < 0.01, ** p < 0.05, * p < 0.1.
Table 5.
Ordinary least squares regression model for socioeconomic factors that influence the environmental, cultural, and provision benefits identified in the El Salitre watershed (Robust standard errors in parenthesis) *** p < 0.01, ** p < 0.05, * p < 0.1.
| Variables | Number of Regulation ES in the Watershed | Number of Cultural ES in the Watershed | Number of Provision ES in the Watershed |
|---|---|---|---|
| (1) | (2) | (3) | |
| Environmental awareness a | 0.207 ** (0.0987) | 0.177 *** (0.0574) | 0.00626 (0.00443) |
| Sense of security—Crime | 0.466 *** (0.152) | 0.170 * (0.0985) | 0.0116 * (0.00678) |
| Higher education (> university degree) | 0.878 *** (0.317) | 0.553 *** (0.0905) | 0.00150 (0.00382) |
| Between 31 and 45 years old | 0.0103 (0.156) | −0.140 (0.0947) | −0.00826 (0.00510) |
| Between 46 and 60 years old | 0.329 (0.244) | 0.0406 (0.110) | −0.00911 (0.00568) |
| Greater than 60 years old | 0.0714 (0.220) | −0.0875 (0.126) | 0.00550 (0.0125) |
| Recognizes climate change effects | 0.903 ** (0.351) | 0.900 *** (0.268) | −0.0436 (0.0436) |
| Born in Bogotá | 0.00404 (0.138) | −0.192 ** (0.0785) | −7.29e-05 (0.00628) |
| Constant | 1.739 *** (0.380) | 1.481 *** (0.282) | 0.0349 (0.0394) |
| Surveys | 499 | 499 | 499 |
| R2 | 0.0634 | 0.095 | 0.021 |
| F statistic | 3.662 | 9.306 | 0.380 |
a The environmental awareness variable consisted of 3 questions: Can you identify 3 trees, palms, or plants in this place? Are you aware of the Reserva Forestal Protectora Bosque Oriental de Bogotá (the adjacent large extensive forest reserve to the east of the city)?; and Can you name wetlands that are located in Bogota? (Appendix A).
Table 6.
Logistic regression a and Odds Ratio of the effects of weak governance (WGOV) on people’s Unwillingness to invest (UTI) for urban ecosystem benefits.
Table 6.
Logistic regression a and Odds Ratio of the effects of weak governance (WGOV) on people’s Unwillingness to invest (UTI) for urban ecosystem benefits.
| UTI | Odds Ratio | Standard Error | Z | P > |z| | [95% Conf. Interval] | |
|---|---|---|---|---|---|---|
| WGOV | 31.43382 | 7.968317 | 13.6 | 0 | 19.1259 | 51.66216 |
| Constant | 0.16 | 0.027247 | −10.76 | 0 | 0.114595 | 0.223396 |
a Number of observations = 495; Log likelihood = −208.44138; LR chi2(1) = 258.53; Prob > chi2 = 0.0000; Pseudo R2 = 0.3828.
Table 7.
Logistic regression a of the effect of weak governance (WGOV) on people’s Unwillingness to Invest (UTI) controlling for gender, age, socio-economic strata, and residence.
Table 7.
Logistic regression a of the effect of weak governance (WGOV) on people’s Unwillingness to Invest (UTI) controlling for gender, age, socio-economic strata, and residence.
| UTI | Odds Ratio | Standard Error | Z | P > |z| | [95% Confidence Interval] | |
|---|---|---|---|---|---|---|
| WGOV | 37.73149 | 10.60571 | 12.92 | 0 | 21.74929 | 65.45804 |
| Gender | 0.8305991 | 0.217637 | −0.71 | 0.479 | 0.497 | 1.388119 |
| Age | 0.9831168 | 0.11173 | −0.15 | 0.881 | 0.7868048 | 1.22841 |
| Stratum 2 | 3.155877 | 1.782857 | 2.03 | 0.042 | 1.042915 | 9.549736 |
| Stratum 3 | 1.353498 | 0.642457 | 0.64 | 0.524 | 0.5338548 | 3.431566 |
| Stratum 4 | 1.22499 | 0.6226557 | 0.40 | 0.69 | 0.452347 | 3.317368 |
| Stratum 5 | 1.170744 | 0.595533 | 0.31 | 0.757 | 0.4319894 | 3.172857 |
| Stratum 6 | 0.734595 | 0.420205 | −0.54 | 0.59 | 0.23941 | 2.254003 |
| Resides in Salitre | 1.058643 | 0.294395 | 0.2 | 0.838 | 0.613821 | 1.825818 |
| Born in Bogota | 1.140392 | 0.322006 | 0.47 | 0.642 | 0.6556999 | 1.983368 |
| Constant | 0.1191804 | 0.06968 | −3.64 | 0 | 0.0378913 | 0.3748613 |
a Number of observations = 495; Logistic Regression chi2(10) = 267.09; Prob > chi2 = 0.0000; Pseudo R2 = 0.3954; Log likelihood = −204.16118.
Publisher’s Note: MDPI stays neutral with regard to jurisdictional claims in published maps and institutional affiliations. |
© 2020 by the authors. Licensee MDPI, Basel, Switzerland. This article is an open access article distributed under the terms and conditions of the Creative Commons Attribution (CC BY) license (http://creativecommons.org/licenses/by/4.0/).
Share and Cite
MDPI and ACS Style
Pineda-Guerrero, A.; Escobedo, F.J.; Carriazo, F. Governance, Nature’s Contributions to People, and Investing in Conservation Influence the Valuation of Urban Green Areas. Land 2021, 10, 14. https://doi.org/10.3390/land10010014
AMA Style
Pineda-Guerrero A, Escobedo FJ, Carriazo F. Governance, Nature’s Contributions to People, and Investing in Conservation Influence the Valuation of Urban Green Areas. Land. 2021; 10(1):14. https://doi.org/10.3390/land10010014
Chicago/Turabian StylePineda-Guerrero, Alexandra, Francisco J. Escobedo, and Fernando Carriazo. 2021. "Governance, Nature’s Contributions to People, and Investing in Conservation Influence the Valuation of Urban Green Areas" Land 10, no. 1: 14. https://doi.org/10.3390/land10010014
Note that from the first issue of 2016, this journal uses article numbers instead of page numbers. See further details here.