
Sail Away to a Safe Harbor? COVID-19 Vaccinations and the Volatility of Travel and Leisure Companies


1
Department of Business Administration, School of Social Sciences, Reykjavik University, Menntavegur 1, 102, 101 Reykjavik, Iceland
2
Department of Banking and Finance, Southampton Business School, University of Southampton, Room 1013, Building 4, Highfield Campus, Southampton SO17 1BJ, UK
3
Montpellier Business School, 2300 Avenue des Moulins, CEDEX 4, 34185 Montpellier, France
4
Department of Investment and Financial Markets, Institute of Finance, Poznan University of Economics and Business, Al. Niepodległości 10, 61-875 Poznan, Poland
*
Author to whom correspondence should be addressed.
J. Risk Financial Manag. 2022, 15(4), 182; https://doi.org/10.3390/jrfm15040182
Submission received: 25 February 2022
/
Revised: 8 April 2022
/
Accepted: 10 April 2022
/
Published: 14 April 2022
(This article belongs to the Special Issue Economic Sustainability of Culture and Cultural Tourism)
Abstract
:This paper examines the impact of vaccination programs on the stock market volatility of the travel and leisure sector. Using daily data from 56 countries over the period from January 2020 to March 2021, we find that vaccination leads to a decrease in the investment risk of travel and leisure companies. Vaccination results in a decrease in the volatility of stock prices of travel and leisure companies. The drop in volatility is robust to many alternative estimation techniques, different volatility measures, and various proxies for vaccinations. Moreover, this effect cannot be explained by an array of control variables; this includes the pandemic itself and both the containment and closure policies that followed. Furthermore, the beneficial role of vaccinations is relatively stronger in emerging markets than in developed ones.
JEL Classification:
G01; G12; G15; G18; H12; H51; I18; Q541. Introduction
The COVID-19 pandemic has had an unprecedented effect on not only humanity but also the global economy. Notably, the tourism and hospitality sectors—in particular—have been hit hardest by the pandemic (Gerwe 2021; Nagaj and Žuromskaitė 2021; World Economic Forum 2022). In 2021, international tourist arrivals remained 72% below 2019 levels, which equals more than 1 billion fewer arrivals. This implies that the industry reached levels last seen in the late 1980s (World Economic Forum 2022). Governments implement several policy measures in order to help flatten the curve due to the asymptomatic transmission of COVID-19. Border closures, travel restrictions, gathering size limitations, quarantines, and temporary closure of restaurants all have detrimental impacts on the hospitality and tourism industry. Although temporary reopening in the summer of 2020 was considered a partial solution, new lockdown measures that have been implemented due to new waves have, once again, brought tourism to a complete standstill. The World Travel and Tourism Council estimates that the global travel and tourism sector’s contribution to global GDP experienced an unprecedented decline of nearly 50% in 2020.1
The tourism and hospitality literature shows a rising interest in analyzing the impact of COVID-19 on the industry. Early studies focus on the preliminary impact that COVID-19 has had on the tourism industry. They show that COVID-19 harms hospitality companies’ performance (Anguera-Torrell et al. 2020; Gil-Alana and Poza 2020; Lee et al. 2021; Lin and Falk 2021; Wu et al. 2021) or tourism demand—in general (Gössling et al. 2020; Yang et al. 2020). Another line of research explores what factors can provide resiliency to those companies. Chen et al. (2020), Kaczmarek et al. (2021), Jawed et al. (2021), Poretti and Heo (2021), and Song et al. (2021) show that the negative impact of COVID-19 is heterogeneous, as better pre-pandemic financial characteristics can provide immunity to hospitality firms against COVID-19. In a similar vein, Qiu et al. (2021) show that CSR activities can improve the stock returns of tourism firms during the COVID-19 pandemic. Recent studies explore the recovery of the tourism industry under different scenarios (Zhang et al. 2021; Fotiadis et al. 2021).
In this paper, we aim to explore whether mass vaccinations help to play a role in stabilizing financial markets. Specifically, we analyze the relationship between daily mass vaccinations and stock market volatility of travel and leisure companies. Mass vaccinations are expected to lower the stock price volatility of travel and leisure companies because herd immunity becomes a key concept for controlling the pandemic. An effective vaccine can be considered the safest way to reach herd immunity (Fontanet and Cauchemez 2020). Vaccination programs are essential for the tourism and hospitality industry. Mass vaccination can speed up the industry’s recovery (Zhu et al. 2021), leading to an increase in the demand for hospitality and tourism services. Global availability of COVID-19 vaccines and the resulting herd immunity will lower the risk perceptions and travel anxiety, which can contribute to the recovery of the hospitality and tourism industry (Gursoy and Chi 2020). Investors can regard tourism stocks as a less risky and uncertain vehicle of investment since countries that are on track to achieve herd immunity utilizing vaccinations are contemplating the possibility of reopening their borders for both domestic and international travel. A mass vaccination program can eliminate the pandemic-induced volatility in financial markets via different channels.
The first channel is the decrease in macroeconomic uncertainty, which transmits to the tourism and hospitality industry. The rollout of vaccinations enables countries to control the COVID-19 pandemic. As countries approach herd immunity, businesses reopen, and social gathering and traveling restrictions are gradually relaxed. Government interventions—such as border closures and travel restrictions—can be minimized once herd immunity is achieved. The elimination of such unexpected interventions will also eliminate substantial negative demand and supply-side shocks (del Rio-Chanona et al. 2020), as vaccinated people might travel both domestically and internationally. The future cash flows of travel and leisure companies will be more predictable. As the industry recovers, economic expectations stabilize. A growing (declining) volume of good (bad) news increases (decreases), triggering volatility declines. This leads to a lower tourism and hospitality industry stock volatility. While there is evidence that the pandemic triggered an unprecedented increase in macroeconomic uncertainty (Altig et al. 2020; Baker et al. 2020; Caggiano et al. 2020; Sharif et al. 2020), our results, reported in Section 3, show that the reversal can have stabilizing effects on international stock markets. Thus, consistently with Bansal and Yaron (2004) and Bansal et al. (2014), volatility in the tourism and hospitality industry can be driven by macroeconomic expectations. Second, stock market volatility decreases because in countries where a larger population share becomes immunized, there is a lower probability of unexpected government interventions, which might otherwise disrupt the economy and the tourism and hospitality industry and/or undermine its recovery. As governments can more confidently ease or even terminate lockdowns, businesses operating in the tourism and hospitality industry and tourists become less dependent on government economic support packages, strengthening public finances and reducing the need to raise tax rates. This can lead to the repricing of financial assets, including stocks. Consistently with Mele (2007), volatility can change due to changing expectations of future returns in the tourism and hospitality industry. Third, vaccinations can lower the financial/operating leverage of firms, including tourism and hospitality operators (Schwert 1989), which manifests in improved financial performance and a decrease in financial risk. Fourth, vaccinations are associated with less stringent government restrictions. Concurrently, in line with Manela and Moreira (2017), decreases in the flow of policy-related news are associated with lower stock market volatility. Fifth, the divergence of opinions (Harris and Raviv 1993; Banerjee 2011; Foucault et al. 2011), driven by the COVID-19 pandemic crisis, becomes less significant when the economy and the tourism and hospitality industry is on course to achieve herd immunity. This is likely to calm stock market volatility too. Sixth, vaccinations can conceivably reduce fear in financial markets. In line with Donadelli et al. (2017), globally dangerous diseases can spread fear throughout the economy, which spills over to the stock market (through the so-called “Main Street” effects). Even if no traveling restrictions to the affected countries are in place, rational individuals will take preventive measures, and they would likely amend their travel plans. In this light, the rollout of vaccinations is likely to curb investor fear spread. All these elements should lead to greater price stability in financial markets. Expectations of improved performance in the tourism and hospitality industry can trigger less sizable valuation changes, which results in lower volatility.
To examine the role of vaccinations, we use daily data from 56 markets around the world from the period January 2020–March 2021. In particular, we explore the novel dataset of global vaccinations that—to our knowledge—has never been explored in the broad international context of tourism sector performance or in financial markets. We run a battery of panel regressions to determine how the vaccinations affect the risk and volatility of travel and leisure companies.
Our findings demonstrate that vaccination results in a decrease in the volatility of stock prices of travel and leisure companies. The drop in risk is both economically and statistically significant, pervasive, and robust to many considerations. It survives different measures of volatility and various proxies for vaccinations. It is not explained by an array of control variables; this includes the pandemic itself and both the containment and closure policies that followed. Finally, the beneficial role of vaccinations is relatively stronger in emerging markets than in developed ones.
To the best of our knowledge, we are the first to analyze the impact of vaccination on the stock market volatility of travel and leisure companies across 56 countries. Earlier studies in the related literature focus on the role of the pandemic itself or government policy responses. We consider the role of vaccination in controlling the impact of the pandemic itself and government interventions. We extend the discussion on how the financial markets react to the news on vaccines (Demir et al. 2021; Rouatbi et al. 2021), focusing on the travel and leisure industry. While few studies scrutinize this issue (Chan et al. 2022; Acharya et al. 2021), there is not yet a study that focuses on the travel and leisure industry where vaccinations play a crucial role.
2. Data and Methodology
This paper aims to explore the impact of vaccination programs on the stock price volatility of travel and leisure companies. The choice of the sample depended on the financial and vaccination data availability. In terms of the stock market data, we searched and collected all the daily travel and leisure index data from Datastream Global Equity Indices. After that, we obtained vaccination-related data from the COVID-19 Data Hub website, which is funded by the Institute for Data Valorization.2 We matched the country-level stock index data with the vaccination data. China was excluded from the sample due to a lack of daily vaccination data.3 Our final sample comprised 56 countries from 1 January 2020 to 30 March 2021.4 China declared several pneumonia cases of an unknown cause in Wuhan on 31 December 2019; therefore, we used the first trading day following this announcement. Table 1 presents the list of stock markets in our sample. Notably, our equity universe covers the top tourist destinations worldwide in developed (e.g., France, Spain) and emerging (e.g., Turkey, Mexico) markets.
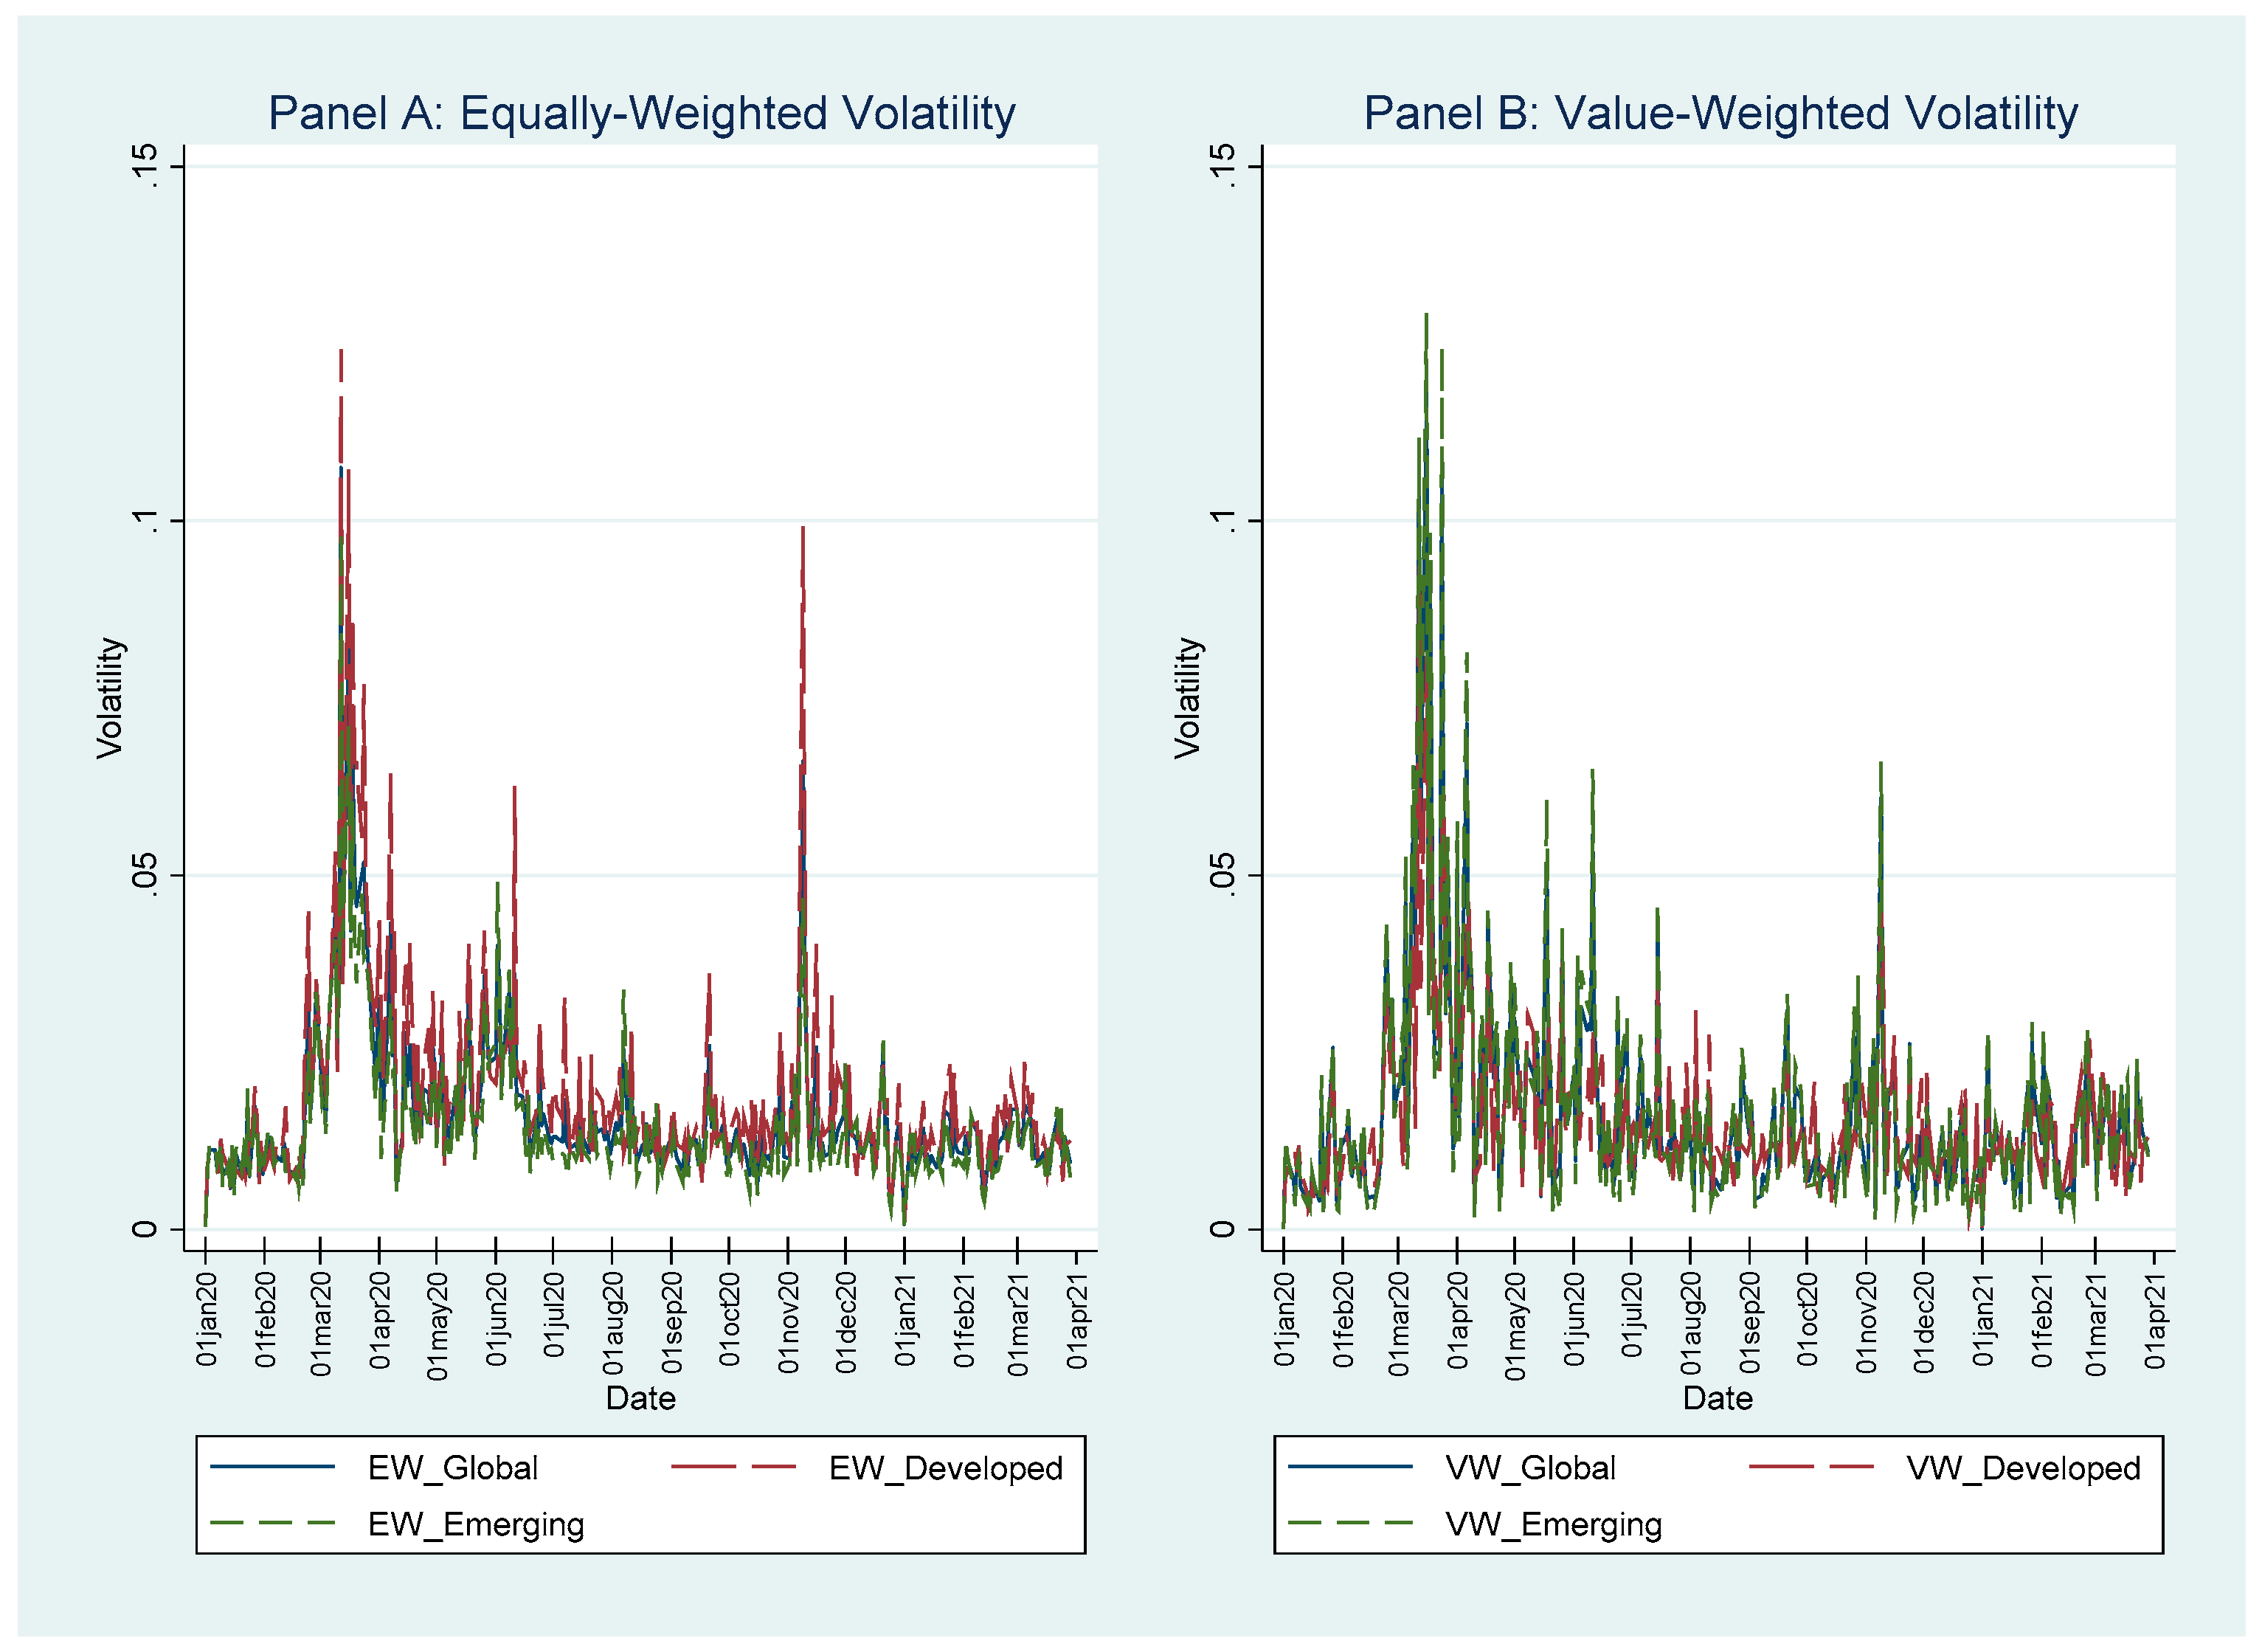
Figure 1 depicts the variation over time in the average volatility of returns on travel and leisure industry stocks for the whole sample (solid blue line), as well as for the subsamples of countries classified into developed (long-dashed red line) and emerging (dashed green line) markets. Panels A and B show the equal-weighted and capitalization-weighted volatility measures, respectively. The figure uncovers that volatility markedly rose in March−April 2020, when the COVID–19 outbreak was declared a pandemic by the WHO. Following the launch of mass vaccinations, the volatility appears to have declined in both the developed and emerging market countries. One possible reason is that COVID-19 vaccinations helped stabilize the stock market, particularly the travel and leisure industry.
We used the following model (subscripts are dropped for notational convenience) in line with the literature (Bae et al. 2021; Zaremba et al. 2020):
where VOLATILITY is proxied by two measures: (1) Log |R| denotes the logarithm of absolute daily returns, (2) Log |RRCAPM| indicates the logarithm of absolute residual returns from the CAPM (Schwert 1989). We used absolute values to measure volatility in line with Antonakakis and Kizys (2015). Moreover, we calculated the logarithmic transformation of the dependent variables to (i) ensure that daily volatility in levels is positive definite and (ii) to control for non-linearities in the relation between the level of volatility and its covariates (Zaremba et al. 2020). |RRCAPM| was calculated using rolling regressions that utilized 60 months of daily data. The market risk factor in the model is represented by the capitalization-weighted portfolio of all the country equity indices in the sample. The risk-free rate was downloaded from Kenneth R. French’s database.5
Our primary variable of interest is the VACCINATION variable. To confirm the robustness of our results, we considered four various vaccination-related variables. These were Log (Daily Vaccinations), Daily Vaccinations per 100,000, Vaccination Period, and Δ Daily Vaccinations Dummy. Log (Daily Vaccinations) indicates the logarithm of the count of daily COVID-19 vaccinations. Daily Vaccinations per 100,000 was calculated as the number of daily COVID-19 vaccinations scaled by the population in a country and then multiplied by 100,000. Countries that immunize a larger population share on a given day can attain herd immunity sooner than countries that immunize a smaller population share. Admittedly, travel and leisure stocks can be perceived as a less risky vehicle of investment in these countries. Staggered vaccination rates across countries can lead to portfolio rebalancing across countries. Investors can sell travel and leisure stocks in countries with lower vaccination rates and invest in countries with higher vaccination rates. Vaccination Period denotes a dummy variable equal to one for the period starting from the country’s first vaccination day, and is zero otherwise. Countries with a relatively earlier rollout of mass vaccination campaigns can achieve herd immunity earlier than countries that launch mass vaccinations later. These countries can also reopen to international tourism earlier and can be perceived as safer locations for stock investments. Δ Daily Vaccinations Dummy is the variable that takes the value of one if the daily change in the number of COVID-19 vaccinations is strictly positive—and zero otherwise. If there is an increase in the number of vaccinations relative to the previous day, this can be regarded as positive news by stock investors. Overall, we expected to find a negative impact of those vaccination-related variables on stock market volatility. This implies that accessing COVID-19 vaccines will lower the stock market volatility.
We introduced several control variables, CONTROLS, that can affect stock market volatility in line with previous studies (e.g., Bae et al. 2021; Zaremba et al. 2020). is a row vector of population coefficients that quantify the effects of the control variables. First, the Stringency Index of Hale et al. (2021) was considered in the estimation. This index measures the stringency of the government policy response to the COVID-19 pandemic and takes a value between 0 and 100. Governments have implemented several measures; these include school closing, restrictions on domestic and international travel, and the cancellation of public events in order to flatten the curve. The index is widely used in the recent pandemic literature as a factor affecting stock markets (Aggarwal et al. 2021; Baig et al. 2021; Chen et al. 2020; Feng et al. 2021). BM is the book-to-market ratio. Log (MV) is the logarithm of market capitalization in U.S. dollars. Turnover is the turnover ratio that was calculated as a 12-month average trading volume over the corresponding aggregate market capitalization. Δ Cases to Tests is the change in the daily number of COVID-19 infections to the daily number of tests (in percentage). Δ Deaths is the daily change in the number of COVID-19 fatalities. The previous studies document that COVID-19-related deaths can influence the stock markets, so they should be considered in the estimations (Chen et al. 2020; Seven and Yılmaz 2021; Zaremba et al. 2020). Finally, by means of the set of indicator variables (TIME), we also controlled for the day of the week and month effects (Zhang et al. 2017). is a row vector of population coefficients that quantify the day of the week and month effects on the daily volatility of returns on the travel and leisure industry stocks. Finally, is the composite random disturbance term. The fixed-effects estimation method implies that comprises two components: the unobserved country-specific volatility effect, , and the idiosyncratic shock term, .
Table 2 exhibits the descriptive statistics of all variables used in the analysis. We winsorized all continuous variables at the 1st and the 99th percentiles to minimize the effect of outliers (Chia et al. 2020). On average, 41 inhabitants were vaccinated in a population of 100,000 per day (Panel A). This low average can be explained by the fact that vaccinations started in early 2021, making most of our sample’s observations outside the vaccination period. Furthermore, we observe high variability in the Stringency Index across countries.
Table 3 shows the pairwise correlation coefficients between explanatory variables. Not surprisingly, the correlation coefficients between the vaccination-related variables are high (more than 0.6). The remaining correlation coefficients, however, are very low; this indicates that multicollinearity is not likely to present a problem in our empirical analysis.
Model 1 was mainly estimated using a fixed-effects estimator, which considers any unobserved heterogeneity in the stock market volatility across countries. Moreover, it allows for arbitrary correlation between the unobserved country fixed effects and the observed explanatory variables. In addition to fixed effects, we also estimated Model 1 with pooled OLS and random effects estimators (see robustness checks below).
In addition, we performed additional robustness tests by considering alternative dependent variables, incorporating additional control variables, and considering an alternative sample period. We also divided our sample into developed and emerging market countries, as emerging market countries have limited access to COVID-19 vaccines.
3. Empirical Findings
This section examines the results from our panel data models, which were estimated using the fixed effects approach. We begin with reporting our baseline results; these are, in turn, supplemented with further robustness checks. Finally, we turn to differences in the magnitude of the effect between developed and emerging markets.
3.1. Baseline Results
Table 4, summarizing our baseline results, is organized into two blocks. In the first block of the table (Columns 1–4), the dependent variable is the natural logarithm of absolute returns. In the second block (Columns 5–8), the dependent variable is the natural logarithm of absolute residual returns, estimated by employing the CAPM. To evaluate the impact of mass vaccinations on the volatility of returns on travel and leisure stocks, we utilized four different predictors, which also carried different information sets. The main predictor of volatility in international stock markets is the logarithm of the daily number of COVID-19 vaccinations (Columns 1 and 5). The coefficient of this predictor can be regarded as vaccination elasticity of volatility. As an alternative indicator of the scale of vaccinations, we used Daily Vaccinations per 100,000 inhabitants (Columns 2 and 6). The coefficient of this predictor shows the percentage rate of change in volatility when one more inhabitant in a population of 100,000 is inoculated. A third predictor is the so-called Vaccination Period (Columns 3 and 7), which takes on the value of one on the day when mass vaccinations were rolled out in a country. It aims to answer whether the volatility of the tourism industry’s stock returns responds more strongly to an early launch of mass vaccinations instead of a late rollout. A fourth predictor also aims to evaluate the effects of the vaccination rate (Columns 4 and 8). This predictor takes a value of one if the number of immunized people on a given day is strictly higher than on the previous day, and it takes on a value of zero otherwise. Thus, the purpose of this variable is to ascertain whether a rise in the vaccination rate can stabilize international stock markets.
The results displayed in Table 4 are as follows. First, Columns 1 and 5 indicate that the logarithm of mass vaccination exerts a negative and significant effect (at the 1% significance level); a 10% increase in the number of vaccinations reduces volatility by 0.378% if absolute returns are used to compute volatility, and by 0.286% if volatility is measured with absolute residual returns. We further scrutinized the coefficient estimates for the second measure of daily vaccinations. Columns 2 and 6 indicate that if 1000 inhabitants in a population of 100,000 are immunized per day, volatility decreases by 0.5% for both absolute returns (Column 2) and absolute residual returns (Column 6). Further, considering Columns 3 and 7, we find that an early rollout of vaccines has a negative effect on the volatility of the travel and leisure industry’s stock returns. The rollout of vaccinations caused a decline in volatility of 0.4872% and 0.3809% in absolute returns (Column 3) and absolute residual returns (Column 7), respectively. Our results also show that a higher vaccination rate is associated with more stable international stock markets, as Columns 4 and 8 appear to indicate. Concretely, if more inhabitants are inoculated on a given day compared to the previous day, volatility decreases by 0.2448% and 0.2135% for absolute returns (Column 4) and absolute residual returns (Column 8), respectively.
3.2. Robustness Checks
Our baseline findings are validated by a series of robustness checks, as is displayed in Table 5 and Table 6. These tests concern different stages and aspects of our research process.
Alternative estimation methods. Our default approach assumed estimations of fixed-effects models. To ensure that our findings did not hang on this approach, we replicated our analysis using pooled OLS and random effects estimators (Table 5, Panel A). Both estimators produced qualitatively similar results to the fixed effects estimator. Notably, the four measures of mass vaccinations appeared to exert both negative and significant effects on the volatility of the tourism industry’s stocks.
Alternative measures of volatility. In Table 5, Panel B, we vary the asset pricing model, which is used to estimate residual returns. In Columns 1–4, the three-factor model, developed by Fama and French (1993), is used to estimate the residual return. In Columns 5–8, the residual return is derived from Asness et al.’s (2013) asset pricing model. In Columns 9–12, the residual return is estimated based on Carhart’s asset pricing model (1997). The precise residuals calculation procedures closely follow Zaremba et al. (2020). Notably, the coefficient estimates are always negative and significant at the 1% significance level; also, the strength of the estimated effect is numerically similar for the same measure of mass vaccinations.
Additional control variables. In Table 6, Panel A, we visualize coefficient estimates of further extensions of the baseline model. These extensions entail explanatory variables; such as turnover ratio (Log (TV)t−1), momentum (Momentumt−1), or crisis dummy (Crisis). Log (TV) indicates the logarithm of trading volume expressed in U.S. dollars.6 Momentum is the total stock return in the past 250 trading days. Finally, Crisis is a dummy variable that takes value one for the COVID-19 crisis period from 18 February to 20 March 2020 (Bae et al. 2021) and zero otherwise. Its use aims at accounting for the potentially elevated volatility during the most intense initial pandemic crisis. Our principal conclusions are intact in all these additional specifications, corroborating the stabilizing influence of vaccinations on the tourism sector.
Modified study period. To ascertain that our findings were not specific to our study period, we also considered an alternative start date; namely, the date at which the WHO considered the COVID-19 as a pandemic (11 March 2020). This approach excludes the initial weeks of the intense global market downturn that culminated on 11 March 2020. We perform this exercise using fixed effects, pooled OLS, and random effects estimators (Table 6, Panel B). Our principal findings remain unchanged, and the coefficients on vaccination-related variables remain negative and significant at the 5% level.
To sum up, the additional robustness checks confirmed the validity of our findings. The vaccination programs help to decrease the volatility of the travel and leisure companies.
3.3. Vaccinations and Market Development
Having established the essential relationship between vaccinations and the risk of travel and leisure companies, we now carry on with providing further insights. We now concentrate on the impact of vaccinations on both emerging and developed markets.
Table 7 reports additional explorations of the role of market development. We seek to ascertain if the observed negative effect is not confined to a particular group of countries. To this end, we divided our sample into developed and emerging market countries. Such a division was determined by the difference in the scale, timeliness, and speed in mass vaccinations in the two groups of countries. This is because emerging market countries have limited access to COVID-19 vaccines when compared with developed countries.
Results are organized in eight columns. Columns 1, 3, 5, and 7 visualize estimations for the emerging market countries. The remaining columns (2, 4, 6, and 8) show estimations for the developed countries for the four indicators of mass vaccinations. The general picture that emerges from Table 5 is that the effect of mass vaccinations on the volatility of the tourism industry’s stock is not sensitive to a group of countries. Nevertheless, analysis reveals that the effect is relatively stronger for emerging market countries. In these countries, the lower incidence of mass vaccinations has a larger marginal effect on the tourism industry in this group of countries, adding a significant value to their income. The effect is particularly pronounced for Daily Vaccinations Per 100,000t−1 and Δ Daily Vaccinations Dummyt−1. For instance, for the number of daily vaccinations, the 1000 people receiving shots per 100,000 inhabitants per day results in a drop in volatility by 0.7% in emerging markets, compared with 0.3% in developed markets.
4. Discussion
Mass vaccinations are of paramount importance for the tourism industry, decimated by the COVID-19 pandemic and the ensuing confinement and closure policies launched by governments around the globe. Our results show that following the rollout of mass vaccinations, the volatility of tourism industry stocks significantly decreased. Stock market investors now regard tourism stocks as a less risky and uncertain investment vehicle. This is because countries that are on track to achieve herd immunity through vaccinations are contemplating the possibility of reopening their borders for international travel. Investors closely monitor vaccination rates across countries. Vaccination rates can influence stock market volatility in the short and long run. First, staggered vaccination rates across countries provide opportunities for profitable investment opportunities in the short run. Equipped with the vaccination data, investors can rebalance their portfolios towards tourism industry stocks in relatively more vaccinated countries, which are expected to remove travel restrictions earlier and faster than countries with lower vaccination rates. This can reduce travel and leisure stock volatility in countries with relatively earlier rollouts of mass vaccinations and relatively higher vaccination rates. Second, in the long run, mass vaccinations are expected to reduce global economic uncertainty, which can be perceived as good news by investors in travel and leisure stocks around the globe. This reduces the volatility of stock investments in this industry in the long run. Taken together, mass vaccinations reduce the risk of investment in the tourism industry, which manifests in lower volatility of returns on the tourism industry’s stocks.
Although it is easier said than done, policymakers should endeavor to increase the vaccination rate in order to attain herd immunity. In turn, a higher vaccination rate will translate into a faster recovery of the economy and the tourism industry. Specifically, such policy efforts will eliminate demand shocks due to COVID-19 itself and restrictions; and, in turn, boost tourism demand. Managers of travel and leisure companies should also keep abreast of vaccination policies to meet the possible rising demand for travel and leisure. However, it is worth mentioning that the complexity of such a recovery should not be underestimated in light of the multidimensional uncertainty brought by the COVID-19 pandemic (Zenker and Kock 2020).
One indirect implication of the critical discussion of a tourism research agenda in the post-pandemic era in Zenker and Kock (2020) is that the valuation models of the tourism industry’s recovery should cater to these five points: (i) a change in destination image driven by the COVID-19 pandemic; (ii) a change in tourist behavior; (iii) a change in the host country’s behavior; (iv) a change in the tourism industry; and (v) the long-term and indirect costs created by the COVID-19 pandemic. Our results indicate that mass vaccinations appear to resolve this multidimensional uncertainty partially. It is worth noting that the rollout of COVID-19 vaccines is associated with a larger volatility decline in emerging market countries. Lower volatility can attract international capital flows, which can be of paramount importance for their business cycle recovery. Lower volatility can also translate into a lower cost of capital. The lower cost of capital, in turn, implies that more investment projects in the travel and leisure industry will break even, which will attract more investors. The travel and leisure industry contributes more to the gross domestic product in less developed countries with favorable climate conditions, where tourism often constitutes a primary source of foreign exchange and income than in more developed countries (Rosselló et al. 2017).
Furthermore, despite the growing anti-globalization sentiment around the globe, there are sound arguments as to why the world economy should be steered towards an even higher degree of globalization, of which international tourism is an important component. Although Contractor (2021) envisages higher perceived risks in the post-pandemic world, such risks can be ameliorated by a number of factors. These include (a) more sophisticated information systems used among international trade parties; (b) closer relationships between parties involved in an international transaction; (c) marginal increase in the diversification of input and assembly-point sources; (d) a decrease in a multidimensional “distance” between countries, in which parties to the international transaction are located; and (e) the quest for common standards in international trade. To the extent to which information about vaccination rates is perceived by investors to mediate the effects of these factors, the volatility of returns on travel and leisure industry stocks may decline.
5. Conclusions
In this study, we explored the effect of vaccination programs on the stock market volatility of the travel and leisure sector. By using daily data from 56 countries over the period from January 2020 to March 2021, we documented that vaccination decreases the investment risk of travel and leisure companies. There is a drop in volatility. Our finding is robust to many alternative estimation techniques, alternative volatility measures, additional control variables, and time periods, and does not depend on either the pandemic or government policy responses. Furthermore, the impact of mass vaccinations on the risk of tourism companies is more substantial in emerging markets.
The main limitation of this study lies in the nature of the dataset, which is fresh and relatively short. Spreading vaccination to more countries would yield more extensive and richer datasets, allowing us to re-evaluate and verify our findings. Future studies can compare the impact vaccinations have on the return and volatility of different industries. They can also consider alternative risk measures, such as default probability, systemic risk, or value at risk. Future research could disentangle “good volatility” (i.e., positive semi-variance) from “bad volatility” (i.e., negative semi-variance). In this regard, Patton and Sheppard (2015) find that future volatility is more strongly linked to the volatility of past negative returns (“bad volatility”) than the volatility of past positive returns. Thus, it would be interesting to ascertain how the balance between “good volatility” and “bad volatility” has changed since the rollout of mass vaccinations around the globe. Moreover, researchers can explore how vaccination affects other asset classes, such as corporate bonds and the credit of travel and leisure companies.
Author Contributions
Conceptualization, E.D., R.K., W.R. and A.Z.; methodology, E.D., R.K., W.R. and A.Z.; formal analysis, W.R., investigation, W.R.; resources, A.Z.; data curation, A.Z. and W.R.; writing—original draft preparation, E.D., R.K., W.R. and A.Z.; writing—review and editing, E.D., R.K., W.R. and A.Z.; visualization, W.R. and A.Z.; funding acquisition, A.Z. All authors have read and agreed to the published version of the manuscript.
Funding
Ender Demir acknowledges the financial support of the Spanish Ministry of Science and Innovation (grant no. PID2020-114797GB-I00].
Institutional Review Board Statement
Not applicable.
Informed Consent Statement
Not applicable.
Data Availability Statement
Not applicable.
Acknowledgments
The authors are grateful to Kee-Hong Bae, Sadok El Ghoul, C. Michael Hall, Ünal Seven, and Yang Yang, whose valuable feedback and constructive comments have improved the quality of the paper. The remaining errors (if any) are the responsibilities of the authors.
Conflicts of Interest
The authors declare no conflict of interest.
| 1 | The Financial Times, https://www.ft.com/content/f3413c8a-2d59-4a75-befd-ee73cd45fd80#post-9c108ebe-9a4f-4c8c-8171-5bdcb32489fb, accessed on 17 April 2020. |
| 2 | For more details, please visit https://covid19datahub.io (accessed on 17 April 2020). |
| 3 | Importantly, though official data from China is unavailable at the time of writing of this paper, rough estimations can be made based on press reports. For robustness, in an unreported analysis, we replicate our analyses with these data included. Accounting for China does not measurably affect our findings. |
| 4 | The data was collected in April 2021. |
| 5 | https://mba.tuck.dartmouth.edu/pages/faculty/ken.french/data_library.html (accessed on17 April 2020). |
| 6 | When using Log(TV), we do not include Log (MV) and Turnover to our regression to avoid multicollinearity. |
References
- Acharya, Viral V., Timothy Johnson, Suresh Sundaresan, and Steven Zheng. 2021. The Value of a Cure: An Asset Pricing Perspective. No. w28127. Cambridge: National Bureau of Economic Research. [Google Scholar]
- Aggarwal, Shobhit, Samarpan Nawn, and Amish Dugar. 2021. What caused global stock market meltdown during the COVID pandemic–Lockdown stringency or investor panic? Finance Research Letters 38: 101827. [Google Scholar] [CrossRef]
- Altig, Dave, Scott Baker, Jose Maria Barrero, Nicholas Bloom, Philip Bunn, Scarlet Chen, Steven J. Davis, Julia Leather, Brent Meyer, Emil Mihaylov, and et al. 2020. Economic uncertainty before and during the COVID-19 pandemic. Journal of Public Economics 191: 104274. [Google Scholar] [CrossRef] [PubMed]
- Anguera-Torrell, Oriol, Juan Pedro Aznar-Alarcón, and Jordi Vives-Perez. 2020. COVID-19: Hotel industry response to the pandemic evolution and to the public sector economic measures. Tourism Recreation Research 46: 148–57. [Google Scholar] [CrossRef]
- Antonakakis, Nikolaos, and Renatas Kizys. 2015. Dynamic spillovers between commodity and currency markets. International Review of Financial Analysis 41: 303–19. [Google Scholar] [CrossRef] [Green Version]
- Asness, Clifford S., Tobias J. Moskowitz, and Lasse Heje Pedersen. 2013. Value and momentum everywhere. Journal of Finance 68: 929–85. [Google Scholar] [CrossRef] [Green Version]
- Bae, Kee-Hong, Sadok El Ghou, Zhaoran Gong, and Omrane Guedhami. 2021. Does CSR matter in times of crisis? Evidence from the COVID-19 pandemic. Journal of Corporate Finance 67: 101876. [Google Scholar] [CrossRef]
- Baig, Ahmed S., Hassan A. Butt, Omair Haroon, and Syed Aun S. Rizvi. 2021. Deaths, panic, lockdowns and US equity markets: The case of COVID-19 pandemic. Finance Research Letters 38: 101701. [Google Scholar] [CrossRef]
- Baker, Scott R., Nicholas Bloom, Steven J. Davis, Kyle Most, Marco Sammon, and Tasaneeya Viratyosin. 2020. The unprecedented stock market reaction to COVID-19. Review of Asset Pricing Studies 10: 742–58. [Google Scholar] [CrossRef]
- Banerjee, Snehal. 2011. Learning from prices and the dispersion in beliefs. Review of Financial Studies 24: 3025–68. [Google Scholar] [CrossRef]
- Bansal, Ravi, and Amir Yaron. 2004. Risks for the long run: A potential resolution of asset pricing puzzles. Journal of Finance 59: 1481–509. [Google Scholar] [CrossRef] [Green Version]
- Bansal, Ravi, Dana Kiku, Ivan Shaliastovich, and Amir Yaron. 2014. Volatility, the macroeconomy, and asset prices. Journal of Finance 69: 2471–511. [Google Scholar] [CrossRef] [Green Version]
- Caggiano, Giovanni, Efrem Castelnuovo, and Richard Kima. 2020. The global effects of COVID-19-induced uncertainty. Economics Letters 194: 109392. [Google Scholar] [CrossRef] [PubMed]
- Carhart, Mark M. 1997. On persistence in mutual fund performance. Journal of Finance 52: 57–82. [Google Scholar] [CrossRef]
- Chan, Kam Fong, Zhuo Chen, Yuanji Wen, and Tong Xu. 2022. COVID-19 vaccines and global stock markets. Finance Research Letters. in press. [Google Scholar] [CrossRef]
- Chen, Ming-Hsiang, Ender Demir, Conrado Diego Garcia-Gomez, and Adam Zaremba. 2020. The impact of policy responses to COVID-19 on US travel and leisure companies. Annals of Tourism Research Empirical Insights 1: 100003. [Google Scholar] [CrossRef]
- Chia, Yee-Ee, Kian-Ping Lim, and Kim-Leng Goh. 2020. More shareholders, higher liquidity? Evidence from an emerging stock market. Emerging Markets Review 44: 100696. [Google Scholar] [CrossRef]
- Contractor, Farok J. 2021. The world economy will need even more globalization in the post-pandemic 2021 decade. Journal of International Business Studies 53: 156–71. [Google Scholar] [CrossRef]
- del Rio-Chanona, R. Maria, Penny Mealy, Anton Pichler, Francois Lafond, and J. Doyne Farmer. 2020. Supply and demand shocks in the COVID-19 pandemic: An industry and occupation perspective. Oxford Review of Economic Policy 36: S94–S137. [Google Scholar] [CrossRef]
- Demir, Ender, Renatas Kizys, Wael Rouatbi, and Adam Zaremba. 2021. COVID-19 Vaccinations and the volatility of energy companies in international markets. Journal of Risk and Financial Management 14: 611. [Google Scholar] [CrossRef]
- Donadelli, Michael, Renatas Kizys, and Max Riedel. 2017. Dangerous infectious diseases: Bad news for Main Street, good news for Wall Street? Journal of Financial Markets 35: 84–103. [Google Scholar] [CrossRef]
- Fama, Eugene F., and Kenneth R. French. 1993. Common risk factors in the returns on stocks and bonds. Journal of Financial Economics 33: 3–56. [Google Scholar] [CrossRef]
- Feng, Gen-Fu, Hao-Chang Yang, Qiang Gong, and Chun-Ping Chang. 2021. What is the exchange rate volatility response to COVID-19 and government interventions? Economic Analysis and Policy 69: 705–19. [Google Scholar] [CrossRef]
- Fontanet, Arnaud, and Simon Cauchemez. 2020. COVID-19 herd immunity: Where are we? Nature Reviews Immunology 20: 583–84. [Google Scholar] [CrossRef] [PubMed]
- Fotiadis, Anestis, Stathis Polyzos, and Tzung-Cheng T. C. Huan. 2021. The good, the bad and the ugly on COVID-19 tourism recovery. Annals of Tourism Research 87: 103117. [Google Scholar] [CrossRef]
- Foucault, Thierry, David Sraer, and David J. Thesmar. 2011. Individual investors and volatility. Journal of Finance 66: 1369–406. [Google Scholar] [CrossRef]
- Gerwe, Oksana. 2021. The COVID-19 pandemic and the accommodation sharing sector: Effects and prospects for recovery. Technological Forecasting and Social Change 167: 120733. [Google Scholar] [CrossRef]
- Gil-Alana, Luis Alberiko, and Carlos Poza. 2020. The impact of COVID-19 on the Spanish tourism sector. Tourism Economics 2020: 1354816620959914. [Google Scholar] [CrossRef]
- Gössling, Stefan, Daniel Scott, and C. Michael Hall. 2020. Pandemics, tourism and global change: A rapid assessment of COVID-19. Journal of Sustainable Tourism 29: 1–20. [Google Scholar] [CrossRef]
- Gursoy, Dogan, and Christina G. Chi. 2020. Effects of COVID-19 pandemic on hospitality industry: Review of the current situations and a research agenda. Journal of Hospitality Marketing & Management 29: 527–29. [Google Scholar]
- Hale, Thomas, Noam Angrist, Rafael Goldszmidt, Beatriz Kira, Anna Petherick, Toby Phillips, Samuel Webster, Emily Cameron-Blake, Laura Hallas, Saptarshi Majumdar, and et al. 2021. A global panel database of pandemic policies (Oxford COVID-19 Government Response Tracker). Nature Human Behaviour 5: 529–38. [Google Scholar] [CrossRef]
- Harris, Milton, and Artur Raviv. 1993. Differences of opinion make a horse race. Review of Financial Studies 6: 473–506. [Google Scholar] [CrossRef]
- Jawed, Mohammad Shameem, Archit Vinod Tapar, and Amol S. Dhaigude. 2021. Crisis, firm characteristics and stock performance: Evidence from Hospitality and Tourism sector. Tourism Recreation Research 2021: 1–18. [Google Scholar] [CrossRef]
- Kaczmarek, Tomasz, Katarzyna Perez, Ender Demir, and Adam Zaremba. 2021. How to survive a pandemic: The corporate resiliency of travel and leisure companies to the COVID-19 outbreak. Tourism Management 84: 104281. [Google Scholar] [CrossRef]
- Lee, Chi-Chuan, Chien-Chiang Lee, and Yizhong Wu. 2021. The impact of COVID-19 pandemic on hospitality stock returns in China. International Journal of Finance & Economics. in press. [Google Scholar]
- Lin, Xiang, and Martin Thomas Falk. 2021. Nordic stock market performance of the travel and leisure industry during the first wave of COVID-19 pandemic. Tourism Economics 2021: 1354816621990937. [Google Scholar] [CrossRef]
- Manela, Asaf, and Alan Moreira. 2017. News implied volatility and disaster concerns. Journal of Financial Economics 123: 137–62. [Google Scholar] [CrossRef]
- Mele, Antonio. 2007. Asymmetric stock market volatility and the cyclical behavior of expected returns. Journal of Financial Economics 86: 446–78. [Google Scholar] [CrossRef]
- Nagaj, Rafał, and Brigita Žuromskaitė. 2021. Tourism in the Era of COVID-19 and Its Impact on the Environment. Energies 14: 2000. [Google Scholar] [CrossRef]
- Patton, Andrew J., and Kevin Sheppard. 2015. Good volatility, bad volatility: Signed jumps and the persistence of volatility. Review of Economics and Statistics 97: 683–97. [Google Scholar] [CrossRef] [Green Version]
- Poretti, Cédric, and Cindy Yoonjoung Heo. 2021. Asset-light strategies and stock market reactions to COVID-19’s pandemic announcement: The case of hospitality firms. Tourism Economics 2021: 13548166211005198. [Google Scholar] [CrossRef]
- Qiu, Shangzhi Charles, Jianing Jiang, Xinming Liu, Ming-Hsiang Chen, and Xina Yuan. 2021. Can corporate social responsibility protect firm value during the COVID-19 pandemic? International Journal of Hospitality Management 93: 102759. [Google Scholar] [CrossRef]
- Rosselló, Jaume, Maria Santana-Gallego, and Waqas Awan. 2017. Infectious disease risk and international tourism demand. Health Policy and Planning 32: 538–48. [Google Scholar] [CrossRef] [PubMed] [Green Version]
- Rouatbi, Wael, Ender Demir, Renatas Kizys, and Adam Zaremba. 2021. Immunizing markets against the pandemic: COVID-19 vaccinations and stock volatility around the world. International Review of Financial Analysis 77: 101819. [Google Scholar] [CrossRef]
- Schwert, G. William. 1989. Why does stock market volatility change over time? Journal of Finance 44: 1115–53. [Google Scholar] [CrossRef]
- Seven, Ünal, and Fatih Yılmaz. 2021. World equity markets and COVID-19: Immediate response and recovery prospects. Research in International Business and Finance 56: 101349. [Google Scholar] [CrossRef]
- Sharif, Arshian, Chaker Aloui, and Larisa Yarovaya. 2020. COVID-19 pandemic, oil prices, stock market, geopolitical risk and policy uncertainty nexus in the US economy: Fresh evidence from the wavelet-based approach. International Review of Financial Analysis 70: 101496. [Google Scholar] [CrossRef]
- Song, Hyoung Ju, Jihwan Yeon, and Seoki Lee. 2021. Impact of the COVID-19 pandemic: Evidence from the US restaurant industry. International Journal of Hospitality Management 92: 102702. [Google Scholar] [CrossRef]
- World Economic Forum. 2022. This Is the Impact of COVID-19 on the Travel Sector. Available online: https://www.weforum.org/agenda/2022/01/global-travel-tourism-pandemic-covid-19/ (accessed on 17 April 2020).
- Wu, Wenmin, Chien-Chiang Lee, Wenwu Xing, and Shan-Ju Ho. 2021. The impact of the COVID-19 outbreak on Chinese-listed tourism stocks. Financial Innovation 7: 1–18. [Google Scholar] [CrossRef]
- Yang, Yang, Hongru Zhang, and Xiang Chen. 2020. Coronavirus pandemic and tourism: Dynamic stochastic general equilibrium modeling of infectious disease outbreak. Annals of Tourism Research 83: 102913. [Google Scholar] [CrossRef]
- Zaremba, Adam, Renatas Kizys, David Y. Aharon, and Ender Demir. 2020. Infected markets: Novel coronavirus, government interventions, and stock return volatility around the globe. Finance Research Letters 35: 101597. [Google Scholar] [CrossRef]
- Zenker, Sebastian, and Florian Kock. 2020. The coronavirus pandemic–A critical discussion of a tourism research agenda. Tourism Management 81: 104164. [Google Scholar] [CrossRef] [PubMed]
- Zhang, Hanyuan, Hanyuam Zhang, Long Wen, and Chang Liu. 2021. Forecasting tourism recovery amid COVID-19. Annals of Tourism Research 87: 103149. [Google Scholar] [CrossRef]
- Zhang, Jilin, Yongzeng Lai, and Jianghong Lin. 2017. The day-of-the-week effects of stock markets in different countries. Finance Research Letters 20: 47–62. [Google Scholar] [CrossRef]
- Zhu, Oscar Yuheng, Bettina Grün, and Sara Dolnicar. 2021. Tourism and vaccine hesitancy. Annals of Tourism Research. in press. [Google Scholar] [CrossRef] [PubMed]
Figure 1.
Volatility in international markets during the COVID-19 pandemic. The figure presents the average daily absolute returns on investment in travel and leisure stocks across countries covered. The presented measures of volatility are for the whole sample (solid blue line), the sub-sample of developed countries (long-dashed red line) and the sub-sample of emerging markets (dashed green line). The research period is from 1 January 2020 to 30 March 2021. Panels A and B report equal-weighted averages and value-weighted averages, respectively.


Table 1.
Countries covered by the study.
| Developed Markets | Emerging Markets | ||||||||
|---|---|---|---|---|---|---|---|---|---|
| 1. | Australia | 13. | New Zealand | 22. | Bahrain | 34. | Malaysia | 46. | Saudi Arabia |
| 2. | Austria | 14. | Norway | 23. | Brazil | 35. | Malta | 47. | Slovakia |
| 3. | Canada | 15. | Portugal | 24. | Bulgaria | 36. | Mexico | 48. | Slovenia |
| 4. | Denmark | 16. | Singapore | 25. | Chile | 37. | Morocco | 49. | South Africa |
| 5. | Finland | 17. | Spain | 26. | Croatia | 38. | Nigeria | 50. | South Korea |
| 6. | France | 18. | Sweden | 27. | Cyprus | 39. | Oman | 51. | Sri Lanka |
| 7. | Germany | 19. | Switzerland | 28. | Egypt | 40. | Pakistan | 52. | Taiwan |
| 8. | Ireland | 20. | United Kingdom | 29. | Estonia | 41. | Peru | 53. | Thailand |
| 9. | Israel | 21. | United States | 30. | Greece | 42. | Philippines | 54. | Turkey |
| 10. | Italy | 31. | India | 43. | Poland | 55. | UAE | ||
| 11. | Japan | 32. | Jordan | 44. | Romania | 56. | Vietnam | ||
| 12. | Netherlands | 33. | Kuwait | 45. | Russia | ||||
This table shows the lists of developed and emerging markets covered by our study.
Table 2.
Descriptive statistics.
| Variables | Log |R| | Log |RRCAPM| | Log (Daily Vaccinations) | Daily Vaccinations Per 100,000 | Vaccination Period | ΔDaily Vaccinations Dummy | Stringency Index | BM | Turnover | Log (MV) | ΔCases to Cases | ΔDeaths to Cases |
|---|---|---|---|---|---|---|---|---|---|---|---|---|
| Panel A: Descriptive statistics: Full sample | ||||||||||||
| Mean | −5.181 | −5.084 | 1.278 | 41.130 | 0.159 | 0.074 | 54.057 | 0.713 | 5.100 | 7.631 | 0.006 | 0 |
| Std. Dev. | 1.805 | 1.478 | 3.465 | 156.976 | 0.366 | 0.262 | 26.016 | 0.769 | 10.784 | 2.057 | 0.072 | 0.001 |
| 25th Quartile | −5.979 | −5.941 | 0 | 0 | 0 | 0 | 40.740 | 0.234 | 0.317 | 6.173 | −0.003 | 0 |
| Median | −4.822 | −4.854 | 0 | 0 | 0 | 0 | 60.190 | 0.501 | 1.653 | 7.652 | 0 | 0 |
| 75th Quartile | −3.919 | −4.026 | 0 | 0 | 0 | 0 | 73.150 | 1.212 | 4.480 | 8.939 | 0.004 | 0 |
| Panel B: Descriptive statistics: Emerging markets | ||||||||||||
| Mean | −5.510 | −5.290 | 1.064 | 32.224 | 0.145 | 0.059 | 54.805 | 0.854 | 6.031 | 6.841 | 0.006 | 0 |
| Std. Dev. | 1.936 | 1.562 | 3.153 | 139.845 | 0.352 | 0.235 | 26.696 | 0.899 | 13.724 | 1.653 | 0.074 | 0.001 |
| 25th Quartile | −6.448 | −6.293 | 0 | 0 | 0 | 0 | 41.670 | 0.272 | 0.093 | 5.755 | −0.003 | 0 |
| Median | −5.144 | −5.057 | 0 | 0 | 0 | 0 | 60.190 | 0.772 | 0.899 | 6.792 | 0 | 0 |
| 75th Quartile | −4.129 | −4.139 | 0 | 0 | 0 | 0 | 75.000 | 1.537 | 3.930 | 8.295 | 0.005 | 0 |
| Panel C: Descriptive statistics: Developed markets | ||||||||||||
| Mean | −4.659 | −4.758 | 1.617 | 55.257 | 0.183 | 0.099 | 52.870 | 0.490 | 3.943 | 8.886 | 0.006 | 0 |
| Std. Dev. | 1.429 | 1.266 | 3.886 | 179.962 | 0.387 | 0.299 | 24.853 | 0.406 | 4.935 | 2.013 | 0.069 | 0.001 |
| 25th Quartile | −5.321 | −5.413 | 0 | 0 | 0 | 0 | 38.890 | 0.217 | 0.891 | 7.357 | −0.002 | 0 |
| Median | −4.444 | −4.592 | 0 | 0 | 0 | 0 | 59.260 | 0.388 | 2.711 | 8.370 | 0 | 0 |
| 75th Quartile | −3.719 | −3.900 | 0 | 0 | 0 | 0 | 71.300 | 0.614 | 4.755 | 10.450 | 0.004 | 0 |
This table displays statistical properties of the variables used in our main analysis for the full sample (Panel A), the subsample of emerging markets (Panel B), and the subsample of developed markets (Panel C). Log |R| and Log |RRCAPM| denote the logarithm of absolute daily returns and the logarithm of residual returns from the CAPM, respectively. Log (Daily Vaccinations) indicates the logarithm of the number of daily COVID-19 vaccinations. Daily Vaccinations per 100,000 represents the number of daily COVID-19 vaccinations scaled by the population of a country (multiplied by 100,000). Vaccination Period denotes a dummy variable taking the value of one for the period starting from the country’s first vaccination day and zero otherwise. Δ Daily Vaccinations Dummy is an indicator variable that amounts to one if the daily change in the number of COVID-19 vaccinations is strictly positive and zero otherwise. Stringency Index reflects the government response to the pandemic and ranges between 0 and 100. BM is the book-to-market ratio; turnover is stock turnover; Log (MV) is the logarithm of market value in U.S. dollars. Δ Cases to Cases represents the daily change in the number of COVID-19 infections scaled by the total number of confirmed cases. Δ Deaths to Cases is the daily change in the number of COVID-19 fatalities to the aggregate number of confirmed infections. We winsorized the continuous variables at the 1st and 99th percentiles.
Table 3.
Pairwise correlation coefficients between major variables.
| 1. | 2. | 3. | 4. | 5. | 6. | 7. | 8. | 9. | 10. | |
|---|---|---|---|---|---|---|---|---|---|---|
| 1. Log (Daily Vaccinations) | 1.000 | |||||||||
| 2. Daily Vaccinations Per 100,000 | 0.752 *** | 1.000 | ||||||||
| 3. Vaccination Period | 0.845 *** | 0.601 *** | 1.000 | |||||||
| 4. Δ Daily Vaccinations Dummy | 0.759 *** | 0.621 *** | 0.648 *** | 1.000 | ||||||
| 5. Stringency Index | 0.205 *** | 0.150 *** | 0.212 *** | 0.149 *** | 1.000 | |||||
| 6. BM | −0.074 *** | −0.054 *** | −0.075 *** | −0.048 *** | 0.012 | 1.000 | ||||
| 7. Turnover | −0.013 | −0.014 * | −0.051 *** | −0.026 *** | 0.099 *** | 0.109 *** | 1.000 | |||
| 8. Log (MV) | 0.079 *** | 0.059 *** | 0.046 *** | 0.065 *** | −0.049 *** | −0.451 *** | 0.155 *** | 1.000 | ||
| 9. Δ Cases to Cases | −0.029 *** | −0.016 ** | −0.037 *** | −0.014 * | −0.115 *** | −0.005 | 0.023 *** | 0.002 | 1.000 | |
| 10. Δ Deaths to Cases | −0.015 * | −0.007 | −0.021 *** | −0.004 | 0.007 | −0.004 | 0.021 ** | 0.006 | 0.311 *** | 1.000 |
This table shows pairwise correlations between the explanatory variables used in our main regressions. Log (Daily Vaccinations) indicates the logarithm of the number of daily COVID-19 vaccinations. Daily Vaccinations per 100,000 represents the number of daily COVID-19 vaccinations scaled by the population of a country (multiplied by 100,000). Vaccinations Period denotes a dummy variable taking the value of one for the period starting from the country’s first vaccination day and zero otherwise. Δ Daily Vaccinations Dummy is an indicator variable that amounts to one if the daily change in the number of COVID-19 vaccinations is strictly positive and zero otherwise. Stringency Index reflects the government response to the pandemic and ranges between 0 and 100. BM is the book-to-market ratio; turnover is stock turnover; Log (MV) is the logarithm of market value in U.S. dollars. Δ Cases to Cases represents the daily change in the number of COVID-19 infections scaled by the total number of confirmed cases. Δ Deaths to Cases is the daily change in the number of COVID-19 fatalities to the aggregate number of confirmed infections. We winsorized the continuous variables at the 1st and 99th percentiles. The asterisks ***, **, and * indicate statistical significance at the 1%, 5%, and 10% levels, respectively.
Table 4.
Primary regressions.
| Dependent Variable: Log |R| | Dependent Variable: Log |RRCAPM| | |||||||
|---|---|---|---|---|---|---|---|---|
| (1) | (2) | (3) | (4) | (5) | (6) | (7) | (8) | |
| Log (Daily Vaccinations)t−1 | −0.0378 *** | −0.0286 *** | ||||||
| (−6.44) | (−4.89) | |||||||
| Daily Vaccinations Per 100,000t−1 | −0.0005 *** | −0.0005 *** | ||||||
| (−3.69) | (−4.50) | |||||||
| Vaccination Period | −0.4872 *** | −0.3809 *** | ||||||
| (−7.54) | (−5.83) | |||||||
| Δ Daily Vaccinations Dummyt−1 | −0.2448 *** | −0.2135 *** | ||||||
| (−4.18) | (−4.16) | |||||||
| Stringency Indext−1 | −0.0018 | −0.0032 *** | −0.0007 | −0.0033 *** | 0.0006 | −0.0002 | 0.0016 | −0.0005 |
| (−1.54) | (−2.94) | (−0.58) | (−2.83) | (0.57) | (−0.21) | (1.51) | (−0.47) | |
| BMt−1 | 0.2723 | 0.2655 | 0.2857 * | 0.3554 * | 0.1176 | 0.0965 | 0.1235 | 0.1777 |
| (1.55) | (1.48) | (1.73) | (1.81) | (1.07) | (0.88) | (1.17) | (1.48) | |
| Turnovert−1 | 0.0152 *** | 0.0158 *** | 0.0147 *** | 0.0160 *** | 0.0125 *** | 0.0128 *** | 0.0121 *** | 0.0130 *** |
| (3.35) | (3.47) | (3.37) | (3.41) | (3.11) | (3.23) | (3.16) | (3.16) | |
| Log (MV)t−1 | −0.2335 ** | −0.2793 *** | −0.1918 ** | −0.2747 *** | −0.1930 ** | −0.2227 *** | −0.1581 * | −0.2272 ** |
| (−2.41) | (−2.99) | (−2.06) | (−2.73) | (−2.31) | (−2.82) | (−1.92) | (−2.64) | |
| Δ Cases to Casest−1 | 0.1618 | 0.1946 | 0.1191 | 0.2166 | 0.5289 *** | 0.5404 *** | 0.4947 *** | 0.5601 *** |
| (0.83) | (0.99) | (0.61) | (1.10) | (2.90) | (3.04) | (2.79) | (3.08) | |
| Δ Deaths to Casest−1 | −4.2655 | −2.4980 | −5.4021 | −2.4986 | −1.2914 | −0.6183 | −2.3240 | −0.3476 |
| (−0.41) | (−0.24) | (−0.52) | (−0.24) | (−0.14) | (−0.07) | (−0.25) | (−0.04) | |
| Weekday Dummies | Yes | Yes | Yes | Yes | Yes | Yes | Yes | Yes |
| Month Dummies | Yes | Yes | Yes | Yes | Yes | Yes | Yes | Yes |
| #Obs. | 12,869 | 12,869 | 12,872 | 12,827 | 12,869 | 12,869 | 12,872 | 12,827 |
| R2 within | 0.0595 | 0.0574 | 0.0615 | 0.0565 | 0.0503 | 0.0499 | 0.0523 | 0.0484 |
This exhibit reports the fixed-effects estimates of the relation between COVID-19 vaccinations and equity returns volatility. The dependent variables include the logarithm of absolute daily returns (Log |R|, Columns (1)–(4)) and the logarithm of absolute residual returns from the CAPM model (Log |RRCAPM|, Columns (5)–(8)). Log (Daily Vaccinations) indicates the logarithm of the number of daily COVID-19 vaccinations. Daily Vaccinations per 100,000 represents the number of daily COVID-19 vaccinations scaled by the population of a country (multiplied by 100,000). Vaccination Period denotes a dummy variable taking the value of one for the period starting from the country’s first vaccination day and zero otherwise. Δ Daily Vaccinations Dummy is an indicator variable that amounts to one if the daily change in the number of COVID-19 vaccinations is strictly positive and zero otherwise. Stringency Index reflects the government response to the pandemic and ranges between 0 and 100. BM is the book-to-market ratio; turnover is stock turnover; Log (MV) is the logarithm of market value in U.S. dollars. Δ Cases to Cases represents the daily change in the number of COVID-19 infections scaled by the total number of confirmed cases. Δ Deaths to Cases is the daily change in the number of COVID-19 fatalities to the aggregate number of confirmed infections. We winsorized the continuous variables at the 1st and 99th percentiles. The numbers in parentheses are t-statistics based on standard errors clustered at the country level. The asterisks ***, **, and * indicate statistical significance at the 1%, 5%, and 10% levels, respectively.
Table 5.
Robustness tests—alternative estimation methods and dependent variables.
| Panel A: Alternative Regression Frameworks | ||||||||||||
| Pooled OLS | Random effects | |||||||||||
| (1) | (2) | (3) | (4) | (5) | (6) | (7) | (8) | |||||
| Log (Daily Vaccinations)t−1 | −0.0311 *** | −0.0445 *** | ||||||||||
| (−3.03) | (−7.54) | |||||||||||
| Daily Vaccinations Per 100,000t−1 | −0.0005 ** | −0.0007 *** | ||||||||||
| (−2.48) | (−4.65) | |||||||||||
| Vaccination Period | −0.5277 *** | −0.5717 *** | ||||||||||
| (−5.11) | (−9.06) | |||||||||||
| Δ Daily Vaccinations Dummyt−1 | −0.2202 ** | −0.2976 *** | ||||||||||
| (−2.32) | (−4.89) | |||||||||||
| Control Variables | Yes | Yes | Yes | Yes | Yes | Yes | Yes | Yes | ||||
| Weekday and Month Dummies | Yes | Yes | Yes | Yes | Yes | Yes | Yes | Yes | ||||
| Obs. | 12,869 | 12,869 | 12,872 | 12,827 | 12,869 | 12,869 | 12,872 | 12,827 | ||||
| R2 within | 0.0725 | 0.0716 | 0.0774 | 0.0705 | 0.0562 | 0.0535 | 0.0587 | 0.0524 | ||||
| Panel B: Alternative Measures of Volatility | ||||||||||||
| Dependent Variable: Log |RRFF| | Dependent Variable: Log |RRAMP| | Dependent Variable: Log |RRCAR| | ||||||||||
| (1) | (2) | (3) | (4) | (5) | (6) | (7) | (8) | (9) | (10) | (11) | (12) | |
| Log (Daily Vaccinations)t−1 | −0.0290 *** | −0.0291 *** | −0.0292 *** | |||||||||
| (−5.05) | (−5.08) | (−4.95) | ||||||||||
| Daily Vaccinations Per 100,000t−1 | −0.0005 *** | −0.0005 *** | −0.0005 *** | |||||||||
| (−4.36) | (−4.03) | (−4.03) | ||||||||||
| Vaccination Period | −0.3951 *** | −0.4129 *** | −0.4146 *** | |||||||||
| (−6.90) | (−7.34) | (−7.07) | ||||||||||
| Δ Daily Vaccinations Dummyt−1 | −0.1996 *** | −0.2176 *** | −0.1903 *** | |||||||||
| (−4.49) | (−4.70) | (−3.82) | ||||||||||
| Control Variables | Yes | Yes | Yes | Yes | Yes | Yes | Yes | Yes | Yes | Yes | Yes | Yes |
| Weekday and Month Dummies | Yes | Yes | Yes | Yes | Yes | Yes | Yes | Yes | Yes | Yes | Yes | Yes |
| Obs. | 12,869 | 12,869 | 12,872 | 12,827 | 12,869 | 12,869 | 12,872 | 12,827 | 12,869 | 12,869 | 12,872 | 12,827 |
| R2 within | 0.0574 | 0.0566 | 0.0597 | 0.055 | 0.0565 | 0.0551 | 0.0593 | 0.0544 | 0.0571 | 0.0558 | 0.06 | 0.0545 |
This table presents the results of the first set of sensitivity tests. Panel A reports results from pooled OLS (Columns (1)–(4)) and random effects (Columns (5)–(8)) estimations using the logarithm of absolute daily returns (Log |R|) as a dependent variable. Panel B concerns the use of alternative dependent variables: the logarithms of absolute residual returns from the models of Fama and French (1993) (Log |RRFF|, Columns (1)–(4)); Asness et al. (2013) (Log |RRAMP|, Columns (5)–(8)); and Carhart (1997) (Log |RRCAR|, Columns (9)–(12)). Log (Daily Vaccinations) indicates the logarithm of the number of daily COVID-19 vaccinations. Daily Vaccinations per 100,000 represents the number of daily COVID-19 vaccinations scaled by the population of a country (multiplied by 100,000). Vaccination Period denotes a dummy variable taking the value of one for the period starting from the country’s first vaccination day and zero otherwise. Δ Daily Vaccinations Dummy is an indicator variable that amounts to one if the daily change in the number of COVID-19 vaccinations is strictly positive and zero otherwise. All specifications include weekday and month dummies. We winsorized the continuous variables at the 1st and 99th percentiles. The numbers in parentheses are t-statistics based on standard errors clustered at the country level. The asterisks ***, **, and * indicate statistical significance at the 1%, 5%, and 10% levels, respectively.
Table 6.
Robustness checks—further control variables and modified study period.
| Panel A: Additional Control Variables | ||||||||||||
| Log (TV)t−1 | Momentumt−1 | Crisis | ||||||||||
| (1) | (2) | (3) | (4) | (5) | (6) | (7) | (8) | (9) | (10) | (11) | (12) | |
| Log (Daily Vaccinations)t−1 | −0.0446 *** | −0.0353 *** | −0.0248 *** | |||||||||
| (−7.91) | (−5.55) | (−4.47) | ||||||||||
| Daily Vaccinations Per 100,000t−1 | −0.0007 *** | −0.0005 *** | −0.0004 ** | |||||||||
| (−4.82) | (−3.33) | (−2.52) | ||||||||||
| Vaccination Period | −0.5584 *** | −0.4649 *** | −0.3133 *** | |||||||||
| (−9.75) | (−6.69) | (−4.95) | ||||||||||
| Δ Daily Vaccinations Dummyt−1 | −0.3072 *** | −0.2180 *** | −0.1453 ** | |||||||||
| (−5.16) | (−3.62) | (−2.51) | ||||||||||
| Additional Control Variable | 0.1214 *** | 0.1245 *** | 0.1180 *** | 0.1234 *** | −0.1412 | −0.2060 * | −0.1428 | −0.2238 ** | 0.6516 *** | 0.6967 *** | 0.5956 *** | 0.7432 *** |
| (5.05) | (5.18) | (5.05) | (5.29) | (−1.25) | (−1.92) | (−1.50) | (−2.02) | (7.77) | (8.02) | (7.34) | (8.71) | |
| Control Variables | Yes | Yes | Yes | Yes | Yes | Yes | Yes | Yes | Yes | Yes | Yes | Yes |
| Weekday and Month Dummies | Yes | Yes | Yes | Yes | Yes | Yes | Yes | Yes | Yes | Yes | Yes | Yes |
| Obs. | 12,869 | 12,869 | 12,872 | 12,827 | 12,869 | 12,869 | 12,872 | 12,827 | 12,869 | 12,869 | 12,872 | 12,827 |
| R2 within | 0.0609 | 0.0578 | 0.0636 | 0.0569 | 0.0599 | 0.0582 | 0.0619 | 0.0574 | 0.0662 | 0.0654 | 0.0668 | 0.0656 |
| Panel B: Alternative Study Period (Starting from 11 March 2020) | ||||||||||||
| Fixed Effects | Pooled OLS | Random Effects | ||||||||||
| (1) | (2) | (3) | (4) | (5) | (6) | (7) | (8) | (9) | (10) | (11) | (12) | |
| Log (Daily Vaccinations)t−1 | −0.0416 *** | −0.0319 *** | −0.0493 *** | |||||||||
| (−6.61) | (−3.18) | (−7.99) | ||||||||||
| Daily Vaccinations Per 100,000t−1 | −0.0006 *** | −0.0005 ** | −0.0007 *** | |||||||||
| (−3.33) | (−2.39) | (−4.47) | ||||||||||
| Vaccination Period | −0.5706 *** | −0.5925 *** | −0.6728 *** | |||||||||
| (−7.90) | (−5.81) | (−9.75) | ||||||||||
| Δ Daily Vaccinations Dummyt−1 | −0.2579 *** | −0.2172 ** | −0.3169 *** | |||||||||
| (−4.41) | (−2.47) | (−5.22) | ||||||||||
| Control Variables | Yes | Yes | Yes | Yes | Yes | Yes | Yes | Yes | Yes | Yes | Yes | Yes |
| Weekday and Month Dummies | Yes | Yes | Yes | Yes | Yes | Yes | Yes | Yes | Yes | Yes | Yes | Yes |
| Obs. | 12,038 | 12,038 | 12,038 | 12,038 | 12,038 | 12,038 | 12,038 | 12,038 | 12,038 | 12,038 | 12,038 | 12,038 |
| R2 within | 0.0598 | 0.0570 | 0.0627 | 0.0598 | 0.0718 | 0.0708 | 0.0775 | 0.0695 | 0.0558 | 0.0521 | 0.0595 | 0.0505 |
This table presents the results of a second set of sensitivity tests. In all regressions, the dependent variable is the natural logarithm of absolute daily returns, Log |R|. Panel A shows regression results after including three variables, one at a time, as additional controls to our main regressions. Namely, (i) Log (TV), defined as the logarithm of trading volume in U.S. dollars. When using this variable, we did not include Log (MV) and Turnover in our regression to avoid multicollinearity; (ii) Momentum is the total stock return in the past 250 trading days; and iii) Crisis, which is a dummy variable that equals one for the COVID-19 crisis period from 18 February to 20 March 2020 (Bae et al. 2021) and zero otherwise. In Panel B, we rerun our main regressions after considering an alternative study period that starts at 11 March 2020 and ends at 29 March 2021. Log (Daily Vaccinations) indicates the logarithm of the number of daily COVID-19 vaccinations. Daily Vaccinations per 100,000 represents the number of daily COVID-19 vaccinations scaled by the population of a country (multiplied by 100,000). Vaccination Period denotes a dummy variable taking the value of one for the period starting from the country’s first vaccination day and zero otherwise. Δ Daily Vaccinations Dummy is an indicator variable that amounts to one if the daily change in the number of COVID-19 vaccinations is strictly positive and zero otherwise. All specifications include weekday and month dummies. We winsorized the continuous variables at the 1st and 99th percentiles. The numbers in parentheses are t-statistics based on standard errors clustered at the country level. The asterisks ***, **, and * indicate statistical significance at the 1%, 5%, and 10% levels, respectively.
Table 7.
The vaccination effect in developed and emerging markets.
| Emerging | Developed | Emerging | Developed | Emerging | Developed | Emerging | Developed | |
|---|---|---|---|---|---|---|---|---|
| (1) | (2) | (3) | (4) | (5) | (6) | (7) | (8) | |
| Log (Daily Vaccinations)t−1 | −0.0394 *** | −0.0340 *** | ||||||
| (−4.00) | (−4.68) | |||||||
| Daily Vaccinations Per 100,000t−1 | −0.0007 *** | −0.0003 * | ||||||
| (−2.86) | (−1.99) | |||||||
| Vaccination Period | −0.5330 *** | −0.4080 *** | ||||||
| (−5.60) | (−4.37) | |||||||
| Δ Daily Vaccinations Dummyt−1 | −0.2647 ** | −0.1898 *** | ||||||
| (−2.40) | (−3.25) | |||||||
| Stringency Indext−1 | −0.0038 ** | 0.0006 | −0.0049 *** | −0.0012 | −0.0025 | 0.0013 | −0.0050 *** | −0.0011 |
| (−2.04) | (0.41) | (−2.83) | (−0.98) | (−1.42) | (0.92) | (−2.79) | (−0.74) | |
| BMt−1 | 0.2109 | 0.1321 | 0.2229 | 0.0952 | 0.2205 | 0.2183 | 0.3089 | 0.1549 |
| (1.01) | (0.66) | (1.05) | (0.48) | (1.10) | (1.12) | (1.30) | (0.81) | |
| Turnovert−1 | 0.0105 *** | 0.0449 *** | 0.0110 *** | 0.0462 *** | 0.0098 *** | 0.0448 *** | 0.0110 *** | 0.0470 *** |
| (3.02) | (7.83) | (3.18) | (7.65) | (3.09) | (7.87) | (3.13) | (7.95) | |
| Log (MV)t−1 | −0.2012 * | −0.3499 ** | −0.2590 ** | −0.4064 *** | −0.1770 | −0.2522 * | −0.2361 ** | −0.4162 *** |
| (−1.84) | (−2.83) | (−2.45) | (−3.51) | (−1.63) | (−1.75) | (−2.16) | (−3.34) | |
| Δ Cases to Casest−1 | 0.0747 | 0.2768 | 0.1076 | 0.3238 | 0.0121 | 0.2680 | 0.1302 | 0.3308 |
| (0.25) | (1.26) | (0.37) | (1.38) | (0.04) | (1.26) | (0.44) | (1.44) | |
| Δ Deaths to Casest−1 | 1.1800 | −11.5439 | 2.5303 | −8.5181 | −0.9133 | −10.9465 | 2.7561 | −9.4817 |
| (0.08) | (−0.79) | (0.17) | (−0.56) | (−0.06) | (−0.74) | (0.18) | (−0.63) | |
| Weekday Dummies | Yes | Yes | Yes | Yes | Yes | Yes | Yes | Yes |
| Month Dummies | Yes | Yes | Yes | Yes | Yes | Yes | Yes | Yes |
| Obs. | 7047 | 5822 | 7047 | 5822 | 7049 | 5823 | 7022 | 5805 |
| R2 within | 0.0546 | 0.0770 | 0.0535 | 0.0736 | 0.0580 | 0.0773 | 0.0518 | 0.0739 |
The table shows fixed-effects estimates of the relation between COVID-19 vaccinations and equity volatility in emerging and developed countries. The left-hand side variable is the logarithm of absolute daily returns, Log |R|. Log (Daily Vaccinations) indicates the logarithm of the number of daily COVID-19 vaccinations. Daily Vaccinations per 100,000 represents the number of daily COVID-19 vaccinations scaled by the population of a country (multiplied by 100,000). Vaccination Period denotes a dummy variable taking the value of one for the period starting from the country’s first vaccination day and zero otherwise. Δ Daily Vaccinations Dummy is an indicator variable that amounts to one if the daily change in the number of COVID-19 vaccinations is strictly positive and zero otherwise. Stringency Index reflects the government response to the pandemic and ranges between 0 and 100. BM is the book-to-market ratio; turnover is stock turnover; Log (MV) is the logarithm of market value in U.S. dollars. Δ Deaths to Cases is the daily change in the number of COVID-19 fatalities to the aggregate number of confirmed infections. We winsorized the continuous variables at the 1st and 99th percentiles. The numbers in parentheses are t-statistics based on standard errors clustered at the country level. The asterisks ***, **, and * indicate statistical significance at the 1%, 5%, and 10% levels, respectively.
Publisher’s Note: MDPI stays neutral with regard to jurisdictional claims in published maps and institutional affiliations. |
© 2022 by the authors. Licensee MDPI, Basel, Switzerland. This article is an open access article distributed under the terms and conditions of the Creative Commons Attribution (CC BY) license (https://creativecommons.org/licenses/by/4.0/).
Share and Cite
MDPI and ACS Style
Demir, E.; Kizys, R.; Rouatbi, W.; Zaremba, A. Sail Away to a Safe Harbor? COVID-19 Vaccinations and the Volatility of Travel and Leisure Companies. J. Risk Financial Manag. 2022, 15, 182. https://doi.org/10.3390/jrfm15040182
AMA Style
Demir E, Kizys R, Rouatbi W, Zaremba A. Sail Away to a Safe Harbor? COVID-19 Vaccinations and the Volatility of Travel and Leisure Companies. Journal of Risk and Financial Management. 2022; 15(4):182. https://doi.org/10.3390/jrfm15040182
Chicago/Turabian StyleDemir, Ender, Renatas Kizys, Wael Rouatbi, and Adam Zaremba. 2022. "Sail Away to a Safe Harbor? COVID-19 Vaccinations and the Volatility of Travel and Leisure Companies" Journal of Risk and Financial Management 15, no. 4: 182. https://doi.org/10.3390/jrfm15040182