Bankruptcy Prediction Models Based on Value Measures


College of Management and Quality Sciences, Cracow University of Economics, Rakowicka 27, 31-510 Kraków, Poland
*
Author to whom correspondence should be addressed.
J. Risk Financial Manag. 2021, 14(1), 6; https://doi.org/10.3390/jrfm14010006
Submission received: 26 November 2020
/
Revised: 16 December 2020
/
Accepted: 18 December 2020
/
Published: 24 December 2020
(This article belongs to the Special Issue International Trends and Economic Sustainability on Emerging Markets)
Abstract
:In the existing studies devoted to predicting bankruptcy, the authors of such models only used book measures. Considering the fact that the evolution of corporate measure efficiency (in addition to book measures) brought into existence and exposed the importance of cash measures, market measures, and measures based on the economic profit concept, it is justified to carry out research into the possibility of using these measures as variables within the discriminant function. The studied dataset was divided into a training set and a testing set based on two variants of the sample division. The assessment of the statistical significance of the built discriminant functions as well as the diagnostic variables was conducted using the STATISTICA package. The research was conducted separately for each variant. In the first step, a total of 30 discriminant models were created. This enabled us to select 20 diagnostic variables that were considered within the two models that were characterised by the highest predictive abilities—one for each variant. The discriminant function that was estimated for the first variant was based on the use of eight diagnostic variables, and 13 diagnostic variables were used in the function that was estimated for the second variant. The conducted analysis has proven that shareholder value measures are a useful tool that can be applied for the needs of corporate risk management in the area of the assessment of a firm’s bankruptcy risk. Using two variants of the division of the research sample into the training and testing sets, it turned out that the division affects the predictive efficiency of the discriminant functions. At the same time, the obtained findings tend to claim that the presence of the value measures from all four of the studied groups in the output set of the diagnostic variables is necessary for possibly building the most efficient tool for the early warning signs of bankruptcy risk.
1. Introduction
Risk is one of key attributes of an enterprise as a market entity and an economic organisation. This arises from managers’ incomplete knowledge with regard to future changes in the conditions of management and their impact on the firm, competitors’ behaviours, and the formation and evolution of customers’ expectations. The aforementioned conditions are objective and permanent.; thus, risk is considered to be the factor that promotes some enterprises that derive additional benefits from it on the one hand and eliminates inefficient entities from the market on the other (for the latter, it becomes only a negative factor). In this context, risk should be perceived both as an opportunity to obtain extra benefits and a threat for the continuation of the activity of a business (Horváthová and Morikrišová 2018).
The first of the mentioned perspectives of perceiving risk is related to the risk management process; during the course of this, risk is treated like an incurred cost with regard to the effort of implementing the goals of an enterprise, including the basic financial goal (namely, the maximisation of its market value, where risk is one of the key factors that determine the efficiency of value creation and a component of the so-called pro-value management triad). The other perspective of risk perception refers to the problem of the risk of bankruptcy and its prediction. The needs that are connected with risk management and the assessment of bankruptcy risk have brought about the necessity to search for tools for the quantification of risk, necessary both in the process of risk management (risk measurement as one of its stages) and during the course of building models for predicting a firm’s bankruptcy.
The pioneer of research into the prediction of bankruptcy based on the application of a multidimensional discriminant analysis was E.I. Altman (Altman 1968), who used a model based on five variables for this purpose. The model then became a contribution to the creation in the following years of different discriminant analysis models by various economists. In the existing theoretical, methodological, and empirical studies devoted to predicting bankruptcy, the authors of such models only used book measures based on the information coming from a company’s financial statement as the variables that describe the company’s financial standing at which the corporate profitability measure were different forms of its profit—namely, book surplus calculated on an accrual basis (Gavurova et al. 2017; Prusak 2018; Wieczorek-Kosmala et al. 2018). Considering the fact that the evolution of corporate measure efficiency (in addition to book measures) brought into existence and exposed the importance of cash measures (based on cash flows and cash basis), market measures, and measures based on the economic profit concept, it is justified to carry out research into the possibility of using these measures as variables within the discriminant function. In this context, the authors see a research gap that establishes the basic objective of this article, which is building a discriminant function based on the use of measures that belong to all groups. In particular, it is about shareholder value measures, which are generally defined as value measures. At the same time, the identified research gap became a premise for formulating the following research questions focused on the effort to implement the aforementioned goal:
- How do we choose value measures that are intended to play the function of estimators of the bankruptcy risk of those construction companies that were listed on the Warsaw Stock Exchange during the years of 2010–2015?
- How do we build a discriminant function with the highest predictive efficiency for the aforementioned companies?
- How does the division into training and testing sets influence the predictive efficiency of the discriminant function that has been built?
We attempt to fill the identified research gap by answering the formulated questions as a key achievement of this article, giving its features of originality.
The choice of the time horizon and the objects of the analysis is not accidental. This was a period for the accumulation of construction investments concerning the erection and extension of sports, road, and touristic and recreational infrastructures that took place in Poland during the years 2010–2012 due to the organisation of the Euro 2012 UEFA European Football Championship by Poland and Ukraine and that also contributed to a rapid increase in the number of the bankruptcies of construction companies on the Polish market over the following years (2013–2015).
The following research methods were used in the article:
- Methods for analysing and evaluating the literature that shows the current scientific achievements in the field of essence as well as using a discriminant analysis in order to predict the bankruptcy of enterprises—with a particular emphasis on the types of enterprise effectiveness measures used for this purpose.
- Statistical methods for verifying and supplementing the missing values of the variables, estimating the discriminant power of the variables, examining the information capacity of the variables, and examining the normality of the empirical distributions of the value measures.
- Statistical methods for assessing the statistical significance of the built discriminant functions as well as the diagnostic variables.
The article is structured as follows. First, we present the theoretical background according to a discriminant analysis based on a literature review, followed by describing the used materials and methods. The next section presents the research results as well as a discussion. Finally, we present the conclusions that resulted from the conducted research.
2. Discriminant Analysis Models—Theoretical Background
Discriminant analysis is an empirical and inductive method that aims to assign objects being compared (enterprises, among others) to a group of objects that are most similar to each other due to the properties describing them (Shiker 2012). The analysis base is the linear discriminant function, whose primary form was formulated by R.A. Fisher and which has been used in natural studies (Fisher 1936). In the most universal approach, the function is described by Equation (1):
where:
- Z—dependent variable;
- a0—constant;
- a1, a2, …, an—discriminant coefficients;
- X1, X2, …, Xn—exogenous (diagnostic) variables.
The starting point to indicate the possibility of using this function for the prediction of corporate bankruptcy risk was the research by W.H. Beaver, who in the 1960s verified the prognostic ability of financial ratios from the point of view of their discriminant power; thus, the usability for the needs of building a discriminant function that would serve to predict corporate bankruptcy risk (Gupta 2017). Among others, the research finding was used by E.I. Altman, who built the first discriminant analysis model and initiated the use of multidimensional discriminant analysis in economic studies in 1968 (Altman 1968). The further development of this analysis is connected with Altman’s cooperation with a group of eminent statisticians, the effect of which was the ZETA model developed in the mid-1970s (Altman et al. 1977). The aforementioned models were developed for different sectors of the American economy. The varied conditions that accompany the functioning of firms in different regions or countries are the reason why the problem of predicting bankruptcies cannot be generalised or requires an individualised research approach based on the use of empirical data that refers to a specific economy or group of economies with similar conditions of functioning (Bărbuţă-Mişu and Madaleno 2020). In this context, the following discriminant analysis models were created:
- G.L.V. Springate’s model that was developed for the Canadian economy (Talebnia et al. 2016);
- models for the Japanese economy (Takahashi et al. 1984);
- models for Asia’s emerging economies (Ashraf et al. 2019);
- H. Koh and L. Killough’s model for the American economy (Rahimipoor 2013).
The problem of the individualisation of the model from the point of view of the specificity of the businesses in which it is to be used also refers to their sizes, the effect of which was J. Falmer’s model that was used to assess the condition of American small- and medium-sized enterprises (Rahimipoor 2013). The processes of the economic and political transformation of the economies of Central and Eastern Europe countries (initiated in Poland in 1989) contributed to the initiation and development of research into predicting the bankruptcy of enterprises functioning in these countries. The results were the discriminant analysis models developed at various stages of the transformation processes of the aforementioned economies (Korol 2019; Kristóf and Virág 2020). An important factor that stimulated the development and improvement of discriminant analysis models for the prediction of bankruptcy was the development of mathematical, statistical, and analytical tools as well as the soft computing techniques initiated in the 1990s (Gavurova et al. 2017; Prusak 2018).
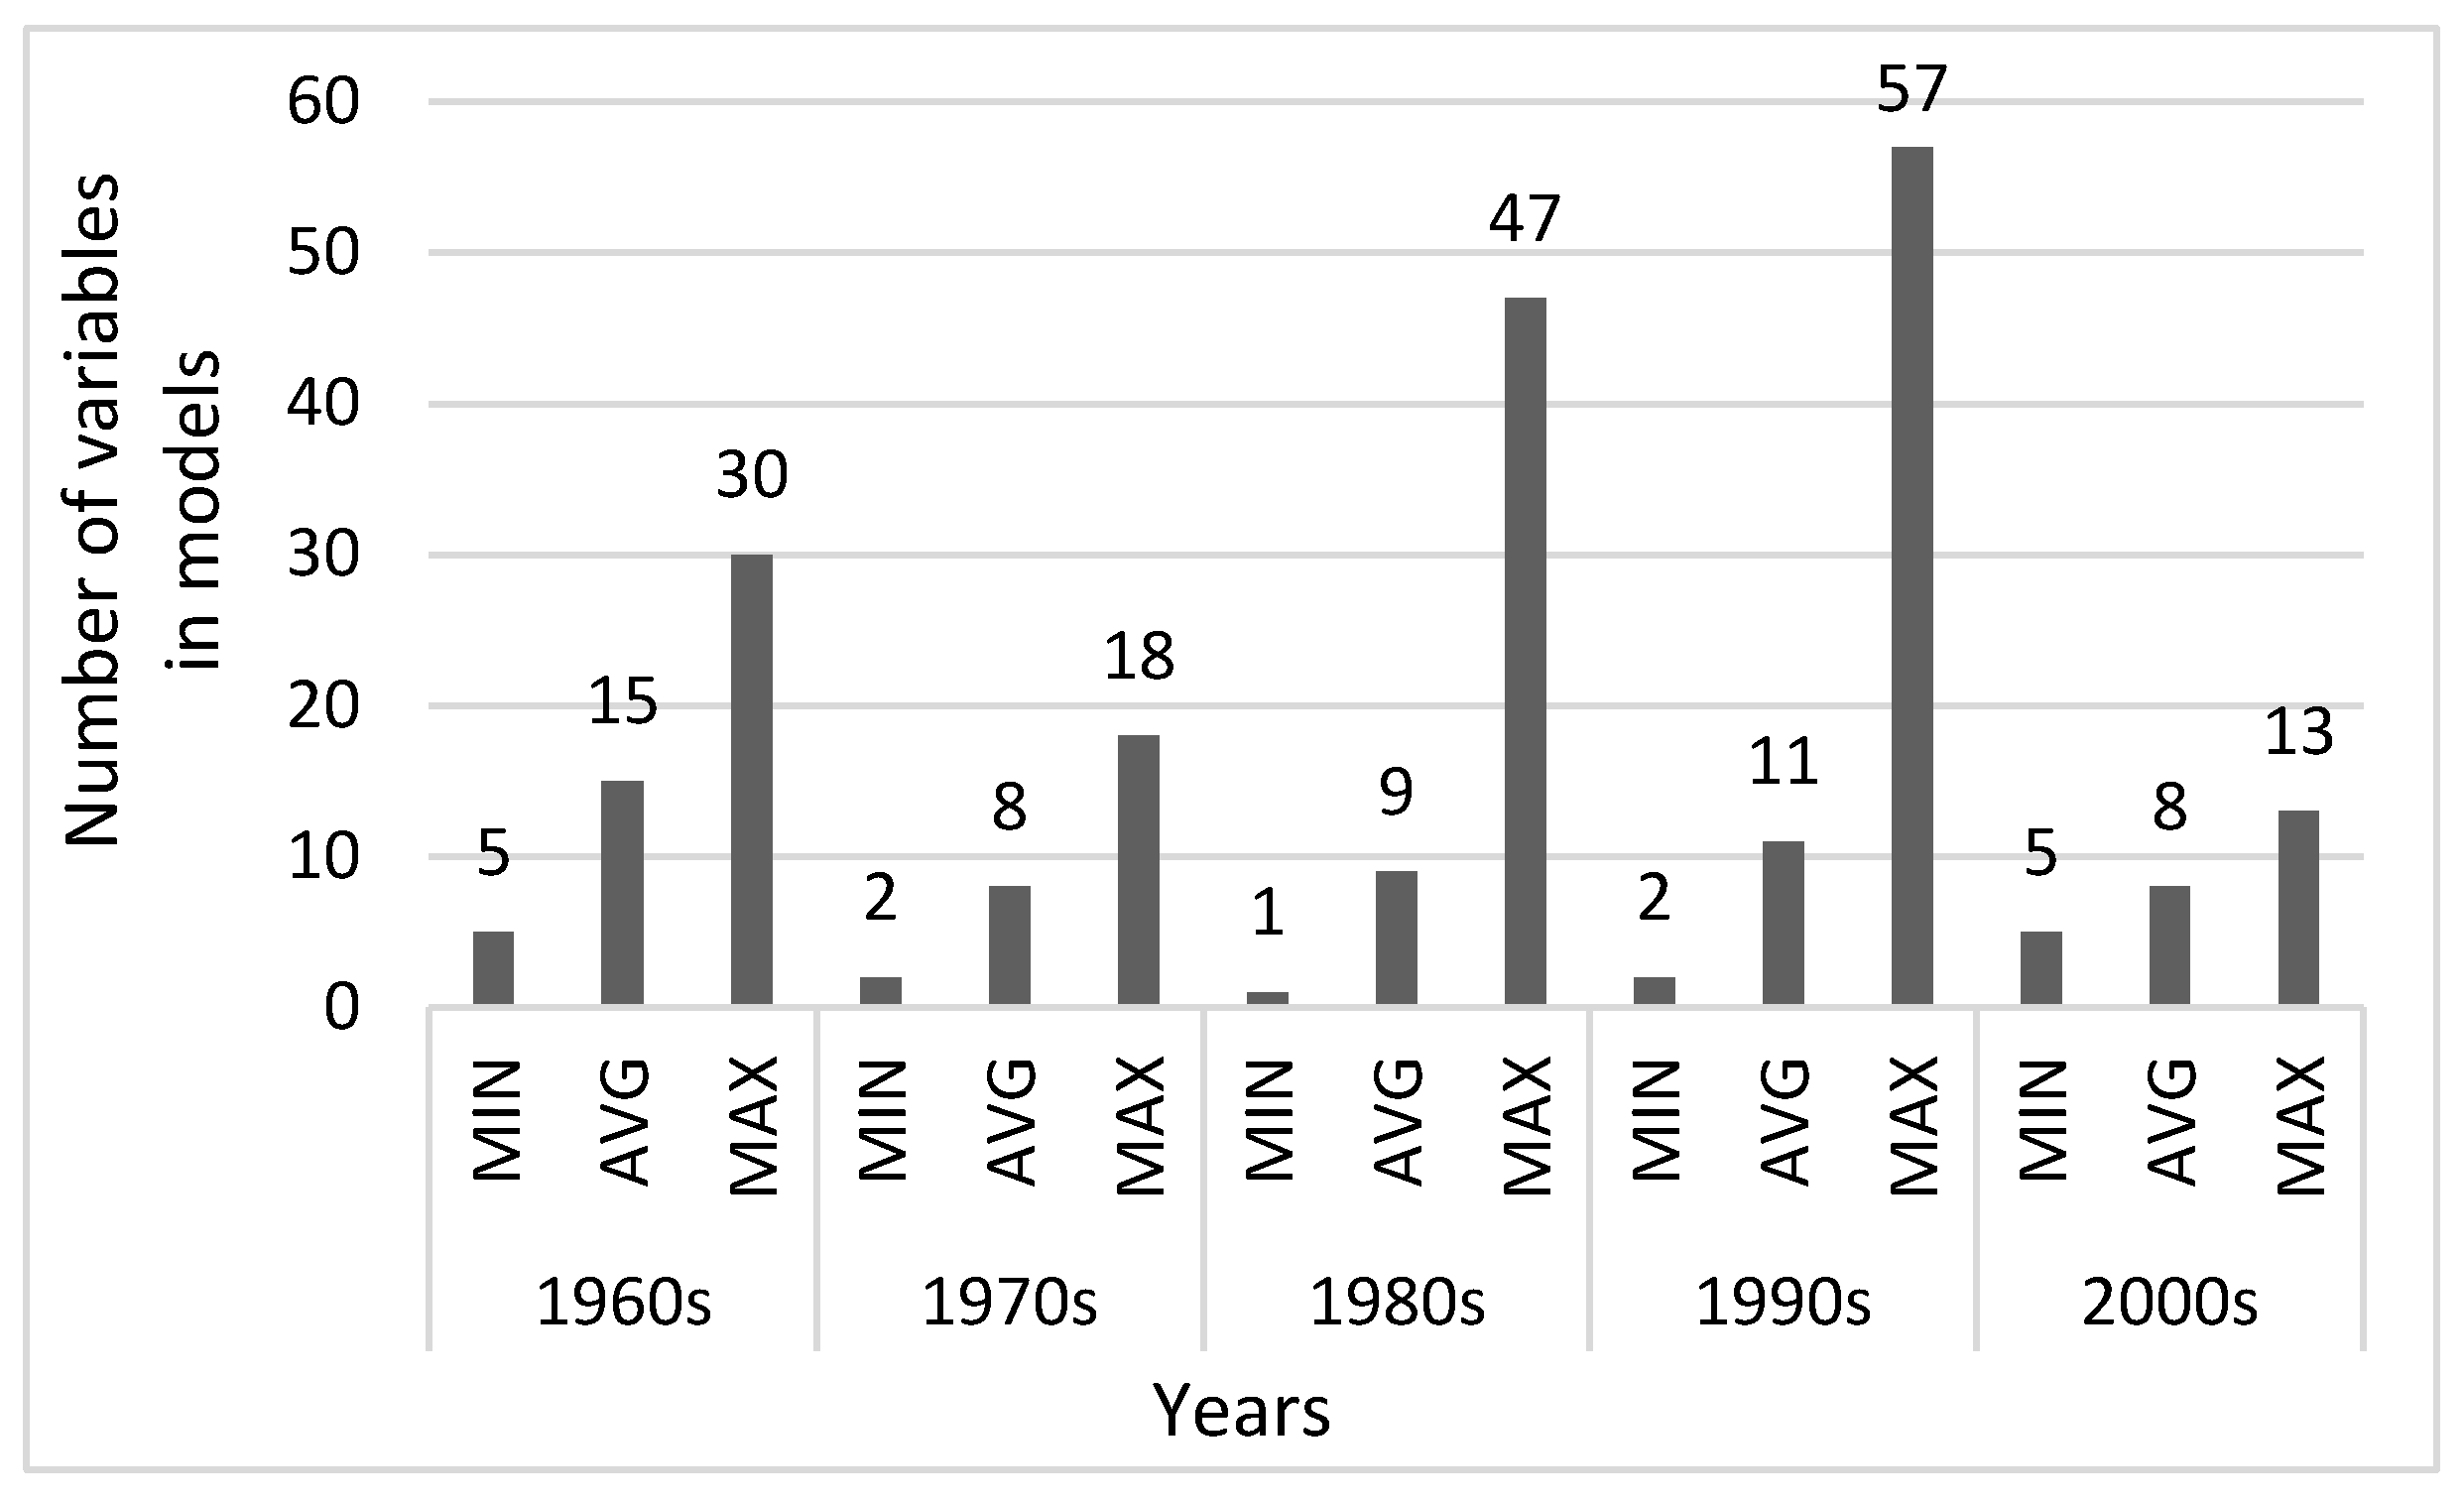
The development and evolution of these discriminant analysis models were also connected with the number of exogenous (diagnostic) variables that were used in these models over the decades. Within this scope, J.L. Bellovary, D.E. Giacomino, and M.D. Akers carried out research into the number and character of the variables used in the models, among other things (Bellovary et al. 2007). Based on the research findings, Figure 1 presents the number of diagnostic variables used in the bankruptcy prediction models.
The most frequently used variables included the following financial analysis ratios:
- Debt and debt coverage ratios;
- Turnover ratios;
- Profitability ratios;
- Liquidity ratios;
- Asset, equity, and debt structure ratios.
This confirms the thesis formulated in the introduction that the bankruptcy prediction models applied so far have been exclusively based on the use of book measures. At the same time, the authors formulate the postulate of the application of these measures for the needs of creating new bankruptcy prediction models by considering the development of the paradigm of the measurement of economic values that have contributed to the emergence and dissemination of the applications of cash measures, market measures, and measures based on the concept of economic profit. In particular, this is about those measures that enable the measurement and assessment of shareholder value. Thus, they are called “shareholder value measures” (or, in short, “value measures”). In this way, we indicate a new potential area of their use that is above and beyond the existing areas that are related to the value-based management concept (Young and O’Byrne 2001; Ehrbar 1998), business valuation (Fernandes 2019), value creating analysis and value controlling (Schierenbeck and Lister 2002), value-focused restructuring (Jaki 2012), pro-value motivation systems, and performance management systems (Mancini and Piscitelli 2018; Škare and Hasić 2016).
3. Materials and Methods
The time span of our analysis includes the years of 2010–2015. This was the period when Poland and Ukraine prepared for and implemented the UEFA European Championship, Euro 2012. During the years of 2010–2012, there was an accumulation of various construction investments that contributed to the rapid growth of the bankruptcies of construction companies on the Polish market over the years of 2013–2015 (Jaki 2018). Therefore, the study included those companies that were listed on the Warsaw Stock Exchange that belonged to the construction sector. The classification was made based on the International Industrial Standard Classification (ISIC)—Section F (Constructing). In the group of “bankrupts”, only those companies were included that filed bankruptcy petitions (both liquidations and arrangement bankruptcies) during the analysed period. On the other hand, those entities that were distinguished by good economic and financial standings and continued their activities during the analysed period were classified to the group of “non-bankrupts”. Forty-four construction companies were analysed, and the structure of the studied population was as follows: 33 bankrupts (75%) and 11 non-bankrupts (25%). The preliminary analysis showed that the share of the missing values of the diagnostic variables for the group of “bankrupts” that were estimated for the year that preceded the year of bankruptcy was as high as 14.42%; for the two years preceding the bankruptcy year, this share was 6.35%. Due to the estimated values of the shares of the missing values of the diagnostic variables, a decision was made to build a discriminatory model for the data from the two years previous to the declaration of bankruptcy by those companies that represented the group of “bankrupts”. It should also be emphasised that, in the article, the learning and test samples were unbalanced, which means that the number of “bankrupt” and “non-bankrupt” enterprises was not the same. This was dictated by the aforementioned small number of “bankrupt” companies, which made it impossible to create a balanced sample that was in compliance with the recommendations of the statistical analysis. It was also taken into account that the models that had been built that were based on the unbalanced sample at that time were not characterised by a bad predictive quality and were inferior to the built models that were based on the balanced sample (Pawełek et al. 2020). The source of the necessary financial data was the EMIS Intelligence—Polska database (EMIS 2020). For the needs of our calculations, the STATISTICA package was used.
In order to prepare the database and identify the value measures that were to be used as diagnostic variables in the discriminant function being built, the following actions were taken (Ramachandran and Tsokos 2009):
- adoption of the output set of book measures (BM), cash measures (CM), market measures (MM), and measures based on economic profit (EPM) as potential estimators of the bankruptcies of the analysed companies;
- verification and supplementation of the missing values of the variables with the use of the median as the well as verification of the variables from the point of view of outliers (using a two-way Tukey’s criterion with α = 0.05);
- estimation of the discriminant power of the variables with the use of the classical coefficient of variation;
- examination of the information capacity of the variables on the basis of Pearson’s linear correlation level;
- examination of the normality of the empirical distributions of the value measures using the following tests: Kolmogorov–Smirnov, Lilliefors, and Shapiro–Wilk, with the assumption of α at a level of 0.05.
In order to find the most efficient discriminant function, the studied dataset was divided into a training set and a testing set. The training set serves to build a discriminant model, whereas the testing set verifies the efficiency of the model. The article considers two variants of the sample division into the training and testing sets. The number of companies that formed the training and testing sets depending on the variant of the division is presented in Table 1.
The assessment of the statistical significance of the built discriminant functions as well as the diagnostic variables was conducted based on the following statistical measures (Ramachandran and Tsokos 2009):
- Wilks’ lambda serves to determine the statistical significance of the discriminatory ability of the whole model and is calculated as the proportion of the discriminant of the variance matrix and total covariance. This takes its value from a [0; 1] range, where “0” represents perfect discriminatory power and “1” represents no discriminatory power.
- Partial Wilks’ lambda—determines the contribution of the individual variables for the discrimination of the groups. The value of this measure is determined as the quotient of Wilks’ lambda value after entering a given variable in the model and Wilks’ lambda value before adding this variable. The partial Wilks’ lambda also takes values from a [0; 1] range, where “0” represents the perfect discriminatory power of a given variable and “1” represents no discriminatory ability of a given variable.
- Standardised discriminant coefficients—these indicate the contribution of the individual variables in the discrimination of enterprises to the populations of “bankrupts” and “non-bankrupts”. A higher absolute value of the standardised discriminant coefficient means the higher contribution of a given variable with which the coefficient occurs in the division of enterprises into both of the discussed groups, as determined by the estimated model.
- Canonical correlation—provides information on how efficiently a discriminant function divides the studied businesses into groups. This takes the value from a [0; 1] range; the higher the value, the stronger the relationship is between the groups and the discriminant function.
- Tolerance of variable—this is defined as 1 minus the squared multiple correlation coefficient of that variable with all other independent variables in the regression equation. This means that the lower the tolerance of the variable, the more excessive its contribution to the regression equation is (that is, it is indispensable in light of the contribution of the remaining variables—it is redundant).
- Multiple regression (R2)—this is an indicator of the quality of the model fit to the data (an R2 close to 1.0 indicates that almost all of the variability of the dependent variable can be explained through the independent variables included in the model).
4. Results and Discussion
With the use of the described methodology and the research procedure, we attempted to identify the most efficient discriminant function based on applying the book, cash, market measures, and measures as diagnostic variables based on the economic profit concept. The research was conducted separately for each variant of the sample division in the training and testing sets. In the first step, a total of 30 discriminant models were created (without using any limitation as for the maximum number of variables to be included in a given model). This enabled us to select 20 diagnostic variables that were considered within the two models that were characterised by the highest predictive abilities—one for each variant. The variables that are based on the use of the different value measures are presented and characterised in Table 2.
As arises from Table 2, there were 2 book measures, 2 cash measures, 2 measures based on the economic profit concept, and 14 market measures of the variables that best estimated the risk of bankruptcy of the studied companies. In Table 3, descriptive statistics of these variables are selected. However, Table 4 and Table 5 present the discriminant power of diagnostic variables and an examination of the normality of the empirical distributions of diagnostic variables for the analysed companies. Table 6 presents the discriminant functions that were estimated for each variant with the values of the statistical parameters.
The discriminant function that was estimated for the first variant was based on the use of eight diagnostic variables, whereas as many as 13 diagnostic variables were used in the function that was estimated for the second variant. Only one variable—NOPATPS—could be found in both variants.
When analysing the distribution of the variables within the function that was estimated for the first variant as well as the values of the statistical parameters in the most efficient model, we can find out that:
- five variables (62.5% of all) represented the group of market measures;
- one variable (12.5% of all) represented the groups of measures based on the economic profit concept, book, and cash measures;
- in the most efficient discriminant function, the diagnostic measures were entered in the form of the value measures of all four studied groups;
- the canonical correlation indicates a strong relationship between the discriminant function and the studied groups.
On the other hand, based on the values of the standardised coefficients that are included in Table 4, it should be stated that:
- the higher the value of the P/E or NOPATPS variables (ceteris paribus), the higher the probability is of classifying the studied company to the population of “bankrupts”;
- the lower the value of the remaining variables (P/EBIT, P/CFO, DY, CEC, EV/S, and CFROS), the higher the probability is that a studied company is a “bankrupt”;
- the higher the value of a company’s depending variable “Z” (ceteris paribus), the greater the risk of bankruptcy for the examined company;
- the greatest influence on the results of the discriminant function is exerted by the P/E variable (discriminant coefficient = 1.917), and the weakest influence is exerted by CFROS (discriminant coefficient = −0.346).
When analysing the distribution of the variables of the function that was estimated for the second variant as well as the values of the statistical parameters in the most efficient model, it can be stated that:
- nine variables (69% of all) represented the group of market measures;
- two variables (15% of all) represented the group of book measures, and one (8%) represented the groups of cash measures and measures based on the economic profit concept;
- in the most efficient discriminant function, the diagnostic variables were entered in the form of value measures from all four of the studied groups;
- built in the second variant of the division of companies into the training set and the testing set, the discriminant function with the highest predictive efficiency was distinguished by a higher level of efficiency than the function built in the first variant of the division;
- the canonical correlation indicates a strong relationship between the discriminant function and the studied groups (the results are better than in the case of the model in the first variant of the division).
Based on the values of the discriminant coefficients that are included in Table 4, it should be stated that:
- increases in the values of the P/CE, FCFEPS, RMVA, NOPATPS, P/FCFF, and EY variables (ceteris paribus) raised the probability of classifying a given company to the population of “bankrupts”;
- increases in the value of the other diagnostic variables (P/EBITDA, P/BV-Gr., ROS, EV/FCFF, P/BV, REVA, DY) reduced the bankruptcy risk;
- the higher the value of a company’s depending variable “Z” (ceteris paribus), the greater the risk of bankruptcy for the examined company;
- the greatest influence on the results of the discriminant function is exerted by the P/CE variable (discriminant coefficient = 5.269), and the weakest influence is exerted by DY (discriminant coefficient = −0.286).
The proportion of the division to the teaching and testing community influenced both the general and partial predictive effectiveness of the constructed models as well as the order of the introduction of the variables into the discriminant models. In the first split variant (8:3), the P/E variable was introduced first, and the P/CE variable was introduced first in the second variant (9:2). Referring to the issue of prognostic effectiveness, it should be noted that the model that was built for the second variant of the division was distinguished by a higher level of effectiveness of the first type—i.e., correctly classifying the “bankrupt”. This is particularly important in the context of making effective capital decisions by investors and establishing “safe” business relationships. However, attention should be paid to the relatively small number of companies that were classified as “bankrupt” and assigned to the test group in which the general and partial prognostic effectiveness of the built discriminatory models was examined. This may entail the risk that the obtained result is not statistically significant.
5. Conclusions
The results of the analysis of the usefulness of various groups of value measures for the purposes of predicting the bankruptcy of an enterprise that is presented in this article make it possible to achieve the objectives of the research and, in particular, provide the following answers to the research questions:
- The conducted analysis has proven that shareholder value measures are a useful tool that can be applied for the needs of corporate risk management in the area of assessing a firm’s bankruptcy risk; based on these values, it was possible to build statistically significant linear discriminant functions. Based on the conducted research, it should be stated that, of the four studied groups of diagnostic variables, the market measures were characterised by the highest usefulness level in explaining the bankruptcy risks of the studied companies. These constituted 70% of the diagnostic variables. Those diagnostic variables that belong to the remaining groups of value measures constituted 14.3% of the variables that were used in the most efficient discriminant models. The selection of the most efficient estimators of bankruptcy risk was possible by considering the discriminatory power and information capacity of the individual measures.
- The selection of the most efficient discriminant functions was made by assessing the statistical significance of the discriminatory ability of the whole model. Within the two most efficient functions, 20 different variables in the form of book, cash, market measures, and measures based on the economic profit concept were used. At the same time, the obtained findings tend to claim that the presence of the value measures from all four of the studied groups in the output set of diagnostic variables is necessary for possibly building the most efficient tool for the early warning signs of bankruptcy risk.
- The research has shown that a change in the proportion of the division of objects to the learning and testing community at the stage of building and verifying the predictive effectiveness of the discriminant models affects both the general and partial predictive effectiveness of the constructed models, as well as the degree of usefulness of individual value measures in explaining the risk of bankruptcy.
The main advantage of the conducted research is the construction of tools for assessing the risk of the bankruptcy of an enterprise using the discriminant analysis that has been used for several decades, which in turn translates into their greater understanding by various groups that are interested in information about the financial condition of the enterprise. The relative simplicity of using discriminant models as compared to more modern and more advanced statistical analysis tools is also important. One of the main intentions of the authors was also to select the measures of the effectiveness of value creation, the changes of which being the most consistent with the change in the level of the risk of bankruptcy of an enterprise.
Fulfilling the statistical requirement of the relative homogeneity of a surveyed group of enterprises in order to maintain the greatest consistency of the discriminatory model being built with the economic reality required us to limit the studied population to the construction sector. In many world economies, the construction sector itself is one of the leading service industries; its condition can be equated with the current economic condition of a given country. The need to verify measures that are based on the share market price limits the application possibilities of the discriminatory models to only those companies that are listed.
The more extensive research conducted by the authors with regard to the changes in the financial situation of Polish construction companies during the analysed period proved that the accumulation of those investments that were related to the organization of Euro 2012 became more of a threat than an opportunity for the development and increased efficiency of these enterprises. Among the exogenous causes of the bankruptcies of Polish building firms whose source was the macroeconomic environment, we should indicate the general recession of the world economic system, which evoked a negative climate among potential investors and real estate buyers, thus weakening the condition of the housing segment of the construction sector. The aforementioned accumulation of the investment ventures that were connected with Euro 2012 also showed other threats from the central authority whose ineffective activities with regard to the process of settling public investments, among others, directly contributed to the rapid collapse of the Polish construction sector (Jaki 2018; Jaki and Ćwięk 2020).
The conducted empirical studies also proved the need to conduct further multidirectional research on the usefulness of value measures in explaining the risk of enterprise bankruptcy. In this context, an interesting research problem may turn out to be the use of different methods of estimating the cost of equity, which, in relation to the research problem presented in the article, implies a different discriminatory power of measures that are based on the concept of economic profit and, thus, their effectiveness in forecasting the bankruptcy of an enterprise. Another issue may be the use of value measures for the purposes of assessing the risk of the bankruptcy of an enterprise using logistic regression models, which shines a light on another direction for future research in this area.
Author Contributions
The contribution share of the authors is equal, amounting to 50% each. All authors have read and agreed to the published version of the manuscript.
Funding
This research was funded with a subsidy for research granted to Cracow University of Economics: 77/ZZE/2020/POT.
Institutional Review Board Statement
Not applicable.
Informed Consent Statement
Not applicable.
Data Availability Statement
Publicly available datasets were analyzed in this study. This data can be found here: https://www.emis.com/pl.
Conflicts of Interest
The authors declare no conflict of interest. The funders had no role in the design of the study; in the collection, analysis, or interpretation of the data; in the writing of the manuscript; or in the decision to publish the results.
References
- Altman, Edward I. 1968. Financial Ratios, Discriminant Analysis and the Prediction of Corporate Bankruptcy. The Journal of Finance 4: 589–609. [Google Scholar] [CrossRef]
- Altman, Edward I., Haldeman Robert, and Paul Narayanan. 1977. Zeta Analysis: A New Model to Identify Bankruptcy Risk of Corporations. Journal of Banking & Finance 1: 29–51. [Google Scholar]
- Ashraf, Sumair, Elisabete G. S. Félix, and Zélia Serrasqueiro. 2019. Do Traditional Financial Distress Prediction Models Predict the Early Warning Signs of Financial Distress? Journal of Risk and Financial Management 9: 55. [Google Scholar] [CrossRef] [Green Version]
- Bărbuţă-Mişu, Nicoleta, and Mara Madaleno. 2020. Assessment of Bankruptcy Risk of Large Companies: European Countries Evolution Analysis. Journal of Risk and Financial Management 13: 58. [Google Scholar] [CrossRef]
- Bellovary, Jodi L., Giacomino Don E., and Akers Michael D. 2007. A Review of Bankruptcy Prediction Studies: 1930 to Present. Journal of Financial Education 33: 6. [Google Scholar]
- Ehrbar, Al. 1998. EVA—The Real Key to Creating Wealth. New York: John Wiley and Sons Inc. [Google Scholar]
- EMIS. 2020. EMIS Intelligence Database. Available online: https://www.emis.com/pl (accessed on 15 January 2020).
- Fernandez, Pablo. 2019. Three Residual Income Valuation Methods and Discounted Cash Flow Valuation. Available online: http://dx.doi.org/10.2139/ssrn.296945 (accessed on 28 May 2019).
- Fisher, Ronald A. 1936. The Use of Multiple Measurements in Taxonomic Problems. Annals of Eugenics 7. [Google Scholar] [CrossRef]
- Gavurova, Beata, Miroslava Packova, Maria Misankova, and Lubos Smrcka. 2017. Predictive Potential and Risk of Selected Bankruptcy Prediction Models in the Slovak Business Environment. Journal of Business Economics and Management 18: 1156–73. [Google Scholar] [CrossRef] [Green Version]
- Gupta, Vandana. 2017. A Survival Approach to Prediction of Default Drivers for Indian Listed Companies. Theoretical Economics Letters 7: 116–38. [Google Scholar] [CrossRef] [Green Version]
- Horváthová, Jarmila, and Martina Morikrišová. 2018. Risk of Bankruptcy, Its Determinants and Models. Risks 6: 117. [Google Scholar] [CrossRef] [Green Version]
- Jaki, Andrzej. 2012. Value Focused Restructuring—A New Approach Facing the Global Economic Crisis. The Business and Management Review 2: 78–86. [Google Scholar]
- Jaki, Andrzej. 2018. Business Continuity Risk of Polish Construction Enterprises in 2010–2011. World of Real Estate Journal—Świat Nieruchomości 106: 21–26. [Google Scholar]
- Jaki, Andrzej, and Wojciech Ćwięk. 2020. Value Creation Efficiency of Polish Construction Companies Listed on Warsaw Stock Exchange during 2010–2012. International Journal of Business Performance Management 21: 214–29. [Google Scholar] [CrossRef]
- Korol, Tomasz. 2019. Dynamic Bankruptcy Prediction Models for European Enterprises. Journal of Risk and Financial Management 12: 185. [Google Scholar] [CrossRef] [Green Version]
- Kristóf, Tamás, and Miklós Virág. 2020. A Comprehensive Review of Corporate Bankruptcy Prediction in Hungary. Journal of Risk and Financial Management 13: 35. [Google Scholar] [CrossRef] [Green Version]
- Mancini, Daniela, and Giuseppina Piscitelli. 2018. Performance measurement systems in business networks: A literature review. International Journal of Business Performance Management 19: 87–104. [Google Scholar] [CrossRef]
- Pawełek, Barbara, Mateusz Baryła, and Józef Pociecha. 2020. Study of the Classification Accuracy Measures for Predicting Corporate Bankruptcy Taking into Account Changes in the Economic Environment. Argumenta Oeconomica 1: 5–17. [Google Scholar] [CrossRef]
- Prusak, Błażej. 2018. Review of Research into Enterprise Bankruptcy Prediction in Selected Central and Eastern European Countries. International Journal of Financial Studies 6: 60. [Google Scholar] [CrossRef] [Green Version]
- Rahimipoor, Akbar. 2018. A comparative study of bankruptcy prediction models of Fulmer and Toffler in firms accepted in Tehran Stock Exchange. Journal of Novel Applied Sciences 2: 522–27. [Google Scholar]
- Ramachandran, Kandethody M., and Chris P. Tsokos. 2009. Mathematical Statistics with Applications. London: Academic Press. [Google Scholar]
- Schierenbeck, Henner, and Michael Lister. 2002. Value Controlling. Grundlagen Wertorientierter Unternehmensführung. München-Wien: R. Oldenbourg Verlag. [Google Scholar]
- Shiker, Mushtak A. K. 2012. Multivariate Statistical Analysis. British Journal of Science 6: 55–66. [Google Scholar]
- Škare, Marinko, and Tea Hasić. 2016. Corporate Governance, Firm Performance, and Economic Growth—Theoretical Analysis. Journal of Business Economics and Management 17: 35–51. [Google Scholar] [CrossRef] [Green Version]
- Takahashi, Kichinosuke, Yukiharu Kurokawa, and Kazunori Watase. 1984. Corporate bankruptcy prediction in Japan. Journal of Banking & Finance 8: 229–47. [Google Scholar] [CrossRef]
- Talebnia, Ghodratollah, Fatemeh Karmozi, and Samira Rahimi. 2016. Evaluating and comparing the ability to predict the bankruptcy prediction models of Zavgren and Springate in companies accepted in Tehran Stock Exchange. Marketing and Branding Research 3: 137–43. [Google Scholar] [CrossRef] [Green Version]
- Wieczorek-Kosmala, Monika, Joanna Błach, and Joanna Trzęsiok. 2018. Analysis of Bankruptcy Threat for Risk Management Purposes: A Model Approach. International Journal of Financial Studies 6: 98. [Google Scholar] [CrossRef] [Green Version]
- Young, David S., and Stephen F. O’Byrne. 2001. EVA and Value-Based Management. A Practical Guide to Implementation. New York: McGraw-Hill. [Google Scholar]
Figure 1.
Number of diagnostic variables in bankruptcy prediction models. Source: own study based on (Bellovary et al. 2007). Designations: MIN—minimal number of diagnostic variables in the model; AVG—average number of diagnostic variables in the model; MAX—maximum number of diagnostic variables in the model.


Table 1.
Sample division into training and testing sets on 8:3 and 9:2 bases. Source: own study.
| Variants | Division Proportions | Division into Groups | ||
|---|---|---|---|---|
| Training Set | Testing Set | Total | ||
| 1. | 8:3 (72.737%) | 104 companies, incl.:
| 39 companies, incl.:
| 143 companies, incl.:
|
| 2. | 9:2 (81.818%) | 117 companies, incl.:
| 26 companies, incl.:
| |
Table 2.
Value measures used as diagnostic variables in most effective discriminant models—Variants 1 and 2. Source: own study based on Ehrbar 1998 and Young and O’Byrne 2001.
Table 2.
Value measures used as diagnostic variables in most effective discriminant models—Variants 1 and 2. Source: own study based on Ehrbar 1998 and Young and O’Byrne 2001.
| Measures | Calculation Formulas | Designations |
|---|---|---|
| book Measures | ||
| NOPATPS | NOPATPS—net operating profit after taxes per share. —net operating profit after taxes in period t. —number of shares at end of period t. —earnings before interests and taxes in period t. T—income tax ratio. | |
| ROS | ROS—return on sales. —net profit in period t. St—net sales in period t. | |
| Cash measures | ||
| FCFEPS | FCFEPS—free cash flow to equity per share. —free cash flow to equity in period t. DEP—accumulated value of depreciations. Inv—investments. ΔWC—changes in net working capital. CL—taken credits and loans. RCL—repaid credits and loans. other designations—as previously. | |
| CFROS | CFROS—cash flow return on sale. CFOt—operating cash flow in period t. Other designations—as previously. | |
| Measures based on economic profit concept | ||
| REVA | REVA—relative market value added. —market value of invested capital at end of period t. WACCt—weighted average cost of capital in period t. | |
| CEC | CEC—cost efficiency of invested capital. EVA—economic value added. IC—invested capital. Other designations—as previously. | |
| Market measures | ||
| P/BV | P/BV—price to book value. PS,t—market price of share at end of period t. BVt—book value of equity at end of period t. other designations—as previously. | |
| P/BV—Gr. | P/BV—Gr.—price to book value by B. Graham. CAt—current assets at end of period t. Lt—liabilities at end of period t. Other designations—as previously. | |
| P/E | P/E—price to earnings. Other designations—as previously. | |
| P/EBIT | P/EBIT—price to earnings before interest and taxes. Other designations—as previously. | |
| P/EBITDA | P/EBITDA—price to earnings before interests, taxes, depreciation, and amortization. —earnings before interests, taxes, depreciation, and amortization in period t. Other designations—as previously. | |
| P/CE | P/CE—price to cash earnings. Other designations—as previously. | |
| P/FCFF | P/FCFF—price to free cash flow to firm. —free cash flow to firm in period t. Other designations—as previously. | |
| EV/S | EV/S—enterprise value to sale. EVt—enterprise value at end of period t. Other designations—as previously. | |
| EV/CFO | EV/CFO—enterprise value to cash flows from operating activities. Other designations—as previously. | |
| EV/FCFF | EV/FCFF—enterprise value to free cash flow to firm. Other designations—as previously. | |
| EY | EY—earnings yield. EPSt—earnings per share in period t. Other designations—as previously. | |
| DY | DY—dividend yield. —dividend per share in period t. Other designations—as previously. | |
| DPR | DPR—dividend payout ratio. Other designations—as previously. | |
| RMVA | RMVA—relative MVA, MVA index. —market value added at end of period t. Other designations—as previously. | |
Table 3.
Selected statistics of diagnostic variables for the analysed companies. Source: own calculations based on data provided by the EMIS Intelligence database (EMIS 2020).
Table 3.
Selected statistics of diagnostic variables for the analysed companies. Source: own calculations based on data provided by the EMIS Intelligence database (EMIS 2020).
| Measures—Diagnostic Variables | “Bankrupts” | “Non-Bankrupts” | All Companies | ||||||
|---|---|---|---|---|---|---|---|---|---|
| Min | Me | Max | Min | Me | Max | Min | Me | Max | |
| NOPATPS | −1.564 | 0.064 | 4.866 | −5.619 | 0.096 | 5.702 | −5.619 | 0.096 | 5.702 |
| ROS | −0.711 | 0.012 | 0.134 | −0.218 | 0.031 | 0.289 | −0.711 | 0.030 | 0.289 |
| FCFEPS | −41.064 | 0.291 | 51.366 | −8.204 | 0.168 | 8.877 | −41.064 | 0.168 | 51.366 |
| CFROS | −0.087 | −0.016 | 0.152 | −0.472 | 0.052 | 0.547 | −0.472 | 0.049 | 0.547 |
| CEC | −3.665 | −0.849 | −0.251 | −6.011 | −0.880 | 1.102 | −6.011 | −0.880 | 1.102 |
| REVA | −0.542 | −0.144 | 0.298 | −0.569 | −0.079 | 0.046 | −0.569 | −0.084 | 0.298 |
| RMVA | −1.842 | 0.353 | 8.988 | −0.778 | −0.102 | 4.359 | −1.842 | −0.102 | 8.988 |
| P/BV | 0.162 | 1.010 | 13.082 | 0.283 | 0.889 | 5.070 | 0.162 | 0.889 | 13.082 |
| P/BV-Gr. | −9.889 | −0.153 | 121.803 | −33.101 | 1.930 | 37.123 | −33.101 | 1.930 | 121.803 |
| P/E | −8.286 | 23.248 | 508.620 | −51.384 | 10.515 | 74.720 | −51.384 | 10.515 | 508.620 |
| P/EBIT | −43.262 | 6.002 | 78.995 | −33.523 | 7.643 | 50.573 | −43.262 | 7.643 | 78.995 |
| P/EBITDA | −58.570 | 4.672 | 79.349 | −19.485 | 5.572 | 30.672 | −58.570 | 5.499 | 79.349 |
| P/CE | −11.687 | 8.607 | 482.909 | −24.217 | 7.094 | 38.242 | −24.217 | 7.094 | 482.909 |
| P/FCFF | −855.401 | 0.334 | 665.674 | −121.864 | −2.301 | 123.833 | −855.401 | −2.301 | 665.674 |
| EY | −0.241 | 0.012 | 0.161 | −0.383 | 0.065 | 0.182 | −0.383 | 0.063 | 0.182 |
| DY | 0.000 | 0.000 | 0.000 | 0.000 | 0.000 | 0.187 | 0.000 | 0.000 | 0.187 |
| DPR | 0.000 | 0.000 | 0.000 | −2.359 | 0.000 | 2.831 | −2.359 | 0.000 | 2.831 |
| EV/S | 0.320 | 0.991 | 9.870 | −0.019 | 0.651 | 3.949 | −0.019 | 0.651 | 9.870 |
| EV/CFO | −63.911 | −2.226 | 214.365 | −64.101 | 8.137 | 83.642 | −64.101 | 8.137 | 214.365 |
| EV/FCFF | −860.017 | 2.975 | 1032.467 | −154.770 | −2.991 | 158.711 | −860.017 | −2.955 | 1032.467 |
Designations: Min—minimum value; Me—median; Max—maximum value.
Table 4.
Discriminant power of diagnostic variables for analysed companies. Source: own calculations based on data provided by the EMIS Intelligence database (EMIS 2020).
Table 4.
Discriminant power of diagnostic variables for analysed companies. Source: own calculations based on data provided by the EMIS Intelligence database (EMIS 2020).
| Measures—Diagnostic Variables | Coefficient of Variation (in %) |
|---|---|
| NOPATPS | 10,512.3 |
| ROS | 553.6 |
| FCFEPS | 761.0 |
| CFROS | 207.6 |
| CEC | 111.3 |
| REVA | 122.3 |
| RMVA | 444.9 |
| P/BV | 125.0 |
| P/BV-Gr. | 575.6 |
| P/E | 325.2 |
| P/EBIT | 187.1 |
| P/EBITDA | 223.9 |
| P/CE | 422.6 |
| P/FCFF | 2570.8 |
| EY | 382.8 |
| DY | 160.7 |
| DPR | 210.4 |
| EV/S | 131.0 |
| EV/CFO | 242.9 |
| EV/FCFF | 3294.2 |
Table 5.
Examination of the normality of empirical distributions of diagnostic variables for the analysed companies. Source: own calculations based on data provided by the EMIS Intelligence database (EMIS 2020).
Table 5.
Examination of the normality of empirical distributions of diagnostic variables for the analysed companies. Source: own calculations based on data provided by the EMIS Intelligence database (EMIS 2020).
| Measures—Diagnostic Variables | “Bankrupts” | “Non-Bankrupts” | All Companies | |||
|---|---|---|---|---|---|---|
| K-S Statistics Value | p Value | K-S Statistics Value | p Value | K-S Statistics Value | p Value | |
| NOPATPS | 0.35781 | <0.10 | 0.19965 | <0.01 | 0.19242 | <0.01 |
| ROS | 0.32387 | <0.20 | 0.20343 | <0.01 | 0.23437 | <0.01 |
| FCFEPS | 0.33262 | <0.15 | 0.20358 | <0.01 | 0.26674 | <0.01 |
| CFROS | 0.17900 | >0.20 | 0.14068 | <0.05 | 0.12845 | <0.05 |
| CEC | 0.23331 | >0.20 | 0.16344 | <0.01 | 0.16772 | <0.01 |
| REVA | 0.27069 | >0.20 | 0.23605 | <0.01 | 0.22309 | <0.01 |
| RMVA | 0.37894 | <0.10 | 0.18588 | <0.01 | 0.22479 | <0.01 |
| P/BV | 0.37226 | <0.10 | 0.17600 | <0.01 | 0.25141 | <0.01 |
| P/BV-Gr. | 0.35603 | <0.10 | 0.18091 | <0.01 | 0.26300 | <0.01 |
| P/E | 0.36769 | <0.10 | 0.20231 | <0.01 | 0.32243 | <0.01 |
| P/EBIT | 0.30432 | >0.20 | 0.19916 | <0.01 | 0.19368 | <0.01 |
| P/EBITDA | 0.28974 | >0.20 | 0.21415 | <0.01 | 0.24075 | <0.01 |
| P/CE | 0.40014 | <0.05 | 0.21655 | <0.01 | 0.40154 | <0.01 |
| P/FCFF | 0.29969 | >0.20 | 0.19152 | <0.01 | 0.30086 | <0.01 |
| EY | 0.30131 | >0.20 | 0.22113 | <0.01 | 0.21736 | <0.01 |
| DY | - | - | 0.26583 | <0.01 | 0.29075 | <0.01 |
| DPR | - | - | 0.29365 | <0.01 | 0.30333 | <0.01 |
| EV/S | 0.37114 | <0.10 | 0.23871 | <0.01 | 0.28445 | <0.01 |
| EV/CFO | 0.34917 | <0.15 | 0.23092 | <0.01 | 0.25595 | <0.01 |
| EV/FCFF | 0.22869 | >0.20 | 0.18614 | <0.01 | 0.31088 | <0.01 |
Table 6.
Most effective discriminant models—Variants 1 and 2. Source: own calculations based on data provided by the EMIS Intelligence database (EMIS 2020).
Table 6.
Most effective discriminant models—Variants 1 and 2. Source: own calculations based on data provided by the EMIS Intelligence database (EMIS 2020).
| Discriminant function—Variant 1 | |||||||||
| where: | |||||||||
| x1—P/E; x2—P/EBIT; x3—EV/CFO; x4—DPR; x5—NOPATPS; x6—CEC; x7—EV/S; x8—CFROS | |||||||||
| Predictive Efficiency | Eigenvalue | Canonical R | Wilks’ lambda | χ2 | p | Means of Canonical Variables | |||
| First Type (%) | Second Type (w%) | Overall (%) | Bankrupts | Non-bankrupts | |||||
| 75 | 100 | 98.0769 | 1.050 | 0.716 | 0.488 | 70.350 | 0.0000 | 3.515 | -0.293 |
| Discriminant function—Variant 2 | |||||||||
| where: | |||||||||
| x1—P/CE; x2—P/EBITDA; x3—FCFEPS; x4—P/BV-Gr.; x5—RMVA; x6—NOPATPS; x7—ROS; x8—P/FCFF; | |||||||||
| x9—EY; x10—EV/FCFF; x11—P/BV; x12—REVA; x13—DY | |||||||||
| Predictive Efficiency | Eigenvalue | Canonical R | Wilks’ lambda | χ2 | p | Means of Canonical Variables | |||
| First Type (%) | Second Type (w%) | Overall (%) | Bankrupts | Non-bankrupts | |||||
| 88.8889 | 100 | 99.1453 | 2.586 | 0.849 | 0.279 | 138.552 | 0.0000 | 5.523 | −0.460 |
Publisher’s Note: MDPI stays neutral with regard to jurisdictional claims in published maps and institutional affiliations. |
© 2020 by the authors. Licensee MDPI, Basel, Switzerland. This article is an open access article distributed under the terms and conditions of the Creative Commons Attribution (CC BY) license (http://creativecommons.org/licenses/by/4.0/).
Share and Cite
MDPI and ACS Style
Jaki, A.; Ćwięk, W. Bankruptcy Prediction Models Based on Value Measures. J. Risk Financial Manag. 2021, 14, 6. https://doi.org/10.3390/jrfm14010006
AMA Style
Jaki A, Ćwięk W. Bankruptcy Prediction Models Based on Value Measures. Journal of Risk and Financial Management. 2021; 14(1):6. https://doi.org/10.3390/jrfm14010006
Chicago/Turabian StyleJaki, Andrzej, and Wojciech Ćwięk. 2021. "Bankruptcy Prediction Models Based on Value Measures" Journal of Risk and Financial Management 14, no. 1: 6. https://doi.org/10.3390/jrfm14010006