
Molecular Determination of mirRNA-126 rs4636297, Phosphoinositide-3-Kinase Regulatory Subunit 1-Gene Variability rs7713645, rs706713 (Tyr73Tyr), rs3730089 (Met326Ile) and Their Association with Susceptibility to T2D

 , ,
, , 
 ,
,
Abstract
:1. Introduction
2. Materials and Methods
2.1. Data Collection
2.2. Sample Collection and DNA Extraction
2.3. Genotyping of SNPs by Amplification-Refractory Mutation System PCR
3. Statistical Analysis
4. Results
5. Discussion
Author Contributions
Funding
Institutional Review Board Statement
Informed Consent Statement
Data Availability Statement
Acknowledgments
Conflicts of Interest
References
- American Diabetes Association. Diagnosis and classification of diabetes mellitus. Diabetes Care 2013, 36, S67–S74. [Google Scholar] [CrossRef] [PubMed] [Green Version]
- Lin, X.; Xu, Y.; Pan, X.; Xu, J.; Ding, Y.; Sun, X.; Song, X.; Ren, Y.; Shan, P.-F. Global, regional, and national burden and trend of diabetes in 195 countries and territories: An analysis from 1990 to 2025. Sci. Rep. 2020, 10, 14790. [Google Scholar] [CrossRef] [PubMed]
- Al Dawish, M.A.; Robert, A.A.; Braham, R.; Al Hayek, A.A.; Al Saeed, A.; Ahmed, R.A.; Al Sabaan, F.S. Diabetes Mellitus in Saudi Arabia: A Review of the Recent Literature. Curr. Diabetes Rev. 2016, 12, 359–368. [Google Scholar] [CrossRef] [PubMed]
- Beckman, J.A.; Creager, M.A. Vascular Complications of Diabetes. Circ. Res. 2016, 118, 1771–1785. [Google Scholar] [CrossRef] [Green Version]
- Burrack, A.L.; Martinov, T.; Fife, B.T. T Cell-Mediated Beta Cell Destruction: Autoimmunity and Alloimmunity in the Context of Type 1 Diabetes. Front. Endocrinol. 2017, 8, 343. [Google Scholar] [CrossRef]
- Czech, M.P. Insulin action and resistance in obesity and type 2 diabetes. Nat. Med. 2017, 23, 804–814. [Google Scholar] [CrossRef]
- Dendup, T.; Feng, X.; Clingan, S.; Astell-Burt, T. Environmental Risk Factors for Developing Type 2 Diabetes Mellitus: A Systematic Review. Int. J. Environ. Res. Public Health 2018, 15, 78. [Google Scholar] [CrossRef] [Green Version]
- Elfaki, I.; Mir, R.; Abu-Duhier, F.M.; Jha, C.K.; Ahmad Al-Alawy, A.I.; Babakr, A.T.; Habib, S.A.E.H. Analysis of the Potential Association of Drug-Metabolizing Enzymes CYP2C9*3 and CYP2C19*3 Gene Varia-tions With Type 2 Diabetes: A Case-Control Study. Curr. Drug Metab. 2020, 21, 1152–1160. [Google Scholar] [CrossRef]
- Elfaki, I.; Almutairi, F.M.; Mir, R.; Khan, R.; Abu-duhier, F. Cytochrome P450 CYP1B1*2 gene and its association with T2D in Tabuk population, Northwestern region of Saudi Arabia. Asian J. Pharm. Clin. Res. 2018, 11, 55–59. [Google Scholar] [CrossRef] [Green Version]
- Xue, A.; Wu, Y.; Zhu, Z.; Zhang, F.; Kemper, K.E.; Zheng, Z.; Yengo, L.; Lloyd-Jones, L.R.; Sidorenko, J.; Wu, Y.; et al. Genome-wide association analyses identify 143 risk variants and putative regulatory mechanisms for type 2 diabetes. Nat. Commun. 2018, 9, 2941. [Google Scholar] [CrossRef] [Green Version]
- Elfaki, I.; Mir, R.; Mir, M.M.; AbuDuhier, F.M.; Babakr, A.T.; Barnawi, J. Potential Impact of MicroRNA Gene Polymorphisms in the Pathogenesis of Diabetes and Atherosclerotic Cardiovascular Disease. J. Pers. Med. 2019, 9, 51. [Google Scholar] [CrossRef] [Green Version]
- Jha, C.K.; Mir, R.; Elfaki, I.; Javid, J.; Babakr, A.; Banu, S.; Chahal, S.M.S. Evaluation of the Association of Omentin 1 rs2274907 A>T and rs2274908 G>A Gene Polymorphisms with Coronary Artery Disease in Indian Population: A Case Control Study. J. Pers. Med. 2019, 9, 30. [Google Scholar] [CrossRef] [Green Version]
- Elfaki, I.; Mir, R.; Almutairi, F.M.; Abu Duhier, F.M. Cytochrome P450: Polymorphisms and Roles in Cancer, Diabetes and Atherosclerosis. Asian Pac. J. Cancer Prev. 2018, 19, 2057–2070. [Google Scholar] [CrossRef]
- Jha, C.K.; Mir, R.; Elfaki, I.; Banu, S.; Chahal, S.M.S. LDLR Gene Polymorphisms (rs5925 and rs1529729) Are Associated with Susceptibility to Coronary Artery Disease in a South Indian Population. Med. Sci. 2019, 7, 80. [Google Scholar]
- Pordzik, J.; Jakubik, D.; Jarosz-Popek, J.; Wicik, Z.; Eyileten, C.; De Rosa, S.; Indolfi, C.; Siller-Matula, J.M.; Czajka, P.; Postula, M. Significance of circulating microRNAs in diabetes mellitus type 2 and platelet reactivity: Bioinformatic analysis and review. Cardiovasc. Diabetol. 2019, 18, 113. [Google Scholar] [CrossRef] [Green Version]
- Zampetaki, A.; Kiechl, S.; Drozdov, I.; Willeit, P.; Mayr, U.; Prokopi, M.; Mayr, A.; Weger, S.; Oberhollenzer, F.; Bonora, E.; et al. Plasma MicroRNA Profiling Reveals Loss of Endothelial MiR-126 and Other MicroRNAs in Type 2 Diabetes. Circ. Res. 2010, 107, 810–817. [Google Scholar] [CrossRef]
- Liu, Y.; Gao, G.; Yang, C.; Zhou, K.; Shen, B.; Liang, H.; Jiang, X. The Role of Circulating MicroRNA-126 (miR-126): A Novel Biomarker for Screening Prediabetes and Newly Diagnosed Type 2 Diabetes Mellitus. Int. J. Mol. Sci. 2014, 15, 10567–10577. [Google Scholar] [CrossRef] [Green Version]
- Massignam, E.T.; Dieter, C.; Pellenz, F.M.; Assmann, T.S.; Crispim, D. Involvement of miR-126 rs4636297 and miR-146a rs2910164 polymorphisms in the susceptibility for diabetic retinopathy: A case–control study in a type 1 diabetes population. Acta Ophthalmol. 2021, 99, 461. [Google Scholar] [CrossRef]
- Di Zazzo, E.; Feola, A.; Zuchegna, C.; Romano, A.; Donini, C.F.; Bartollino, S.; Frunzio, R.; Laccetti, P.; Di Domenico, M.; Porcellini, A. The p85 regulatory subunit of PI3K mediates cAMP-PKA and insulin biological effects on MCF-7 cell growth and motility. Sci. World J. 2014, 2014, 565839. [Google Scholar] [CrossRef] [Green Version]
- Burke, J.E.; Vadas, O.; Berndt, A.; Finegan, T.; Perisic, O.; Williams, R.L. Dynamics of the phosphoinositide 3-kinase p110delta interaction with p85alpha and membranes reveals aspects of regulation distinct from p110alpha. Structure 2011, 19, 1127–1137. [Google Scholar] [CrossRef] [Green Version]
- Hopkins, B.D.; Goncalves, M.D.; Cantley, L.C. Insulin–PI3K signalling: An evolutionarily insulated metabolic driver of cancer. Nat. Rev. Endocrinol. 2020, 16, 276–283. [Google Scholar] [CrossRef]
- Huang, X.; Liu, G.; Guo, J.; Su, Z. The PI3K/AKT pathway in obesity and type 2 diabetes. Int. J. Biol. Sci. 2018, 14, 1483–1496. [Google Scholar] [CrossRef] [Green Version]
- Alotaibi, A.; Perry, L.; Gholizadeh, L.; Al-Ganmi, A. Incidence and prevalence rates of diabetes mellitus in Saudi Arabia: An overview. J. Epidemiol. Glob. Health 2017, 7, 211–218. [Google Scholar] [CrossRef]
- Ding, H.-X.; Lv, Z.; Yuan, Y.; Xu, Q. MiRNA Polymorphisms and Cancer Prognosis: A Systematic Review and Meta-Analysis. Front. Oncol. 2018, 8, 596. [Google Scholar] [CrossRef]
- Xiang, Y.; Guo, J.; Peng, Y.-F.; Tan, T.; Huang, H.-T.; Luo, H.-C.; Wei, Y.-S. Association of miR-21, miR-126 and miR-605 gene polymorphisms with ischemic stroke risk. Oncotarget 2017, 8, 95755–95763. [Google Scholar] [CrossRef] [Green Version]
- Zhang, T.; Lv, C.; Li, L.; Chen, S.; Liu, S.; Wang, C.; Su, B. Plasma miR-126 is a potential biomarker for early prediction of type 2 diabetes mellitus in susceptible individuals. Biomed. Res. Int. 2013, 2013, 761617. [Google Scholar] [CrossRef]
- McAuley, A.K.; Dirani, M.; Connell, P.P.; Lamoureux, E.L.; Wang, J.J.; Hewitt, A.W. A genetic variant regulating miR-126 is associated with sight threatening diabetic retinopathy. Diabetes Vasc. Dis. Res. 2015, 12, 133–138. [Google Scholar] [CrossRef] [Green Version]
- Rezai, M.; Shahbazi, S.; Mansournia, N. Plasma miR-126 levels and its genomic polymorphism SNP rs4636297 in Type 2 dia-betes. Asia Pac. J. Mol. Biol. Biotechnol. 2020, 28, 27–33. [Google Scholar] [CrossRef]
- Chu, M.; Zhao, Y.; Feng, Y.; Zhang, H.; Liu, J.; Cheng, M.; Li, L.; Shen, W.; Cao, H.; Li, Q.; et al. MicroRNA-126 participates in lipid metabolism in mammary epithelial cells. Mol. Cell. Endocrinol. 2017, 454, 77–86. [Google Scholar] [CrossRef]
- Sun, X.; Zhang, M.; Sanagawa, A.; Mori, C.; Ito, S.; Iwaki, S.; Satoh, H.; Fujii, S. Circulating microRNA-126 in patients with coronary artery disease: Correlation with LDL cholesterol. Thromb. J. 2012, 10, 16. [Google Scholar] [CrossRef] [Green Version]
- Winnay, J.N.; Boucher, J.; Mori, M.; Ueki, K.; Kahn, C.R. A regulatory subunit of phosphoinositide 3-kinase increases the nuclear accumulation of X-box–binding protein-1 to modulate the unfolded protein response. Nat. Med. 2010, 16, 438–445. [Google Scholar] [CrossRef] [PubMed] [Green Version]
- Akinleye, A.; Avvaru, P.; Furqan, M.; Song, Y.; Liu, D. Phosphatidylinositol 3-kinase (PI3K) inhibitors as cancer therapeutics. J. Hematol. Oncol. 2013, 6, 88. [Google Scholar] [CrossRef] [PubMed] [Green Version]
- Backer, J.M. The Regulation of Class IA PI 3-Kinases by Inter-Subunit Interactions. Curr. Top. Microbiol. Immunol. 2010, 346, 87–114. [Google Scholar] [CrossRef] [PubMed] [Green Version]
- Maffei, A.; Lembo, G.; Carnevale, D. PI3Kinases in Diabetes Mellitus and Its Related Complications. Int. J. Mol. Sci. 2018, 19, 4098. [Google Scholar] [CrossRef] [Green Version]
- Jamshidi, Y.; Snieder, H.; Wang, X.; Pavitt, M.J.; Spector, T.D.; Carter, N.D.; O’Dell, S.D. Phosphatidylinositol 3-kinase p85α regulatory subunit gene PIK3R1 haplotype is associated with body fat and serum leptin in a female twin population. Diabetologia 2006, 49, 2659–2667. [Google Scholar] [CrossRef] [Green Version]
- Karadoğan, A.H.; Arikoglu, H.; Gokturk, F.; Iscioglu, F.; Ipekçi, S.H. PIK3R1 gene polymorphisms are associated with type 2 diabetes and related features in the Turkish population. Adv. Clin. Exp. Med. 2018, 27, 921–927. [Google Scholar] [CrossRef]
- Almind, K.; Delahaye, L.; Hansen, T.; Van Obberghen, E.; Pedersen, O.; Kahn, C.R. Characterization of the Met326Ile variant of phosphatidylinositol 3-kinase p85. Proc. Natl. Acad. Sci. USA 2002, 99, 2124–2128. [Google Scholar] [CrossRef] [Green Version]
- Elfaki, I.; Bayer, P.; Mueller, J.W. A potential transcriptional regulator is out-of-frame translated from the metallothionein 2A messenger RNA. Anal. Biochem. 2011, 409, 159–161. [Google Scholar] [CrossRef]
- Rai, E.; Sharma, S.; Kaul, S.; Jain, K.; Matharoo, K.; Bhanwer, A.S.; Bamezai, R.N.K. The Interactive Effect of SIRT1 Promoter Region Polymorphism on Type 2 Diabetes Susceptibility in the North Indian Population. PLoS ONE 2012, 7, e48621. [Google Scholar] [CrossRef]
- Elfaki, I.; Knitsch, A.; Matena, A.; Bayer, P. Identification and characterization of peptides that bind the PPIase domain of Parvulin17. J. Pept. Sci. 2013, 19, 362–369. [Google Scholar] [CrossRef]
- Mompeán, M.; Romano, V.; Pantoja-Uceda, D.; Stuani, C.; Baralle, F.E.; Buratti, E.; Laurents, D.V. Point mutations in the N-terminal domain of transactive response DNA-binding protein 43 kDa (TDP-43) compromise its stability, dimerization, and functions. J. Biol. Chem. 2017, 292, 11992–12006. [Google Scholar] [CrossRef] [Green Version]
- Jaremko, L.; Jaremko, M.; Elfaki, I.; Mueller, J.W.; Ejchart, A.; Bayer, P.; Zhukov, I. Structure and dynamics of the first archaeal parvulin reveal a new functionally important loop in par-vulin-type prolyl isomerases. J. Biol. Chem. 2011, 286, 6554–6565. [Google Scholar] [CrossRef] [Green Version]
- Kumar, R.; Moche, M.; Winblad, B.; Pavlov, P.F. Combined X-ray crystallography and computational modeling approach to investigate the Hsp90 C-terminal peptide binding to FKBP51. Sci. Rep. 2017, 7, 14288. [Google Scholar] [CrossRef] [Green Version]


| HBA1c % | TG mg/dL | Choles. mg/dL | LDL-C mg/dL | HDL-C mg/dL | FBS mg/dL | ||
| Controls | 5 | 135 | 153 | 74 | 57.0 | 89 | |
| HBA1c % | TG mg/dL | Choles mg/dL | LDL-C mg/dL | HDL-C mg/dL | RBS mg/dL | Vit. D ng/mL | |
| Cases | 9 | 178 | 198 | 130 | 44 | 224 | 28 |
| Primer Sequence of microR-126 rs4636297 A > G SNP | |||
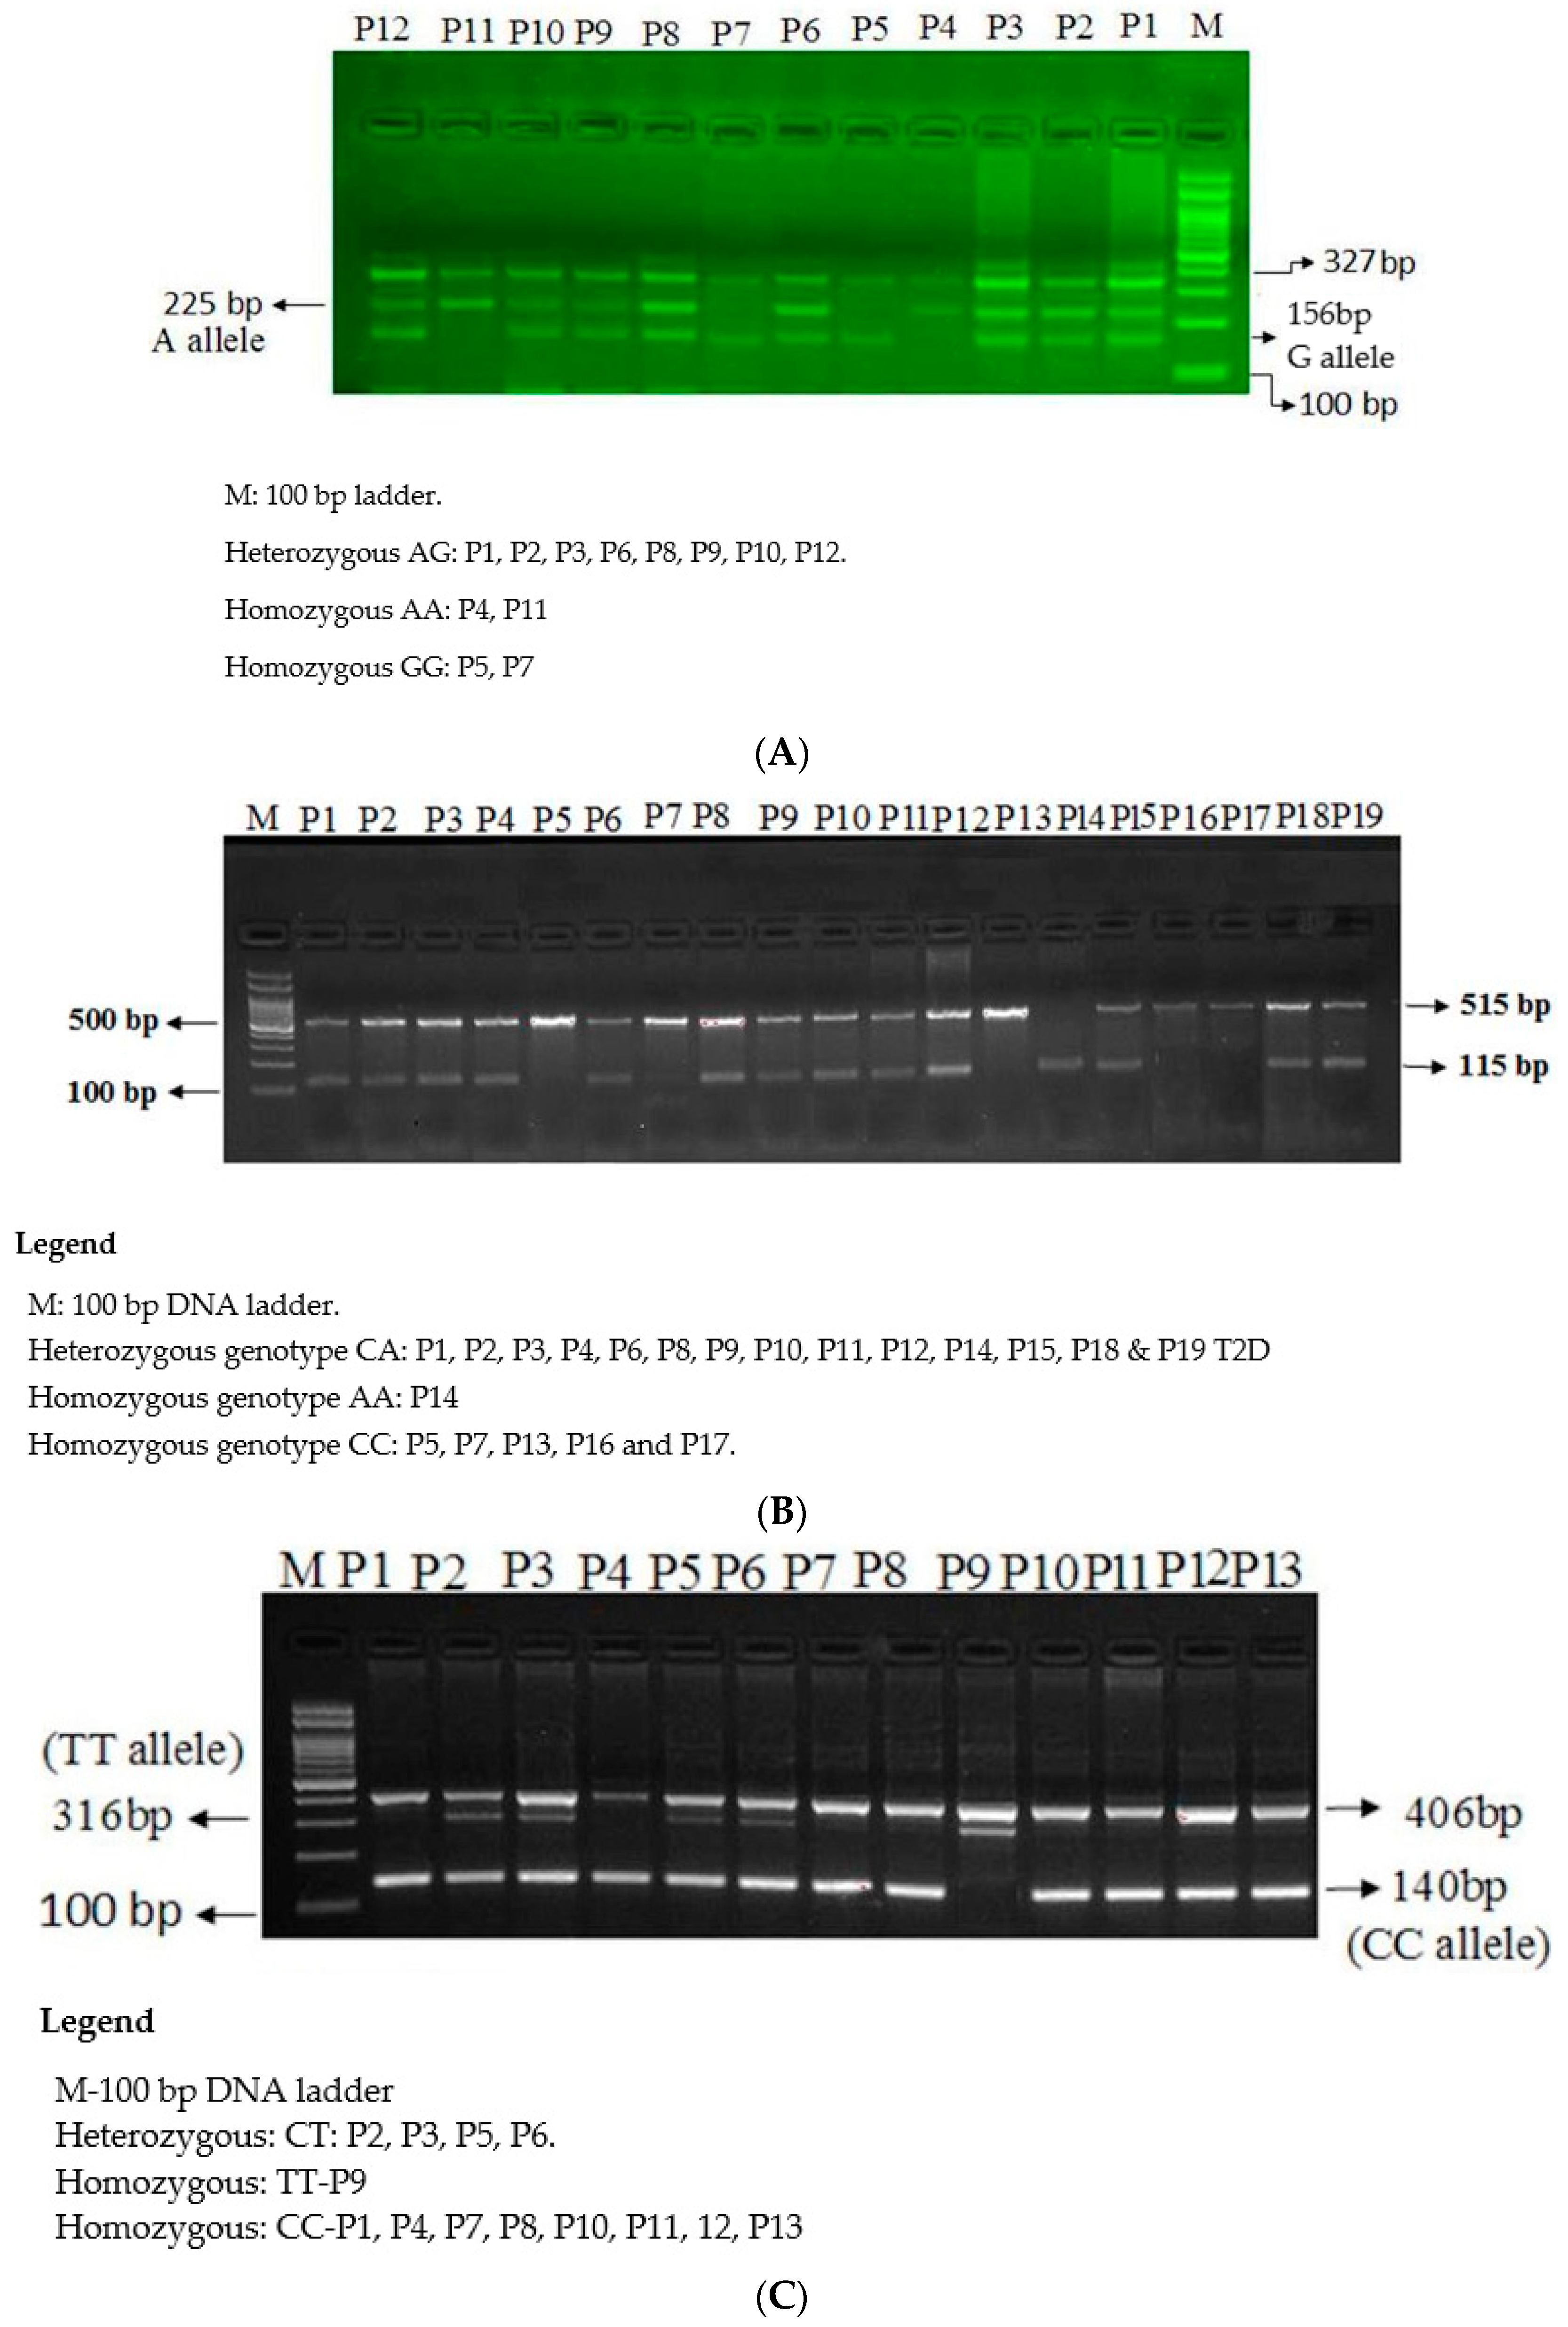
| mi126Fo | 5-GGATAGGTGGGTTCCCGAGAACTG-3 | 327 bp | 58 °C |
| mi126Ro | 5-TCTCAGGGCTATGCCGCCTAAGT-3 | ||
| mi126FI-G | 5-TTCAAACTCGTACCGTGAGTAATAATGAGC-3 | 156 bp | |
| mi126RI-A | 5-GTTTTCGATGCGGTGCCGTGGAAGA-3 | 225 bp | |
| Primer Sequence of PIK3R rs7713645 A > C SNP | |||
| PIK3R1-F1 | 5-CCTACACCAACCCCATTCAGC-3 | 518 bp | 58 °C |
| PIK3R1-A | 5-ACACTCAAATGCTGAATGTGAAAAGTT-3 | ||
| PIK3R-F2 | 5-GGTTTCCCAAGGCATGTTATTGTCAC-3 | 115 bp | |
| PIK3R-R2C | 5-TAGTCAATGTTTGTGATTTATTGCAGCC-3 | ||
| Primer Sequence of PIK3R rs706713 C > T SNP | |||
| PIK3R1-Fo | 5-TAAAAACGTAAAATCAGACTGCTCTG-3 | 406bp | 58 °C |
| PIK3R1-Ro | 5-TGACCTTGTTGTTCAACATCTGC-3 | ||
| PIK3R1C-FI | 5-GGGACTTTCCGGGAACTTAC-3 | 140bp | |
| PIK3R1T-RI | 5-GAGATTTTTTTCCTTCCAATATATTCTACA-3 | 316bp | |
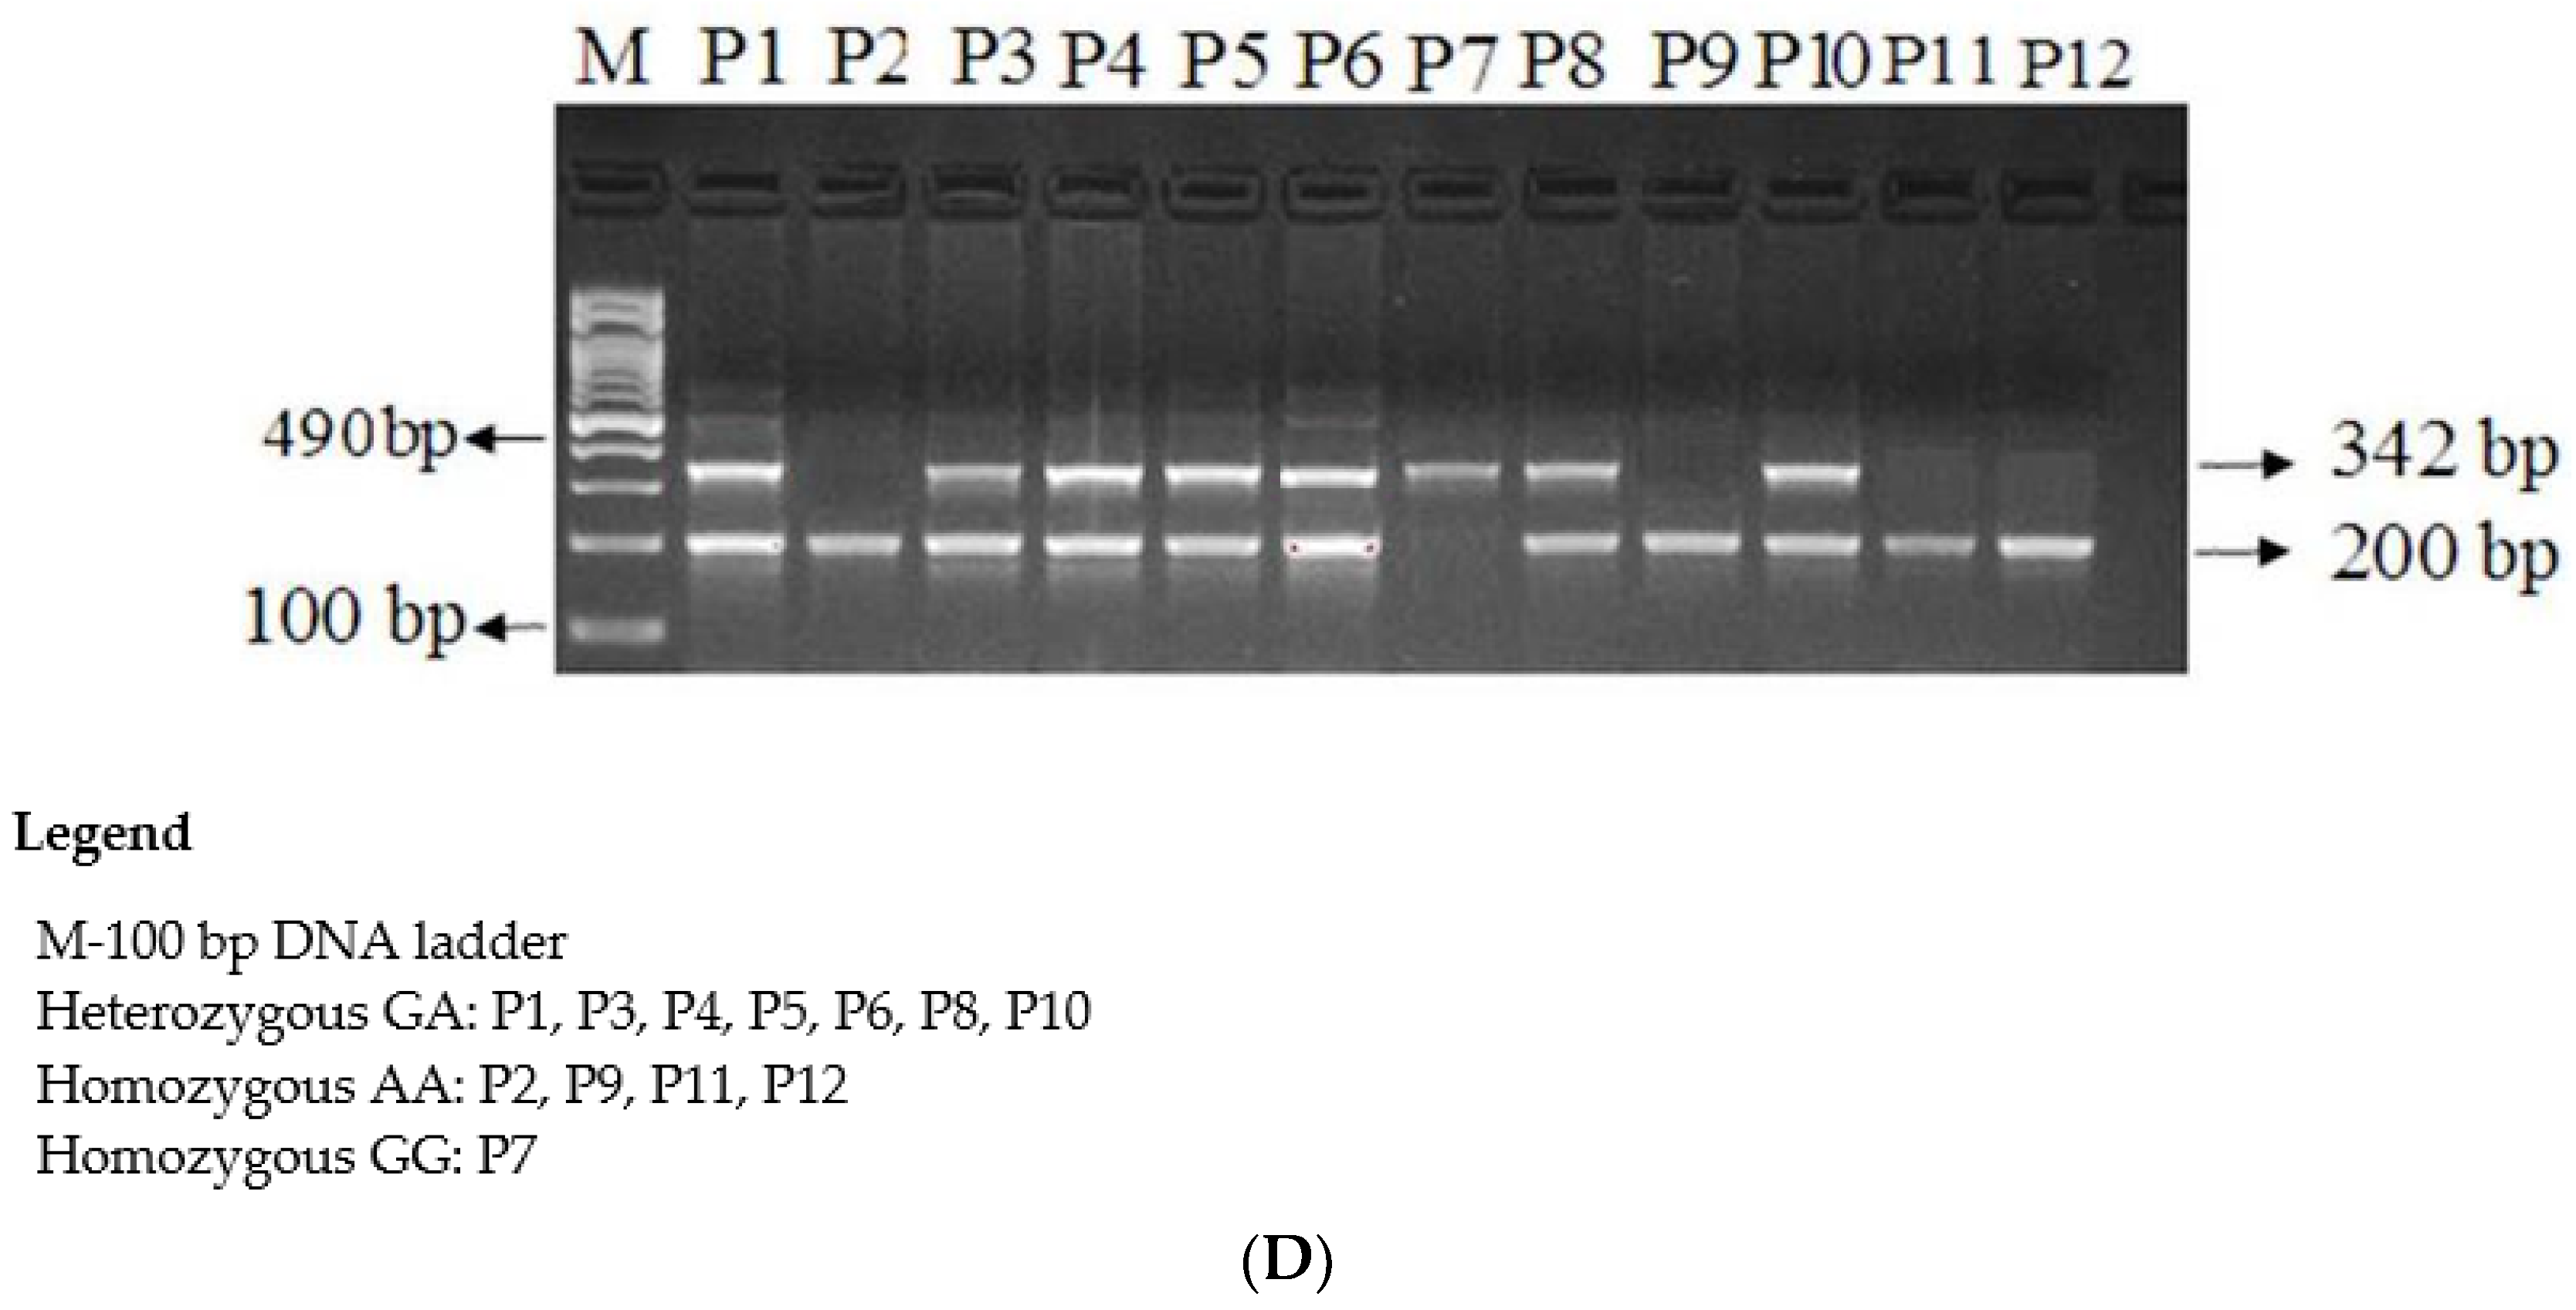
| Primer Sequence of PI3KR1 rs3730089 G > A SNP | |||
| PIK3R-F1 | CATGGCCAGCCCAATTTATTTGTTC | 490 bp | 60 °C |
| PIK3R-R | CGTCTTTGGAAGAGAACCAACTATG | ||
| PIK3R-F1A | GCCAACAACGGTATGAATAACAATA | 200 bp | |
| PIK3RI-C | GTACCATTCAGCATCTTGTAAGGAC | 342 bp | |
| Subjects | n | AA | GA | GG | A | G | χ2 | df | p-Value |
|---|---|---|---|---|---|---|---|---|---|
| T2D patients | 113 | 65 (57.52%) | 43 (38%) | 05 (4.42%) | 0.77 | 0.23 | 7.69 | 2 | 0.021 |
| Controls | 114 | 47 (41.22%) | 54 (47.36%) | 13 (11.40%) | 0.65 | 0.35 |
| Mode of Inheritance | Controls (n = 114) | Cases (n = 113) | OR (95% CI) | RR (95% CI) | p-Value |
|---|---|---|---|---|---|
| Co-dominant model | |||||
| MiR-AA | 47 (41.22%) | 65 (57.52%) | 1 (ref.) | 1 (ref.) | |
| MiR-GA | 54 (47.36%) | 43(38%) | 0.57 (0.33 to 0.99) | 0.76 (0.57 to 1.00) | 0.05 |
| MiR-GG | 13 (11.40%) | 05 (4.42%) | 0.27 (0.09 to 0.83) | 0.58 (0.40 to 0.83) | 0.02 |
| Dominant model | |||||
| MiR-AA | 47 (41.22%) | 65 (57.52%) | 1 (ref.) | 1 (ref.) | |
| MiR (GA + GG) | 67 (58.77%) | 48 (42.47%) | 0.51 (0.30–0.87) | 0.72 (0.55–0.94) | 0.014 |
| Recessive model | |||||
| MiR (AA+ GA) | 101 (88.59%) | 108 (95.57%) | 1 (ref.) | 1 (ref.) | |
| MiR-GG | 13 (11.40%) | 05 (4.42%) | 0.35 (0.12–1.04) | 0.69 (0.48–0.92) | 0.067 |
| Allele | |||||
| MiR-A | 148 | 173 | 1 (ref.) | 1 (ref.) | |
| MiR-G | 78 | 53 | 0.58 (0.38–0.87) | 0.77 (0.64–0.93) | 0.009 |
| Subjects | n = 113 | AA | GA | GG | χ2 | df | p-Value |
|---|---|---|---|---|---|---|---|
| Association with gender | |||||||
| Males | 80 | 50 | 26 | 04 | 3.6 | 2 | 0.160 |
| Females | 33 | 15 | 17 | 01 | |||
| Association with Age | |||||||
| Age > 20 | 27 | 15 | 10 | 02 | 0.75 | 2 | 0.068 |
| Age > 40 | 86 | 50 | 33 | 03 | |||
| Association with RBS mg/dL | |||||||
| RBS < 140 | 34 | 22 | 10 | 02 | 1.62 | 2 | 0.444 |
| RBS > 140 | 79 | 43 | 33 | 03 | |||
| Association with Cholesterol mg/dL | |||||||
| Cholesterol < 200 | 81 | 50 | 30 | 01 | 7.54 | 2 | 0.023 |
| Cholesterol > 200 | 32 | 15 | 13 | 04 | |||
| Association with HDL-C mg/dL | |||||||
| HDL-C < 55 | 79 | 48 | 30 | 01 | 6.4 | 2 | 0.048 |
| HDL-C > 55 | 34 | 17 | 13 | 04 | |||
| Association with LDL-C mg/dL | |||||||
| LDL < 100 | 23 | 06 | 15 | 04 | 26.1 | 2 | 0.0001 |
| LDL > 100 | 77 | 59 | 28 | 01 | |||
| Association with TG mg/dL | |||||||
| TG < 200 | 61 | 47 | 13 | 01 | 20.87 | 2 | 0.0001 |
| TG > 200 | 52 | 18 | 30 | 04 | |||
| Association with HBA1c % | |||||||
| HBA1c < 6 | 27 | 15 | 10 | 2 | 0.25 | 2 | 0.882 |
| HBA1c > 6 | 86 | 50 | 33 | 3 | |||
| Association with Vitamin D ng/mL | |||||||
| Vit.D < 30 | 18 | 03 | 13 | 02 | 2.54 | 2 | 0.28 |
| Vit.D > 30 | 14 | 1 | 13 | 0 |
| Subjects | n | AA | CA | CC | A | C | χ2 | df | p-Value |
|---|---|---|---|---|---|---|---|---|---|
| PIKR patients | 100 | 8 (8%) | 80 (80%) | 12 (12%) | 0.48 | 0.52 | 21.31 | 2 | 0.0001 |
| Controls | 108 | 37 (34.25%) | 60 (55.55%) | 11 (10.18%) | 0.62 | 0.38 |
| Mode of Inheritance | Controls (n = 108) | Cases (n = 100) | OR (95% CI) | RR (95% CI) | p-Value |
|---|---|---|---|---|---|
| Co-dominant model | |||||
| PIKR-AA | 37 | 8 | 1 (ref.) | 1 (ref.) | |
| PIKR-CA | 60 | 80 | 6.16 (2.67 to 14.20) | 1.91 (1.51 to 2.42) | 0.0001 |
| PIKR-CC | 11 | 12 | 5.04 (1.64 to 15.45) | 1.71 (1.09 to 2.69) | 0.0046 |
| Dominant model | |||||
| PIKR-AA | 37 | 8 | 1 (ref.) | 1 (ref.) | |
| PIKR-(CA + CC) | 71 | 92 | 5.99 (2.62–13.66) | 1.88 (1.51–2.35) | 0.0001 |
| Recessive model | |||||
| PIKR-(AA + CA) | 97 | 88 | 1 (ref.) | 1 (ref.) | |
| PIKR-CC | 11 | 12 | 1.20 (0.50–2.86) | 1.09 (0.70–1.71) | 0.67 |
| Allele | |||||
| PIKR-A | 134 | 96 | 1 (ref.) | 1 (ref.) | |
| PIKR-C | 82 | 104 | 1.77 (1.19–2.61) | 1.32 (1.08–1.60) | 0.004 |
| Subjects | n = 100 | AA | CA | CC | χ2 | df | p-Value |
|---|---|---|---|---|---|---|---|
| Association with gender | 8 | 80 | 12 | ||||
| Males | 59 | 4 | 47 | 8 | 0.56 | 2 | 0.755 |
| Females | 41 | 4 | 33 | 4 | |||
| Association with Age | 8 | 80 | 12 | ||||
| Age > 20 | 14 | 04 | 08 | 02 | 9.75 | 2 | 0.0076 |
| Age > 40 | 86 | 04 | 72 | 10 | |||
| Association with RBS mg/dL | 8 | 80 | 12 | ||||
| RBS < 140 | 34 | 05 | 27 | 02 | 4.5 | 2 | 0.102 |
| RBS > 140 | 66 | 03 | 53 | 10 | |||
| Association with Cholesterol mg/dL | 8 | 80 | 12 | ||||
| Cholesterol < 200 | 64 | 05 | 60 | 02 | 16.14 | 2 | 0.0003 |
| Cholesterol > 200 | 36 | 3 | 20 | 10 | |||
| Association with HDL-C mg/dL | 8 | 80 | 12 | ||||
| HDL < 55 mg | 72 | 05 | 63 | 04 | 11.7 | 2 | 0.0039 |
| HDL > 55 mg | 28 | 03 | 17 | 08 | |||
| Association with LDL-C mg/dL | |||||||
| LDL-C < 100 | 23 | 05 | 14 | 04 | 9.14 | 2 | 0.010 |
| LDL-C > 100 | 77 | 03 | 66 | 08 | |||
| Association with TG mg/dL | |||||||
| TG < 200 | 73 | 03 | 62 | 08 | 6.31 | 2 | 0.045 |
| TG > 200 | 27 | 05 | 18 | 04 | |||
| Association with HBA1c % | |||||||
| HBA1c < 6 | 01 | 0 | 1 | 0 | 0.25 | 2 | 0.882 |
| HBA1c > 6 | 99 | 08 | 79 | 12 | |||
| Association with Vitamin D ng/mL | |||||||
| Vit.D < 30 | 18 | 03 | 13 | 02 | 2.54 | 2 | 0.28 |
| Vit.D > 30 | 14 | 1 | 13 | 0 |
| Variables/Genotype | C/C | T/C | T/T | χ2 | df | p-Value |
|---|---|---|---|---|---|---|
| PIKR patients | 68 (67.3%) | 33 (32.7%) | 0 (0%) | 6.71 | 2 | 0.03 |
| Controls | 53 (52.5%) | 45 (44.6%) | 3 (2.9%) |
| Mode of Inheritance | Cases (n = 101) | Controls (n = 101) | OR (95% CI) | RR (95% CI) | p-Value |
|---|---|---|---|---|---|
| Co-dominant | |||||
| PIKR-CC | 68 | 53 | 1 (ref.) | 1 (ref.) | |
| PIKR-TC | 33 | 45 | 0.57 (0.32–1.01) | 0.75 (0.57–1.0) | 0.056 |
| PIKR-TT | 00 | 03 | 0.11 (0.005–2.2) | 0.43 (0.35–0.53) | 0.149 |
| Dominant | |||||
| PIKR-CC | 68 | 53 | 1 (ref.) | 1 (ref.) | |
| PIKR-(TC + TT) | 33 | 48 | 0.53 (0.3–0.94) | 0.73 (0.56–0.96) | 0.032 |
| Recessive | |||||
| PIKR-(CC + TC) | 101 | 98 | 1 (ref.) | 1 (ref.) | |
| PIKR-TT | 00 | 03 | 0.13 (0.007–2.7) | 0.49 (0.42–0.56) | 0.193 |
| Allele | |||||
| PIKR-C | 269 | 151 | 1 (ref.) | 1 (ref.) | |
| PIKR-T | 33 | 51 | 0.36 (0.22–0.58) | 0.59 (0.47–0.73) | 0.0001 |
| Subjects | n = 101 | C/C | T/C | T/T | χ2 | df | p-Value |
|---|---|---|---|---|---|---|---|
| Association with gender | |||||||
| Males | 69 | 42 | 27 | 0 | 4.13 | 2 | 0.126 |
| Females | 32 | 26 | 06 | 0 | |||
| Association with Age | |||||||
| Age > 20 | 17 | 08 | 09 | 0 | 8.47 | 2 | 0.014 |
| Age > 40 | 84 | 60 | 14 | 0 | |||
| Association with RBS mg/dL | |||||||
| RBS < 140 | 27 | 14 | 13 | 0 | 2.13 | 2 | 0.344 |
| RBS > 140 | 51 | 35 | 16 | 0 | |||
| Association with Cholesterol mg/dL | |||||||
| Cholesterol < 200 | 53 | 32 | 21 | 0 | 0.02 | 2 | 0.990 |
| Cholesterol > 200 | 29 | 18 | 11 | 0 | |||
| Association with HDL-C mg/dL | |||||||
| HDL < 55 | 69 | 44 | 25 | 0 | 0.84 | 2 | 0.657 |
| HDL > 55 | 13 | 10 | 03 | 0 | |||
| Association with LDL-C mg/dL | |||||||
| LDL < 100 | 31 | 21 | 10 | 0 | 0.0 | 2 | 1 |
| LDL > 100 | 52 | 35 | 17 | 0 | |||
| Association with TG mg/dL | |||||||
| TG < 200 mg | 63 | 43 | 20 | 0 | 0.17 | 2 | 0.918 |
| TG > 200 mg | 19 | 12 | 07 | 0 | |||
| Association with HBA1c % | |||||||
| HBA1c < 6 mg | 02 | 1 | 1 | 0 | 0.28 | 2 | 0.869 |
| HBA1c > 6 mg | 99 | 67 | 32 | 0 | |||
| Association with Vitamin D ng/mL | |||||||
| Vit.D < 30 | 15 | 11 | 04 | 0 | 0.6 | 2 | 0.740 |
| Vit.D > 30 | 15 | 09 | 06 | 0 | |||
| Variables/Genotype | G/G | G/A | A/A | χ2 | df | p-Value |
|---|---|---|---|---|---|---|
| PIKR patients | 9 (9%) | 49 (49%) | 42 (42%) | 6.71 | 2 | 0.03 |
| Controls | 18 (14.8%) | 69 (56.5%) | 35 (28.7%) |
| Mode of Inheritance | Cases (n = 100) | Controls (n = 101) | OR (95% CI) | RR (95% CI) | p-Value |
|---|---|---|---|---|---|
| Co-dominant | |||||
| PIKR-GG | 9 | 18 | 1 (ref.) | 1 (ref.) | |
| PIKR-GA | 49 | 69 | 1.42 (0.58–3.42) | 1.14 (0.83–1.54) | 0.434 |
| PIKR-AA | 42 | 35 | 2.4(0.95–6.0) | 1.46 (1.02–2.1) | 0.061 |
| Dominant | |||||
| PIKR-GG | 9 | 18 | 1 (ref.) | 1 (ref.) | |
| PIKR-(GA + AA) | 91 | 104 | 1.75 (0.74–4.08) | 1.25 (0.92–1.68) | 0.196 |
| Recessive | |||||
| PIKR-(GG + GA) | 58 | 87 | 1 (ref.) | 1 (ref.) | |
| PIKR-AA | 42 | 35 | 1.8 (1.03–3.14) | 1.32 (0.99–1.74) | 0.039 |
| Allele | |||||
| PIKR-G | 67 | 105 | 1 (ref.) | 1 (ref.) | |
| PIKR-A | 133 | 139 | 1.49 (1.01–2.21) | 1.19 (1.01–1.41) | 0.040 |
| Subjects | n = 100 | G/G | G/A | A/A | χ2 | df | p-Value |
|---|---|---|---|---|---|---|---|
| Association with gender | |||||||
| Males | 62 | 3 | 30 | 29 | 4.04 | 2 | 0.132 |
| Females | 38 | 6 | 19 | 13 | |||
| Association with Age | |||||||
| Age > 20 | 15 | 0 | 6 | 9 | 3.24 | 2 | 0.197 |
| Age > 40 | 85 | 9 | 43 | 33 | |||
| Association with RBS mg/dL | |||||||
| RBS < 140 mg | 25 | 3 | 8 | 14 | 2.25 | 2 | 0.324 |
| RBS > 140 mg | 54 | 5 | 27 | 22 | |||
| Association with Cholesterol mg/dL | |||||||
| Cholesterol < 200 | 50 | 5 | 21 | 24 | 0.82 | 2 | 0.663 |
| Cholesterol > 200 | 31 | 2 | 16 | 13 | |||
| Association with HDL-C mg/dL | |||||||
| HDL < 55 | 70 | 7 | 32 | 31 | 1.32 | 2 | 0.516 |
| HDL > 55 | 11 | 0 | 5 | 6 | |||
| Association with LDL-C mg/dL | |||||||
| LDL < 100 | 27 | 4 | 11 | 12 | 2.02 | 2 | 0.364 |
| LDL > 100 | 54 | 3 | 26 | 25 | |||
| Association with TG mg/dL | |||||||
| TG < 200 mg | 61 | 6 | 24 | 31 | 4.01 | 2 | 0.134 |
| TG > 200 mg | 20 | 1 | 13 | 6 | |||
| Association with HBA1c % | |||||||
| HBA1c < 6 mg | 1 | 0 | 1 | 0 | 1.07 | 2 | 0.585 |
| HBA1c > 6 mg | 98 | 9 | 47 | 42 | |||
| Association with Vitamin D ng/mL | |||||||
| Vit.D < 30 | 14 | 2 | 7 | 5 | 0.94 | 2 | 0.625 |
| Vit.D > 30 | 17 | 2 | 6 | 9 | |||
Publisher’s Note: MDPI stays neutral with regard to jurisdictional claims in published maps and institutional affiliations. |
© 2021 by the authors. Licensee MDPI, Basel, Switzerland. This article is an open access article distributed under the terms and conditions of the Creative Commons Attribution (CC BY) license (https://creativecommons.org/licenses/by/4.0/).
Share and Cite
Mir, R.; Elfaki, I.; Duhier, F.M.A.; Alotaibi, M.A.; AlAlawy, A.I.; Barnawi, J.; Babakr, A.T.; Mir, M.M.; Mirghani, H.; Hamadi, A.; et al. Molecular Determination of mirRNA-126 rs4636297, Phosphoinositide-3-Kinase Regulatory Subunit 1-Gene Variability rs7713645, rs706713 (Tyr73Tyr), rs3730089 (Met326Ile) and Their Association with Susceptibility to T2D. J. Pers. Med. 2021, 11, 861. https://doi.org/10.3390/jpm11090861
Mir R, Elfaki I, Duhier FMA, Alotaibi MA, AlAlawy AI, Barnawi J, Babakr AT, Mir MM, Mirghani H, Hamadi A, et al. Molecular Determination of mirRNA-126 rs4636297, Phosphoinositide-3-Kinase Regulatory Subunit 1-Gene Variability rs7713645, rs706713 (Tyr73Tyr), rs3730089 (Met326Ile) and Their Association with Susceptibility to T2D. Journal of Personalized Medicine. 2021; 11(9):861. https://doi.org/10.3390/jpm11090861
Chicago/Turabian StyleMir, Rashid, Imadeldin Elfaki, Faisel M. Abu Duhier, Maeidh A. Alotaibi, Adel Ibrahim AlAlawy, Jameel Barnawi, Abdullatif Taha Babakr, Mohammad Muzaffar Mir, Hyder Mirghani, Abdullah Hamadi, and et al. 2021. "Molecular Determination of mirRNA-126 rs4636297, Phosphoinositide-3-Kinase Regulatory Subunit 1-Gene Variability rs7713645, rs706713 (Tyr73Tyr), rs3730089 (Met326Ile) and Their Association with Susceptibility to T2D" Journal of Personalized Medicine 11, no. 9: 861. https://doi.org/10.3390/jpm11090861