Evaluation of Microsatellite Typing, ITS Sequencing, AFLP Fingerprinting, MALDI-TOF MS, and Fourier-Transform Infrared Spectroscopy Analysis of Candida auris

 , , ,
, , ,
Abstract
:1. Introduction
2. Materials and Methods
2.1. Candida auris Isolates and Media
2.2. Microsatellite Typing
2.3. Internal Transcribed Spacer Region (ITS) Sequencing
2.4. Amplified Fragment Length Polymorphism (AFLP) Fingerprinting
2.5. MALDI-TOF Mass Spectrum Analysis
2.6. IR Biotyper Spectrum Acquisition and Analysis
2.7. Comparison of Clustering Concordance
3. Results
3.1. Comparison of the Five Typing Methods
3.2. Microsatellite Typing
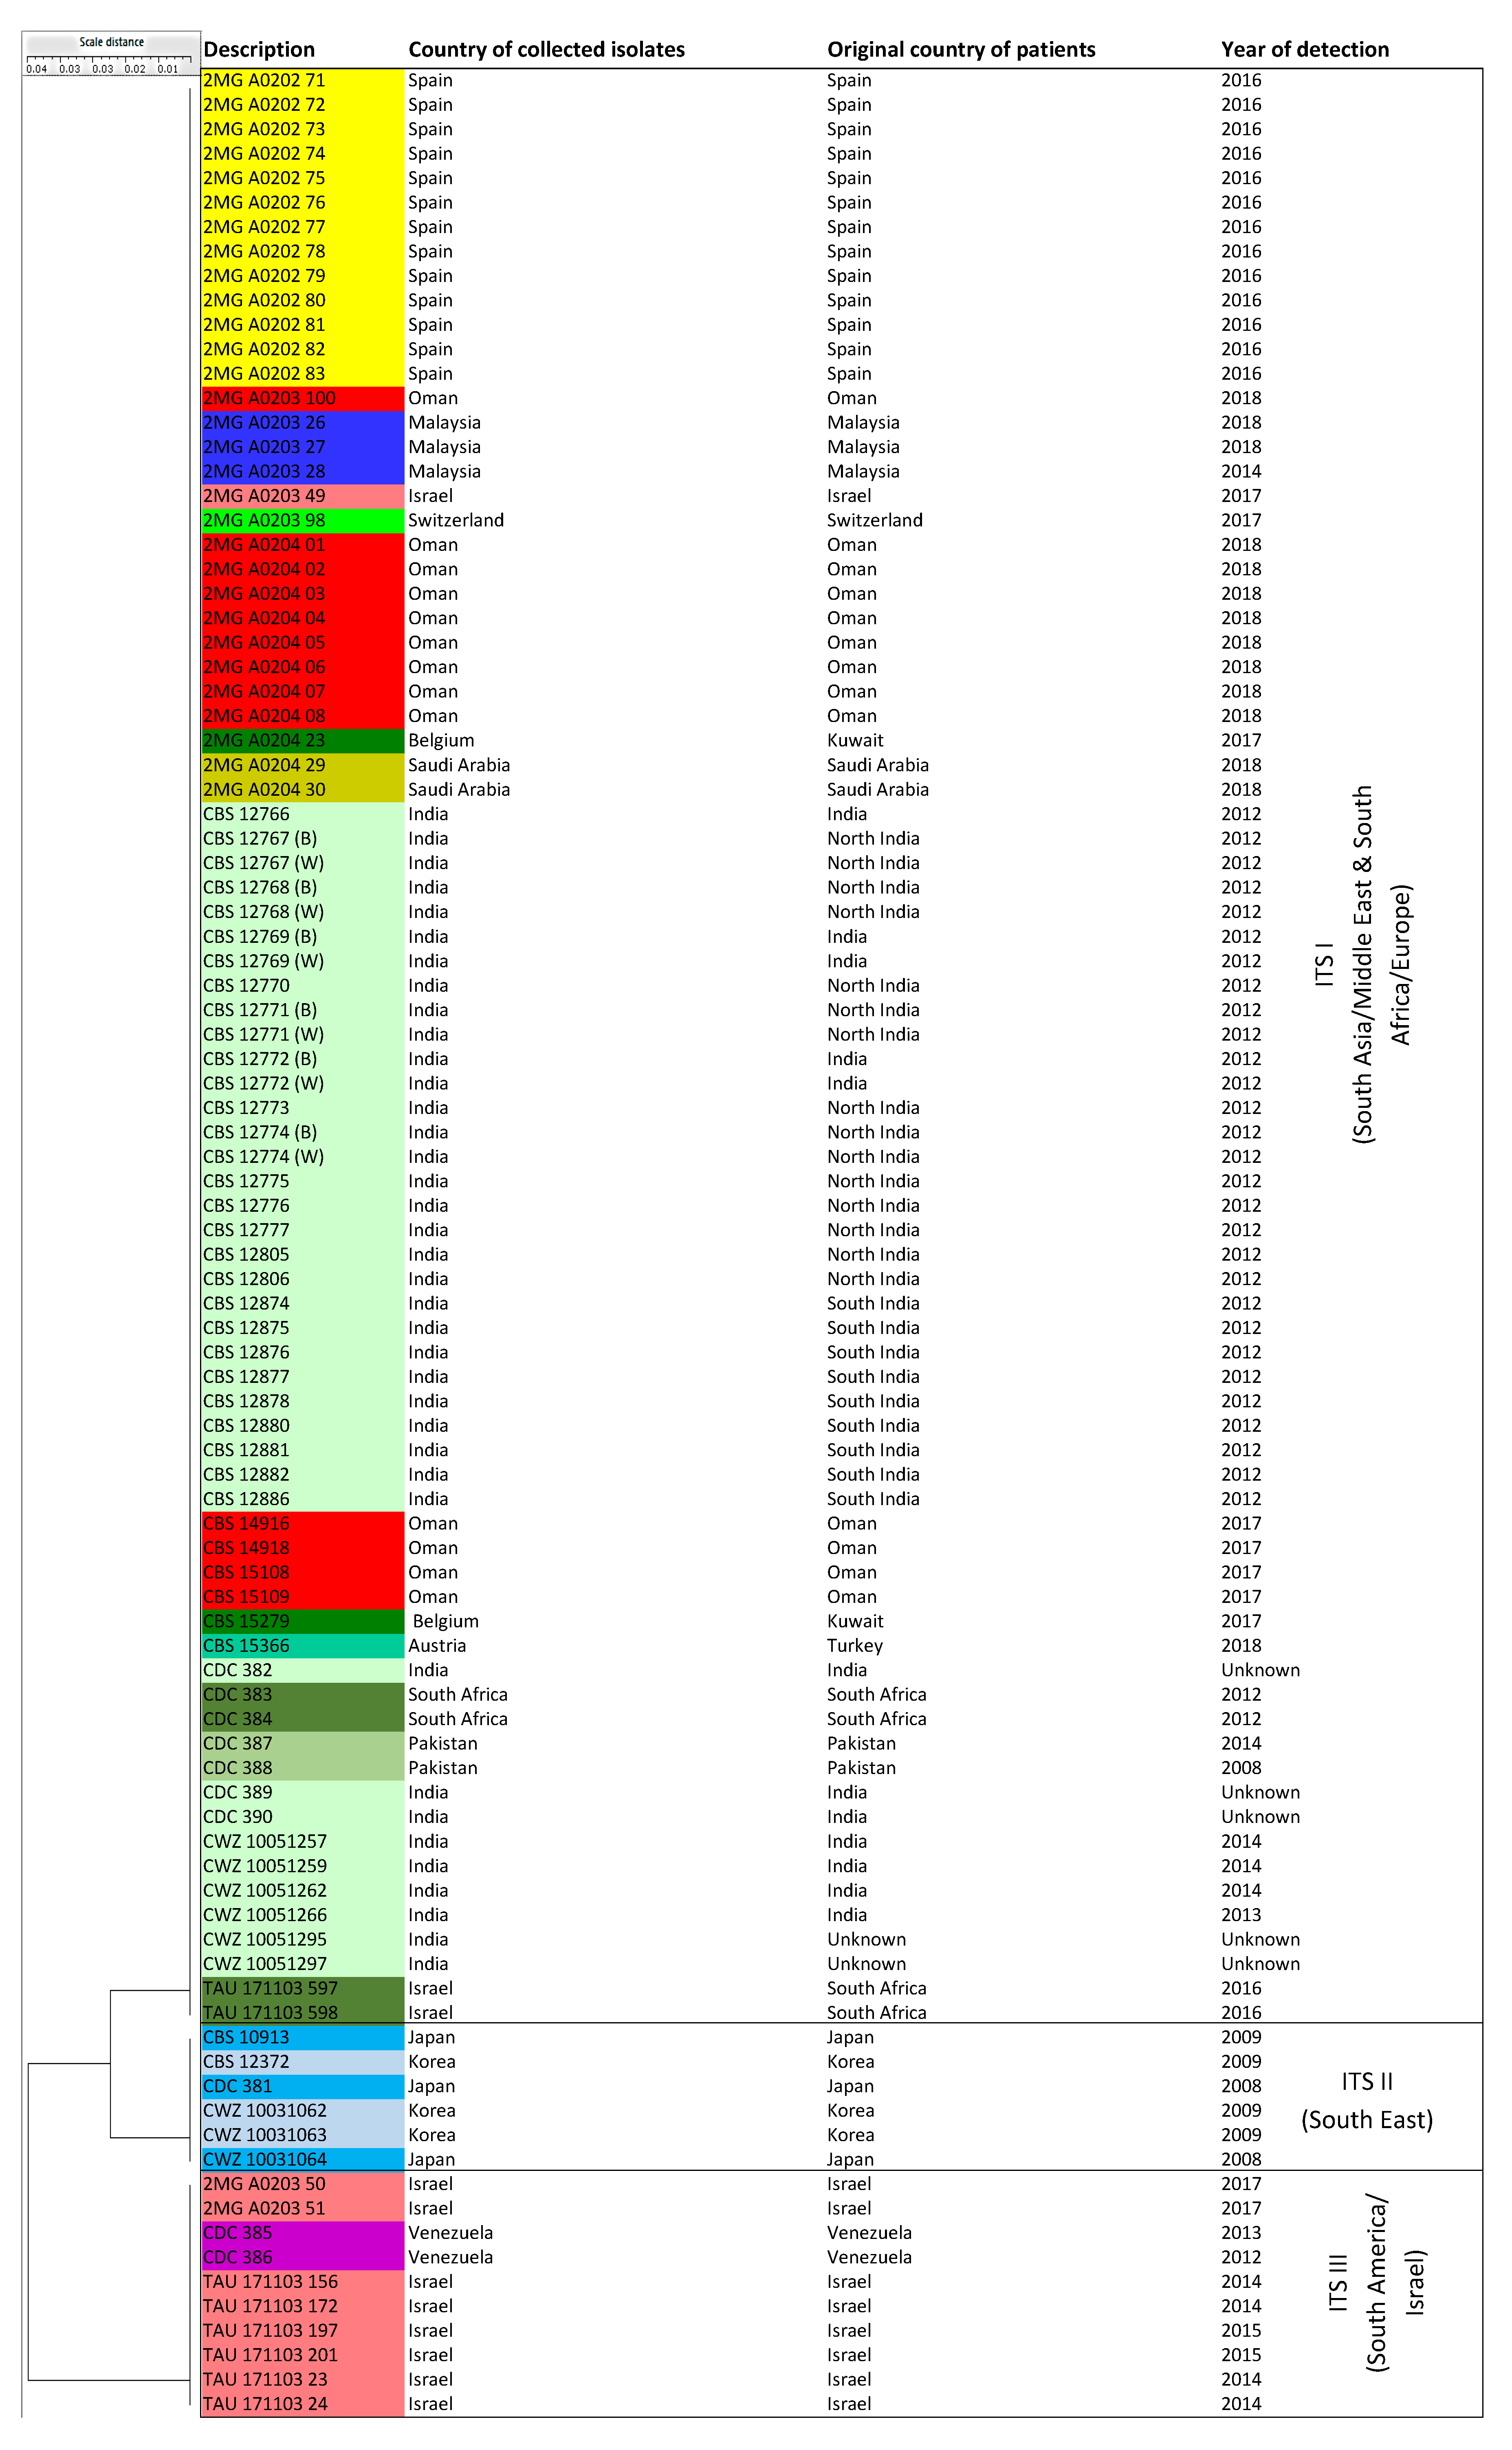
3.3. ITS Sequence-Based Typing
3.4. AFLP Fingerprinting
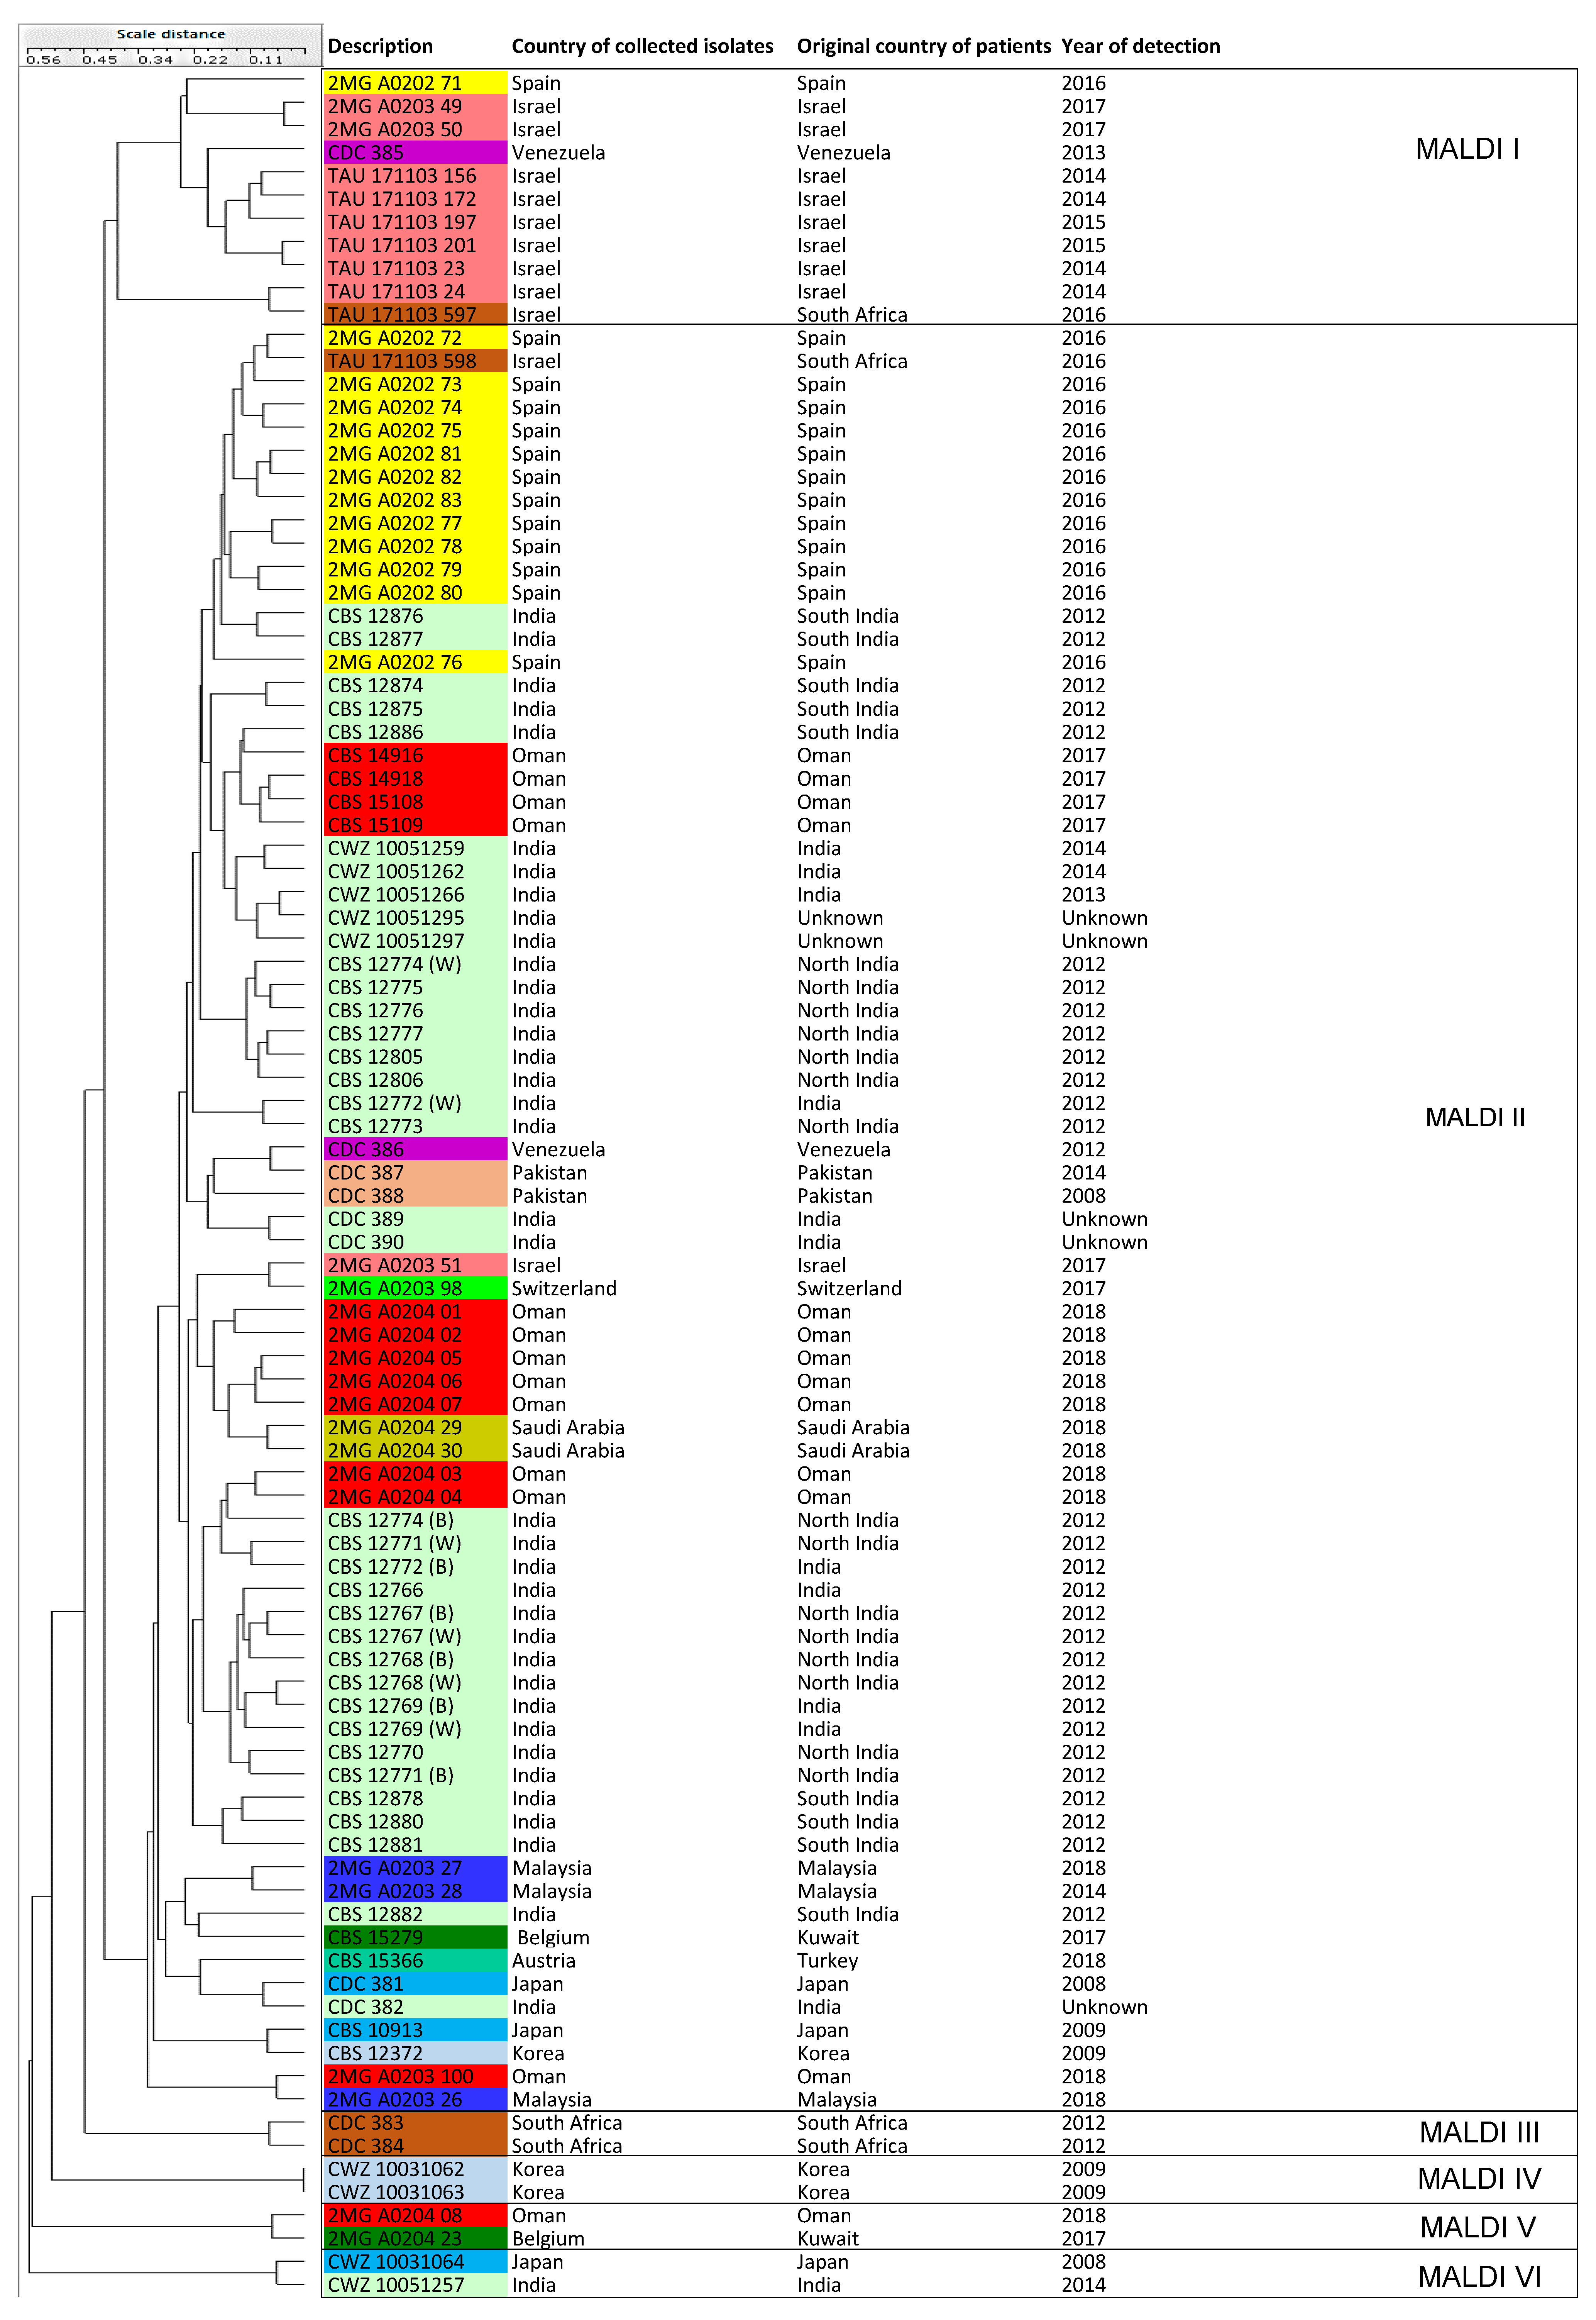
3.5. MALDI-TOF MS
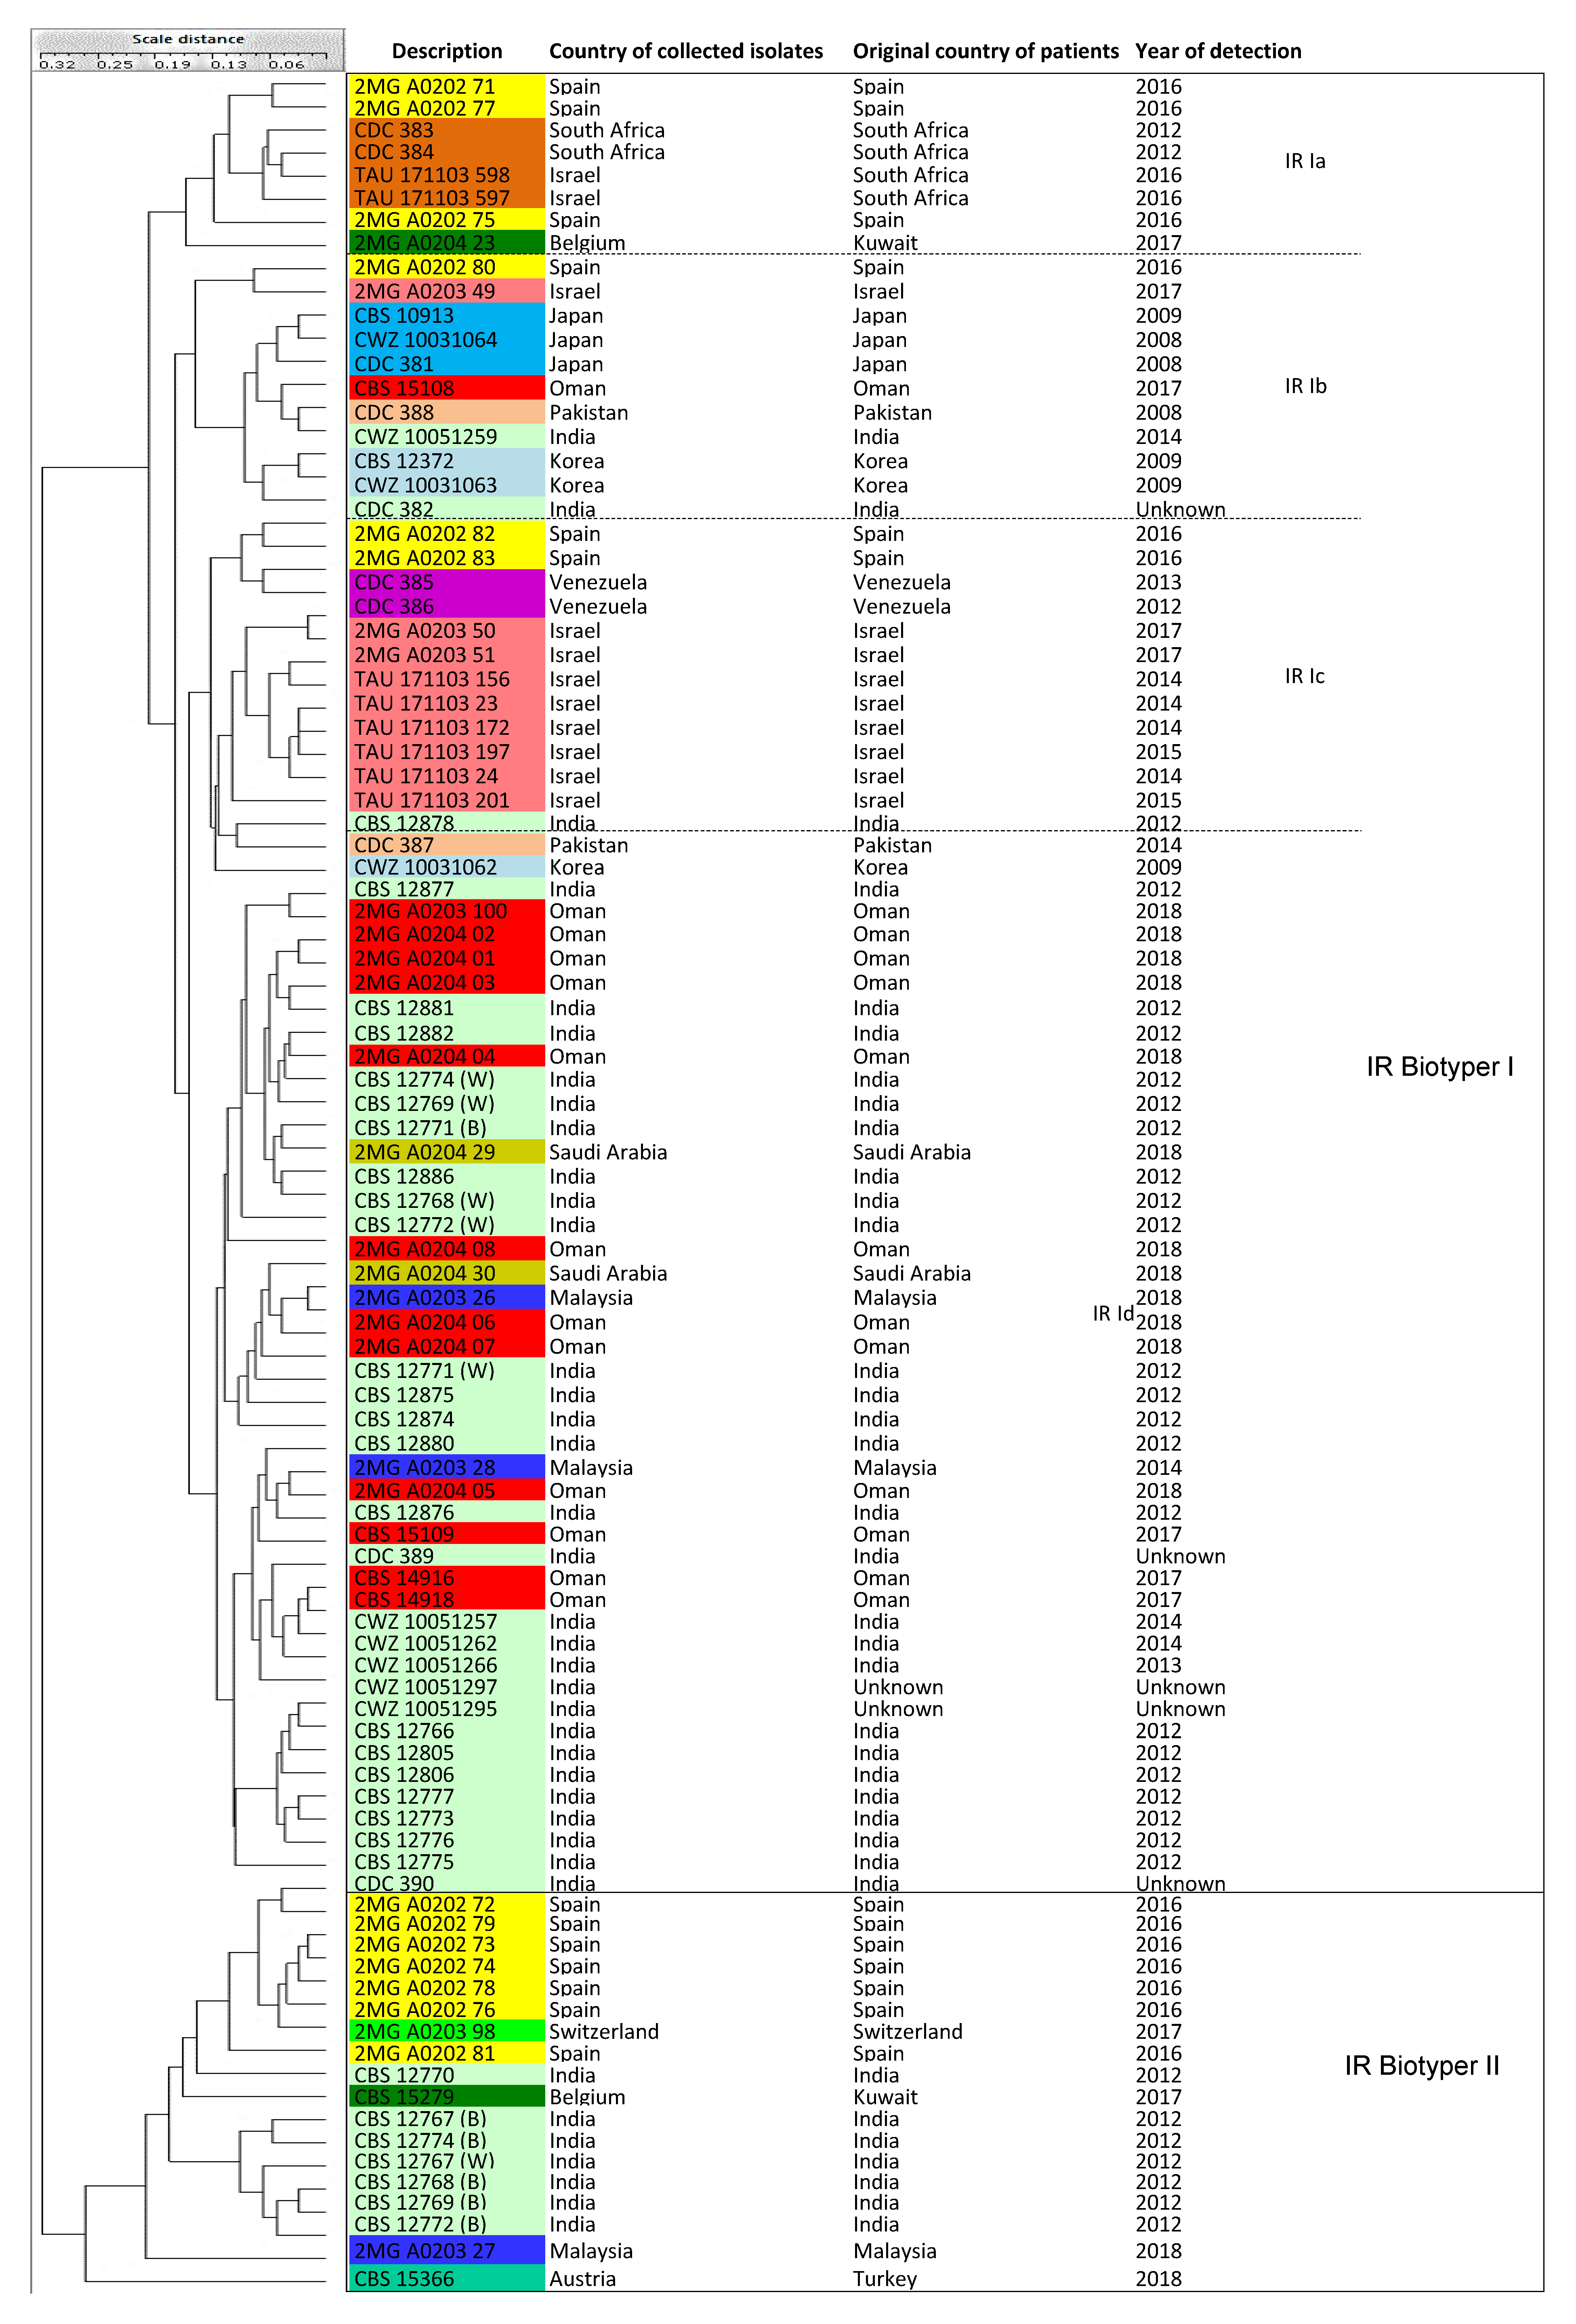
3.6. IR Biotyper
4. Discussion
Supplementary Materials
Author Contributions
Funding
Acknowledgments
Conflicts of Interest
Availability of Data and Material
References
- Lockhart, S.R.; Etienne, K.A.; Vallabhaneni, S.; Farooqi, J.; Chowdhary, A.; Govender, N.P.; Colombo, A.L.; Calvo, B.; Cuomo, C.A.; Desjardins, C.A.; et al. Simultaneous emergence of multidrug-resistant Candida auris on 3 continents confirmed by whole-genome sequencing and epidemiological analyses. Clin. Infect. Dis. 2017, 64, 134–140. [Google Scholar] [CrossRef] [Green Version]
- Schelenz, S.; Hagen, F.; Rhodes, J.L.; Abdolrasouli, A.; Chowdhary, A.; Hall, A.; Ryan, L.; Shackleton, J.; Trimlett, R.; Meis, J.F.; et al. First hospital outbreak of the globally emerging Candida auris in a European hospital. Antimicrob. Resist. Infect. Control 2016, 5, 35. [Google Scholar] [CrossRef] [Green Version]
- Borman, A.M.; Szekely, A.; Johnson, E.M. Isolates of the emerging pathogen Candida auris present in the UK have several geographic origins. Med. Mycol. 2017, 55, 563–567. [Google Scholar] [CrossRef] [PubMed]
- Chowdhary, A.; Prakash, A.; Sharma, C.; Kordalewska, M.; Kumar, A.; Sarma, S.; Tarai, B.; Singh, A.; Upadhyaya, G.; Upadhyay, S.; et al. A multicentre study of antifungal susceptibility patterns among 350 Candida auris isolates (2009-2017) in India: Role of the ERG11 and FKS1 genes in azole and echinocandin resistance. J. Antimicrob. Chemother. 2018, 73, 891–899. [Google Scholar] [CrossRef] [PubMed]
- Saris, K.; Meis, J.F.; Voss, A. Candida auris. Curr. Opin. Infect. Dis. 2018, 31, 334–340. [Google Scholar] [CrossRef] [PubMed]
- De Jong, A.W.; Hagen, F. Attack, defend and persist: How the fungal pathogen Candida auris was able to emerge globally in healthcare environments. Mycopathologia 2019, 184, 353–365. [Google Scholar] [CrossRef] [PubMed] [Green Version]
- Kohlenberg, A.; Struelens, M.J.; Monnet, D.L.; Plachouras, D.; The Candida auris Survey Collaborative Group. Candida auris: Epidemiological situation, laboratory capacity and preparedness in European Union and European Economic Area countries, 2013 to 2017. Eurosurveillance 2018, 23, 18–136. [Google Scholar] [CrossRef] [PubMed] [Green Version]
- Lee, W.G.; Shin, J.H.; Uh, Y.; Kang, M.G.; Kim, S.H.; Park, K.H.; Jang, H.-C. First three reported cases of nosocomial fungemia caused by Candida auris. J. Clin. Microbiol. 2011, 49, 3139–3142. [Google Scholar] [CrossRef] [Green Version]
- Chowdhary, A.; Voss, A.; Meis, J.F. Multidrug-resistant Candida auris: “New kid on the block” in hospital-associated infections? J. Hosp. Infect. 2016, 94, 209–212. [Google Scholar] [CrossRef] [Green Version]
- Chowdhary, A.; Sharma, C.; Duggal, S.; Agarwal, K.; Prakash, A.; Singh, P.K.; Jain, S.; Kathuria, S.; Randhawa, H.S.; Hagen, F.; et al. New clonal strain of Candida auris, Delhi, India. Emerg. Infect. Dis. 2013, 19, 1670–1673. [Google Scholar] [CrossRef] [Green Version]
- Magobo, R.E.; Corcoran, C.; Seetharam, S.; Govender, N.P. Candida auris-associated candidemia, South Africa. Emerg. Infect. Dis. 2014, 20, 1250–1251. [Google Scholar] [CrossRef] [PubMed]
- Emara, M.; Ahmad, S.; Khan, Z.; Joseph, L.; Al-Obaid, I.; Purohit, P.; Bafna, R. Candida auris candidemia in Kuwait, 2014. Emerg. Infect. Dis. 2015, 21, 1091–1092. [Google Scholar] [CrossRef] [PubMed] [Green Version]
- Calvo, B.; Melo, A.S.A.; Perozo-Mena, A.; Hernandez, M.; Francisco, E.C.; Hagen, F.; Meis, J.F.; Colombo, A.L. First report of Candida auris in America: Clinical and microbiological aspects of 18 episodes of candidemia. J. Infect. 2016, 73, 369–374. [Google Scholar] [CrossRef] [PubMed]
- Chow, N.A.; Gade, L.; Tsay, S.V.; Forsberg, K.; Greenko, J.A.; Southwick, K.L.; Barrett, P.M.; Kerins, J.L.; Lockhart, S.R.; Chiller, T.M.; et al. Multiple introductions and subsequent transmission of multidrug-resistant Candida auris in the USA: A molecular epidemiological survey. Lancet Infect. Dis. 2018, 18, 1377–1384. [Google Scholar] [CrossRef]
- Chow, N.A.; De Groot, T.; Badali, H.; Abastabar, M.; Chiller, T.M.; Meis, J.F. Potential fifth clade of Candida auris, Iran, 2018. Emerg. Infect. Dis. 2019, 25, 1780–1781. [Google Scholar] [CrossRef] [Green Version]
- Abastabar, M.; Haghani, I.; Ahangarkani, F.; Rezai, M.S.; Taghizadeh Armaki, M.; Roodgari, S.; Kiakojuri, K.; Al-Hatmi, A.M.S.; Meis, J.F.; Badali, H. Candida auris otomycosis in Iran and review of recent literature. Mycoses 2019, 62, 101–105. [Google Scholar] [CrossRef] [Green Version]
- Muñoz, J.F.; Gade, L.; Chow, N.A.; Loparev, V.N.; Juieng, P.; Berkow, E.L.; Farrer, R.A.; Litvintseva, A.P.; Cuomo, C.A. Genomic insights into multidrug-resistance, mating and virulence in Candida auris and related emerging species. Nat. Commun. 2018, 9, 5346. [Google Scholar] [CrossRef] [Green Version]
- Prakash, A.; Sharma, C.; Singh, A.; Kumar Singh, P.; Kumar, A.; Hagen, F.; Govender, N.P.; Colombo, A.L.; Meis, J.F.; Chowdhary, A. Evidence of genotypic diversity among Candida auris isolates by multilocus sequence typing, matrix-assisted laser desorption ionization time-of-flight mass spectrometry and amplified fragment length polymorphism. Clin. Microbiol. Infect. 2016, 22, 277.e1–277.e9. [Google Scholar] [CrossRef] [Green Version]
- De Groot, T.; Puts, Y.; Berrio, I.; Chowdhary, A.; Meis, J.F. Development of Candida auris microsatellite typing and its application on a global collection of isolates. mBio 2020, 11, e02971-19. [Google Scholar] [CrossRef] [Green Version]
- Enache-Angoulvant, A.; Bourget, M.; Brisse, S.; Stockman-Pannier, C.; Diancourt, L.; François, N.; Rimek, D.; Fairhead, C.; Poulain, D.; Hennequin, C. Multilocus microsatellite markers for molecular typing of Candida glabrata: Application to analysis of genetic relationships between bloodstream and digestive system isolates. J. Clin. Microbiol. 2010, 48, 4028–4034. [Google Scholar] [CrossRef] [Green Version]
- Wu, Y.; Zhou, H.; Che, J.; Li, W.; Bian, F.; Yu, S.; Zhang, L.; Lu, J. Multilocus microsatellite markers for molecular typing of Candida tropicalis isolates. BMC Microbiol. 2014, 14, 245. [Google Scholar] [CrossRef] [Green Version]
- Asadzadeh, M.; Ahmad, S.; Al-Sweih, N.; Hagen, F.; Meis, J.F.; Khan, Z. High-resolution fingerprinting of Candida parapsilosis isolates suggests persistence and transmission of infections among neonatal intensive care unit patients in Kuwait. Sci. Rep. 2019, 9, 1340. [Google Scholar] [CrossRef] [PubMed] [Green Version]
- Bitar, I.; Khalaf, R.A.; Harastani, H.; Tokajian, S. Identification, typing, antifungal resistance profile, and biofilm formation of Candida albicans isolates from Lebanese hospital patients. BioMed Res. Int. 2014, 2014, 931372. [Google Scholar] [CrossRef] [Green Version]
- Schoch, C.L.; Seifert, K.A.; Huhndorf, S.; Robert, V.; Spouge, J.L.; Levesque, C.A.; Chen, W.; Fungal Barcoding Consortium; Fungal Barcoding Consortium Author List. Nuclear ribosomal internal transcribed spacer (ITS) region as a universal DNA barcode marker for Fungi. Proc. Natl. Acad. Sci. USA 2012, 109, 6241–6246. [Google Scholar] [CrossRef] [PubMed] [Green Version]
- Vatanshenassan, M.; Boekhout, T.; Meis, J.F.; Berman, J.; Chowdhary, A.; Ben-Ami, R.; Sparbier, K.; Kostrzewa, M. Candida auris identification and rapid antifungal susceptibility testing against echinocandins by MALDI-TOF MS. Front. Cell. Infect. Microbiol. 2019, 9, 20. [Google Scholar] [CrossRef] [PubMed] [Green Version]
- Kathuria, S.; Singh, P.K.; Sharma, C.; Prakash, A.; Masih, A.; Kumar, A.; Meis, J.F.; Chowdhary, A. Multidrug-resistant Candida auris misidentified as Candida haemulonii: Characterization by Matrix-Assisted Laser Desorption Ionization-Time of Flight Mass Spectrometry and DNA sequencing and its antifungal susceptibility profile variability by Vitek 2, CLSI Broth Microdilution, and Etest Method. J. Clin. Microbiol. 2015, 53, 1823–1830. [Google Scholar] [PubMed] [Green Version]
- Cendejas-Bueno, E.; Kolecka, A.; Alastruey-Izquierdo, A.; Theelen, B.; Groenewald, M.; Kostrzewa, M.; Cuenca-Estrella, M.; Gómez-López, A.; Boekhout, T. Reclassification of the Candida haemulonii complex as Candida haemulonii (C. haemulonii group I), C. duobushaemulonii sp. nov. (C. haemulonii group II), and C. haemulonii var. vulnera var. nov.: Three multiresistant human pathogenic yeasts. J. Clin. Microbiol. 2012, 50, 3641–3651. [Google Scholar] [CrossRef] [PubMed] [Green Version]
- Bao, J.R.; Master, R.N.; Azad, K.N.; Schwab, D.A.; Clark, R.B.; Jones, R.S.; Moore, E.C.; Shier, K.L. Rapid, accurate identification of Candida auris by using a novel Matrix-Assisted Laser Desorption Ionization-Time of Flight Mass Spectrometry (MALDI-TOF MS) database (Library). J. Clin. Microbiol. 2018, 56, e01700-17. [Google Scholar] [CrossRef] [PubMed] [Green Version]
- Kwon, Y.J.; Shin, J.H.; Byun, S.A.; Choi, M.J.; Won, E.J.; Lee, D.; Lee, S.Y.; Chun, S.; Lee, J.H.; Choi, H.J.; et al. Candida auris clinical isolates from South Korea: Identification, antifungal susceptibility, and genotyping. J. Clin. Microbiol. 2019, 57, e01624-18. [Google Scholar] [CrossRef] [Green Version]
- Zhu, Y.; O’Brien, B.; Leach, L.; Clarke, A.; Bates, M.; Adams, E.; Ostrowsky, B.; Quinn, M.; Dufort, E.; Southwick, K.; et al. Laboratory analysis of an outbreak of Candida auris in New York from 2016 to 2018: Impact and lessons learned. J. Clin. Microbiol. 2020, 58, e01503-19. [Google Scholar] [CrossRef] [Green Version]
- Girard, V.; Mailler, S.; Chetry, M.; Vidal, C.; Durand, G.; Van Belkum, A.; Colombo, A.L.; Hagen, F.; Meis, J.F.; Chowdhary, A. Identification and typing of the emerging pathogen Candida auris by matrix-assisted laser desorption ionisation time of flight mass spectrometry. Mycoses 2016, 59, 535–538. [Google Scholar] [CrossRef] [PubMed]
- Dinkelacker, A.G.; Vogt, S.; Oberhettinger, P.; Mauder, N.; Rau, J.; Kostrzewa, M.; Rossen, J.W.A.; Autenrieth, I.B.; Peter, S.; Liese, J. Typing and Species Identification of Clinical Klebsiella Isolates by Fourier Transform Infrared Spectroscopy and Matrix-Assisted Laser Desorption Ionization-Time of Flight Mass Spectrometry. J. Clin. Microbiol. 2018, 56, e00843-18. [Google Scholar] [CrossRef] [Green Version]
- Adt, I.; Kohler, A.; Gognies, S.; Budin, J.; Sandt, C.; Belarbi, A.; Manfait, M.; Sockalingum, G.D. FTIR spectroscopic discrimination of Saccharomyces cerevisiae and Saccharomyces bayanus strains. Can. J. Microbiol. 2010, 56, 793–801. [Google Scholar] [CrossRef] [PubMed]
- Galichet, A.; Sockalingum, G.D.; Belarbi, A.; Manfait, M. FTIR spectroscopic analysis of Saccharomyces cerevisiae cell walls: Study of an anomalous strain exhibiting a pink-colored cell phenotype. FEMS Microbiol. Lett. 2001, 197, 179–186. [Google Scholar] [CrossRef] [PubMed] [Green Version]
- Grangeteau, C.; Gerhards, D.; Terrat, S.; Dequiedt, S.; Alexandre, H.; Guilloux-Benatier, M.; Von Wallbrunn, C.; Rousseaux, S. FT-IR spectroscopy: A powerful tool for studying the inter- and intraspecific biodiversity of cultivable non-Saccharomyces yeasts isolated from grape must. J. Microbiol. Methods 2016, 121, 50–58. [Google Scholar] [CrossRef] [PubMed]
- Rakovitsky, N.; Frenk, S.; Kon, H.; Schwartz, D.; Temkin, E.; Solter, E.; Paikin, S.; Cohen, R.; Schwaber, M.J.; Carmeli, Y.; et al. Fourier Transform Infrared Spectroscopy is a new option for outbreak investigation: A retrospective analysis of an Extended-Spectrum-Beta-Lactamase-producing Klebsiella pneumoniae outbreak in a neonatal intensive care unit. J. Clin. Microbiol. 2020, 58, e00098-20. [Google Scholar] [CrossRef]
- Martak, D.; Valot, B.; Sauget, M.; Cholley, P.; Thouverez, M.; Bertrand, X.; Hocquet, D. Fourier-Transform InfraRed spectroscopy can quickly type Gram-negative bacilli responsible for hospital outbreaks. Front. Microbiol. 2019, 10, 1440. [Google Scholar] [CrossRef] [Green Version]
- Sandt, C.; Sockalingum, G.D.; Aubert, D.; Lepan, H.; Lepouse, C.; Jaussaud, M.; Leon, A.; Pinon, J.M.; Manfait, M.; Toubas, D. Use of Fourier-transform infrared spectroscopy for typing of Candida albicans strains isolated in intensive care units. J. Clin. Microbiol. 2003, 41, 954–959. [Google Scholar] [CrossRef] [Green Version]
- Chow, N.A.; Muñoz, J.F.; Gade, L.; Berkow, E.; Li, X.; Welsh, R.M.; Forsberg, K.; Lockhart, S.R.; Adam, R.; Alanio, A.; et al. Tracing the evolutionary history and global expansion of Candida auris using population genomic analyses. mBio 2020, 11, e03364-19. [Google Scholar] [CrossRef]
- Pekard-Amenitsch, S.; Schriebl, A.; Posawetz, W.; Willinger, B.; Kölli, B.; Buzina, W. Isolation of Candida auris from ear of otherwise healthy patient, Austria, 2018. Emerg. Infect. Dis. 2018, 24, 1596–1597. [Google Scholar] [CrossRef] [Green Version]
- Dewaele, K.; Frans, J.; Smismans, A.; Ho, E.; Tollens, T.; Lagrou, K. First case of Candida auris infection in Belgium in a surgical patient from Kuwait. Acta Clin. Belg. 2018, 1–8. [Google Scholar] [CrossRef]
- Satoh, K.; Makimura, K.; Hasumi, Y.; Nishiyama, Y.; Uchida, K.; Yamaguchi, H. Candida auris sp. nov., a novel ascomycetous yeast isolated from the external ear canal of an inpatient in a Japanese hospital. Microbiol. Immunol. 2009, 53, 41–44. [Google Scholar] [CrossRef] [PubMed]
- Ben-Ami, R.; Berman, J.; Novikov, A.; Bash, E.; Shachor-Meyouhas, Y.; Zakin, S.; Maor, Y.; Tarabia, J.; Schechner, V.; Adler, A.; et al. Multidrug-Resistant Candida haemulonii and C. auris, Tel Aviv, Israel. Emerg. Infect. Dis. 2017, 23, 195–203. [Google Scholar] [CrossRef]
- Belkin, A.; Gazit, Z.; Keller, N.; Ben-Ami, R.; Wieder-Finesod, A.; Novikov, A.; Rahav, G.; Brosh-Nissimov, T. Candida auris infection leading to nosocomial transmission, Israel, 2017. Emerg. Infect. Dis. 2018, 24, 801–804. [Google Scholar] [CrossRef] [Green Version]
- Mohd Tap, R.; Lim, T.C.; Kamarudin, N.A.; Ginsapu, S.J.; Abd Razak, M.F.; Ahmad, N.; Amran, F. A fatal case of Candida auris and Candida tropicalis candidemia in neutropenic patient. Mycopathologia 2018, 183, 559–564. [Google Scholar] [CrossRef] [PubMed] [Green Version]
- Mohsin, J.; Hagen, F.; Al-Balushi, Z.A.M.; De Hoog, G.S.; Chowdhary, A.; Meis, J.F.; Al-Hatmi, A.M.S. The first cases of Candida auris candidaemia in Oman. Mycoses 2017, 60, 569–575. [Google Scholar] [CrossRef] [PubMed] [Green Version]
- Al Maani, A.; Paul, H.; Al-Rashdi, A.; Wahaibi, A.A.; Al-Jardani, A.; Al Abri, A.M.A.; AlBalushi, M.A.H.; Al-Abri, S.; Al Reesi, M.; Al Maqbali, A.; et al. Ongoing challenges with healthcare-associated Candida auris outbreaks in Oman. J. Fungi 2019, 5, 101. [Google Scholar] [CrossRef] [Green Version]
- Abdalhamid, B.; Almaghrabi, R.; Althawadi, S.; Omrani, A. First report of Candida auris infections from Saudi Arabia. J. Infect. Public Health 2018, 11, 598–599. [Google Scholar] [CrossRef]
- Ruiz-Gaitán, A.; Moret, A.M.; Tasias-Pitarch, M.; Aleixandre-López, A.I.; Martínez-Morel, H.; Calabuig, E.; Salavert-Lletí, M.; Ramírez, P.; López-Hontangas, J.L.; Hagen, F.; et al. An outbreak due to Candida auris with prolonged colonisation and candidaemia in a tertiary care European hospital. Mycoses 2018, 61, 498–505. [Google Scholar] [CrossRef] [Green Version]
- Riat, A.; Neofytos, D.; Coste, A.; Harbarth, S.; Bizzini, A.; Grandbastien, B.; Pugin, J.; Lamoth, F. First case of Candida auris in Switzerland: Discussion about preventive strategies. Swiss Med. Wkly. 2018, 148, w14622. [Google Scholar]
- Kostrzewa, M.; Schubert, S. MALDI-TOF Mass Spectrometry in Microbiology. In British Library Cataloguing-in-Publication Data; Caister Academic Press: Norfolk, UK, 2016. [Google Scholar]
- Al-Hatmi, A.M.S.; Bonifaz, A.; De Hoog, G.S.; Vazquez-Maya, L.; Garcia-Carmona, K.; Meis, J.F.; Van Diepeningen, A.D. Keratitis by Fusarium temperatum, a novel opportunist. BMC Infect. Dis. 2014, 14, 588. [Google Scholar] [CrossRef] [PubMed] [Green Version]
- Lu, X.-L.; Najafzadeh, M.J.; Dolatabadi, S.; Ran, Y.-P.; Gerrits van den Ende, A.H.G.; Shen, Y.-N.; Li, C.-Y.; Xi, L.-Y.; Hao, F.; Zhang, Q.-Q.; et al. Taxonomy and epidemiology of Mucor irregularis, agent of chronic cutaneous mucormycosis. Persoonia 2013, 30, 48–56. [Google Scholar] [CrossRef] [Green Version]
- Sauer, S.; Freiwald, A.; Maier, T.; Kube, M.; Reinhardt, R.; Kostrzewa, M.; Geider, K. Classification and identification of bacteria by mass spectrometry and computational analysis. PLoS ONE 2008, 3, e2843. [Google Scholar] [CrossRef] [Green Version]
- Vlek, A.; Kolecka, A.; Khayhan, K.; Theelen, B.; Groenewald, M.; Boel, E.; Multicenter Study Group; Boekhout, T. Interlaboratory comparison of sample preparation methods, database expansions, and cutoff values for identification of yeasts by matrix-assisted laser desorption ionization-time of flight mass spectrometry using a yeast test panel. J. Clin. Microbiol. 2014, 52, 3023–3029. [Google Scholar] [CrossRef] [Green Version]
- Cassagne, C.; Cella, A.-L.; Suchon, P.; Normand, A.-C.; Ranque, S.; Piarroux, R. Evaluation of four pretreatment procedures for MALDI-TOF MS yeast identification in the routine clinical laboratory. Med. Mycol. 2013, 51, 371–377. [Google Scholar] [CrossRef] [Green Version]
- Kim, T.-H.; Kweon, O.J.; Kim, H.R.; Lee, M.-K. Identification of uncommon Candida species using commercial identification systems. J. Microbiol. Biotechnol. 2016, 26, 2206–2213. [Google Scholar] [CrossRef] [PubMed]
- Robert, V.; Szoke, S.; Jabas, B.; Vu, D.; Chouchen, O.; Blom, E.; Cardinali, G. BioloMICS software, biological data management, identification, classification and statistics. Open Appl. Inform. J. 2011, 5, 87–98. [Google Scholar] [CrossRef]
- Kuramae, E.E.; Robert, V.; Echavarri-Erasun, C.; Boekhout, T. Cophenetic correlation analysis as a strategy to select phylogenetically informative proteins: An example from the fungal kingdom. BMC Evol. Biol. 2007, 7, 134. [Google Scholar] [CrossRef] [Green Version]
- Gabaldón, T.; Gómez-Molero, E.; Bader, O. Molecular typing of Candida glabrata. Mycopathologia 2019. [Google Scholar] [CrossRef]
- Li, C.; Wang, L.; Tong, H.; Ge, Y.; Mei, H.; Chen, L.; Lv, G.; Liu, W. Microsatellite analysis of genotype distribution patterns of Candida albicans vulvovaginal candidiasis in Nanjing, China and its association with pregnancy, age and clinical presentation. Arch. Gynecol. Obstet. 2016, 294, 291–297. [Google Scholar] [CrossRef]
- Dhieb, C.; Normand, A.C.; L’Ollivier, C.; Gautier, M.; Vranckx, K.; El Euch, D.; Chaker, E.; Hendrickx, M.; Dalle, F.; Sadfi, N.; et al. Comparison of MALDI-TOF mass spectra with microsatellite length polymorphisms in Candida albicans. J. Mass Spectrom. 2015, 50, 371–377. [Google Scholar] [CrossRef] [PubMed]
- Hagen, F.; Illnait-Zaragozí, M.-T.; Meis, J.F.; Chew, W.H.M.; Curfs-Breuker, I.; Mouton, J.W.; Hoepelman, A.I.M.; Spanjaard, L.; Verweij, P.E.; Kampinga, G.A.; et al. Extensive genetic diversity within the Dutch clinical Cryptococcus neoformans population. J. Clin. Microbiol. 2012, 50, 1918–1926. [Google Scholar] [CrossRef] [PubMed] [Green Version]
- Ashu, E.E.; Hagen, F.; Chowdhary, A.; Meis, J.F.; Xu, J. Global population genetic analysis of Aspergillus fumigatus. mSphere 2017, 2, e00019-17. [Google Scholar] [CrossRef] [Green Version]
- De Valk, H.A.; Meis, J.F.G.M.; Klaassen, C.H.W. Microsatellite based typing of Aspergillus fumigatus: Strengths, pitfalls and solutions. J. Microbiol. Methods 2007, 69, 268–272. [Google Scholar] [CrossRef] [PubMed]
- De Carolis, E.; Hensgens, L.A.M.; Vella, A.; Posteraro, B.; Sanguinetti, M.; Senesi, S.; Tavanti, A. Identification and typing of the Candida parapsilosis complex: MALDI-TOF MS vs. AFLP. Med. Mycol. 2014, 52, 123–130. [Google Scholar] [CrossRef] [PubMed] [Green Version]
- Asadzadeh, M.; Ahmad, S.; Al-Sweih, N.; Khan, Z. Molecular fingerprinting studies do not support intrahospital transmission of Candida albicans among candidemia patients in Kuwait. Front. Microbiol. 2017, 8, 247. [Google Scholar] [CrossRef] [Green Version]
- Tomazin, R.; Matos, T.; Meis, J.F.; Hagen, F. Molecular characterization and antifungal susceptibility testing of sequentially obtained clinical Cryptococcus deneoformans and Cryptococcus neoformans isolates from Ljubljana, Slovenia. Mycopathologia 2018, 183, 371–380. [Google Scholar] [CrossRef]
- Restrepo, C.M.; Llanes, A.; Lleonart, R. Use of AFLP for the study of eukaryotic pathogens affecting humans. Infect. Genet. Evol. 2018, 63, 360–369. [Google Scholar] [CrossRef]
- Bertani, G.; Savo Sardaro, M.L.; Neviani, E.; Lazzi, C. AFLP protocol comparison for microbial diversity fingerprinting. J. Appl. Genet. 2019, 60, 217–223. [Google Scholar] [CrossRef]
- Ismail, N.A.; Rafii, M.Y.; Mahmud, T.M.M.; Hanafi, M.M.; Miah, G. Molecular markers: A potential resource for ginger genetic diversity studies. Mol. Biol. Rep. 2016, 43, 1347–1358. [Google Scholar] [CrossRef]
- Chowdhary, A.; Anil Kumar, V.; Sharma, C.; Prakash, A.; Agarwal, K.; Babu, R.; Dinesh, K.R.; Karim, S.; Singh, S.K.; Hagen, F.; et al. Multidrug-resistant endemic clonal strain of Candida auris in India. Eur. J. Clin. Microbiol. Infect. Dis. 2014, 33, 919–926. [Google Scholar] [CrossRef] [PubMed]
- Dhieb, C.; Normand, A.C.; Al-Yasiri, M.; Chaker, E.; El Euch, D.; Vranckx, K.; Hendrickx, M.; Sadfi, N.; Piarroux, R.; Ranque, S. MALDI-TOF typing highlights geographical and fluconazole resistance clusters in Candida glabrata. Med. Mycol. 2015, 53, 462–469. [Google Scholar] [CrossRef] [PubMed] [Green Version]
- Lauterbach, A.; Usbeck, J.C.; Behr, J.; Vogel, R.F. MALDI-TOF MS typing enables the classification of brewing yeasts of the genus Saccharomyces to major beer styles. PLoS ONE 2017, 12, e0181694. [Google Scholar] [CrossRef] [PubMed]
- Zautner, A.E.; Masanta, W.O.; Weig, M.; Groß, U.; Bader, O. Mass Spectrometry-based PhyloProteomics (MSPP): A novel microbial typing Method. Sci. Rep. 2015, 5, 13431. [Google Scholar] [CrossRef] [PubMed] [Green Version]
- Pulcrano, G.; Roscetto, E.; Iula, V.D.; Panellis, D.; Rossano, F.; Catania, M.R. MALDI-TOF mass spectrometry and microsatellite markers to evaluate Candida parapsilosis transmission in neonatal intensive care units. Eur. J. Clin. Microbiol. Infect. Dis. 2012, 31, 2919–2928. [Google Scholar] [CrossRef]
- Burckhardt, I.; Sebastian, K.; Mauder, N.; Kostrzewa, M.; Burckhardt, F.; Zimmermann, S. Analysis of Streptococcus pneumoniae using Fourier-transformed infrared spectroscopy allows prediction of capsular serotype. Eur. J. Clin. Microbiol. Infect. Dis. 2019, 38, 1883–1890. [Google Scholar] [CrossRef] [Green Version]
- Arber, W. Genetic variation: Molecular mechanisms and impact on microbial evolution. FEMS Microbiol. Rev. 2000, 24, 1–7. [Google Scholar] [CrossRef]
- Hirakawa, M.P.; Martinez, D.A.; Sakthikumar, S.; Anderson, M.Z.; Berlin, A.; Gujja, S.; Zeng, Q.; Zisson, E.; Wang, J.M.; Greenberg, J.M.; et al. Genetic and phenotypic intra-species variation in Candida albicans. Genome Res. 2015, 25, 413–425. [Google Scholar] [CrossRef] [Green Version]
- Merseguel, K.B.; Nishikaku, A.S.; Rodrigues, A.M.; Padovan, A.C.; E Ferreira, R.C.; Salles de Azevedo Melo, A.; Da Silva Briones, M.R.; Colombo, A.L. Genetic diversity of medically important and emerging Candida species causing invasive infection. BMC Infect. Dis. 2015, 15, 1–11. [Google Scholar] [CrossRef] [Green Version]


| Clusters | Sub-Clusters | Number of Isolates (Known Cluster Names Based on Microsatellite Assay and Countries of Origin) | |
|---|---|---|---|
| Microsatellite assay | Microsatellite I | 19 sub-clusters (Ia-n) | 61 isolates (Cluster MS I = South Asia/Middle East) |
| Microsatellite II | 3 sub-clusters (IIa-c) | 6 isolates (Cluster MS II = East Asia) | |
| Microsatellite III | 6 sub-clusters (IIIa-f) | 19 isolates (Cluster MS III = Israel, South Africa, Spain, Switzerland) | |
| Microsatellite IV | 6 sub-clusters (IVa-b) | 10 isolates (Cluster MS IV = Israel, South America) | |
| ITS sequencing | ITS I | NA | 80 isolates (Cluster MS I and III = South Africa, South Asia/Middle East, Spain, Switzerland) |
| ITS II | NA | 6 isolates (Cluster MS II = East Asia) | |
| ITS III | NA | 10 isolates (Cluster MS IV = Israel, South America) | |
| AFLP genotyping assay | AFLP I | 4 sub-clusters (Ia-d) | 39 isolates (Cluster MS I, II, III, IV) |
| AFLP II | 4 sub-clusters (IIa-d) | 57 isolates (Cluster MS I, II, III = East Asia, South Asia/Middle East, Spain) | |
| MALDI-TOF MS | MALDI-TOF I | NA | 11 isolates (Cluster MS III and Cluster IV = Israel, South America, Spain) |
| MALDI-TOF II | NA | 77 isolates (Cluster MS I, II, III, Cluster IV) | |
| MALDI-TOF III | NA | 2 isolates (Cluster MS III = South Africa) | |
| MALDI-TOF IV | NA | 2 isolates (Cluster MS II = Korea) | |
| MALDI-TOF V | NA | 2 isolates (Cluster MS I = Oman, Kuwait) | |
| MALDI-TOF VI | NA | 2 isolates (Cluster MS I, II = India, Japan) | |
| IR Biotyper | IR Biotyper I | 4 sub-clusters (Ia-d) | 78 isolates (Cluster MS I, II, III, IV) |
| IR Biotyper II | NA | 18 isolates (Cluster MS I, III = India, Kuwait, Malaysia, Spain, Switzerland, Turkey) |
| Method | ITS Sequencing | MALDI-TOF MS | AFLP | IR Biotyper | Microsatellites |
|---|---|---|---|---|---|
| ITS sequencing | 0.285 | 0.065 | −0.010 | 0.446 | |
| MALDI-TOF MS | 0.285 | 0.052 | −0.011 | 0.210 | |
| AFLP | 0.065 | 0.052 | 0.061 | 0.215 | |
| IR Biotyper | −0.010 | −0.011 | 0.061 | 0.330 | |
| Microsatellites | 0.446 | 0.210 | 0.215 | 0.330 |
© 2020 by the authors. Licensee MDPI, Basel, Switzerland. This article is an open access article distributed under the terms and conditions of the Creative Commons Attribution (CC BY) license (http://creativecommons.org/licenses/by/4.0/).
Share and Cite
Vatanshenassan, M.; Boekhout, T.; Mauder, N.; Robert, V.; Maier, T.; Meis, J.F.; Berman, J.; Then, E.; Kostrzewa, M.; Hagen, F. Evaluation of Microsatellite Typing, ITS Sequencing, AFLP Fingerprinting, MALDI-TOF MS, and Fourier-Transform Infrared Spectroscopy Analysis of Candida auris. J. Fungi 2020, 6, 146. https://doi.org/10.3390/jof6030146
Vatanshenassan M, Boekhout T, Mauder N, Robert V, Maier T, Meis JF, Berman J, Then E, Kostrzewa M, Hagen F. Evaluation of Microsatellite Typing, ITS Sequencing, AFLP Fingerprinting, MALDI-TOF MS, and Fourier-Transform Infrared Spectroscopy Analysis of Candida auris. Journal of Fungi. 2020; 6(3):146. https://doi.org/10.3390/jof6030146
Chicago/Turabian StyleVatanshenassan, Mansoureh, Teun Boekhout, Norman Mauder, Vincent Robert, Thomas Maier, Jacques F. Meis, Judith Berman, Euníce Then, Markus Kostrzewa, and Ferry Hagen. 2020. "Evaluation of Microsatellite Typing, ITS Sequencing, AFLP Fingerprinting, MALDI-TOF MS, and Fourier-Transform Infrared Spectroscopy Analysis of Candida auris" Journal of Fungi 6, no. 3: 146. https://doi.org/10.3390/jof6030146