
Beach Response to a Shoreface Nourishment (Aveiro, Portugal)
by
 , , , , and
Diogo Mendes
1,*,† ,
,
Joaquim Pais-Barbosa
2,
Paulo Baptista
1,
Paulo A. Silva
2 ,
,
Cristina Bernardes
1 and
Celso Pinto
3
1
Departamento de Geociências e Centro de Estudos do Ambiente e do Mar (CESAM), Campus de Santiago, Universidade de Aveiro, 3810-193 Aveiro, Portugal
2
Departamento de Física e Centro de Estudos do Ambiente e do Mar (CESAM), Campus de Santiago, Universidade de Aveiro, 3810-193 Aveiro, Portugal
3
Agência Portuguesa do Ambiente, I.P., Rua da Murgueira, 9, Zambujal, Alfragide, 2610-124 Amadora, Portugal
*
Author to whom correspondence should be addressed.
†
Current address: HAEDES, Casais do Arrocho, 2025-452 Azóia de Cima, Portugal.
J. Mar. Sci. Eng. 2021, 9(10), 1112; https://doi.org/10.3390/jmse9101112
Submission received: 1 September 2021
/
Revised: 29 September 2021
/
Accepted: 6 October 2021
/
Published: 13 October 2021
(This article belongs to the Special Issue Sediment Dynamics in Artificial Nourishments)
Abstract
:In Aveiro (NW coast of Portugal), a coastal monitoring programme was carried out in sequence of a shoreface nourishment intervention (over than 2 M m) performed in 2020. In this programme, almost one year of biweekly subaerial topographies and quarterly bathymetric surveys have been collected along a 10 km coastal stretch between June 2020 and June 2021. In this study, topographic and bathymetric surveys were analysed to assess the expectation that if the shoreface nourishment is located in sufficiently shallow water depths, its landward movement will feed adjacent beaches and, consequently, increase the subaerial beach volume. Results show that the subaerial beach volume is well correlated with the 1.05 m (above MSL) isoline displacement through time. While the seaward limit of the shoreface nourishment moved landwards about 200 m, the shoreline proxy (isoline of 1.05 m) displayed a maximum seaward displacement of 60 m. The displacement of the shoreline proxy was highly variable in space, along the 10 km coastal stretch, and also in time, during storm events. During such events, both landward and seawards displacement of the shoreline proxy took place, depending on the spatial position. Moreover, while beaches close to the initial shoreface nourishment intervention displayed faster accretion patterns than those located farther away, the well-defined onshore movement of the shoreface nourishment did not result in a considerable beach volume increase. The achieved results were also compared against case studies of shoreface nourishments with similar volumes performed worldwide.
1. Introduction
Beach nourishment constitutes a nature-based engineering solution commonly employed by coastal managers on sandy beaches [1]. It comprises the placement of large quantities of good quality sand on the beach to advance it seaward [2]. This advance is of key importance for tourism and recreation because it provides enough space on the dry beach for this type of activities. In general, urbanized beaches, such as those located or backed up by buildings and infrastructures, are the most prone to be improved with sand nourishments because a municipality tax revenue can be used for such interventions (e.g., [2]). The sand can be either placed on the subaerial beach or in the subtidal beach, as an underwater mound. While the former is usually referred in the literature as a beach nourishment, the latter can be referred as profile nourishment [2], berm nourishment [3], nearshore berm [4] or shoreface nourishment [5]. In this study, shoreface nourishment was used to designate the placement of sand in the subtidal zone of a beach profile.
Following Dean [2], a shoreface nourishment has two advantages compared to beach nourishment. First, the dredging-dumping operation is less expensive (e.g., [6]). Second, it is associated with less restrictive policies regarding sediment quality characteristics. Unlike beach nourishments, shoreface nourishments can use sediments that are dredged from nearby navigation channels, subtidal bars or offshore deposits. Though, there are some examples that sediments dredged from navigation channels are used for beach nourishment [7]. As an example, a large beach nourishment intervention (1.5 × 10 m) was performed in Dunkirk, France, using sediments dredged from a nearby navigation channel but with a median grain size () coarser than those of the native beach [8].
Beach nourishment has been employed throughout the world. In the US, beach nourishment has been used since 1923 with an exponentially growth in sand volume placement by the end of the last century [9]. In Europe, beach nourishment interventions started after 1950. In the last decades, it has been a gradual change from the use of hard to soft coastal protection/defense techniques both for short-term and long-term coastal planning [10]. In Australia, beach nourishment interventions are generally smaller in scale but more frequent and mainly begin in spring to promote beach accretion [11]. In China, beach nourishment was first introduced in 1990 and the number of beach nourishment interventions has also show an exponential increase between 1990 and 2010 [12]. Despite the overall use of beach nourishment on sandy beaches, this solution can also be used in complex reef environments associated with irregular bathymetries [13,14].
In Portugal, the first beach nourishment intervention was performed in 1950 [7]. A recent review and compilation of beach nourishment practice in Portugal has shown that the main objectives are shoreline stability and erosion mitigation [7]. Nourishment interventions have been mainly performed with sediments dredged from maintenance channels’ dredging. Moreover, there has been an increasing tendency to use soft engineering techniques in opposition to hard engineering solutions [7]. The largest shoreface nourishment intervention ever made in Portugal, before that reported in this study, took place in Aveiro in 1996 where a sand volume of 1.7 × 10 m was deposited nearshore. Sediments were dredged from the navigation channel of the Aveiro lagoon and were placed southwards at Costa Nova beach. Shoreline stability was the objective of this intervention. Previous works conducted in Aveiro associated with shoreface nourishments observed cross-shore volume variations of up to 1500 m/m (e.g., [15]), which suggests that this coastal stretch is morphologically very dynamic.
Following Brutsché et al. [4], pioneer shoreface nourishment interventions, undertaken between 1930 and 1940 in the US, raised some doubts about their overall effectiveness. Besides the observed sediment accretion near the shoreface nourishment, sediment erosion took place near the shoreline. These initial results postponed the use of shoreface nourishments until late 1960. Later on, the effectiveness of shoreface nourishments started to become documented. As an example, observations indicated that a shoreface nourishment located in Durban (South Africa) provided shelter to beaches [16]. Those beaches that were located on the lee side of the shoreface nourishment experienced up to 25% less erosion than those that were not. Nowadays, shoreface nourishments constitute a viable solution from a technical perspective [2]. However, stakeholders and the general public can still be reluctant to this type of solutions because they cannot be easily seen from the dry beach. Even though, the large number of shoreface nourishment interventions after 1940, that were documented in [4], provides some confidence that they are becoming better accepted.
Beach nourishment design, construction and subsequent monitoring is well documented in the literature (e.g., [2]). On the contrary, shoreface nourishment interventions are less well understood. In particular, shoreface nourishments can behave in two ways [2]. The shoreface nourishment can be placed in sufficiently deep water depths so that it remains there in time, usually referred as a stable berm. The stable berm main objective is to reduce storm damage relative to the level of damage that would have resulted without the nourishment. The shoreface nourishment can also be placed in sufficiently shallow water depths so that it moves landwards, usually referred as a feeder berm. The main goal of a feeder berm is to feed adjacent beaches with sand. The hypothesis is if a shoreface nourishment is placed in sufficiently shallow depths, its onshore movement will continuously promote beach accretion, through an increase in the subaerial beach width or volume. In this study, field observations associated with a coastal monitoring program were analysed to assess the spatial and time evolution of a large (2 × 10 m) shoreface nourishment intervention that was deployed between −10 m and −6 m (Mean Sea Level, hereafter MSL) water depths in Costa Nova (Aveiro, Portugal). In particular, this dataset was used to test the hypothesis just mentioned.
This paper is structured as follows. A review of previous works on shoreface nourishment interventions with a considerable volume (>0.8 × 10 m) is performed in Section 2. The characterization of the study site and of the shoreface nourishment intervention, together with a description of the field data collection, processing and analysis is presented in Section 3. The results of the shoreface nourishment subtidal evolution and of the subaerial beach shoreline proxy evolution are presented in Section 4. In Section 5, a discussion is performed in light of the hypothesis that shoreface nourishment interventions that moved landwards can increase the subaerial beach width or volume. The discussion in Section 5 also compares the results analysed in this work with other shoreface nourishments performed elsewhere. Conclusions are summarized in Section 6.
2. Previous Works on Shoreface Nourishments
Five shoreface nourishment interventions were reviewed in this Section. They were chosen from a recent review on shoreface nourishments [4] and from a review of beach nourishment experience in Europe [10]. The five chosen shoreface nourishments were selected based on two criterion. First, shoreface nourishments had an overall volume > 0.8 × 10 m, to be comparable with that reported in the present study (2 × 10 m). Second, the chosen shoreface nourishments had ready-available and well-documented general characteristics, such as shoreface nourishment length (L) and placement water depths (h) (Table 1). It was noted that a shoreface nourishment of 8.2 × 10 m was performed in Anglet, France [10] but, unfortunately, its general characteristics were not available. The shoreface nourishment of 2.0 × 10 m performed in Rio de Janeiro, Brazil, [17] was also excluded because the project not only included a shoreface nourishment but also a beach nourishment. Consequently, the overall beach response was not solely due to the shoreface nourishment. Moreover, the interesting case study in Denmark [18], where a comparison between a beach and a shoreface nourishment was conducted, was also excluded because the shoreface nourishment volume was 0.25 × 10 m.
In 1992, a shoreface nourishment of about 1.0 × 10 m was built at Newport Beach, California, US [19]. The shoreface nourishment was placed in water depths between −4 to −9 m (MSL). Offshore wave conditions along the California coastline are characterized by an averaged offshore significant wave height () that ranges from 1.75 m to 3.5 m in summer and in winter, respectively. Large swell waves generated in the Pacific Ocean are common at this site with an averaged peak wave period () of 12.3 s [20]. During storms, can reach or exceed 5 m offshore but it is effectively reduced due to Channel Islands sheltering effect close to Newport Beach [20]. The wave-induced sediment transport is towards the southeast direction [19] and the tidal range is about 2 m during spring tides. Overall, this nourishment moved onshore likely due to wave action. While the outer limit of the shoreface nourishment moved about 180 m onshore, the MSL contour moved offshore (i.e., beach width increase) about 30 m in 2.5 yr (Figure 2 in [19]). Moreover, the analysis of profile surveys displayed no indication of an alongshore shoreface nourishment movement [19].
All the other shoreface nourishments in Table 1 were performed in The Netherlands. The wave climate along the Dutch coast is associated with an average significant wave height of 1.0 m during summer, which increases to 1.7 m during winter [21]. Winter storms are typically associated with an of 4 to 5 m and a of 10 s. The net sand transport rate ranges between 0.25 × 10 m up to 0.6 × 10 m [22]. The Terschelling shoreface nourishment displayed a complex behaviour with both offshore and onshore movement of the intermediate bar after nourishment (Figure 7d in [6]). The other shoreface nourishments performed in the Dutch coast (Terheijde, Egmond and Wassenaar) displayed an overall onshore movement of about 100 m in 4.5 yr for Wassenaar, about 100 m in 2 yr for Egmond and about 150 m in 3 yr for Terheijde. The MSL contour varied less than about 20 m for all four shoreface nourishments.
The values associated with onshore and offshore shoreface nourishments’ displacement are summarized in Table 2. The shoreface nourishment onshore displacement increases for a more energetic wave climate. The MSL contour seaward displacement is much smaller (<20%) than the outer part of the shoreface nourishment landward movement, independently of the offshore wave conditions.
3. Case Study and Field Observations
3.1. Brief Description of the Coastal Settings
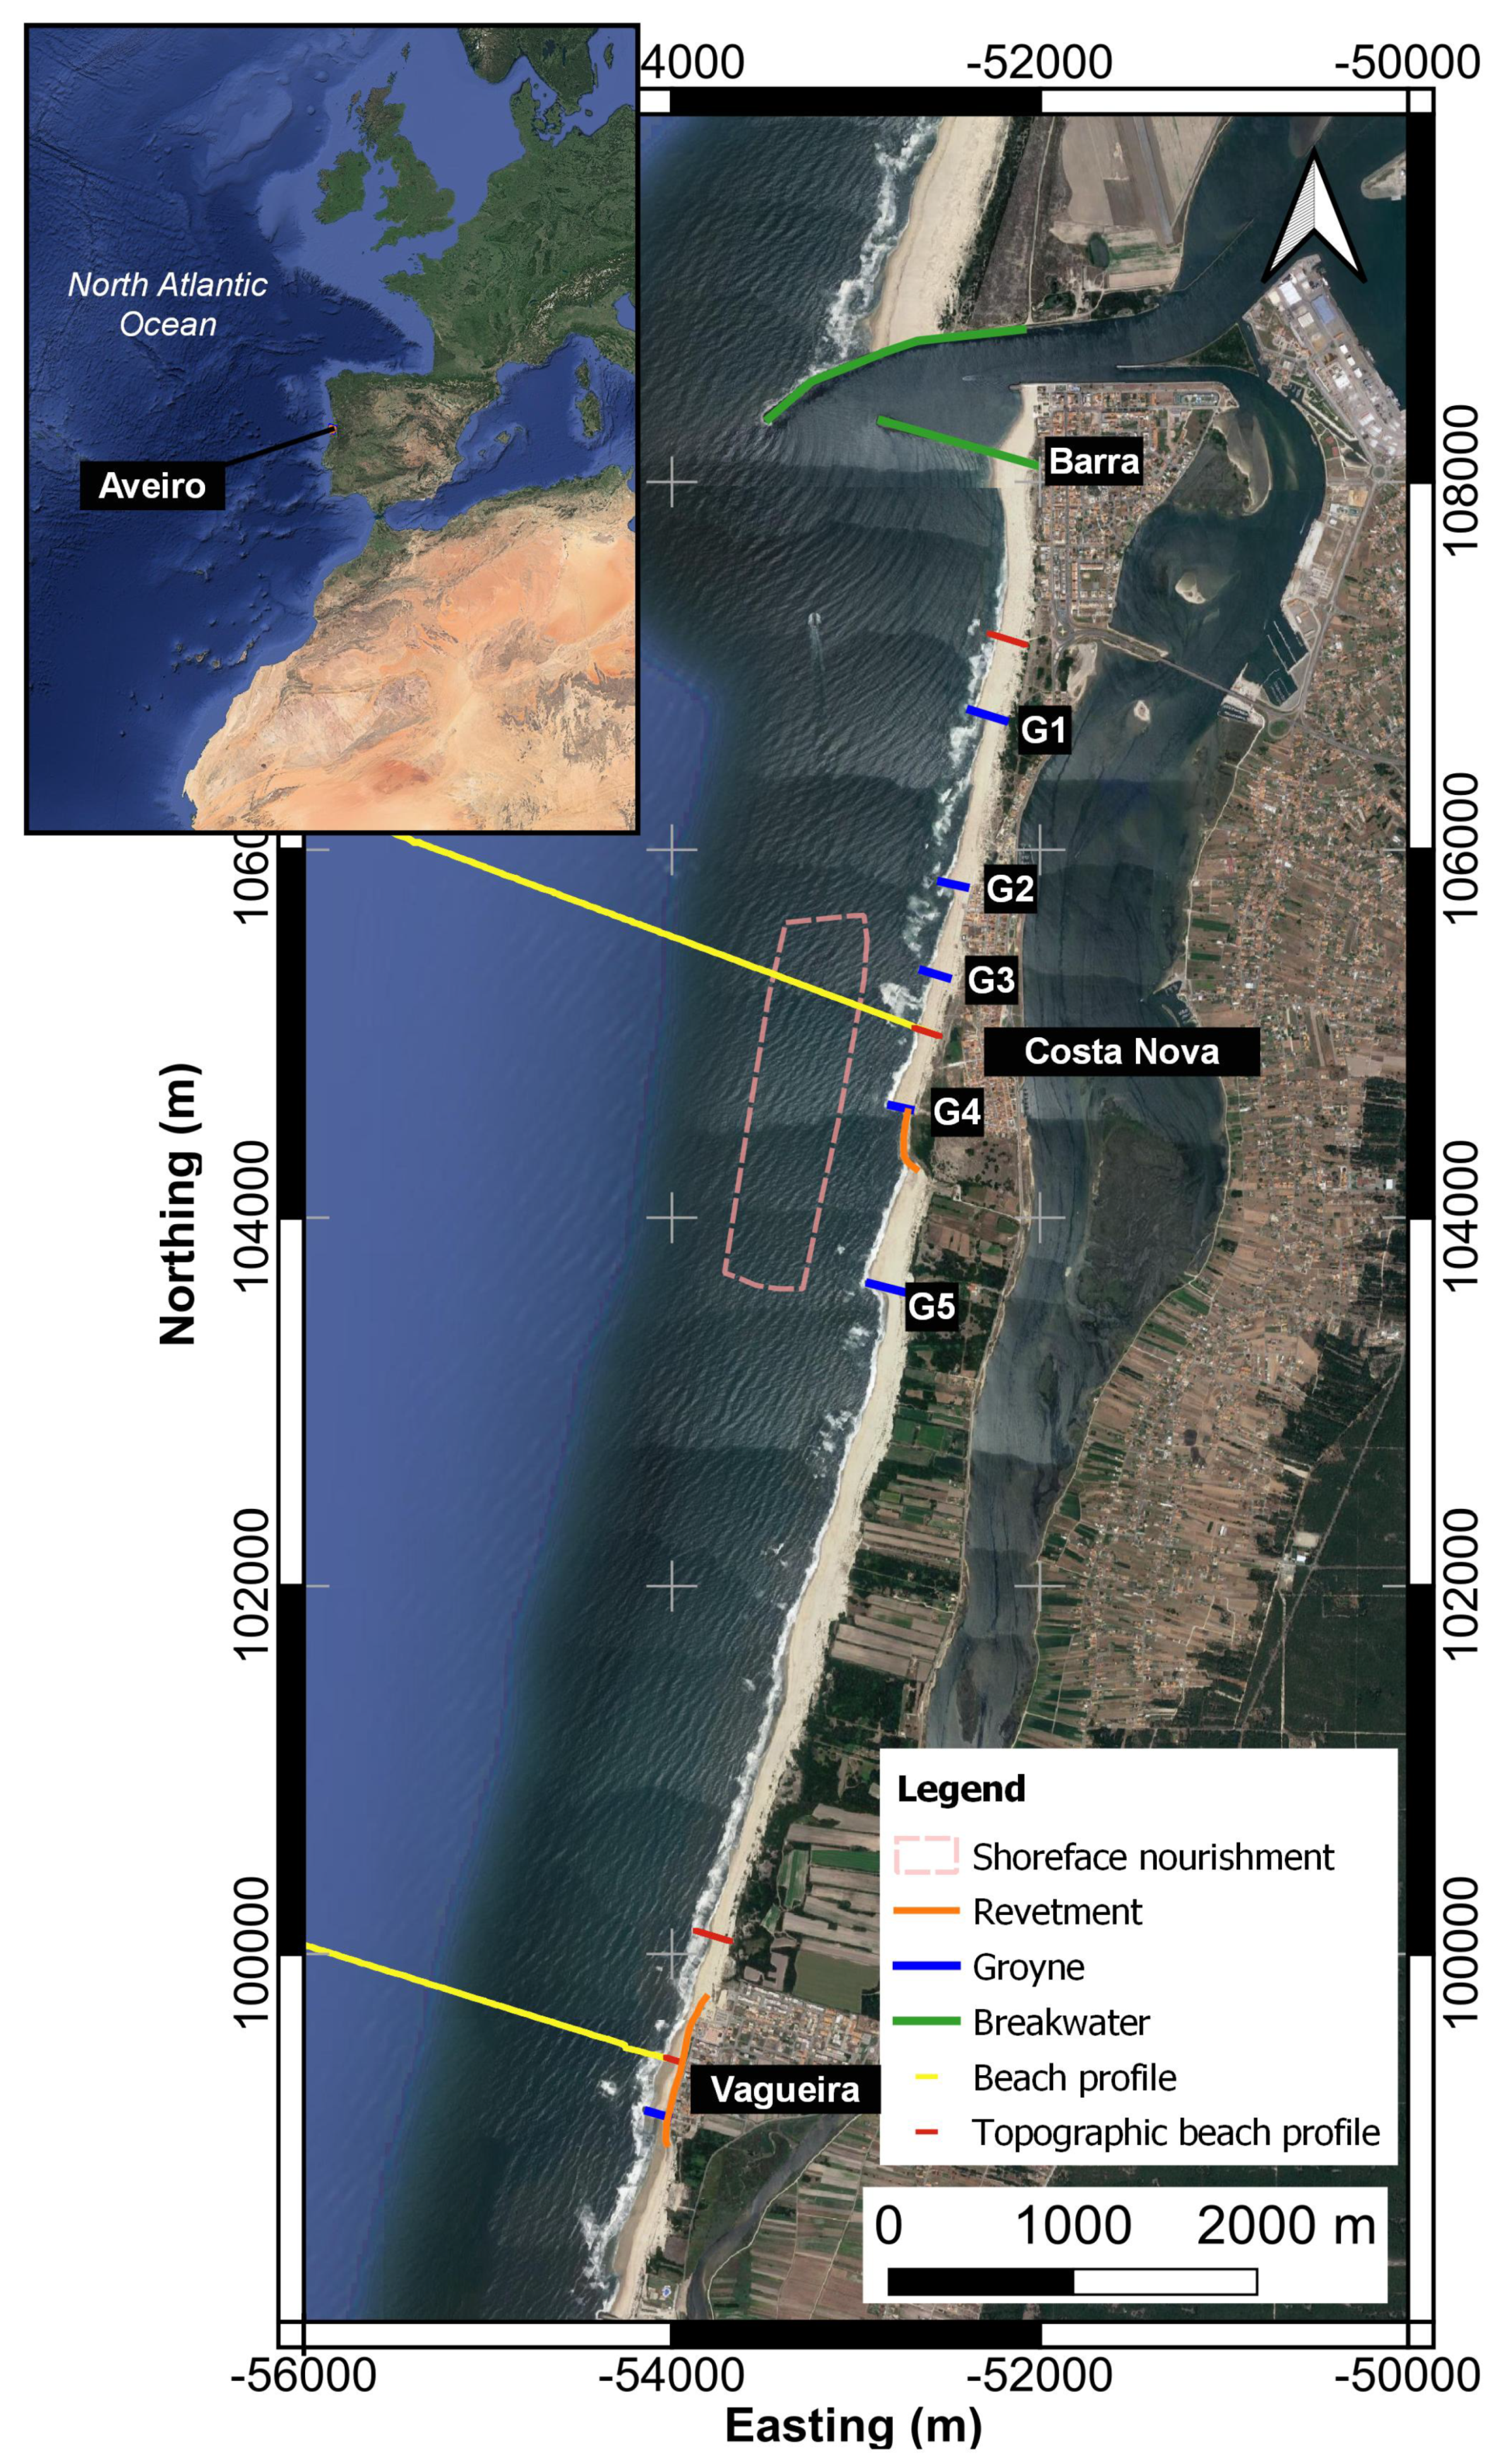
The study area is located south of the Aveiro harbour entrance (Barra), and extends up to 10 km towards south until Vagueira beach (Figure 1). The coastline orientation is approximately 15 N. Coastal defense works along the study area (Figure 1) comprise two breakwaters near the Aveiro harbour entrance (white), six groynes (blue) and two revetments (orange). The beach is delimited by groynes at Costa Nova (between Barra and G5) and it is backed-up by dune systems southwards of G5. At Vagueira, the beach is both confined by one revetment and one groyne. The reader is referred to [23] for a more in-depth characterization of the study area.
Based on an analysis of field measurements collected by deep-water wave buoys offshore mainland Portugal [24], the offshore has a monthly-averaged value of 1.7 ± 0.7 m during maritime summer and increases to 3.1 ± 1.3 m during maritime winter. The monthly-averaged values of mean wave period oscillate between 6.0 ± 1.0 s and 8.0 ± 1.7 s along the year, with large swell waves easily reaching 20 s of during winter. The most frequent mean wave direction is from NW, with some sea states displaying a mean wave direction from W. On average, five to fifteen coastal storms ( threshold of 4.5 m) hit the study site per year [25]. Tidal range varies from approximately 1.2 m to 3.6 m during neap and spring tides, respectively. The most frequent northwestern wave conditions can promote a net potential sediment transport rate of about 1 × 10 m/yr directed towards south [26].
According to numerical modelling results [27], the coastal stretch south of Aveiro after 25 years of reduced sediment supply, critical situations of imminent sand-spit disruption are expected, as well as an ultimate linkage between the sea and the lagoon. The scenarios of sea level rise (SLR) are less important than the scenarios of wave-climate change after 25 years. A slight increase in the relative frequency of higher waves would have greater effects than a pessimistic scenario of the SLR rate.
Morphodynamically, the beach profile can be characterized as intermediate [28]. A well-defined subtidal bar is often present on the shoreface which induces partial depth-induced breaking of incoming waves. On the foreshore, the beach slope is mild during low tide and steep during high tide. Intertidal beach sediments are typically composed by fine to medium sand with a median grain size between 0.4 mm to 0.6 mm [29].
3.2. Shoreface Nourishment Intervention
The shoreface nourishment intervention comprised the dumping of sediments, dredged from the Zona de Atividades Logísticas e Industriais (ZALI) deposition area located inside the Aveiro harbour, between groynes 3 and 5 (G3 and G5 in Figure 1). These groynes are located at Costa Nova beach. Consequently, the beach response to the shoreface nourishment at Costa Nova is of particular interest because it is located closer to the intervention. The intervention was materialized by an underwater mound with a length of 1900 m and a width of 500 m. The shoreface nourishment was placed in water depths between −6 m to −11 m (MSL). At the end of the intervention, the mean water depth at the flat top of the underwater mound was −6 m (MSL). Sediments that were dumped at that location were compatible with native sediments but slightly coarser because the former were dredged in part from the Aveiro harbour entrance channel [30]. According to the Aveiro harbour authority, dredging works have started in May and last until August 2020. The analysis of the available multibeam surveys performed on June 2020 and on August 2020 allowed to detect a volume increase of 1.9 × 10 m at that location. This calculation was performed based on the August 2020 survey coverage area with reference to the depth of closure which is −10 m (MSL) (see Section 4.1).
3.3. Methodology
3.3.1. Data Collection
Bathymetric surveys were performed with the research vessel Nereide from Centro de Estudos do Ambiente e do Mar (CESAM). This vessel can be equipped with a single beam or a multi-beam echo-sounder. The multi-beam survey was performed in an area pre-defined by the Portuguese Environment Agency (hereafter APA). The single beam survey was performed along the study area through cross-shore transects with a 500 m spacing (Figure 1). The vertical accuracy of the single-beam surveys is approximately 0.10 m. Part of the surf zone was not surveyed due to wave conditions at the study site. The bathymetric surveys were performed on July 2020, on September 2020 and on January 2021 (see Figure 4, below).
Topographic surveys were performed using a quad-bike equiped with the INSHORE monitoring system [31,32]. This allows a horizontal and vertical accuracy better than 0.05 m (see Baptista et al. [31]). Topographic surveys were performed approximately biweekly from September 2020 to June 2021 along the 10 km coastal stretch (from Barra to Vagueira in Figure 1). These surveys were performed during low-water on spring tides and each took between 3 h to 4 h to be completed. Each topographic survey was performed through cross-shore beach transects with a spacing between 30 m to 80 m and through longshore transects that accounted for the water line, berm crest and dune base, with a maximum spacing of about 30 m. These topographic surveys were used to extract the 1.05 m isoline that was analysed in Section 4 (Figure 5, Figure 6 and Figure 7, see below).
At approximately 55 km northwest of the study site, offshore wave conditions were obtained from the Copernicus Marine Service (CMEMS, https://marine.copernicus.eu/, accessed on 28 June 2021). The wave parameters were , and the mean wave direction (). The numerically generated wave data was carefully compared against buoy and satellite observations (see CMEMS report and assessment [33]).
3.3.2. Data Processing and Analysis
For the bathymetric surveys, the acquired data was processed with Caris software (version 9.5). The obtained XYZ coordinates were interpolated in the QGIS software to produce a digital elevation model (DEM) with a horizontal resolution of 5 m using a Triangular Irregular Network (TIN) interpolation method. For the topographic surveys, the acquired data was processed with a set of dedicated software, namely the Trimble Business Center (version 5.32, www.trimble.com, accessed on 10 October 2021) to GPS data process and the Matlab (version R2020a) to estimate the inclination angles (i.e., the attitude) of the GPS antennas in the quad-bike for each sample period. The obtained XYZ coordinates were interpolated in the ArcGIS software to produce a DEM with a horizontal resolution of 1 m using a Kriging interpolation method.
The analysis conducted in this study used a set of cross-shore transects with a spacing of 50 m that were extracted from the generated DEM between Barra and Vagueira. These transects were perpendicular to the main coastline orientation (15 N). The extraction of cross-shore transects with a 50 m spacing allowed to analysed in more detail the spatial variations of the beach response in time along the coastal stretch.
3.3.3. Additional Data Sources
To complement the analysis conducted in this study, additional data sources were used. These sources were all the available topo-bathymetric surveys, beach profile surveys and topographic beach surveys obtained between July 2018 and November 2020 under the Portuguese COaStal MOnitoring Programme (COSMO), developed and implement by APA (https://cosmo.apambiente.pt/, accessed on 28 June 2021) [34]. Moreover, a bathymetric survey provided by the Aveiro harbour authority was also used in this study. The latter was performed right after the shoreface nourishment intervention on August 2020 and it covered the area in Figure 1 (dashed white line).
4. Results
4.1. Depth of Closure and Beach Volume Based on a Shoreline Elevation Proxy
The beach profile surveys, obtained before the shoreface nourishment through the COSMO programme, were used to estimate the elevation associated with the depth of closure in the study area. The beach profile surveys were conducted with a wave runner in the submerged part, thereby surveying the entire surf zone, and by foot on the intertidal and aerial part. In Figure 1, the guide lines of the submerged part of the beach profile survey are displayed in yellow. The available profiles were located near Costa Nova beach (between G3 and G4) and at Vagueira beach.
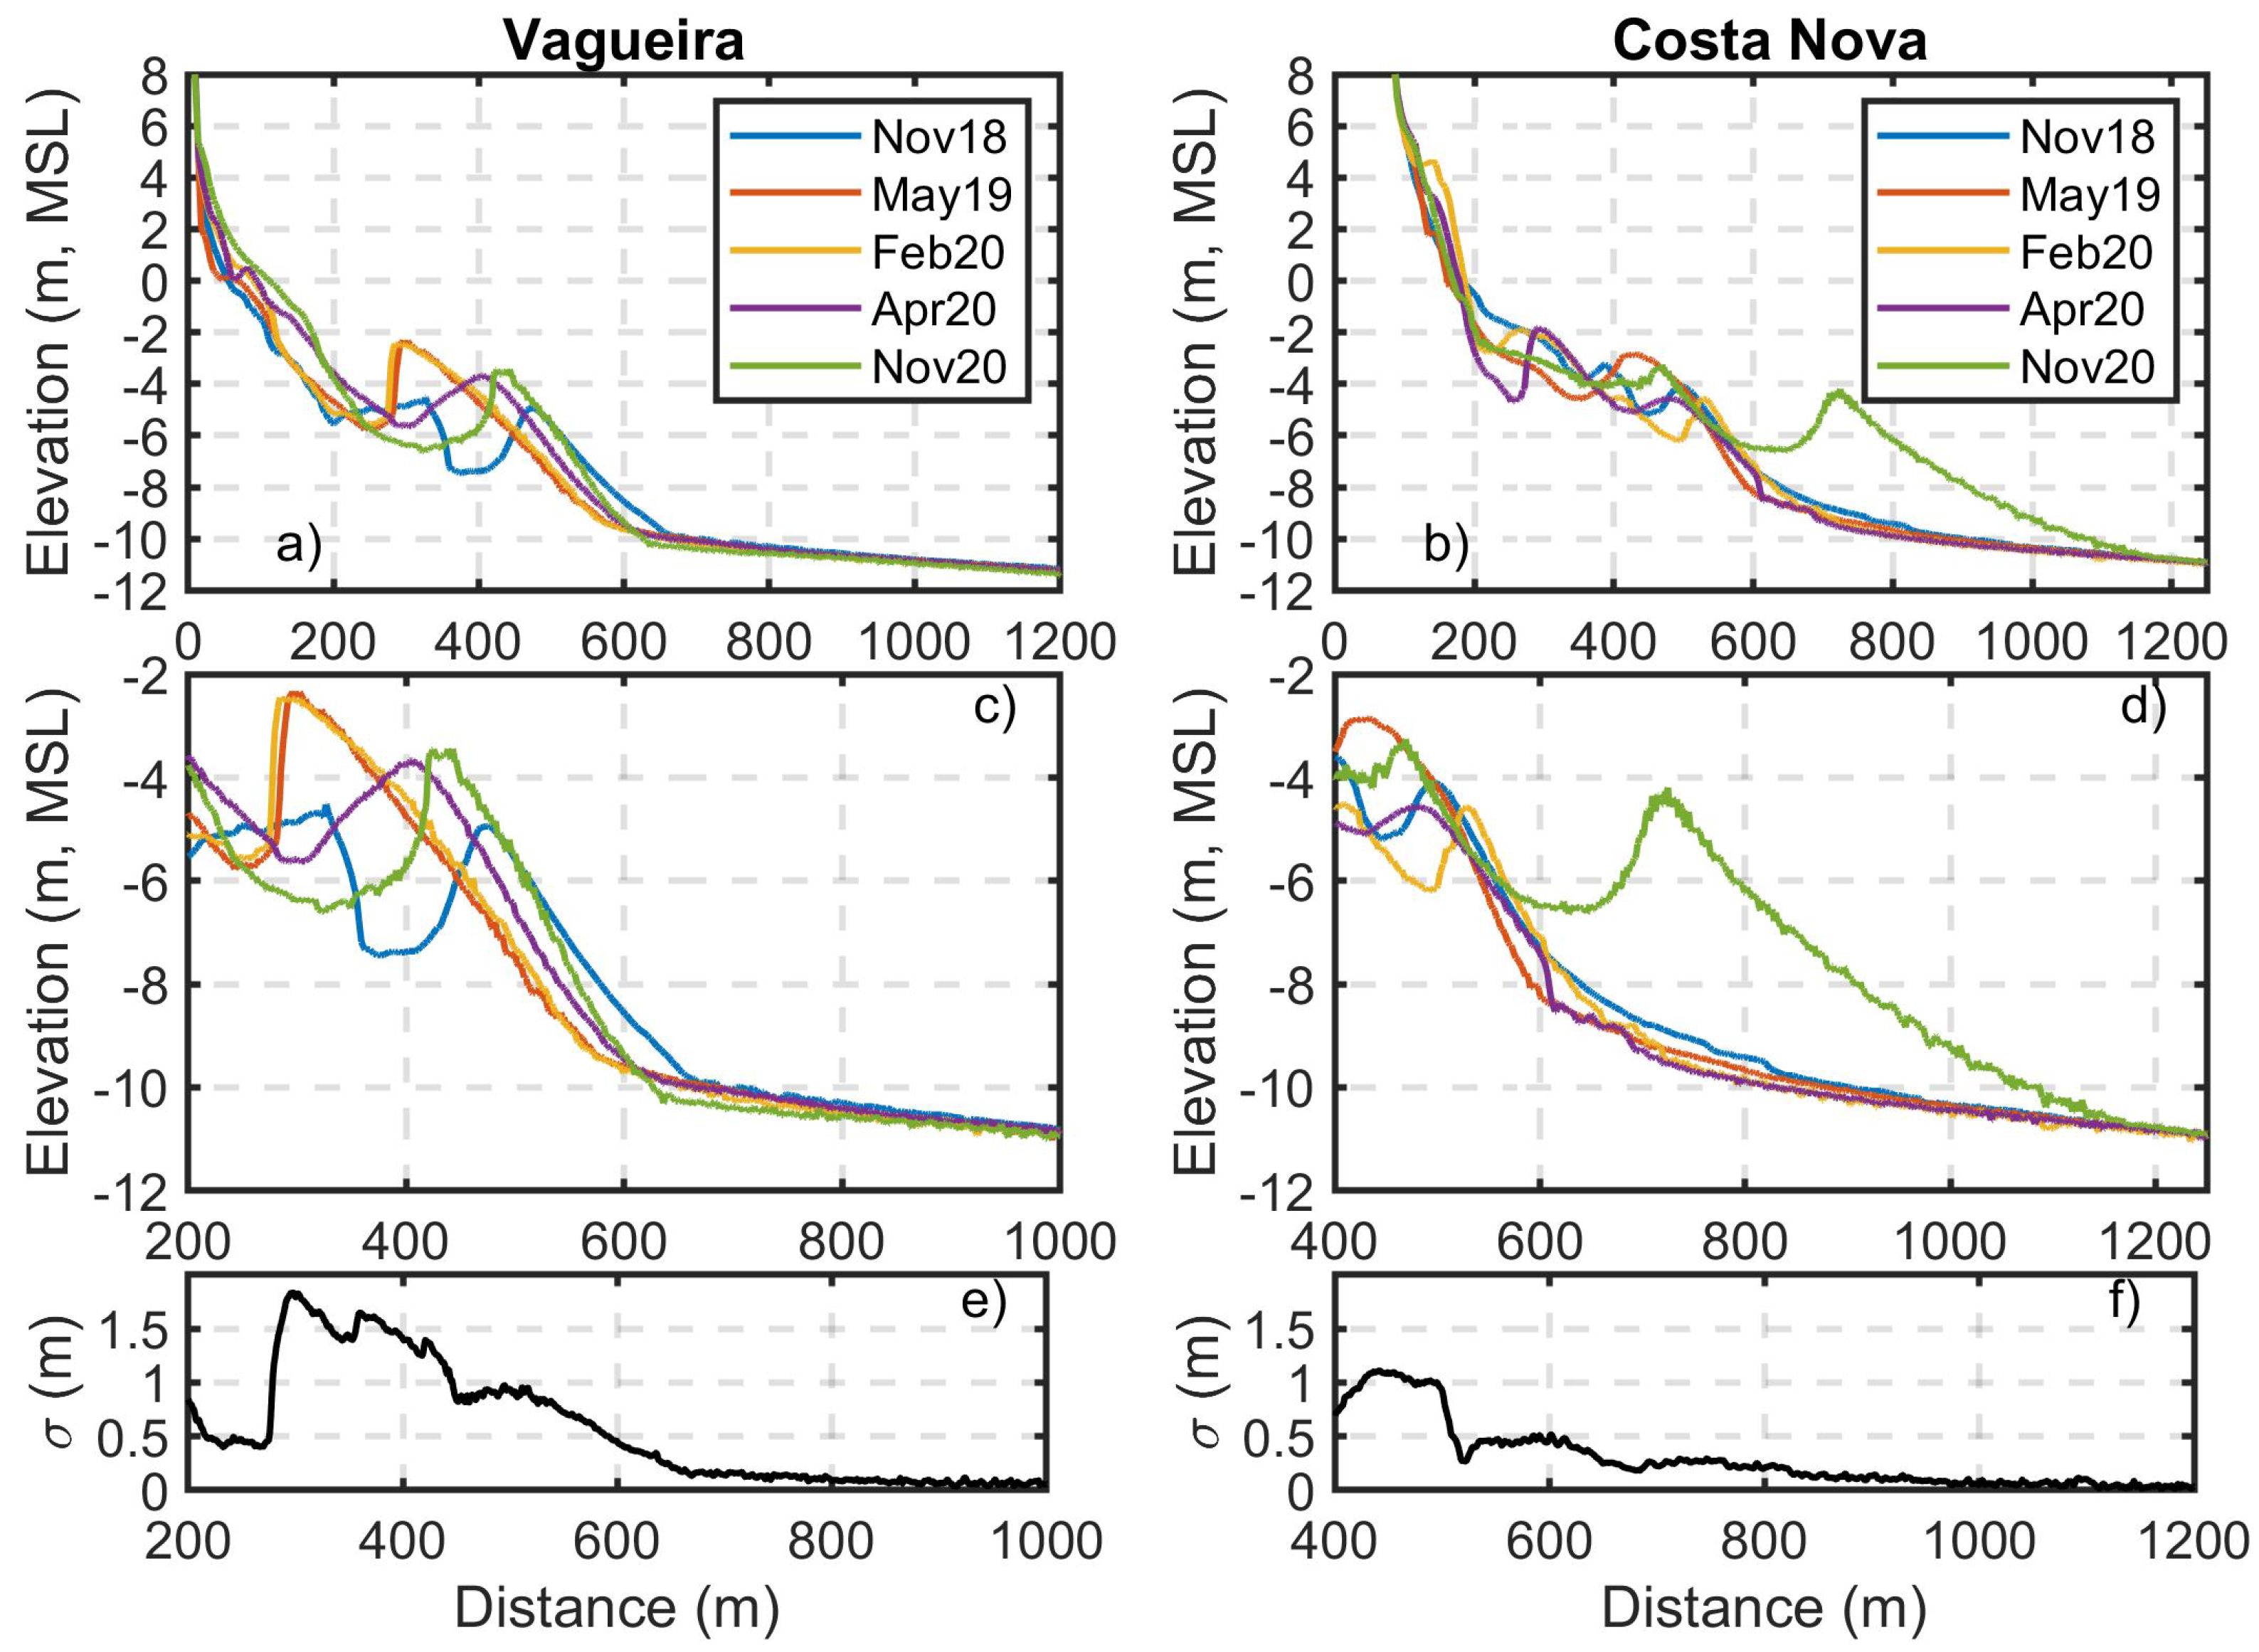
Figure 2 shows the beach profile surveys for Vagueira (left) and Costa Nova (right). The bottom panels display the standard deviation of the beach profiles. At Vagueira, the standard deviation rapidly increases from its offshore value of less than 0.20 m to values larger than about 0.50 m (Figure 2e). In more details, the standard deviation has an inflexion point for distance equal to 650 m. This inflexion point is associated with an elevation of −10 m (MSL). At Costa Nova, it is clear that the November 2020 profile has an influence of the shoreface nourishment (Figure 2b,d) and it was not used in the standard deviation calculation. A similar analysis performed on Costa Nova beach profile also suggests that the elevation −10 m (MSL) is associated with very small morphological changes (less than 0.20 m) (Figure 2d). Therefore, the analysis of the COSMO profiles allowed to estimate a depth of closure of −10 m (MSL) for this study site. Note that the shoreface nourishment intervention led to morphological modifications up to −11 m (MSL) at Costa Nova (November 2020 in Figure 2a,b) but this was due to the intervention and not due to the natural beach behaviour (see Figure 4 of [35]).
Also available through the COSMO programme were four subaerial topographic profiles that can be found along the coastal stretch depicted in Figure 3 (see also red lines in Figure 1). The profiles were collected between August 2018 and October 2020 every 3 months. Therefore, the seasonal subaerial beach variability throughout is well captured. These field measurements were used to understand how well the displacement of an elevation in time can represent the beach volume temporal evolution. Beach profiles display an elevation (about 5 m, MSL) above which the morphological variations are smaller than 0.3 m (top panels in Figure 3). An exception is the beach profile Vagueira 2 because it is located in front of a revetment. The beach volume (per unit width) for Barra, Costa Nova and Vagueira 1 was determined as the area above MSL until the point in which the profiles converge (5 m, MSL), see Figure 3. For Vagueira 2, the beach volume (per unit width) was calculated as the volume above MSL that is delimited by the revetment toe (distance = 25 m, Figure 3). Next, it was assessed how well the displacement of several isolines (ranging from 0 m to 5 m) through time can describe the temporal beach volume variations. The middle panels of Figure 3 show the correlation coefficient between those two quantities. In general, the onshore-offshore displacements of isolines between 1 and 3 m are well correlated with the beach volume variations. For the Vagueira 1 beach, this is not the case and there is a well-defined maximum of the correlation coefficient around 1 m. Motivated by this maximum and since other beach profiles have also correlation coefficients higher than about 0.9 for 1 m, the following shoreline proxy was used: the 1.05 m (MSL) contour, for two reasons. First, this contour is capable of describing well the temporal variations of beach volume for the four beach profiles located across the coastal stretch (bottom panels of Figure 3). Second, the 1.05 m (MSL) contour is the averaged value of the high-tide at Aveiro tidal gauge, which corresponds to the shoreline [36]. Therefore, the displacement of the 1.05 m (MSL) contour will be used to characterize the subaerial beach response to the shoreface nourishment in time and in space.
4.2. Subtidal Beach Response to the Shoreface Nourishment
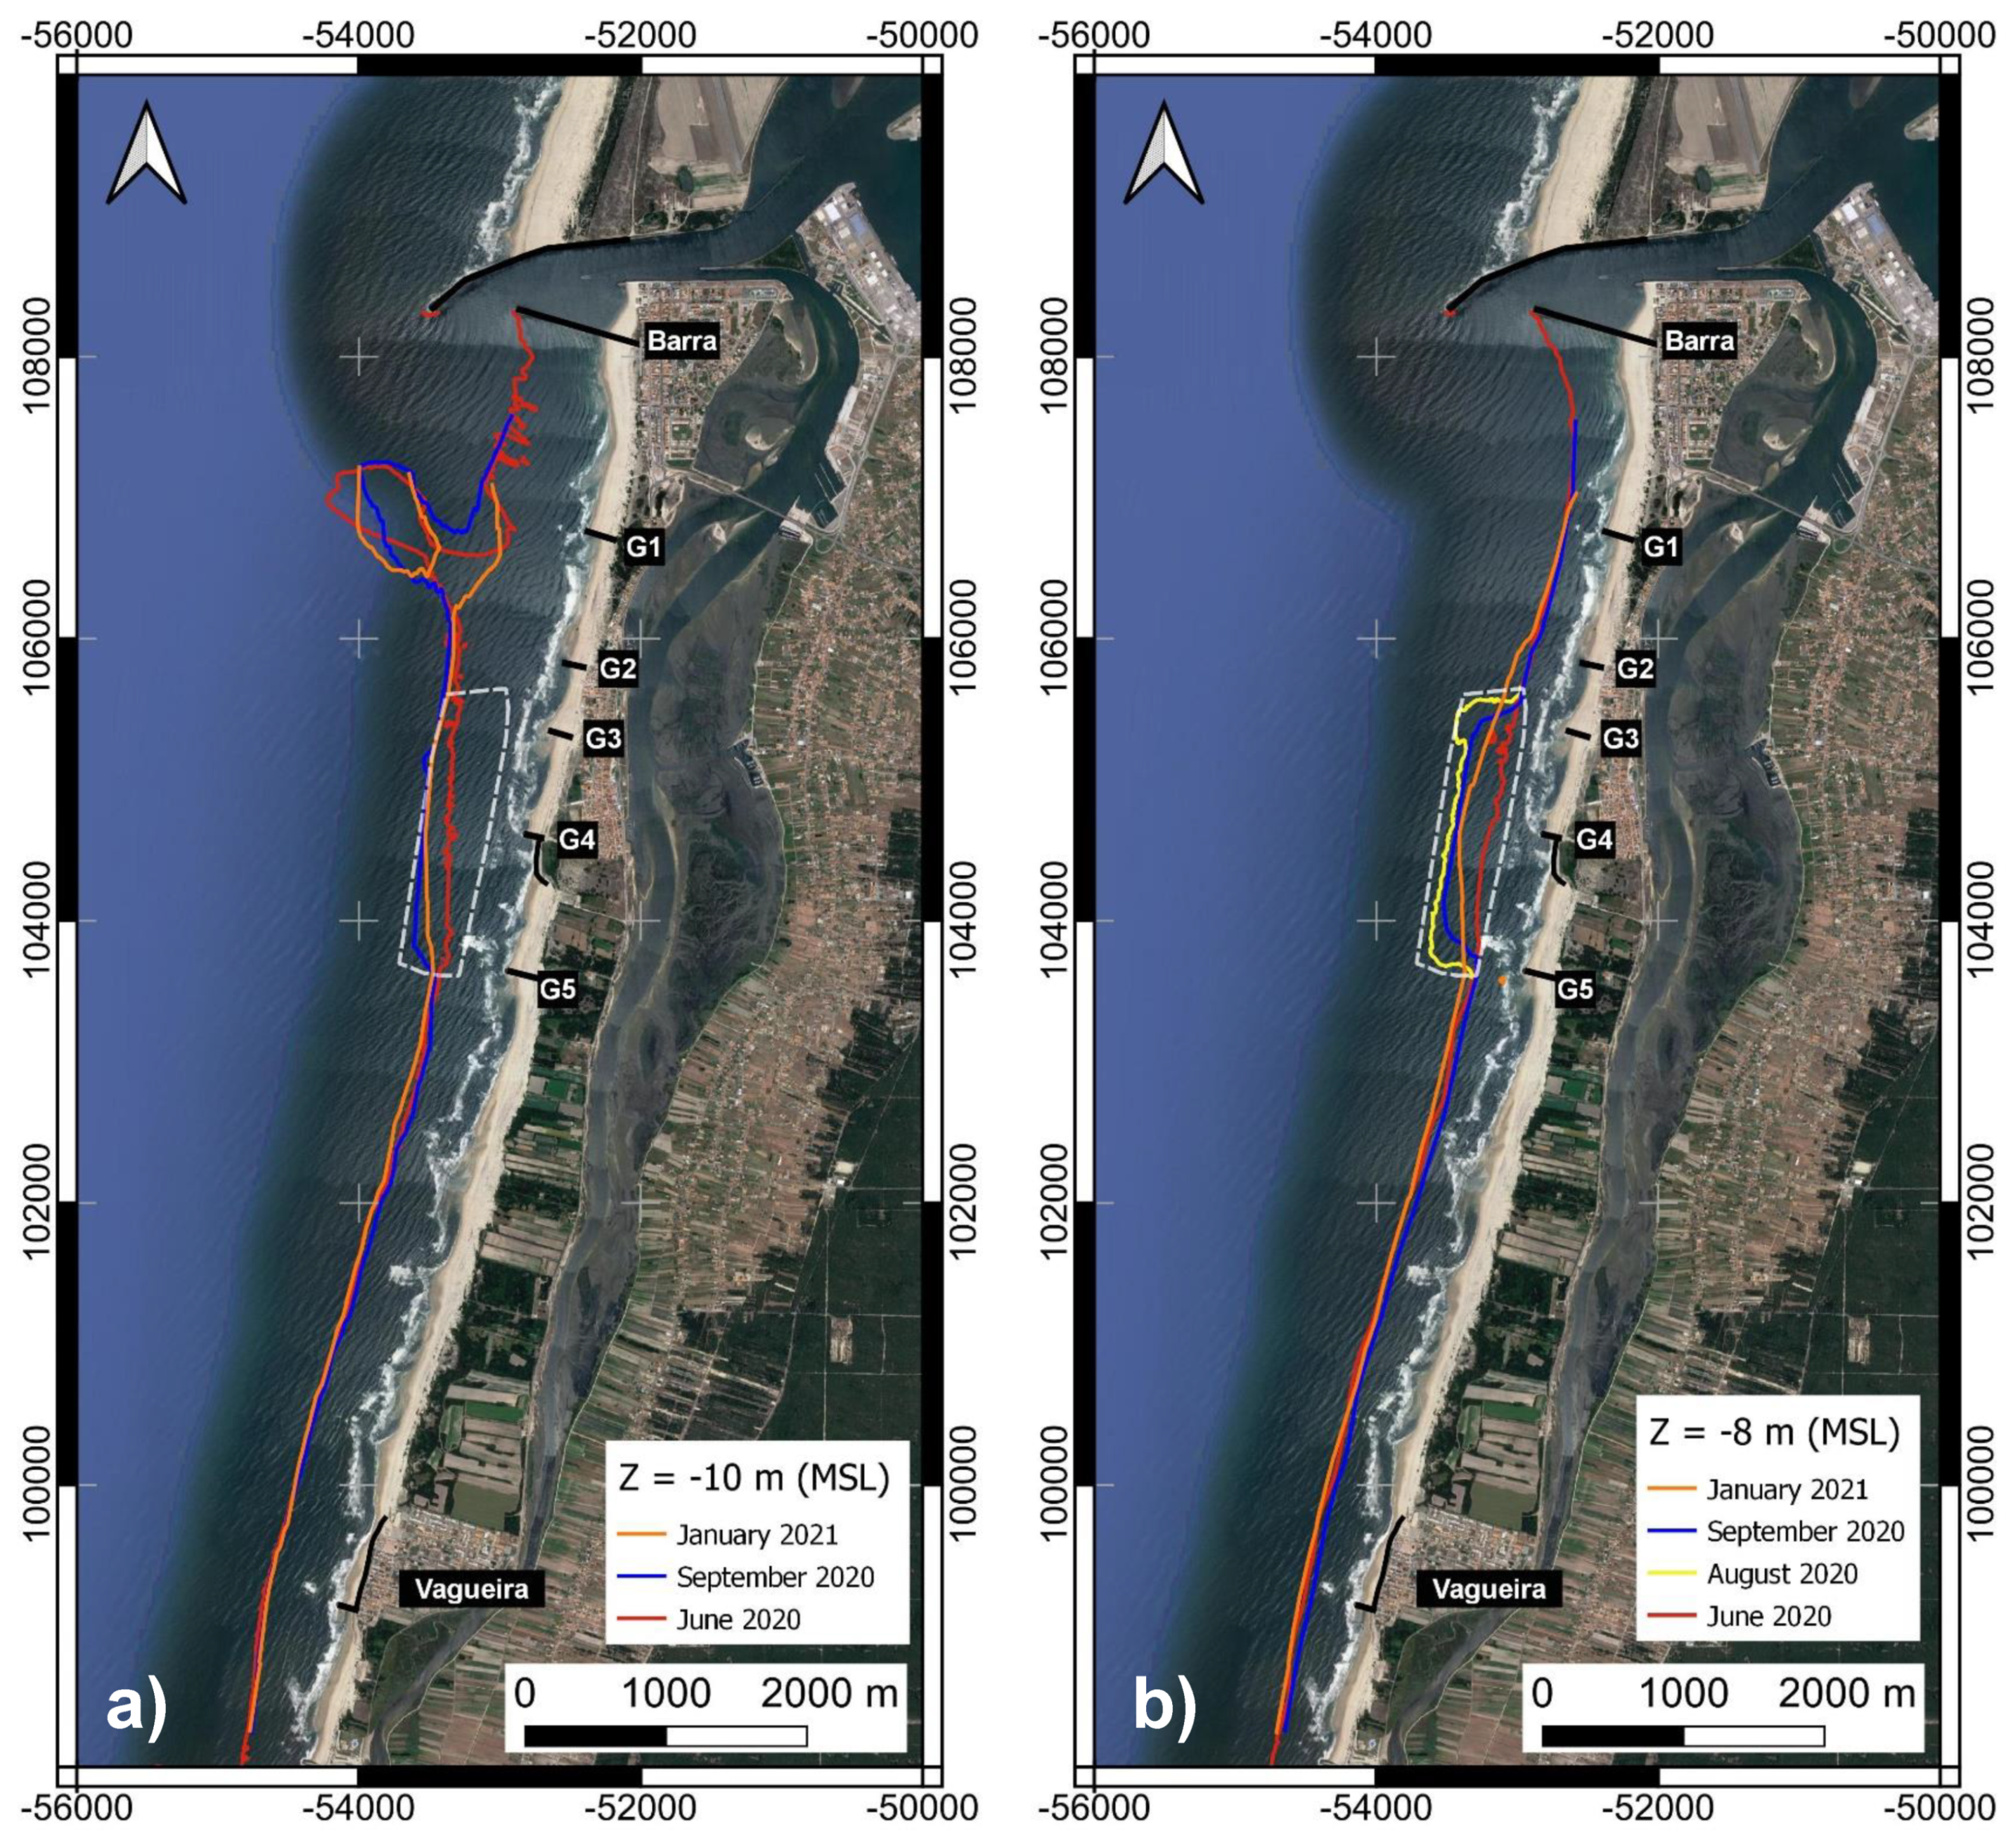
Figure 4 shows the temporal evolution of the −10 m and of the −8 m (MSL) contours along the coastal stretch between June 2020 (previous to the nourishment) and January 2021. The initial sediment deposition zone, between G3 and G5, is obtained from the August 2020 multibeam survey provided by the Aveiro harbour administration.
Since the closure depth was disturbed by the shoreface nourishment intervention, its onshore or offshore displacement is associated with the shoreface nourishment movement through time. As an example, if the isobathymetric contour of −10 m (MSL) does not change in time, it means that the shoreface nourishment is relatively stable. On the opposite, if the −10 m (MSL) contour moves landward, it means that the shoreface nourishment moved towards the coast. To complement the analysis, the −8 m (MSL) contour was also used. The latter is expected to have a larger displacement in space than the −10 m (MSL). Other less deep contours were also envisaged but they were more influenced by the bar movement that occurred southward and northward of the initial shoreface nourishment area. Consequently, the shallower isobathymetric contours will not be considered hereafter.
Regarding the −10 m (MSL) contour, its offshore displacement ranged between 250 m at the southward end to 120 m at the northward end of the initial deposition zone (between June and September 2020). Between September 2020 and January 2021, while the onshore displacement at the northward end was smaller than 50 m, the onshore displacement reached 120 m at the southern end. Differences between the −10 m (MSL) contour between G1 and G2 are likely associated with the ebb-tidal delta shoal dynamics of the Aveiro inlet and to the different survey technologies (i.e., multibeam vs single-beam), and will not be discussed hereafter. The horizontal differences between the −10 m (MSL) contours are smaller than 50 m at 1600 m southwards (Y = 102,000 m in Figure 4a). Therefore, the influence of the shoreface nourishment on the displacement of the −10 m (MSL) contour south of the initial deposition zone had an extent of about 1600 m.
The patterns displayed by the −8 m (MSL) contour are more pronounced than those associated with the −10 m (MSL) contour. The offshore displacement between June and August 2020 ranged between 280 m to 350 m at the initial deposition zone. After one month (September 2020), the −8 m (MSL) contour shifted landwards between 50 m at the central area (in front of G4) and 120 m at the end points (in front of G3 and G5). The largest landward migration at the end points is in part explained by the very sharp contours that are rapidly eroded. On January 2021, the overall shape of the shoreface nourishment resembles a gaussian function (Figure 4b, January 2021), denoting the spreading of the nourishment in the longshore direction (Figure 4b). The onshore displacement of the −8 m (MSL) contour was 30 m between September 2020 and January 2021 at the central part (in front of G4). This onshore displacement increased farther away, reaching about 100 m in front of G3 and of G5. The influence of the shoreface nourishment was felt until about 600 m towards north (200 m north of G3). At south, the onshore or offshore displacements of the −8 m (MSL) contour can be associated with the subtidal bar movement, as seen in Figure 2a, thereby preventing to isolate the effect of the nourishment. The latter aspect is visible in front of Vagueira beach where the September 2020 −8 m (MSL) contour is not only located 60 m landward than the January 2021 contour but also about 40 m landward than the June 2020 contour.
4.3. Subaerial Beach Response to the Shoreface Nourishment
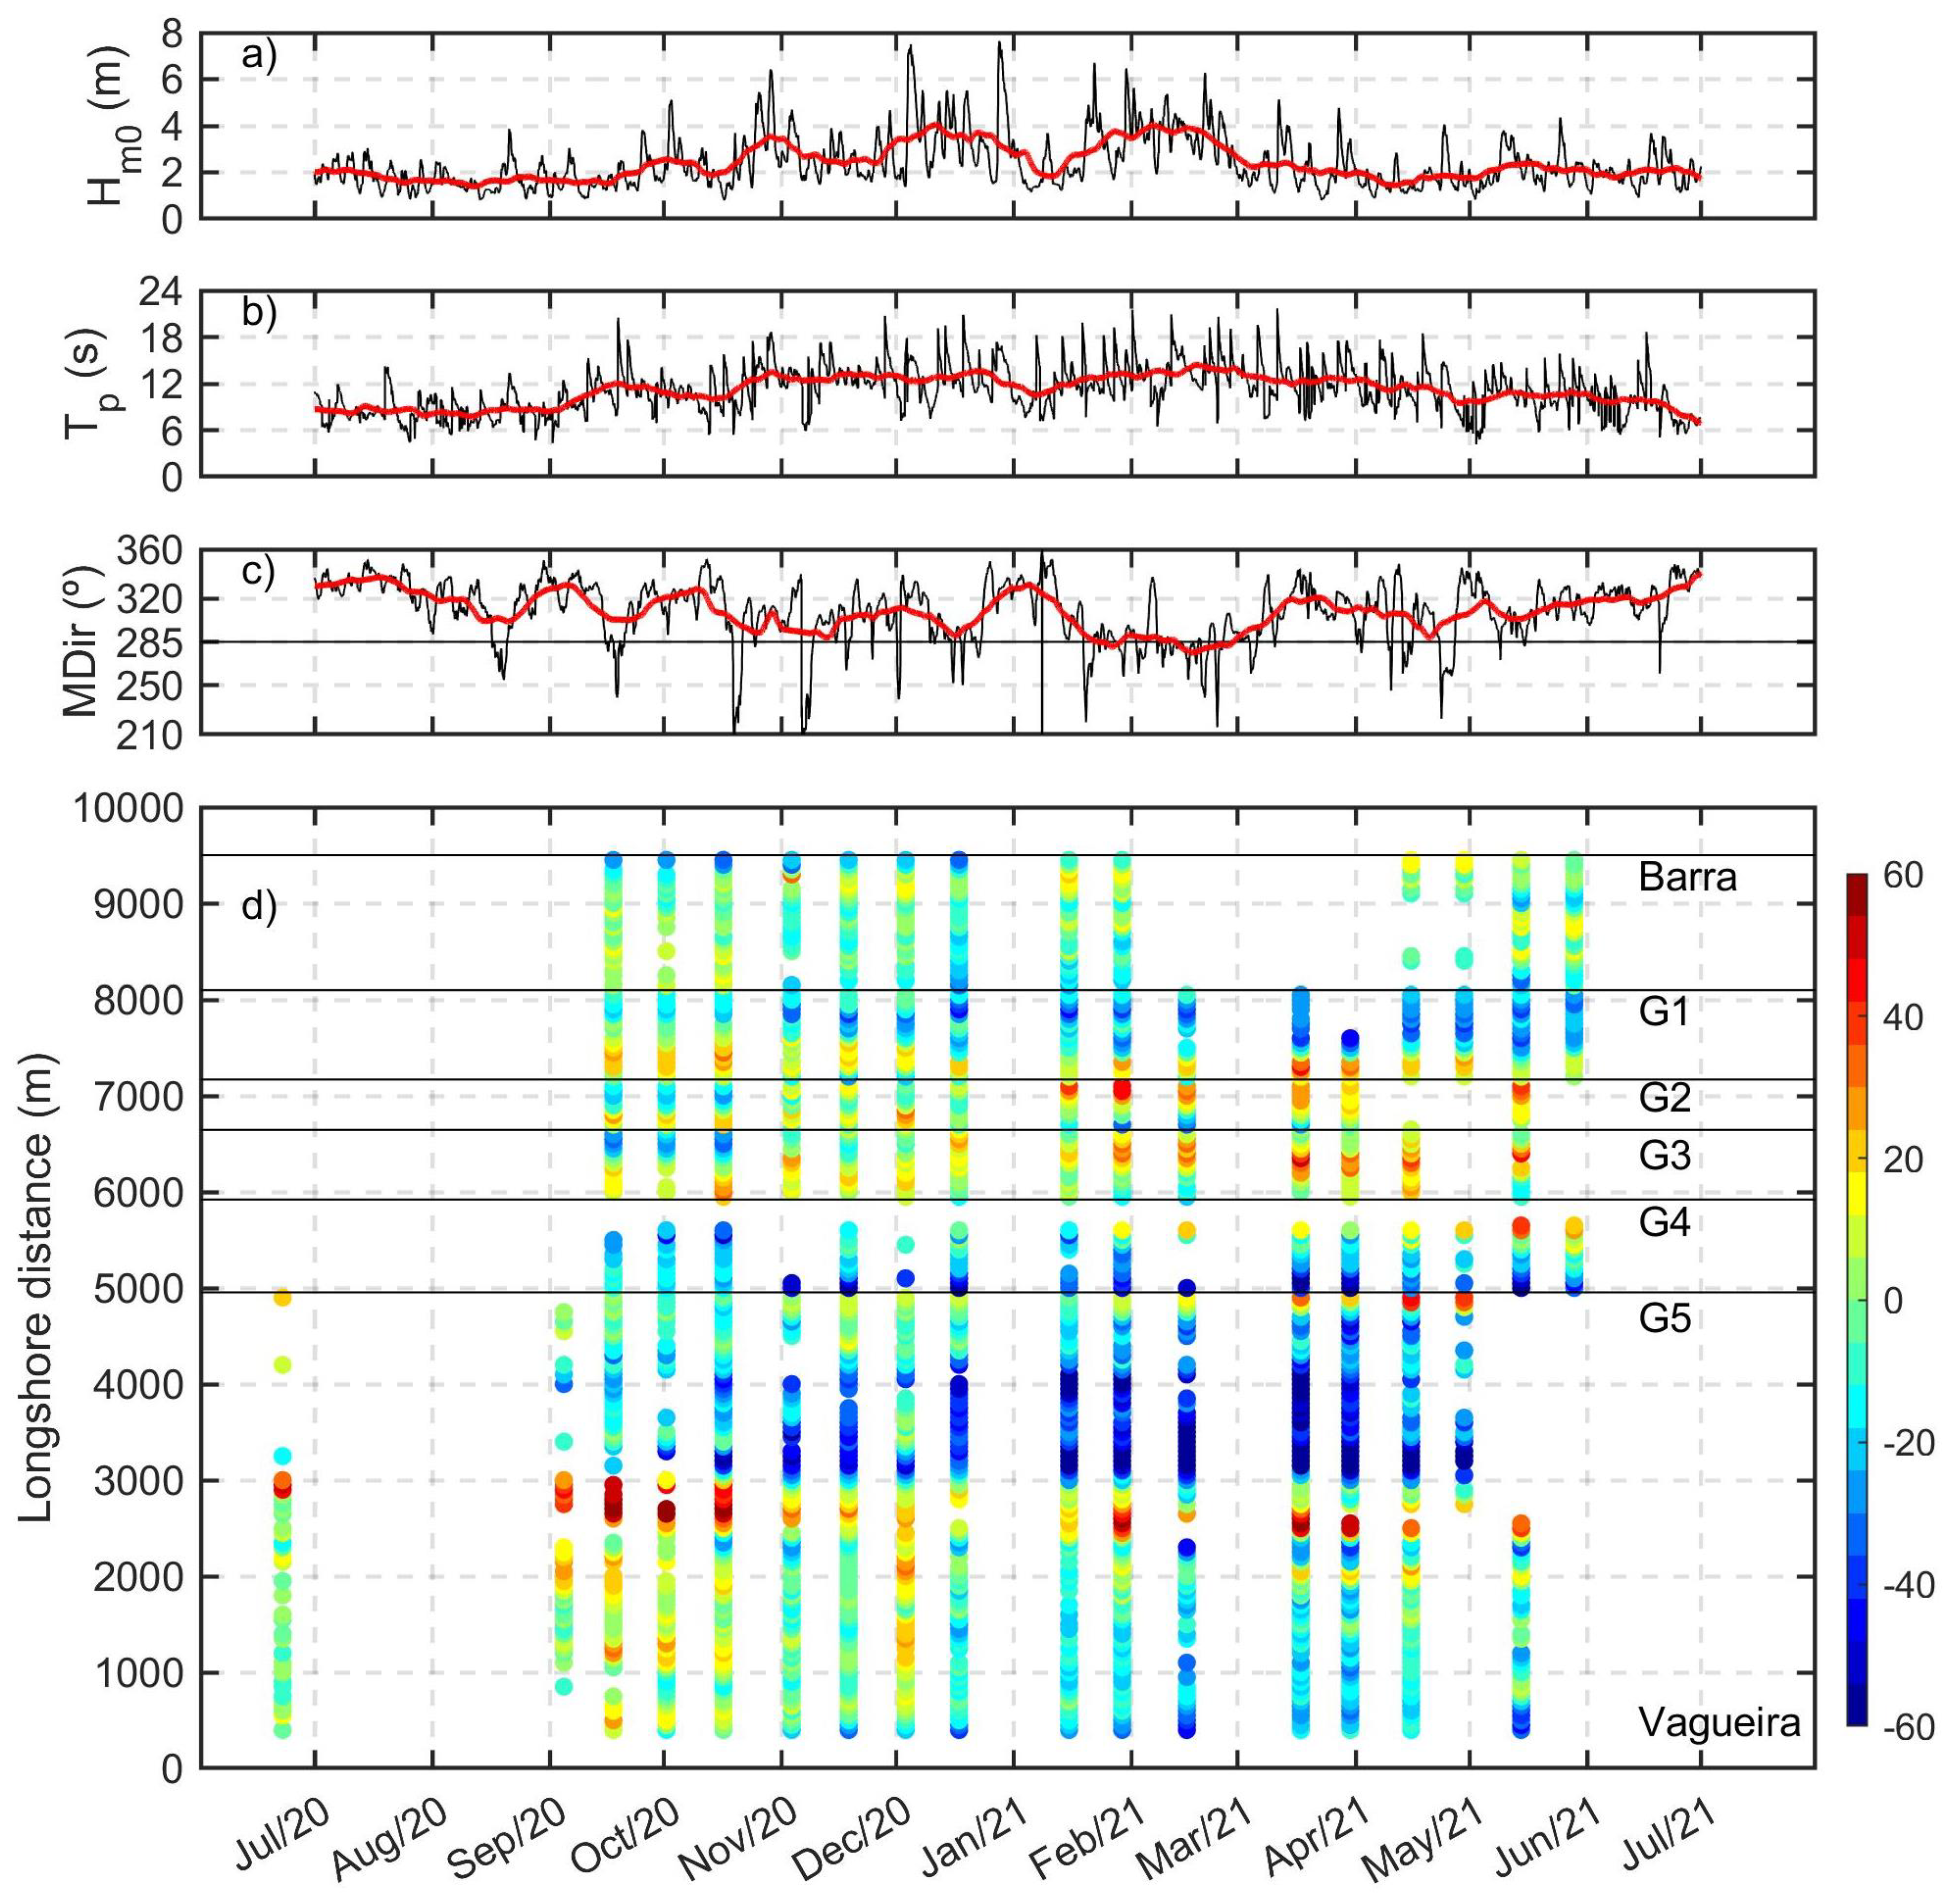
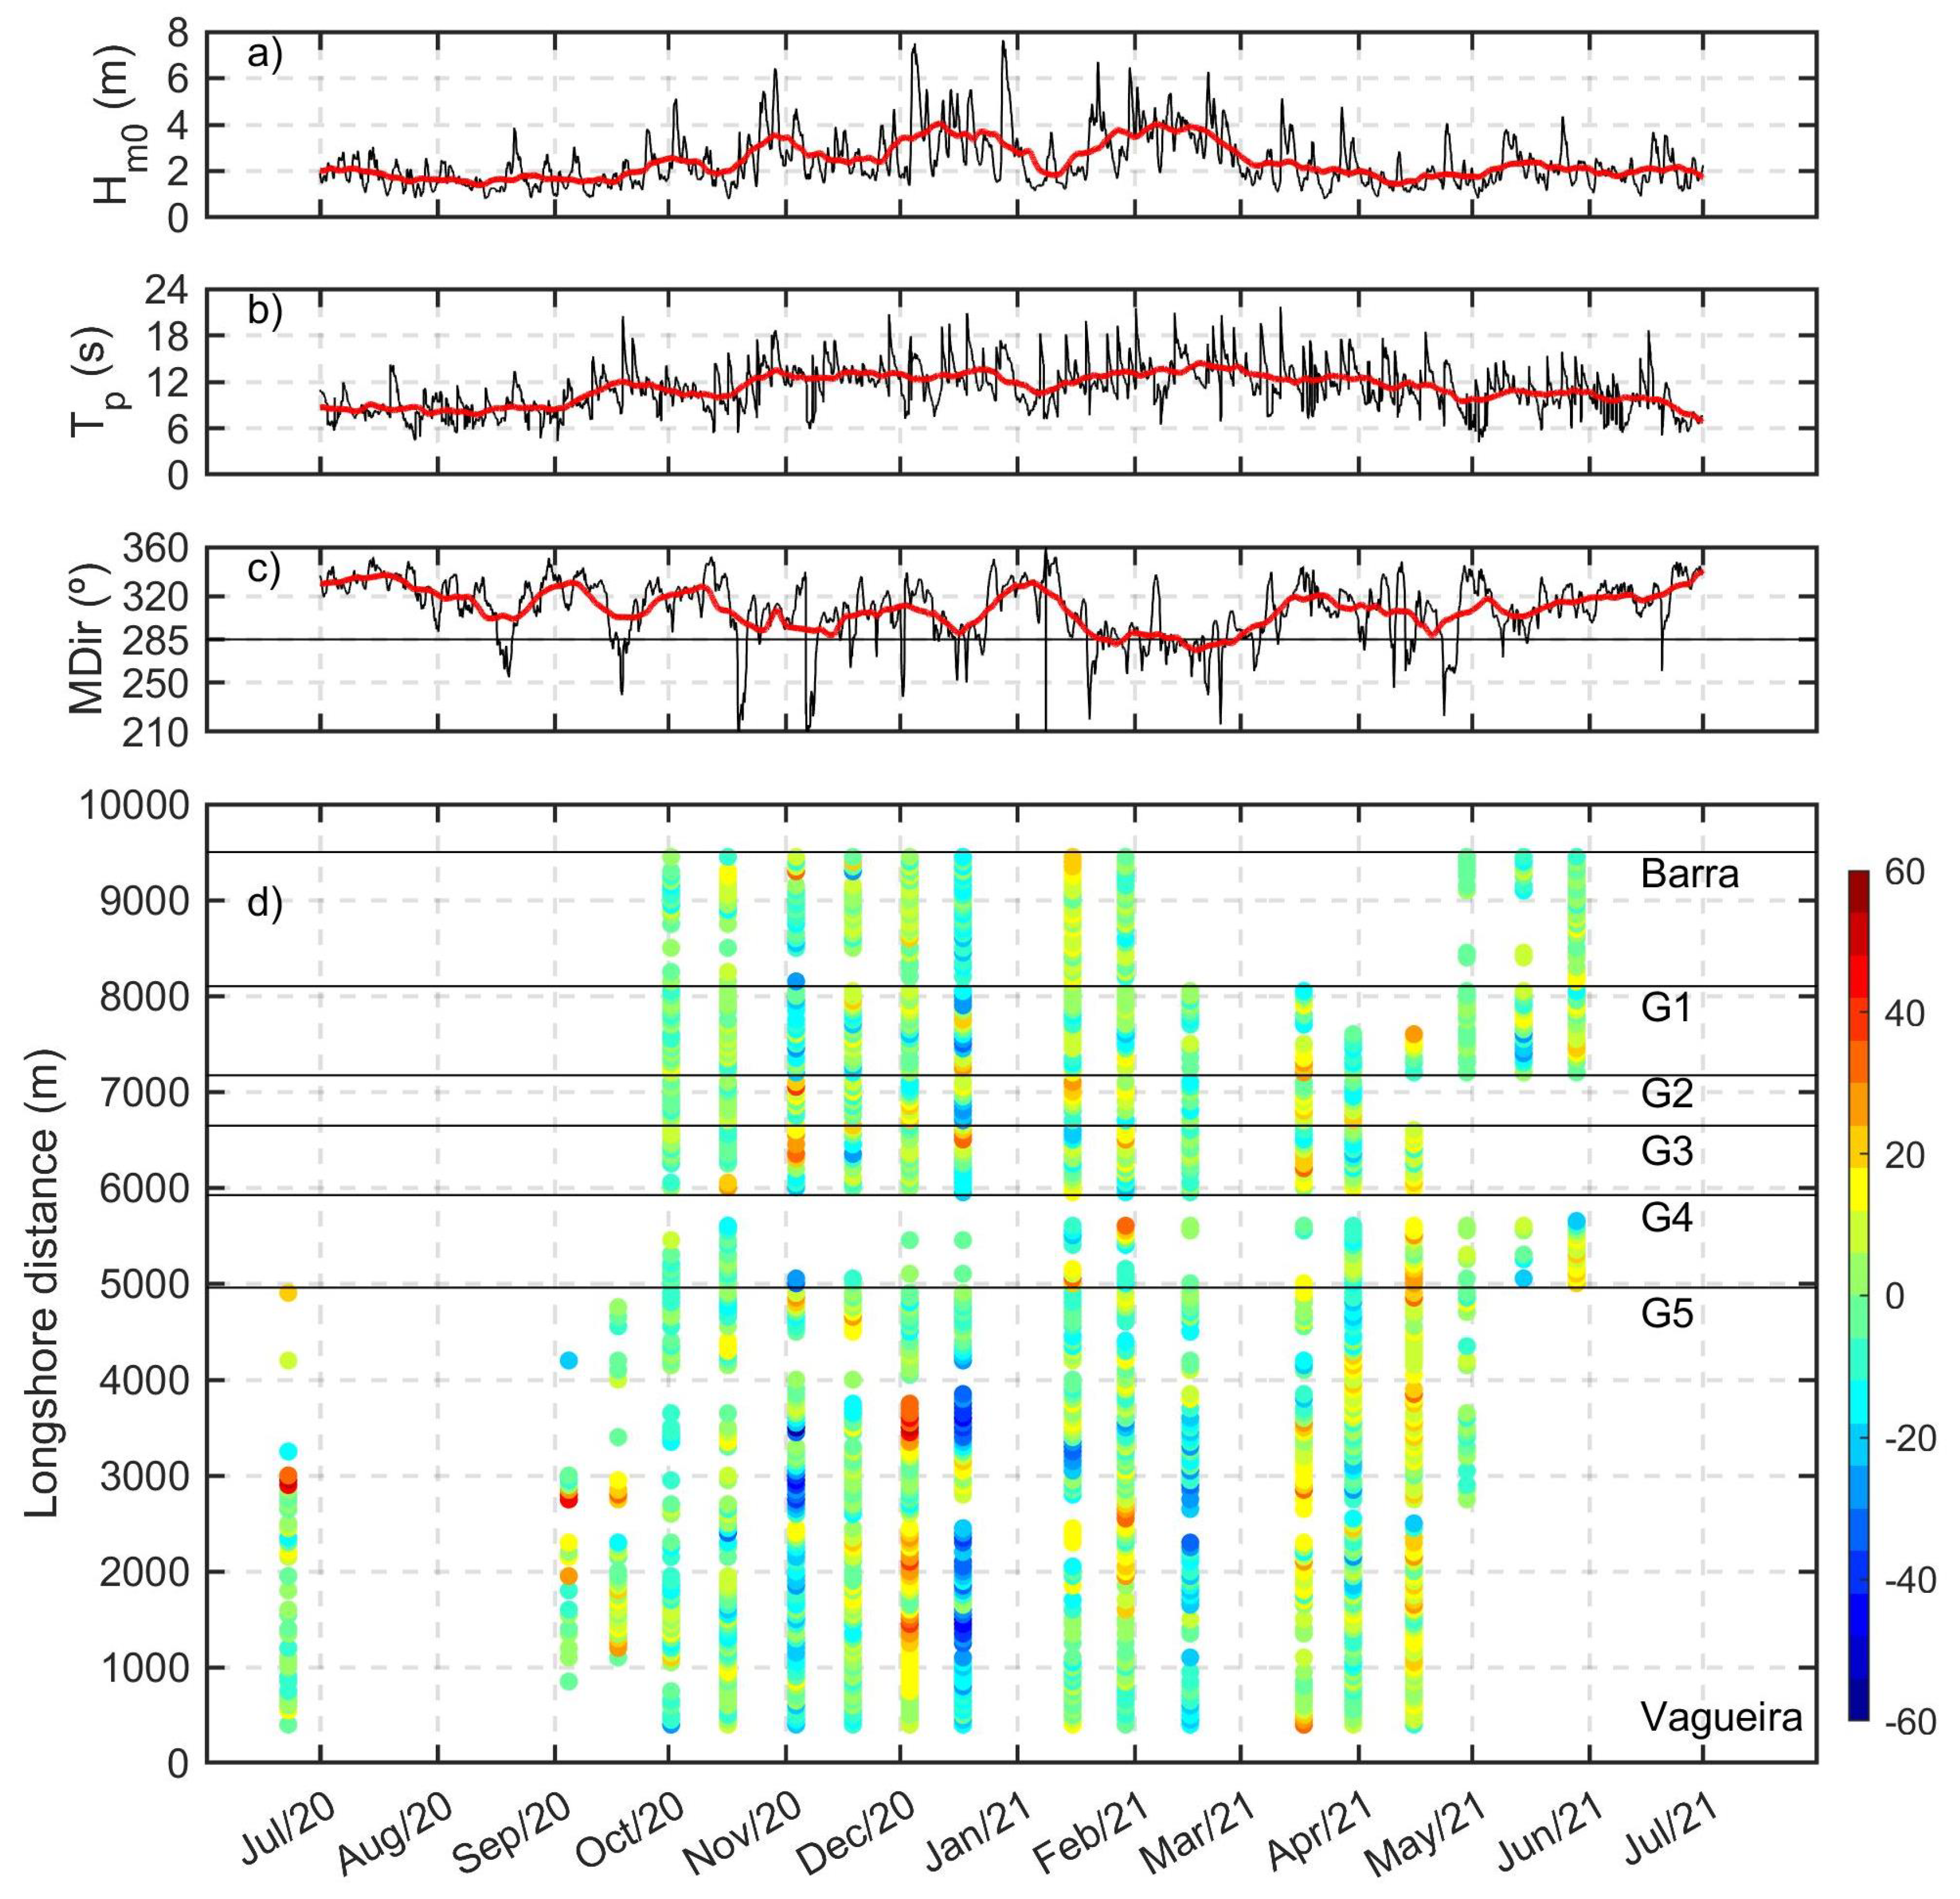
The analysis of the beach response to the shoreface nourishment was based on the 1.05 m (MSL) contour (see Figure 3 and Section 4.1). Figure 5 shows the spatial and temporal displacement of the 1.05 m (MSL) contour along the coastal stretch relative to its position on the beginning of June 2020, together with the the time series of wave parameters. While warm colors indicate an offshore displacement (i.e., beach volume increase), cold colors are associated with an onshore displacement (i.e., beach volume decrease). The horizontal black lines represent the five groynes (G1 to G5 in Figure 1) located at Costa Nova beach. The absence of colored circles means no data.
In general, three main features can be observed. First, the dominance of a landward displacement (blue circles) for distance between 3000 m and 4000 m. This displacement, that can reach locally −60 m, is located at the downdrift side of the shoreface nourishment. In more details, the shoreface nourishment was performed between G5 and G3. The retreat of the 1.05 m (MSL) contour relative to the June 2020 can be associated with modification of local wave parameters which drive divergency of the longshore sediment transport at the end parts of the shoreface nourishment. This erosion pattern was pointed out by [5] where the downdrift part can experience shoreline retreat in analogy to a detached breakwater. Second, the large seawards displacement (red circles) for distance equal to 2800 m between September and November 2020, and also on February and on April 2021. It is speculated that this seawards displacement is associated with the natural beach behaviour which increases in volume until late summer. Unfortunately, a comparison with older surveys is not possible because they are not available with the high-temporal and spatial resolution as those presented in this study. Third, the mild offshore displacement of the 1.05 m (MSL) contour located between G4 and G2. This offshore displacement through time is likely induced by the shoreface nourishment. The beaches delimited between G1 and G4 do experience the expected response due to the longshore drift until November 2020, which is from North to South at this study area during summer (see Figure 7 in [26]). Between September and October 2020, those beaches are associated with a seawards displacement northward of each groyne and with an onshore displacement southward (i.e., downdrift side) of each groyne. From November 2020 onward, this pattern changes and the onshore displacement is northward of each groyne, while the offshore displacement occurs at the downdrift side. This inversion in the expected beach erosion and accumulation associated with groynes is clearly observed for beaches between G2 and G5. Moreover, the mean wave direction become more confined to the WNW and W sectors (see January to February 2021 in Figure 5d). The maximum landward displacement of the shoreline proxy was −60 m at distance between 3000 m and 4000 m between January and April 2021. The maximum seawards displacement was +60 m at distance equal to 2800 m between September and October 2020.
4.4. Subaerial Beach Response to Storms and Subsequent Recovery
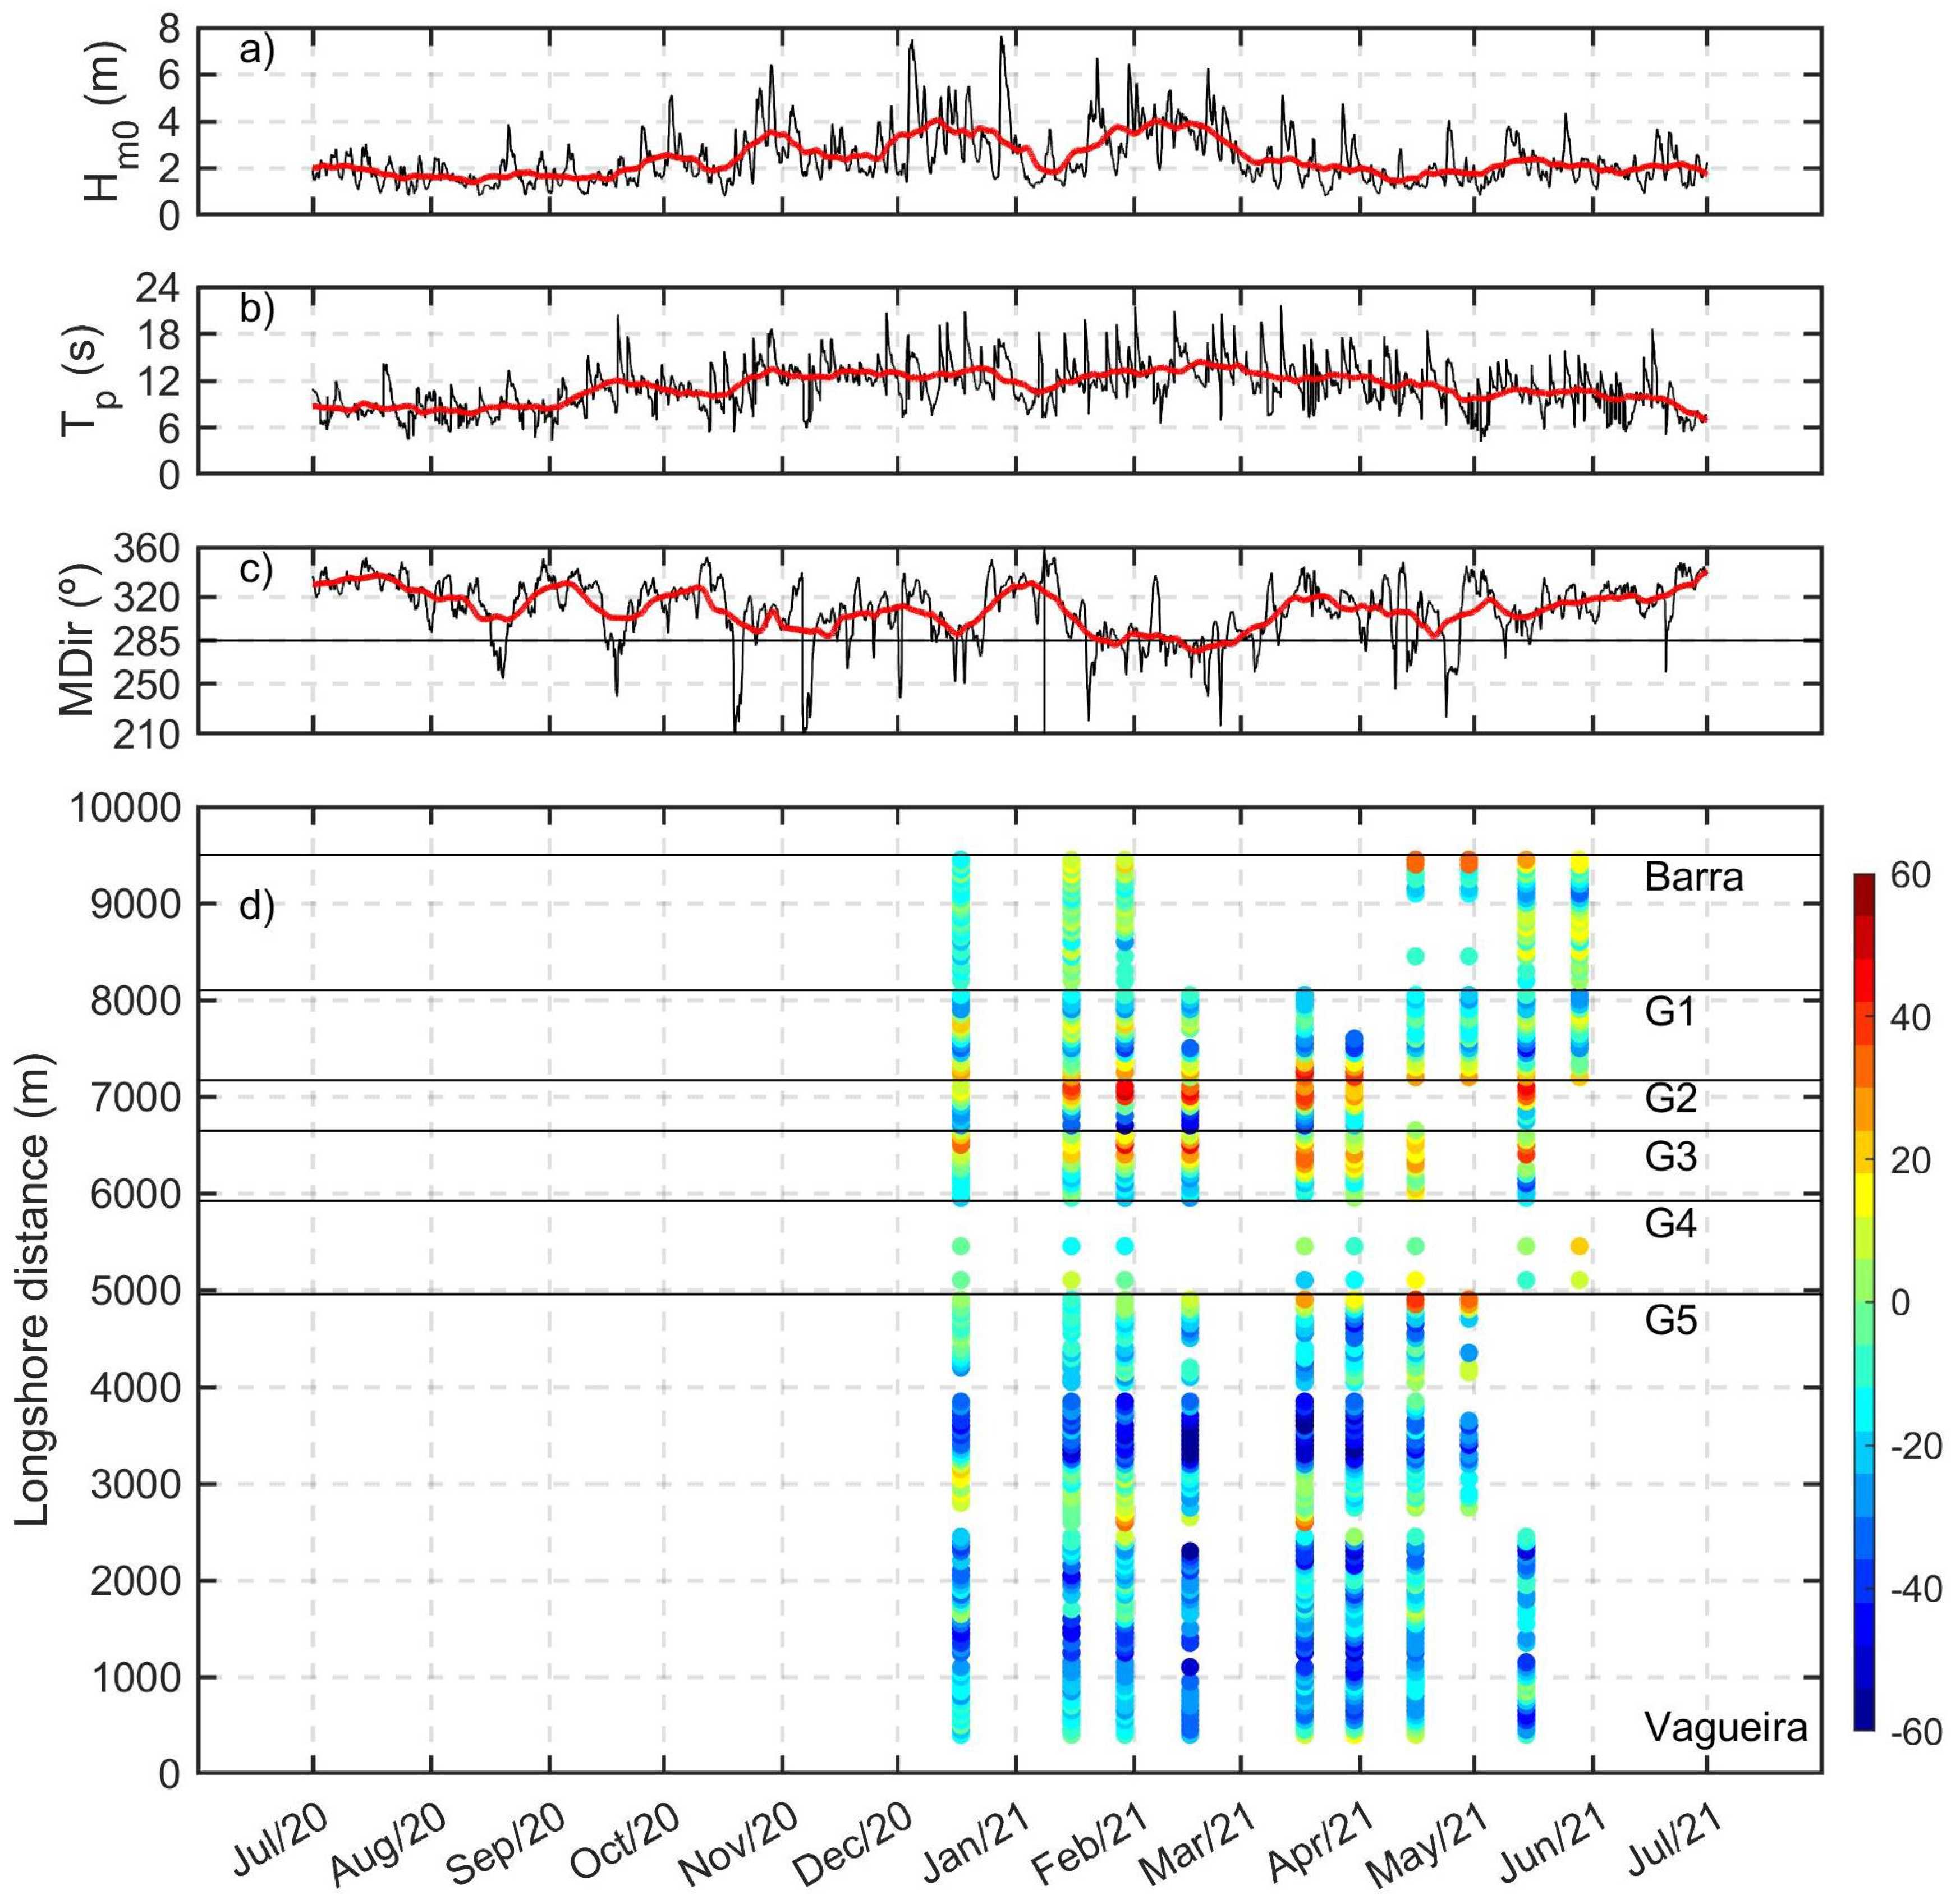
The beach response to storms was analysed based on the relative displacement of the shoreline proxy (1.05 m, MSL) in relation to the previous topographic survey, as shown in Figure 6. As an example, the shoreline proxy displacement on 17 December 2020 is obtained as the difference between 17 and 3 December 2020 surveys.
Looking at Figure 6d, the largest differences between consecutive surveys took place on December 2020. More specifically, the shoreline proxy moved seawards on 3 December and moved landwards on 17 December. Regarding the landward displacement, this occurred after storm Dora, which hit mainland Portugal on 4 December 2020. However, the beach response was very variable across the coastal stretch. The largest changes are more visible on natural beaches (south of G5) than on beaches close to coastal structures (between Barra and G5), which are under the influence of the shoreface nourishment. The offshore time-series clearly displays a very large increase on that day (up to 8 m) with an incident mean wave direction of about 320 N. The shoreline proxy retreat reach up to −50 m in some areas. The seaward displacement downdrift of G3 and G2 after storm Dora is likely associated with the presence of the shoreface nourishment. At that locations, the shoreline proxy advanced approximately 10 m. Regarding the seaward displacement that occurred on 3 December (south of G5), this beach accretion was likely associated with a reduction of the offshore , together with large . The 15-day moving average window suggests that decreased from 4 m to about 2 m. This reduction accompanied by large wave periods have most likely promoted the beach accretion (i.e., seaward displacement of the shoreline proxy). Again, the shoreline proxy advance is not uniform along the coastal stretch.
Beach accretion after storm Dora is displayed in Figure 7d. In this Figure, each shoreline proxy relative position is compared with the shoreline proxy position on 3 December (before storm Dora). Two major patterns emerged in Figure 7. First, the shoreline proxy 1.05 m (MSL) rapidly moved landwards at the downdrift side of G2 and of G3 from January 2021 onward. Second, the shoreline proxy continued to moved landwards on beaches backed up by dunes (those located southwards of G5). At those locations, there are no clear patterns of total recovery because the circles are still associated with negative values. The shoreline proxy close to Vagueira beach started to display some values close to 0 m on March 2021. This indicates that the 1.05 m (MSL) contour has recovered its 3 December relative position at that location, which can be in part ascribed to the Vagueira beach natural behaviour.
5. Discussion
5.1. General Characteristics of the Aveiro Shoreface Nourishment in Comparison with Previous Works
The review of previous works presented in Section 2 (see Table 1) suggests that shoreface nourishments performed at locations with both larger significant wave heights and wave periods have a value (ratio between nourishment volume and shoreface nourishment length) about a factor of 2 greater than those performed at locations characterized by milder and local generated waves. The shoreface nourishment movement landwards is performed with a migration rate about 50% larger than those in milder environments. In both mild or energetic wave conditions, the MSL contour displacement ranges between 13% to 20% of the shoreface nourishment onshore migration. Moreover, for the shoreface nourishment in California, Figure 2 in [19] suggests that the increase in beach volume above MSL is much smaller than the reduction of shoreface nourishment volume. For the Dutch shoreface nourishments, ref. [37] mentioned that the nourishment only acted partially as a feeder berm.
The Aveiro shoreface nourishment had an overall sediment volume (V) of about 2 × 10 m and a length (L) = 1900 m, which gives a = 1050 m/m. Its −8 m (MSL) contour onshore displacement, ranged from 80 m to 230 m between August 2020 and January 2021. Although the observations available in this study do not coverage one year, the initial onshore displacement rate (rate ) is between 200 m/yr to 500 m/yr. The local wave conditions at Aveiro are similar to those offshore because there are neither a sheltering effect promoted by islands nor dissipation by bottom friction over the continental shelf (about 80 km at Aveiro). In general, the Aveiro shoreface nourishment shares similar characteristics with that performed in California, US [19]. Wave conditions at California are associated with a larger than those at Aveiro (3.5 m in winter compared to 2.8 m) but the local wave conditions at California are likely milder due to the Channel Islands sheltering effect. Therefore, the large onshore displacement of Aveiro shoreface nourishment (200–500 m/yr), when compared to California (72 m/yr), can be attributed to the more energetic local wave conditions.
Regarding the Dutch nourishments [6], they were performed with a V/L ratio about a factor of 2–3 smaller than both Aveiro and California nourishments (Table 1). Their onshore migration rates varied for each nourishment, ranging from about 20 m/yr, for Wassenaar, to 50 m/yr, for both Egmond and Terheijde. These rates are smaller when compared with 72 m/yr for California and with 200–500 m/yr for Aveiro. In general, the wave climate along The Netherlands is milder and characterised by local generated waves. Even if the wave climate is different from that in Aveiro and California, often more energetic and characterized by swell waves, the differences between wave climates alone cannot explain the differences in the onshore migration rates. This is because for the same wave climate and with similar V/L ratios, the onshore migration rate of Wasenaar nourishment (22 m/yr) was about half of the rate of Egmond nourishment (50 m/yr). We suggest that other factors, such as tidal-induced velocities, beach or surfzone slopes, sediment grain sizes, coastal geomorphology and man-made structures (e.g., harbours) can contribute to explain these differences on the overall shoreface nourishment evolution.
The maximum seaward displacement of the 1.05 m (MSL) contour was about 60 m when compared to its reference position on June 2020. Although this displacement varied along the study area (see Figure 5), this gives an approximate offshore migration rate of 60 m/yr. Despite the fact that this offshore migration rate is larger than that of other shoreface nourishments, it is still about 30% of the onshore movement of the Aveiro shoreface nourishment (200 m/yr). Therefore, although the onshore and offshore displacements associated with the Aveiro shoreface nourishment are more pronounced than the shoreface nourishments performed elsewhere, the shoreline proxy advance seawards only accounted for 30% of the smallest shoreface nourishment outer limit advance landward. This suggests that the Aveiro shoreface nourishment behaved only partially as a feeder berm. In other words, the Aveiro shoreface nourishment did not contribute exclusively to a subaerial beach volume increase. The remaining part of the sediment volume associated with the shoreface nourishment have likely dispersed alongshore driven by the littoral drift. The latter suggestion is supported by the gaussian shape of the shoreface nourishment −8 (MSL) contour in January 2021 (Figure 4b).
5.2. Response of the Shoreline Proxy to the Shoreface Nourishment
The results presented above clearly highlighted distinct behaviours of the shoreline proxy relative to its cross-shore position before the shoreface nourishment intervention (June 2020, in Figure 5) and after the major storm Dora (December 2020, in Figure 6). The results suggest that the most clear shoreline proxy displacement onshore occurs at the downdrift side of the shoreface nourishment intervention (cold colours in Figure 5d). This behaviour has been pointed out by Van Duin et al. [5]. In our case study, the extent of this effect was about 2000 m southwards of the initial deposition zone. Since the length of the Aveiro shoreface nourishment is 1900 m, it is suggested that the shoreline retreat associated with this shoreface nourishment is about the same length as the shoreface nourishment itself.
The longshore spreading and evolution of the shoreface nourishment is about their initial length (1900 m). The results show a southward displacement of the −10 m and of the −8 m isolines up to 1600 m (Figure 4). Towards north, the shoreface nourishment evolution is influenced by the ebb delta shoal of Aveiro inlet but it extends up to 600 m northwards. Based on the available bathymetric surveys, it can be expected that the shoreface longshore spreading is about its initial length during the first year of morphological evolution.
Beaches located closer to the shoreface nourishment were benefited. This effect was present in three comparisons: to its relative position on June 2020; after storm Dora; and also during subsequent beach recovery. As an example, during storm Dora beaches located near the shoreface nourishment (between G3 and G5) even experienced a shoreline proxy advance seawards. This effect is likely offered by the sheltering effect of the shoreface nourishment which is capable of reducing wave amplitude during storms. Moreover, beaches closer to the shoreface nourishment also experienced recovery much quicker than those farther away. Looking at Figure 7d, the shoreline proxy associated with beaches located between G4 and G2 displayed positive values after storm Dora (>20 m, yellow and red markers) from January until June 2021. On the opposite, the shoreline proxy associated with beaches located southwards of G5 displayed negative values (<−20 m, cyan and blue markers). There are some locations where this pattern was not so clear, such as beaches located updrift of G3 (where shoreline proxy retreat reached −40 m between February and March 2021) and also beaches located downdrift of G5 (where the shoreline proxy advanced up to 40 m on mid April 2021). Though, the general pattern is that the relative position of the shoreline proxy accreted more between G4 and G2 than at beaches located southwards of G5, where a shoreline proxy retreat was observed. Therefore, beaches located closer to the shoreface nourishment (between G4 and G2) achieved their position before storm Dora (warm colours in Figure 7d) quicker than beaches located southward of G5 (cold colours in Figure 7d).
On a seasonal scale (from September 2020 to April 2021), beaches located closer to the shoreface nourishment experienced a milder but steady advance seawards (see warm colours between G4 and G2 in Figure 5d). An interesting result is that beaches delimited by groynes have experienced a different morphodynamic pattern than that expected from the longshore drift. The expected pattern occurred until October 2020 on beaches located between G2 and G4, with erosion downdrift (cold colours in Figure 5d) and accretion updrift (warm colours in Figure 5d). From November 2020 on, but more clear in January and February 2021, this pattern changed and beach accretion occurred on the downdrift side of a groyne (warm colours in Figure 5d), while beach erosion took place on the updrift side of a groyne (cold colours in Figure 5d). This inversion is possibly linked to the nearshore circulation patterns induced by the shoreface nourishment [5], and also with the directional wave conditions. Future numerical modelling efforts may be used to understand the reason for this observed inversion.
The results presented in this study suggest that the shoreface nourishment was beneficial to the subaerial beach in different ways. Although the results presented above also allow to better understand the beach response to a shoreface nourishment at Aveiro, more coastal monitoring is definitely desirable to draw more firm conclusions. The use of simple techniques to assess shoreface nourishment expected evolution can be of interest for preliminary designs [38]. Additionally, the use of video cameras can be included to complement topographic and bathymetric measurements [39]. Moreover, the application of numerical models (either more simple, such as one-line models, or more complex, such as coastal area models) can be envisaged in future (e.g., [40]). These type of applications would not only allow to verify numerical models but also to test different shoreface nourishment options and configurations by varying its width, length, volume and distance to shoreline, and also to perform cost-benefit analysis of coastal protection strategies [41].
6. Conclusions
In this study, the beach response to a shoreface nourishment was analysed based on topographic and bathymetric surveys performed over one year along 10 km in Aveiro (Portugal). The analysis was based on the evolution of the −10 m and −8 m (MSL) contours and of the 1.05 m (MSL) contour. The former is associated with the displacement of the shoreface nourishment outer limit and the latter is associated with the temporal variation of the beach volume above MSL, for this study area.
While the onshore displacement of the −10 m (MSL) and of the −8 m (MSL) contour ranged between 80 m and 230 m, the maximum offshore displacement of the 1.05 m (MSL) contour was 60 m. Therefore, our results suggest that the shoreface nourishment intervention only acted partially as a feeder berm. This is in agreement with shoreface nourishment of similar volume magnitudes performed elsewhere.
The beach response (the onshore or offshore displacement of the 1.05 m contour) was highly variable in time and along the 10 km study area. Beaches located closer to the shoreface nourishment (delimited by groynes) exhibit a more stable behaviour, are not so vulnerable to wave conditions than those located south of G5 and display a large seaward displacement (i.e., beach volume increase). During storm Dora (December 2020), beaches located closer to the shoreface nourishment even display an offshore advance (i.e., beach volume increase). Moreover, the beach response is also quick on that beaches. A drawback associated with the shoreface nourishment was the beach retreat at the downdrift side of the nourishment. This effect occurred until a distance that is about the shoreface nourishment length.
Author Contributions
Conceptualization, D.M.; data collection, D.M.; methodology, D.M.; software, D.M.; formal analysis, D.M., J.P.-B., P.B., P.A.S., C.B. and C.P.; resources, P.B.; writing—original draft preparation, D.M.; writing—review and editing, J.P.-B., P.B., P.A.S., C.B. and C.P.; project administration, P.B. and C.P.; funding acquisition, P.B. and C.P. All authors have read and agreed to the published version of the manuscript.
Funding
Some of the collected data were co-funded by POSEUR (Ref. POSEUR-02-1809-FC-000051—Remoção dos Inertes da Zali do Porto de Aveiro para Reforço do Cordão Litoral a Sul da Costa Nova) and are gratefully acknowledged. Data were also obtained under the COSMO Programme-Coastal Monitoring Programme of Continental Portugal, of the Portuguese Environment Agency, co-funded by the Operational Program for Sustainability and Efficiency in the Use of Resources (POSEUR), https://cosmo.apambiente.pt, accessed on 28 June 2021.
Acknowledgments
The authors acknowledge Rita Cavalinhos (CESAM field technician) and Paulo Rosa (CESAM skipper) for their fantastic work during the bathymetric surveys. Rita Cavalinhos is also acknowledged for her work during the multibeam surveys pre-processing phase. Fábio Santos is also acknowledged for his help during the bathymetric surveys. The Aveiro harbour authority is warmly acknowledged for providing the multibeam survey. Comments and suggestions provided by two anonymous reviewers are acknowledged. Thanks are due to FCT/MCTES for the financial support to CESAM (UIDP/50017/2020+UIDB/50017/2020), through national funds. SANDTRACK project (PTDC/CTA-GEO/31779/2017) funded by FEDER, through COMPETE2020 - Programa Operacional Competitividade e Internacionalização (POCI), and by national funds (OE), through FCT/MCTES.
Conflicts of Interest
The authors declare no conflict of interest.
References
- de Schipper, M.A.; Ludka, B.C.; Raubenheimer, B.; Luijendijk, A.P.; Schlacher, T.A. Beach nourishment has complex implications for the future of sandy shores. Nat. Rev. Earth Environ. 2020, 2, 70–84. [Google Scholar] [CrossRef]
- Dean, R. Beach Nourishment: Theory and Practice; Advanced Series on Ocean Engineering—Volume 18; World Scientific: Singapore, 2002; p. 399. [Google Scholar]
- Brutsché, K.E.; Wang, P.; Beck, T.M.; Rosati, J.D.; Legault, K.R. Morphological evolution of a submerged artificial nearshore berm along a low-wave microtidal coast, Fort Myers Beach, west-central Florida, USA. Coast. Eng. 2014, 91, 29–44. [Google Scholar] [CrossRef]
- Brutsché, K.E.; McFall, B.C.; Bryant, D.B.; Wang, P. Literature Review of Nearshore Berms—ERDC/CHL SR-19-2; Technical Report; USACE: Washington, DC, USA, 2019. [Google Scholar]
- van Duin, M.J.P.; Wiersma, N.R.; Walstra, D.J.R.; van Rijn, L.C.; Stive, M.J.F. Nourishing the shoreface: Observations and hindcasting of the Egmond case, The Netherlands. Coast. Eng. 2004, 51, 813–837. [Google Scholar] [CrossRef]
- Huisman, B.J.A.; Walstra, D.J.R.; Radermacher, M.; de Schipper, M.A.; Ruessink, B.G. Observations and Modelling of Shoreface Nourishment Behaviour. J. Mar. Sci. Eng. 2019, 7, 59. [Google Scholar] [CrossRef] [Green Version]
- Pinto, C.A.; Silveira, T.M.; Teixeira, S.B. Beach nourishment practice in mainland Portugal (1950–2017): Overview and retrospective. Ocean Coast. Manag. 2020, 192, 105211. [Google Scholar] [CrossRef]
- Spodar, A.; Héquette, A.; Ruz, M.H.; Cartier, A.; Grégoire, P.; Sipka, V.; Forain, N. Evolution of a beach nourishment project using dredged sand from navigation channel, Dunkirk, northern France. J. Coast. Conserv. 2018, 22, 457–474. [Google Scholar] [CrossRef]
- Elko, N.; Briggs, T.R.; Benedet, L.; Robertson, Q.; Thomson, G.; Webb, B.M.; Garvey, K. A century of U.S. beach nourishment. Ocean Coast. Manag. 2021, 199, 105406. [Google Scholar] [CrossRef]
- Hanson, H.; Brampton, A.; Capobianco, M.; Dette, H.; Hamm, L.; Laustrup, C.; Lechuga, A.; Spanhoff, R. Beach nourishment projects, practices, and objectives—A European overview. Coast. Eng. 2002, 47, 81–111. [Google Scholar] [CrossRef]
- Cooke, B.C.; Jones, A.R.; Goodwin, I.D.; Bishop, M.J. Nourishment practices on Australian sandy beaches: A review. J. Environ. Manag. 2012, 113, 319–327. [Google Scholar] [CrossRef] [PubMed]
- Cai, F.; Dean, R.G.; Liu, J. Beach nourishment in China: Status and Prospects. Coast. Eng. Proc. 2010, 1, 1–12. [Google Scholar] [CrossRef] [Green Version]
- Habel, S.; Fletcher, C.H.; Barbee, M.; Anderson, T.R. The influence of seasonal patterns on a beach nourishment project in a complex reef environment. Coast. Eng. 2016, 116, 67–76. [Google Scholar] [CrossRef]
- Muñoz-Perez, J.J.; Gallop, S.L.; Moreno, L.J. A Comparison of Beach Nourishment Methodology and Performance at Two Fringing Reef Beaches in Waikiki (Hawaii, USA) and Cadiz (SW Spain). J. Mar. Sci. Eng. 2020, 8, 266. [Google Scholar] [CrossRef] [Green Version]
- Marinho, B.; Coelho, C.; Larson, M.; Hanson, H. Monitoring the evolution of nearshore nourishments along Barra-Vagueira coastal stretch, Portugal. Ocean Coast. Manag. 2018, 157, 23–39. [Google Scholar] [CrossRef]
- Zwaborn, J.; Fromme, G.; FitzPatrick, J. Underwater mound for the protection of Durban’s beaches. Coast. Eng. Proc. 1970, 1, 62. [Google Scholar] [CrossRef] [Green Version]
- Vera-Cruz, D. Artificial Nourishment of Copacabana Beach. Coast. Eng. Proc. 1972, 1, 1451–1463. [Google Scholar] [CrossRef]
- Laustrup, C.; Madsen, H.T.; Sorensen, P.; Broker, I. Comparison of beach and shoreface nourishment Torsminde Tang, Denmark. Coast. Eng. Proc. 1996, 1, 2927–2940. [Google Scholar] [CrossRef]
- Mesa, C. Nearshore berm performance at Newport Beach, California, USA. Coast. Eng. Proc. 1996, 1, 4636–4649. [Google Scholar] [CrossRef]
- Wilson, J.H.; Beyene, A. California Wave Energy Resource Evaluation. J. Coast. Res. 2007, 23, 679–690. [Google Scholar] [CrossRef]
- Wijnberg, K.M. Environmental controls on decadal morphologic behaviour of the Holland coast. Mar. Geol. 2002, 189, 227–247. [Google Scholar] [CrossRef]
- van Rijn, L.C. Sediment transport and budget of the central coastal zone of Holland. Coast. Eng. 1997, 32, 61–90. [Google Scholar] [CrossRef]
- Coelho, C. Riscos de Exposição de Frentes Urbanas para Diferentes Intervenções de Defesa Costeira. Ph.D. Thesis, University of Aveiro, Aveiro, Portugal, 2005. (In Portuguese). [Google Scholar]
- Mendes, D.; Oliveira, T.C. Deep-water spectral wave steepness offshore mainland Portugal. Ocean Eng. 2021, 236, 109548. [Google Scholar] [CrossRef]
- Oliveira, T.C.; Neves, M.G.; Fidalgo, R.; Esteves, R. Variability of wave parameters and Hmax/Hs relationship under storm conditions offshore the Portuguese continental coast. Ocean Eng. 2018, 153, 10–22. [Google Scholar] [CrossRef]
- Silva, A.N.; Taborda, R.; Bertin, X.; Dodet, G. Seasonal to Decadal Variability of Longshore Sand Transport at the Northwest Coast of Portugal. J. Waterw. Port Coast. Ocean Eng. 2012, 138, 464–472. [Google Scholar] [CrossRef]
- Coelho, C.; Silva, R.; Veloso-Gomes, F.; Taveira-Pinto, F. Potential effects of climate change on northwest Portuguese coastal zones. ICES J. Mar. Sci. 2009, 66, 1497–1507. [Google Scholar] [CrossRef] [Green Version]
- Ferreira, Ó. Morfodinâmica de Praias Expostas: Aplicação ao Sector Costeiro Aveiro-Cabo Mondego. Ph.D. Thesis, University of Algarve, Aveiro, Portugal, 1998. (In Portuguese). [Google Scholar]
- Silva, R.; Baptista, P.; Veloso-Gomes, F.; Coelho, C.; Taveira-Pinto, F. Sediment grain size variation on a coastal stretch facing the North Atlantic (NW Portugal). J. Coast. Res. 2009, SI56, 762–766. [Google Scholar]
- Rato, D. Relatório II—Análise Textural de Sedimentos. Technical Report; SandTrack Project: 2019. Available online: http://sandtrack.web.ua.pt/pt/outputs/reports/02_Relatorio_II_Analise_textural_sedimentos.pdf (accessed on 28 June 2021). (In Portuguese).
- Baptista, P.; Bernardes, C.; Cunha, T. The validation analysis of the INSHORE system—A precise and efficient coastal survey system. Environ. Monit. Assess. 2011, 179, 589–604. [Google Scholar] [CrossRef] [Green Version]
- Baptista, P.; Cunha, T.; Bernardes, C.; Gama, C.; Ferreira, Ó.; Dias, A. A Precise and Efficient Methodology to Analyse the Shoreline Displacement Rate. J. Coast. Res. 2011, 27, 223–232. [Google Scholar] [CrossRef]
- Toledano, C.; Dalphinet, A.; Lorente, P.; de Alfonso, M.; Ghantous, M.; Aouf, L.; García Sotillo, M. Qualitity Information Document Atlantic-Iberian Biscay Irish IBI Production Centre IBI ANALYSIS FORECAST WAV 005 005. Technical Report; Copernicus Marine Environment Monitoring Service: 2020. Available online: https://catalogue.marine.copernicus.eu/documents/QUID/CMEMS-IBI-QUID-005-005.pdf (accessed on 28 June 2021).
- Pinto, C.; Penacho, N.; Pires, B. Programa de Monitorização da Faixa Costeira de Portugal Continental (COSMO): Da concepção à implementação. In Proceedings of the X CPGZCPEP, Rio de Janeiro, Brazil, 6–10 December 2021; submitted. (In Portuguese). (In Portuguese). [Google Scholar]
- Palalane, J.; Fredriksson, C.; Marinho, B.; Larson, M.; Hanson, H.; Coelho, C. Simulating cross-shore material exchange at decadal scale. Model application. Coast. Eng. 2016, 116, 26–41. [Google Scholar] [CrossRef]
- Carapuço, M.M.; Taborda, R.; Silveira, T.M.; Psuty, N.P.; Andrade, C.; Freitas, M.C. Coastal geoindicators: Towards the establishment of a common framework for sandy coastal environments. Earth-Sci. Rev. 2016, 154, 183–190. [Google Scholar] [CrossRef]
- Hoekstra, P.; Houwman, K.T.; Kroon, A.; Ruessink, B.G.; Roelvink, J.A.; Spanhoff, R. Morphological development of the Terschelling shoreface nourishment in response to hydrodynamic and sediment transport processes. Coast. Eng. Proc. 1996, 1, 2897–2910. [Google Scholar] [CrossRef]
- Bain, R.; McFall, B.; Krafft, D.; Hudson, A. Evaluating Transport Formulations for Application to Nearshore Berms. J. Waterw. Port Coast. Ocean Eng. 2021, 147, 04021031. [Google Scholar] [CrossRef]
- Jóia Santos, C.; Andriolo, U.; Ferreira, J.C. Shoreline Response to a Sandy Nourishment in a Wave-Dominated Coast Using Video Monitoring. Water 2020, 12, 1632. [Google Scholar] [CrossRef]
- Baptista, P.; Coelho, C.; Pereira, C.; Bernardes, C.; Veloso-Gomes, F. Beach morphology and shoreline evolution: Monitoring and modelling medium-term responses (Portuguese NW coast study site). Coast. Eng. 2014, 84, 23–37. [Google Scholar] [CrossRef]
- Lima, M.; Coelho, C.; Veloso-Gomes, F.; Roebeling, P. An integrated physical and cost-benefit approach to assess groins as a coastal erosion mitigation strategy. Coast. Eng. 2020, 156, 103614. [Google Scholar] [CrossRef]
Figure 1.
Study area. Coastal defense works include two breakwaters at the Aveiro entrance channel, five groynes at the northern part of the study area and another at Vagueira beach and two revetments one close to G4 and the other at Vagueira beach. The area associated with the shoreface nourishment intervention was between G3 and G5. Beach profiles and topographic beach profiles were obtained within the COSMO programme. Coordinates are referred to the ETRS89 system.

Figure 2.
Beach profiles at Vagueira (panel (a)) and at Costa Nova (panel (b)) beaches (yellow lines in Figure 1) between 2018 and 2020. Zoom-in of the submerged beach profiles (panels (c,d)). Standard deviation of beach profile elevations for each cross-shore position (panels (e,f)).
Figure 2.
Beach profiles at Vagueira (panel (a)) and at Costa Nova (panel (b)) beaches (yellow lines in Figure 1) between 2018 and 2020. Zoom-in of the submerged beach profiles (panels (c,d)). Standard deviation of beach profile elevations for each cross-shore position (panels (e,f)).

Figure 3.
Topographic beach profiles at Barra, Costa Nova, Vagueira 1 and Vagueira 2 beaches (red lines in Figure 1, from North to South) (top panels). Correlation coefficient between beach volume (per unit width) and the displacement of elevation contours (middle panels). Scatter diagrams between beach volume and the displacement of the 1.05 m (MSL) contour (bottom panels).

Figure 4.
Time evolution of the bathymetric contour associated with −10 m (MSL) (panel (a)) and with −8 m (MSL) (panel (b)). Coastal defense works over the study area (black) and the area associated with the shoreface nourishment intervention was between G3 and G5 (dashed white). Coordinates are referred to the ETRS89 system.

Figure 5.
Time series of offshore significant wave height (a), peak period (b) and mean wave direction (c) obtained from CMEMS (https://marine.copernicus.eu/, accessed on 28 June 2021), and 15-day moving average (red). Time-series of the relative 1.05 m (MSL) shoreline proxy advance seawards (warm colors) or retreat landwards (cold colors) (d) along the coastal stretch from Vagueira (0 m) to Barra (9500 m). The relative advance or retreat is in comparison with the shoreline proxy position surveyed on June 2020 (reference situation before shoreface nourishment). Horizontal black lines refer to groynes and to breakwater.

Figure 6.
Time series of offshore significant wave height (a), peak period (b) and mean wave direction (c) obtained from CMEMS (https://marine.copernicus.eu/, accessed on 28 June 2021), and 15-day moving average (red). Time-series of the relative 1.05 m (MSL) shoreline proxy advance seawards (warm colors) or retreat landwards (cold colors) (d) along the coastal stretch from Vagueira (0 m) to Barra (9500 m). The relative advance or retreat is in comparison with the shoreline proxy position surveyed on the previous survey. Horizontal black lines refer to groynes and to breakwater.

Figure 7.
Time series of offshore significant wave height (a), peak period (b) and mean wave direction (c) obtained from CMEMS (https://marine.copernicus.eu/, accessed on 28 June 2021), and 15-day moving average (red). Time-series of the relative 1.05 m (MSL) shoreline proxy advance seawards (warm colors) or retreat landwards (cold colors) (d) along the coastal stretch from Vagueira (0 m) to Barra (9500 m). The relative advance or retreat is in comparison with the shoreline proxy position surveyed on 3 December 2020 (reference situation before storm Dora). Horizontal black lines refer to groynes and to breakwater.


Table 1.
General characteristics of shoreface nourishments in previous works.
| Location | V (×10 m) | (m/m) | h (m, MSL) |
|---|---|---|---|
| California, US (1992) [19] | 1.0 | 1070 | −9 to −4 |
| Terschelling, NL (1993) [6] | 2.1 | 480 | −7 to −4 |
| Terheijde, NL (1997) [6] | 0.9 | 530 | −8 to −5 |
| Egmond, NL (1999) [6] | 0.9 | 390 | −8 to −5 |
| Wassenaar, NL (2002) [6] | 2.5 | 410 | −8 to −5 |
Table 2.
Shoreface nourishment onshore displacement (), MSL contour offshore displacement (), and respective migration rates.
Table 2.
Shoreface nourishment onshore displacement (), MSL contour offshore displacement (), and respective migration rates.
| Location | (m) | (m) | Rate (m/yr) | Rate (m/yr) |
|---|---|---|---|---|
| California, US (1992) [19] | 180 | 30 | 72 | 12 |
| Terschelling, NL (1993) [6] | - | - | - | - |
| Terheijde, NL (1997) [6] | 150 | 20 | 50 | 7 |
| Egmond, NL (1999) [6] | 100 | 20 | 50 | 10 |
| Wassenaar, NL (2002) [6] | 100 | 20 | 22 | 4 |
Publisher’s Note: MDPI stays neutral with regard to jurisdictional claims in published maps and institutional affiliations. |
© 2021 by the authors. Licensee MDPI, Basel, Switzerland. This article is an open access article distributed under the terms and conditions of the Creative Commons Attribution (CC BY) license (https://creativecommons.org/licenses/by/4.0/).
Share and Cite
MDPI and ACS Style
Mendes, D.; Pais-Barbosa, J.; Baptista, P.; Silva, P.A.; Bernardes, C.; Pinto, C. Beach Response to a Shoreface Nourishment (Aveiro, Portugal). J. Mar. Sci. Eng. 2021, 9, 1112. https://doi.org/10.3390/jmse9101112
AMA Style
Mendes D, Pais-Barbosa J, Baptista P, Silva PA, Bernardes C, Pinto C. Beach Response to a Shoreface Nourishment (Aveiro, Portugal). Journal of Marine Science and Engineering. 2021; 9(10):1112. https://doi.org/10.3390/jmse9101112
Chicago/Turabian StyleMendes, Diogo, Joaquim Pais-Barbosa, Paulo Baptista, Paulo A. Silva, Cristina Bernardes, and Celso Pinto. 2021. "Beach Response to a Shoreface Nourishment (Aveiro, Portugal)" Journal of Marine Science and Engineering 9, no. 10: 1112. https://doi.org/10.3390/jmse9101112
Note that from the first issue of 2016, this journal uses article numbers instead of page numbers. See further details here.