Research and Analysis of Pressure-Maintaining Trapping Instrument for Macro-Organisms in Hadal Trenches


1
Ocean College, Zhejiang University, No.1 Zheda Road, Dinghai District, Zhoushan 316000, China
2
The Engineering Research Center of Oceanic Sensing Technology and Equipment, Ministry of Education, Zhoushan 316021, China
3
Shanghai Engineering Research Center of Hadal Science and Technology College of Marine Sciences, Shanghai Ocean University, Shanghai 201306, China
4
The key Laboratory of Ocean Observation-Imaging Testbed of Zhejiang Province, Zhoushan 316021, China
*
Author to whom correspondence should be addressed.
J. Mar. Sci. Eng. 2020, 8(8), 596; https://doi.org/10.3390/jmse8080596
Submission received: 5 June 2020
/
Revised: 31 July 2020
/
Accepted: 5 August 2020
/
Published: 10 August 2020
Abstract
:The ecosystem of the abyss is one of the fields that humans hardly know. The ultra-high hydrostatic pressure makes it very difficult to obtain abyssal organisms. Samples are often severely broken during recovery due to changes in environmental pressure, temperature, and other factors. Currently, there are no macro-organism samplers suitable for the abyss. The development of a pressure-maintaining sampler for the abyss is a prerequisite for abyssal ecosystem research. This paper mainly proposed a pressure-maintaining trapping instrument (PMTI) designed to work at a depth above 10,000 m. Unlike typical deep-sea equipment, this instrument is lightweight (about 65 kg in water). The instrument adopts a new structure, using a hollow piston as the sampling space and sealing the mechanism with O-rings at both ends of the piston, thus avoiding sealing methods such as ball valves and greatly reducing the weight of the equipment. The structure and working process of the instrument are described in detail in this paper. Meanwhile, in this paper, the movement resistance of the piston (mainly the resistance of the O-ring) is analyzed using a dynamic explicit method in Abaqus. The factors affecting the friction of the O-rings are analyzed via the method of orthogonal tests and ANOVA. In addition, high-pressure tests were conducted on key parts of the instrument, and the results showed that the instrument works well at 100 MPa.
1. Introduction
The deep sea covers more than 50% of the Earth and is both a treasure trove of biodiversity and a source of important ecosystem services [1]. Although the abyss has become a subject of intense studies in recent years, our knowledge of the diversity of benthic organisms, especially at the molecular level, is far from complete [2]. The abyss is characterized by high pressure, darkness, low temperatures, and nutrient deficiencies. However, observations in recent years have shown that the hadal trench is not a desert of life. In contrast, the hadal trench is a unique ecosystem with considerable material inputs, rich biodiversity, and active benthic activity [3,4]. In recent decades, many countries have conducted biological and geological surveys in the abyssal areas and have obtained some macro-organism samples, including fish, bipeds, etc. [5].
It is very difficult to obtain live samples for laboratory studies. This is because, during the recovery of samples from the seafloor, the animals are severely damaged due to changes in external pressure and temperature. In recent decades, lots of instruments have been developed to capture animals at deep sea and bring them to the surface alive and maintaining the in-situ pressure. Most of the high-pressure instruments were developed to capture microbes in the deep sea due to engineering constraints. A few instruments have been developed to capture macro-organisms. One of the biggest problems is the sealing method. Most of deep-sea pressure-maintaining sampling equipment uses very heavy parts such as ball valves, which causes difficulties in the sampling work. Yayonos constructed a trap (pressure-retaining amphipod traps, PRAT) for bipeds in the deep sea. The amphipods were collected at a depth of 5700 m and kept alive on board for nine days. The PRAT was equipped with an accumulator with gas to prevent pressure loss during the recovery process [6]. Jeffrey C. Drazen developed a hyperbaric oxygen trap-booster instrument to capture and sustain living deep-sea organisms. The system captures the animals outside, guides the animal inside, and closes the door behind the animal. The weight of the instrument is approximately 680 kg. Two layers of 2.5 cm thick open cell foam provide insulation for the barrel. The system is equipped with a hydraulic accumulator, which is filled with nitrogen gas. In addition, a pressure relief valve provides additional safety to the system [7]. B. Shilito and G. Hamel developed the PERISCOPE system. The system has more advanced features such as active compensation of pressure, the suction of organisms, etc. The difference is that the system finishes its job with ROV (Remote Operated Vehicle) assistance. Moreover, the system succeeded in capturing live animals in the deep sea above 2000 m [8].
However, most current devices are costly and heavy. Some equipment also requires ROV assistance to work. There are few instruments for capturing large organisms in the hadal trench (depths over 6000 m) [9,10,11,12,13,14,15,16]. We have built a pressure-maintaining trapping instrument (PMTI) specifically designed to capture macro-organisms in the hadal trench. The advantages of the PMTI are that (1) the instrument can operate at a depth above 10,000 m. (2) The PMTI weighs much less (about 65 kg underwater) than most of the equipment with the same function.
This paper presents the structure of the PMTI and investigates the resistance of the piston to move. The factors affecting the piston movement were evaluated using orthogonal tests and ANOVA, and the results of the calculations were validated by the experiment. In addition, we performed a high-pressure test (over 100 MPa) and held the pressure for 12 h on some crucial parts of PMTI. To verify the feasibility of the explicit dynamic analysis, the resistance is tested in a laboratory. Experiment results are consistent with the analysis results.
2. Material and Methods
2.1. Structure of the PMTI
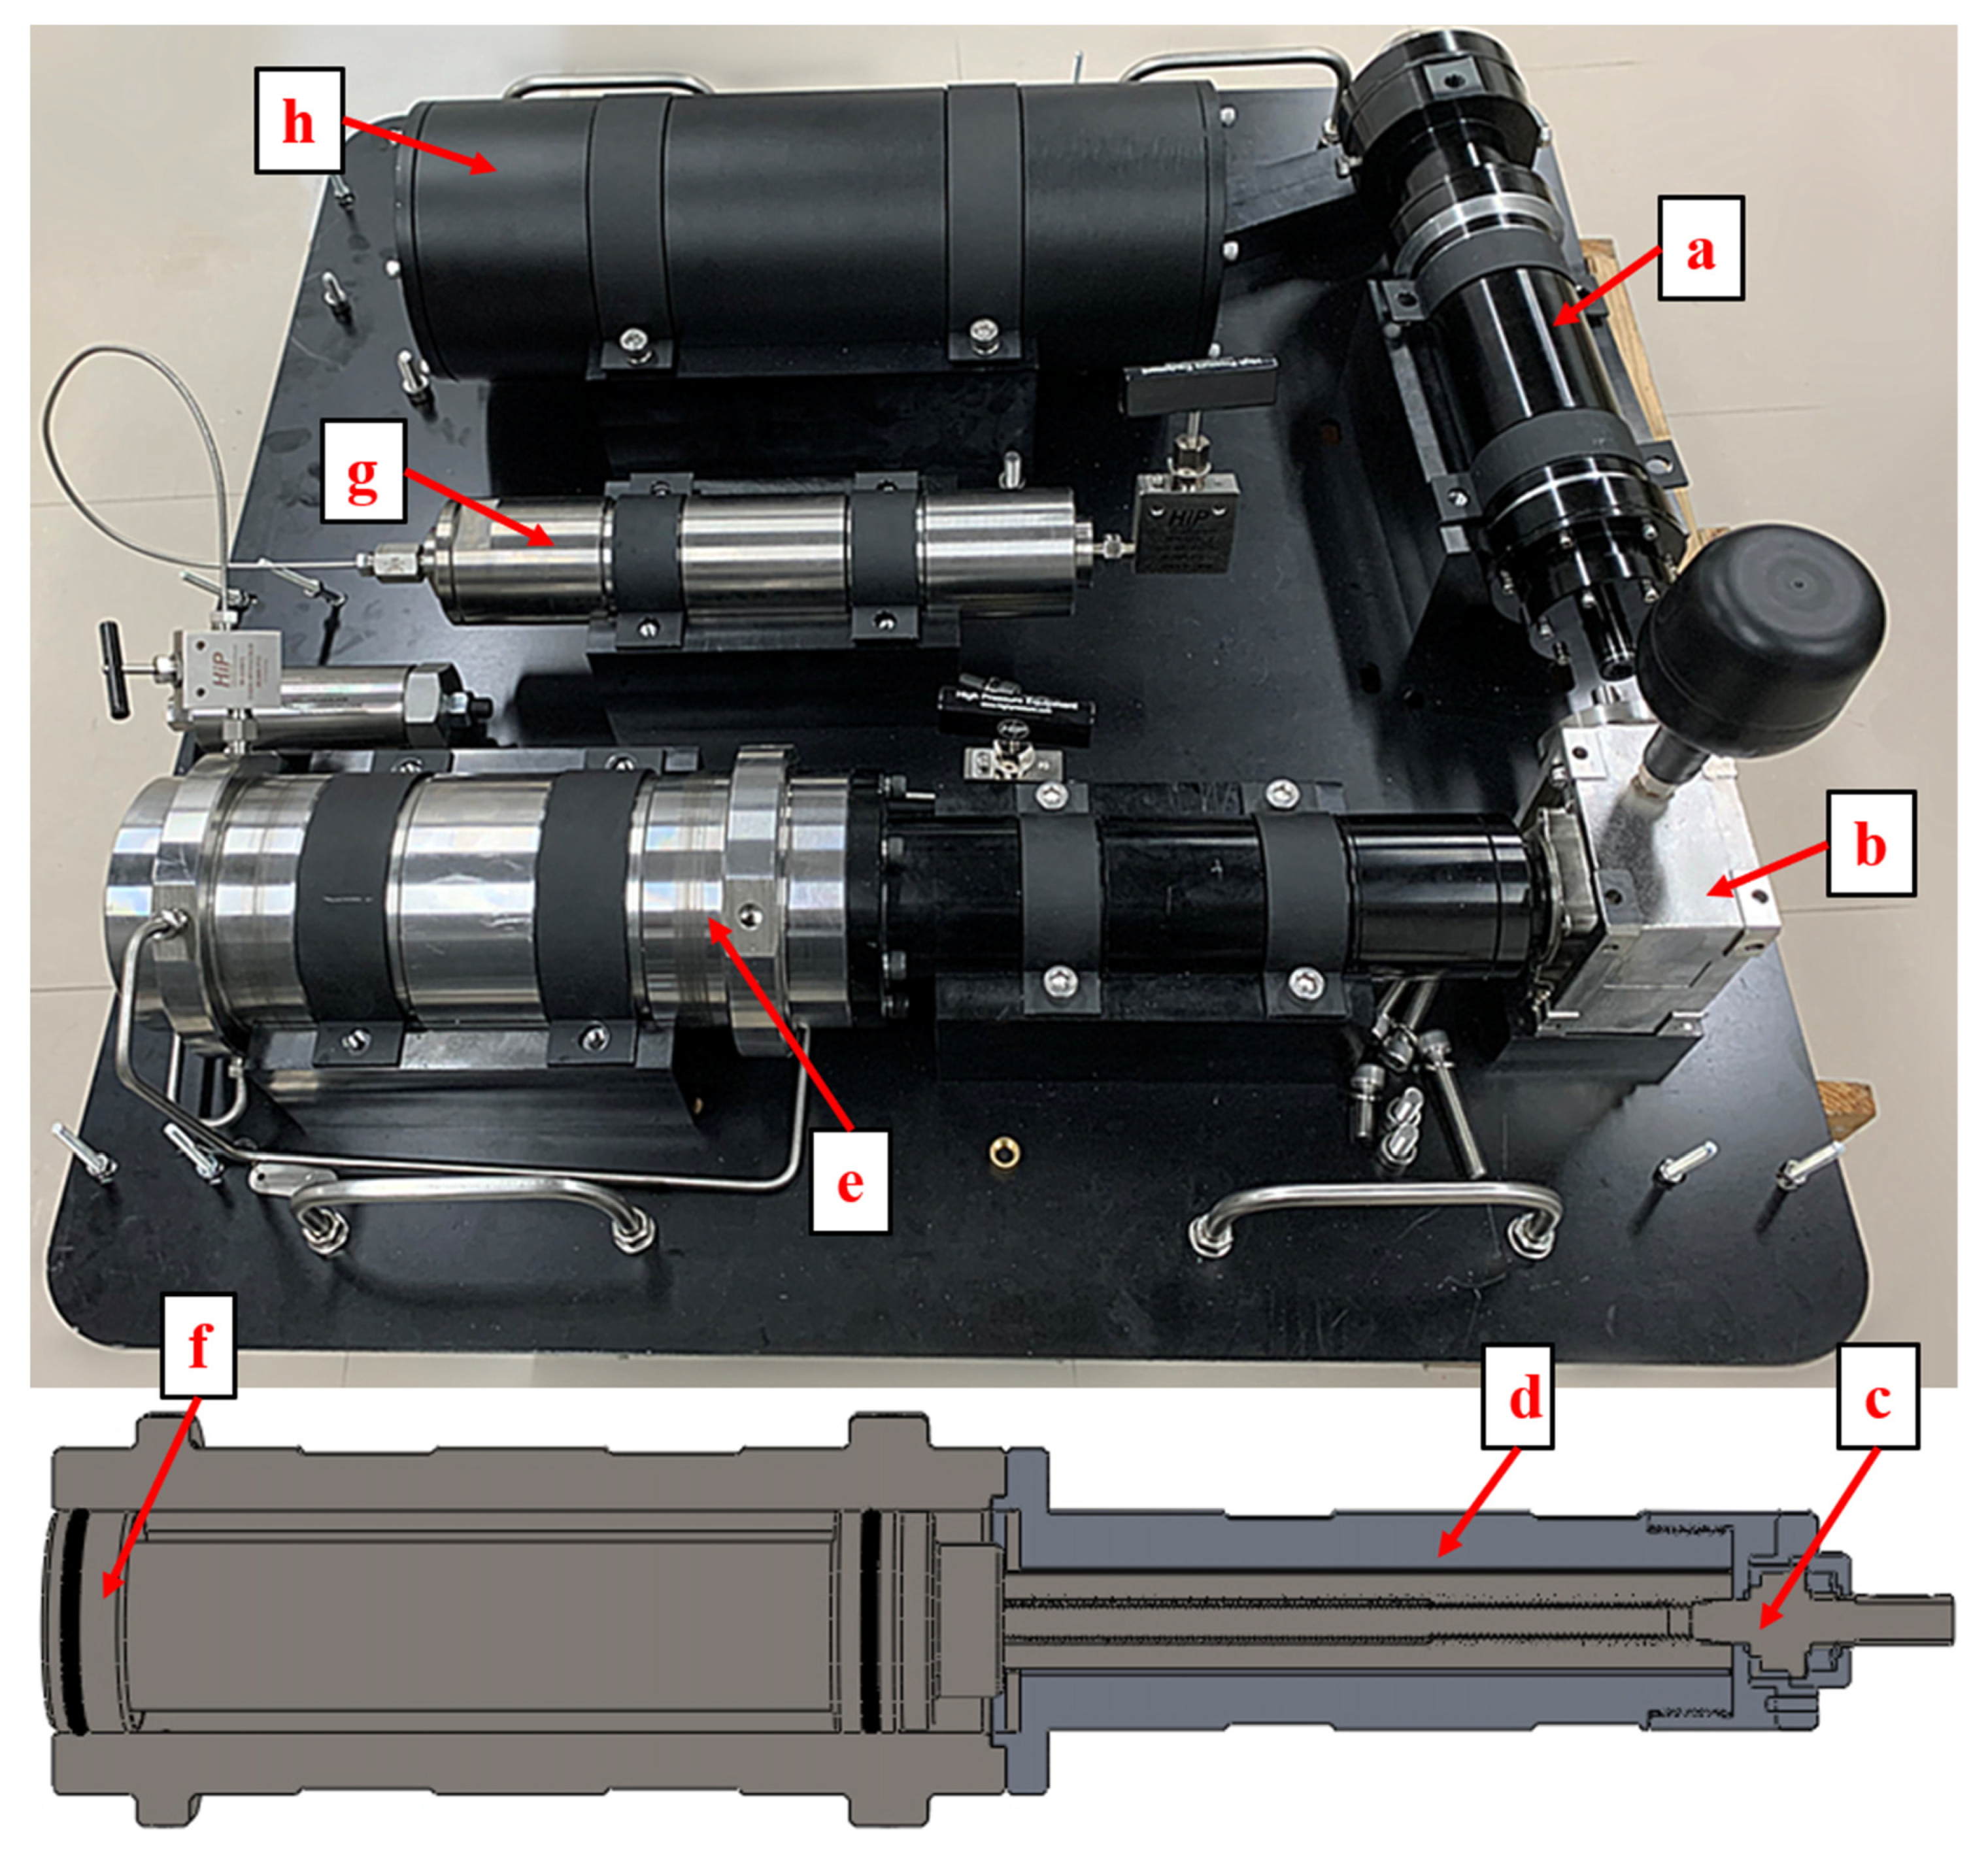
Figure 1 shows the PMTI prototype.
In Figure 1, (a) is the oil-filled compensation DC motor. It consists of a motor, a motor chamber, and a pressure compensator, which keeps the internal pressure equal to external pressure, thus eliminating rotational resistance due to differential pressure. The material of the cabin is aluminum 6061. (b) is a gearbox. The gearbox housing is filled with oil to slow down corrosion by seawater. (c) is a screw made of stainless steel 316. The drive screw fits the reducer through the keyway, and it connects to the drive nut (not shown) via a trapezoidal thread. The diameter of the screw is 18 mm and the length is 420 mm. (d) is a guide cylinder to limit nut rotation. It is made of aluminum alloy. (e) is a pressure-retaining cylinder with a thick wall. Considering the strength and corrosion resistance of the material, it is made of precipitation-hardened stainless steel 17-4PH. The apparent weight of the cylinder is 15.5 kg, the inner diameter is 80 mm, the outer diameter is 125 mm, and the length is 341 mm. There are holes in the wall of the cylinder for connecting the accumulator (g) and the pressure sensor, temperature sensor, etc. The wall of the cylinder has been thickened at the aperture. (f) is a hollow piston used to capture organisms. It is made of precipitation-hardened stainless steel 17-4PH. The hollow part of the piston is used for capture, and the sidewall is used to withstand the pressure. The apparent weight of the piston is 3.2 kg. The pistons have a hollow section width of 55 mm and a length of 240 mm. (g) is an accumulator to compensate for pressure loss during the recovery process. It is made of titanium alloy TC4. (h) is the circuit board chamber. The circuit board chamber contains a pressure compensator and a circuit board fixing board. It is made of aluminum 6061.
2.2. Work Process
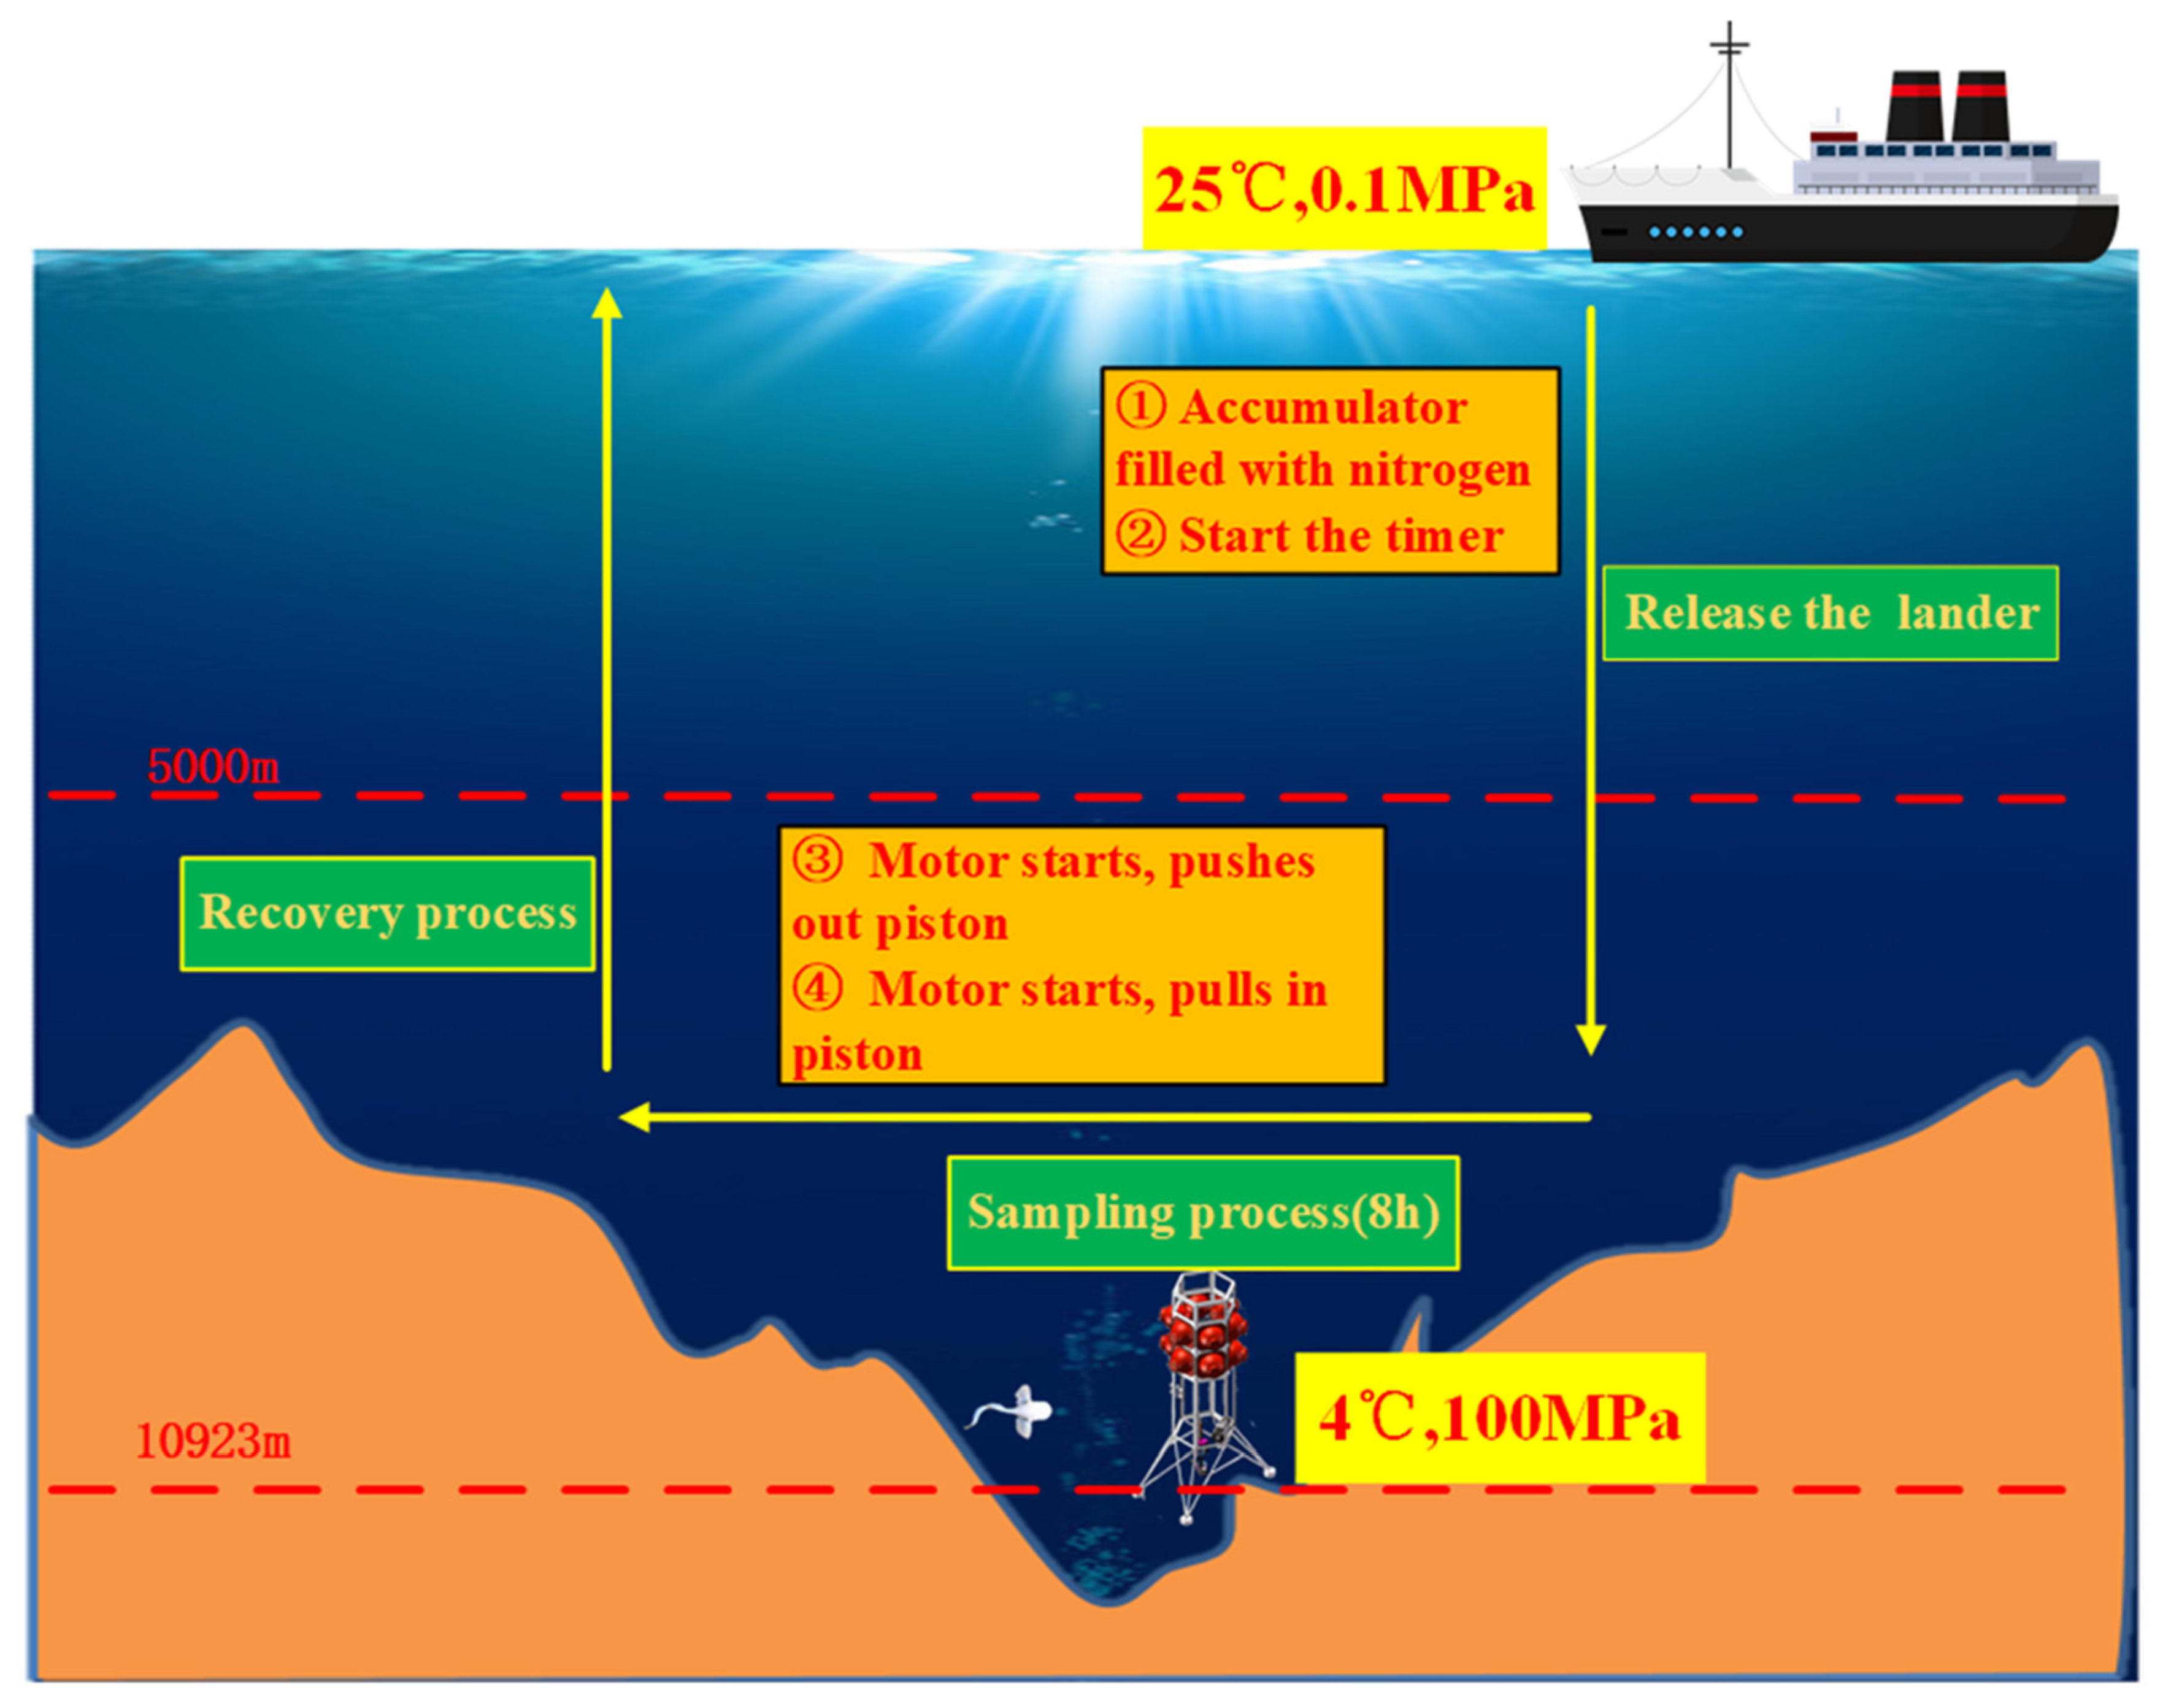
Figure 2 shows the work process of the PMTI.
Before putting the equipment on the sea floor, we put bait in the hollow part of the piston. After the device descends to the seabed with the lander, the controller will send a start signal to the motor. Then, the piston is pushed out of the pressure-retaining cylinder. Nearby, creatures will be attracted to the piston by the bait. After a period of time, the controller sends a reverse signal to the motor, and the piston is pulled into the sampling cylinder. At this point, the creature has been trapped in the piston. During the recovery process, the accumulator compensates for pressure losses due to changes in outside temperature and pressure.
2.3. Control System
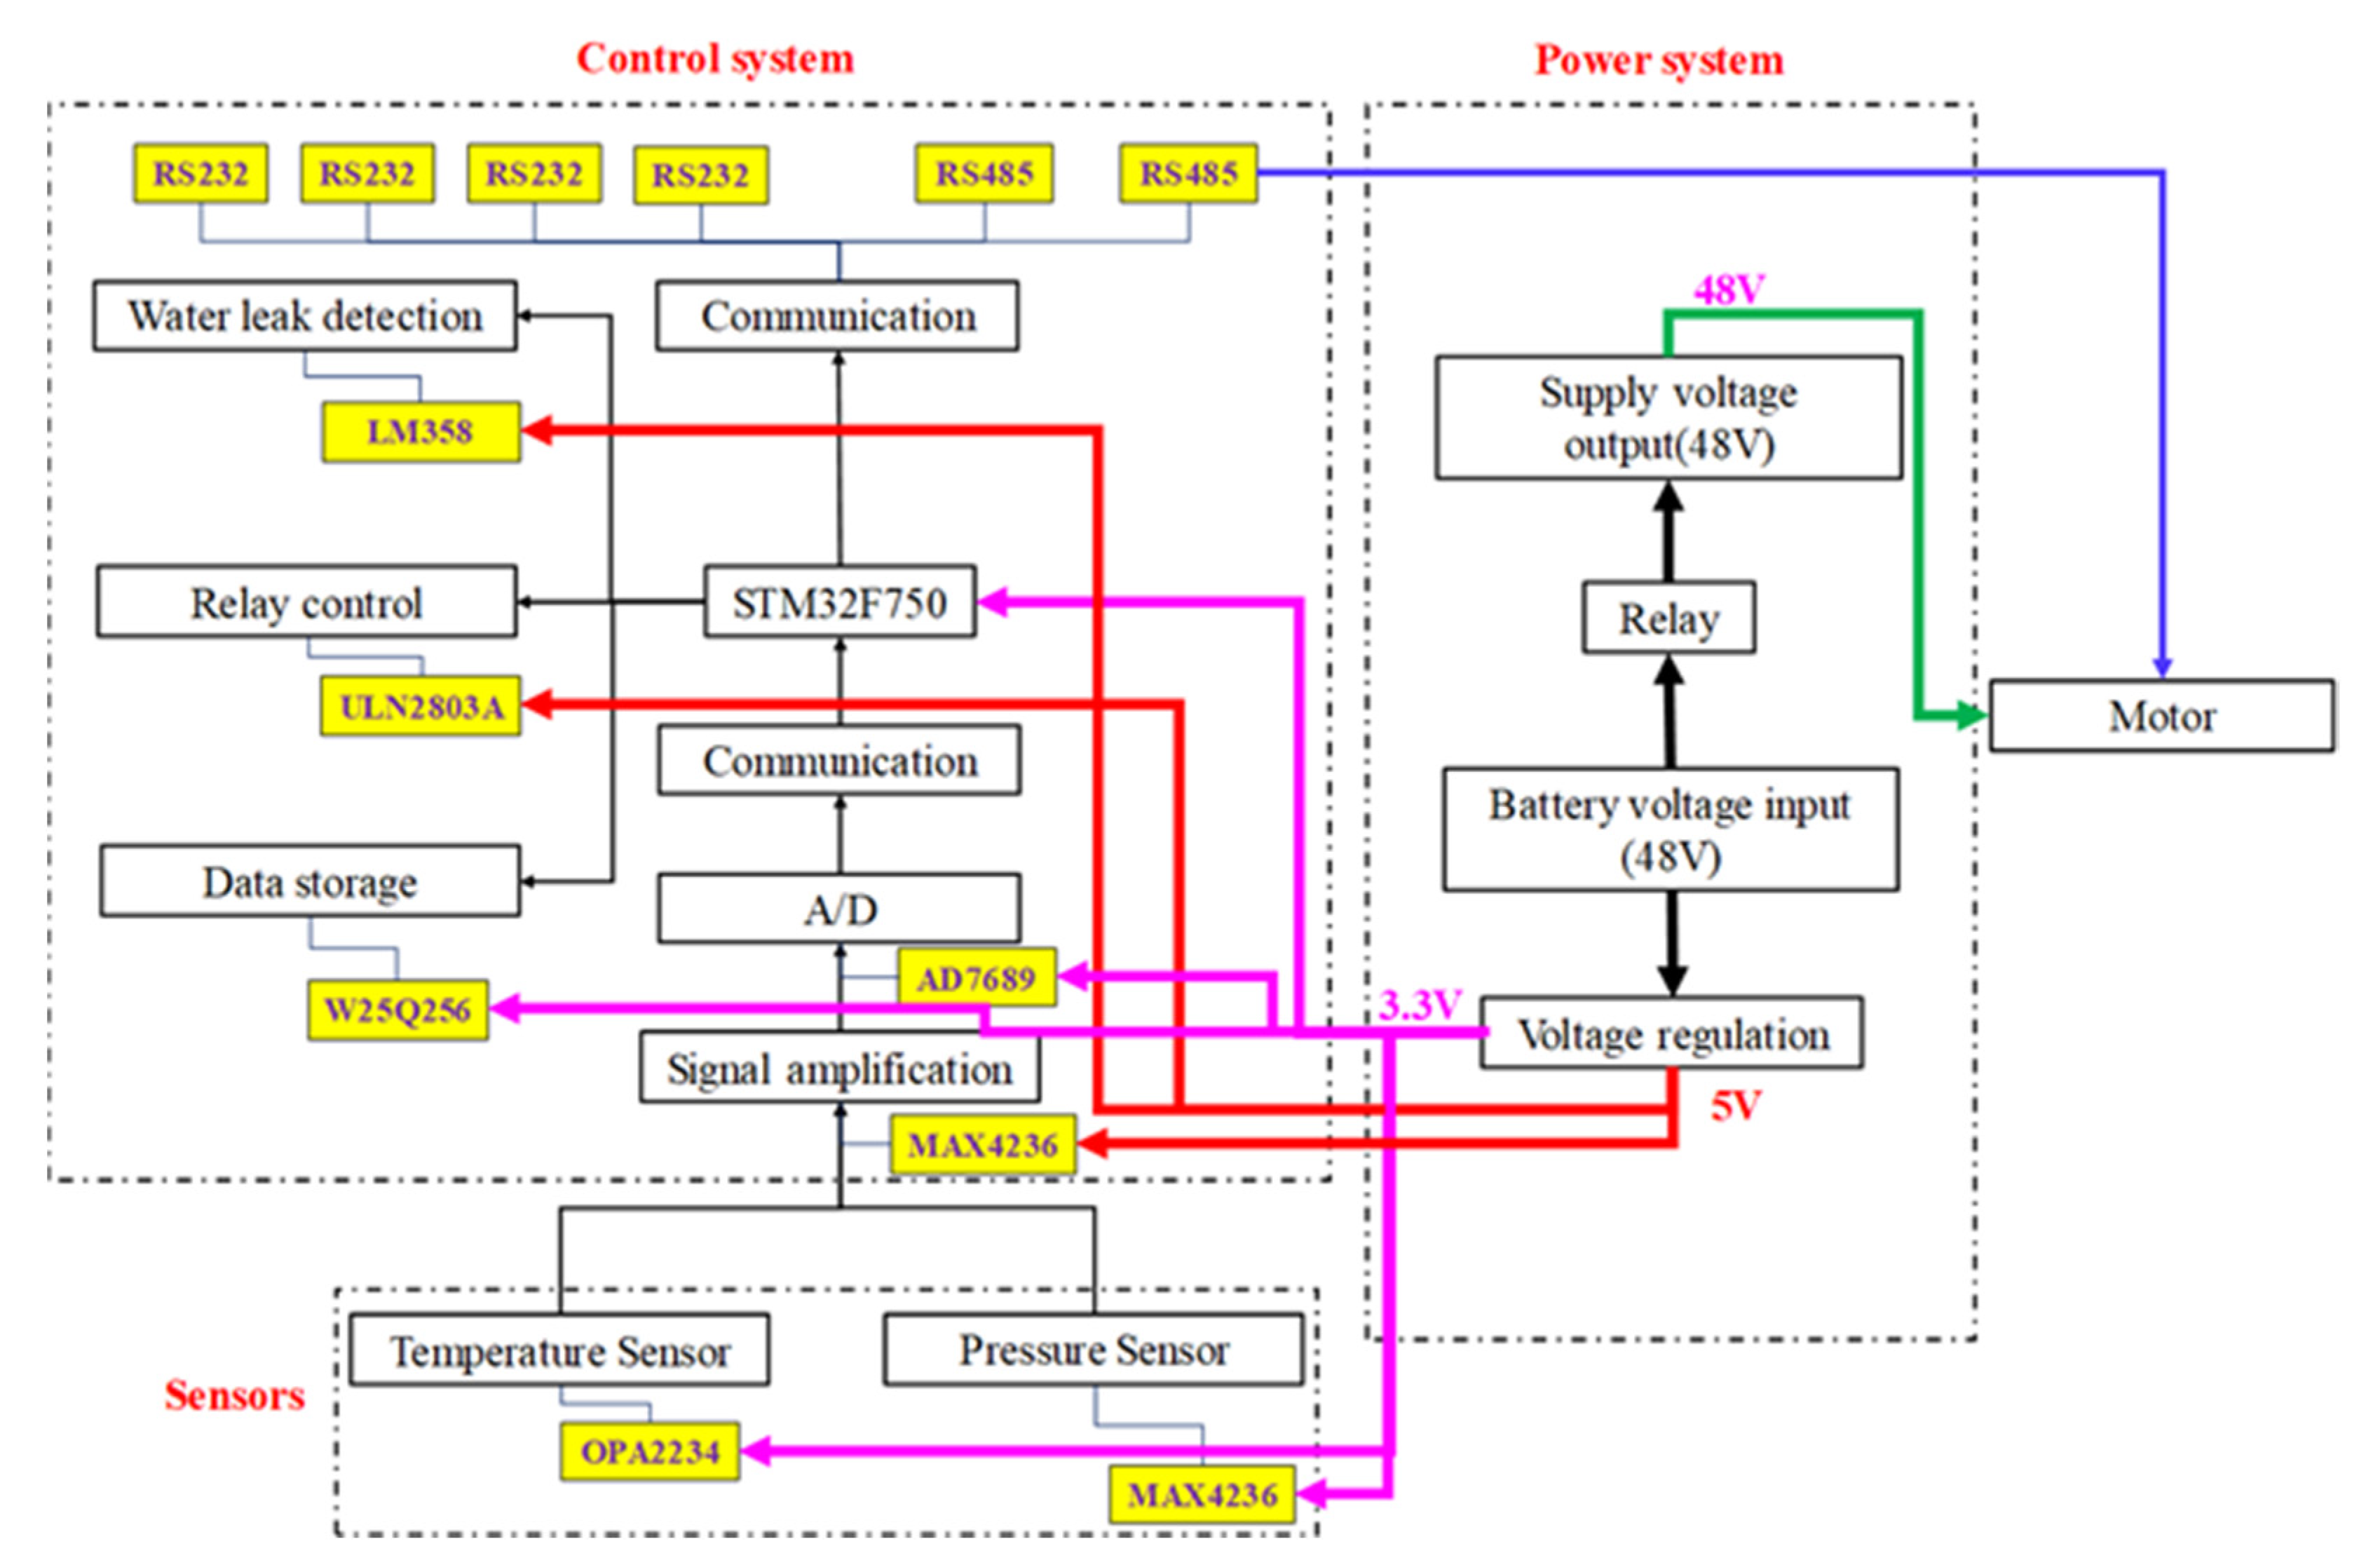
The PMTI control system is shown in Figure 3. The data collected by the temperature and pressure sensors are amplified, AD-converted (analogue-to-digital converted), and transferred to the main controller STM32F750, which is then stored on the data memory W25Q256. The water leak detection function of the control system is implemented by the LM358 chip. The relay control is implemented via ULN2803A.
The battery is equipped with a voltage of 48 V, which is then stepped down to supply 5.5 V and 3 V to the control system. Forty-eight volts of power is supplied directly to the DC motor. The motor communicates with the control system via RS485, and all the components of the PMTI control system board are high voltage resistant. The PCBs (Printed Circuit Board) have been passed through a high voltage test.
3. Analysis of the Piston Movement Resistance
3.1. The Resistance of O-Ring
It is necessary to study at which point the maximum resistance appears when the piston moves in the cylinder. During the pushing-out process, the resistance comes mainly from the friction between two O-rings and the inner wall of the cylinder. During the pull-in process, the resistance includes the axial friction of the inner O-ring and resistance due to radial compression of the outer O-ring when it goes into the cylinder. Therefore, the maximum resistance of the piston movement appears during the pull-in process.
In order to study the resistance of the pull-in process, we established a finite element model to analyze.
3.2. Basic Assumptions
Many factors affect the motion resistance between the O-ring and the inner wall of the cylinder, including the compression rate of the O-ring, the friction coefficient between the O-ring and the cylinder wall, the material of the O-ring, and the relative movement speed.
The following assumptions are made: (1) the influence of temperature changes on the properties of rubber materials is not considered. (2) The volume of the rubber material is constant, and it is regarded as a superelastic body. (3) The piston and the outer cylinder are regarded as rigid bodies, and only the deformation of the O-ring is considered [17].
3.3. Orthogonal Test
This study is a four-factor, four-level study. The orthogonal test design can uniformly cover all test factors and levels while avoiding the distortion of test results. A full-scale test required too many tests. Therefore, the following orthogonal test (shown in Table 1) is designed (including four test error groups: group 17, group 18, group 19, and group 20).
The hardness of commonly used rubber O-rings is between 70 and 85, so we have set 70, 75, 80, and 85 four groups. According to industry standards for O-ring design, the compression ratio of O-rings used for dynamic seals under high pressure should be greater than 15% and less than 25%. Because of the high working pressure of O-rings in this study, we set 18%, 19.5%, 21%, and 22.5% four groups. This device is designed to trap deep-sea macro-organisms, and when the organisms enter the piston, we should pull the piston into the cylinder very slowly to prevent the creature from escaping. Thus, we set the speed as 1 mm/s, 2 mm/s, 3 mm/s, and 4 mm/s. The friction coefficient is 0.1, 0.15, 0.2, and 0.25.
3.4. Constitutive Model of Superelastic Materials
The main material of the O-ring is rubber. Rubber is a superelastic material and a highly nonlinear composite material. Aiming at its geometrically nonlinear behavior under large deformation, this paper uses the two-parameter Mooney-Rivlin model to describe its constitutive relationship. The model is [18]
The model is reliable when the strain is within 150%. For rubber materials, the relationship between the elastic modulus E and the shear modulus G is
The relationship between Poisson’s ratio, elastic modulus, and material constant can be described using Formula (3).
The fitting formula of rubber hardness Hr (IRHD) and elastic modulus E is
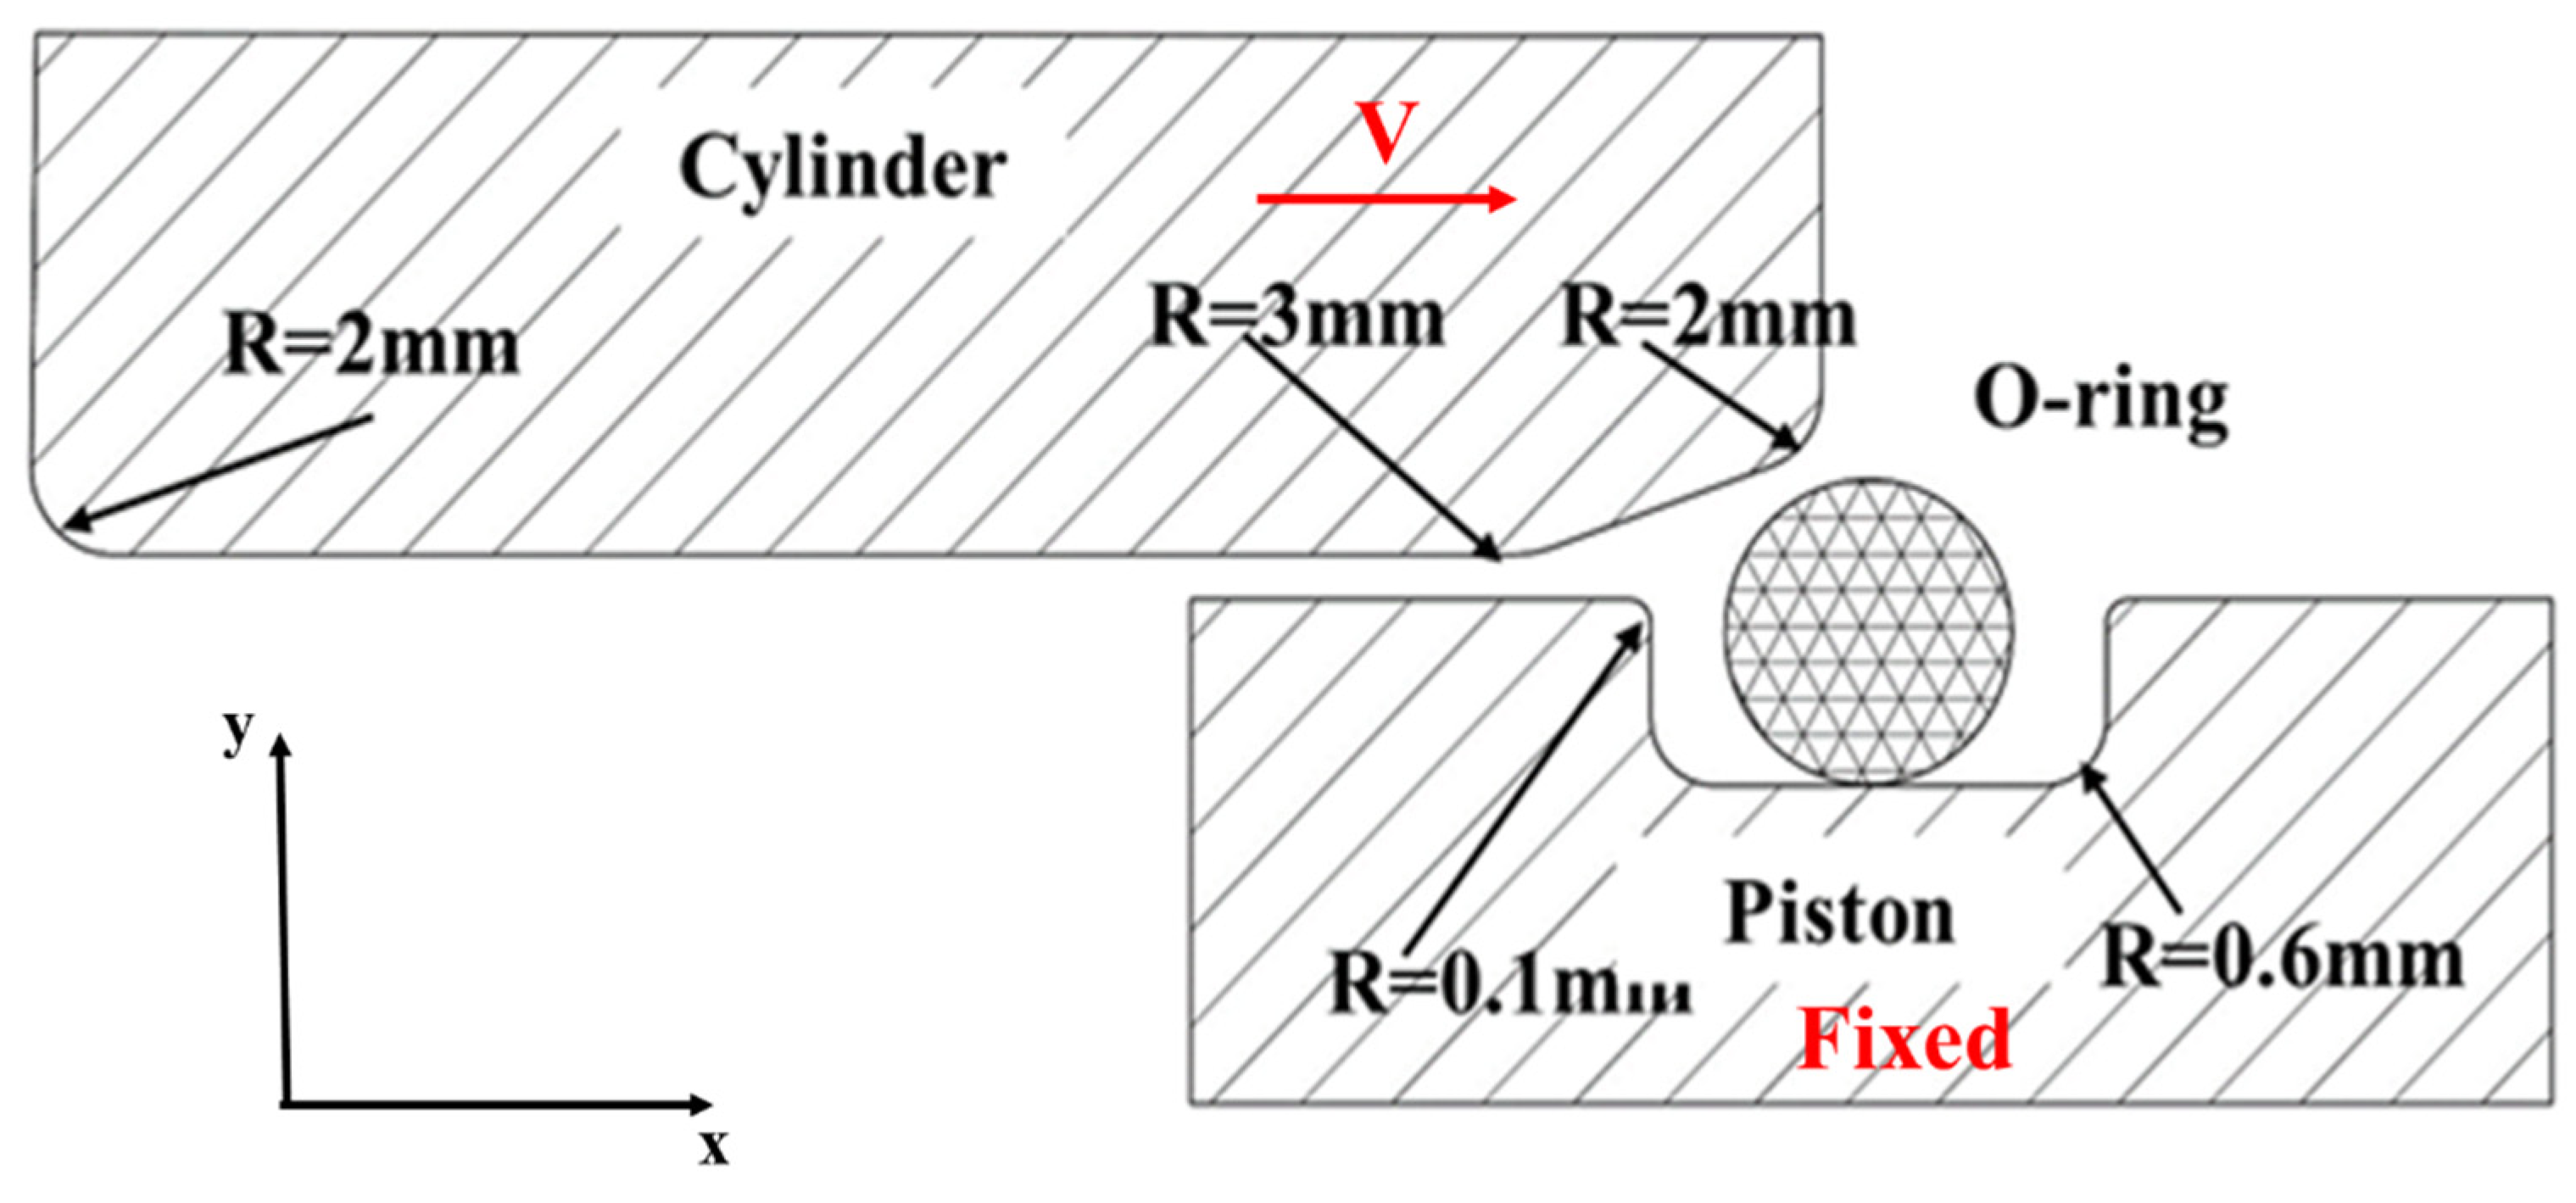
3.5. Finite Element Model
In order to improve the efficiency of the solution, an axisymmetric finite element model was developed for analysis. Figure 4 shows the geometric model of the analysis. Since the maximum resistance occurs during the pull-in process, we therefore analyze that process. In this study, the diameter of the O-ring was 3.55 mm. Generally speaking, the frequently used O-ring diameter is 2.65 mm, 3.55 mm, and 5.3 mm. The diameter of the piston is 80 mm. According to the mechanical design standard, the size of the O-ring used for the hydraulic dynamic sealing of the piston with this diameter can be 3.55 mm or 5.3 mm. In order to reduce the resistance of the movement process, thereby reducing the energy consumption, that is, reducing the weight of the battery required for the device, we chose a 3.55 mm O-ring. The corresponding groove length is 4.2 mm and the depth is 2.7 mm. Since this study focuses on the deformation of the O-ring, and the deformation of the cylinder and piston is really small compared to the O-ring, we set the cylinder and piston as rigid bodies. We set up two contact pairs: the inner wall of the cylinder to the O-ring and the groove surface to the O-ring. Both contact pairs are hard-soft surface contact. O-rings are set to the soft surface. This is because the stiffness of the O-ring is much smaller than that of the piston and the cylinder, and the mesh size of the O-ring is smaller than that of the piston and the cylinder. The tangential feature of the contact is defined as a penalty friction type. The friction coefficient varies from 0.1 to 0.25. The O-ring unit uses the CAX4RH unit. This unit is a four-node bilinear axis-symmetrical quadrilateral unit, which is suitable for large deformation characteristics of rubber materials in this study. Regarding the boundary conditions, we apply a completely fixed constraint to the piston and a constant velocity to the cylinder along the positive direction of the x-axis. The approximate global dimension of the units of O-ring is 0.05 mm. We refined the units for the areas where the groove and cylinder are in contact with the O-rings, and we verified the independence of the model mesh.
We set up two steps. The first analysis step is the initial analysis step. In the first analysis step, all parts remain stationary. The second analysis step is an explicit dynamics analysis step. In this step, the cylinder moves at a constant speed along the positive direction of the x-axis. In order to make the displacement of each group the same, the time setting of each analysis step is different. In addition, we set the field output and the history output and record the reaction force of the cylinder during the movement and the contact stress between the O-ring and the inner wall of the cylinder. The Mises stress change and the contact stress of the O-ring during the movement was also recorded.
3.6. Results of Orthogonal Test
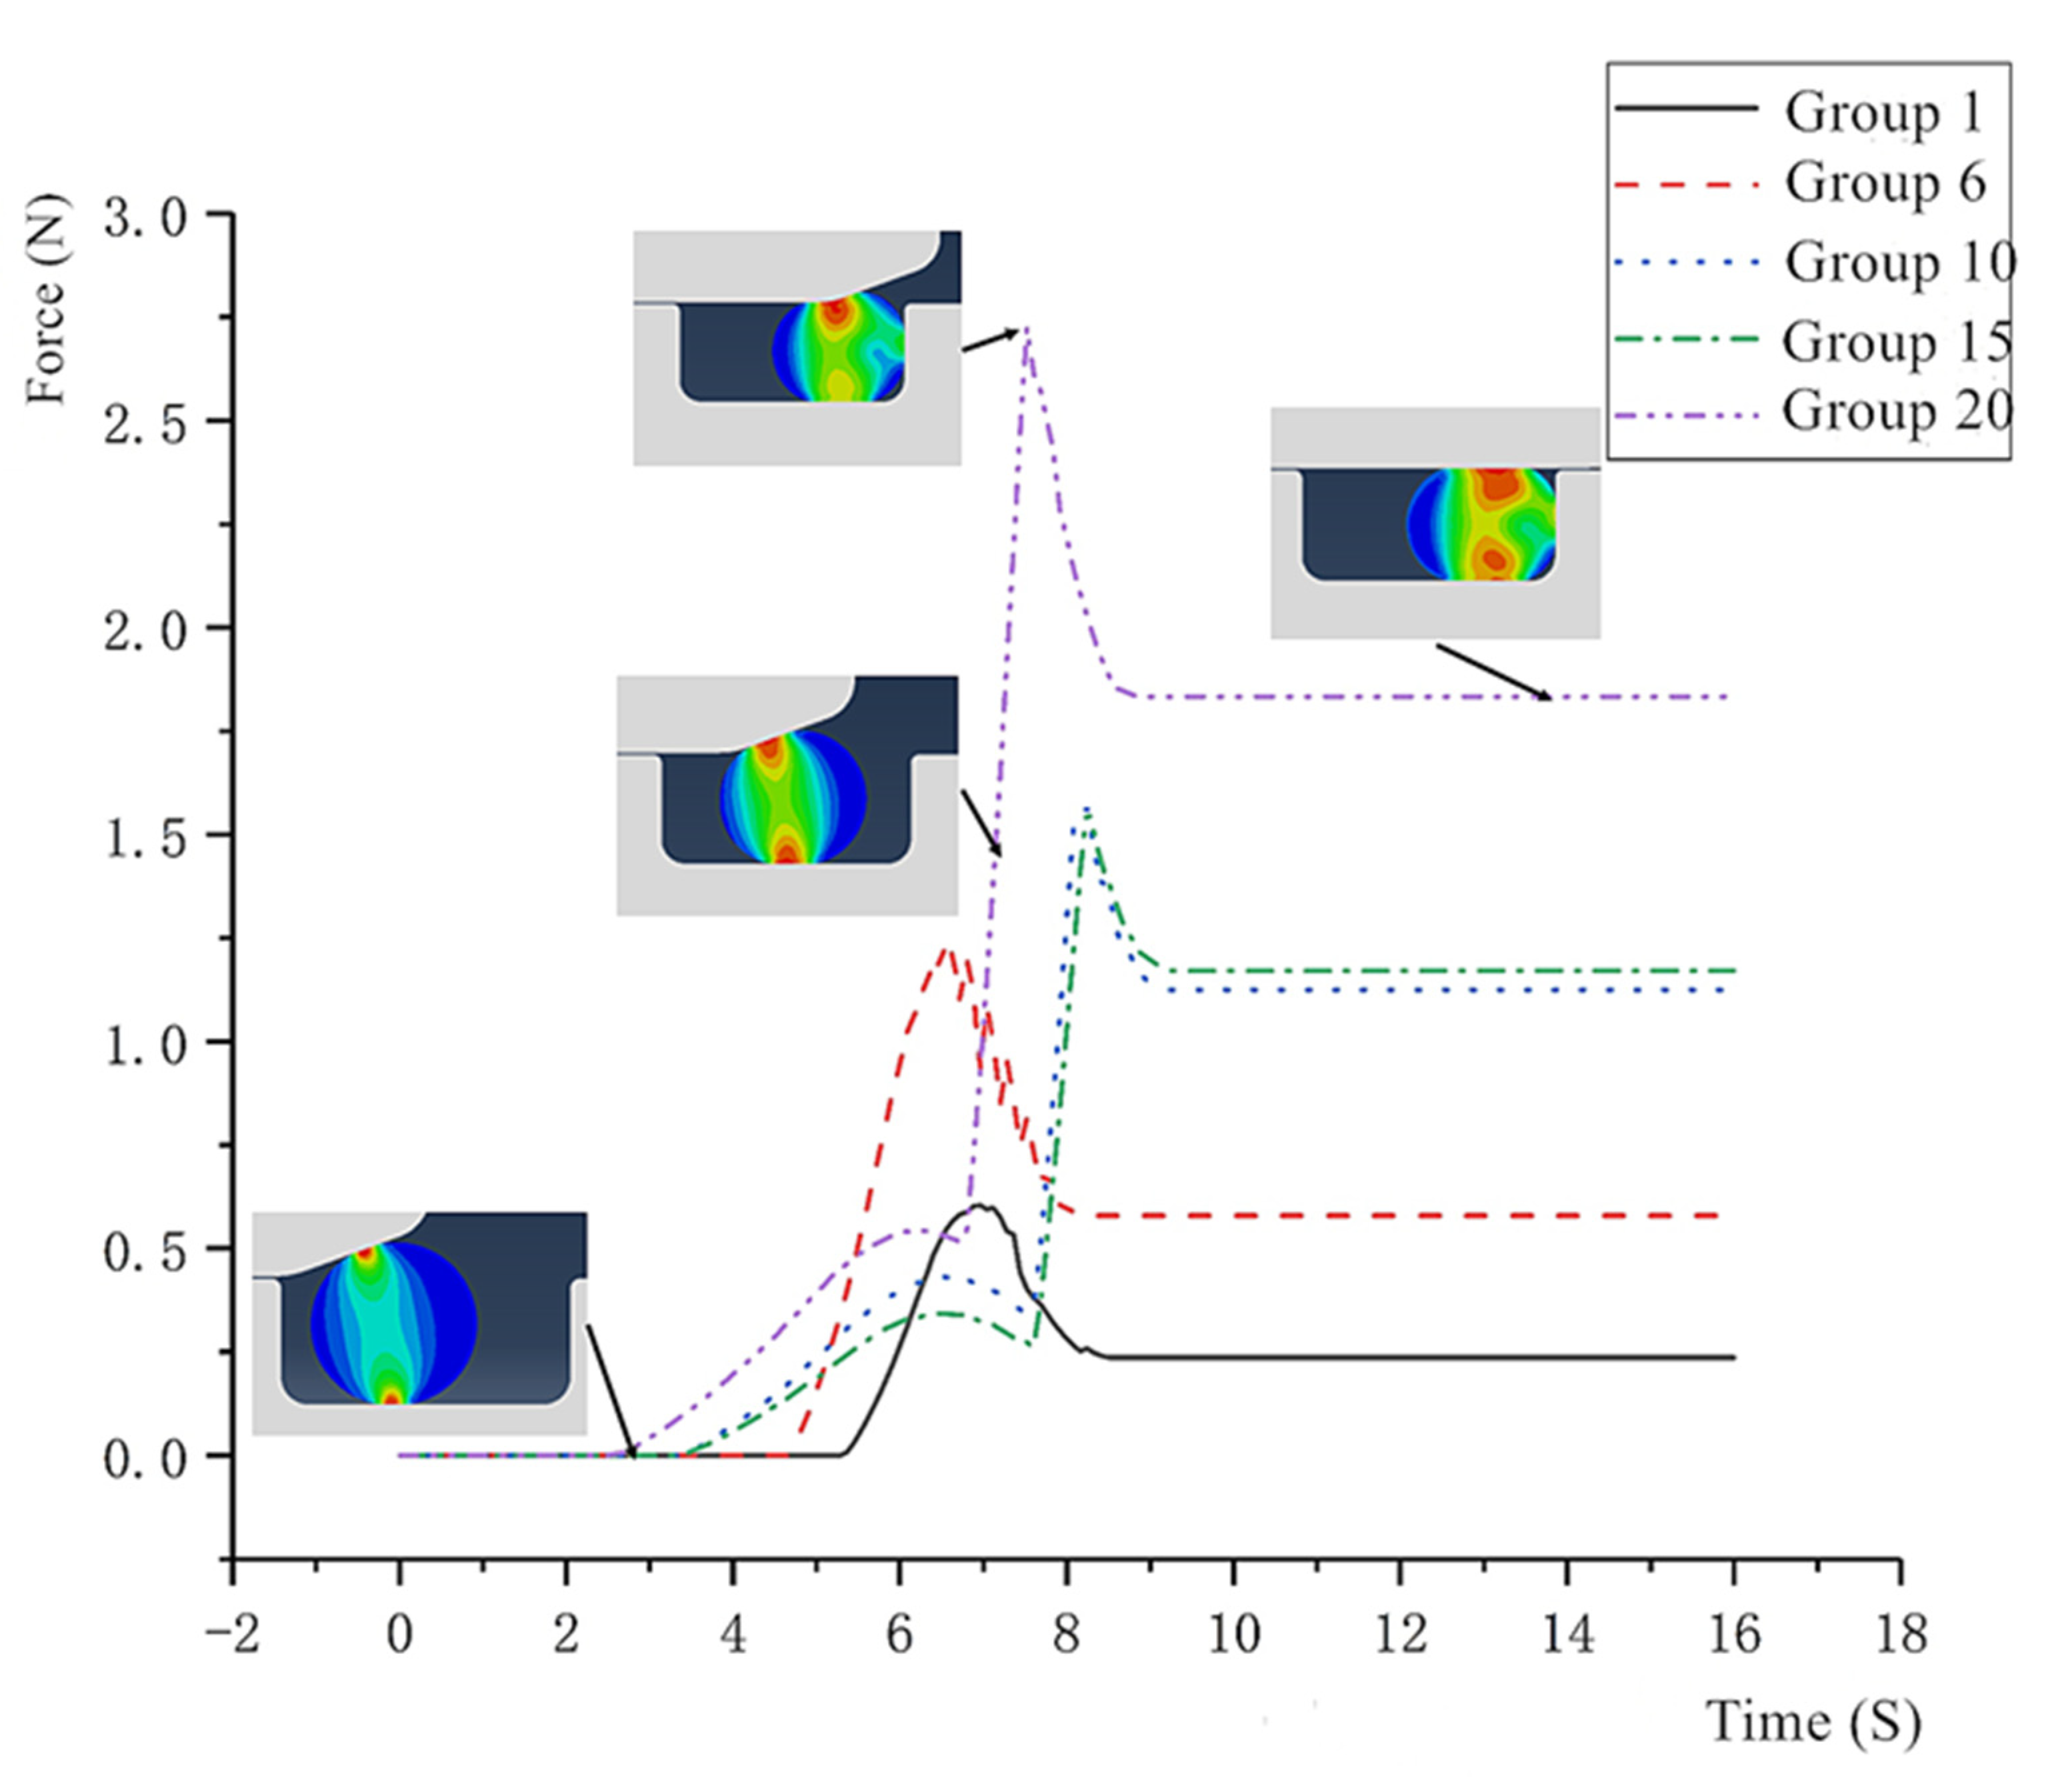
Figure 5 shows the results of the groups numbered 1, 6, 10, 15, and 20 in the orthogonal table. It can be seen that the shapes and trends of the curves are similar. That is, the friction increases first, reaches the maximum, and then decreases, and finally reaches the stabilization stage. This result is consistent with the actual change in resistance during the piston moving into the cylinder. The resistance begins to increase when the O-ring contacts the cylinder. When the O-ring reaches the specified compression rate, the resistance reaches the maximum, and then the resistance begins to decrease until a fixed value, i.e., the relative stable movement stage.
To investigate the extent to which each factor affects the maximum resistance and the stable resistance, univariate ANOVA is performed on the results of the orthogonal experiment [21]. The main effects of each factor on the maximum resistance and the stable resistance are analyzed using SNK (Student-Newman-Keuls) comparative analysis. The significance level of the analytical model is α = 0.05, i.e., the results of the analysis are considered to be 95% reliable when the significance level of each factor is less than α. The results of the analysis are shown in Table 2 and Table 3 [22].
The result of the ANOVA of the maximum resistance shows that the hardness of the material has the greatest influence on the maximum resistance, followed by the compression rate of the O-ring, and the friction coefficient also has a certain influence on the maximum resistance, but its significance is less than the previous two factors. The result of the ANOVA of resistance of the stabilization phase shows that the friction coefficient has the greatest influence on the friction in the stabilization phase, followed by the hardness of the material. Relative motion speed has no obvious effect on the resistance of these two motion stages. It should be noted that the premise of this study is that the relative motion speed is very low. If the relative motion speed is high, the results may be different.
Numerical simulations in Abaqus and the results of ANOVA on several factors affecting friction indicate that the compression ratio, coefficient of friction, material hardness, and speed of relative movement differ in the significance of the effect of friction. Greater compression ratio, greater coefficient of friction, or greater material hardness will cause the friction between the O-ring and the cylinder wall to significantly increase. The effect of the speed of relative movement on the friction can be negligible. In order to reduce friction, we should choose a smaller compression ratio, smaller coefficient of friction, and smaller material hardness. On the other hand, if the compression ratio is too small, the contact width and the contact stress between the O-ring and the cylinder wall are reduced, which may lead to poor sealing performance. Thus, we made a compromise in the design of the compression ratio: the design of the compression ratio is 20%. If the material hardness of the O-ring is too small, the O-ring will be squeezed into the gap between the piston and the cylinder at high pressure, which will cause shear damage of the O-ring. Thus, we chose a medium hardness of Hr = 80. The coefficient of friction is mainly related to surface machining accuracy and lubrication. However, the smoother the surface is, the higher the processing costs. Thus, we chose a relatively high surface roughness of Ra = 0.4.
Since the force we obtained in the model is from an axisymmetric model. We need to integrate the resistance on the entire circle to obtain the total resistance of the O-rings. It can be calculated according to Formula (6):
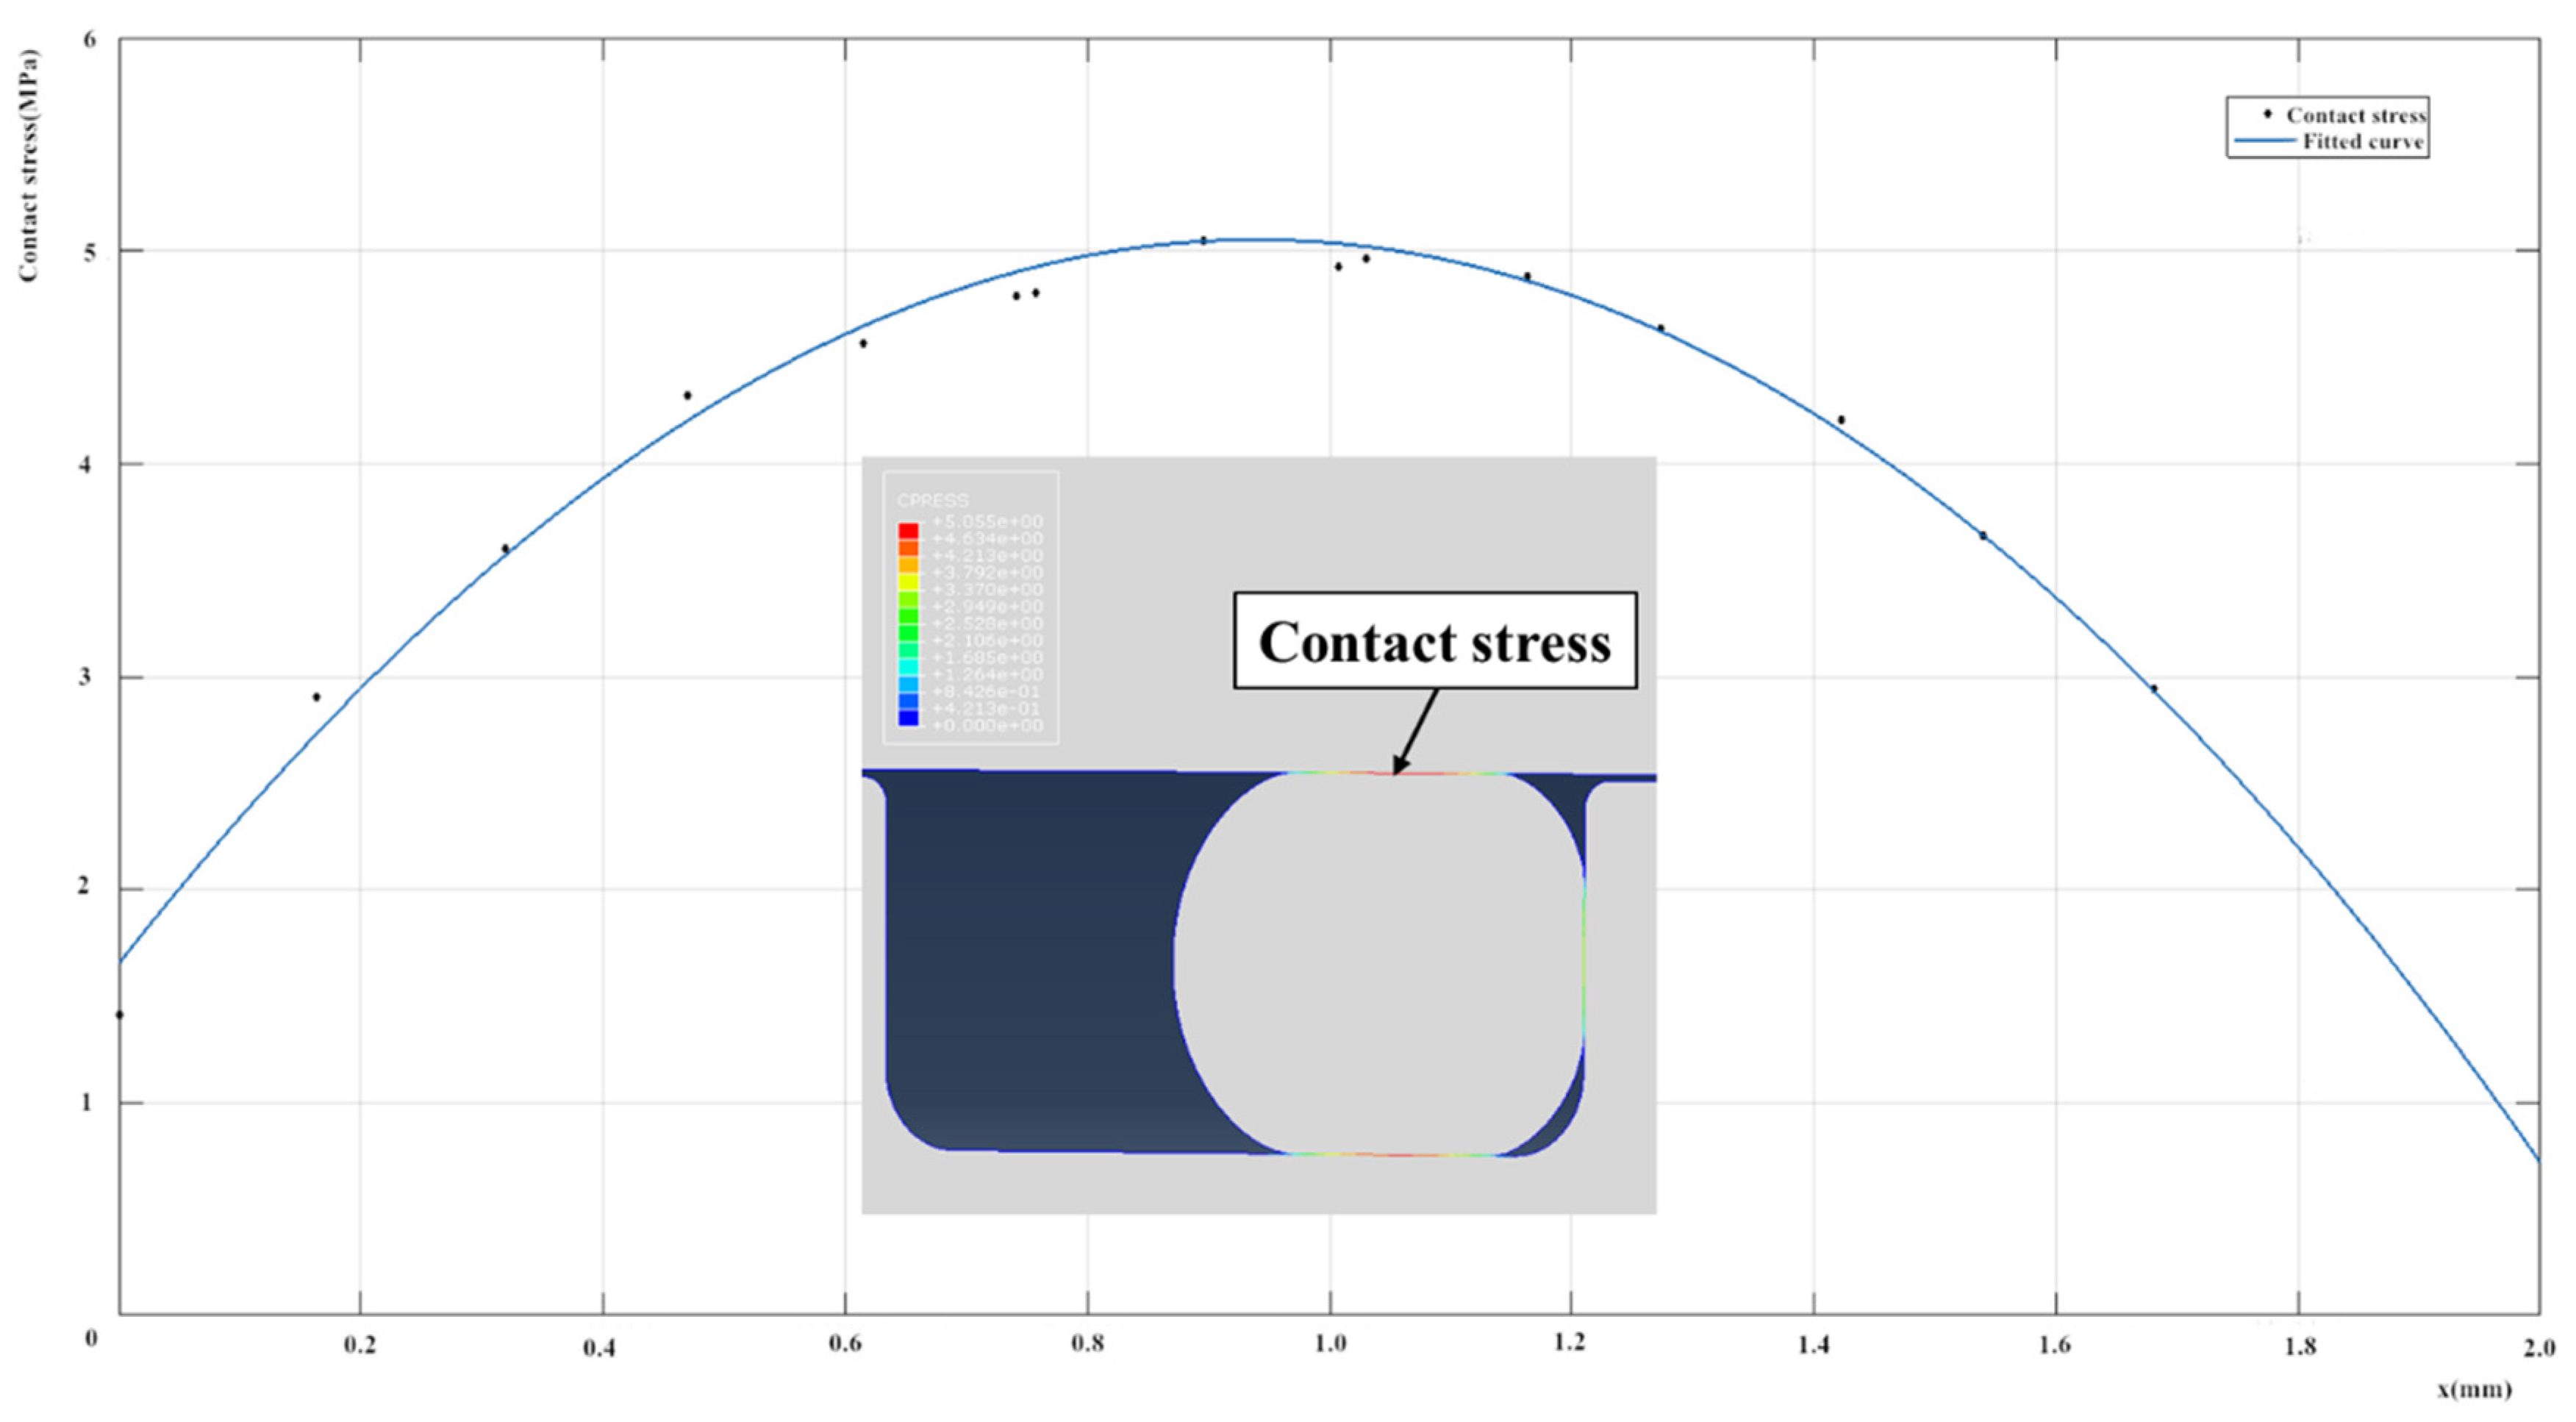
To calculate the motion resistance of the seal structure we designed, we need to obtain the contact stress distribution p(x) between the O-ring and the inner wall of the cylinder. We obtained the contact stress distribution of the O-ring in Abaqus and fitted it as a quadratic function in Matlab. The results are shown in Figure 6. The distribution of contact stress can be described using Formula (7):
We integrate p(x) along the contact width to get the total contact stress of this section. Then, we can obtain the total resistance of the O-rings according to Formula (6). The calculation result is 30.84 N.
Karaszkiewicz studied similar problems. He established a mathematical model. The model describes the length of the contact area, the maximum contact stress, and the stress distribution as follows [23]
Table 4 shows the difference between the analysis results and the calculation results of the Karaszkiewicz model (in the table, lf and sf are the results of the contact length and maximum contact stress studied in this paper, and lk and sk represent the values of the Karaszkiewicz model).
From the contact length and contact stress distribution, it can be concluded that the simulation data overlap better with the Karaszkiewicz model calculation results when the compression rates are less than 21%, with a difference within 7%. As the compression rate increases, the rubber hardness increases and the simulation results deviate from the Karaszkiewicz model. This may be related to the superelastic nature of the O-ring. This simulation method has high confidence at compression rates of less than 20%.
4. Experiments
4.1. High Pressure Tests
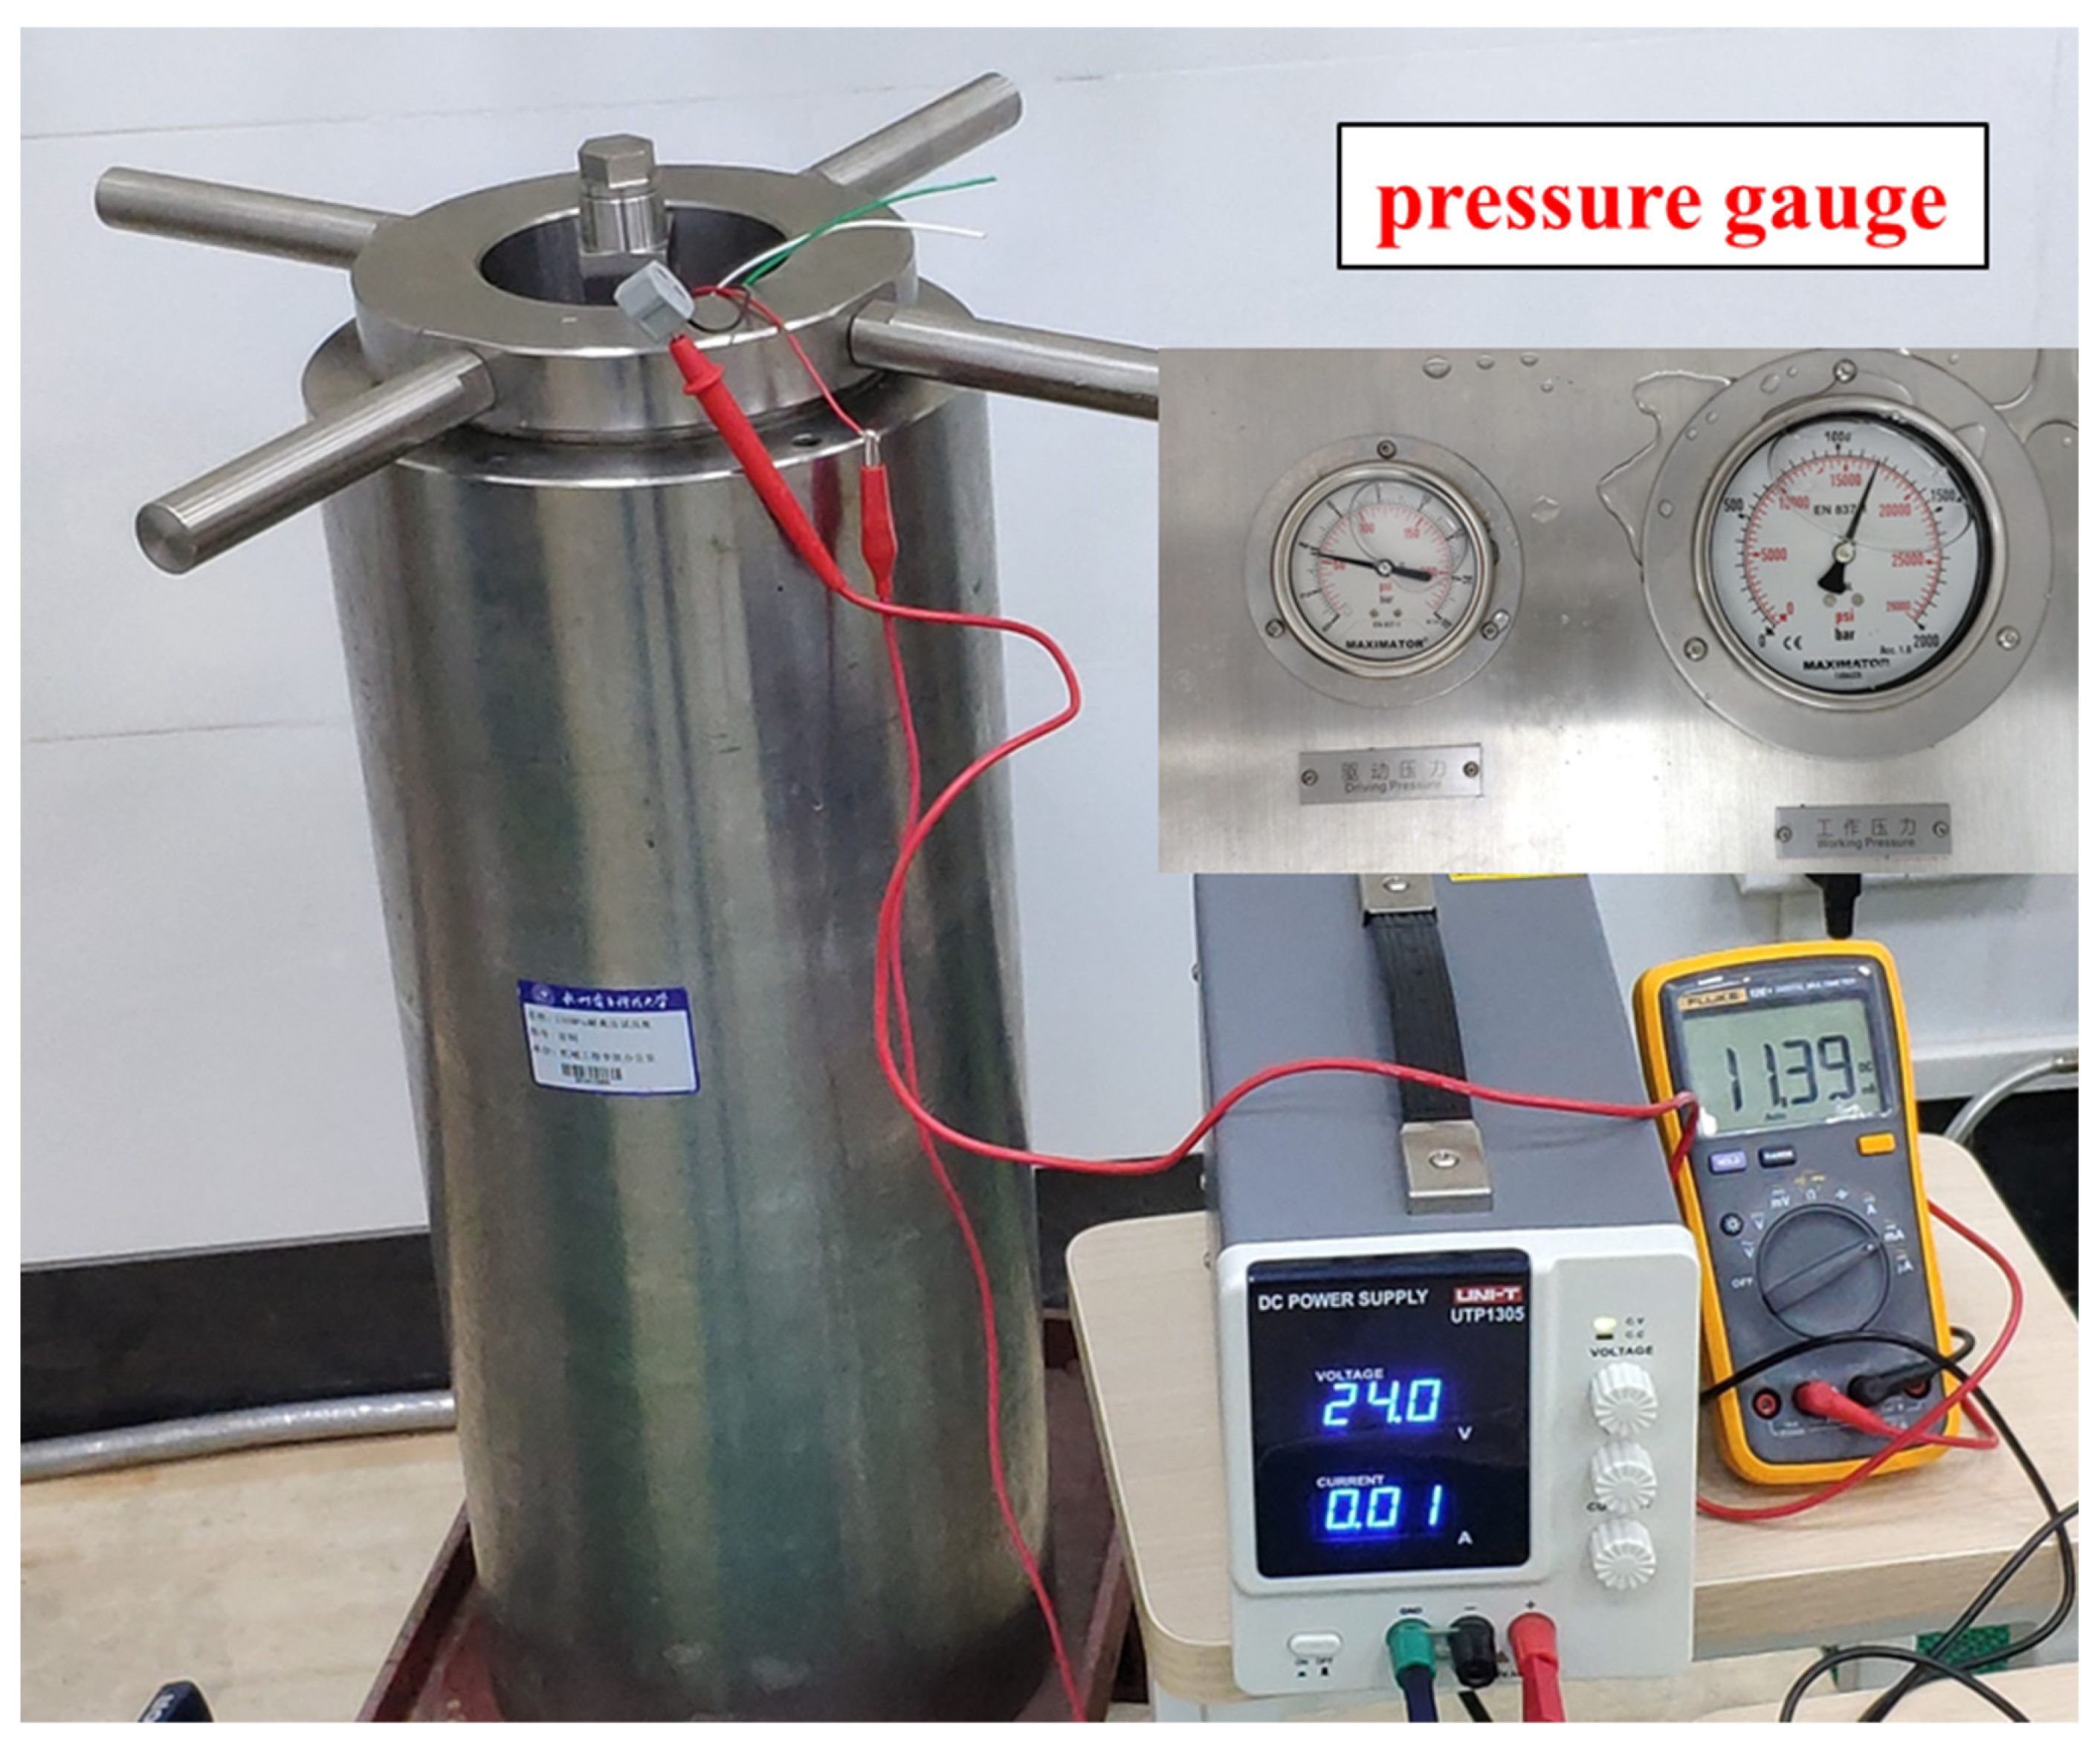
Figure 7 shows a stress test of a circuit board. The pressure chamber is filled with oil to prevent damage to the circuit board. Circuit board data transmission is stable during the experiment.
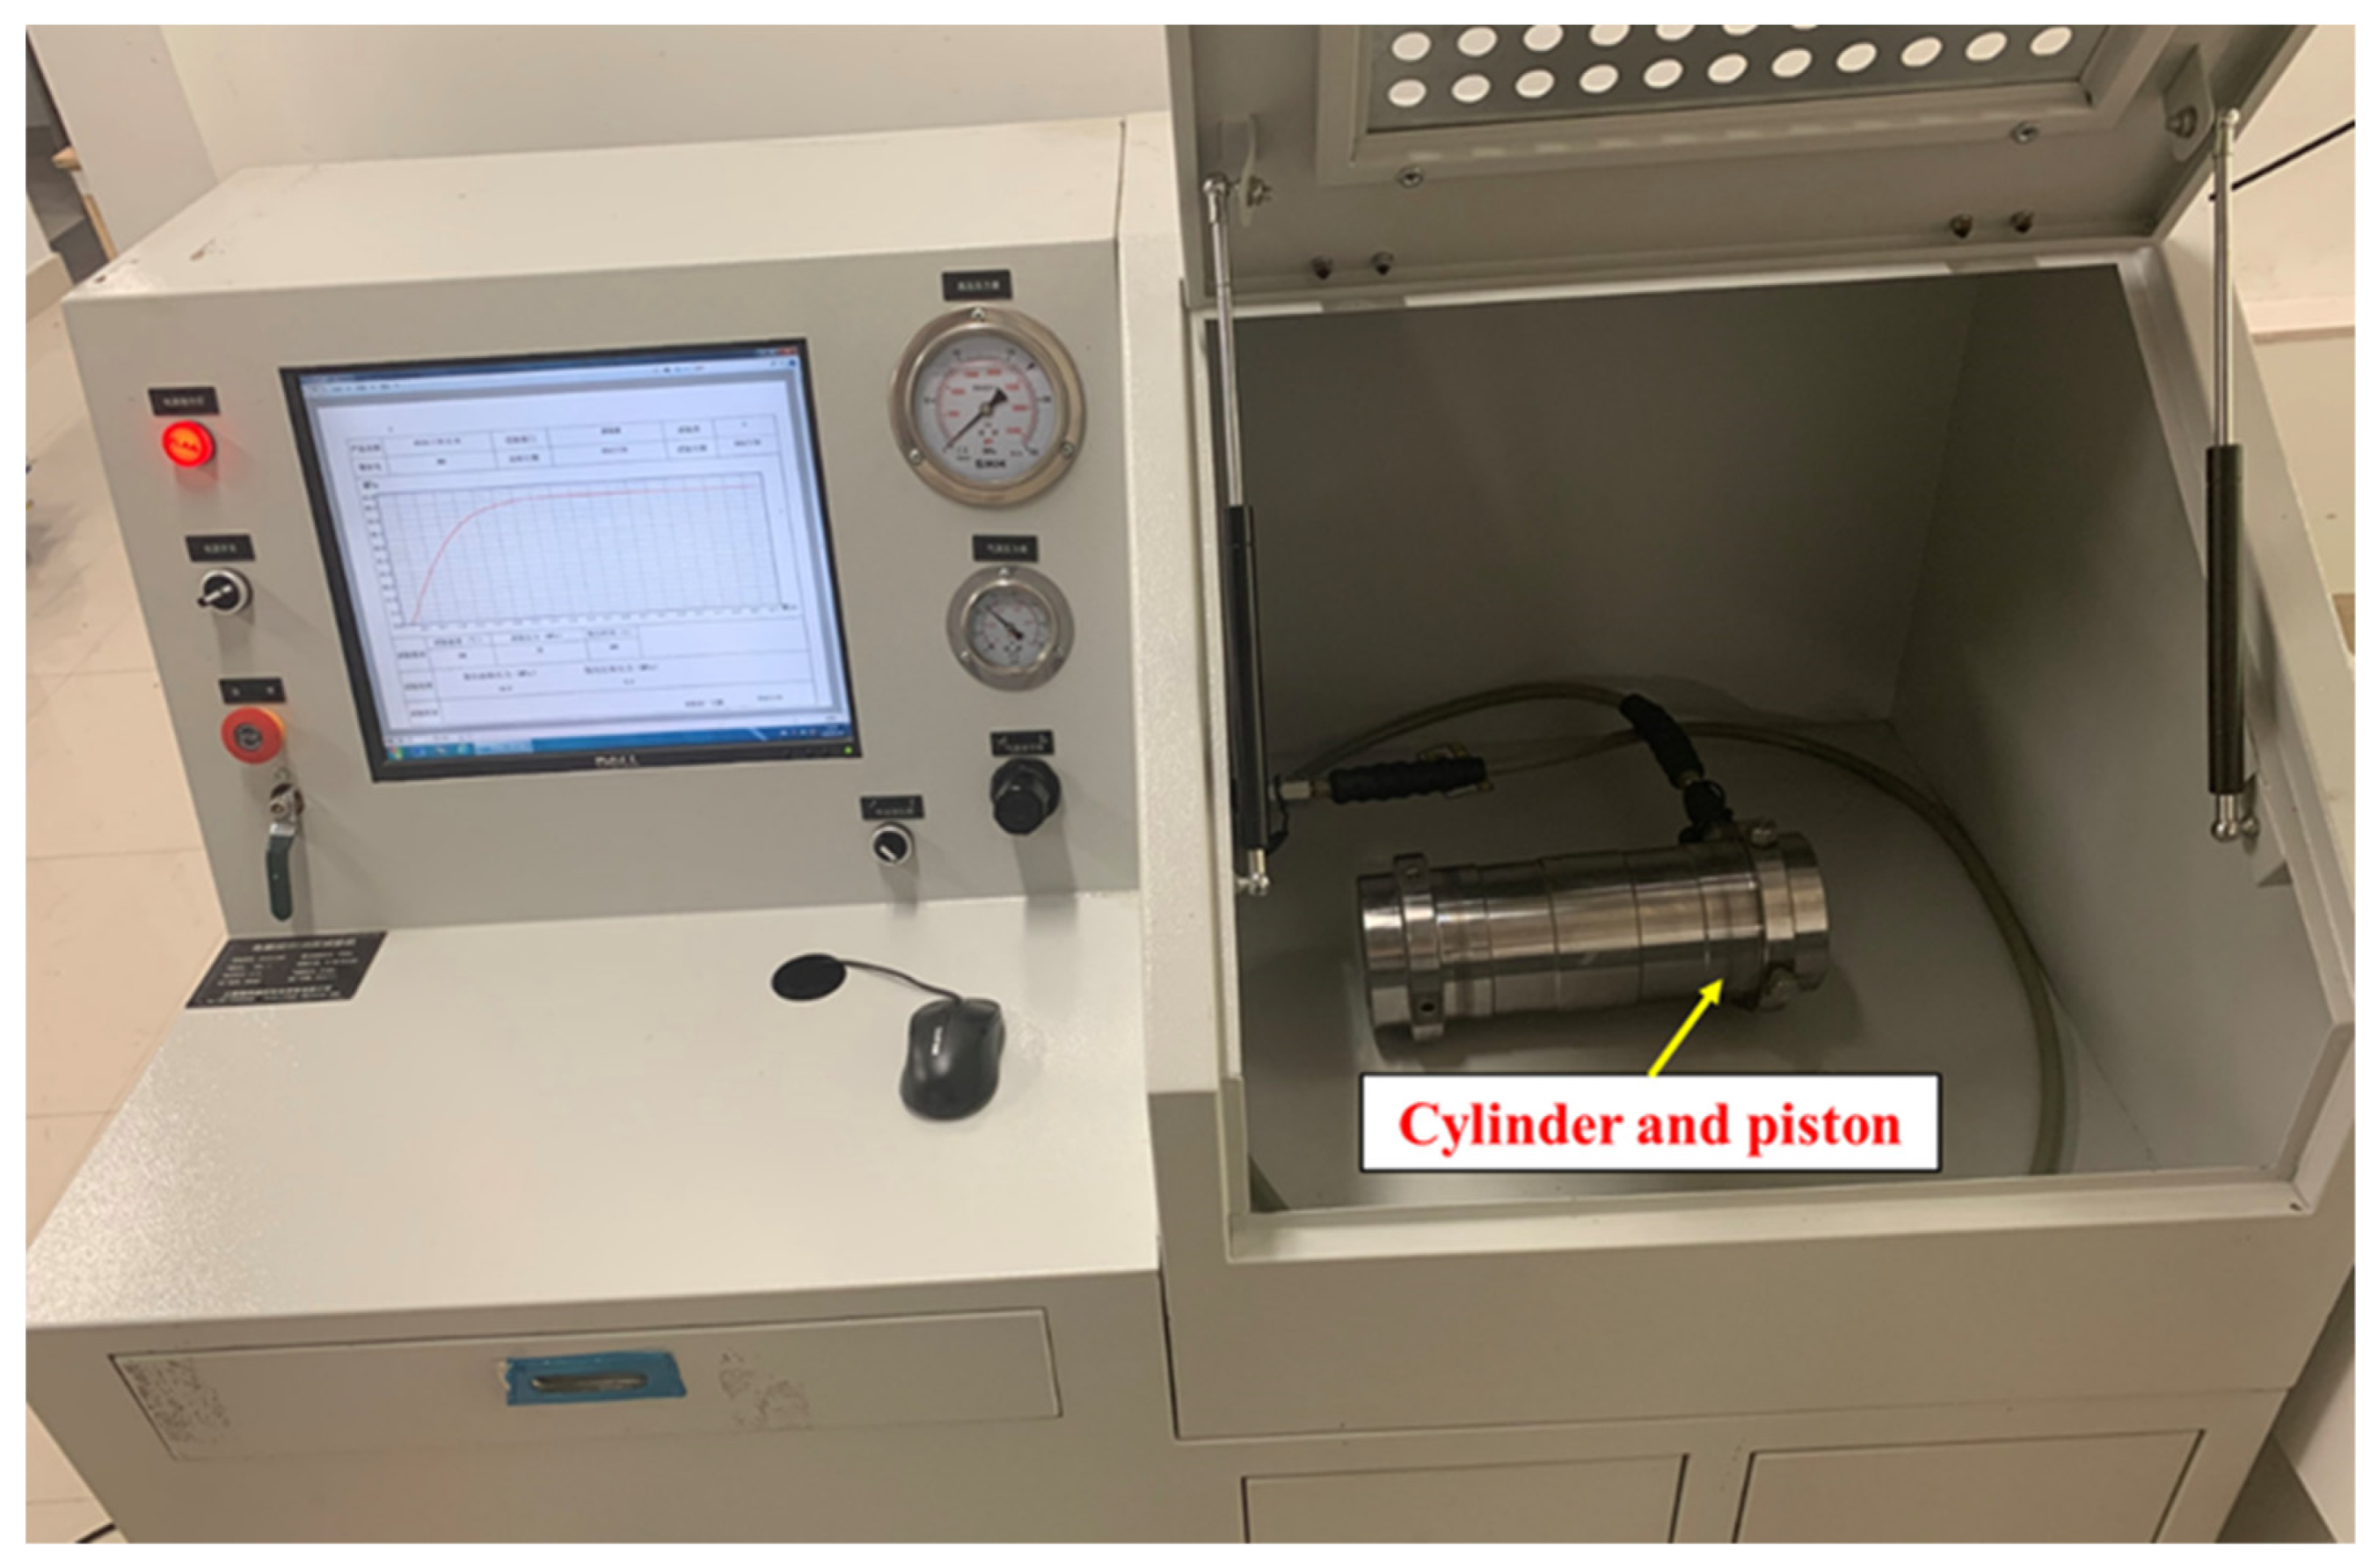
Figure 8 shows a pressure test of the piston and cylinder on a high-pressure test bench.
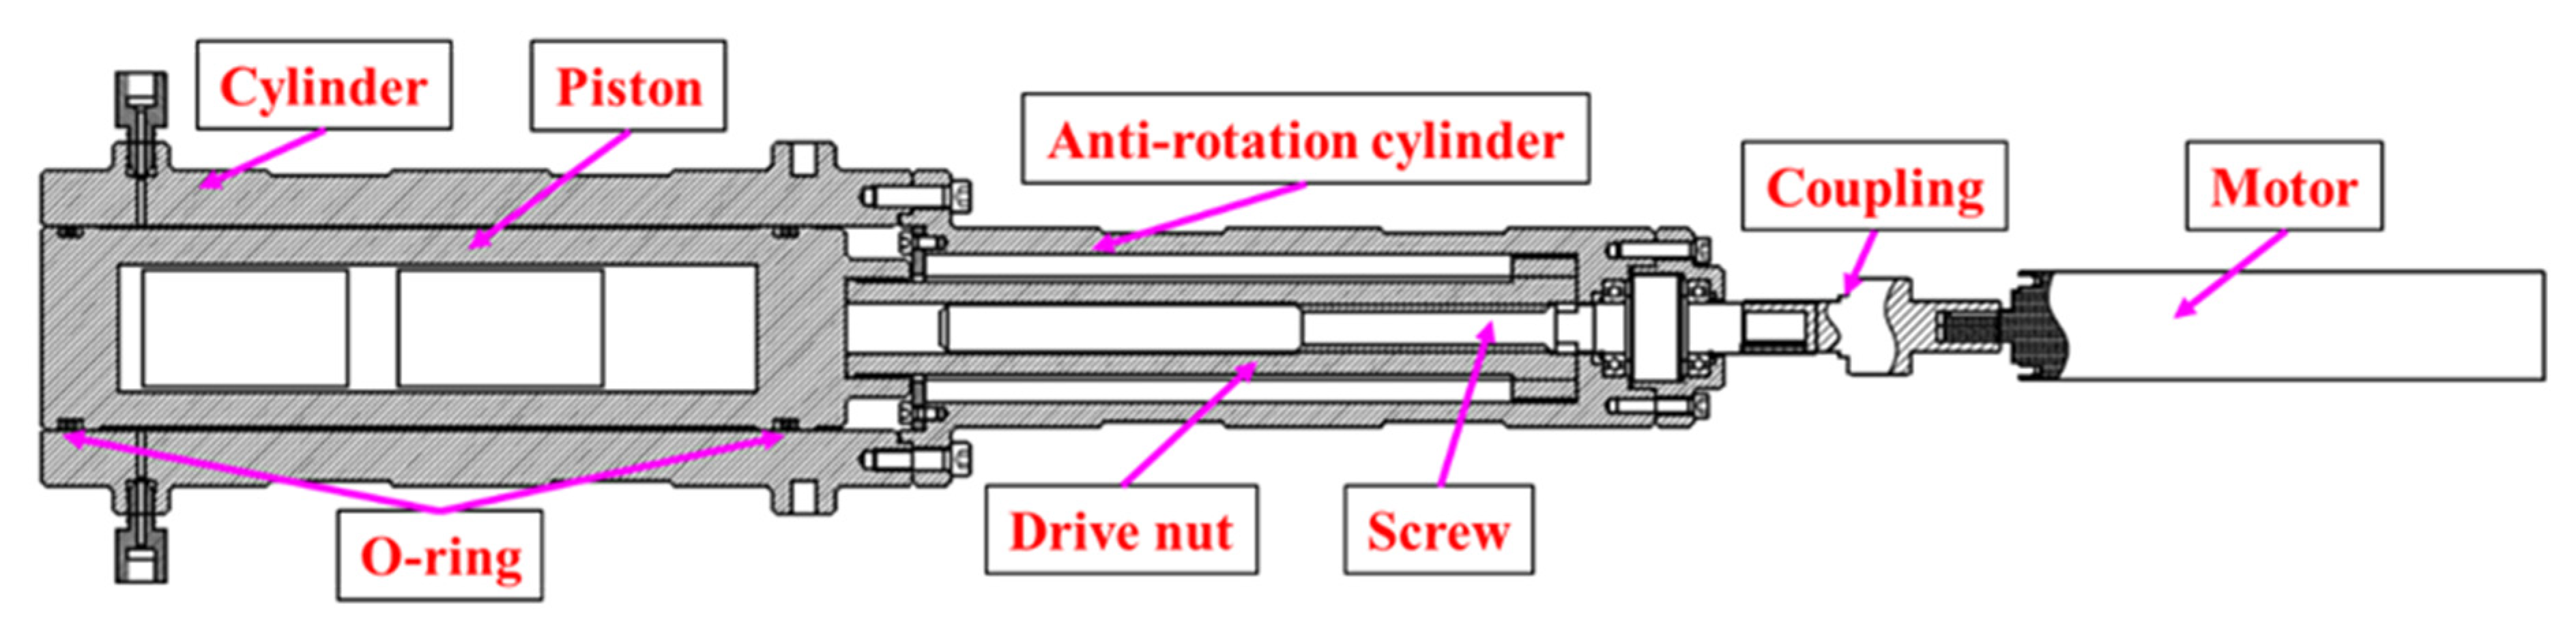
4.2. Frictional Force Measurement Test
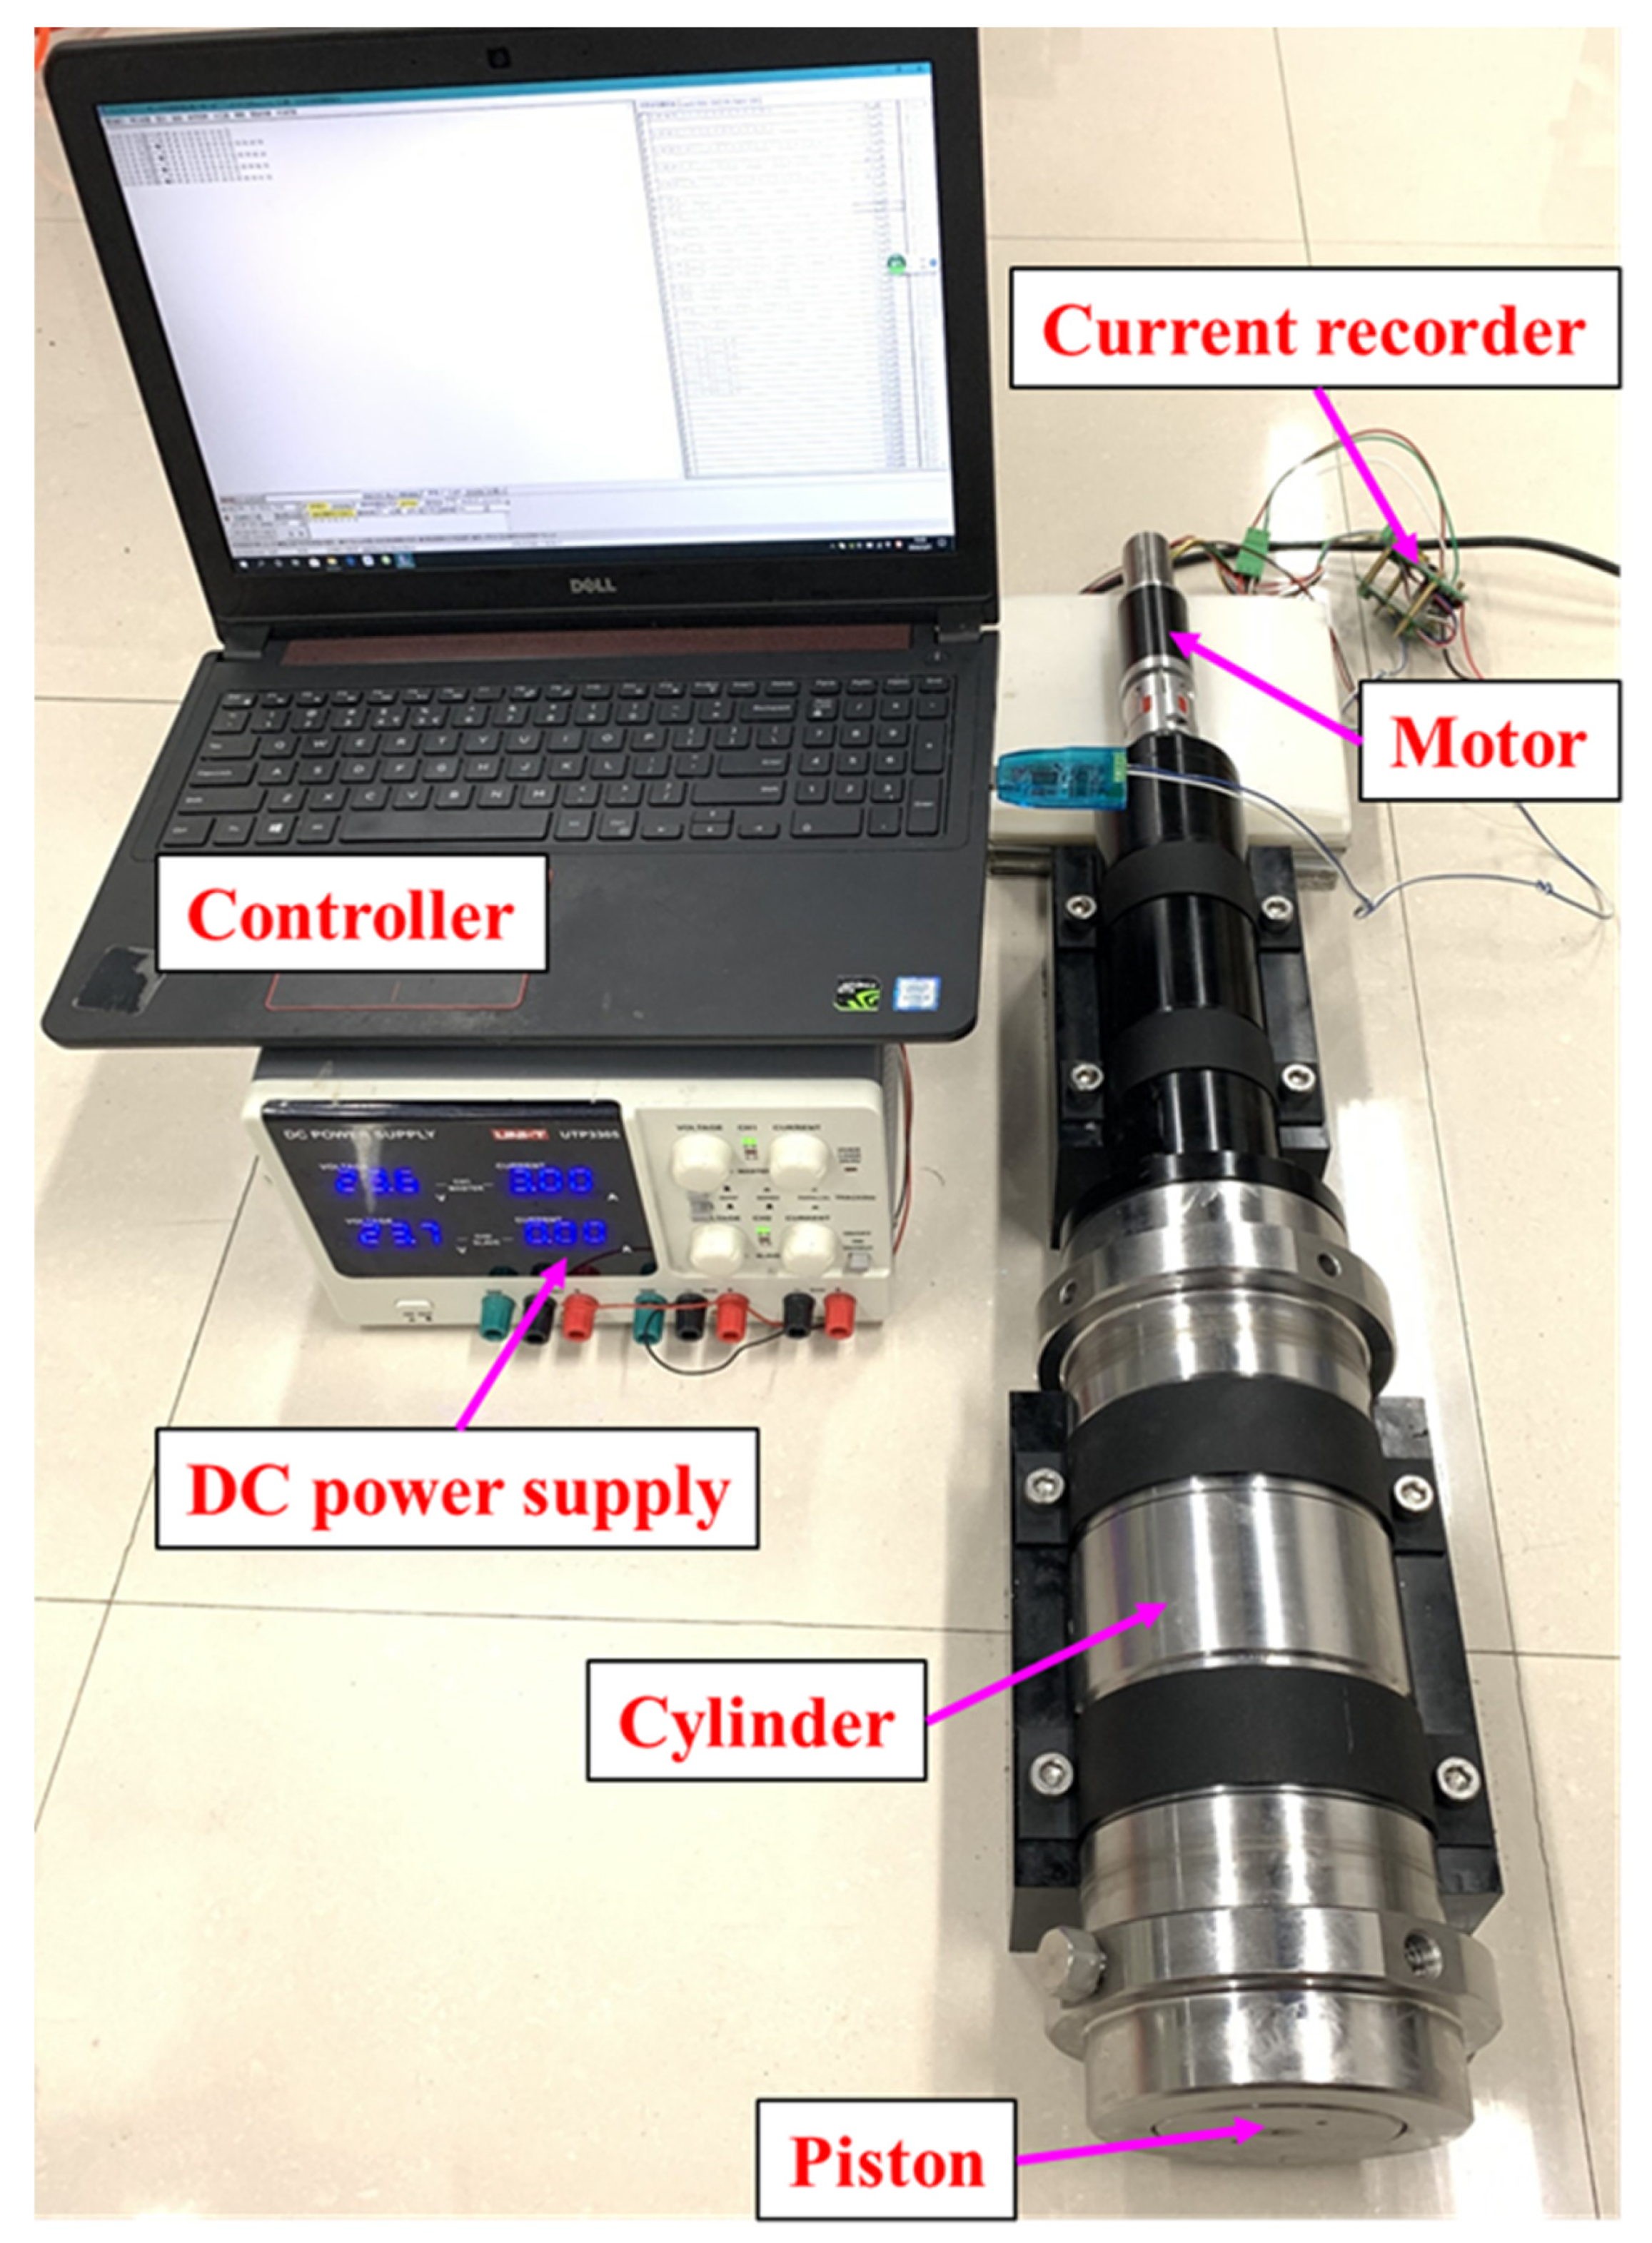
We designed the piston and the cylinder according to the dimensions we had chosen and tested the friction force. Figure 9 shows the mechanical model of the friction test. The motor drives the piston to reciprocate in the sampling cylinder through the screw drive mechanism. The DC motor is connected to 48 V DC constant voltage power supply. The motor starts after receiving a start signal from the upper computer, and the lower computer records the current data of the motor during the rotation process. Once the piston reaches its maximum stroke, the motor reverses to pull in the piston. The current and voltage data are used to obtain the actual power of the motor. The output torque of the motor (T) can be obtained by referring to the power-torque curve of the motor used in the test (supplied by the motor manufacturer). The frictional force during the movement of the O-ring can be obtained using Formula (11). In this test we consider the axial force of the screw to be equal to the friction between the O-ring and the inner wall of the cylinder. Figure 10 shows the frictional test in laboratory.
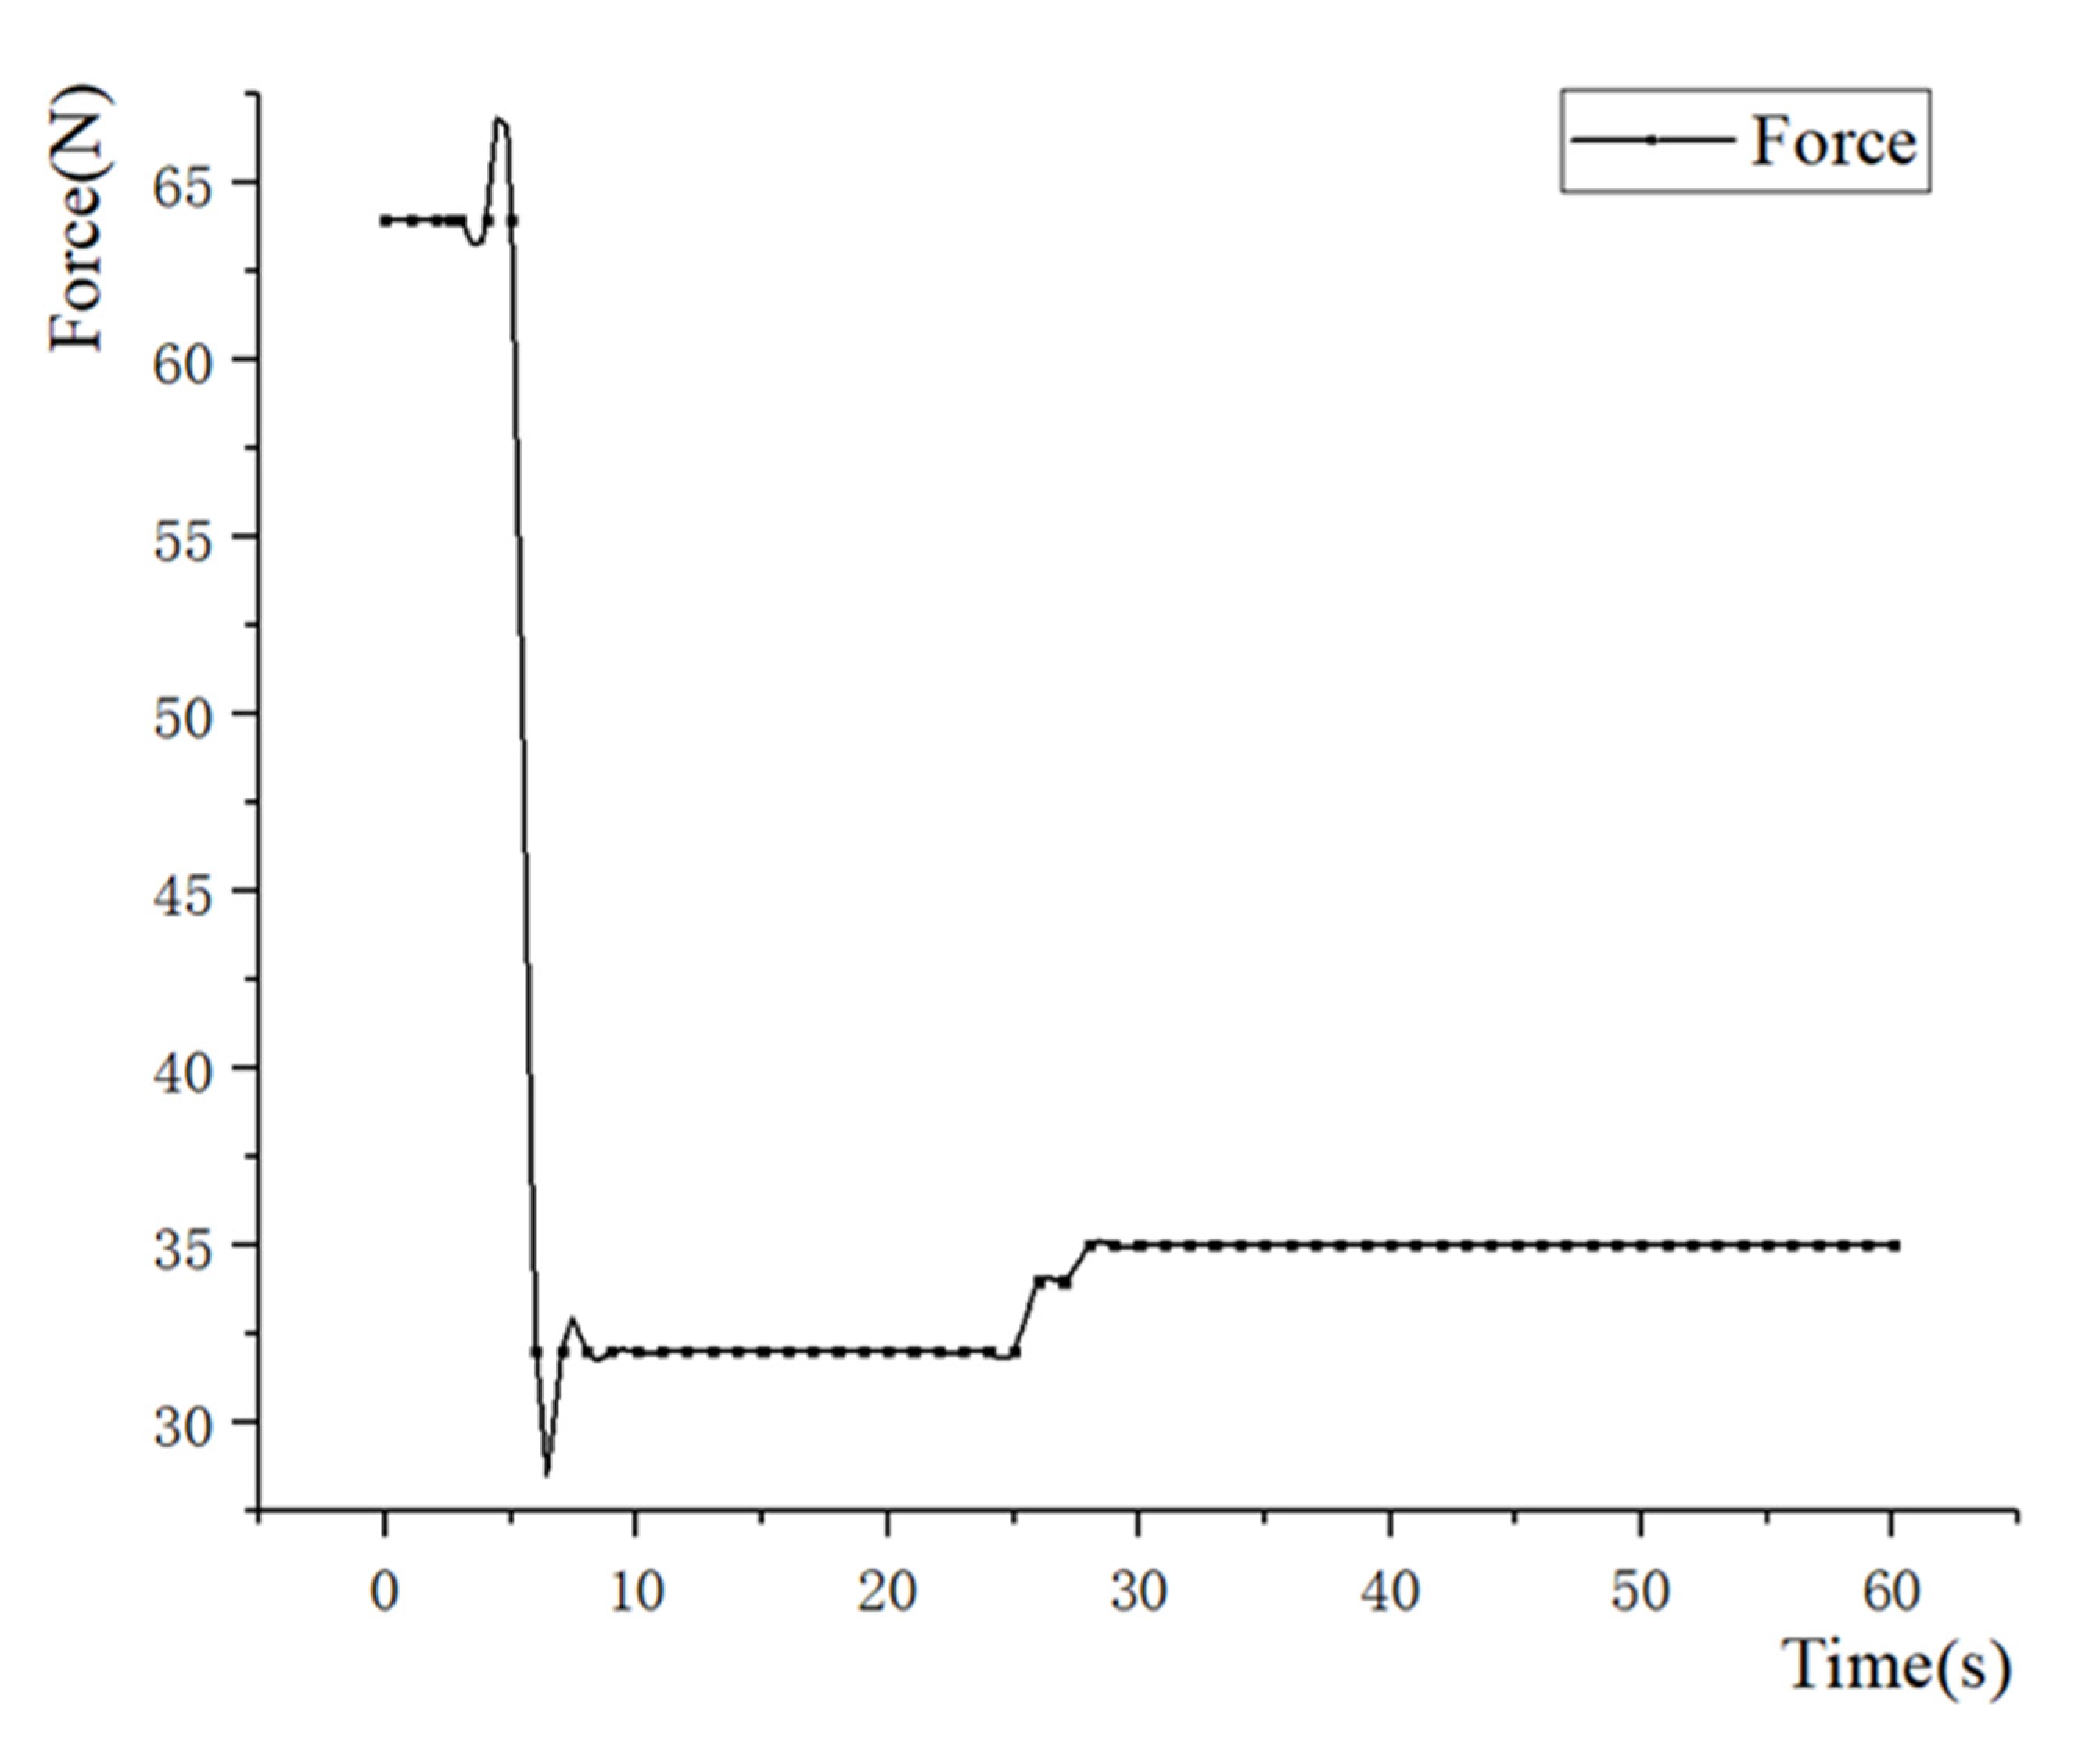
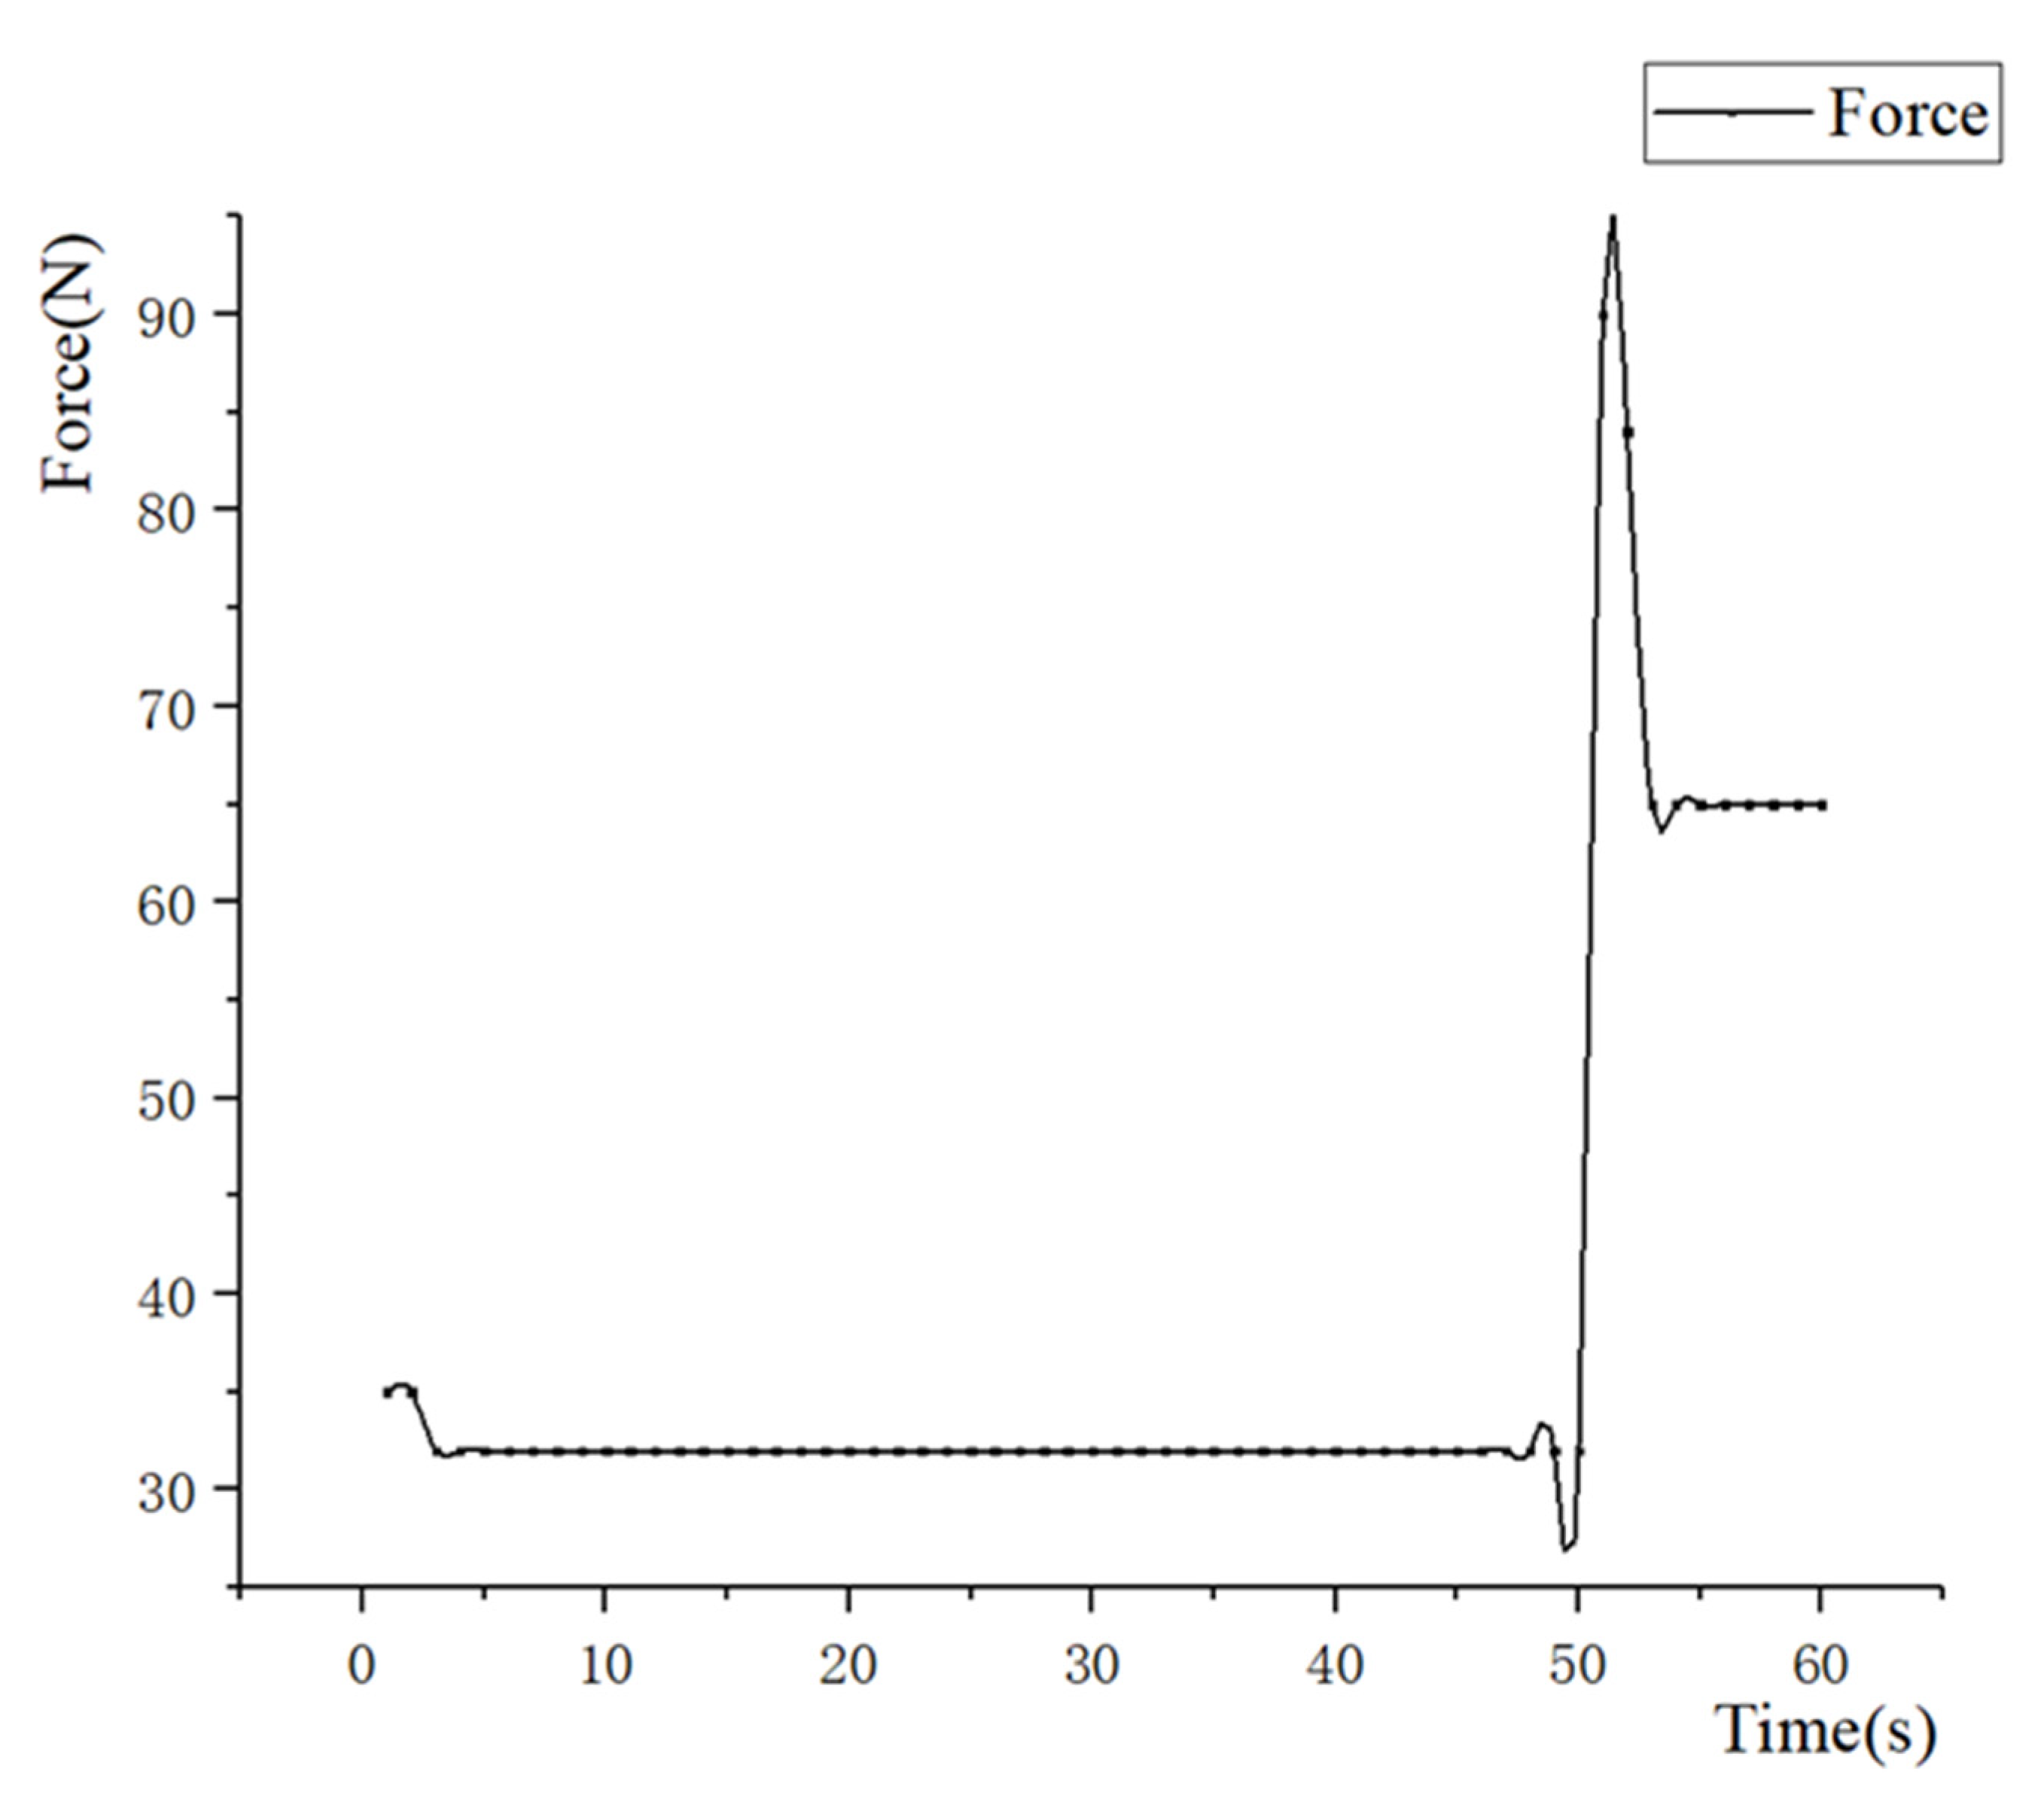
The following curve is derived from the experimental results. The results of the resistance of the piston push-out process and pull-in process are shown in Figure 11 and Figure 12.
The results show that during the initial stage of the push-out process, the piston is in contact with the two seals of the barrel and the resistance is approximately 68 N. After a short period of smooth operation, the first seal is no longer in contact with the cylinder, and the resistance reduced to about 35 N, which is consistent with the actual situation.
In the pull-in phase, the initial period of resistance is around 33 N. The O-ring on the outside of the cylinder is compressed when it enters the cylinder, at which time the resistance rises sharply. After the O-ring is fully compressed, there are two O-ring contacts between the piston and the cylinder, and the resistance is about 65 N.
The resistance of a single O-ring obtained from the test was 35 N (the process of the piston being pushed out) and 33 N (the process of the piston being pulled in). The results obtained in Abaqus are 30.08 N. The error is about 13% and 9.7%. The error is within the acceptable range. It shows that the analytical method is basically valid under the assumptions in this paper.
The experimental results are consistent with the actual situation, but the test result is always greater than the calculated value. There are three possible reasons: (1) the generation of frictional heat changes the nature of the rubber material and the contact state of the O-ring and the cylinder. (2) There is no support after the piston is pushed out, which may make the internal O-ring and the cylinder contact asymmetric. (3) The inner wall of the cylinder has insufficient machining accuracy.
5. Summary and Conclusions
In this paper, a new deep-sea organism trapping and pressure-maintaining recovery device is proposed. The weight of the device is greatly reduced while ensuring high sealing reliability and a sufficient diameter. The dynamic explicit analysis of the O-ring motion is an analysis of the large deformation characteristics of superelastic materials such as rubber. The rubber O-ring is an important component of marine equipment, and this technology helps marine structural designers to analyze the O-ring’s reciprocal resistance to motion, etc. In this paper, the weights of the factors affecting the O-ring are analyzed using an orthogonal test for the first time. However, in this study, the influence of compression rate, material hardness, the relative velocity of motion, and friction coefficient on the resistance and state of motion of the O-ring is considered, but not the influence of seawater lubrication, frictional heat generation, and other factors. This will be taken into account in future studies. Based on the analysis and tests in this paper, the following conclusions can be drawn:
(1) Explicit dynamic analysis of O-ring motion based on Abaqus
This study builds a finite element model of the 2D plane for analysis. The superelastic material is described using the Mooney-Rivlin model. The resulting trend in the magnitude of resistance to the O-ring movement corresponds to the actual moving process. The contact stresses were fitted in Matlab. The fitting results are highly consistent with the Karaszkiewicz model when the compression rate is not greater than 21%. The fitted curve is integrated along the circumference to obtain the total friction on the circumference. The difference between the friction obtained from the resistance test and the simulation results is small. This simulation has a high degree of reliability.
(2) Analysis of factors affecting O-rings based on orthogonal tests and ANOVA
Many factors affect the resistance of the piston of the PMTI, and an orthogonal test is used in cases where there are multiple values for each factor. This is an efficient, fast, and economical method of test design. We performed an ANOVA on the numerical analysis results. The research results show that the compression rate and material hardness of the O-ring have the greatest influence on its resistance to movement at low speeds.
The PMTI in this research is the first prototype of a lightweight macro-organism pressure sampler used in the abyss. Our target species are mainly amphipods and fishes. We will improve it in the future work. These improvements include: (1) we will set up an observation window to observe the sample in the cylinder. (2) For different creatures (such as amphipods and fish, etc.), we will use different baits to improve the capture efficiency (currently we use carrion as bait). In addition, more suitable piston structures for creatures of different sizes will be designed. (3) We will establish a longer duration of the sampling to improve the sampling success rate (currently it is about 2 h). (4) Additional measurement functions for biological metabolic parameters such as dissolved oxygen measurement, carbon dioxide measurement, etc. will be developed on this device, and the first prototype of the PMTI will be tested in the Mariana Trench in the near future.
Author Contributions
Conceptualization, H.W. and Y.W.; methodology, J.F.; software, H.W.; validation, H.W., Y.W. and Y.F.; formal analysis, H.W.; investigation, H.W.; resources, J.C.; data curation, Y.W.; writing—original draft preparation, H.W.; writing—review and editing, H.W.; visualization, H.W.; supervision, J.C.; project administration, J.F.; funding acquisition, J.C. All authors have read and agreed to the published version of the manuscript.
Funding
This research received no external funding.
Acknowledgments
The study based on the project named “Research on cutting-edge technology systems for exploration, acquisition, and exploitation of abyssal biological resources”, which is derived from the “National Key R&D Program of China (grant No SQ2018YFC030173) supported by the Ministry of Science and Technology of the People’s Republic of China.
Conflicts of Interest
The authors declare no conflict of interest.
Nomenclature
| W | Strain energy density of superelastic material |
| C10, C01 | Material coefficients of rubber |
| I1, I2 | The first and second strain tensor invariants |
| G | The shear modulu |
| E | The elastic modulu |
| Poisson’s ratio | |
| Hr | Rubber hardness |
| Frictional force, N | |
| d | Diameter of O-ring, mm |
| p(x) | Contact stress distribution |
| Compression ratio | |
| p0 | Maximum contact stress, MPa |
| b | Contact width, mm |
| F | Axial force of screw, N |
| Transmission efficiency of screw | |
| T | Torque, Nm |
| L | Screw pitch, mm |
References
- Smith, C.; DeLeo, F.; Bernardino, A.F.; Sweetman, A.; Arbizu, P.M. Abyssal food limitation, ecosystem structure and climate change. Trends Ecol. Evol. 2008, 23, 518–528. [Google Scholar] [CrossRef] [PubMed]
- Jażdżewska, A.M.; Mamos, T. High species richness of Northwest Pacific deep-sea amphipods revealed through DNA barcoding. Prog. Oceanogr. 2019, 178, 102184. [Google Scholar] [CrossRef]
- O’Hara, T.D.; Williams, A.; Woolley, S.N.; Nau, A.W.; Bax, N.J. Deep-sea temperate-tropical faunal transition across uniform environmental gradients. Deep Sea Res. Part I 2020, 161, 103283. [Google Scholar] [CrossRef]
- Mauchline, J.; Gordon, J.D.M. Diets and bathymetric distributions of the macrourid fish of the Rockall Trough, northeastern Atlantic Ocean. Mar. Biol. 1984, 81, 107–121. [Google Scholar] [CrossRef]
- Lacey, N.C.; Rowden, A.A.; Clark, M.R.; Kilgallen, N.M.; Linley, T.; Mayor, D.J.; Jamieson, A. Community structure and diversity of scavenging amphipods from bathyal to hadal depths in three South Pacific Trenches. Deep Sea Res. Part I 2016, 111, 121–137. [Google Scholar] [CrossRef]
- Yayanos, A.A. Recovery and Maintenance of Live Amphipods at a Pressure of 580 Bars from an Ocean Depth of 5700 Meters. Science 1978, 200, 1056–1059. [Google Scholar] [CrossRef]
- Drazen, J.C.; Bird, L.E.; Barry, J.P. Development of a hyperbaric trap-respirometer for the capture and maintenance of live deep-sea organisms. Limnol. Oceanogr. Methods 2005, 3, 488–498. [Google Scholar] [CrossRef]
- Shillito, B.; Hamel, G.; Duchi, C.; Cottin, D.; Sarrazin, J.; Sarradin, P.-M.; Ravaux, J.; Gaill, F. Live capture of megafauna from 2300m depth, using a newly designed Pressurized Recovery Device. Deep Sea Res. Part I 2008, 55, 881–889. [Google Scholar] [CrossRef]
- Bailey, D.M.; Jamieson, A.; Bagley, P.; Collins, M.; Priede, I.G. Measurement of in situ oxygen consumption of deep-sea fish using an autonomous lander vehicle. Deep Sea Res. Part I 2002, 49, 1519–1529. [Google Scholar] [CrossRef]
- Koyama, S.; Miwa, T.; Horii, M.; Ishikawa, Y.; Horikoshi, K.; Aizawa, M. Pressure-stat aquarium system designed for capturing and maintaining deep-sea organisms. Deep Sea Res. Part I 2002, 49, 2095–2102. [Google Scholar] [CrossRef]
- Monterey Bay Aquarium Research Institute. Pulses of sinking carbon reaching the deep sea are not captured in global climate models. News Rx Health Sci. 2018, 144. Available online: https://www.sciencedaily.com/releases/2018/12/181203131109.htm (accessed on 3 December 2018).
- Glud, R.N.; Tengberg, A.; Kühl, M.; Hall, P.; Klimant, I.; Holst, G. An in situ instrument for planar O2 Optode measurements at benthic interfaces. Limnol. Oceanogr. 2001, 46, 2073–2080. [Google Scholar] [CrossRef] [Green Version]
- Jamieson, A.J.; Linley, T.D.; Craig, J. Baited camera survey of deep-sea demersal fishes of the West African oil provinces off Angola: 1200–2500m depth, East Atlantic Ocean. Mar. Environ. Res. 2017, 129, 347–364. [Google Scholar] [CrossRef] [PubMed] [Green Version]
- Macdonald, A.G.; Gilchrist, I. An apparatus for the recovery and study of deep sea plankton at constant temperature and pressure. In Barobiology and the Experimental Biology of the Deep Sea; Brauer, R.W., Ed.; University of North Carolina Press: Chapel Hill, NC, USA, 1972; pp. 394–412. [Google Scholar]
- Bianchi, A.; Garcin, J.; Tholosan, O. A high-pressure serial sampler to measure microbial activity in the deep sea. Deep Sea Res. Part I 1999, 46, 2129–2142. [Google Scholar] [CrossRef]
- Linley, T.D.; Craig, J.; Jamieson, A.J.; Priede, I.G. Bathyal and abyssal demersal bait-attending fauna of the Eastern Mediterranean Sea. Mar. Biol. 2018, 165, 159. [Google Scholar] [CrossRef] [Green Version]
- Qin, K.; Zhou, Q.; Zhang, K.; Feng, Y.; Zhang, T.; Zheng, G.; Xia, B.; Liu, B. Non-uniform abrasive particle size effects on friction characteristics of FKM O-ring seals under three-body abrasion. Tribol. Int. 2019, 136, 216–223. [Google Scholar] [CrossRef]
- Wan, Y.; Soh, A.; Shao, Y.; Cui, X.; Tang, Y.; Chua, K.J. Numerical study and correlations for heat and mass transfer coefficients in indirect evaporative coolers with condensation based on orthogonal test and CFD approach. Int. J. Heat Mass Transf. 2020, 153, 119580. [Google Scholar] [CrossRef]
- Nicolin, I.; Nicolin, B.A. Tribological aspects of dynamic seals with O-rings used in aircraft hydraulic equipment. INCAS Bull. 2019, 11, 221–228. [Google Scholar] [CrossRef]
- Kumar, A.; Prasad, B.; Kumar, K. Effect of change of material model in Mooney Rivlin hyper-elastic material. Mater. Today Proc. 2020, 26, 2511–2514. [Google Scholar] [CrossRef]
- Bin Du, X.; Zhao, Y.; Lin, F.; Xiao, Z. Parameters Determination of Mooney-Rivlin Model for Rubber Material of Mechanical Elastic Wheel. Appl. Mech. Mater. 2017, 872, 198–203. [Google Scholar]
- Cetin, M.H.; Korkmaz, S. Investigation of the concentration rate and aggregation behaviour of nano-silver added colloidal suspensions on wear behaviour of metallic materials by using ANOVA method. Tribol. Int. 2020, 147, 106273. [Google Scholar] [CrossRef]
- Karaszkiewicz, A. Geometry and contact pressure of an O-ring mounted in a seal groove. Ind. Eng. Chem. Res. 1990, 29, 2134–2137. [Google Scholar] [CrossRef]
Figure 1.
The prototype of the pressure-maintaining trapping instrument (PMTI).

Figure 2.
Work process of PMTI.

Figure 3.
Control system of PMTI.

Figure 4.
The geometric model for analysis.

Figure 5.
Changes of resistance during movement. (The force shown is the resistance of the cylinder’s motion in the axisymmetric model. The direction of the force is opposite to the direction of the cylinder’s motion. Here, the force is numerically equal to the resistance that pushes the piston into the cylinder. The purpose of this is to simplify the setting of boundary conditions.)

Figure 6.
Contact stress distribution of the O-ring. (The x-axis represents the contact width between the O-ring and the cylinder, and x = 0 refers to the first node where the O-ring contacts the inner wall. The y-axis represents the contact stress value at each point.)
Figure 6.
Contact stress distribution of the O-ring. (The x-axis represents the contact width between the O-ring and the cylinder, and x = 0 refers to the first node where the O-ring contacts the inner wall. The y-axis represents the contact stress value at each point.)

Figure 7.
Pressure test of circuit board. (We first increase the pressure to 10% of the maximum test pressure, then gradually increase the test pressure by 10% each time until reaching maximum test pressure. Then, we hold the pressure for a period of time (approximately 30 min), after which, we reduce the pressure to 87% of the maximum test pressure and continue holding pressure. If there are no abnormalities throughout the process, the part is considered to meet the requirements for high-pressure operation. The circuit board is connected to the DC constant voltage power supply (24 V) through the waterproof connector. Then, the circuit board is put into the high-pressure tank filled with oil for testing, and the container is pressurized with a pneumatic booster. It can be seen from the indication of the pressure gauge that the highest pressure has reached 110 MPa, which is 107% of the working pressure. The pressure test process is strictly in accordance with the standard of the high voltage test, and there is no abnormality in the circuit board signal transmission during the test. This proves that the special circuit board of this device can be used in a high voltage environment. Similarly, the temperature sensor and pressure sensor of this device were tested in this way, and the test results show that these components can work normally under high pressure.)

Figure 8.
Pressure test of cylinder and piston. (In this test, we place the piston that has O-rings on both ends into the cylinder and fill the cylinder with water. This is then pressurized using a pneumatic booster. The maximum test pressure is 1.2 times the working pressure of the cylinder and piston, i.e., 120 MPa, and then, the pressure is held at 100 MPa for 12 h. No leaks or pressure drops were found in the device during the test. The test results show that the strength of the cylinder and piston meets the requirements.)

Figure 9.
Mechanical model of the friction test.

Figure 10.
Friction test. (The motors we used in our tests are the same motors that PMTI is equipped with. The motor model is MAX 30, manufactured by MAXON. The piston was pushed out and pulled in five times during the test. In addition, the screw pitch (L) in this test is 8 mm, and the translating efficiency is 0.85.).

Figure 11.
The resistance of the pushing process.

Figure 12.
The resistance of the pulling process.


Table 1.
Orthogonal test table.
| No. | Factor 1 | Factor 2 | Factor 3 | Factor 4 |
|---|---|---|---|---|
| 1 | 1 | 1 | 1 | 1 |
| 2 | 2 | 2 | 2 | 1 |
| 3 | 3 | 3 | 3 | 1 |
| 4 | 4 | 4 | 4 | 1 |
| 5 | 4 | 3 | 2 | 2 |
| 6 | 3 | 2 | 1 | 2 |
| 7 | 2 | 1 | 4 | 2 |
| 8 | 1 | 4 | 3 | 2 |
| 9 | 1 | 3 | 4 | 3 |
| 10 | 2 | 4 | 1 | 3 |
| 11 | 3 | 1 | 2 | 3 |
| 12 | 4 | 2 | 3 | 3 |
| 13 | 4 | 1 | 3 | 4 |
| 14 | 3 | 4 | 4 | 4 |
| 15 | 2 | 3 | 1 | 4 |
| 16 | 1 | 2 | 2 | 4 |
| 17 | 2 | 2 | 4 | 4 |
| 18 | 2 | 4 | 3 | 4 |
| 19 | 4 | 4 | 2 | 4 |
| 20 | 4 | 4 | 1 | 4 |
Table 2.
ANOVA of maximum resistance.
| Factor | Average Square | Significance |
|---|---|---|
| Material hardness | 0.761 | 0.001 |
| Relative speed | 0.017 | 0.744 |
| Coefficient of friction | 0.248 | 0.022 |
| Compression rate | 0.373 | 0.008 |
Table 3.
ANOVA of stable resistance.
| Factor | Average Square | Significance |
|---|---|---|
| Material hardness | 0.298 | 0.006 |
| Relative speed | 0.014 | 0.690 |
| Coefficient of friction | 0.567 | 0.001 |
| Compression rate | 0.059 | 0.192 |
Table 4.
Comparison of analysis model and Karaszkiewicz model.
| No. | Compression Ratio | Contact Lenth (lf/lk) | Difference | Maximum Stress (sf/sk) | Difference |
|---|---|---|---|---|---|
| 1 | 18% | 1.7053/1.7395 | −1.9% | 2.57/2.46 | 4.8% |
| 6 | 21% | 1.8262/1.9525 | −6.4% | 2.83/2.77 | 2.1% |
| 7 | 19.5% | 1.723/1.846 | −6.6% | 2.68/2.59 | 3.5% |
| 19 | 22.5% | 1.912/2.059 | −7.1% | 4.96/4.53 | 9.4% |
© 2020 by the authors. Licensee MDPI, Basel, Switzerland. This article is an open access article distributed under the terms and conditions of the Creative Commons Attribution (CC BY) license (http://creativecommons.org/licenses/by/4.0/).
Share and Cite
MDPI and ACS Style
Wang, H.; Chen, J.; Wang, Y.; Fang, J.; Fang, Y. Research and Analysis of Pressure-Maintaining Trapping Instrument for Macro-Organisms in Hadal Trenches. J. Mar. Sci. Eng. 2020, 8, 596. https://doi.org/10.3390/jmse8080596
AMA Style
Wang H, Chen J, Wang Y, Fang J, Fang Y. Research and Analysis of Pressure-Maintaining Trapping Instrument for Macro-Organisms in Hadal Trenches. Journal of Marine Science and Engineering. 2020; 8(8):596. https://doi.org/10.3390/jmse8080596
Chicago/Turabian StyleWang, Hao, Jiawang Chen, Yuhong Wang, Jiasong Fang, and Yuping Fang. 2020. "Research and Analysis of Pressure-Maintaining Trapping Instrument for Macro-Organisms in Hadal Trenches" Journal of Marine Science and Engineering 8, no. 8: 596. https://doi.org/10.3390/jmse8080596
Note that from the first issue of 2016, this journal uses article numbers instead of page numbers. See further details here.