

An Index-Based Method to Assess the Resilience of Urban Areas to Coastal Flooding: The Case of Attica, Greece

Abstract
:1. Introduction
2. Materials and Methods
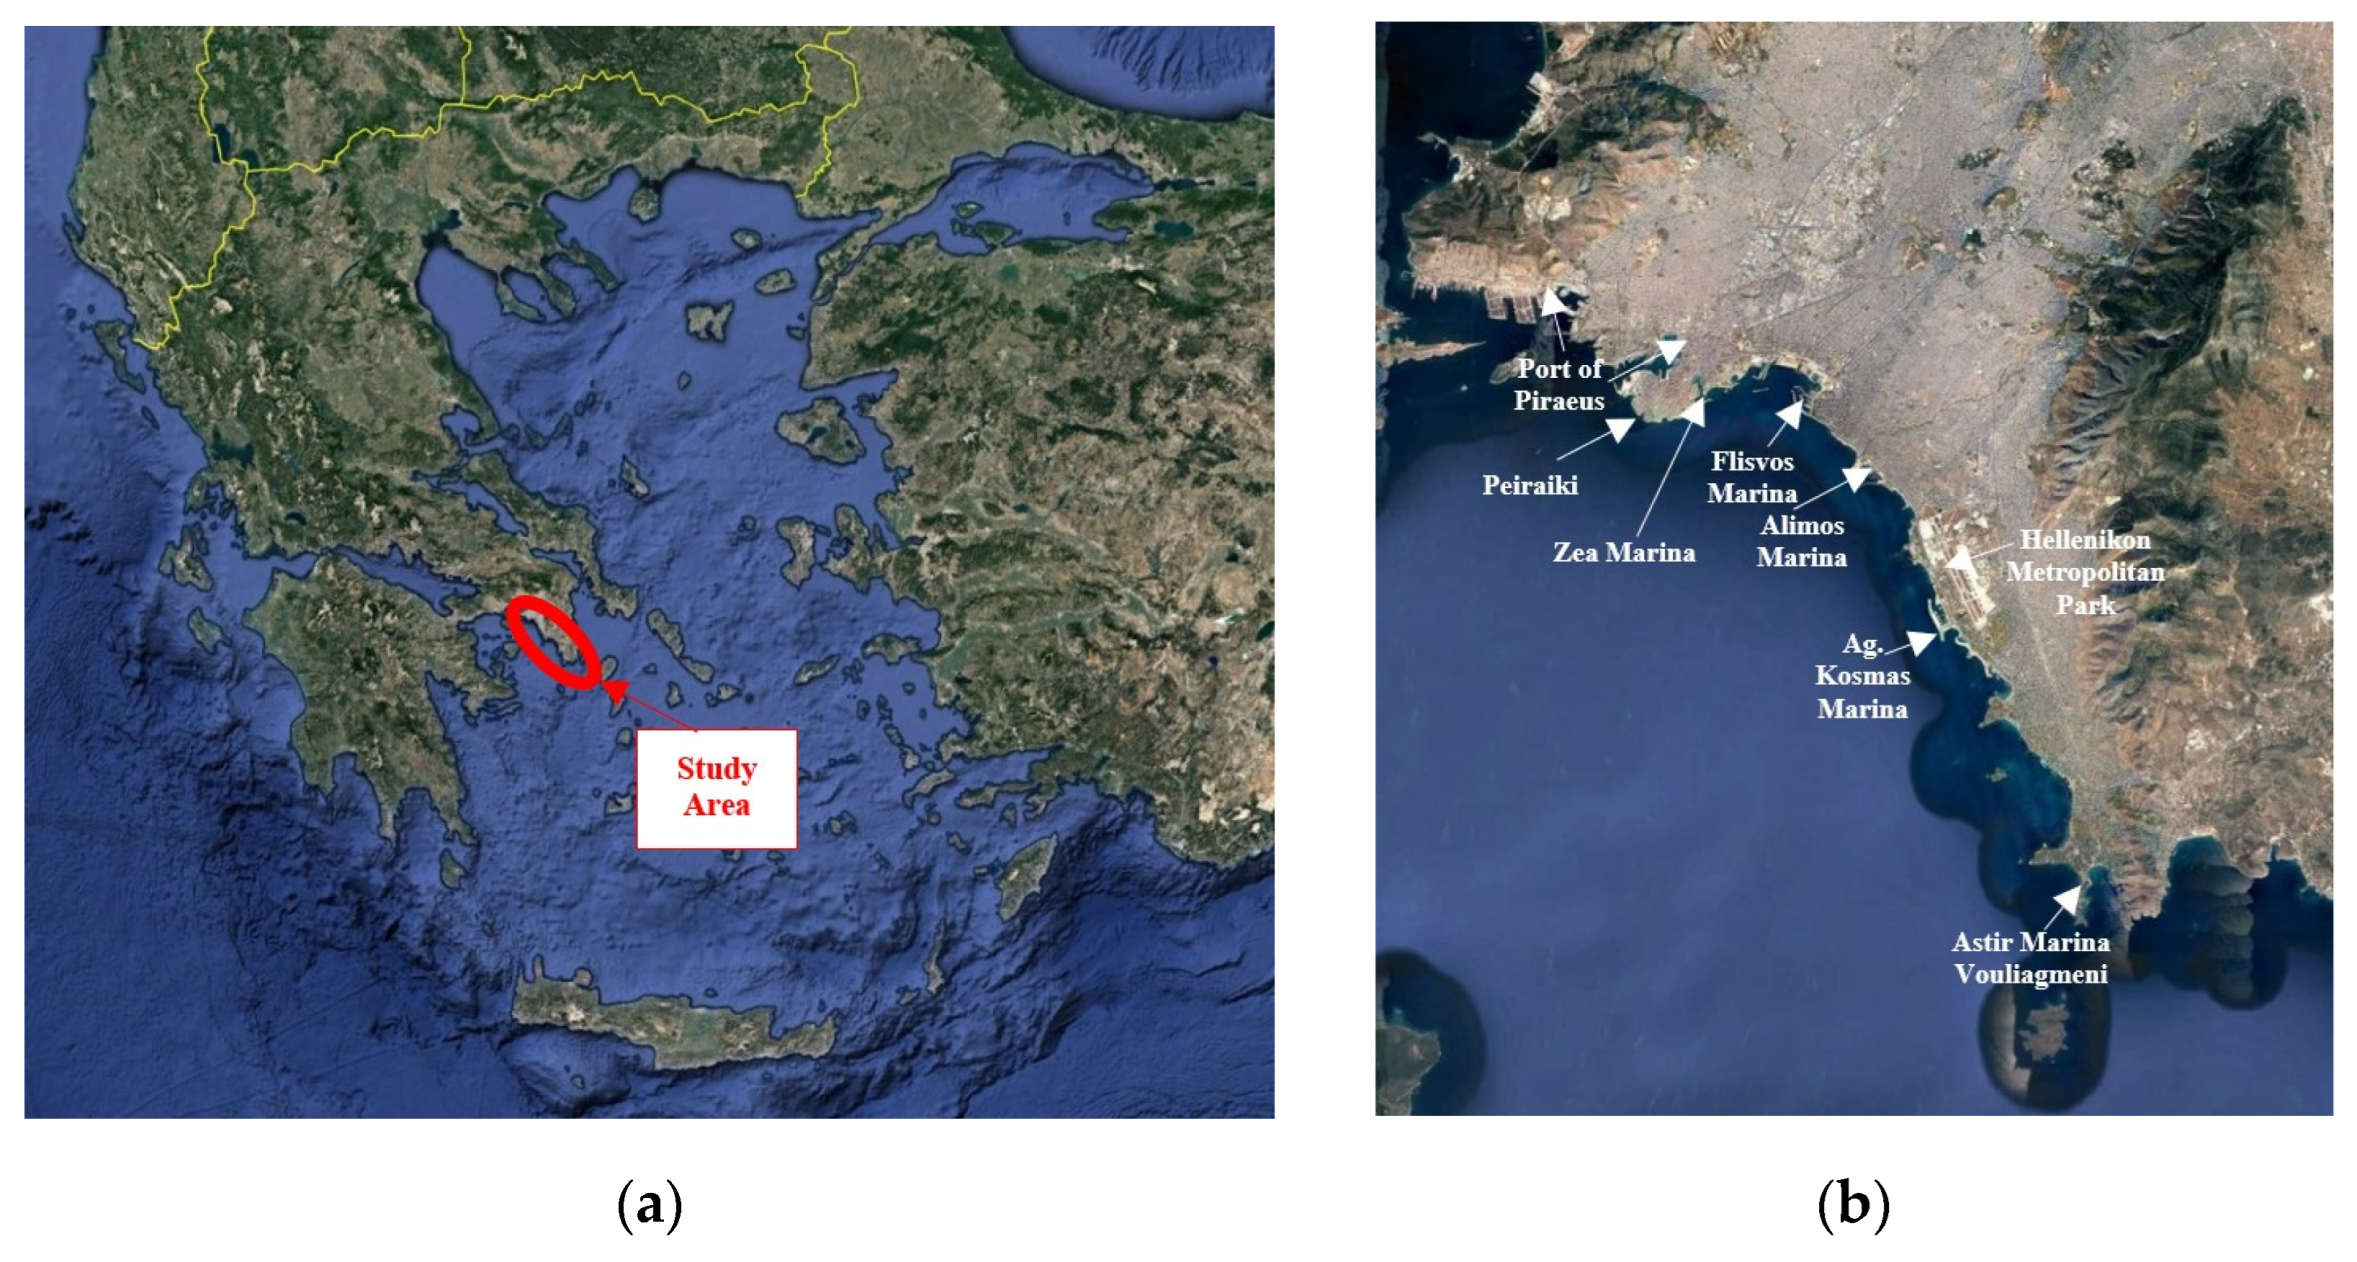
2.1. Area of Concern
2.2. Data

| Classification | Parameter | Source |
| Coastal Landforms (CL) | Geotechnical Classification (GC) | [69] |
| Flooding (FL) | Flood Hazard Zones (FHZ) | [68,80] |
| Slope (S) | [65] | |
| Sea-Level Rise (SLR) | [72] | |
| Wave Exposition | Mean Significant Wave Height (MeanW) | [72] |
| Max Significant Wave Height (MaxW) | [72] | |
| Tide Height (TD) | [70,71] | |
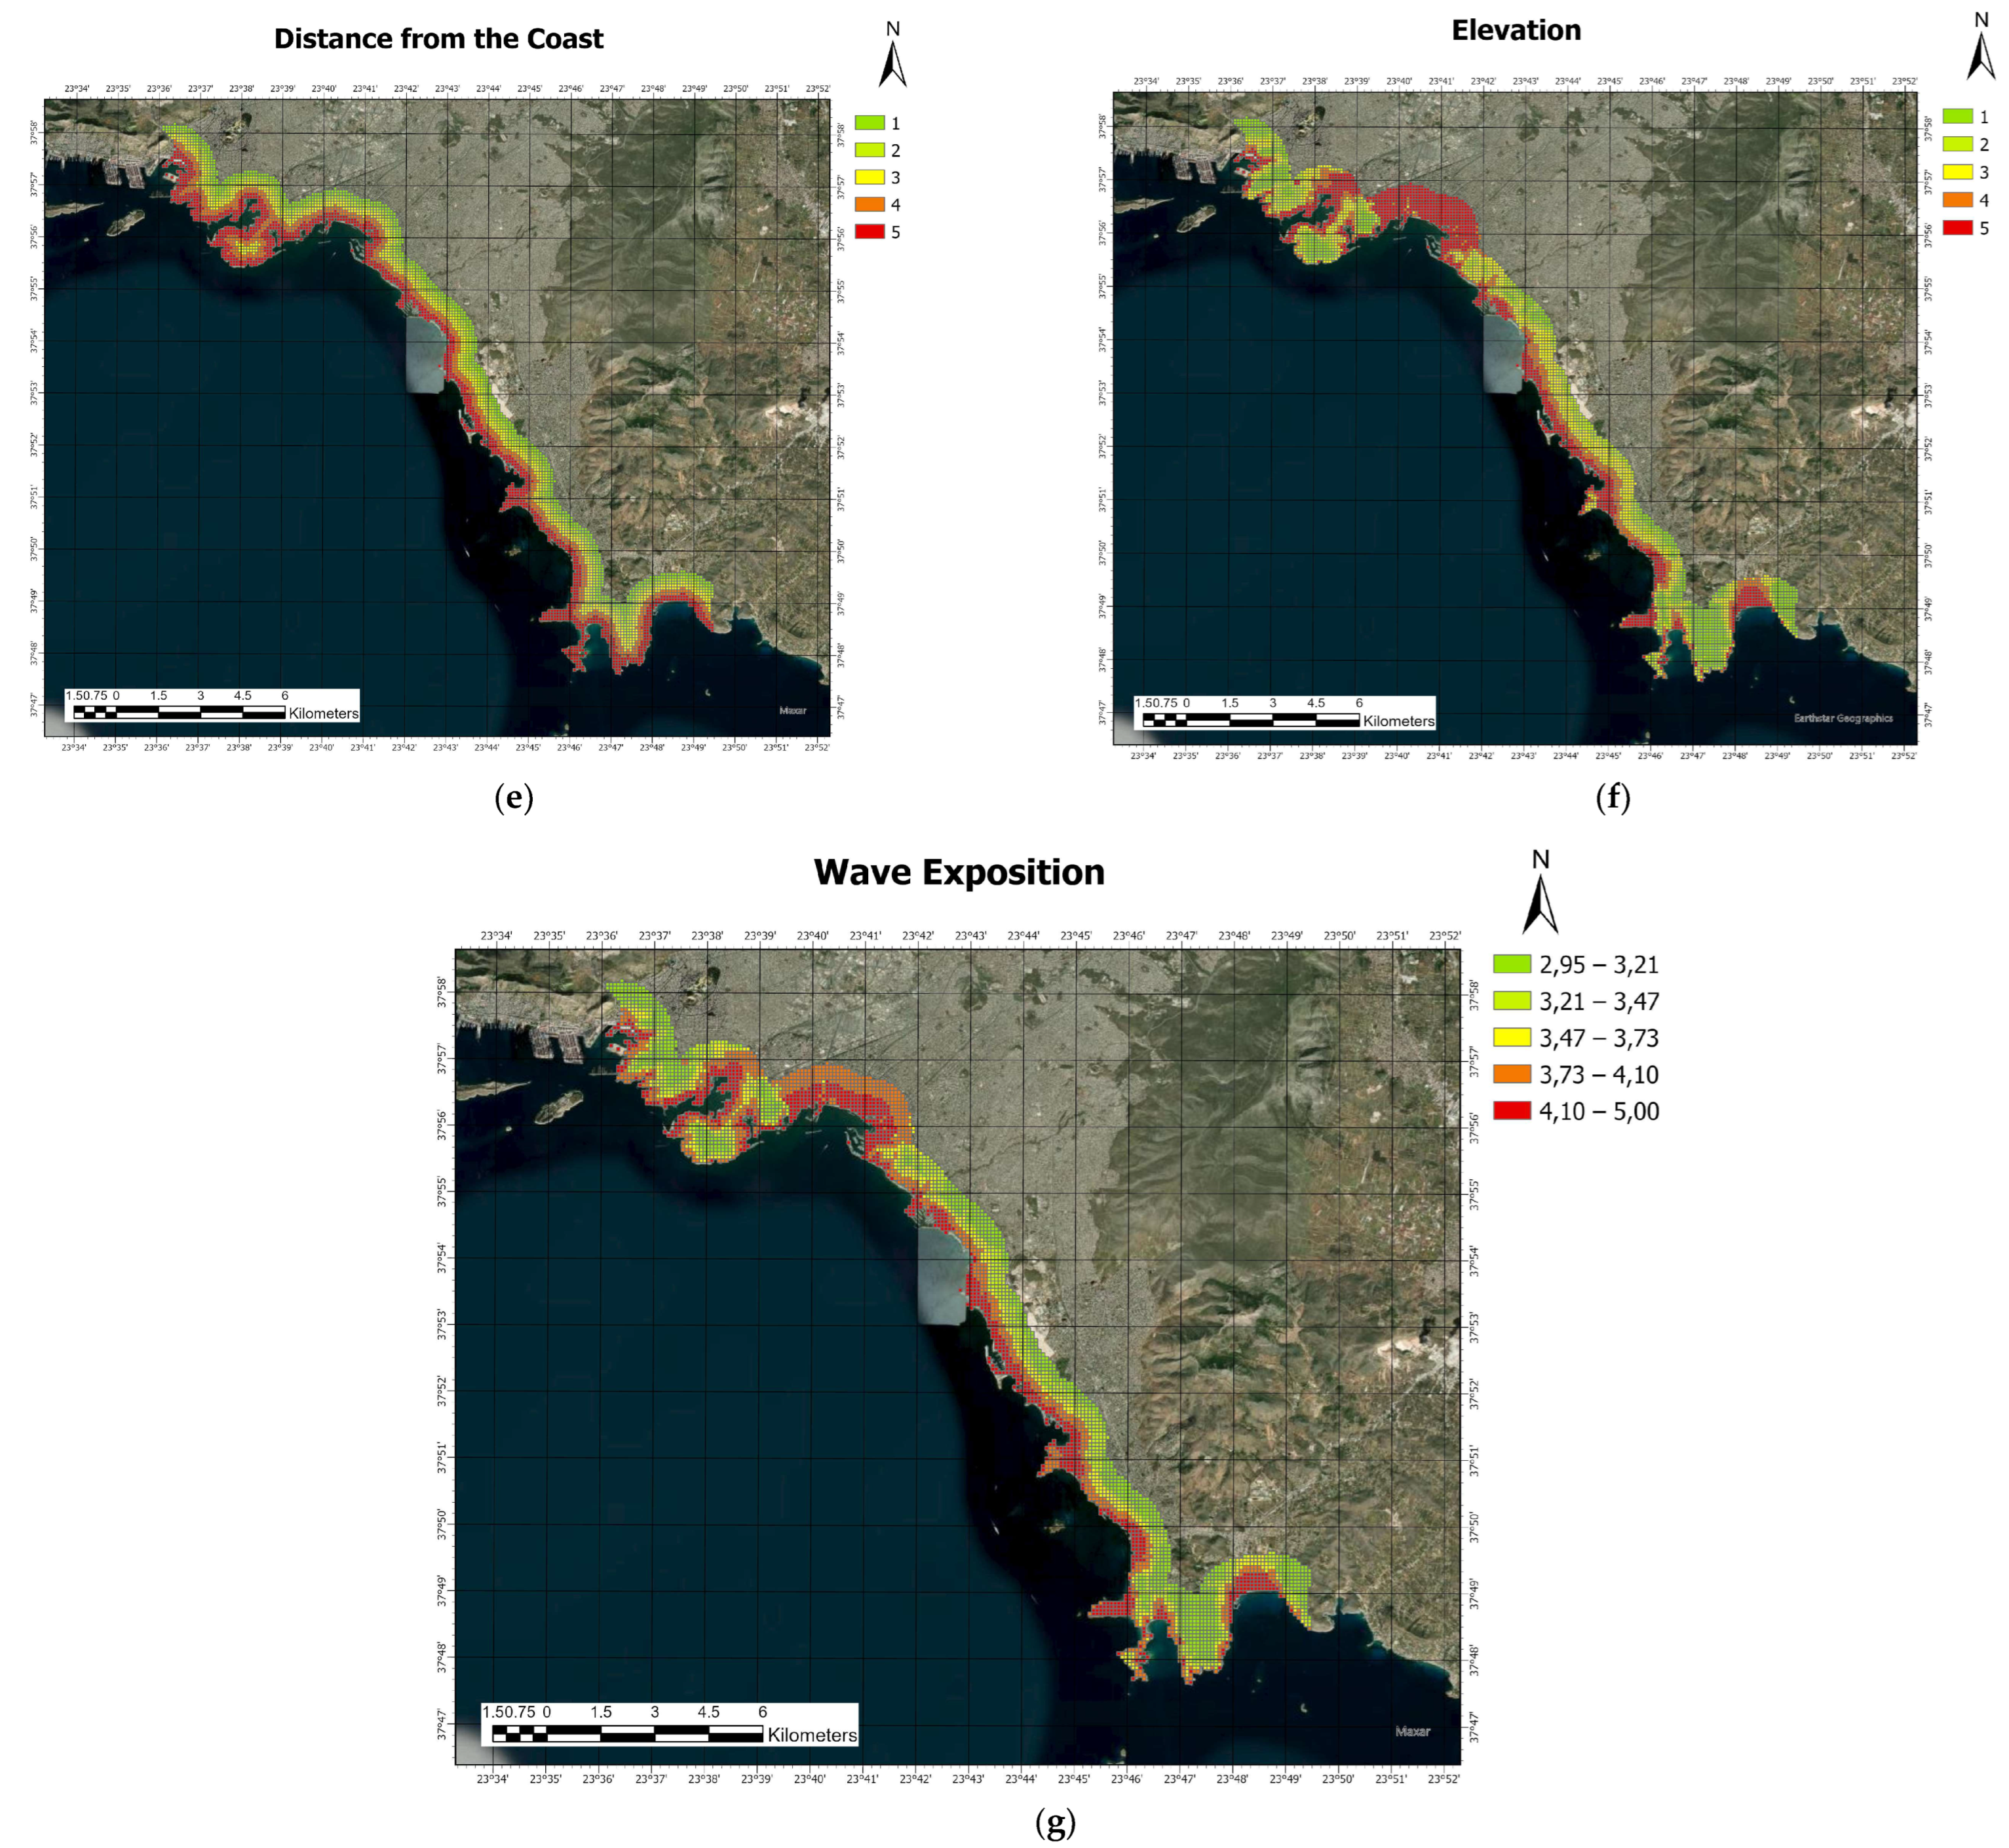
| Distance from the coast (D) | [77,78] | |
| Elevation (E) | [65] | |
| Number of extreme events (EE) | [66,67] | |
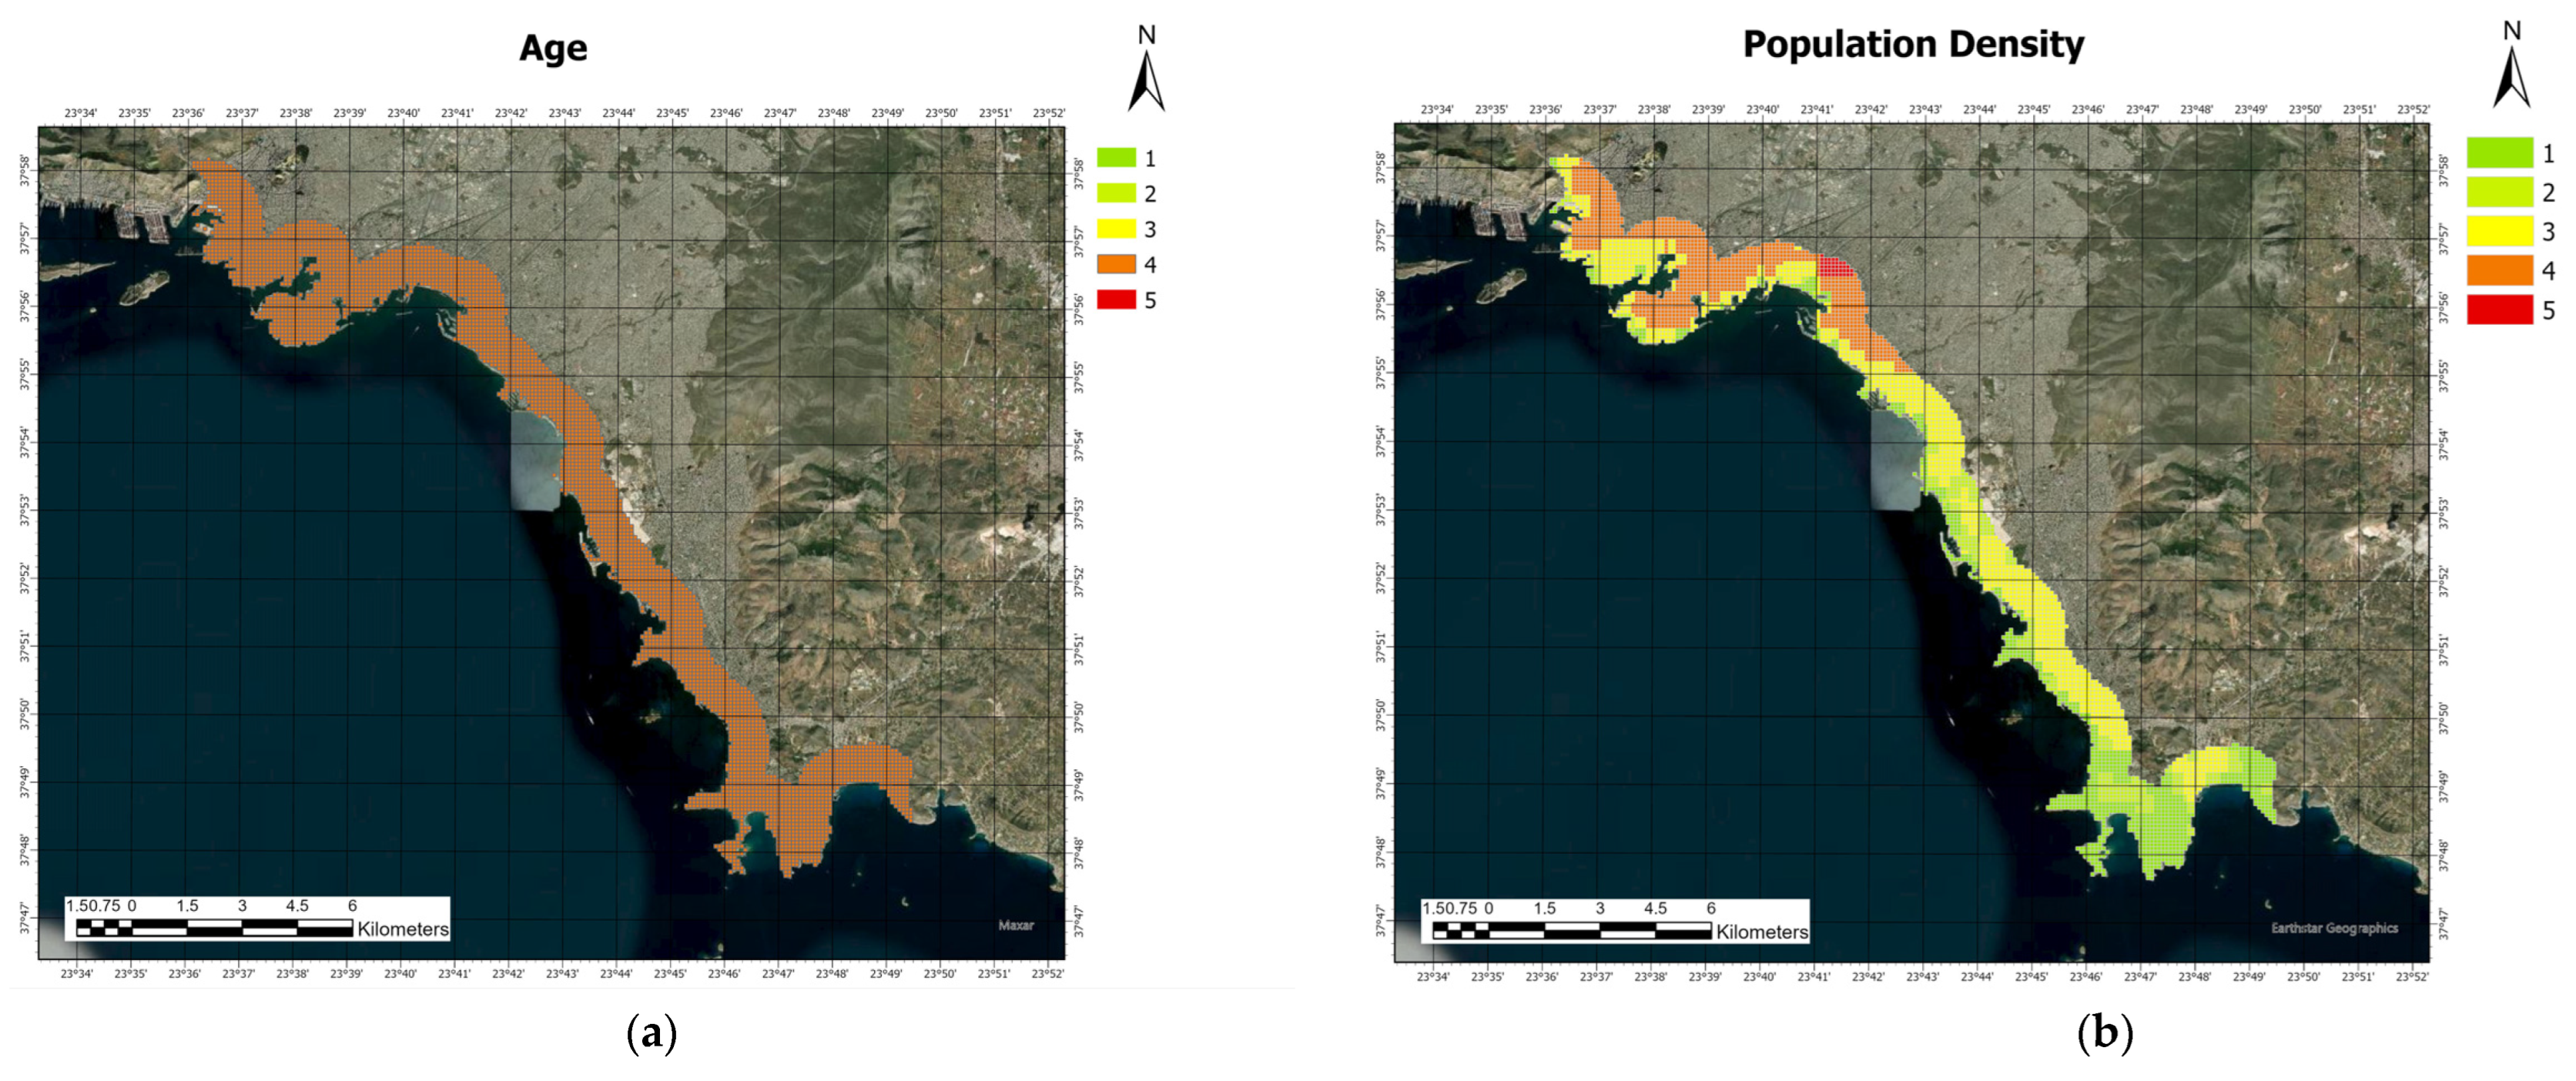
| Socioeconomic | Age (population aged less than 9 and more than 70 years old) (A) | [75] |
| Population Density (PD) | [76] | |
| Education Level (% of the population that has attended post-secondary education) (EL) | [75] | |
| Urban Development (% of population change within 10 years) (UD) | [75] | |
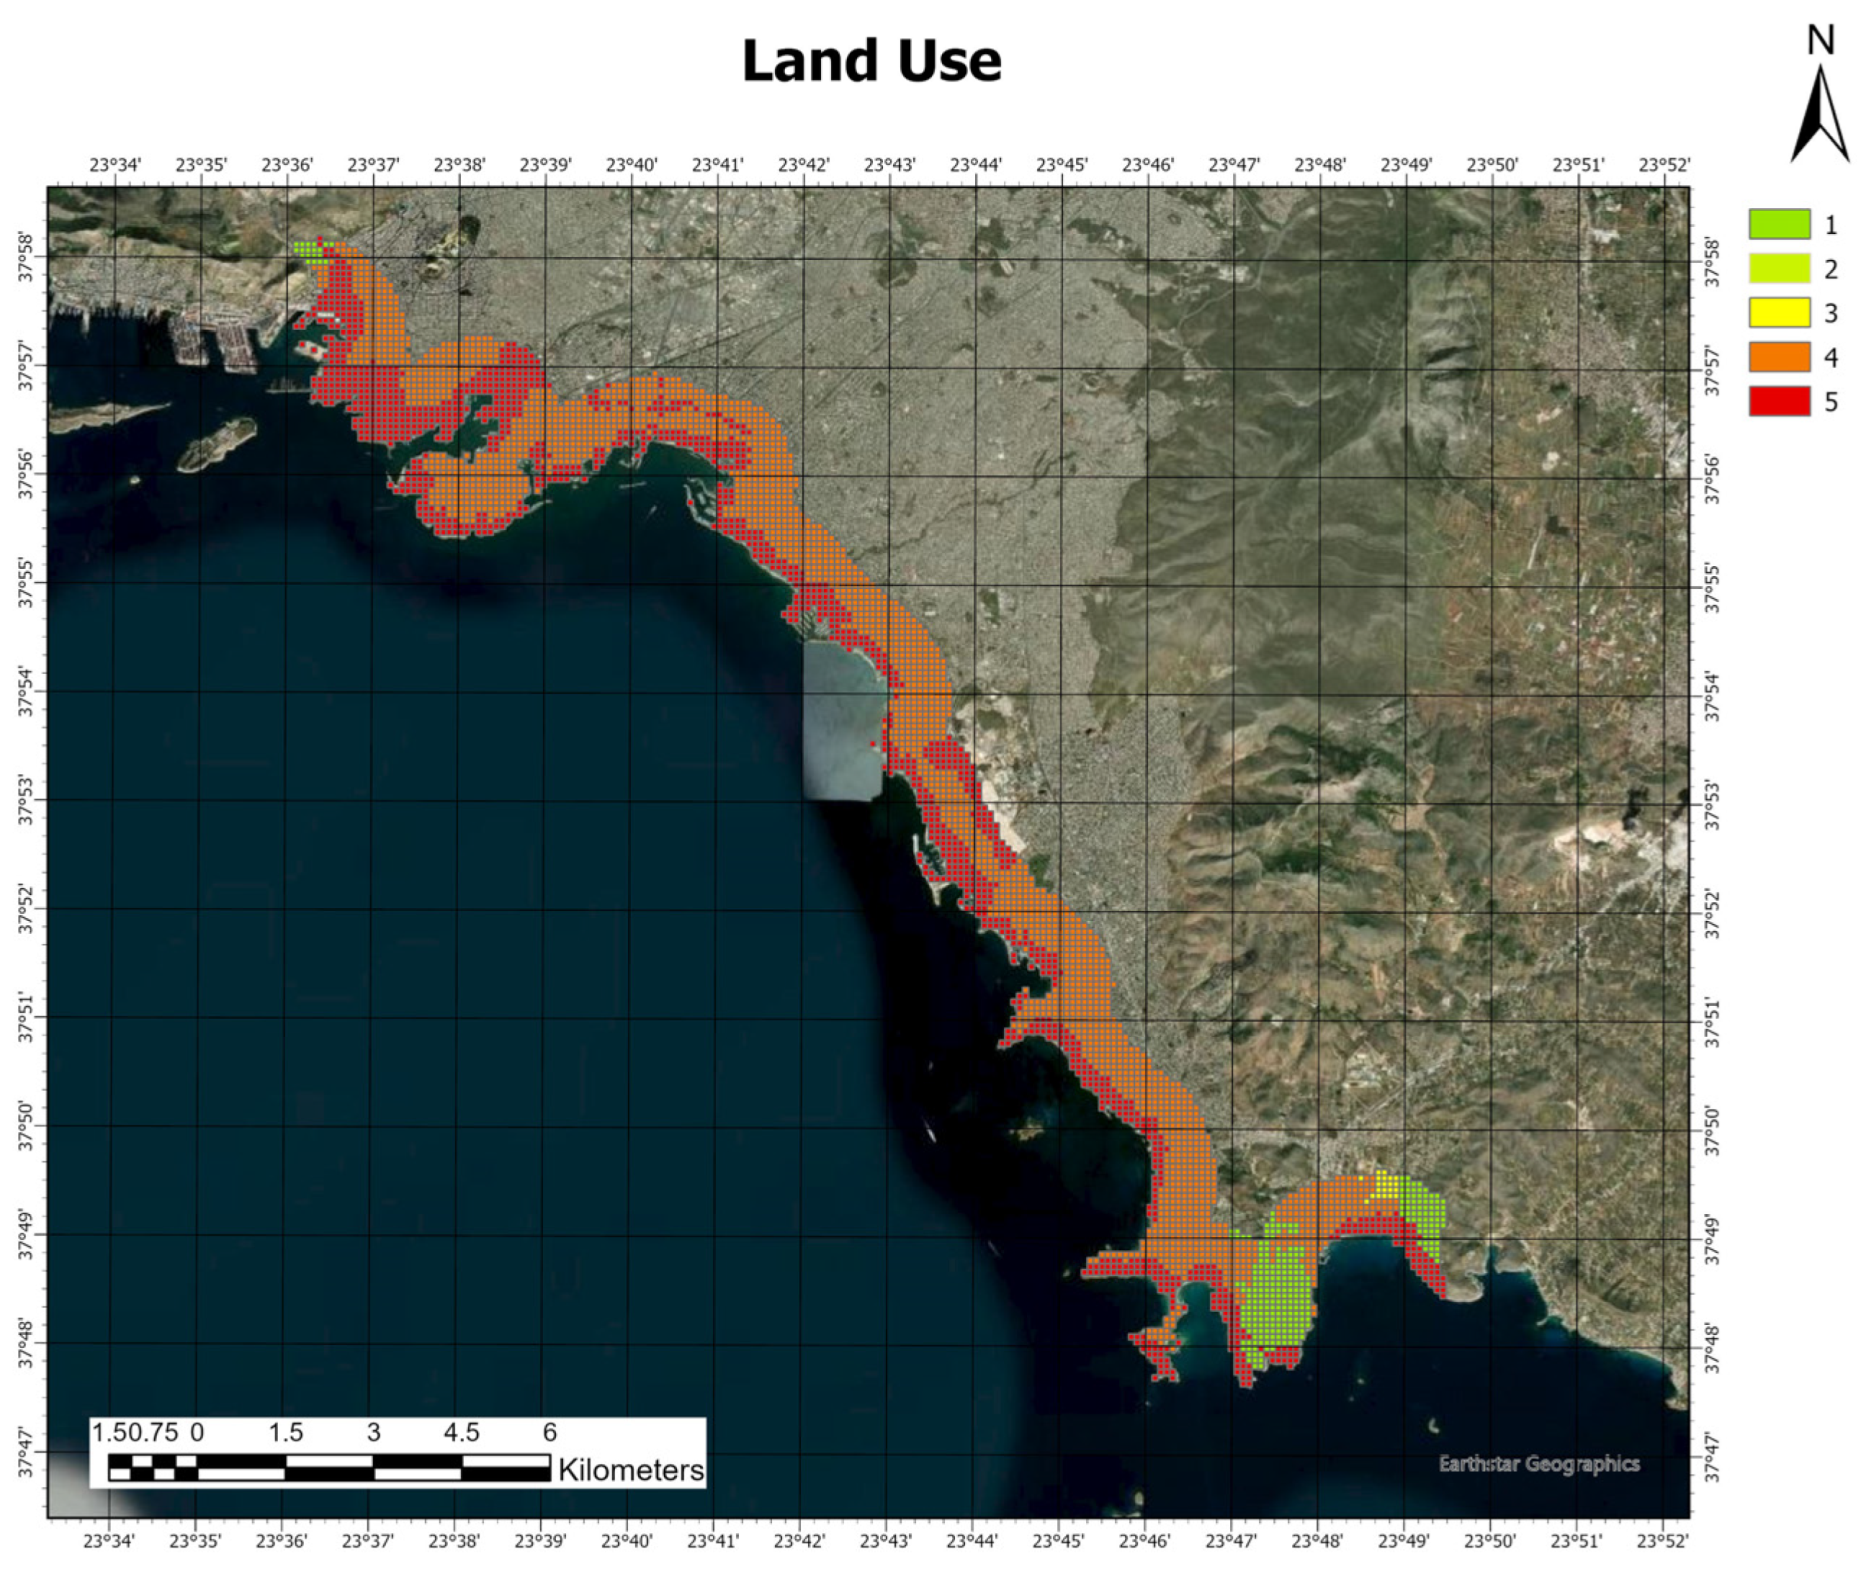
| Land Use | Land Use (LU) | [74] |
| Infrastructure/Functional | Road Network (TN) | [77,78] |
| Distance from hospitals/fire departments/police departments (DHPF) | [77,78] | |
| Level of community Awareness/Preparedness (AP1) | [78,80] | |
| Level of Public Natural Hazard Adaptation Planning (AP2) | [78,80] |
2.3. Methodology
3. Results
4. Discussion
5. Conclusions
Author Contributions
Funding
Institutional Review Board Statement
Informed Consent Statement
Data Availability Statement
Conflicts of Interest
References
- Wahl, T.; Brown, S.; Haigh, I.; Nilsen, J. Coastal Sea Levels, Impacts, and Adaptation. J. Mar. Sci. Eng. 2018, 6, 19. [Google Scholar] [CrossRef]
- McGranahan, G.; Balk, D.; Anderson, B. The rising tide: Assessing the risks of climate change and human settlements in low elevation coastal zones. Environ. Urban. 2007, 19, 17–37. [Google Scholar] [CrossRef]
- IPCC. Global warming of 1.5 °C. An IPCC Special Report on the impacts of global warming of 1.5 °C above pre-industrial levels and related global greenhouse gas emission pathways, in the context of strengthening the global response to the threat of climate change, sustainable development, and efforts to eradicate poverty; Masson-Delmotte, V., Zhai, P., Pörtner, H.O., Roberts, D., Skea, J., Shukla, P.R., Pirani, A., Moufouma-Okia, W., Péan, C., Pidcock, R.; et al., Eds.; 2018. Available online: https://www.ipcc.ch/site/assets/uploads/sites/2/2022/06/SR15_Full_Report_HR.pdf (accessed on 1 September 2023).
- IPCC. Summary for Policymakers. In Climate Change 2023: Synthesis Report. A Report of the Intergovernmental Panel on Climate Change. Contribution of Working Groups I, II and III to the Sixth Assessment Report of the Intergovernmental Panel on Climate Change; Core Writing Team, Lee, H., Romero, J., Eds.; IPCC: Geneva, Switzerland, 2023; 36p, in press. [Google Scholar]
- Tsoukala, V.; Chondros, M.; Kapelonis, Z.; Martzikos, N.; Lykou, A.; Belibassakis, K.; Makropoulos, C. An integrated wave modelling framework for extreme and rare events for climate change in coastal areas—The case of Rethymno, Crete. Oceanologia 2016, 58, 71–79. [Google Scholar] [CrossRef]
- Afentoulis, V.; Kragiopoulou, E.; Skarlatou, E.; Moschos, E.; Lykou, A.; Makropoulos, C.; Tsoukala, V. Coastal processes assessment under extreme storm events using numerical modelling approaches. Environ. Process. 2017, 4, 731–747. [Google Scholar] [CrossRef]
- Chalastani, V.; Pantelidis, A.; Tsaimou, C.; Tsoukala, V. Development of a Complex Vulnerability Index for Fishing Shelters—The Case of Cyprus. In Proceedings of the 7th Europe Congress of the International Association for Hydro-environment Engineering and Research (IAHR), Athens, Greece, 7–9 September 2022. [Google Scholar]
- Tsaimou, C.; Kagkelis, G.; Papadimitriou, A.; Chalastani, V.; Sartampakos, P.; Chondros, M.; Tsoukala, V. Advanced Multi-Area Approach for Coastal Vulnerability Assessment. In Proceedings of the 7th Europe Congress of the International Association for Hydro-Environment Engineering and Research (IAHR), Athens, Greece, 7–9 September 2022. [Google Scholar]
- Giannakidou, C.; Diakoulaki, D.; Memos, C.D. Vulnerability to Coastal Flooding of Industrial Urban Areas in Greece. Environ. Process. 2020, 7, 749–766. [Google Scholar] [CrossRef]
- Brooks, N. Vulnerability, Risk and Adaptation: A conceptual Framework. Tyndall Centre for Climate Change Research. Working Paper 38. School of Environmental Sciences 2003, University of East Anglia, Norwich, UK. Available online: https://gsdrc.org/document-library/vulnerability-risk-and-adaptation-a-conceptual-framework (accessed on 20 May 2021).
- Bevacqua, E.; Maraun, D.; Vousdoukas, M.I.; Voukouvalas, E.; Vrac, M.; Mentaschi, L.; Widmann, M. Higher probability of compound flooding from precipitation and storm surge in Europe under anthropogenic climate change. Sci. Adv. 2019, 5, eaaw5531. [Google Scholar] [CrossRef] [PubMed]
- McIntosh, R.D.; Becker, A. Expert evaluation of open-data indicators of seaport vulnerability to climate and extreme weather impacts for U.S. North Atlantic ports. Ocean Coast. Manag. 2019, 180, 104911. [Google Scholar] [CrossRef]
- Malone, E.L.; Engle, N.L. Evaluating regional vulnerability to climate change: Purposes and methods. WIREs Clim. Change 2011, 2, 462–474. [Google Scholar] [CrossRef]
- United Nations. The Paris Agreement. Conference of the Parties, United Nations Framework Convention on Climate Change, Paris, November–December 2015. 2015. Available online: https://unfccc.int/sites/default/files/english_paris_agreement.pdf (accessed on 21 September 2020).
- Gornitz, V. Global coastal hazards from future sea level rise. Palaeogeogr. Palaeoclimatol. Palaeoecol. 1991, 89, 379–398. [Google Scholar] [CrossRef]
- Thieler, E.R.; Hammar-Klose, E.S. National Assessment of Coastal Vulnerability to Sea-Level Rise. Open-File Report 1999, 179p. Available online: https://pubs.usgs.gov/dds/dds68/reports/gulfrep.pdf (accessed on 19 November 2020).
- Cutter, S.L.; Boruff, B.J.; Shirley, W.L. Social Vulnerability to Environmental Hazards *. Soc. Sci. Q. 2003, 84, 242–261. [Google Scholar] [CrossRef]
- Roukounis, C.N.; Tsihrintzis, V.A. Indices of Coastal Vulnerability to Climate Change: A Review. Environ. Process. 2022, 9, 29. [Google Scholar] [CrossRef]
- Shaw, J.; Taylor, R.B.; Solomon, S.; Christian, H.A.; Forbes, D.L. Potential Impacts of Global Sea-Level Rise on Canadian Coasts. Can. Geogr. /Le Géographe Can. 1998, 42, 365–379. [Google Scholar] [CrossRef]
- Mclaughlin, S.; Cooper, J.A.G. A multi-scale coastal vulnerability index: A tool for coastal managers? Environ. Hazards 2010, 9, 233–248. [Google Scholar] [CrossRef]
- Karymbalis, E.; Chalkias, C.; Chalkias, G.; Grigoropoulou, E.; Manthos, G.; Ferentinou, M. Assessment of the sensitivity of the southern coast of the Gulf of Corinth (Peloponnese, Greece) to sea-level rise. Open Geosci. 2012, 4, 561–577. [Google Scholar] [CrossRef]
- Tragaki, A.; Gallousi, C.; Karymbalis, E. Coastal Hazard Vulnerability Assessment Based on Geomorphic, Oceanographic and Demographic Parameters: The Case of the Peloponnese (Southern Greece). Land 2018, 7, 56. [Google Scholar] [CrossRef]
- Zampazas, G.; Karymbalis, E.; Chalkias, C. Assessment of the sensitivity of Zakynthos Island (Ionian Sea, Western Greece) to climate change-induced coastal hazards. Z. Für Geomorphol. 2022, 63, 183–200. [Google Scholar] [CrossRef]
- Tate, E.; Cutter, S.L.; Berry, M. Integrated Multihazard Mapping. Environ. Plan. B Plan. Des. 2010, 37, 646–663. [Google Scholar] [CrossRef]
- Satta, A. An Index-Based Method to Assess Vulnerabilities and Risks of Mediterranean Coastal Zones to Multiple Hazards—Un Indice per la Valutazione delle Vulnerabilità e dei Rischi Generati da Multiple Pericolosità sulle zone Costiere del Mediterraneo. Ph.D. Thesis, Department of Economics Ca’Foscari University, Venice, Italy, 2014. [Google Scholar] [CrossRef]
- Zanetti, V.; de Sousa Junior, W.; De Freitas, D. A Climate Change Vulnerability Index and Case Study in a Brazilian Coastal City. Sustainability 2016, 8, 811. [Google Scholar] [CrossRef]
- Gargiulo, C.; Battarra, R.; Tremiterra, M.R. Coastal areas and climate change: A decision support tool for implementing adaptation measures. Land Use Policy 2020, 91, 104413. [Google Scholar] [CrossRef]
- Pendleton, E.A.; Thieler, E.R.; Williams, S.J.; Beavers, R. Coastal Vulnerability Assessment of Cumberland Island National Seashore (CUIS) to Sea-Level Rise. 2004. Available online: https://pubs.usgs.gov/of/2004/1196/ofr20041196.pdf (accessed on 16 October 2020).
- Rao, K.N.; Subraelu, P.; Rao, T.V.; Malini, B.H.; Ratheesh, R.; Bhattacharya, S.; Rajawat, A.S. Sea-level rise and coastal vulnerability: An assessment of Andhra Pradesh coast, India through remote sensing and GIS. J. Coast. Conserv. 2008, 12, 195–207. [Google Scholar] [CrossRef]
- Doukakis, E. Coastal vulnerability and risk parameters. Eur. Water 2005, 11, 3–7. [Google Scholar]
- Abuodha, P.A.; Woodroffe, C.D. Assessing vulnerability of coasts to climate change: A review of approaches and their application to the Australian coast. In Proceedings of the GIS for the Coastal Zone: A Selection of Papers from CoastGIS 2006; Woodroffe, C., Bruce, E., Poutinen, M., Furness, R., Eds.; University of Wollongong: Wollongong, Australia, 2006; p. 458. Available online: https://ro.uow.edu.au/cgi/viewcontent.cgi?article=1189&context=scipapers (accessed on 29 August 2023).
- Devoy, R.J.N. Coastal Vulnerability and the Implications of Sea-Level Rise for Ireland. J. Coast. Res. 2008, 242, 325–341. [Google Scholar] [CrossRef]
- Gaki-Papanastassiou, K.; Karymbalis, E.; Poulos, S.; Zouva, C. Coastal vulnerability assessment to sea-level rise based on geomorphological and oceanographical parameters: The case of Argolikos Gulf. Hell. J. Geosci. 2010, 45, 109–122. [Google Scholar]
- Yin, J.; Yin, Z.; Wang, J.; Xu, S. National assessment of coastal vulnerability to sea-level rise for the Chinese coast. J. Coast. Conserv. 2012, 16, 123–133. [Google Scholar] [CrossRef]
- Tibbetts, J.R.; van Proosdij, D. Development of a relative coastal vulnerability index in a macro-tidal environment for climate change adaptation. J. Coast. Conserv. 2013, 17, 775–797. [Google Scholar] [CrossRef]
- Bonetti, J.; Klein, A.H.F.; Muler, M.; De Luca, C.B.; Silva, G.V.; Toldo, E.E., Jr.; Gonzalez, M. Spatial and numerical methodologies on coastal erosion and flooding risk assessment. In Coastal Hazards; Coastal Research Library Series; Finkl, C., Ed.; Springer: Dordrecht, The Netherlands, 2013; Chapter 16; pp. 423–442. [Google Scholar]
- Addo, K.A. Assessing Coastal Vulnerability Index to Climate Change: The Case of Accra—Ghana. J. Coast. Res. 2013, 165, 1892–1897. [Google Scholar] [CrossRef]
- Mani Murali, R.; Ankita, M.; Amrita, S.; Vethamony, P. Coastal vulnerability assessment of Puducherry coast, India, using the analytical hierarchical process. Nat. Hazards Earth Syst. Sci. 2013, 13, 3291–3311. [Google Scholar] [CrossRef]
- Bagdanavičiūtė, I.; Kelpšaitė, L.; Soomere, T. Multi-criteria evaluation approach to coastal vulnerability index development in micro-tidal low-lying areas. Ocean Coast. Manag. 2015, 104, 124–135. [Google Scholar] [CrossRef]
- Pantusa, D.; D’Alessandro, F.; Riefolo, L.; Principato, F.; Tomasicchio, G. Application of a Coastal Vulnerability Index. A Case Study along the Apulian Coastline, Italy. Water 2018, 10, 1218. [Google Scholar] [CrossRef]
- Gzam, M.; Mansouri, B.; Gargouri, D.; Kharroubi, A. Assessment of the Coastal Sensitivity in the Southern Mediterranean Using the CSI. Environ. Process. 2022, 9, 39. [Google Scholar] [CrossRef]
- Wu, S.; Yarnal, B.; Fisher, A. Vulnerability of coastal communities to sea-level rise: A case study of Cape May County, New Jersey, USA. Clim. Res. 2002, 22, 255–270. [Google Scholar] [CrossRef]
- Briguglio, L.; Galea, W. Updating and Augmenting the Economic Vulnerability Index. In Occasional Chapters on Islands and Small States; Islands and Small States Institute of the University of Malta: Msida, Malta, 2003; Volume 4, pp. 1–15. Available online: https://www.um.edu.mt/library/oar/handle/123456789/18371 (accessed on 1 December 2020).
- Chakraborty, J.; Tobin, G.A.; Montz, B.E. Population Evacuation: Assessing Spatial Variability in Geophysical Risk and Social Vulnerability to Natural Hazards. Nat. Hazards Rev. 2005, 6, 23–33. [Google Scholar] [CrossRef]
- Li, K.; Li, G.S. Vulnerability assessment of storm surges in the coastal area of Guangdong Province. Nat. Hazards Earth Syst. Sci. 2011, 11, 2003–2010. [Google Scholar] [CrossRef]
- Mackey, P.; Russell, M. Climate Change scenarios, sea level rise for Ca Mau, Kien Giang-Climate Change Impact and Adaptation Study in the Mekong Delta —Part A. In Climate Change Vulnerability & Risk Assessment Study for Ca Mau and Kien Giang Provinces, Vietnam; Institute of Meteorology, Hydrology and Environment of Vietnam (IMHEN): Hanoi, Vietnam, 2011; p. 250. Available online: https://www.adb.org/sites/default/files/project-documents/43295-012-tacr-03b_0.pdf (accessed on 2 September 2023).
- Ahsan, M.N.; Warner, J. The socioeconomic vulnerability index: A pragmatic approach for assessing climate change led risks–A case study in the south-western coastal Bangladesh. Int. J. Disaster Risk Reduct. 2014, 8, 32–49. [Google Scholar] [CrossRef]
- Edmonds, H.K.; Lovell, J.E.; Lovell, C.A.K. A new composite climate change vulnerability index. Ecol. Indic. 2020, 117, 106529. [Google Scholar] [CrossRef]
- Kleinosky, L.R.; Yarnal, B.; Fisher, A. Vulnerability of Hampton Roads, Virginia to Storm-Surge Flooding and Sea-Level Rise. Nat. Hazards 2006, 40, 43–70. [Google Scholar] [CrossRef]
- Guillard-Gonçalves, C.; Cutter, S.L.; Emrich, C.T.; Zêzere, J.L. Application of Social Vulnerability Index (SoVI) and delineation of natural risk zones in Greater Lisbon, Portugal. J. Risk Res. 2014, 18, 651–674. [Google Scholar] [CrossRef]
- Toimil, A.; Losada, I.J.; Díaz-Simal, P.; Izaguirre, C.; Camus, P. Multi-sectoral, high-resolution assessment of climate change consequences of coastal flooding. Clim. Change 2017, 145, 431–444. [Google Scholar] [CrossRef]
- Boruff, B.J.; Emrich, C.; Cutter, S.L. Erosion hazard vulnerability of US coastal counties. J. Coast. Res. 2005, 215, 932–942. [Google Scholar] [CrossRef]
- Mendoza, E.T.; Jiménez, J.A. Regional vulnerability analysis of Catalan beaches to storms. Proc. Inst. Civ. Eng.-Marit. Eng. 2009, 162, 127–135. [Google Scholar] [CrossRef]
- Balica, S.F.; Wright, N.G.; van der Meulen, F. A flood vulnerability index for coastal cities and its use in assessing climate change impacts. Nat. Hazards 2012, 64, 73–105. [Google Scholar] [CrossRef]
- Kokkinos, D.; Prinos, P.; Galiatsatou, P. Assessment of coastal vulnerability for present and future climate conditions in coastal areas of the Aegean Sea. In Proceedings of the 11th International Conference on Hydroscience & Engineering, Hamburg, Germany, 28 September–2 October 2014; Available online: https://www.researchgate.net/publication/266561166 (accessed on 22 June 2021).
- El-Zein, A.; Ahmed, T.; Tonmoy, F. Geophysical and social vulnerability to floods at municipal scale under climate change: The case of an inner-city suburb of Sydney. Ecol. Indic. 2021, 121, 106988. [Google Scholar] [CrossRef]
- Satta, A.; Venturini, S.; Puddu, M.; Firth, J.; Lafitte, A. Strengthening the Knowledge Base on Regional Climate Variability and Change: Application of a Multi-Scale Coastal Risk Index at Regional and Local Scale in the Mediterranean. Plan Bleu Technical Report. September 2015. Available online: https://planbleu.org/wp-content/uploads/2020/04/multi-scale_coastal_risk_index_compressed.pdf (accessed on 10 January 2021).
- Calil, J.; Reguero, B.G.; Zamora, A.R.; Losada, I.J.; Méndez, F.J. Comparative Coastal Risk Index (CCRI): A multidisciplinary risk index for Latin America and the Caribbean. PLoS ONE 2017, 12, e0187011. [Google Scholar] [CrossRef]
- Hawchar, L.; Naughton, O.; Nolan, P.; Stewart, M.G.; Ryan, P.C. A GIS-based framework for high-level climate change risk assessment of critical infrastructure. Clim. Risk Manag. 2020, 29, 100235. [Google Scholar] [CrossRef]
- Kantamaneni, K. Coastal infrastructure vulnerability: An integrated assessment model. Nat. Hazards 2016, 84, 139–154. [Google Scholar] [CrossRef]
- Debortoli, N.S.; Clark, D.G.; Ford, J.D.; Sayles, J.S.; Diaconescu, E.P. An integrative climate change vulnerability index for Arctic aviation and marine transportation. Nat. Commun. 2019, 10, 2596. [Google Scholar] [CrossRef]
- Innes, C.; Anand, M.; Bauch, C. The impact of human-environment interactions on the stability of forest-grassland mosaic ecosystems. Sci. Rep. 2013, 2689, 3. [Google Scholar] [CrossRef]
- Gaur, A.; Simonovic, S.P. Towards Reducing Climate Change Impact Assessment Process Uncertainty. Environ. Process. 2015, 2, 275–290. [Google Scholar] [CrossRef]
- Tran, L.T.; O’Neill, R.V.; Smith, E.R. Determine the most influencing stressors and the most susceptible resources for environmental integrated assessment. Ecol Model. 2009, 220, 2335–2340. [Google Scholar] [CrossRef]
- Hellenic Cadastre Office. Digital Elevation Model 5x5m; Hellenic Cadastre Office: Athens, Greece, 2021.
- Hellenic Centre for Marine Research. 2022. Available online: https://poseidon.hcmr.gr/ (accessed on 10 December 2022).
- Hochman, A.; Marra, F.; Messori, G.; Pinto, J.G.; Raveh-Rubin, S.; Yosef, Y.; Zittis, G. Extreme weather and societal impacts in the eastern Mediterranean. Earth Syst. Dyn. 2022, 13, 749–777. [Google Scholar] [CrossRef]
- Ministry of Environment and Energy (YPEN). Preliminary Flood Risk Assessment. 2012. Available online: https://floods.ypeka.gr/egyFloods/prokatarktiki_axiologisi/GR_PFRA_REPORT_V2_7.6.2013.pdf (accessed on 1 September 2023).
- Greek Institute of Geology and Mineral Exploration (GIGME). Online Map, Data. Available online: https://gaia.igme.gr/portal/home/ (accessed on 21 July 2022).
- Tsimplis, M.N. Tidal Oscillations in the Aegean and Ionian Seas. Estuar. Coast. Shelf Sci. 1994, 39, 201–208. [Google Scholar] [CrossRef]
- Vousdoukas, M.I.; Mentaschi, L.; Voukouvalas, E.; Verlaan, M.; Feyen, L. Extreme sea levels on the rise along Europe’s coasts. Earth’s Future 2017, 5, 304–323. [Google Scholar] [CrossRef]
- Soukissian, T.; Hatzinaki, M.; Korres, G.; Papadopoulos, A.; Kallos, G.; Anadranistakis, E. Wind and Wave Atlas of the Hellenic Seas; Hellenic Centre for Marine Research Publication: Heraklion, Greece, 2007; 300p, ISBN 978-960-86651-9-4. [Google Scholar]
- Marcos, M.; Tsimplis, M.N.; Shaw, A.G.P. Sea level extremes in southern Europe. J. Geophys. Res. 2009, 114, C01007. [Google Scholar] [CrossRef]
- Copernicus Land Monitoring Service (CLMS); European Environment Agency (EEA). CORINE Land Cover. Available online: https://land.copernicus.eu/ (accessed on 15 March 2022).
- Hellenic Statistical Authority (ELSTAT) Population-Housing Census. Available online: https://www.statistics.gr/2011-census-pop-hous (accessed on 10 August 2021).
- Schiavina, M.; Freire, S.; MacManus, K. GHS-POP R2022A—GHS Population Grid Multitemporal (1975–2030); European Commission, Joint Research Centre (JRC): Brussels, Belgium, 2022. [Google Scholar] [CrossRef]
- OpenStreetMap Contributors. OpenStreetMap Foundation: Cambridge, UK; 2021. Available online: https://openstreetmap.org (accessed on 1 February 2022).
- Open Data Greece. Available online: https://geodata.gov.gr/ (accessed on 4 March 2023).
- Ministry of Environment and Energy (YPEN). National Energy and Climate Plan (NECP). 2016. Available online: https://ypen.gov.gr/wp-content/uploads/legacy/Files/Klimatiki%20Allagi/Prosarmogi/20160406_ESPKA_teliko.pdf (accessed on 2 December 2022).
- Ministry of Environment and Energy (YPEN). Online Geospatial Information Portal. 2021. Available online: http://mapsportal.ypen.gr/ (accessed on 1 August 2022).
- Adens, S.A.; Regional Adaptation Plan to Climate Change. Attica Region. 2021. Available online: https://www.patt.gov.gr/koinonia/perivallon/pespka/pespka_ye1/ (accessed on 20 December 2021).
- Saaty, R.W. The analytic hierarchy process—What it is and how it is used. Math. Model. 1987, 9, 161–176. [Google Scholar] [CrossRef]
- Saaty, T.L. Making and validating complex decisions with the AHP/ANP. J. Syst. Sci. Syst. Eng. 2005, 14, 1–36. [Google Scholar] [CrossRef]
- Mau-Crimmins, T.; de Steiguer, J.E.; Dennis, D. AHP as a means for improving public participation: A pre–post experiment with university students. For. Policy Econ. 2005, 7, 501–514. [Google Scholar] [CrossRef]
- Lepetu, J.P. The use of analytic hierarchy process (AHP) for stakeholder preference analysis: A case study from Kasane Forest Reserve, Botswana. J. Soil Sci. Environ. Manag. 2012, 3, 237–251. [Google Scholar]
- Roukounis, C.N.; Karambas, T.; Aretoulis, G. Multicriteria Decision Making for Water Aerodromes Allocation in Greece. In Proceedings of the 7th Transport Research Arena TRA 2018, Vienna, Austria, 16–19 April 2018. [Google Scholar]
- Roukounis, C.N.; Aretoulis, G.; Karambas, T. A Combination of PROMETHEE and Goal Programming Methods for the Evaluation of Water Airport Connections. Int. J. Decis. Support Syst. Technol. 2020, 12, 50–66. [Google Scholar] [CrossRef]
- Vandarakis, D.; Panagiotopoulos, I.P.; Loukaidi, V.; Hatiris, G.-A.; Drakopoulou, P.; Kikaki, A.; Gad, F.-K.; Petrakis, S.; Malliouri, D.I.; Chatzinaki, M.; et al. Assessment of the Coastal Vulnerability to the Ongoing Sea Level Rise for the Exquisite Rhodes Island (SE Aegean Sea, Greece). Water 2021, 13, 2169. [Google Scholar] [CrossRef]
- Goepel, K.D. Implementation of an Online Software Tool for the Analytic Hierarchy Process (AHP-OS). Int. J. the Anal. Hierarchy Process 2018, 10, 469–487. [Google Scholar] [CrossRef]
- Larsen, R. Elementary Linear Algebra; Cengage Learning: Boston, MA, USA, 2013. [Google Scholar]
- Alonso, J.A.; Lamata, T. Consistency in the Analytic Hierarchy Process: A new approach. Int. J. Uncertain. Fuzziness Knowl.-Based Syst. 2006, 14, 445–459. [Google Scholar] [CrossRef]
- Rizzo, A.; Vandelli, V.; Buhagiar, G.; Micallef, A.S.; Soldati, M. Coastal Vulnerability Assessment along the North-Eastern Sector of Gozo Island (Malta, Mediterranean Sea). Water 2020, 12, 1405. [Google Scholar] [CrossRef]
- Šimac, Z.; Lončar, N.; Faivre, S. Overview of Coastal Vulnerability Indices with Reference to Physical Characteristics of the Croatian Coast of Istria. Hydrology 2023, 10, 14. [Google Scholar] [CrossRef]


| No. | Index | Authors |
|---|---|---|
| 1 | CVI (Coastal Vulnerability Index) | [15,16,20,28,29,30,31,32,33,34,35,36,37,38,39,40] |
| 2 | Sensitivity and Coastal Sensitivity Index | [19,21,22,23,41] |
| 3 | Composite (social, economic, environmental) Vulnerability Index | [7,26,42,43,44,45,46,47,48] |
| 4 | Social Vulnerability Index | [17,24,49,50,51] |
| 5 | PVI (Place Vulnerability Index) | [52] |
| 6 | Coastal Flood Vulnerability Index | [53,54,55,56] |
| 7 | Coastal Risk Index | [25,57,58,59] |
| 8 | Coastal Infrastructure Vulnerability Index | [60,61] |
| 9 | CORI (Coastal Resilience Index) | [27] |
| Classification | Parameter | Units | Categories | |||||
|---|---|---|---|---|---|---|---|---|
| 1 | 2 | 3 | 4 | 5 | Thresholds Adapted from | |||
| Coastal Landforms (CL) | Geotechnical Classification | - | Rocky, high cliffs, seawalls | Medium cliffs and indented coast, bulkhead | Low cliffs, alluvial plain | Cobble beach, estuary lagoon | Sandy beach, mudflat, delta | [15,16] adapted to Greek case studies by [21,22,33,88] |
| Flooding (FL) | Flood Hazard Zones (FHZ) | - | Outside | Inside | Elaborated by authors | |||
| Slope (S) | % | S ≥ 15 | 9 ≤ S < 15 | 6 ≤ S < 9 | 3 ≤ S < 6 | S < 3 | [15,16] adapted to Greek case studies by [21,22,33,88] | |
| Sea-Level Rise (SLR) | mm/y | SLR < 1.8 | 1.8 ≤ SLR < 2.5 | 2.5 ≤ SLR < 3.0 | 3.0 ≤ SLR < 3.4 | SLR > 3.4 | [15,16] adapted to Greek case studies by [21,22,33,88] | |
| Wave Exposition | Mean Significant Wave Height (MeanW) | m | MeanW < 0.30 | 0.3 ≤ MeanW < 0.6 | 0.6 ≤ MeanW < 0.9 | 0.9 ≤ MeanW < 1.2 | MeanW > 1.20 | [15,16] adapted to Greek case studies by [21,22,33,88] |
| Max Significant Wave Height (MaxW) | m | MaxW < 3.0 | 3.0 ≤ MaxW < 5.0 | 5.0 ≤ MaxW < 6.0 | 6.0 ≤ MaxW < 6.9 | MaxW > 6.9 | [15,16] adapted to Greek case studies by [21,22,33,88] | |
| Tide Height (TD) | m | TD < 0.2 | 0.2 ≤ TD < 0.4 | 0.4 ≤ TD < 0.6 | 0.6 ≤ TD < 0.8 | TD > 0.8 | [40] | |
| Distance from the coast (D) | m | 1500 < D ≤ 2000 | 1000 < D ≤ 1500 | 500 < D ≤ 1000 | 250 < D ≤ 500 | D < 250 | [25] | |
| Elevation (E) | m | E > 30 | 20 ≤ D < 30 | 10 ≤ D < 20 | 5 ≤ D < 10 | E < 5 | [20] | |
| Number of extreme events (EE) | No of events in the last 10 years | 0 ≤ EE < 3 | 3 ≤ EE < 10 | 10 ≤ EE < 20 | 20 ≤ EE < 36 | EE ≥ 36 | [26] | |
| Socioeconomic | Age (population aged less than 9 and more than 70 years old) (A) | % | A < 8 | 8 ≤ A < 14 | 14 ≤ A < 20 | 20 ≤ A < 25 | A ≥ 25 | [27] |
| Population Density (PD) | Persons/km2 | PD < 1000 | 1000 ≤ PD < 2000 | 2000 ≤ PD < 10,000 | 10,000 ≤ PD < 20,000 | A ≥ 20,000 | [57] elaborated by authors | |
| Education Level (% of population that have attended post-secondary education) (EL) | % | EL ≥ 60 | 40 ≤ EL < 60 | 27 ≤ EL < 40 | 10 ≤ EL < 27 | EL < 10 | [25] | |
| Urban Development (% of population change within 10 years) (UD) | % | UD < 0.1 | 0.1 ≤ UD < 0.5 | 0.5 ≤ UD < 1.0 | 1.0 ≤ UD < 2.0 | UD ≥ 2.0 | [25] | |
| Land Use | Land Use (LU) | - | Environmental protection area/natural habitat | Rural area | Residential Area | Commercial Area | Crucial Infrastructure and Industrial Area | [26]) |
| Infrastructure/Functional | Road Network (TN) | - | No roads/Minor Roads | Major Urban Roads | Highways | [27], Elaborated by authors | ||
| Distance from hospitals/fire departments/police departments (DHPF) | m | DHPF < 250 | 250 ≤ DHPF < 500 | 500 ≤ DHPF < 750 | 750 ≤ DHPF < 1000 | DHPF ≥ 1000 | Elaborated by authors | |
| Level of community Awareness/Preparedness (AP1) | - | Aware/Prepared | Partially Aware/Prepared | Not aware/prepared | [25] Elaborated by authors | |||
| Level of Public Natural Hazard Adaptation Planning (AP2) | - | Immediate Response | Adaptation Strategy not implemented yet | No Measures yet | Elaborated by authors | |||
| Factor | Coastal Landforms | Flooding | Wave Exposition | Socioeconomic | Land Use | Functional | Normalized Principal Eigenvector% |
|---|---|---|---|---|---|---|---|
| Coastal Landforms | 1.0000 | 0.2887 | 0.2500 | 0.2887 | 0.2887 | 0.2582 | 4.81 |
| Flooding | 3.4641 | 1.0000 | 1.0000 | 1.5811 | 1.4142 | 1.4142 | 20.80 |
| Wave Exposition | 4.0000 | 1.0000 | 1.0000 | 2.0000 | 2.0000 | 3.1623 | 28.47 |
| Socioeconomic | 3.4641 | 0.6325 | 0.5000 | 1.0000 | 0.2887 | 0.4082 | 10.50 |
| Land Use | 3.4641 | 0.7071 | 0.5000 | 3.4641 | 1.0000 | 0.5774 | 17.21 |
| Functional | 3.8730 | 0.7071 | 0.3162 | 2.4495 | 1.7321 | 1.0000 | 18.21 |
| Factor | Total Factor Weight (AHP) (%) | Parameters | Relevant Factor Weight (%) | Total Parameter Weight (%) |
|---|---|---|---|---|
| Coastal Landforms (CL) | 4.8 | Geotechnical Classification (GC) | 100.00 | 4.80 |
| Flooding (FL) | 20.8 | Flood Hazard Zones (FHZ) | 33.33 | 6.93 |
| Slope (S) | 33.33 | 6.93 | ||
| Sea-Level Rise (SLR) | 33.33 | 6.93 | ||
| Wave Exposition (WE) | 28.5 | Mean Significant Wave Height (MeanW) | 11.60 | 3.31 |
| Max Significant Wave Height (MaxW) | 26.70 | 7.61 | ||
| Tide Height (TD) | 4.30 | 1.23 | ||
| Number of extreme events (EE) | 12.90 | 3.68 | ||
| Distance from the coast (D) | 18.60 | 5.30 | ||
| Elevation (E) | 25.90 | 7.38 | ||
| Socioeconomic (SE) | 10.5 | Age (A) | 10.60 | 1.11 |
| Population Density (PD) | 41.30 | 4.34 | ||
| Education Level (EL) | 12.00 | 1.26 | ||
| Urban Development (UD) | 36.00 | 3.78 | ||
| Land Use (LU) | 17.2 | Land Use | 17.20 | 17.20 |
| Infrastructure/Functional (IF) | 18.2 | Road Network (TN) | 25.00 | 4.55 |
| Distance from hospitals/fire departments/police departments (DHPF) | 25.00 | 4.55 | ||
| Level of community Awareness/Preparedness (AP1) | 25.00 | 4.55 | ||
| Level of Public Natural Hazard Adaptation Planning (AP2) | 25.00 | 4.55 |
Disclaimer/Publisher’s Note: The statements, opinions and data contained in all publications are solely those of the individual author(s) and contributor(s) and not of MDPI and/or the editor(s). MDPI and/or the editor(s) disclaim responsibility for any injury to people or property resulting from any ideas, methods, instructions or products referred to in the content. |
© 2023 by the authors. Licensee MDPI, Basel, Switzerland. This article is an open access article distributed under the terms and conditions of the Creative Commons Attribution (CC BY) license (https://creativecommons.org/licenses/by/4.0/).
Share and Cite
Roukounis, C.N.; Tsoukala, V.K.; Tsihrintzis, V.A. An Index-Based Method to Assess the Resilience of Urban Areas to Coastal Flooding: The Case of Attica, Greece. J. Mar. Sci. Eng. 2023, 11, 1776. https://doi.org/10.3390/jmse11091776
Roukounis CN, Tsoukala VK, Tsihrintzis VA. An Index-Based Method to Assess the Resilience of Urban Areas to Coastal Flooding: The Case of Attica, Greece. Journal of Marine Science and Engineering. 2023; 11(9):1776. https://doi.org/10.3390/jmse11091776
Chicago/Turabian StyleRoukounis, Charalampos Nikolaos, Vasiliki K. Tsoukala, and Vassilios A. Tsihrintzis. 2023. "An Index-Based Method to Assess the Resilience of Urban Areas to Coastal Flooding: The Case of Attica, Greece" Journal of Marine Science and Engineering 11, no. 9: 1776. https://doi.org/10.3390/jmse11091776