Article

Investigation on Bearing Characteristics of Gravity Wharf Rubble-Mound Foundation in Different Influencing Factors

1
Key Laboratory of Ministry of Education for Geomechanics and Embankment Engineering, Hohai University, Nanjing 210098, China
2
Jiangsu Research Center for Geotechnical Engineering Technology, Hohai University, Nanjing 210098, China
3
Priority Research Center for Geotechnical Science and Engineering, The University of Newcastle, Callaghan, NSW 2308, Australia
*
Author to whom correspondence should be addressed.
J. Mar. Sci. Eng. 2023, 11(7), 1331; https://doi.org/10.3390/jmse11071331
Submission received: 31 May 2023 / Revised: 28 June 2023 / Accepted: 28 June 2023 / Published: 29 June 2023
(This article belongs to the Special Issue Advances in the Simulation of Coastal and Ocean Engineering Problems)

Abstract

:
The use of the heavy hammer compaction method can enhance the bearing characteristics of underwater rubble-mound foundations. This is crucial to ensure the safety and stability of port and coastal engineering projects. In the present work, a combination of image-recognition technology, 3D laser scanning technology, a discrete element numerical simulation, and a field test was first utilized to establish riprap particles and reconstruct a discrete element numerical model of a rubble-mound foundation, and then the effects of various influencing factors on the bearing characteristics of the rubble-mound foundation were studied. The main conclusions are as follows. (1) The load–settlement curve of the rubble-mound foundation can be divided into three stages: rapid growth stage, slow growth stage, and failure stage. (2) The ultimate bearing capacity of the rubble-mound foundation is positively correlated with the vibration time and vibration amplitude. The riprap particle size and the foundation thickness have negligible effects on the ultimate bearing capacity of the rubble-mound foundation. (3) When adjusting the vibration time, vibration amplitude, and foundation thickness, the settlement value of the rubble-mound foundation tends to increase as the compactness increases. On the other hand, the effects of factors such as the riprap particle size, riprap particle gradation, and vibration frequency on the compactness and settlement value of the rubble-mound foundation are less significant.

1. Introduction

The rubble-mound foundation is known for its simple construction technology, outstanding anti-slip ability, and economic applicability. It is commonly utilized beneath engineering structures such as gravity wharves, breakwaters, and immersed tube tunnels and plays a crucial role in ensuring the stability and deformation of the structure [1,2,3,4]. As these structures in ports and hydraulic engineering have grown in size these days, the bearing-capacity demand of underwater rubble-mound foundations has increased significantly [5,6,7,8]. The mechanical properties of rubble-mound foundation under wave action are very complex [9,10,11]. Notwithstanding a relatively long application history, the bearing characteristics of the rubble-mound foundation are still unclear due to the irregular shape of the riprap, uncertain parameters, uneven gradation, and unclear vibration compaction conditions, which are the key influencing factors. In the field of offshore port engineering, it is crucial to investigate the bearing characteristics of rubble-mound foundations after they have undergone vibration and densification. Understanding how the bearing characteristics of these foundations change under different influencing factors is of great importance for both scientific research and engineering applications.
Nowadays, the vibration compaction and bearing characteristics of underwater rubble-mound foundations are widely studied through laboratory tests, field tests, and numerical simulations [12,13,14,15]. The physical and mechanical properties of riprap can be determined through laboratory and field tests. These tests can then be used to compare the bearing characteristics of the rubble-mound foundation under different mechanical indicators [16]. Through physical test methods, various analyses can be conducted, such as a statistical analysis of the particle characteristics of the riprap, determination of the constitutive relationship of the riprap, and examination of the impact of rock content on permeability [17,18,19,20,21]. However, due to the high cost and numerous restrictions, conducting many analyses on a certain key influencing factor by using the test method is difficult. In the case of a discrete underwater rubble-mound foundation, a small amount of test data may not accurately reflect the influence of various factors on its bearing characteristics. Therefore, many experts and scholars have adopted numerical simulation research as an alternative approach [22,23,24,25,26]. Numerical simulation methods, such as finite element and discrete element, have been utilized to solve practical problems in port and coastal engineering [27,28,29]. By establishing a numerical model of the rubble-mound foundation and analyzing it under static or dynamic loads, researchers can reveal the movement and accumulation process of the riprap, as well as the change in mechanical characteristics over time [30,31]. The stress–strain laws of various rock and soil masses and the bearing capacity of foundations have also been studied to some extent under the influence of heavy hammer compaction, owing to the numerical simulations. The results have been reported to agree well with the data obtained from field tests [32,33].
Despite existing experimental and numerical simulation research on the compaction process and bearing capacity of rubble-mound foundations compacted by a heavy hammer, the bearing characteristics of such foundations under different influencing factors remain unclear. Driven by the intention of filling the gap, this study investigates the impact of various riprap and vibration factors on the bearing characteristics of underwater rubble-mound foundations, using a combination method of vibration compaction field tests, discrete element numerical simulation, riprap image-recognition technology, riprap mesoscopic simulation theory, 3D laser scanning technology, and PFC 3D particle flow discrete element model. The findings of this study can be used as a reference for actual engineering.

2. Discrete Element Model Used in Rubble-Mound Foundation

In the field of rubble-mound foundation engineering, ripraps are typically distributed randomly and vary in size, resulting in a relatively extensive particle gradation, which is unfavorable for the stability of rubble-mound foundations. The reason for this is that a rubble-mound foundation has low compactness and a weak bearing capacity when the particle gradation is uneven. The rubble-mound foundation can be considered a non-homogeneous discrete medium that requires simulation through a particle discrete element method, which accurately considers particle connections and interactions [34].

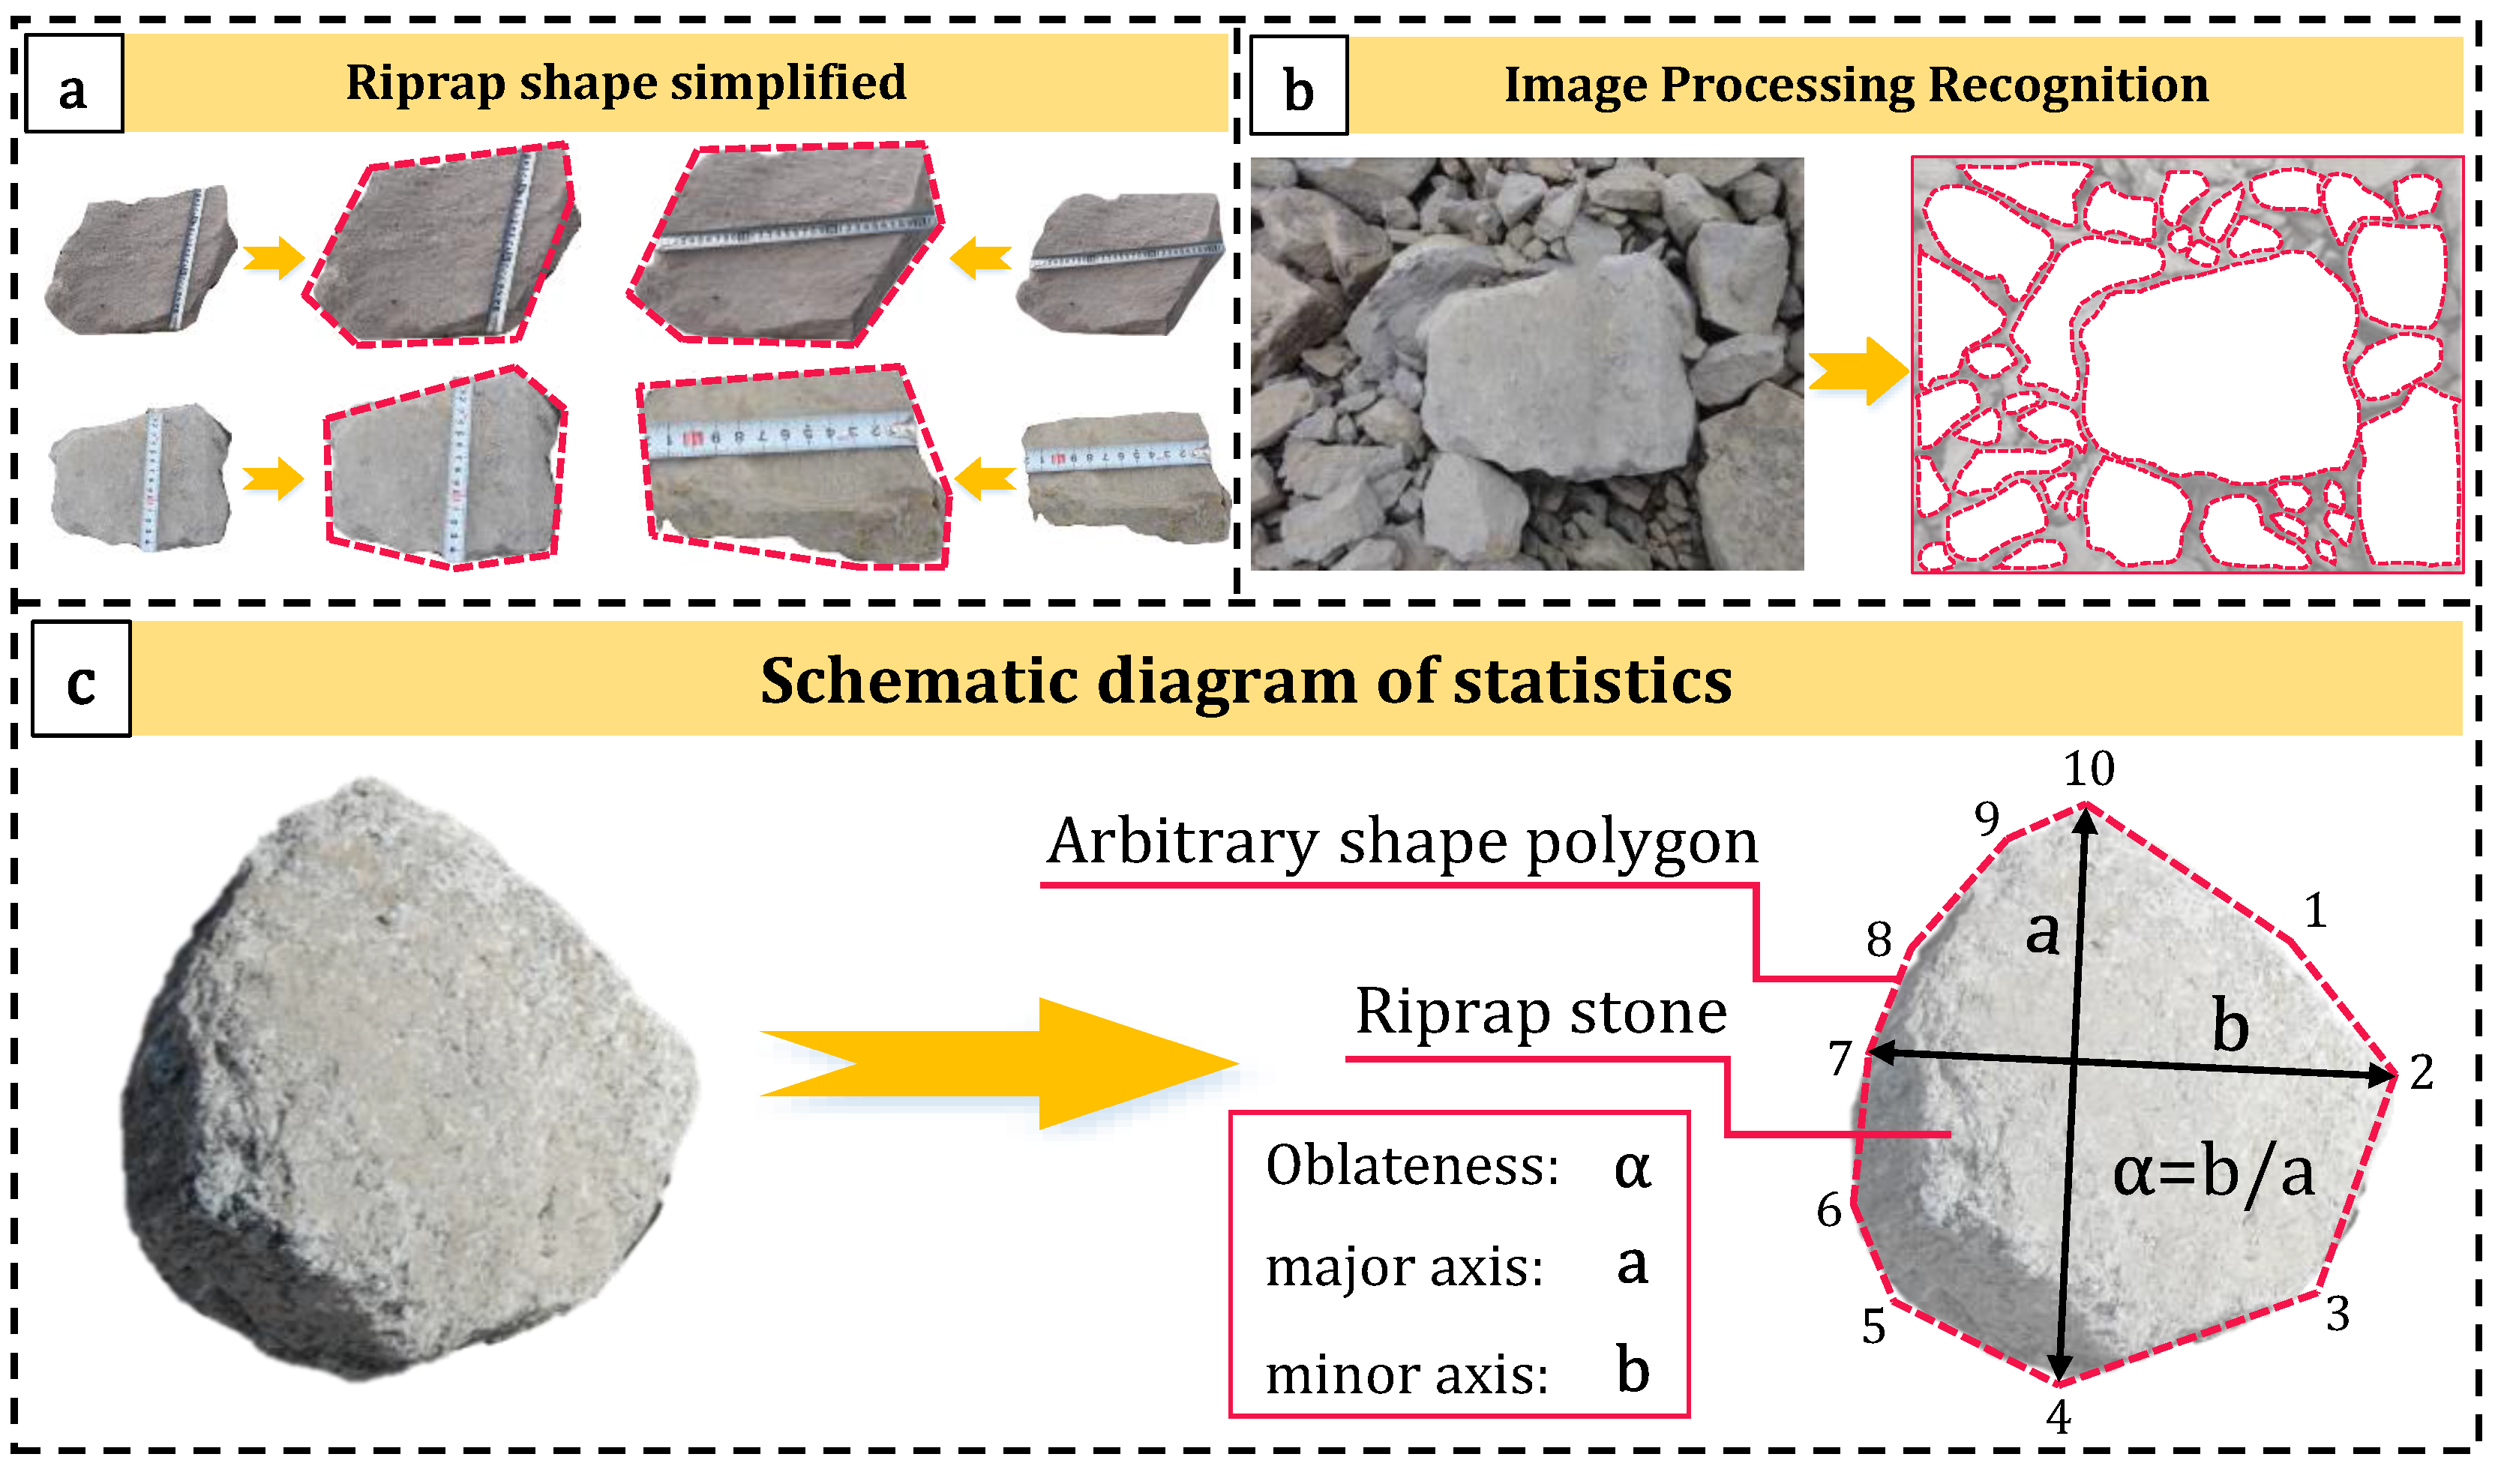
2.1. Riprap Image-Processing Recognition

The riprap stones in the rubble-mound foundation engineering are randomly distributed and uneven in size. To determine the particle gradation of the rubble-mound foundation, it is necessary to conduct on-site statistics on the shape of each riprap stone. This involves simplifying each riprap stone into an arbitrary polyhedron and obtaining its basic physical properties, such as stone size and acreage. This process is illustrated in Figure 1a. The use of image-recognition technology simplifies the statistics of the mesostructure of the riprap stone. As illustrated in Figure 1b, on-site pictures are imported into AutoCAD for riprap stone recognition and to distinguish the structural features of the riprap stones. A self-programmed program is then used to convert each riprap stone into an arbitrary polygon, from which its major axis, minor axis, oblateness, acreage, and other statistical characteristics are obtained. These statistical characteristics are essential for the construction of the discrete element model. As depicted in Figure 1c, the oblateness of a riprap stone is determined by the ratio of its minor axis to its major axis. The arbitrary polygon is made up of specific nodes. The program compares the distance between any two nodes, and the maximum distance obtained is considered the major axis. By approximating the major axis of the arbitrary polygon to the particle size of the riprap, the size distribution of the rubble-mound foundation can be determined. Table 1 shows the size distribution of the on-site riprap, which indicates a gradual decrease in the number of riprap stones with increasing stone size.

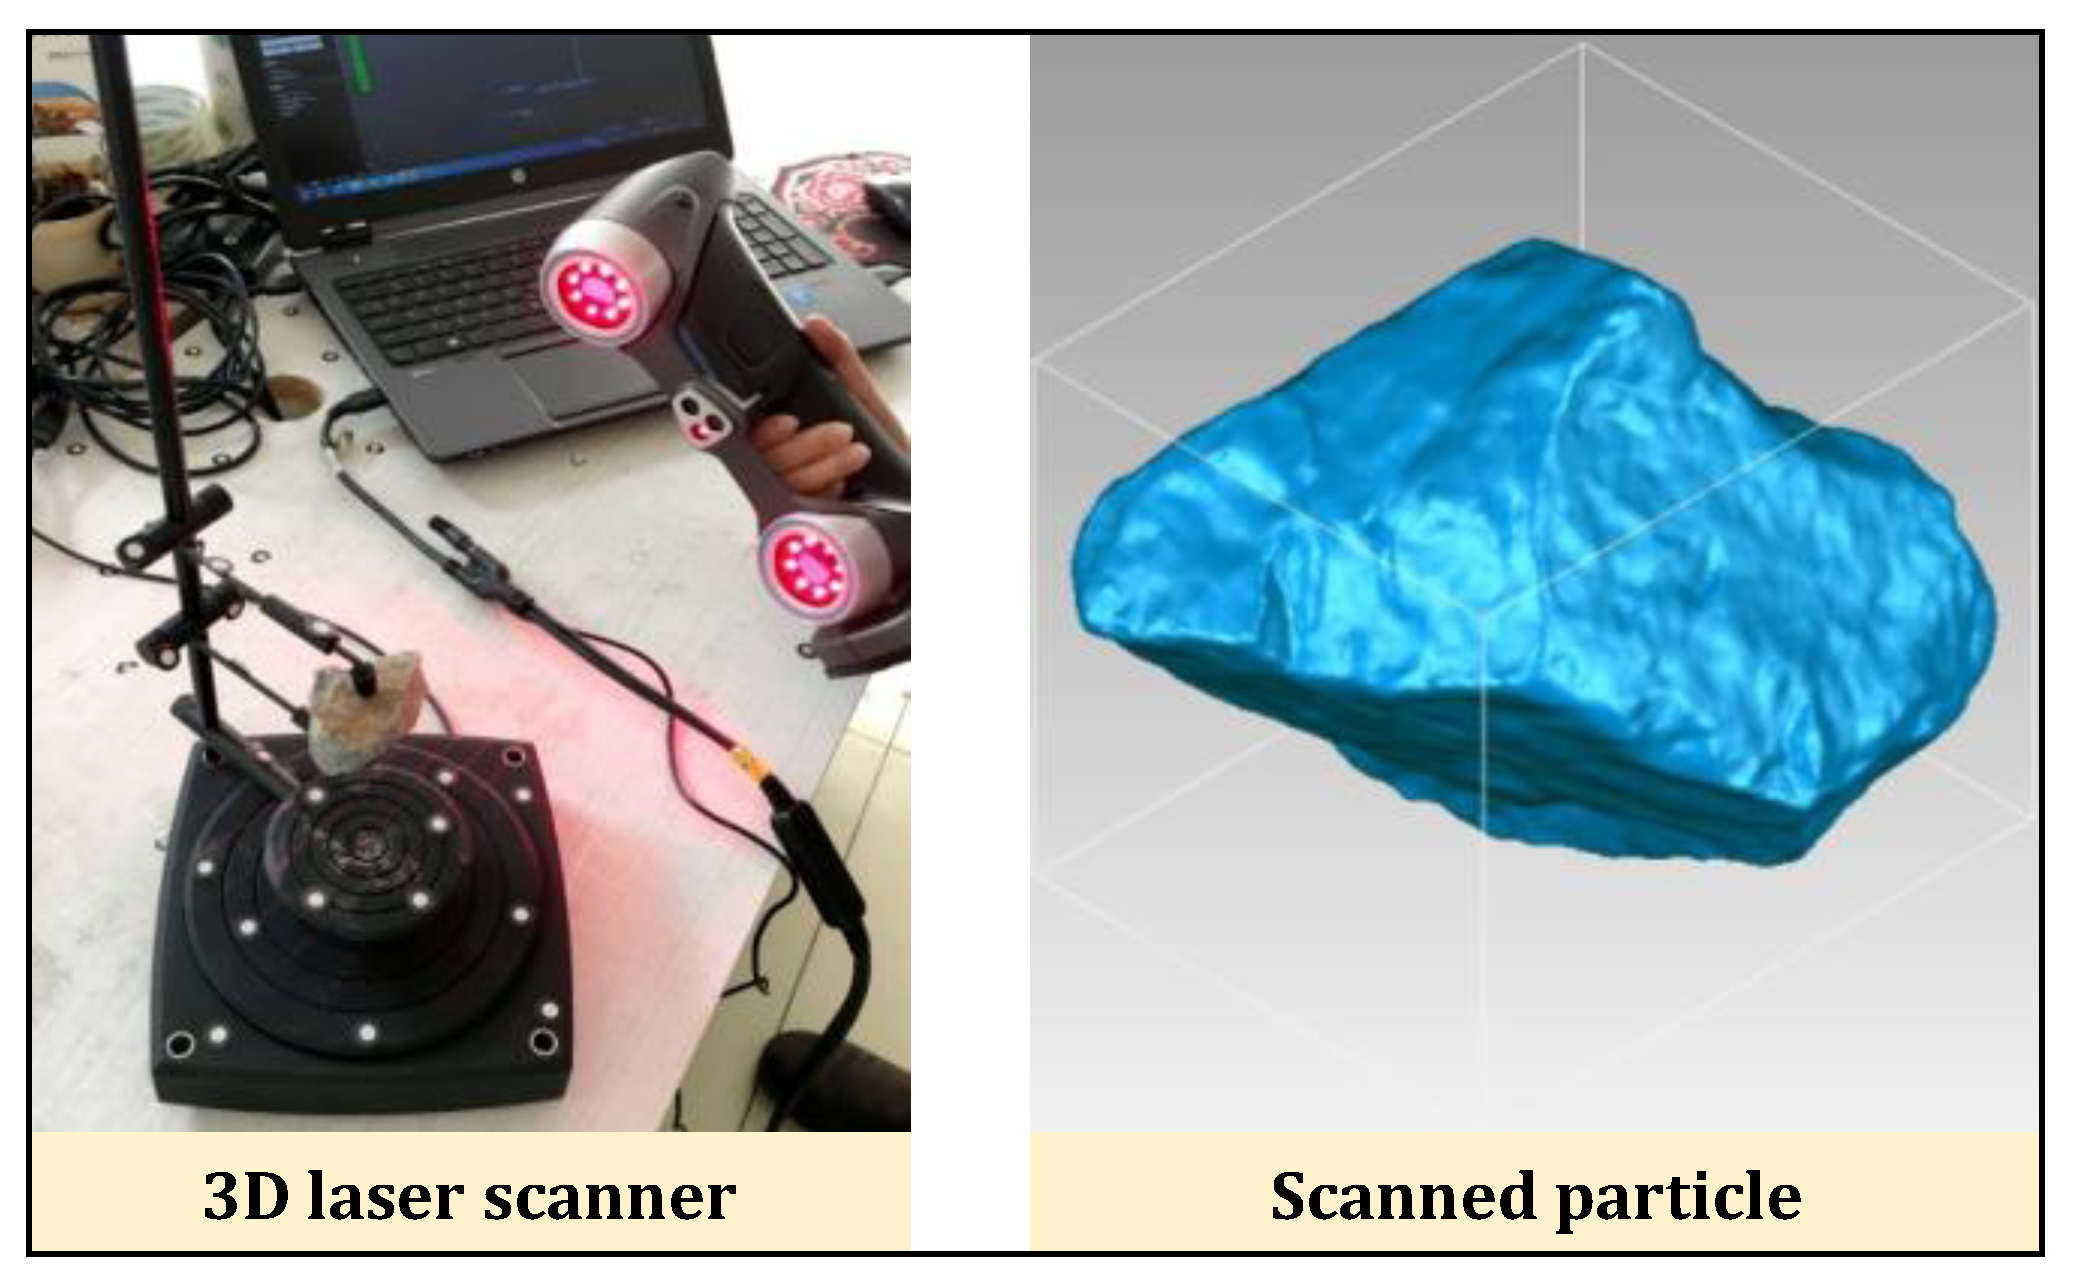
2.2. Three-Dimensional Riprap Model Construction

Three-dimensional laser scanning is an advanced and fully automated stereo mapping technique [35]. The technique involves obtaining dense data points on the surface of an object through laser ranging. The volume of the object can be calculated directly based on the incident time, reflection time, and scanning angle of each laser ray. The riprap was analyzed using a Handy Scan 700 TM laser scanner, which generated a 3D particle model (Figure 2). This model was then used as the foundation for subsequent PFC 3D modeling.

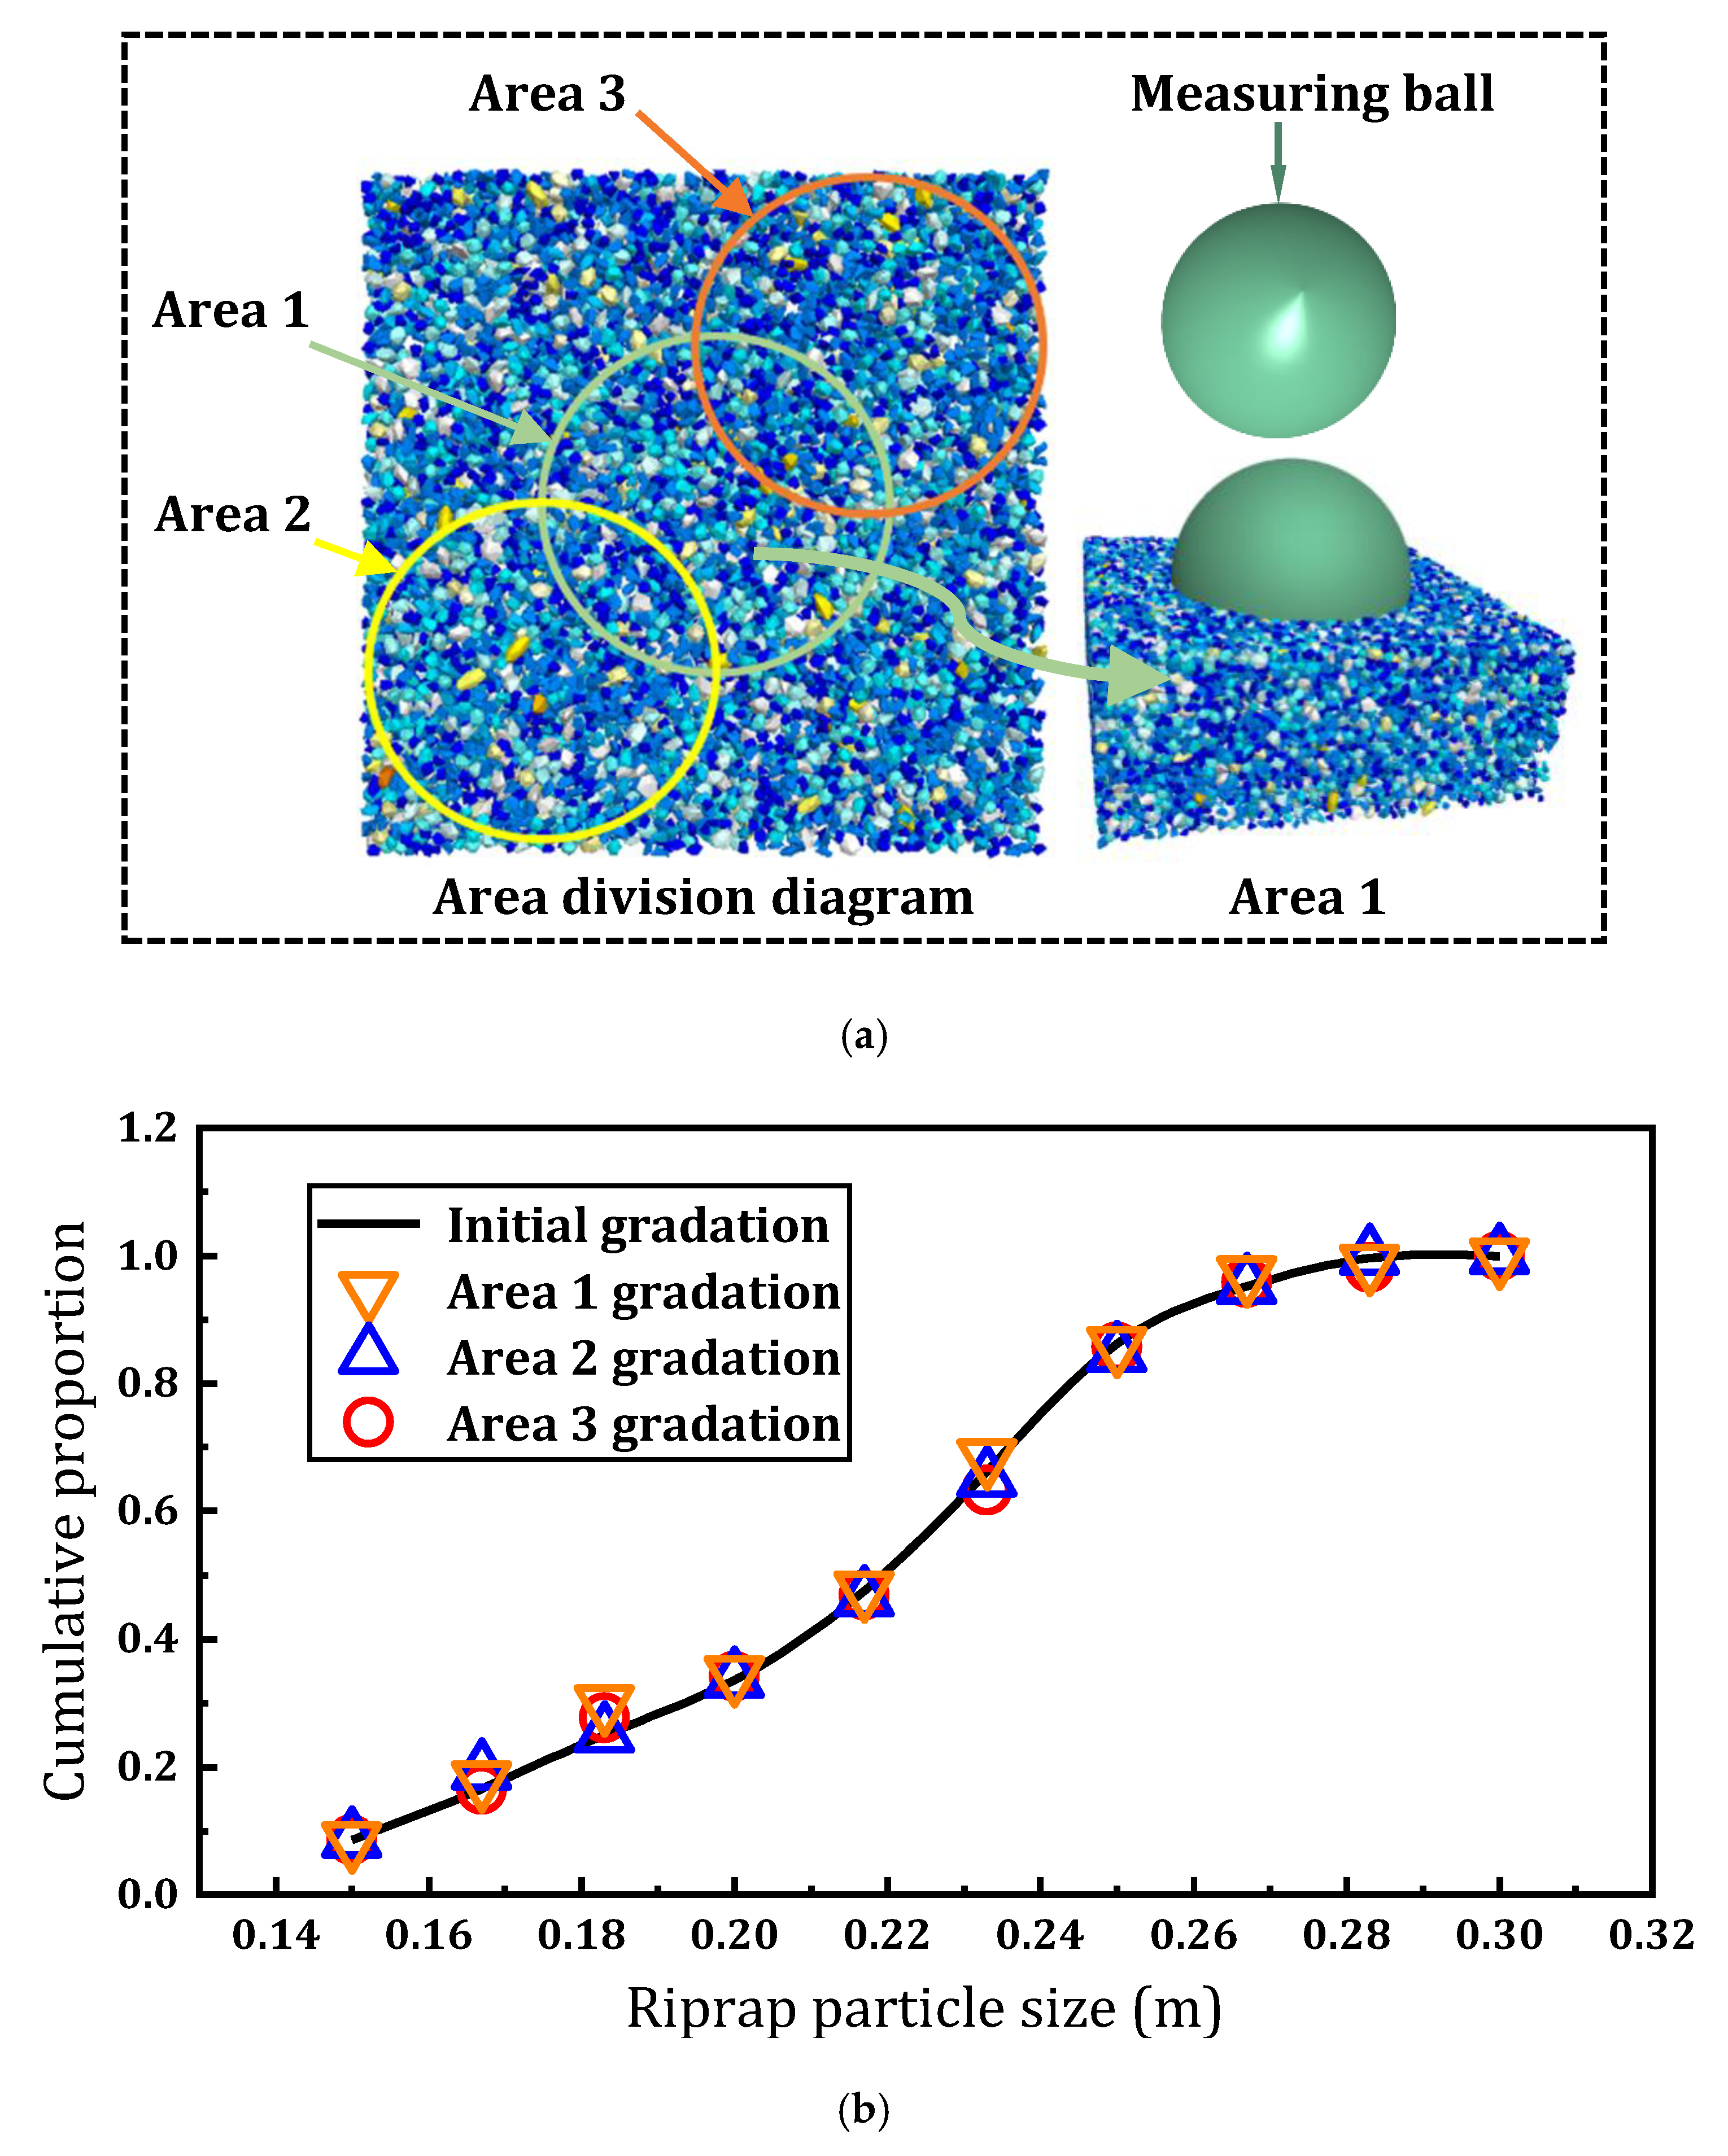
2.3. Discrete Element Model Construction

In the PFC software for discrete element numerical analysis, the use of Rigid block can decrease the contact surface of each unit and enhance operational speed when simulating riprap. Thus, a discrete element model of the rubble-mound foundation was created using the Rigid block. The 3D numerical model for the rubble-mound foundation had a size of 10 m × 10 m and a thickness of 1.8 m. In order to facilitate the implementation of 3D laser scanning technology and construction of numerical models, we chose to model only riprap with a particle size of 15~30 cm. When approximating riprap as a sphere, its mass can be expressed using Equation (1). Therefore, the riprap stone mass range fell into the range of 40~100 kg, with an average size of 15~30 cm.
ρ × 4 3 π r 3 = m
where ρ represents the density of the riprap, π represents the circumference ratio, r represents the radius of the sphere, and m represents the mass of the riprap.
The establishment process of this model is illustrated in Figure 3. As depicted in Figure 3, the boundary of the foundation was initially sketched out, followed by the random generation of riprap blocks based on particle gradation. In order to simulate the process of riprap stone throwing in the field test, the first riprap-stone layer, which is approximately 1/10 of the designed thickness of the rubble-mound foundation, was generated and placed on top of the boundary. The first layer was allowed to fall freely under the influence of gravity. After the first layer of riprap stones had fallen and accumulated to a certain height, the second layer was generated in the same position, using the same method, and was allowed to fall freely under the influence of gravity. This process was repeated until the rubble-mound foundation reached the desired thickness. The rubble-mound foundation should be allowed to undergo free accumulation and settlement due to gravity, which can stabilize the unbalanced force and allow it to reach a natural state.
Further validation is required to confirm the consistency between the particle gradation of the newly generated rubble-mound foundation with that from the field test, as the discrete element model was formed through the settlement and stabilization of the riprap layer after the free fall. To conduct particle gradation testing, three areas of the rubble-mound foundation were selected, as illustrated in Figure 4a. For instance, in Area 1, a measuring ball of a specific radius was generated to inspect the size of all the riprap stones within the sphere. The measuring ball counted the sizes of all the riprap stones inside the sphere. Subsequently, the particle gradation curve of the riprap stones within the measuring ball was determined based on the statistical data. The results of the particle gradation curve are presented in Figure 4b. The riprap particle size is represented on the X-coordinate, while the Y-coordinate displays the cumulative proportion of riprap content that is smaller than a certain particle size. Upon comparing the gradation curve of each area with the initial gradation, we concluded that the particle gradation of the rubble-mound foundation, formed by the settling and stabilization after the free fall, is consistent with the filed test result.

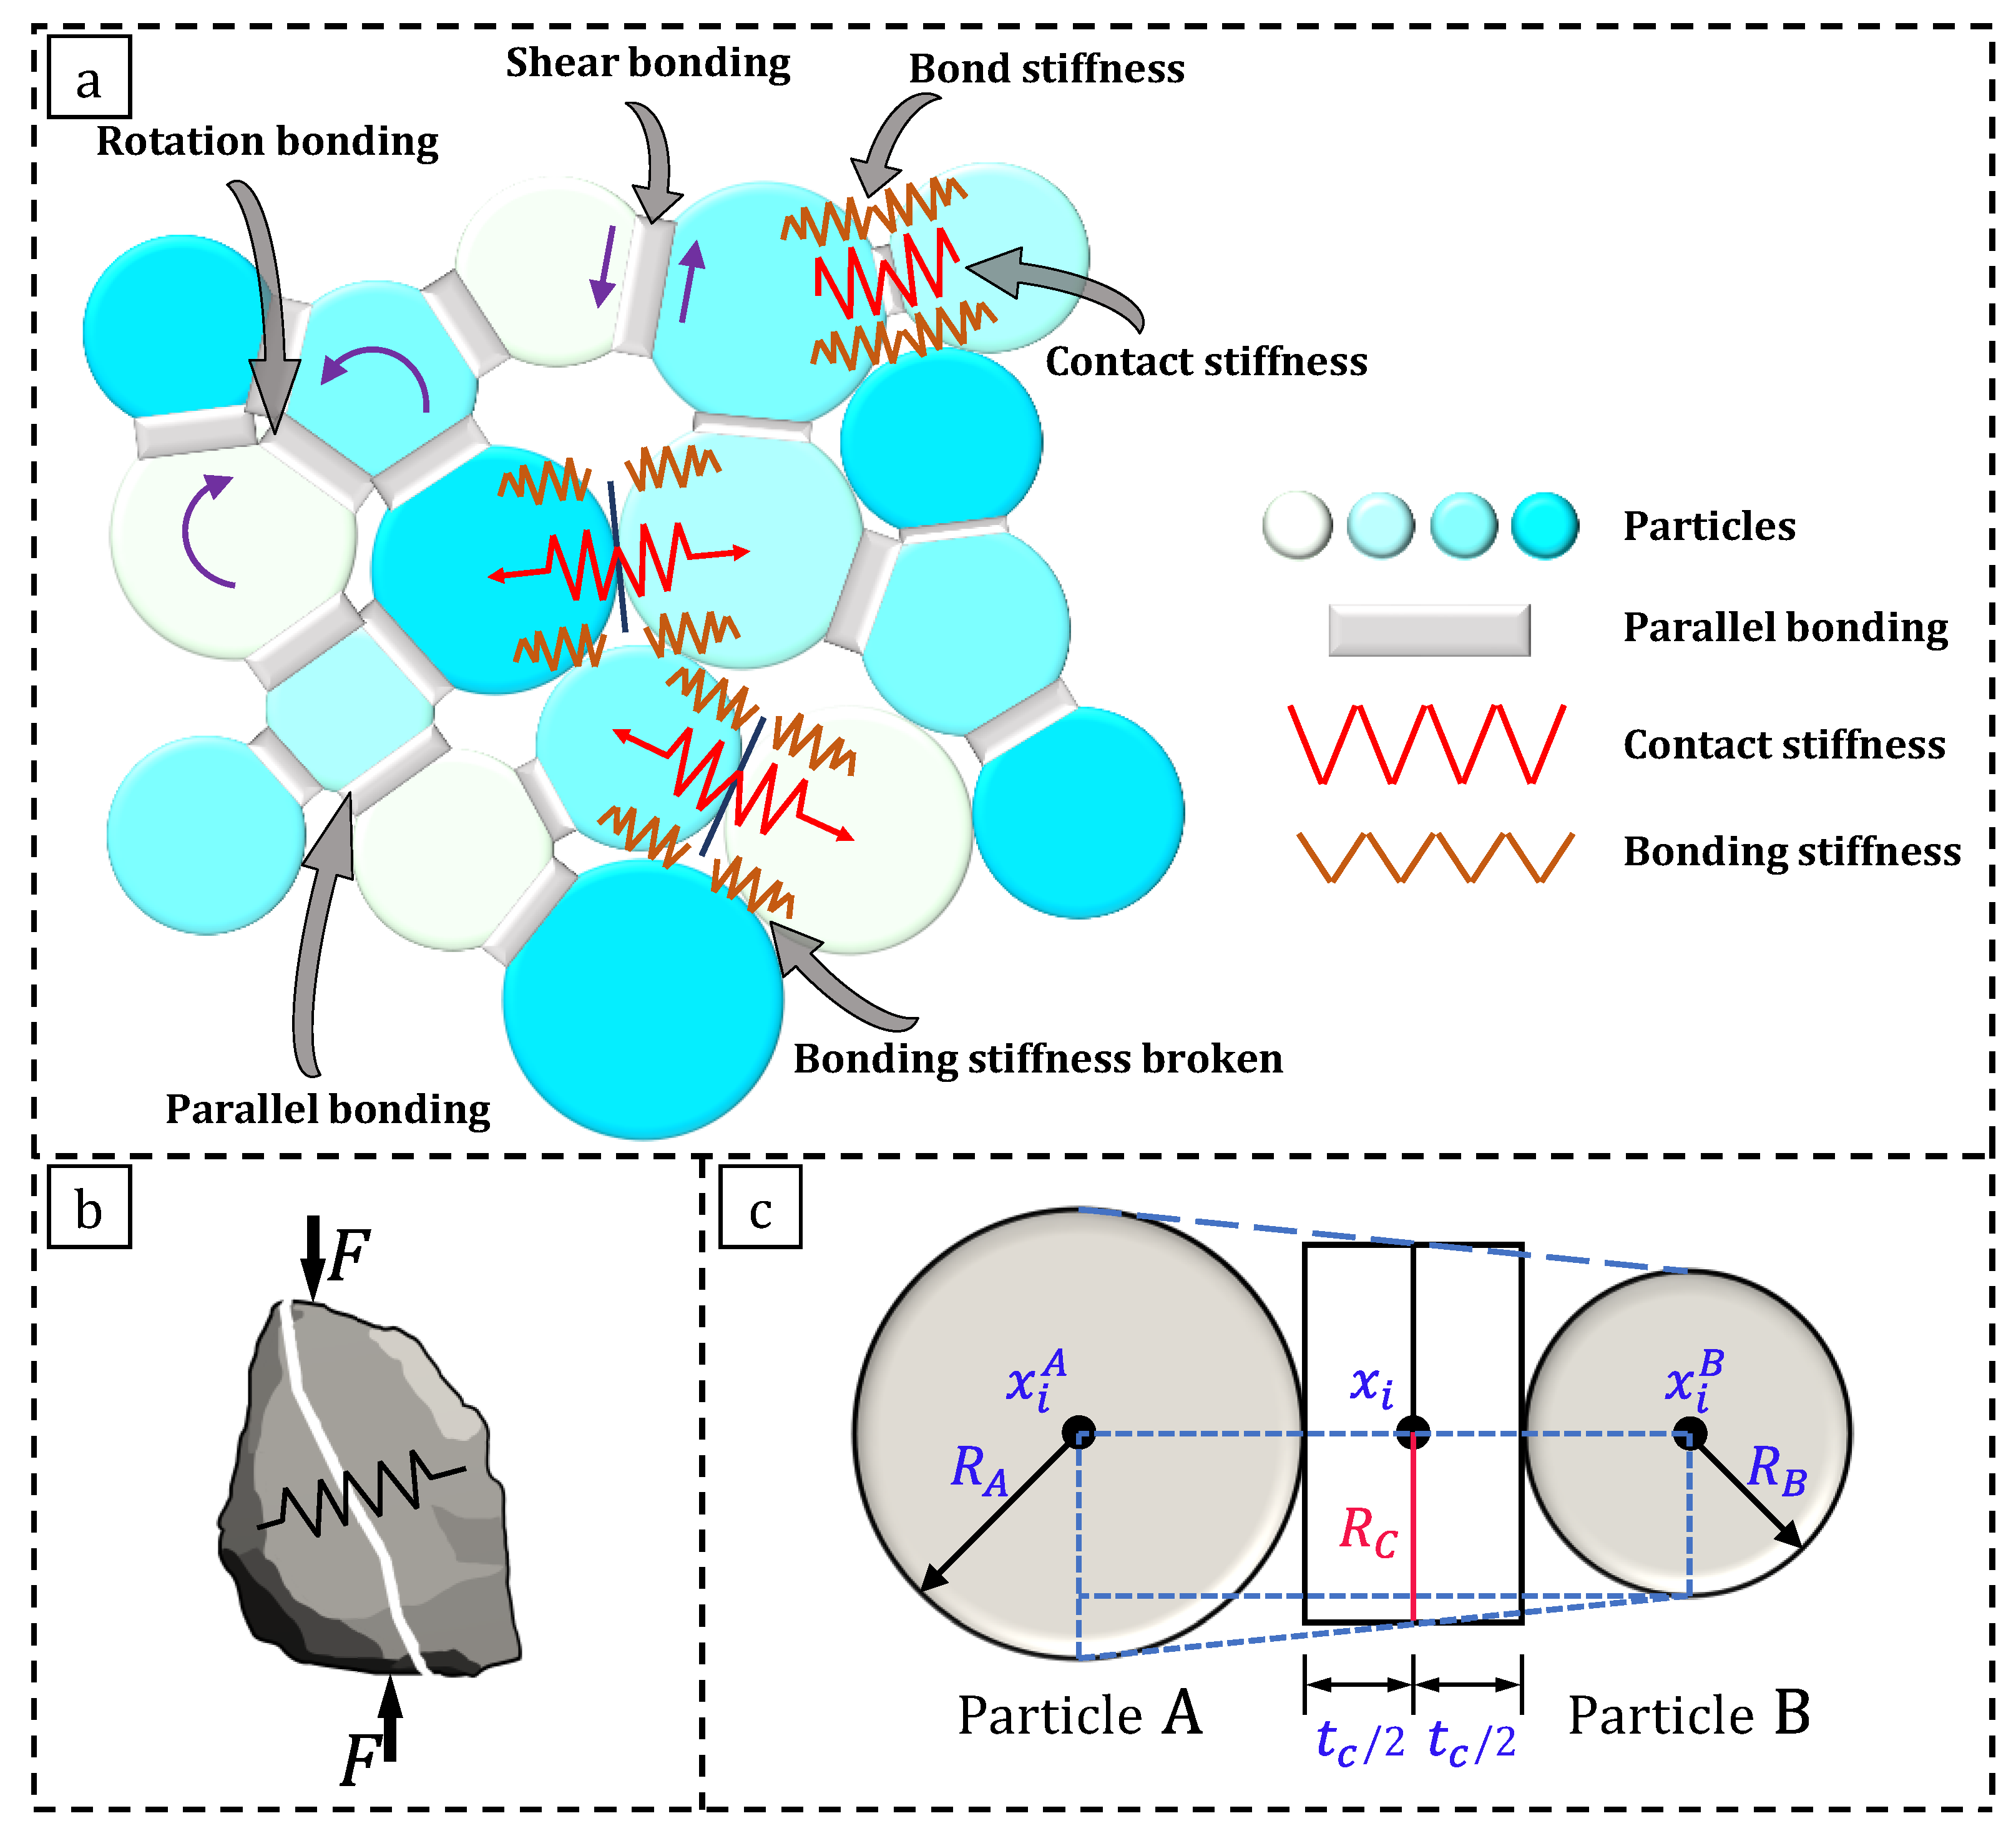
3. Riprap Microcosmic Simulation Theory

The discrete element model relies on mesoscopic parameters such as the geometric and mechanical properties of particles, as well as their contact form and mechanical parameters. In this study, a parallel bonding model was used to model riprap-stone contacts due to its suitability in simulating the characteristics of the rubble-mound foundation. According to Figure 5a, the parallel bonding between particles is evenly distributed at the contact surface. This allows force and moment transfers and also provides stiffness and the ability for deformation. This simulation method is more appropriate for modeling the mechanical properties of riprap stones, as the parallel bonding will break when the maximum stress in any direction exceeds the bonding strength.
The particle-flow theory enables cracks to form at the contact surface between particles, mimicking the weak structural surface of the real specimen. This creates the necessary conditions for the development and formation of cracks in the simulated rock mass, as illustrated in Figure 5b. Cracks in PFC occur only in a mode named contact bond and parallel. As a result, the bonding parameters of the particles in the initial sample affect the number and location of the crack formations, while the size and location of microcracks are determined by the size and location of the two particles that generate them. The bonding between particles can be represented by a cylindrical surface with its normal direction in the plane, as illustrated in Figure 5c. Assuming that Particles A and B are responsible for creating cracks, the thickness of the cylindrical surface can be expressed as follows:
t c = d R A + R B
where d is the distance between the two particles, and R A and R B are the radius of Particle A and Particle B , respectively.
The center point of the cylindrical surface can be expressed as follows:
x i = x i A + R A + t c / 2 n i
where x i A is the center point of Particle A, and n i is the normal direction from the center point ( x i A ) of Particle A to the center point ( x i B ) of Particle B .
The radius of the cylindrical surface is as follows:
R c = R B + R A R B R A + t c / 2 d
Ultimately, each microcrack is represented by the following parameters: thickness, t c ; radius, R c ; normal direction, n i ; and center point, x i .
The aforementioned theories provide an explanation for the mechanical properties of microcracks and their integration with the microcosmic mechanical behavior of rock mass. The calibration of microcosmic parameters of riprap stones was achieved through a biaxial test simulation. The microcosmic parameters of the riprap are presented in Table 2.

4. Results of Field Test and Numerical Simulation
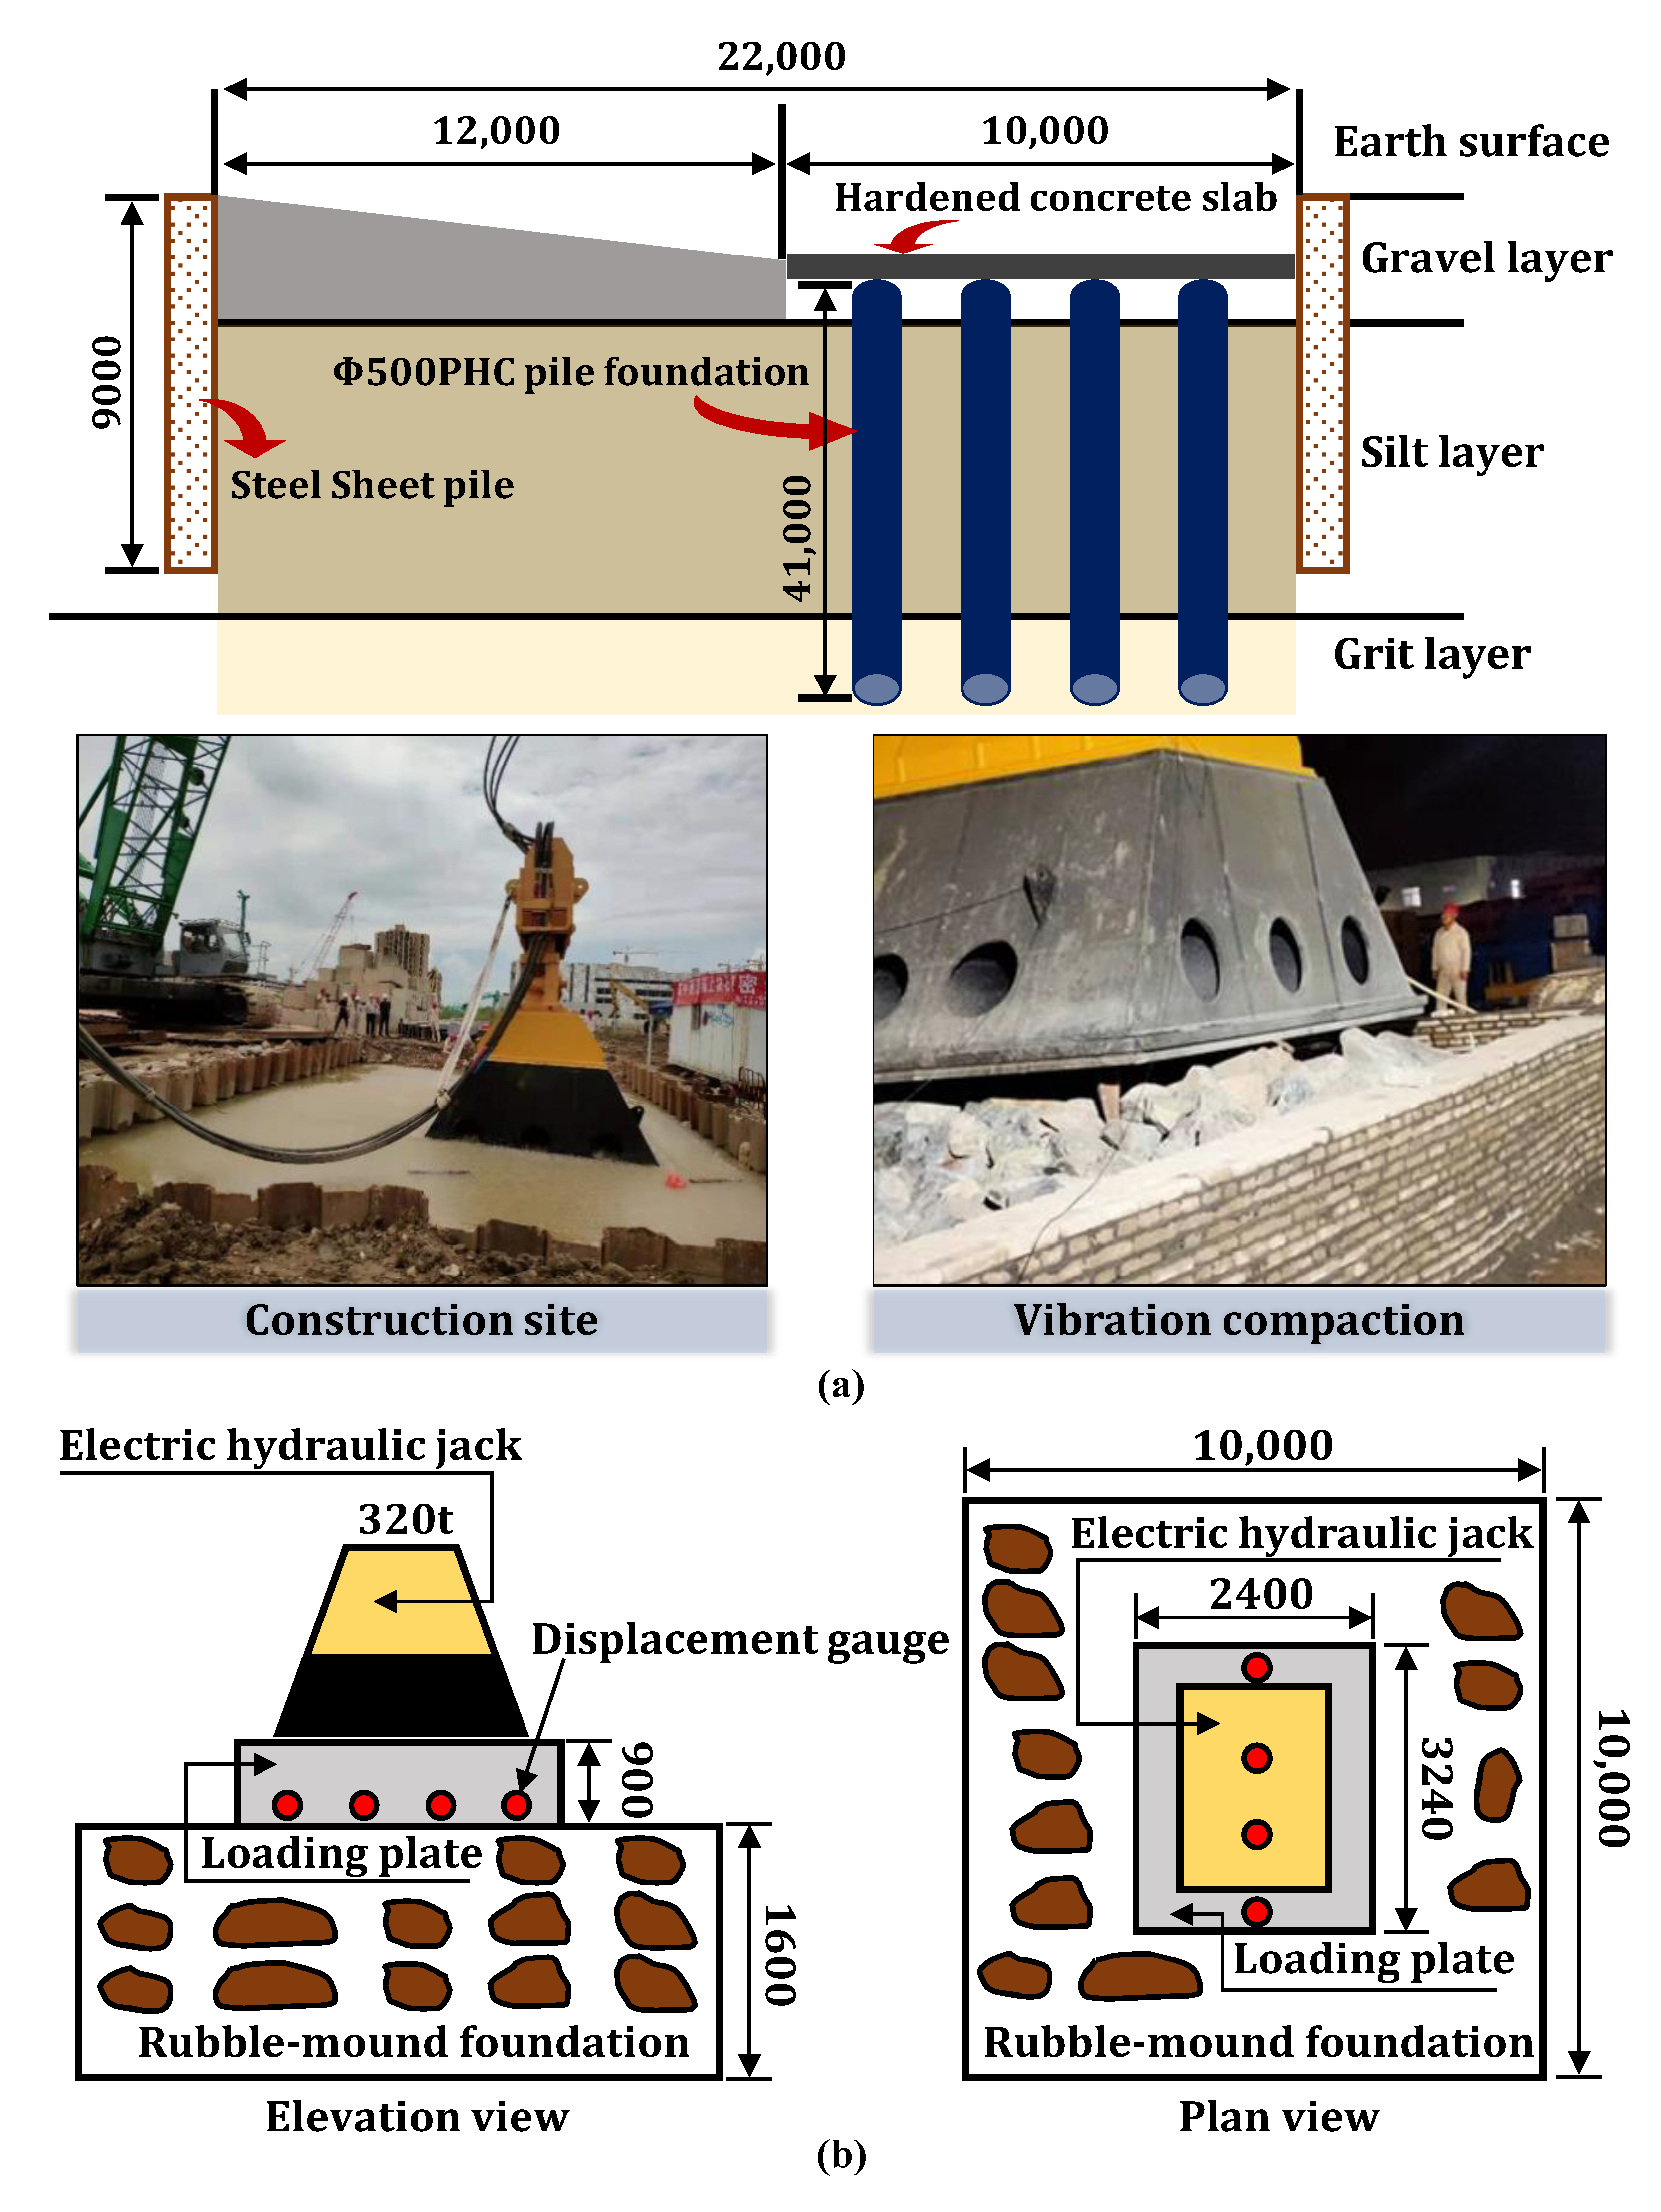
4.1. Field Test

Figure 6a displays the vibration compaction field test conducted on the rubble-mound foundation. To ensure the precision of the field test data on the natural foundation, the following measures were implemented.
A closed cofferdam environment for testing was created, and 9 m steel sheet piles were placed around the 10 m × 22 m test area.
To enhance the foundation’s bearing capacity, we opted for PHC piles due to the intricate composition of the soil layer at the test site, which includes layers of gravel, silt, and grit. Then, 41 m Ф 500 PHC piles were placed around the 10 m × 10 m vibration compaction test area. The bottom of the piles reached the grit layer.
The entrance to the foundation for the field test was excavated with a sloping technique. To make it easier for the test equipment to enter and exit, we excavated the gravel layer in the test area and reinforced it with concrete at the bottom.
In this study, the APE600 hydraulic vibratory hammer and a 4 m × 5 m tamping plate were utilized for conducting vibration compaction tests. The settlement of the tamping plate and the riprap layer after vibration compaction were monitored and recorded for analysis. The bearing capacity test of the rubble-mound foundation is shown in Figure 6b. To determine the ultimate bearing capacity of the rubble-mound foundation and observe its pressure and failure form, a 3.24 m × 2.4 m loading plate was placed on the upper part of the foundation. A 320 t electric hydraulic jack was then used to apply a continuous load until the foundation broke. The deformation of the foundation was measured by displacement gauges placed under the loading plate.

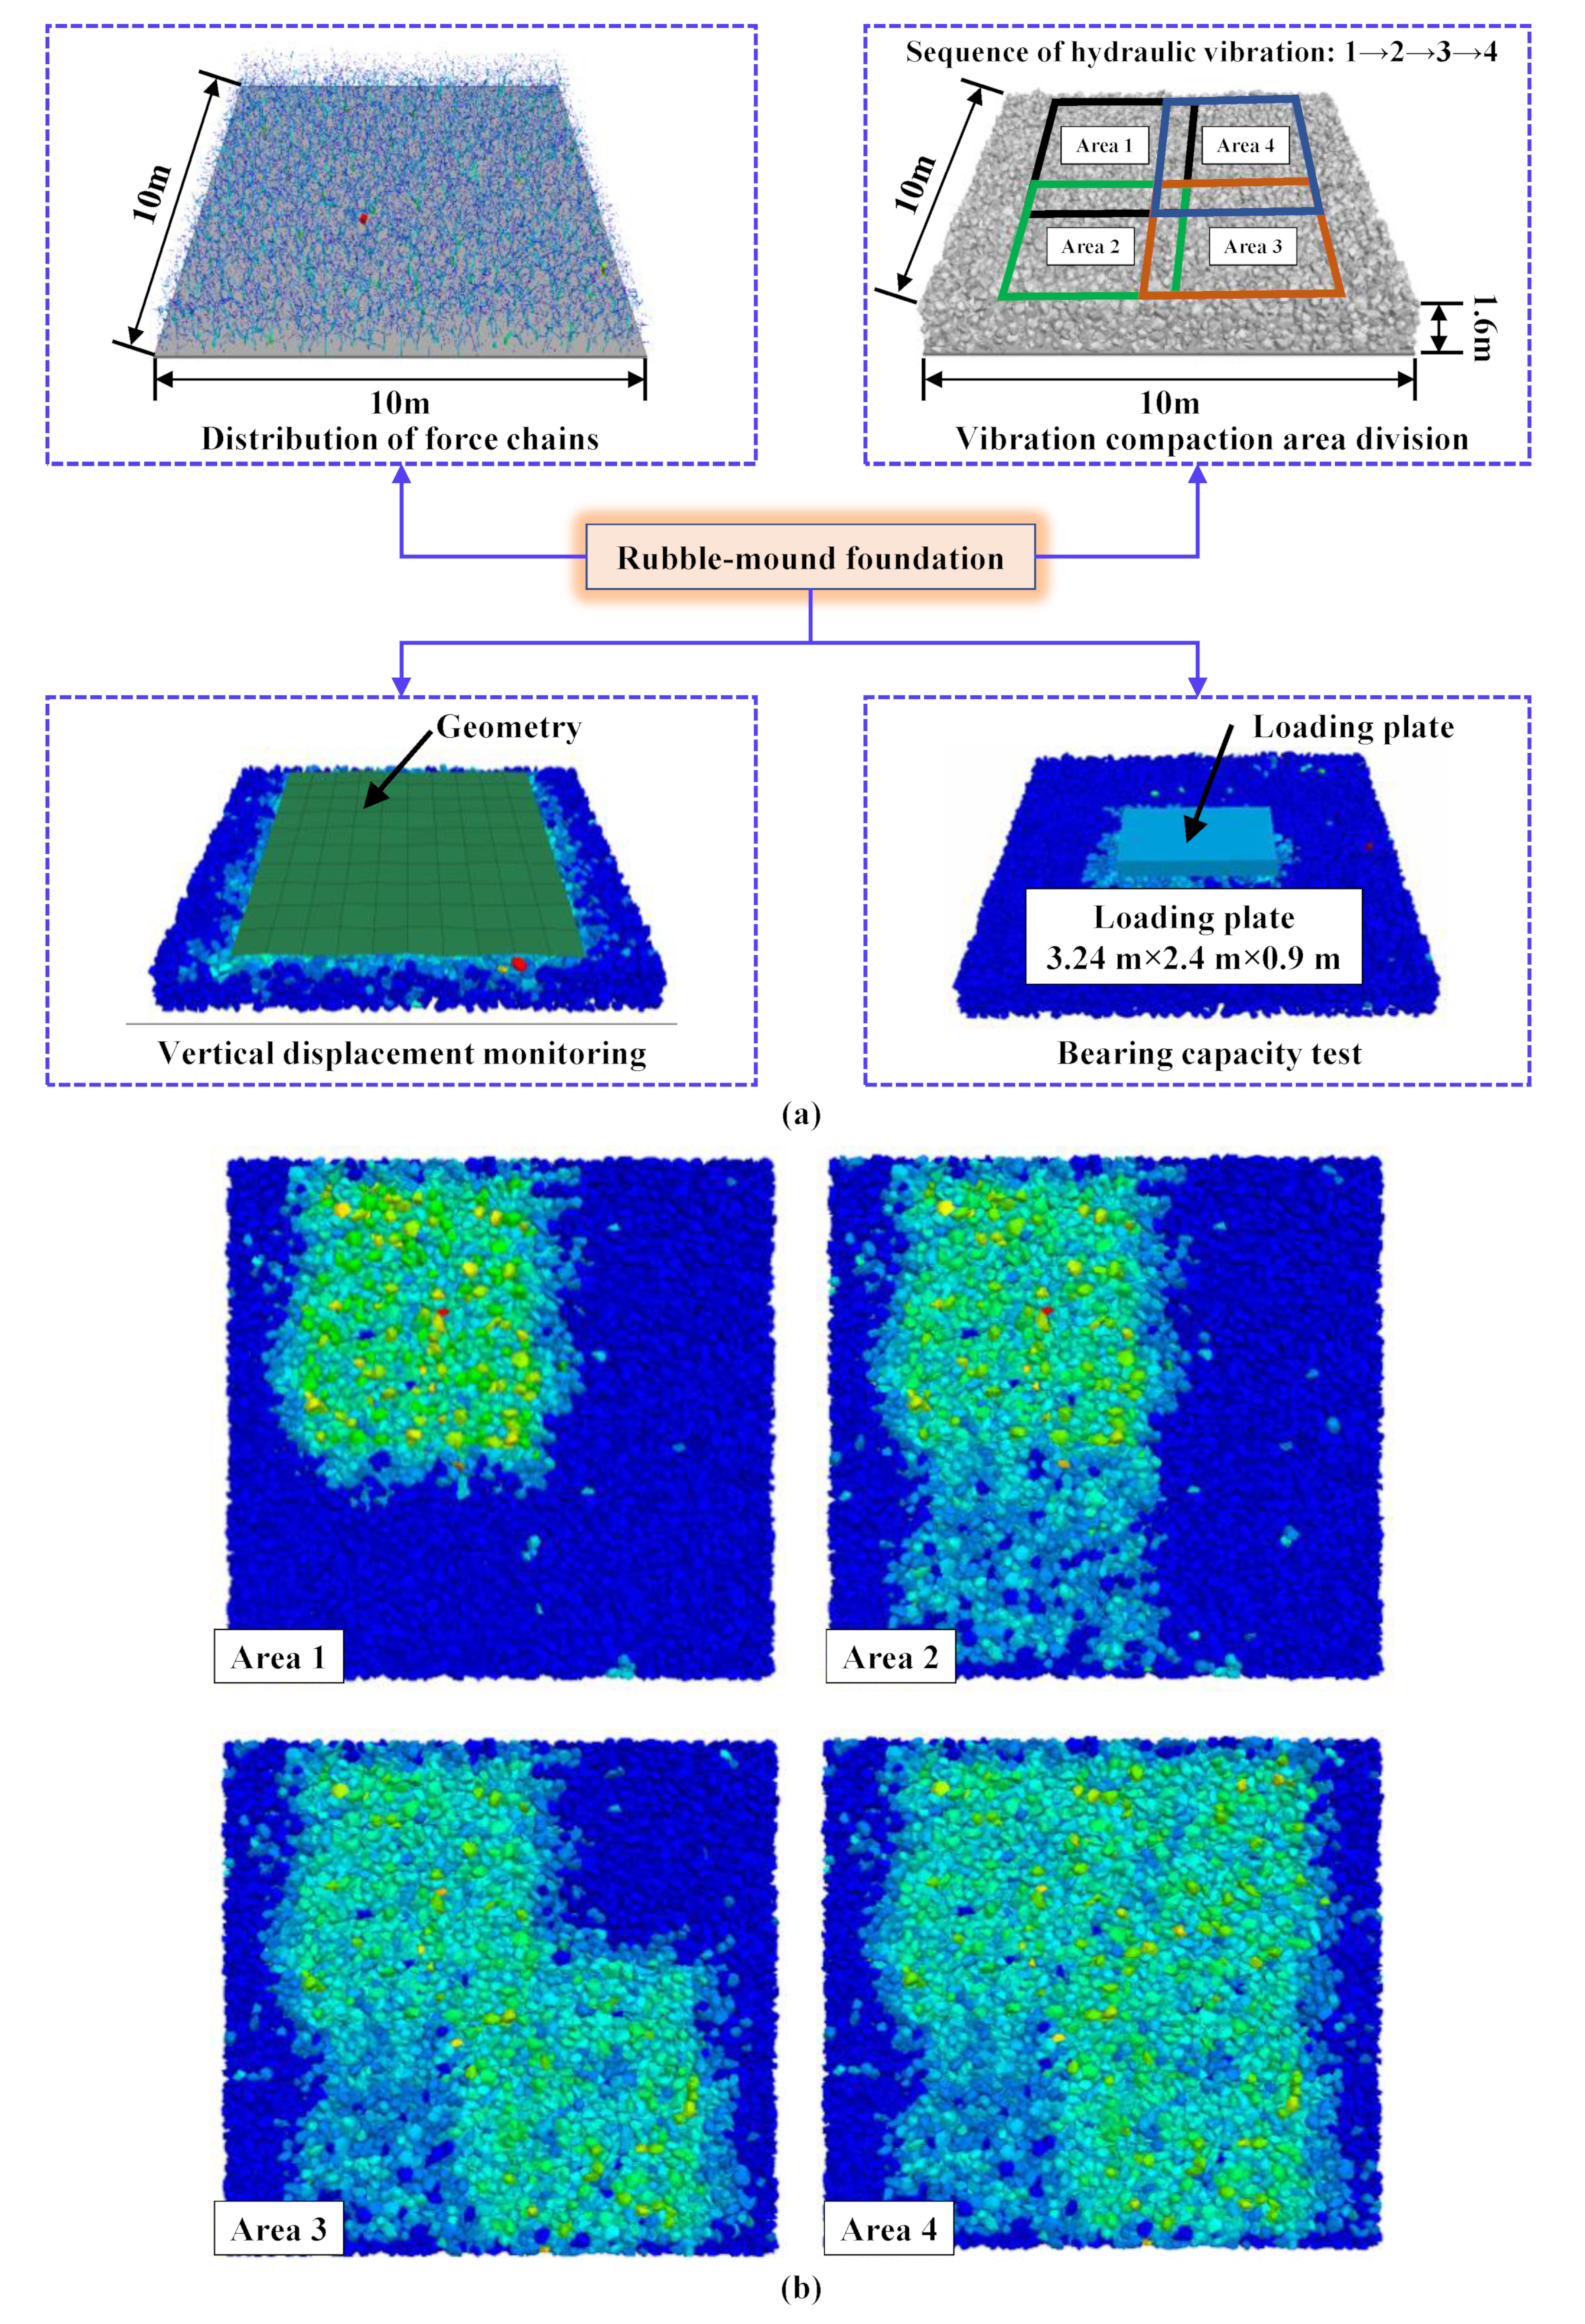
4.2. Numerical Simulation

PFC 3D software was adopted to simulate and analyze the changes in compactness and bearing capacity of the rubble-mound foundation under vibration compaction. Field tests were conducted in artificial cofferdams, with a concrete layer beneath the rubble-mound foundation. The numerical simulation simplified the boundary condition of the model to overall consolidation. The initiation of tamping was implemented after the model attained equilibrium by bearing its own weight. Figure 7a depicts the distribution of force chains, presenting a linear decrease in the vertical direction. In the horizontal direction, the force chain is uniformly distributed, which is consistent with the force chain distribution of the riprap under the influence of the gravity field. The numerical simulation model of the rubble-mound foundation had a thickness of 1.6 m and a square cross-section of 10 m. The model used riprap stones with a size range of 15~30 cm. During the vibration process, the displacement of the riprap was monitored, and the vibration compaction area division is shown in Figure 7a. The sequence of hydraulic vibration was 1→2→3→4, and the vibration compaction time of each area was 30 s. Figure 7b depicts a diagram illustrating the displacement of the rubble-mound foundation over time, specifically under the excitation stress of 160 kPa, with a vibration time of 30 s, at a frequency of 21 Hz.
Following the completion of vibration compaction, a bearing capacity test simulation was performed on the rubble-mound foundation. The simulation method, as depicted in Figure 7a, involved a Rigid block that was used in creating a loading plate with dimensions of 3.24 m × 2.4 m × 0.9 m. The loading plate was positioned at a designated location within the vibration compaction area and subjected to incremental loading at specific intervals. The purpose of the bearing capacity test was to observe the deformation of the rubble-mound foundation under different loads. This was achieved by monitoring the settlement of the test area during the step-by-step loading process and drawing the load–settlement curve of the rubble-mound foundation.
The ripraps were made of Rigid blocks. In order to obtain the settlement value of the rubble-mound foundation, only the vertical displacement at the top of the corresponding Rigid block was required, and there was no necessity to consider the rotation of the riprap during its movement. Fish code was used to generate a geometry area to scan the average height of the rubble-mound foundation top, and the final settlement value is the difference between the initial height of the foundation top and the average height. The geometry scan area is shown in Figure 7a.

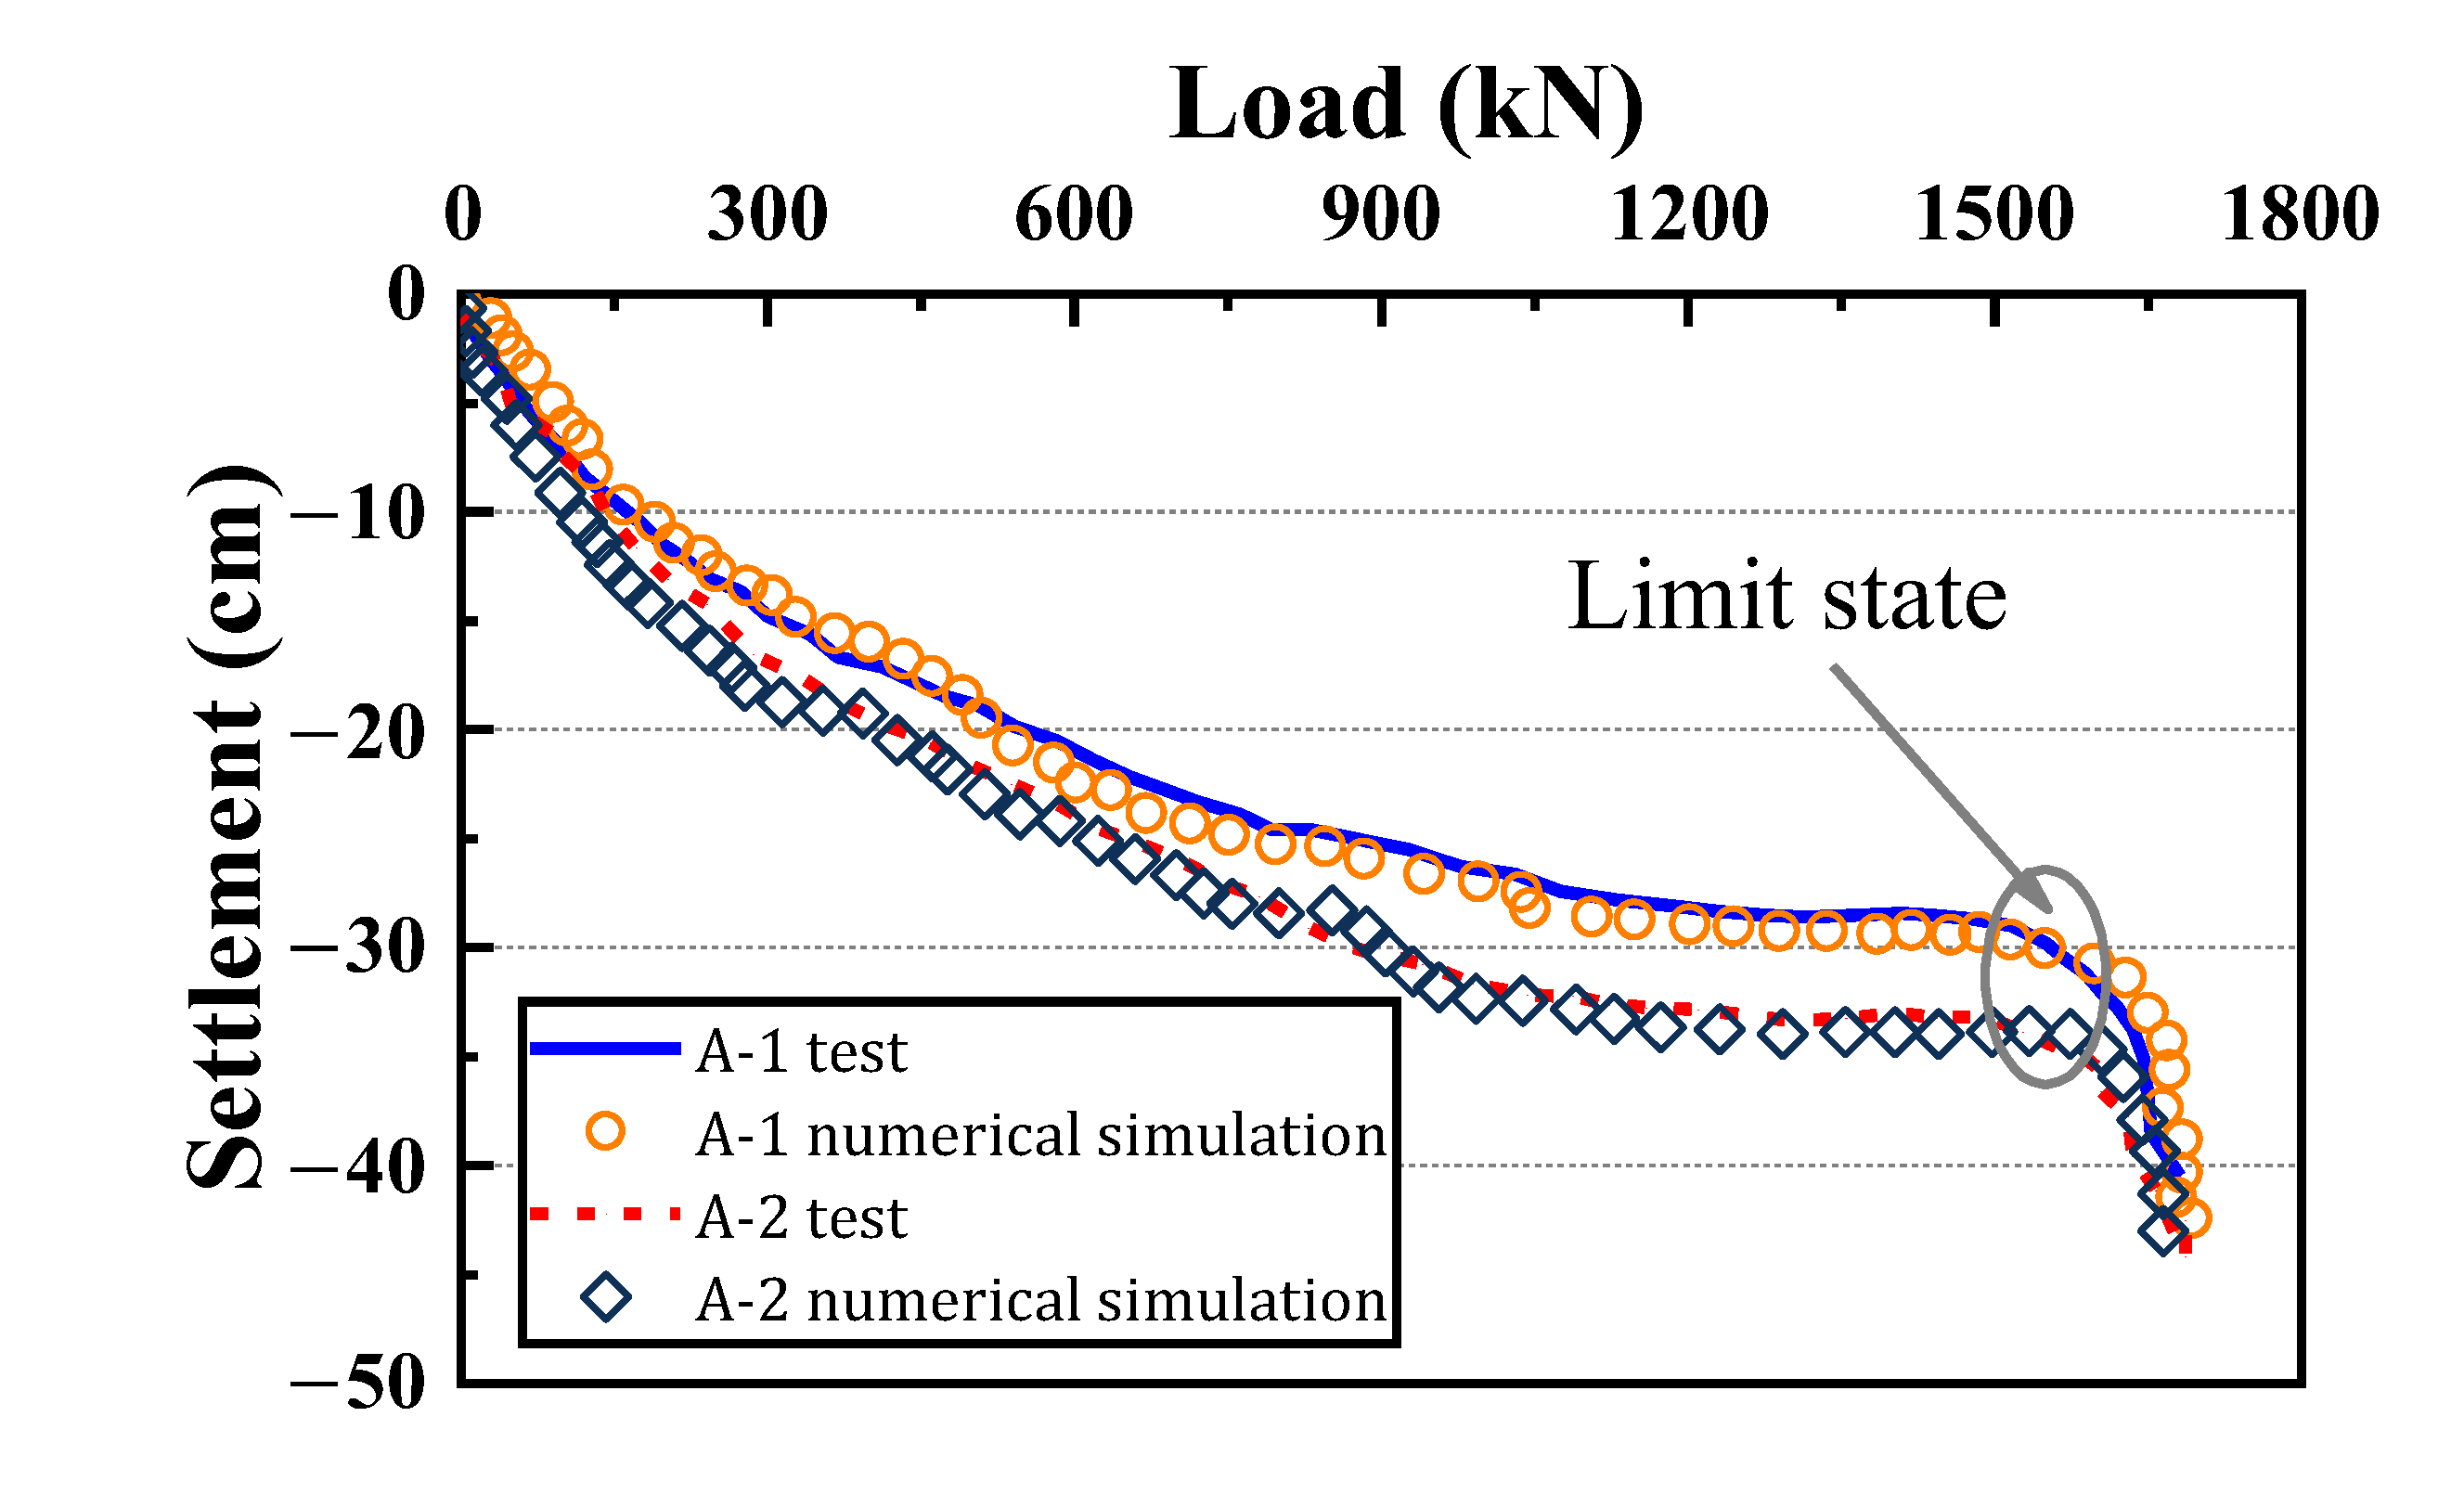
4.3. Comparison between Field Test and Simulation Results

Two sets of field test data and numerical simulation results are used for comparison, and the riprap parameter calibration and parameter rationality assessment are introduced in this section. Table 3 presents a comparison between the test and numerical simulation results with a vibration frequency of 21 Hz, a riprap stone size range of 15~30 cm, and a foundation thickness of 1.6 m. Table 3 indicates that when subjected to 60 s of vibration, the maximum settlements of the A-1 test group and A-1 simulation group were −29.44 cm and −30.57 cm, respectively. The ratio of the maximum settlement value to the foundation’s initial thickness is defined as the vibration compactness rate. The vibration compactness rates of the A-1 test group and A-1 simulation group were very close. When the vibration time was increased to 75 s, the maximum settlement of the A-2 test group was −34.52 cm, while the maximum settlement of the A-2 simulation group was −35.12 cm, showing a tiny difference of 0.37% in vibration compactness rate. These results suggest that the numerical simulation method used in the study is reliable and accurate.
For the bearing capacity test, the comparison of the load–settlement curves from the test and numerical simulation is shown in Figure 8. The figure illustrates that the settlement first increases proportionally with the load at a relatively fast rate during the initial loading stage and then slows down its growth when the load on the rubble-mound foundation reaches 300 kN. Afterwards, as the load continues to increase, the settlement of the foundation only increases slowly and becomes nearly constant when the load approaches 1000 kN. After this point, though the settlement value increases sharply, the load value remains unchanged, indicating that the rubble-mound foundation has reached its failure state. The load–settlement curve obtained from the numerical simulation is consistent with the field test results under different vibration compaction times. This further validates the correctness of the numerical simulation parameters. The ultimate bearing capacity of the rubble-mound foundation can be determined based on the load–settlement curve.

5. Influencing Factors of Bearing Characteristics

Due to many limitations, it is not feasible to study the influence of various factors on the bearing characteristics of the rubble-mound foundation by using the field test method. As a result, this section conducts a series of sensitivity analyses of parameters that influence the bearing characteristics of the rubble-mound foundation, using numerical simulations.

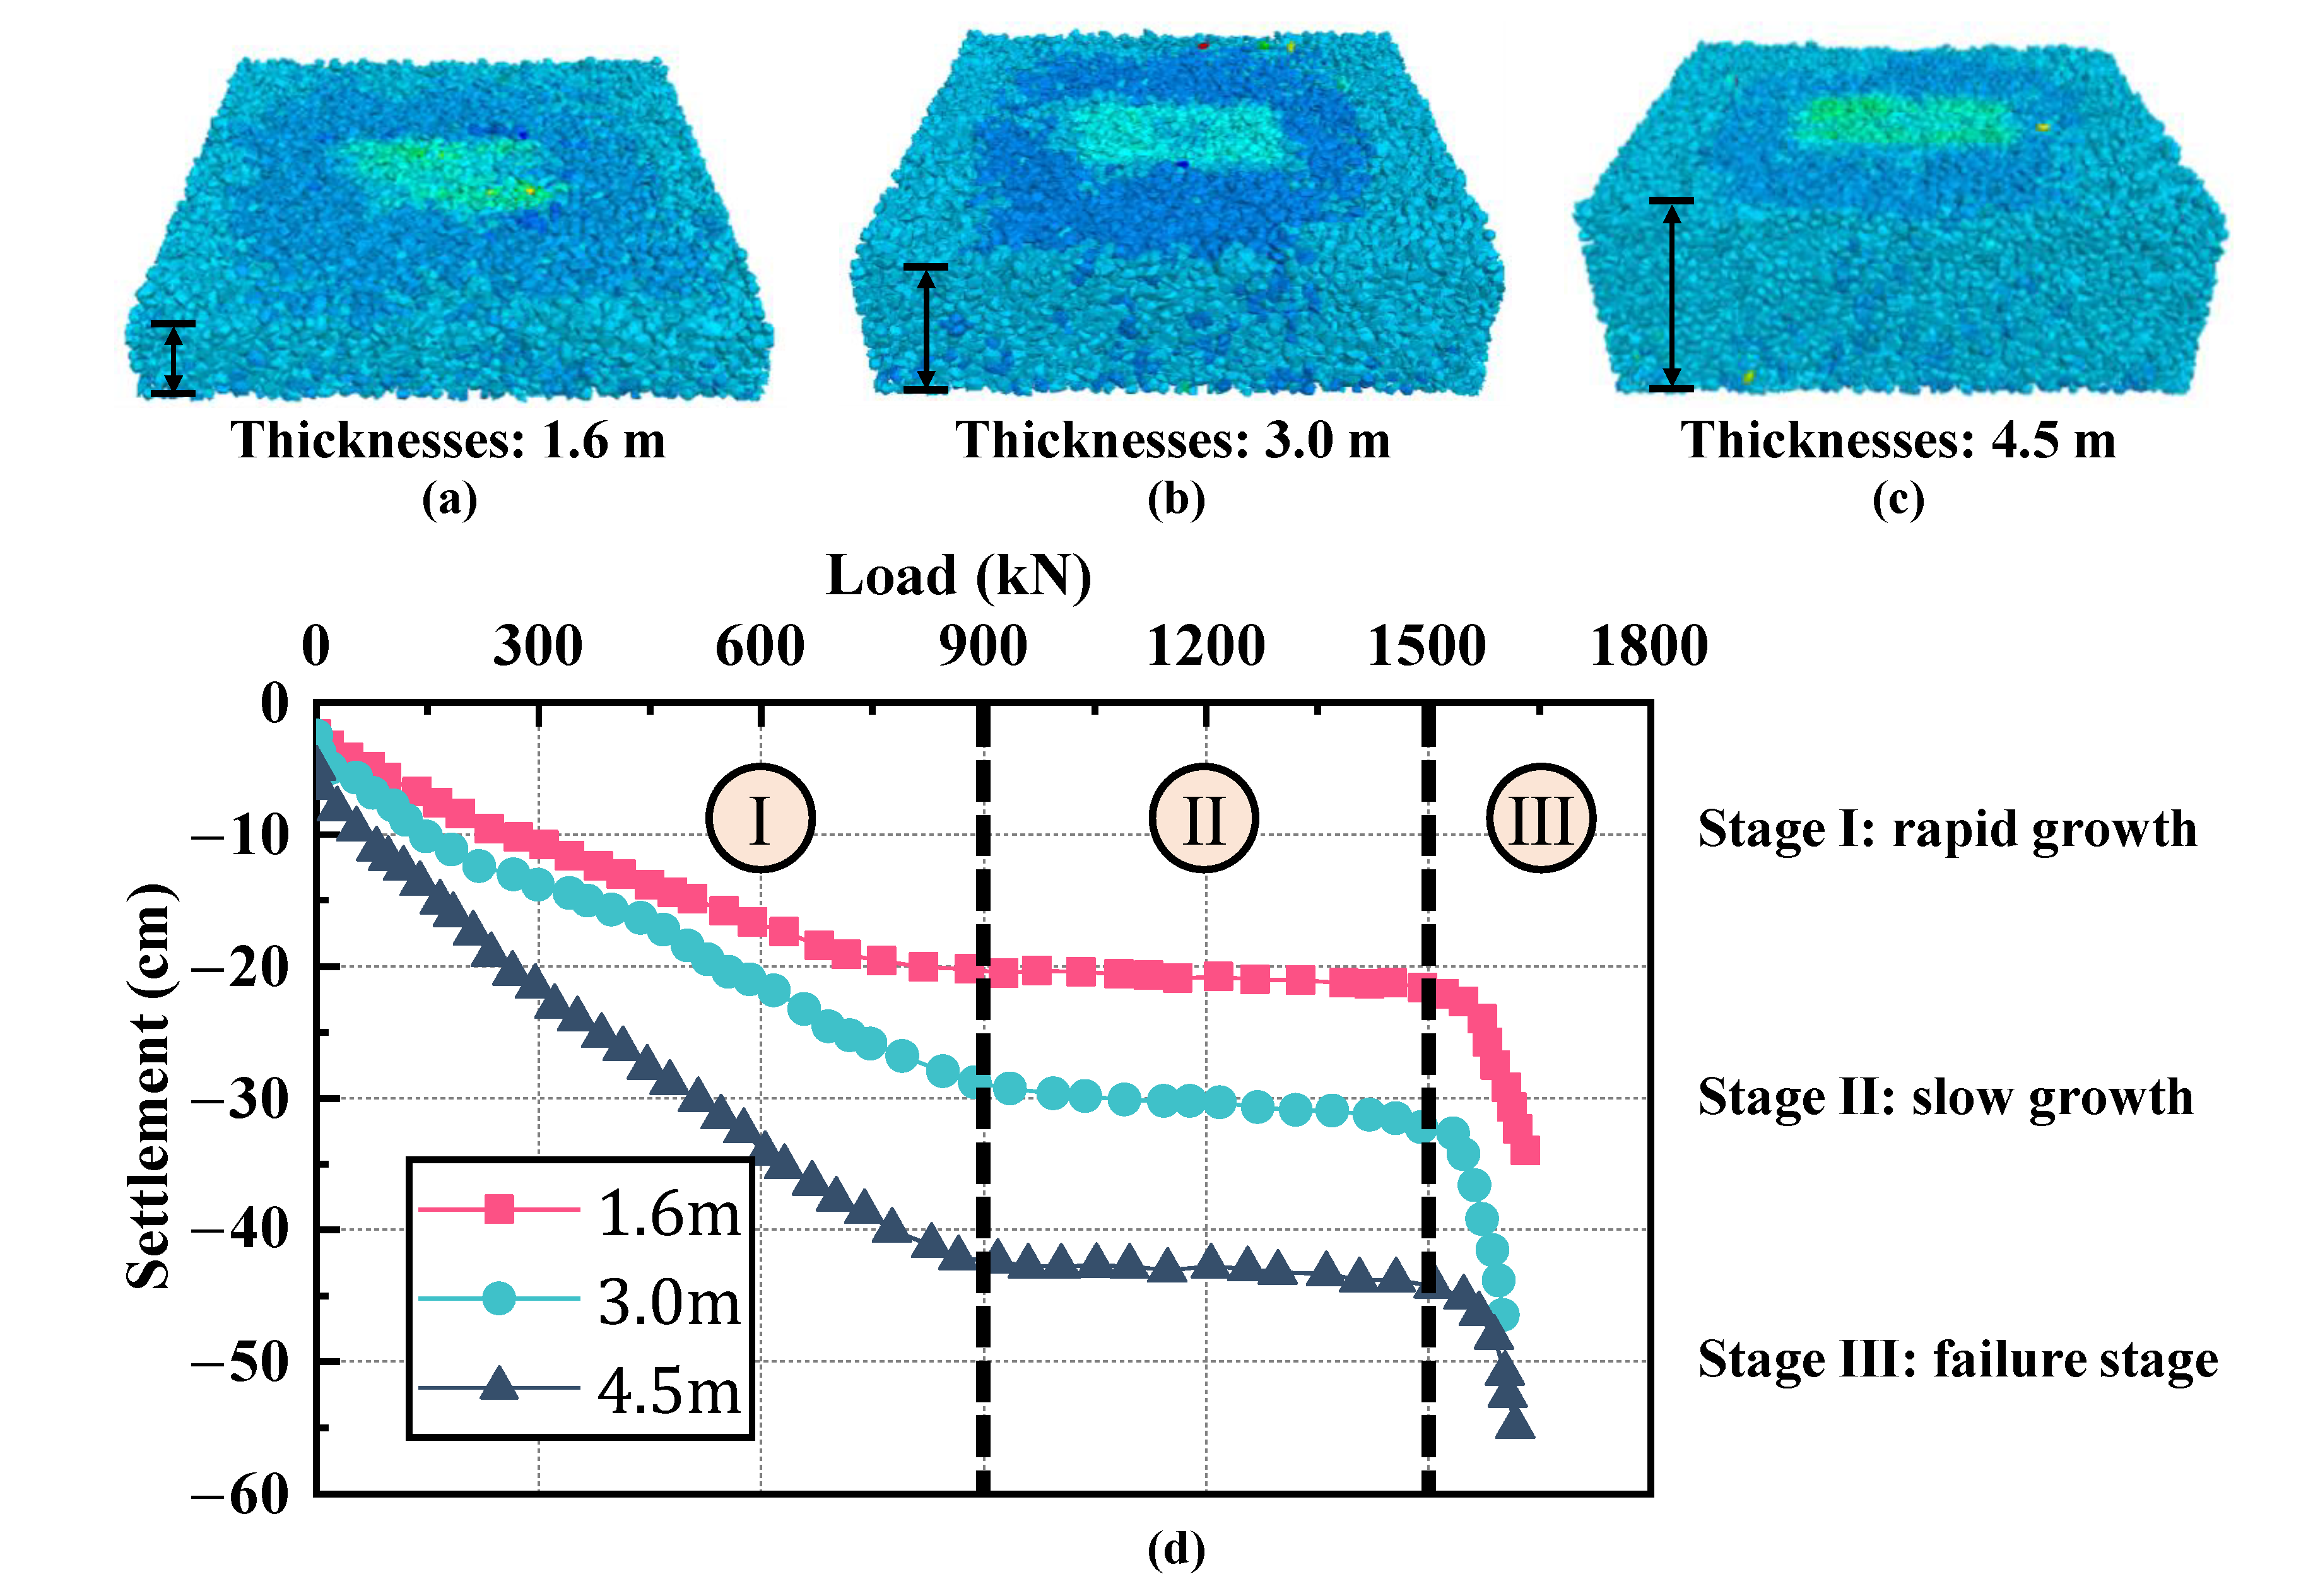
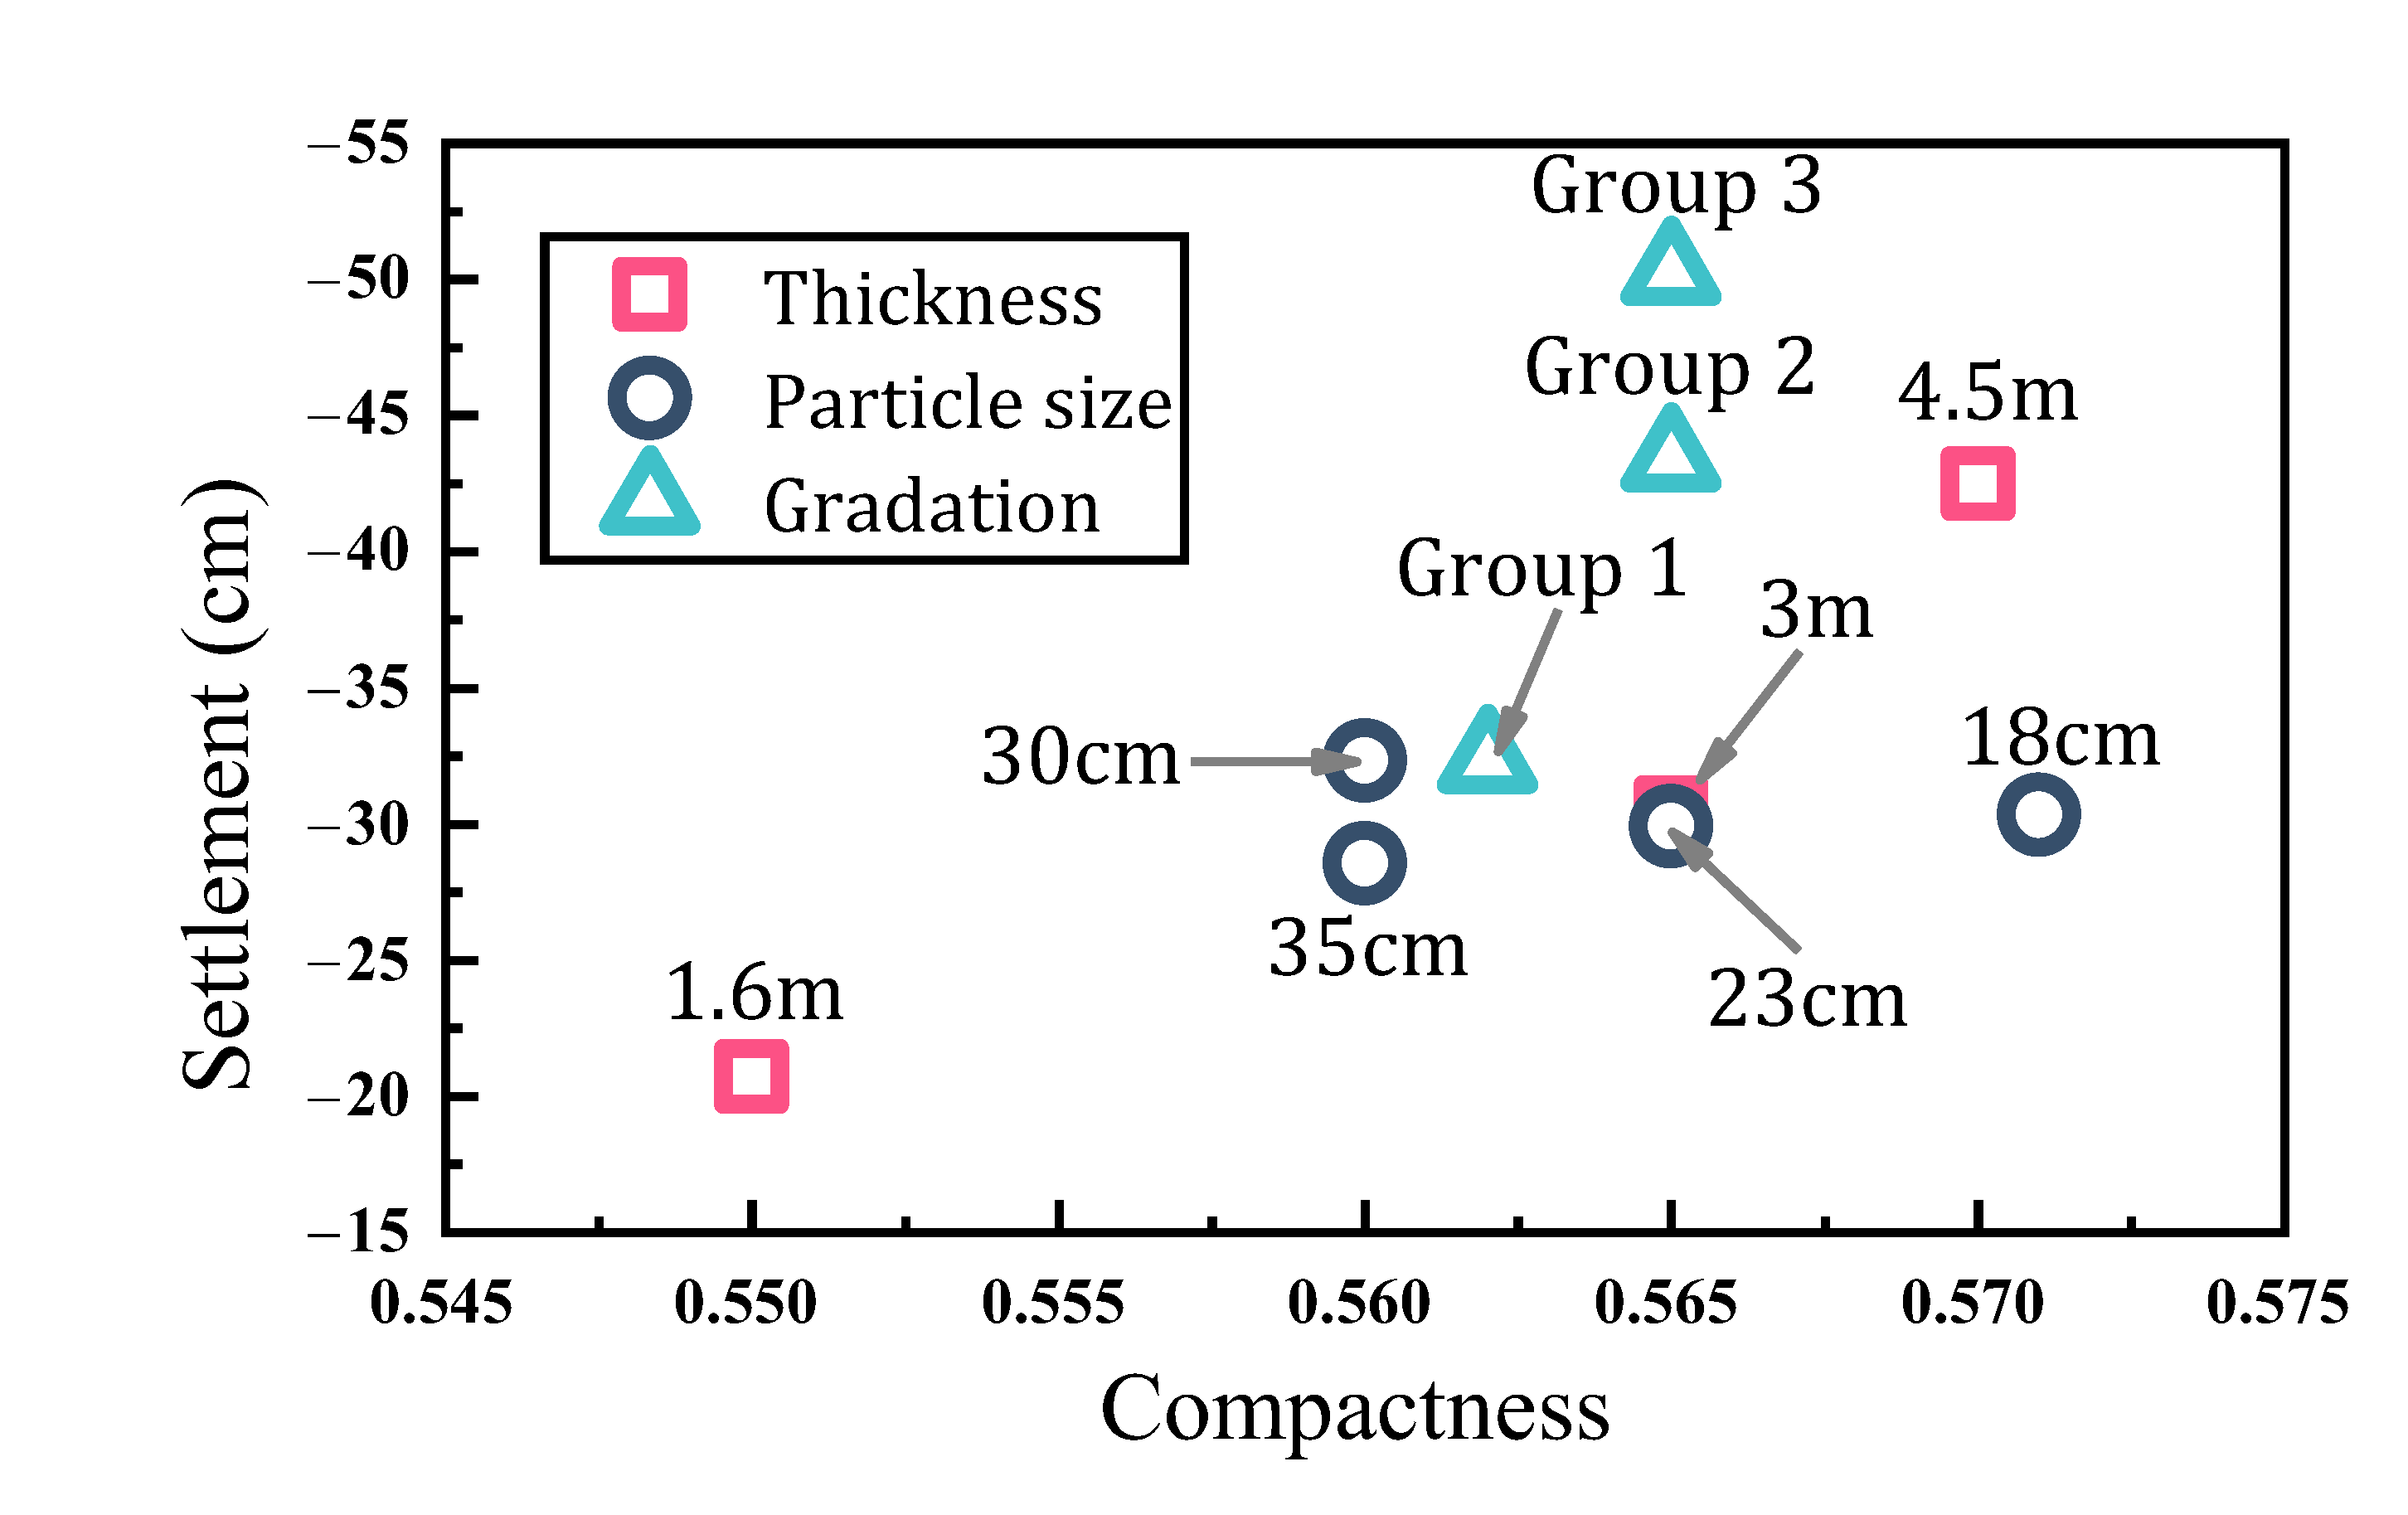
5.1. Foundation Thickness

During the high-frequency vibration compaction process, the thickness of the rubble-mound foundation can vary. Therefore, it is important to analyze how the thickness of the rubble-mound foundation affects its bearing characteristics. The numerical simulation scheme for the foundation thickness sensitivity analysis is as follows. The vibration frequency remained at 21 Hz; the vibration time was fixed at 60 s; the riprap stone sizes were in the range of 15~30 cm; and the foundation thickness varied between 1.6 m, 3.0 m, and 4.5 m. Figure 9a–c present the displacement diagrams of the rubble-mound foundations with the three different thicknesses, under the static load, and the load–settlement curves of rubble-mound foundations with the three different thicknesses are illustrated in Figure 9d. From the figures, we can see that the initial settlement first increases rapidly as the load increases and then becomes stable after the load reaches 900 kN. When further increasing the load to approximately 1550 kN, the settlement value starts increasing rapidly, which, in turn, halts the growth of the load. This indicates that the rubble-mound foundation reaches its ultimate bearing capacity at a load of 1550 kN. The compactness of the rubble-mound foundation increases as the thickness increases, leading to a significant increase in the settlement value. At a load of 900 kN, all foundations reached the stable stage, but the settlement values of the 1.6 m and 4.5 m foundations were −20 cm and −42 cm, respectively, showing an increase of more than double. The gravity of the foundation itself increased with the increasing thickness of the foundation, resulting in changes in its initial compactness. Therefore, increasing the thickness of the foundation will increase its bearing capacity.

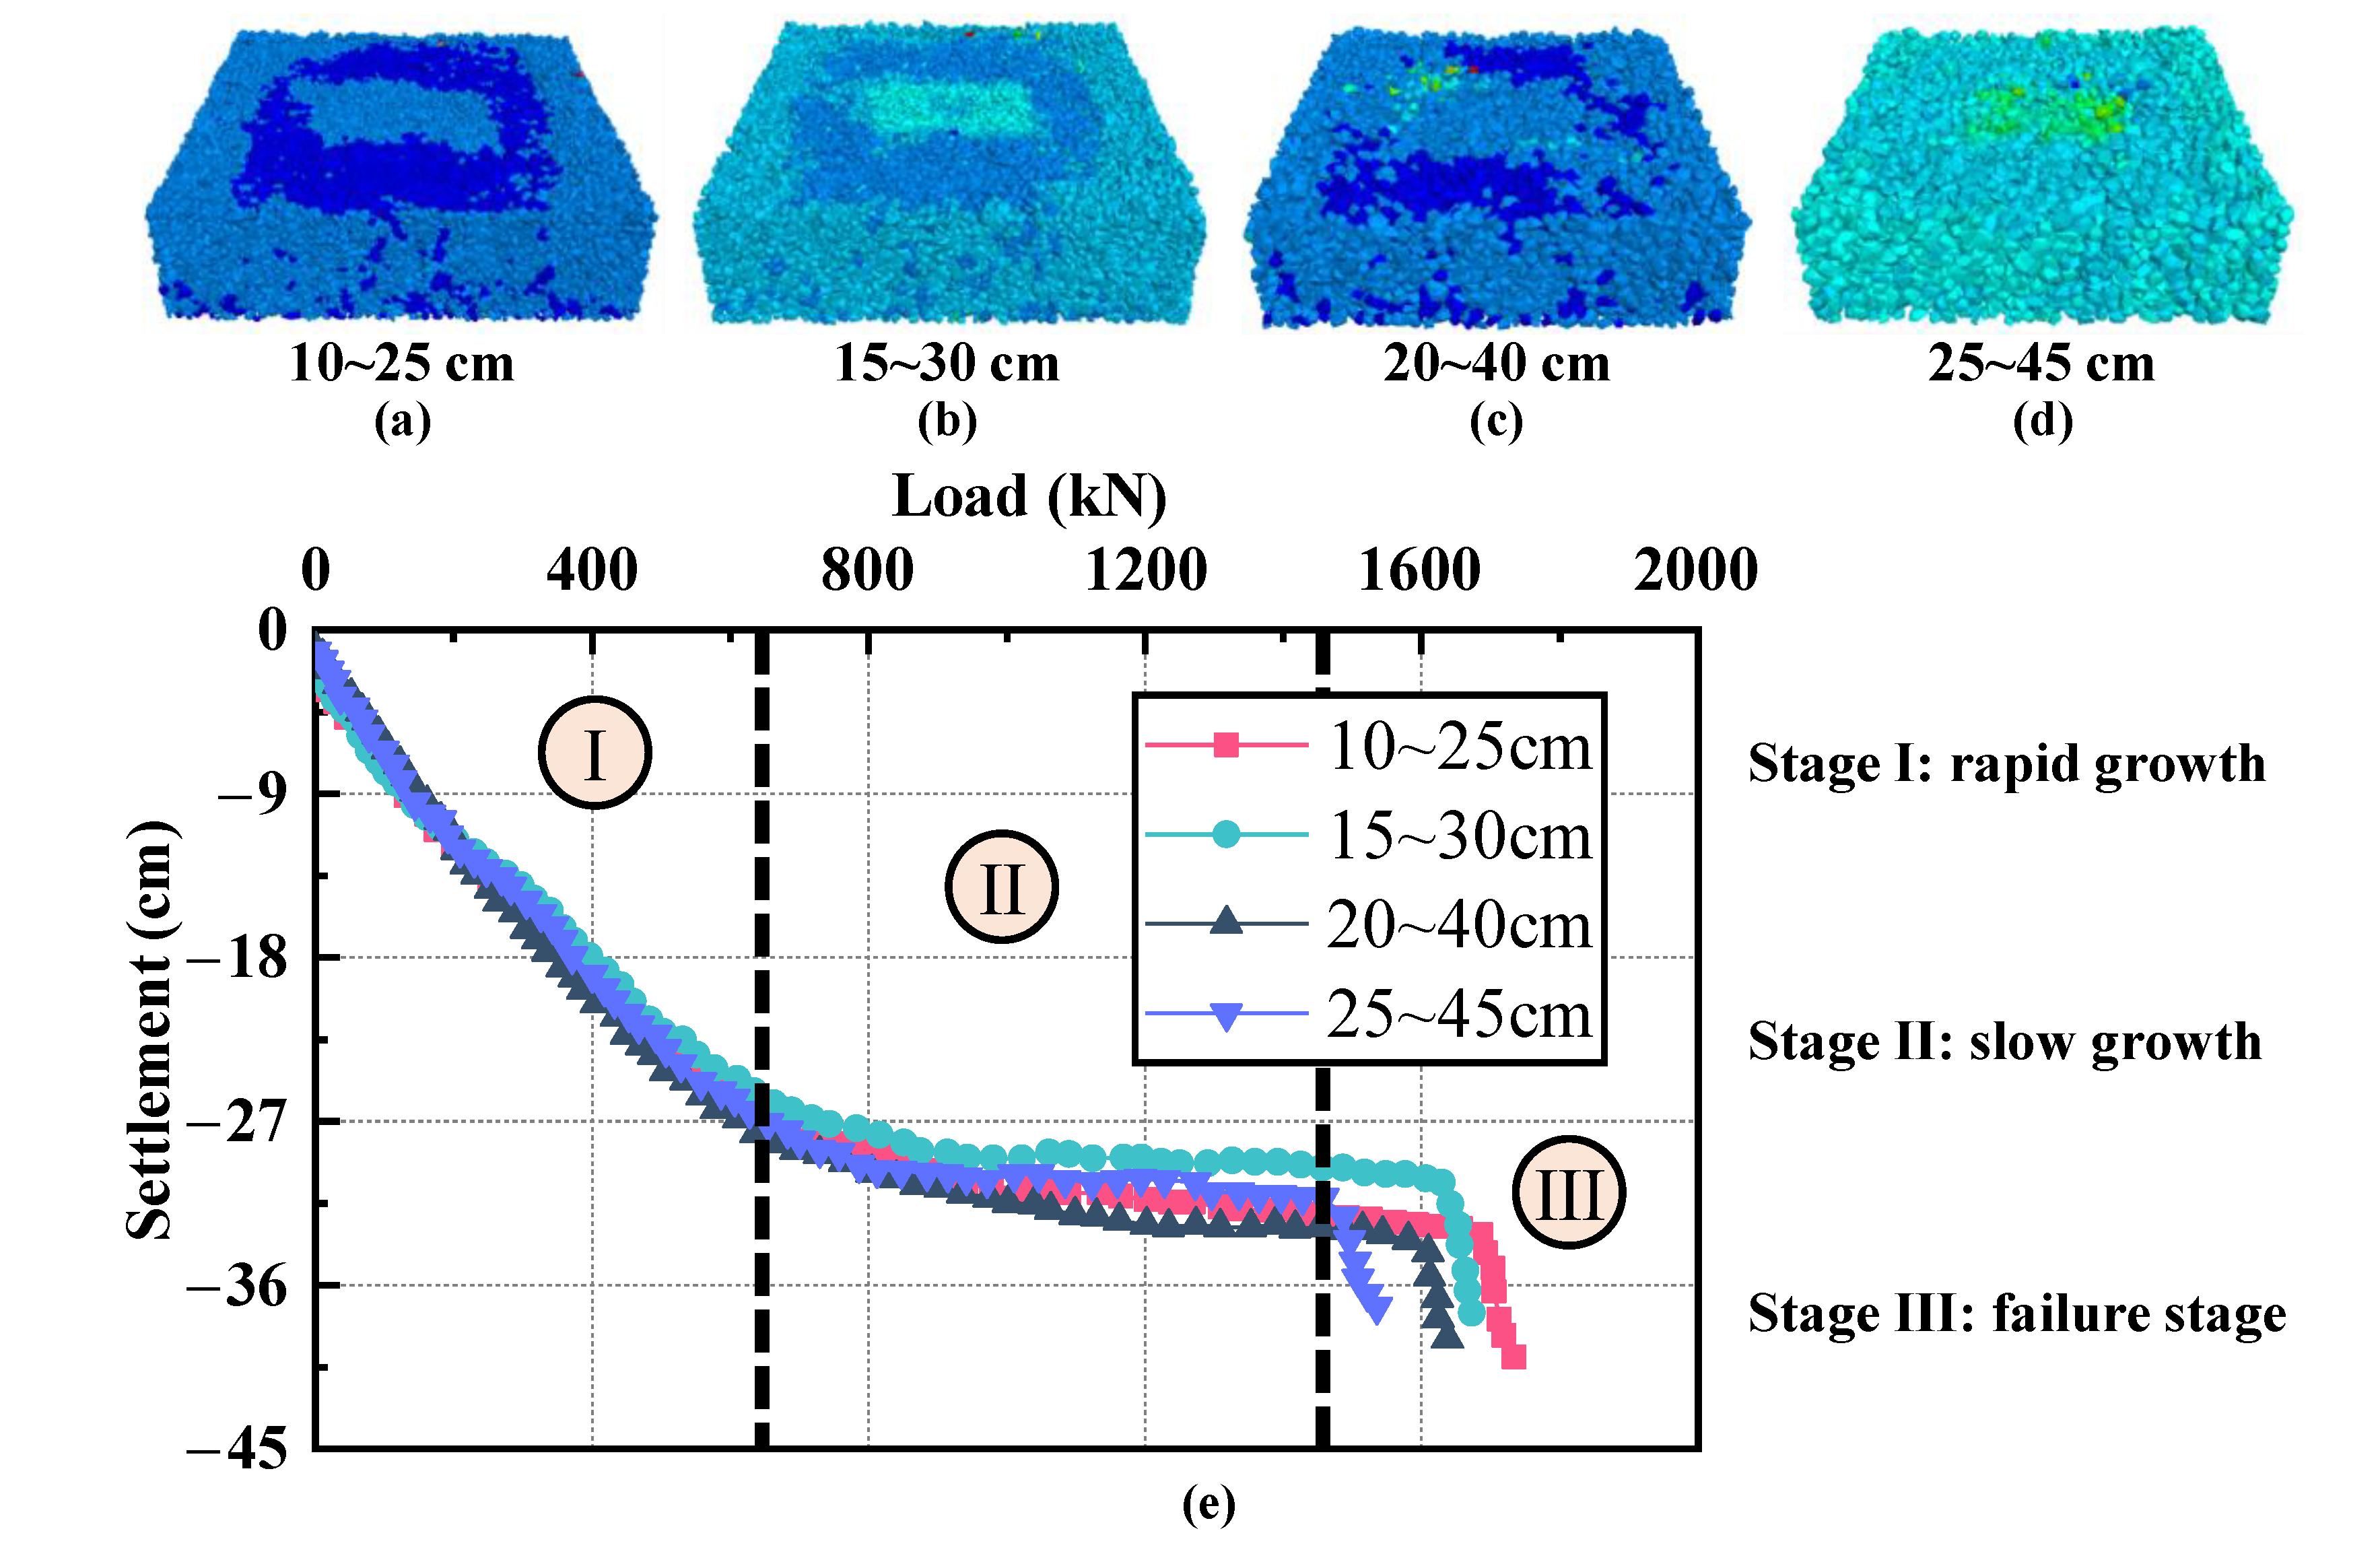
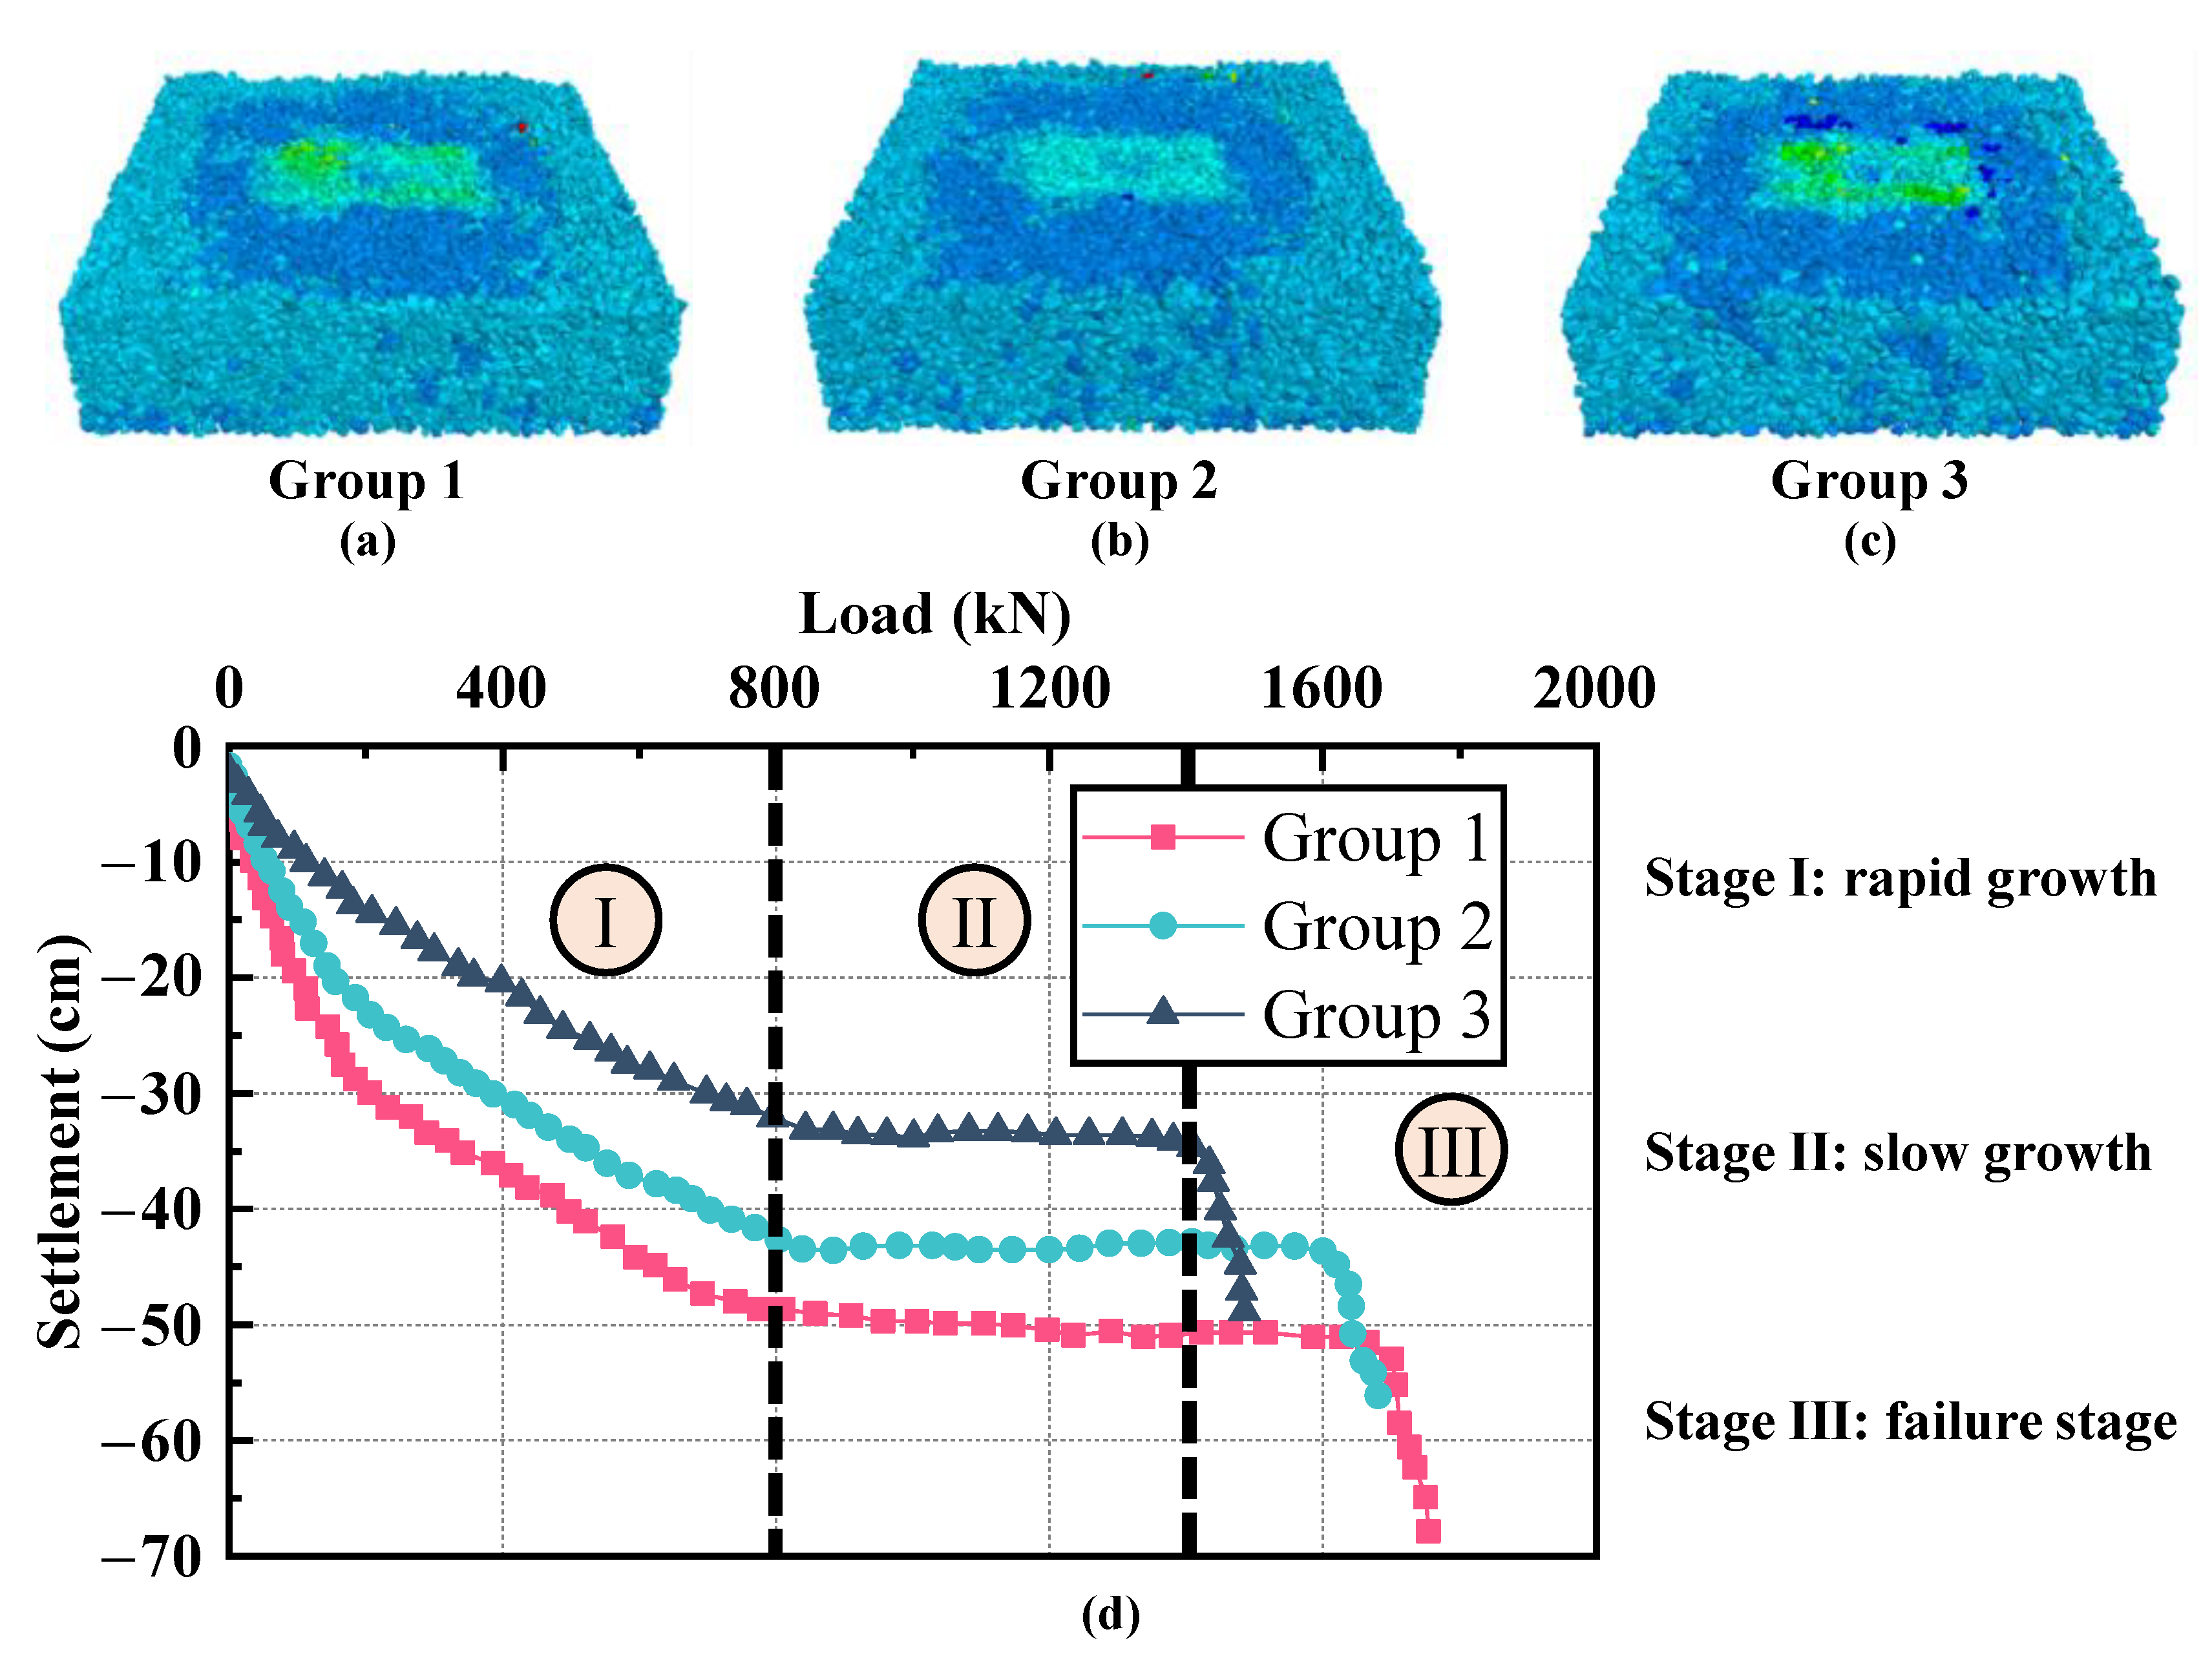
5.2. Riprap Properties

This section investigates the impact of the riprap particle size and gradation on the bearing characteristics of the rubble-mound foundation. These two factors were studied separately to determine their individual effects. When studying the effect of riprap particle size, the vibration frequency remained 21 Hz; the vibration time was fixed at 60 s; the foundation thickness was a kept at 3.0 m; and four different riprap particle size ranges were selected, which were 10~25 cm, 15~30 cm, 20~40 cm, and 25~45 cm. For the sensitivity analysis of the riprap particle gradation, the vibration frequency, vibration time, and foundation thickness remained the same as those used for studying the effect of riprap particle size, and only one riprap particle size range, which was 15~30 cm, was studied with three different particle gradation curves.
The displacement diagrams of the foundations with varying riprap particle sizes are presented in Figure 10a–d. Similarly, Figure 11a–c depict the displacement diagrams of the foundations with different riprap particle gradations. It can be seen that the vibration compaction area of the rubble-mound foundation has obvious settlement, and the settlement area coincides with the vibration compaction area, which is consistent with the vibration compaction effect of the field test. Figure 10e and Figure 11d display the load–settlement curves for the rubble-mound foundation. The settlement value of the foundation initially increases rapidly under the influence of two factors, i.e., the riprap particle size and riprap particle gradation; stabilizes; and finally collapses rapidly after reaching the ultimate bearing capacity. The existence of large-sized riprap makes the foundation form a complete skeleton structure. When the vibration is compact, small-sized riprap is more likely to enter the pores of the foundation skeleton, and the riprap particles are more tightly squeezed. It can be seen that good particle gradation helps to improve the bearing capacity of the rubble-mound foundation.

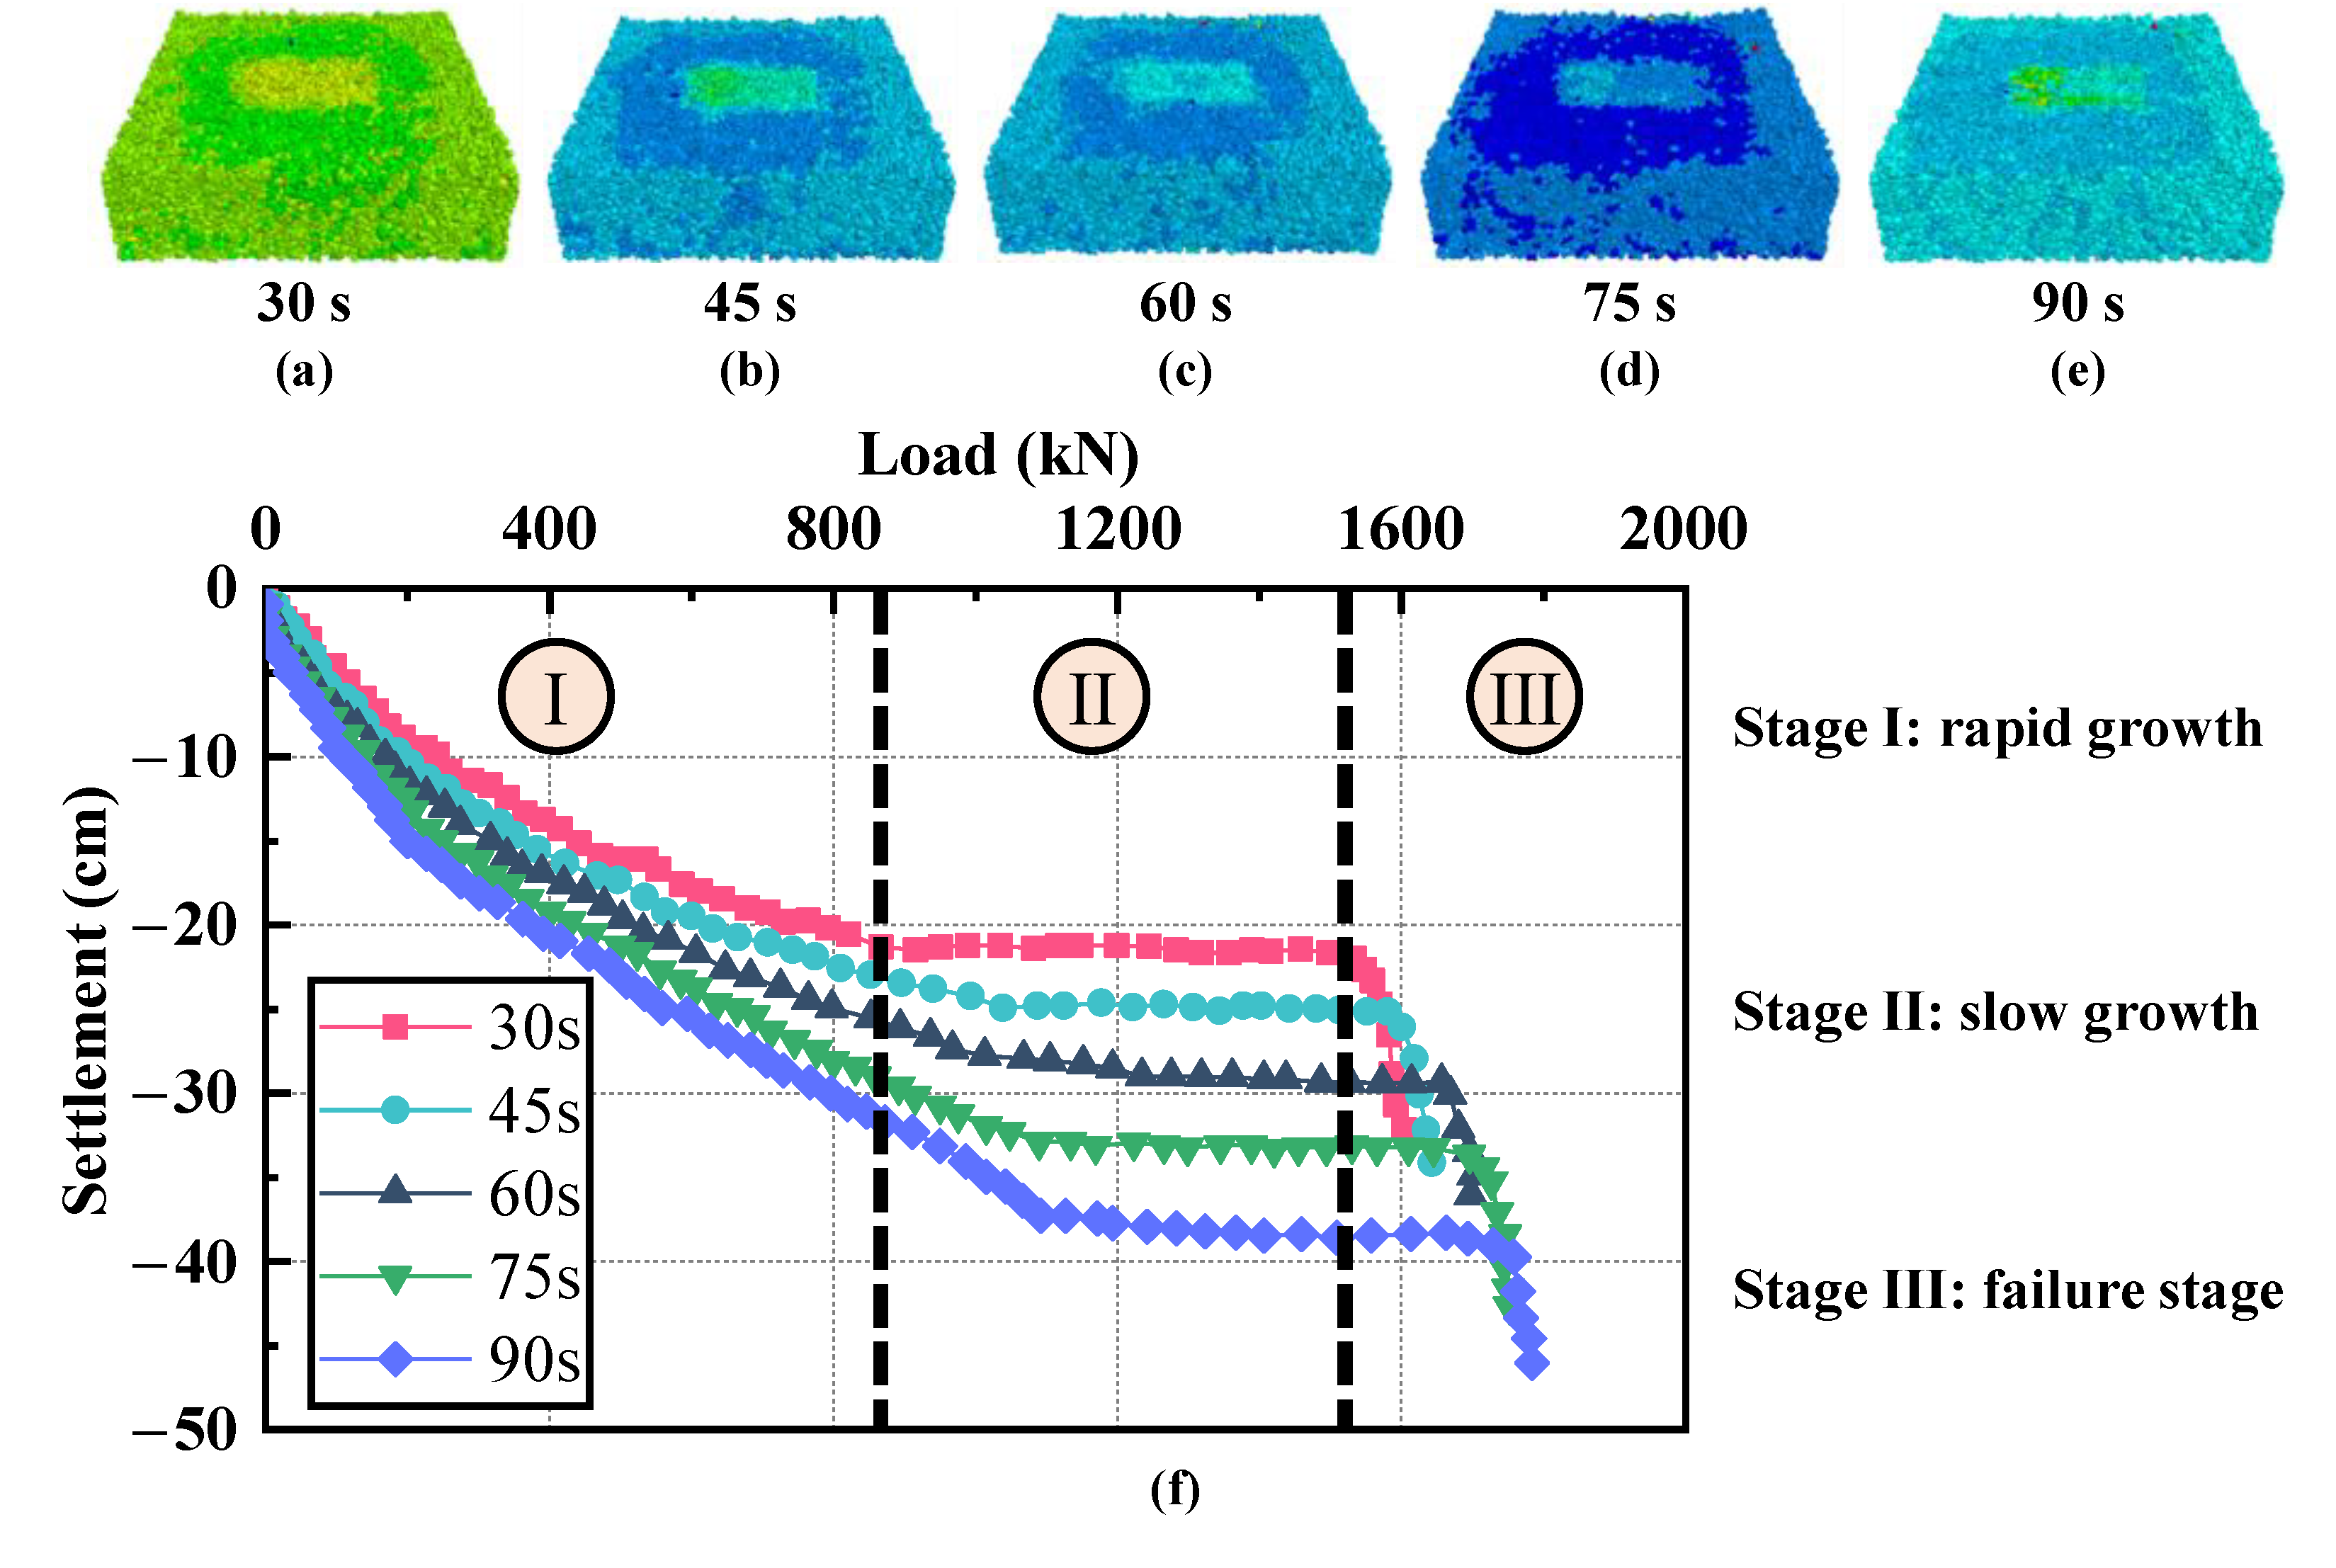
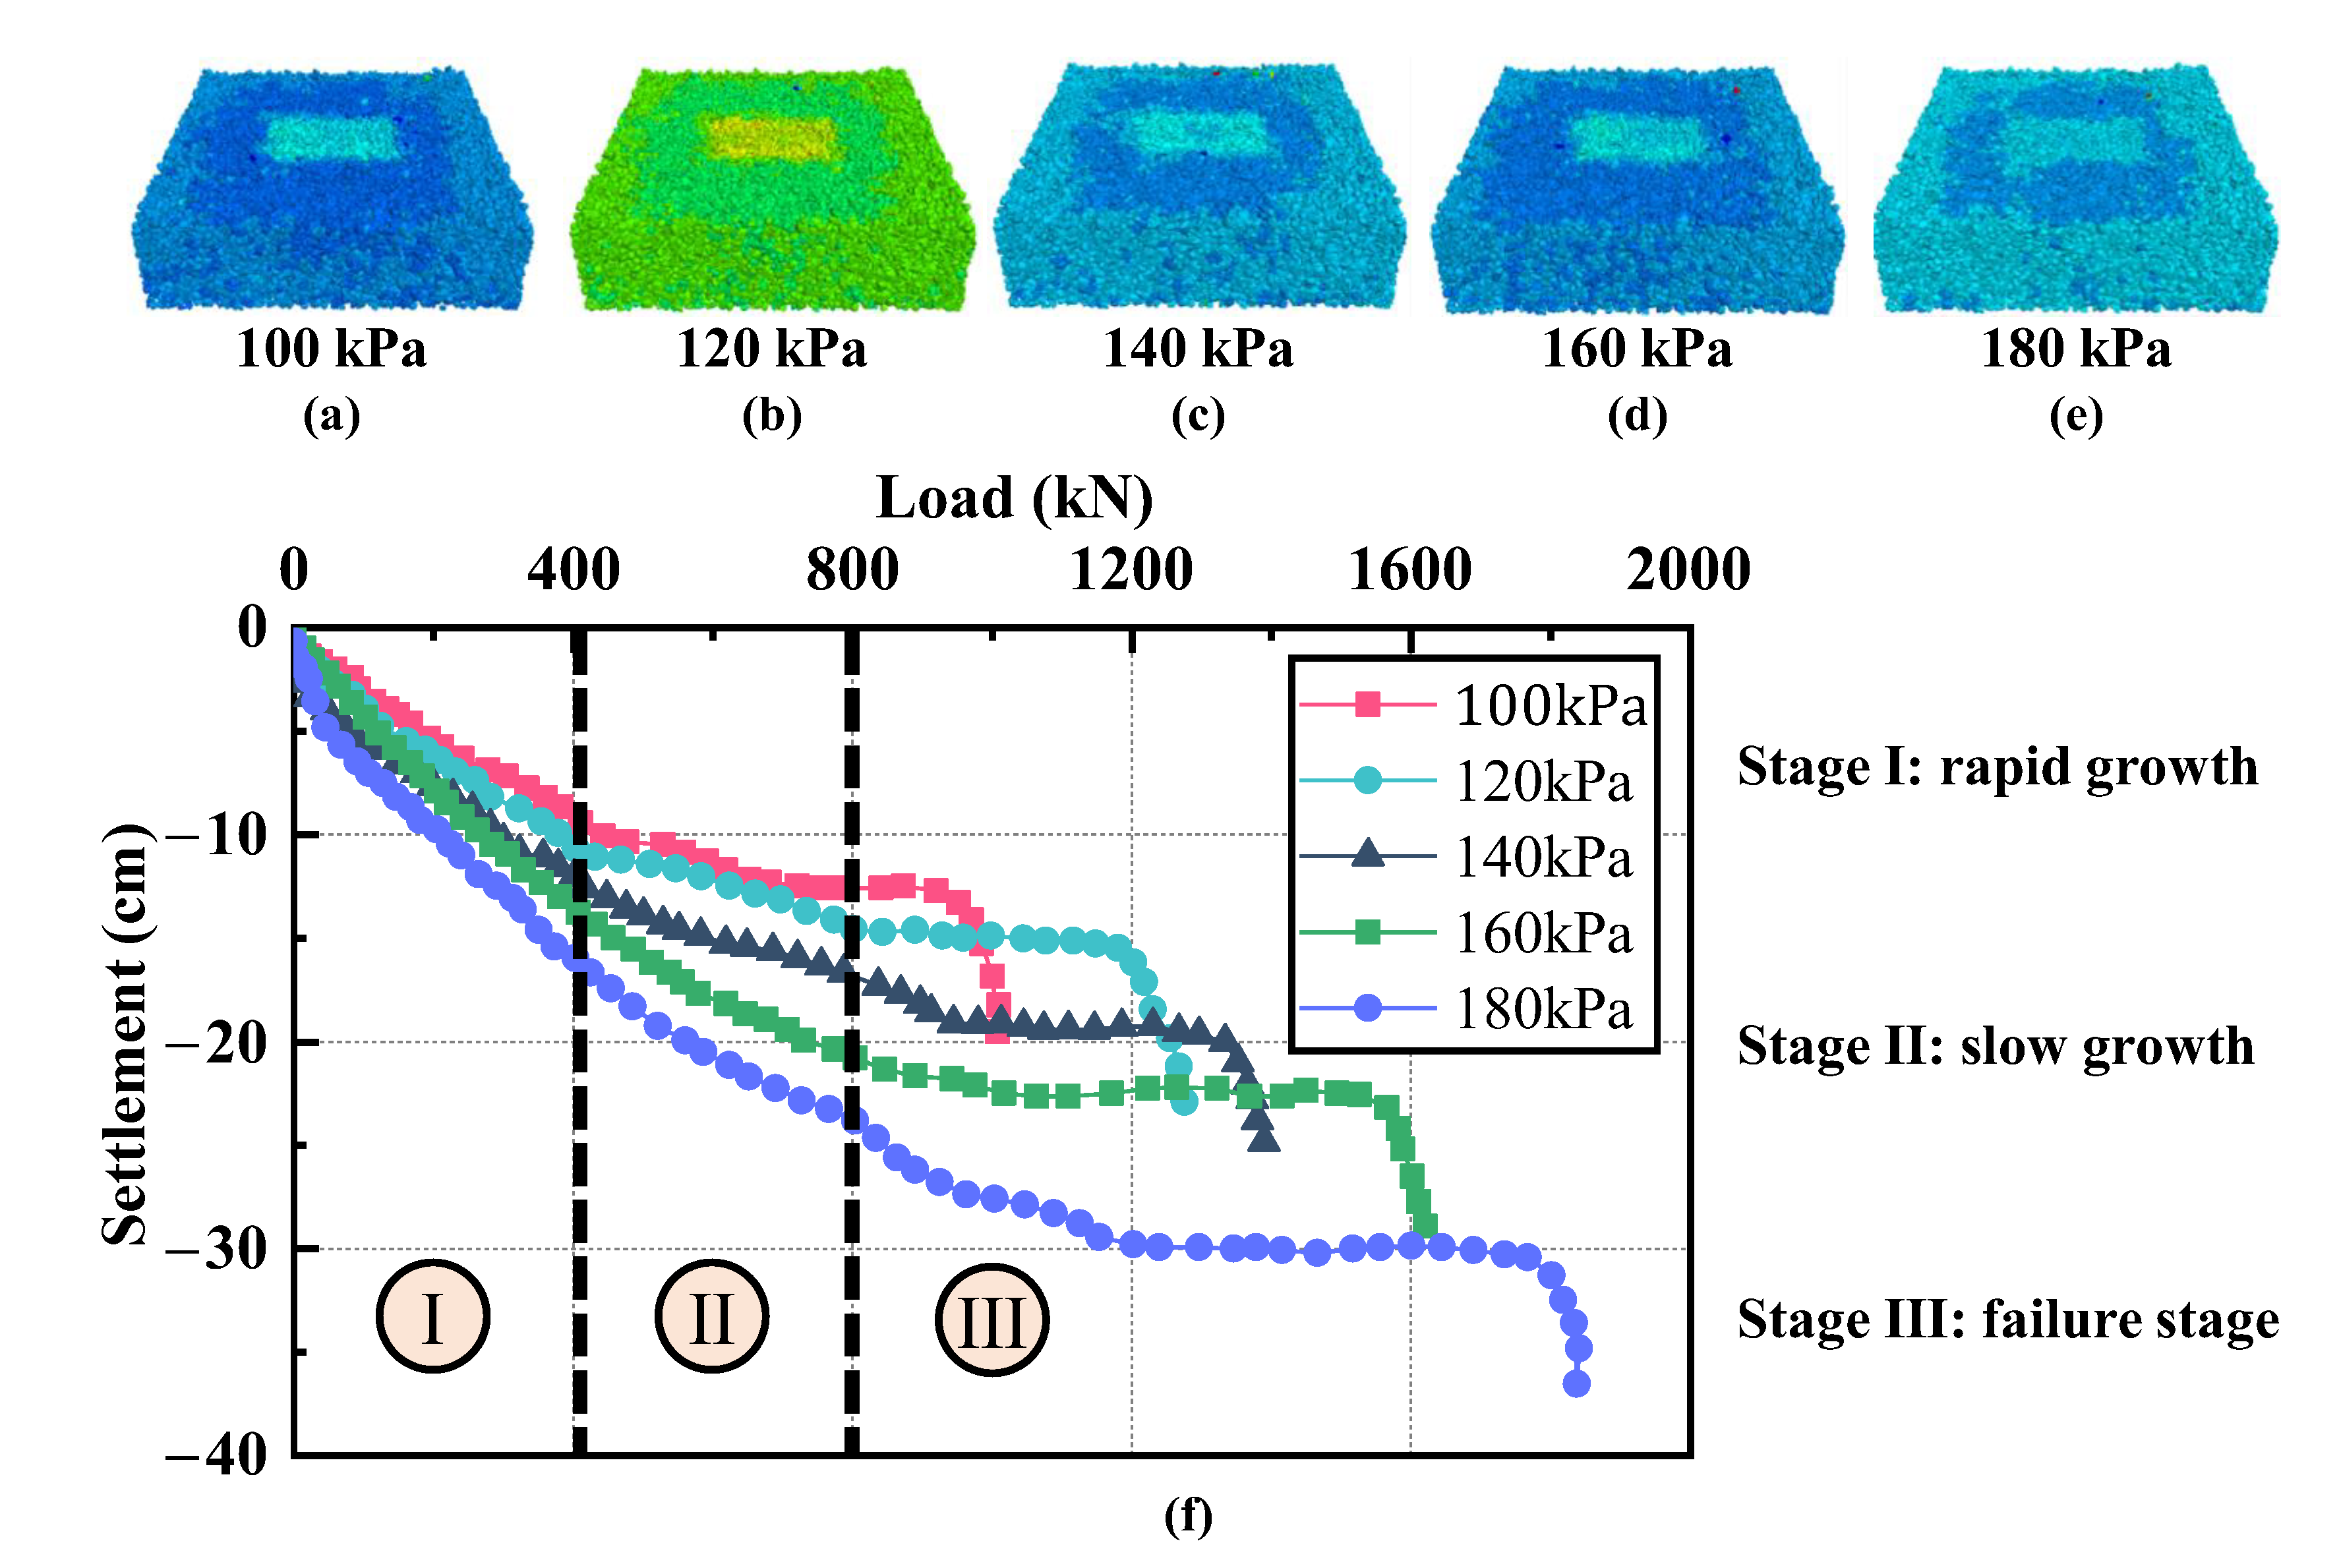
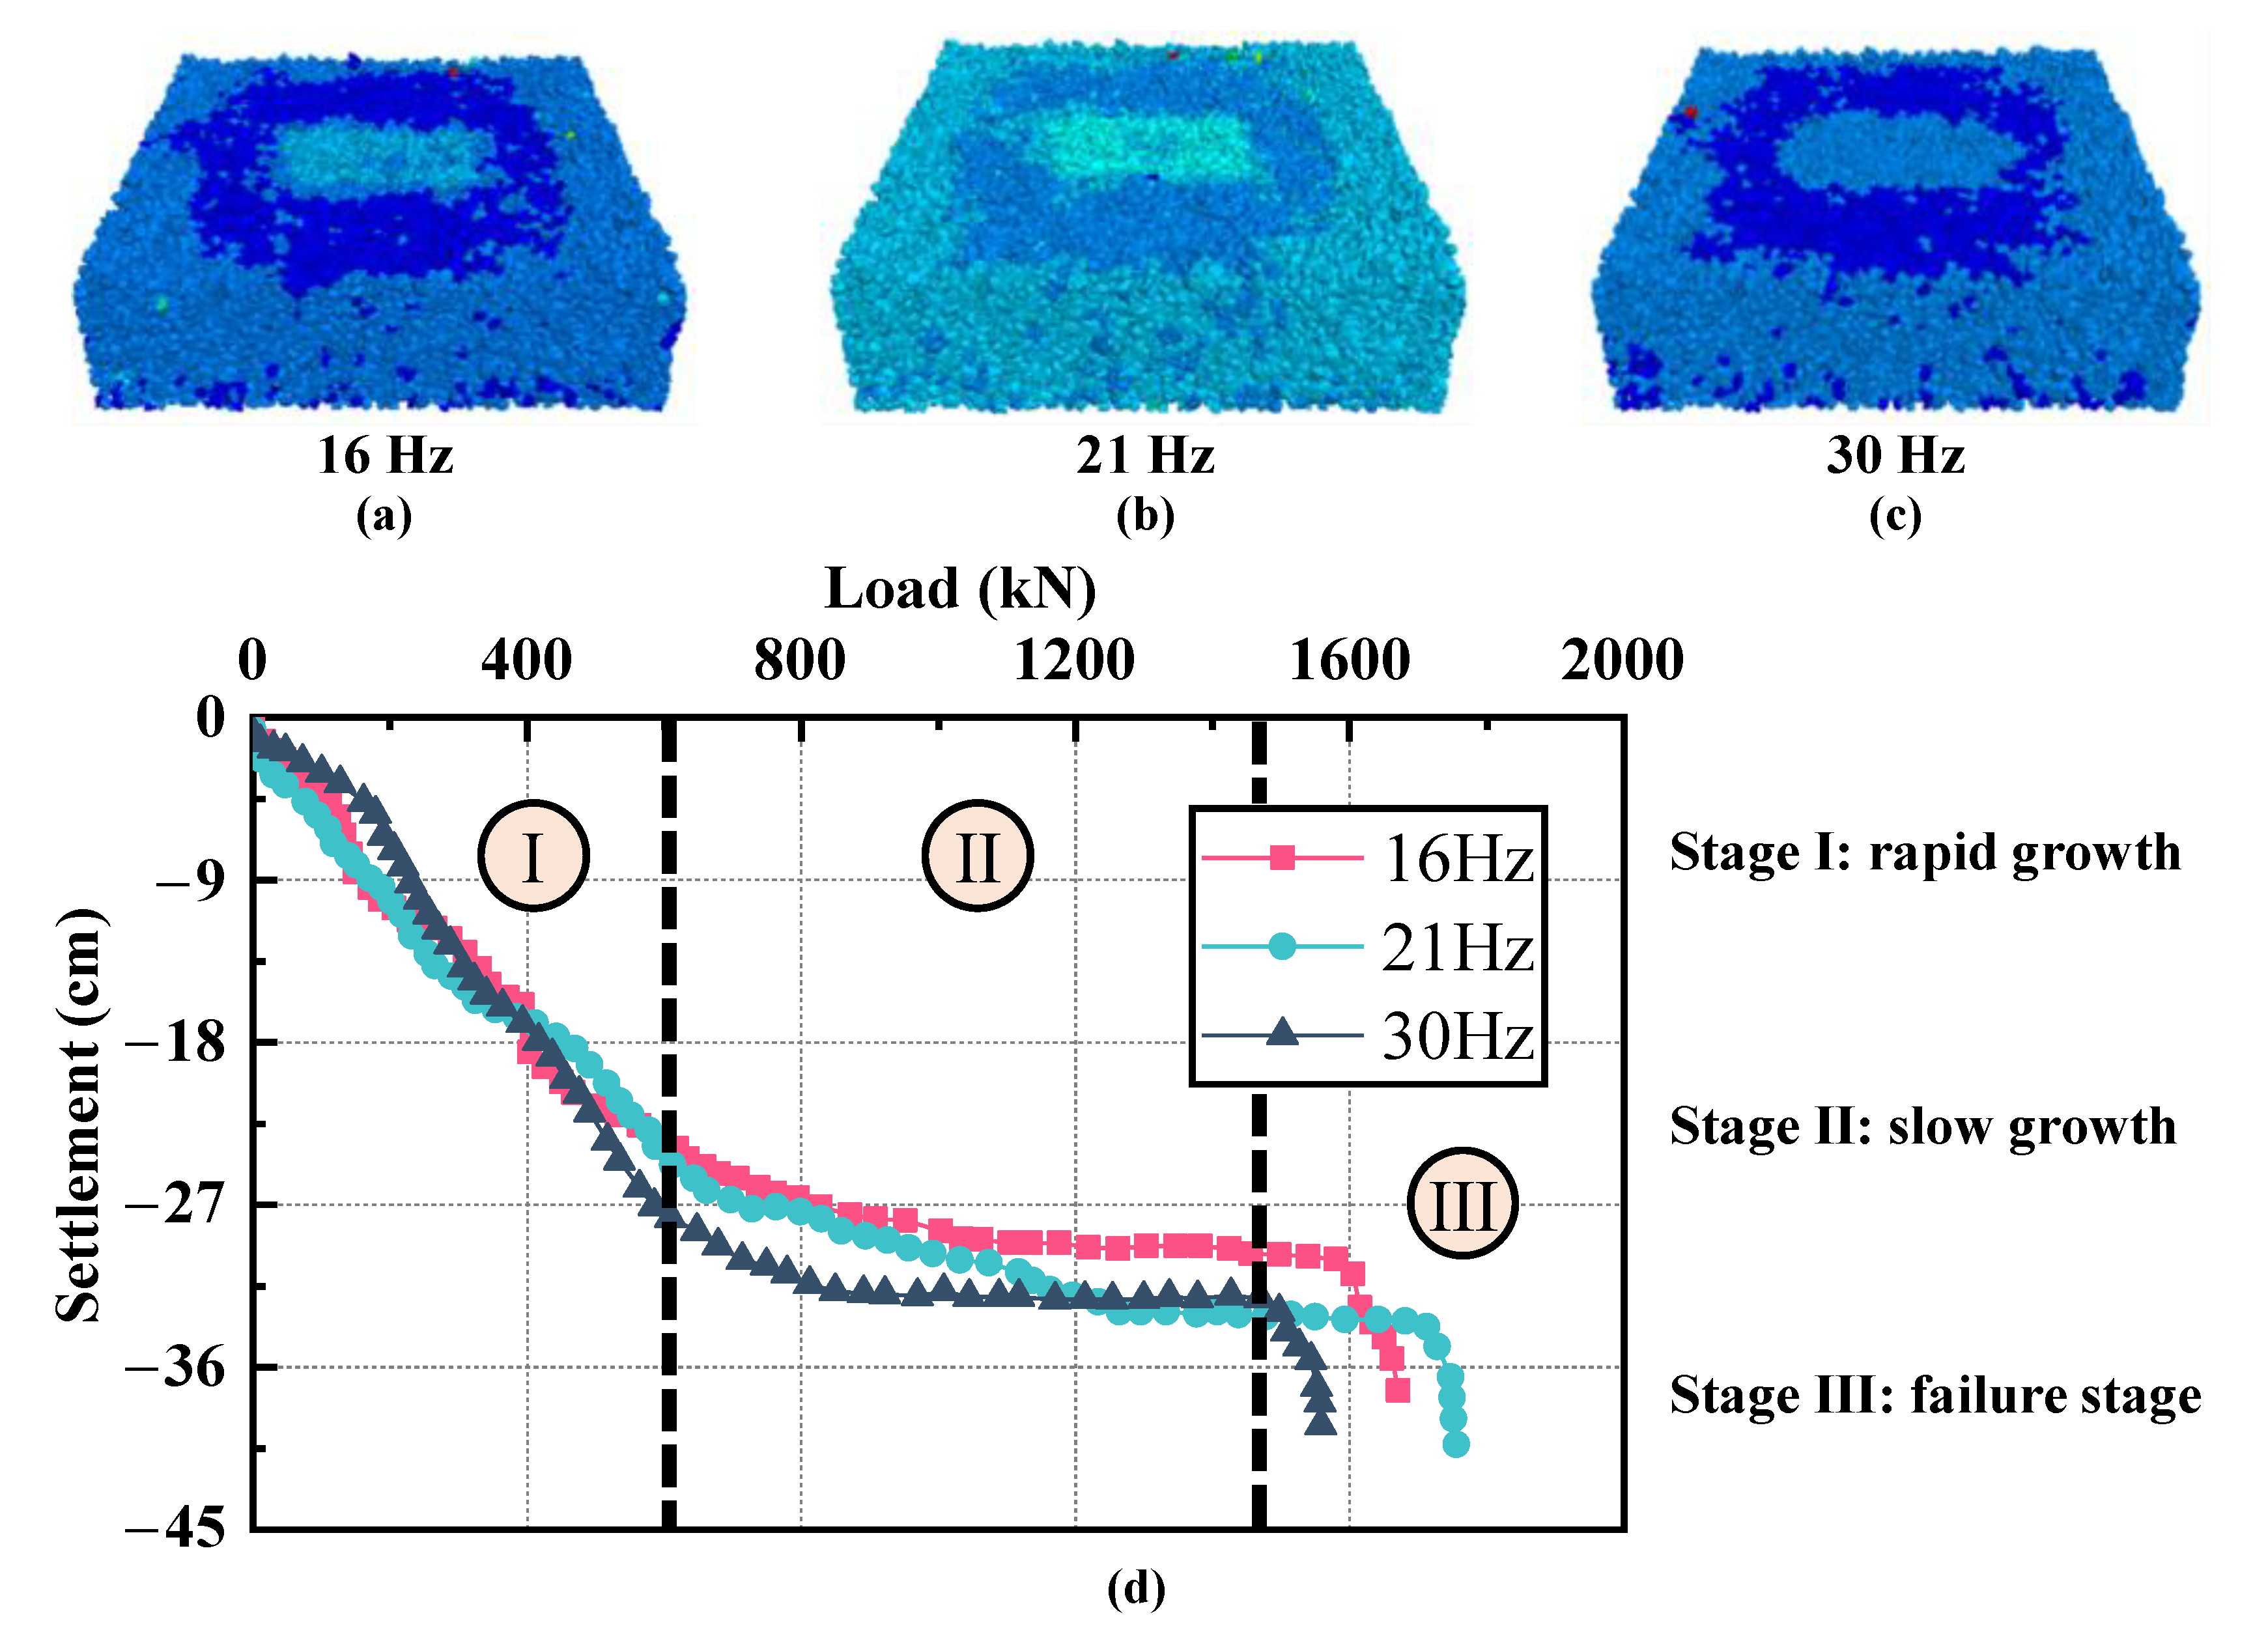
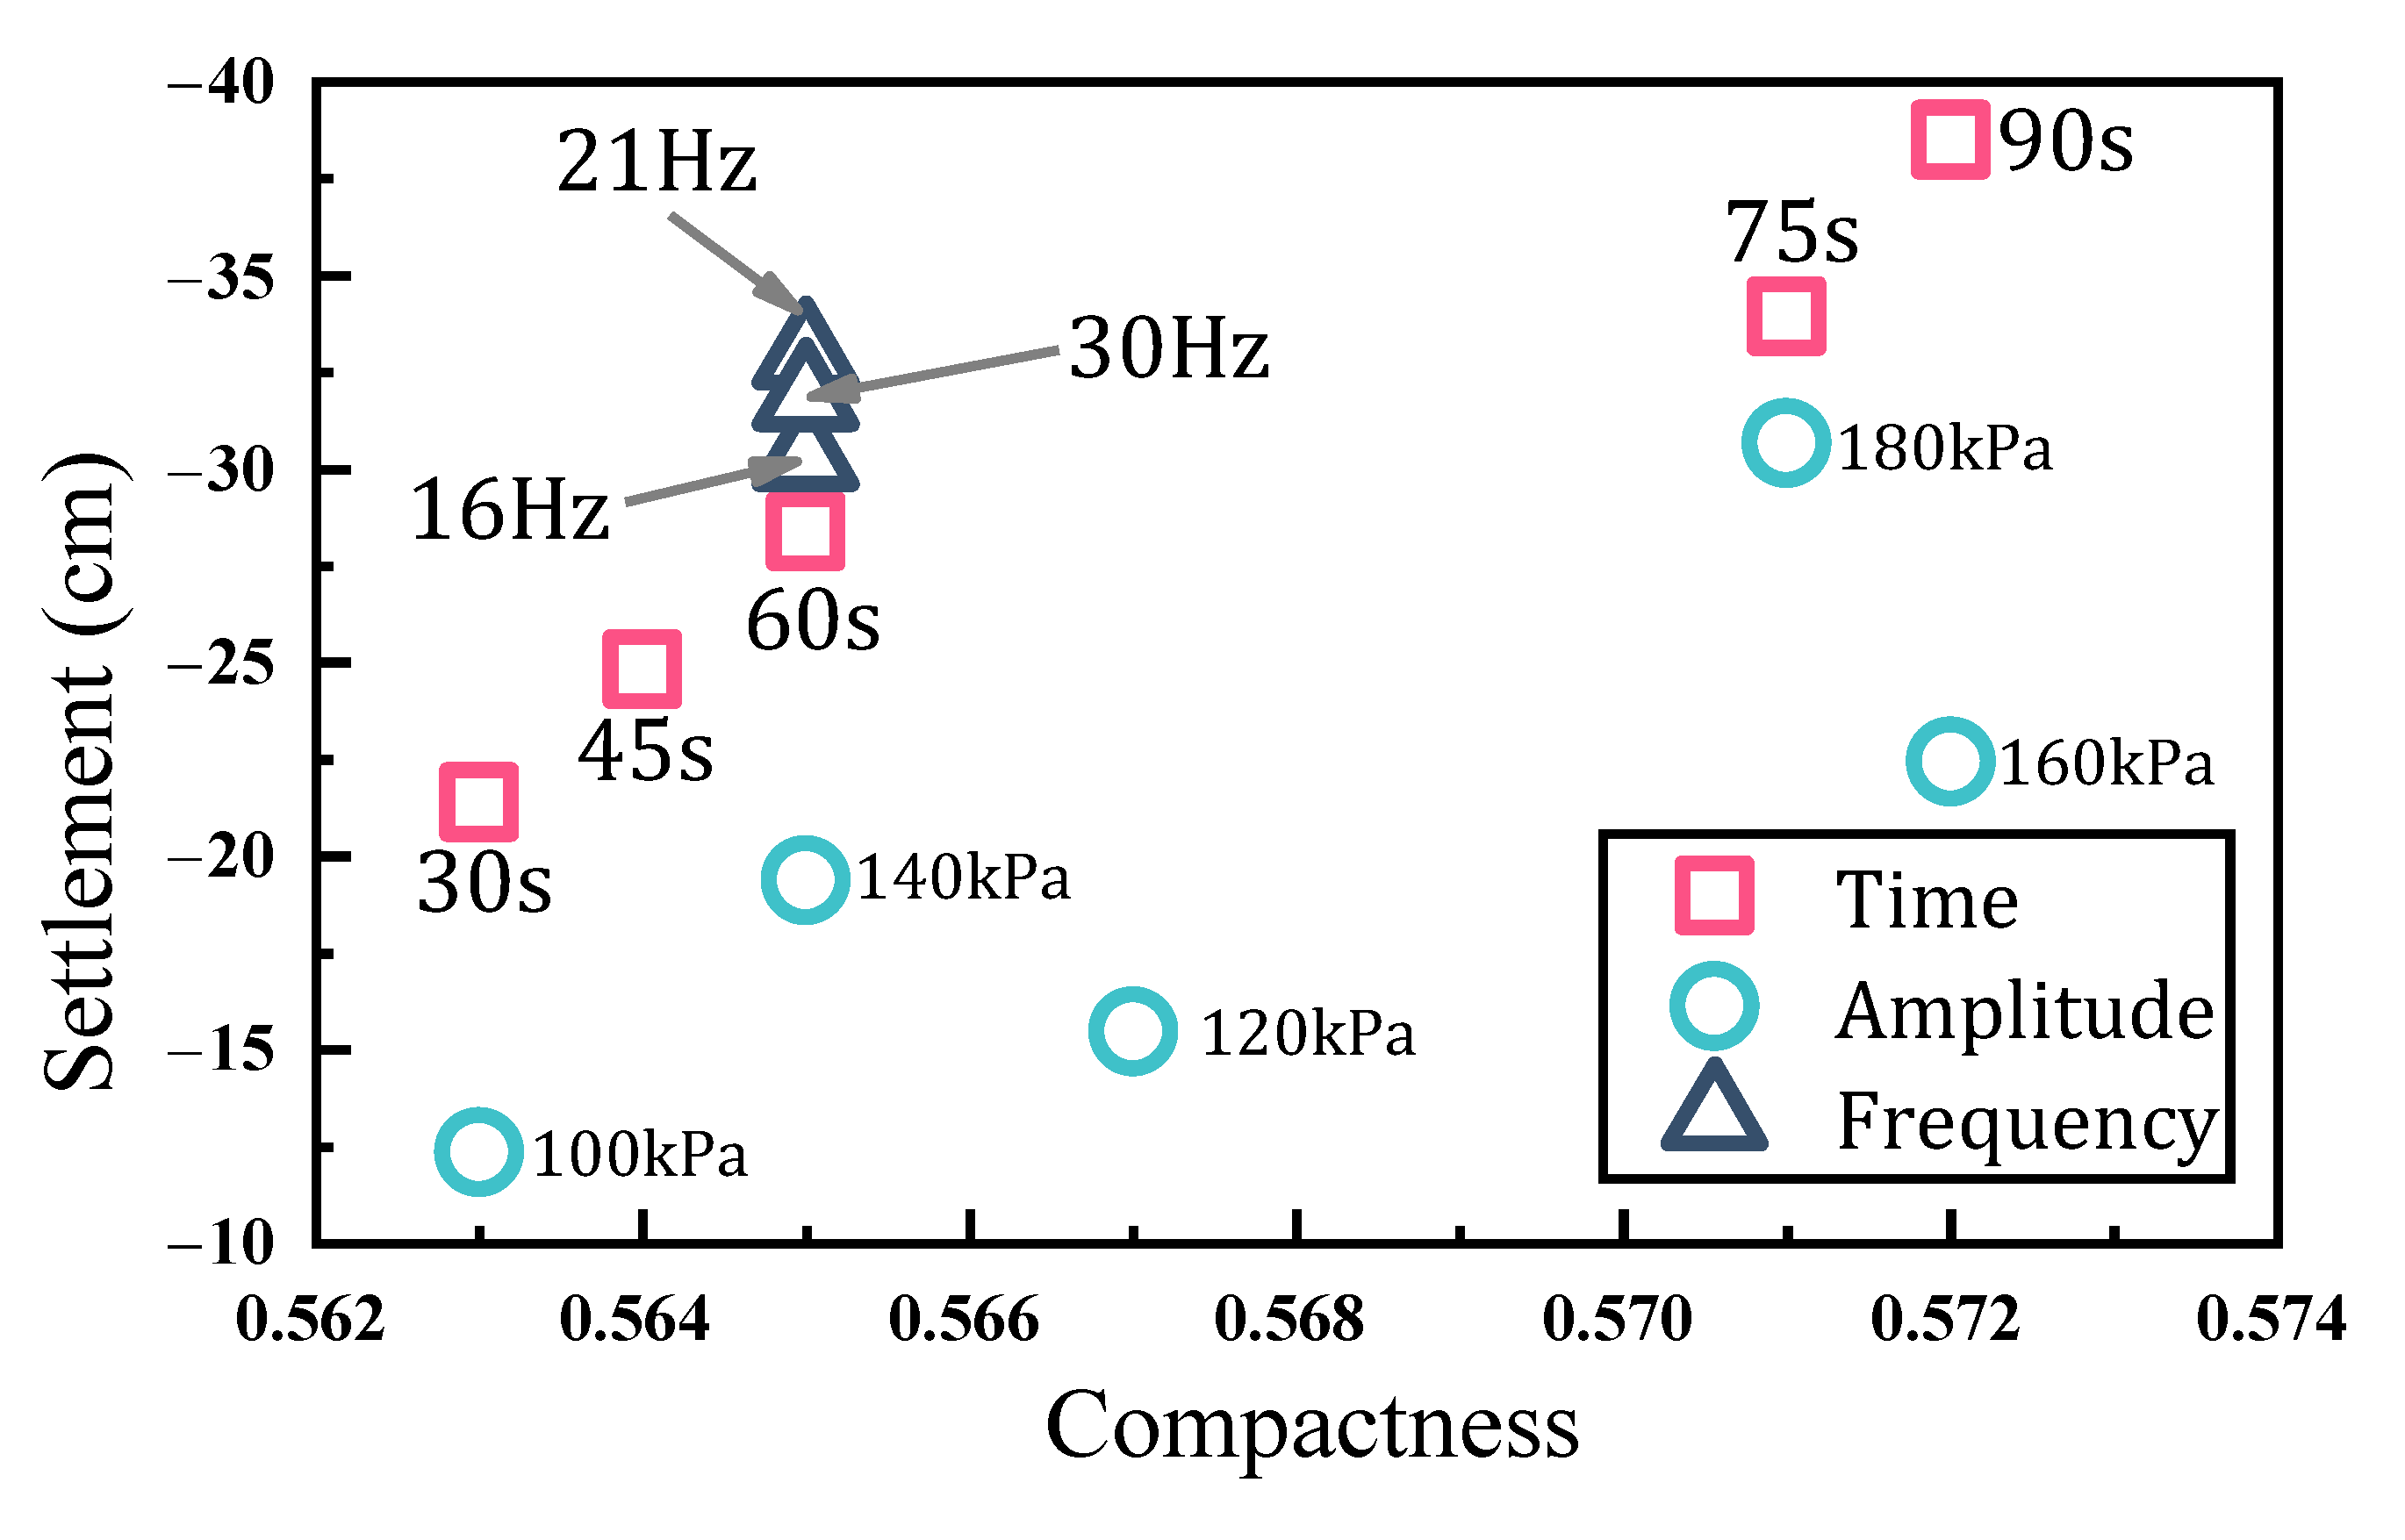
5.3. Vibration Properties

This section investigates the impact of vibration time, vibration amplitude, and vibration frequency on the bearing characteristics of the rubble-mound foundation. The vibration time sensitivity analysis was conducted using a loading scheme that included a vibration frequency of 21 Hz; a foundation thickness of 3.0 m; a riprap particle size range of 15~30 cm; a second group of riprap particle gradation; and specified vibration times of 30 s, 45 s, 60 s, 75 s, and 90 s. The vibration amplitude sensitivity analysis was analyzed using a loading scheme with a vibration time of 60 s, a vibration frequency of 21 Hz, a foundation thickness of 3.0 m; a riprap particle size range of 15~30 cm; a second group of riprap gradation; and five excitation stresses, which were 100 kPa, 120 kPa, 140 kPa, 160 kPa, and 180 kPa. The vibration frequency sensitivity analysis was conducted using a loading scheme that involved a vibration time of 60 s; a foundation thickness of 3.0 m; a riprap particle range of 15~30 cm; a second group of riprap gradation; and three vibration frequencies, which were 16 Hz, 21 Hz, and 30 Hz.
Displacement diagrams and load–settlement curves of the rubble-mound foundations under various vibration factors are displayed in Figure 12, Figure 13 and Figure 14. Obviously, the settlement value in a vibration compaction area is affected by various factors, such as the vibration time, vibration amplitude, and vibration frequency. However, their impact on the settlement value varies from one another. Changing the vibration time can affect the settlement value of the rubble-mound foundation. Increasing the vibration time will result in a higher settlement value, whereas the ultimate bearing capacity of the rubble-mound foundation shows little dependency on the vibration time. As the vibration continues, the riprap particles keep moving, rolling, and squeezing, and the gaps in the rubble-mound foundation continue to decrease, making the tamping on the surface of the foundation increase until it reaches a new state of balance. By adjusting the amplitude of the exciting force applied during vibration compaction, it is possible to achieve a significant improvement in the bearing capacity of the rubble-mound foundation. In contrast, the alteration of vibration frequency has a minimal impact on the bearing capacity of the rubble-mound foundation.
By combining the displacement diagrams and load–settlement curves of the rubble-mound foundation under different influencing factors, we can observe that the failure process of the rubble-mound foundation is comparable to that of the general foundation soil and can be divided into three stages:
  • The settlement value increases rapidly with the external load.
  • The settlement value increases slowly with the external load.
  • The settlement value increases sharply, and the rubble-mound foundation enters the stage of failure.
Based on the analysis results presented in Section 5.1, Section 5.2 and Section 5.3, it is evident that the foundation thickness, vibration time, vibration amplitude, and riprap particle gradation are significant factors that affect the rubble-mound foundation. To further elaborate on the impact of these factors on the bearing characteristics of a rubble-mound foundation, Table 4 is presented. The compactness and settlement value of the rubble-mound foundation increases positively with variables such as vibration time, vibration amplitude, and foundation thickness after vibration compaction. Additionally, the ultimate bearing capacity of the rubble-mound foundation also increases with increasing vibration time and amplitude. The change law of the bearing characteristics of the rubble-mound foundation can be influenced by various factors. In actual engineering, appropriate parameters such as vibration time, vibration amplitude, and foundation thickness can be selected to guide the design of the ultimate bearing capacity of the rubble-mound foundation.

6. Discussion

The analysis results in Section 5 indicate that several factors, including the foundation thickness, vibration time, vibration amplitude, vibration frequency, riprap particle size, and riprap particle gradation, affect the settlement value and ultimate bearing capacity of the rubble-mound foundation. The bearing characteristics of a rubble-mound foundation are primarily affected by the foundation thickness, vibration time, vibration amplitude, and riprap particle gradation. On the other hand, factors such as the riprap particle size and vibration frequency have a minimal impact on the bearing characteristics of the rubble-mound foundation.

6.1. Effect of Riprap Properties on Bearing Characteristics

In Figure 15, a scatter diagram displays the relationship between compactness and the settlement. This relationship is influenced by the foundation thickness, riprap particle size, and riprap particle gradation.
The compactness of the foundation increases as the thickness of the foundation increases. Specifically, when the thickness of the foundation is 1.6 m, 3.0 m, and 4.5 m, the compactness of the foundation is 0.55, 0.565, and 0.57, respectively. The settlement value of a foundation with a thickness of 1.6 m is only −20.7 cm. As the thickness increases to 3.0 m and 4.5 m, the settlement values increase to −30.4 cm and −42.5 cm, respectively. The settlement value increases with the increasing compactness. After changing the foundation’s thickness, there is a linear correlation between the compactness and the settlement value. Moreover, there is a significant variation in the density and settlement values of the rubble-mound foundations with varying thicknesses. The riprap in the lower part of the foundation will naturally compact due to the weight of the upper riprap. As the thickness of the rubble-mound foundation increases, the compaction will also increase. This is a reasonable phenomenon.
The compactness of a foundation is affected by the average particle size of the riprap used. When the average particle size is smaller, such as 18 cm, the compactness is higher, at 0.57. As the average particle size increases to 23 cm, the compactness decreases slightly to 0.565. The compactness further decreases to 0.56 when using larger particle sizes of 30 cm and 35 cm. A smaller riprap can effectively fill the pores in the rubble-mound foundation, resulting in a better vibration compaction effect and greater compactness. Altering the riprap particle size affects the compactness of the rubble-mound foundation to some extent. However, despite the increase in compactness, the settlement value remained almost unchanged, with a tiny rise from −28 cm to −30 cm.
As for the riprap particle gradation, it has a minimal impact on the compactness of the rubble-mound foundation but influences the settlement of the rubble-mound foundation significantly. The compactness values of the foundations with different particle gradations are all around 0.565. The maximum and minimum settlement values under various particle gradations are −50 cm and −32 cm, respectively. Three different particle gradations were selected for analysis, with all three groups having particle-size ranges of 15~30 cm. This uniformity in particle-size range is the primary reason why the foundation’s compactness remains unchanged.

6.2. Effect of Vibration Properties on Bearing Characteristics

In Figure 16, the effects of vibration time, vibration amplitude, and vibration frequency on the compactness and settlement value of the rubble-mound foundation are presented.
When the vibration time increased from 30 s to 90 s, the compactness of the rubble-mound foundations increased from 0.563 to 0.572, and the settlement values increased from −21.4 cm to −38.5 cm. Thus, the compactness and settlement values increased significantly with the increase in vibration time. The compactness of the rubble-mound foundation increases over time due to the influence of the vibration time. As a result, the settlement value and compactness exhibit a linear upward trend, with the maximum settlement value reaching −38.5 cm.
Increasing the excitation stress from 100 kPa to 160 kPa increased the foundation’s compactness from 0.563 to 0.572. The effect of the vibration amplitude on compactness is directly proportional to the increase in the maximum excitation force. Both the vibration amplitude and the vibration time will significantly improve the compactness of the rubble-mound foundation. On the other hand, the settlement value also increases with the increasing excitation stress, and their correlation is very sensitive.
It can be seen that the compactness of the rubble-mound foundation under the action of three vibration frequencies is 0.565. The minimum settlement value is −30.5 cm, and the maximum settlement value is −32.9 cm. The influence of the vibration frequency on the settlement of the rubble-mound foundation can be ignored. The compactness and settlement of the rubble-mound foundation are not significantly affected by changes in the vibration frequency. Hence, selecting an appropriate vibration time and vibration amplitude is crucial in actual engineering.

7. Conclusions

This study investigated the bearing characteristics of deep-water wharf rubble-mound foundations in offshore environments by combining image-recognition technology, a discrete element numerical simulation, and a field test. A Rigid block was used to establish the discrete element model of the rubble-mound foundation. The bearing characteristics of the rubble-mound foundation were studied while accounting for various influencing factors, leading to the following conclusions:
(1)
Image-recognition technology can be used to determine the shape parameters and particle size distribution of riprap. Additionally, 3D laser scanning technology can aid in creating random riprap models, establishing 3D particle mesoscopic feature descriptions and mesoscopic reconstruction methods, and ultimately constructing intricate 3D rubble-mound foundation models.
(2)
The contact parameters of the discrete element model for the rubble-mound foundation and the numerical simulation method were accurately calibrated through a vibration compaction field test of an immersed tunnel. The rubble-mound foundation model was scanned using PFC 3D to monitor the foundation settlement and changes in the bearing capacity. Overall, the calibration test results demonstrate good accuracy.
(3)
The load–settlement curve of a rubble-mound foundation can be obtained by numerically simulating a static load test. This curve can be divided into three stages: rapid growth stage, slow growth stage, and failure stage. The ultimate bearing capacity of the rubble-mound foundation can be greatly influenced by adjusting the vibration amplitude and riprap particle gradation. Increasing the vibration time and vibration amplitude can lead to an increase in the ultimate bearing capacity of the rubble-mound foundation.
(4)
When altering the vibration time, vibration amplitude, and foundation thickness, the settlement value increases with the increase in compactness. However, alterations in the riprap particle size, riprap particle gradation, and vibration frequency have little effect on the settlement value and compactness of the foundation.

Author Contributions

Conceptualization, C.Z. and C.S.; methodology, L.D. and C.S.; software, C.Z. and L.D.; validation, L.D., C.Z. and Z.Z.; formal analysis, L.D.; investigation, D.Z.; resources, C.Z.; data curation, D.Z. and C.S.; writing-original draft preparation, L.D.; writing—review and editing, L.D.; visualization, C.Z.; supervision, S.W.; project administration, S.W.; funding acquisition, Z.Z. and S.W.; All authors have read and agreed to the published version of the manuscript.

Funding

This research was funded by the National Natural Science Foundation of China (Grant Nos. 52209130 and 52108448) and the Fundamental Research Funds for the Central Universities (B220202058). The work described in this paper was also funded by Jiangsu Excellent Postdoctoral Program and ARC Discovery Project, grant DP210100437.

Institutional Review Board Statement

Not applicable.

Informed Consent Statement

Not applicable.

Data Availability Statement

The data are available upon reasonable request from the first author.

Acknowledgments

I would like to express my heartfelt thanks to Shi Chong of Hohai University for providing the original data of the paper and for his help in the writing process.

Conflicts of Interest

The authors declare no conflict of interest.

References

  1. Jensen, B.; Christensen, E.D.; Sumer, B.M. Pressure-induced forces and shear stresses on rubble mound breakwater armour layers in regular waves. Coast. Eng. 2014, 91, 60–75. [Google Scholar] [CrossRef]
  2. Andersen, T.L.; Burcharth, H.F. Three-dimensional investigations of wave overtopping on rubble mound structures. Coast. Eng. 2009, 56, 180–189. [Google Scholar] [CrossRef]
  3. Allsop, W.; Williams, A. Hydro-Geotechnical Performance of Rubble Mound Breakwaters; Hydraulics Research: Wallingford, UK, 1991. [Google Scholar]
  4. Allsop, W.; Wood, L. Hydro-Geotechnical Performance of Rubble Mound Breakwaters––A Literature Review; Hydraulics Research: Wallingford, UK, 1987. [Google Scholar]
  5. Bürger, W.; Oumeraci, H.; Partenscky, H.W. Ceohydraulic investigations of rubble mound breakwaters. Coast. Eng. 1988, 2242–2256. [Google Scholar] [CrossRef] [Green Version]
  6. Gourvenec, S. Effect of embedment on the undrained capacity of shallow foundations under general loading. Géotechnique 2008, 58, 177–185. [Google Scholar] [CrossRef]
  7. Bransby, M.F.; Yun, G.J. The undrained capacity of skirted strip foundations under combined loading. Géotechnique 2009, 59, 115–125. [Google Scholar] [CrossRef]
  8. Gourvenec, S.; Barnett, S. Undrained failure envelope for skirted foundations under general loading. Géotechnique 2011, 61, 263–270. [Google Scholar] [CrossRef]
  9. Cantelmo, C.; Dunn, S.; Cuomo, G.; Allsop, W. Hydro-geotechnical stability of rubble mound breakwaters under wave action. Coast. Struct. 2011, 2, 972–982. [Google Scholar] [CrossRef]
  10. Celli, D.; Li, Y.; Ong, M.C.; Risio, M.D. The role of submerged berms on the momentary liquefaction around conventional rubble mound breakwaters. Appl. Ocean Res. 2019, 85, 1–11. [Google Scholar] [CrossRef]
  11. Zhao, H.Y.; Liang, Z.D.; Jeng, D.S.; Zhu, J.F.; Guo, Z.; Chen, W.Y. Numerical investigation of dynamic soil response around a submerged rubble mound breakwater. Ocean Eng. 2018, 156, 406–423. [Google Scholar] [CrossRef]
  12. Morales, R.; Ettema, R.; Barkdoll, B. Large-scale flume tests of riprap-apron performance at a bridge abutment on a floodplain. J. Hydraul. Eng. 2008, 134, 800–809. [Google Scholar] [CrossRef]
  13. Ji, U.; Yeo, W.K.; Lee, W.M.; Kang, J.G. An Experimental Study to develope the Subsidence Equation for Riprap Protection around the Pier. KSCE J. Civ. Environ. Eng. Res. 2009, 29, 63–71. [Google Scholar]
  14. Akbari, H.; Taherkhani, A. Numerical study of wave interaction with a composite breakwater located on permeable bed. Coast. Eng. 2019, 146, 1–13. [Google Scholar] [CrossRef]
  15. Wang, Y.; Wen, H.J.; Yu, X.P. SPH modeling of caisson stability on rubble-mound foundation under wave action. Chin. Sci. Bull. 2021, 66, 4700–4708. (In Chinese) [Google Scholar] [CrossRef]
  16. Van Gent, M.R.A.; van der Werf, I.M. Rock toe stability of rubble mound breakwaters. Coast. Eng. 2014, 83, 166–176. [Google Scholar] [CrossRef]
  17. Zhao, P.H.; Sun, D.P.; Wu, H.; Li, Y.C. Theoretical investigation of wave reflection from partially perforated caisson sitting on a rubble mound foundation. Ocean Eng. 2021, 235, 109085. [Google Scholar] [CrossRef]
  18. Zarrati, A.R.; Chamani, M.R.; Shafaie, A.; Latifi, M. Scour countermeasures for cylindrical piers using riprap and combination of collar and riprap. Int. J. Sediment Res. 2010, 25, 313–322. [Google Scholar] [CrossRef]
  19. Xing, T.; Sun, D.; Wu, H.; Feng, Y.; Xia, Z.; Dong, H. Experimental investigation on reflection coefficient of perforated caisson with rubble foundation under action of irregular wave. Ocean Eng. 2016, 34, 46–53. [Google Scholar]
  20. Liu, Y.; Faraci, C. Analysis of orthogonal wave reflection by a caisson with open front chamber filled with sloping rubble mound. Coast. Eng. 2014, 91, 151–163. [Google Scholar] [CrossRef]
  21. Altomare, C.; Gironella, X. An experimental study on scale effects in wave reflection of low-reflective quay walls with internal rubble mound for regular and random waves. Coast. Eng. 2014, 90, 51–63. [Google Scholar] [CrossRef]
  22. Moysey, P.A.; Thompson, M.R. Modelling the solids inflow and solids conveying of single-screw extruders using the discrete element method. Powder Technol. 2005, 153, 95–107. [Google Scholar] [CrossRef]
  23. Langston, P.A.; Tüzün, U.; Heyes, D.M. Discrete element simulation of internal stress and flow fields in funnel flow hoppers. Powder Technol. 1995, 85, 153–169. [Google Scholar] [CrossRef]
  24. Kruggel-Emden, H.; Rickelt, S.; Wirtz, S.; Scherer, V. A study on the validity of the multi-sphere Discrete Element Method. Powder Technol. 2008, 188, 153–165. [Google Scholar] [CrossRef]
  25. Wang, Z.; Ruiken, A.; Jacobs, F.; Ziegler, M. A new suggestion for determining 2D porosities in DEM studies. Geomech. Eng. 2014, 7, 665–678. [Google Scholar] [CrossRef]
  26. Ferellec, J.; McDowell, G. Modelling realistic shape and particle inertia in DEM. Géotechnique 2010, 60, 227–232. [Google Scholar] [CrossRef]
  27. Zhong, W.; Xiong, Y.; Yuan, Z.; Zhang, M. DEM simulation of gas–solid flow behaviors in spout-fluid bed. Chem. Eng. Sci. 2006, 61, 1571–1584. [Google Scholar] [CrossRef]
  28. Cleary, P.W. Large scale industrial DEM modelling. Eng. Comput. 2004, 21, 169–204. [Google Scholar] [CrossRef]
  29. Nakamura, H.; Tokuda, T.; Iwasaki, T.; Watano, S. Numerical analysis of particle mixing in a rotating fluidized bed. Chem. Eng. Sci. 2007, 62, 3043–3056. [Google Scholar] [CrossRef]
  30. Jenck, O.; Dias, D.; Kastner, R. Discrete element modelling of a granular platform supported by piles in soft soil–Validation on a small scale model test and comparison to a numerical analysis in a continuum. Comput. Geotech. 2009, 36, 917–927. [Google Scholar] [CrossRef]
  31. Chan, E.W.W.; Luo, X.; Fok, W.W.T.; Li, W.C.; Chang, R.K.C. Non-cooperative diagnosis of submarine cable faults. In Passive and Active Measurement, Proceedings of the International Conference on Passive and Active Network Measurement, Atlanta, GA, USA, 20–22 March 2011; Springer: Berlin/Heidelberg, Germany, 2011; pp. 224–234. [Google Scholar] [CrossRef] [Green Version]
  32. Pena, A.A.; Lizcano, A.; Alonso-Marroquin, F.; Herrmann, H.J. Biaxial test simulations using a packing of polygonal particles. Int. J. Numer. Anal. Methods Geomech. 2008, 32, 143–160. [Google Scholar] [CrossRef]
  33. Nouguier-Lehon, C.; Cambou, B.; Vincens, E. Influence of particle shape and angularity on the behaviour of granular materials: A numerical analysis. Int. J. Numer. Anal. Methods Geomech. 2003, 27, 1207–1226. [Google Scholar] [CrossRef]
  34. Polojärvi, A.; Tuhkuri, J.; Pustogvar, A. DEM simulations of direct shear box experiments of ice rubble: Force chains and peak loads. Cold Reg. Sci. Technol. 2015, 116, 12–23. [Google Scholar] [CrossRef]
  35. Bueno Esposito, M.; Díaz-Vilariño, L.; Martínez-Sánchez, J.; González-Jorge, H.; Arias, P. 3D reconstruction of cubic armoured rubble mound breakwaters from incomplete lidar data. Int. J. Remote Sens. 2015, 36, 5485–5503. [Google Scholar] [CrossRef]
Figure 1. Riprap stone geometry simplification and image recognition: (a) Riprap shape simplified; (b) Image processing recognition; (c) Schematic diagram of statistics.
Jmse 11 01331 g001
Figure 2. Three-dimensional laser scanning technology.
Jmse 11 01331 g002
Figure 3. Discrete element model construction.
Jmse 11 01331 g003
Figure 4. Particle gradation of the discrete element model: (a) area division and (b) particle gradation curve.
Jmse 11 01331 g004
Figure 5. Riprap microcosmic simulation: (a) parallel ponding model, (b) rock cracking, and (c) microcrack extension.
Jmse 11 01331 g005
Figure 6. Field test of rubble-mound foundation (in millimeters): (a) vibration compaction and (b) bearing capacity test.
Jmse 11 01331 g006
Figure 7. Numerical simulations of rubble-mound foundation: (a) simulation process and (b) displacement vector diagram.
Jmse 11 01331 g007
Figure 8. Comparison of load–settlement curves.
Jmse 11 01331 g008
Figure 9. Rubble-mound foundations of different thicknesses: (a) 1.6 m, (b) 3.0 m, and (c) 4.5 m. (d) Load–settlement curves.
Jmse 11 01331 g009
Figure 10. Rubble-mound foundations of different particle sizes: (a) 10~25 cm, (b) 15~30 cm, (c) 20~40 cm, and (d) 25~45 cm. (e) Load–settlement curves.
Jmse 11 01331 g010
Figure 11. Rubble-mound foundations of different riprap gradations: (a) Group 1, (b) Group 2, and (c) Group 3. (d) Load–settlement curves.
Jmse 11 01331 g011
Figure 12. Rubble-mound foundations of different vibration times: (a) 30 s, (b) 45 s, (c) 60 s, (d) 75 s, and (e) 90 s. (f) Load–settlement curves.
Jmse 11 01331 g012
Figure 13. Rubble-mound foundations of different vibration amplitudes: (a) 100 kPa, (b) 120 kPa, (c) 140 kPa, (d) 160 kPa, and (e) 180 kPa. (f) Load–settlement curves.
Jmse 11 01331 g013
Figure 14. Rubble-mound foundations of different vibration frequencies: (a) 16 Hz, (b) 21 Hz, and (c) 30 Hz. (d) Load–settlement curves.
Jmse 11 01331 g014
Figure 15. Compactness and settlement value of rubble-mound foundation under the influence of riprap properties.
Jmse 11 01331 g015
Figure 16. Compactness and settlement value of rubble-mound foundation under the influence of vibration properties.
Jmse 11 01331 g016
Table 1. Riprap stone size distribution.
Particle Size (cm)10~1212~1414~1616~1818~2020~2222~2424~2626~2828~30
Number60523941332521121510
Occupied rate (%)19.4816.8812.6613.3110.718.116.833.904.873.25
Table 2. Microcosmic parameters of riprap particles.
Microcosmic ParametersRiprap
Density (kg/m3)2.75 × 103
Effective modulus (MPa)2.3 × 10³
Stiffness ratio2.0
Parallel bonding tangential stiffness (MPa/m)2.3 × 104
Parallel bonding normal stiffness (MPa/m)4.2 × 104
Normal bonding strength (MPa)1.85 × 10²
Tangential bonding strength (MPa)1.1 × 10²
Table 3. Comparison of test and simulation results.
GroupThickness (m)Time (s)Maximum Settlement (cm)Vibration Compactness Rate (%)
A-1 (simulation)1.660−30.5719.11
A-1 (test)1.660−29.4418.40
A-2 (simulation)1.675−35.1221.95
A-2 (test)1.675−34.52 21.58
Table 4. Bearing characteristic parameters of rubble-mound foundation.
FactorsVariablesInitial CompactnessCompactness after VibrationInitial Thickness
(m)
Settlement
(cm)
Ultimate Bearing Capacity
(kN)
Vibration time30 s0.5250.5633.0−21.4101550
45 s0.5250.5643.0−24.8311586
60 s0.5250.5653.0−28.3931672
75 s0.5250.5713.0−33.9571689
90 s0.5250.5723.0−38.5071741
Vibration amplitude100 kPa0.5250.5633.0−12.369924
120 kPa0.5250.5673.0−15.4881196
140 kPa0.5250.5653.0−19.3931355
160 kPa0.5250.5723.0−22.4431591
180 kPa0.5250.5713.0−30.6821794
Foundation thickness1.6 m0.5000.5501.6−20.7361521
3.0 m0.5250.5653.0−30.3931514
4.5 m0.5370.5704.5−42.4981518
Riprap gradationGroup 10.5240.5623.0−32.3271456
Group 20.5250.5653.0−43.3931613
Group 30.5260.5653.0−50.2391728
Disclaimer/Publisher’s Note: The statements, opinions and data contained in all publications are solely those of the individual author(s) and contributor(s) and not of MDPI and/or the editor(s). MDPI and/or the editor(s) disclaim responsibility for any injury to people or property resulting from any ideas, methods, instructions or products referred to in the content.

