Article

Adiabatic Blanking: Influence of Clearance, Impact Energy, and Velocity on the Blanked Surface

Fraunhofer Institute for Machine Tools and Forming Technology IWU, 09126 Chemnitz, Germany
*
Author to whom correspondence should be addressed.
J. Manuf. Mater. Process. 2021, 5(2), 35; https://doi.org/10.3390/jmmp5020035
Submission received: 18 March 2021 / Revised: 8 April 2021 / Accepted: 10 April 2021 / Published: 13 April 2021
(This article belongs to the Special Issue Impulse-Based Manufacturing Technologies)

Abstract

:
In contrast to other cutting processes, adiabatic blanking typically features high blanking velocities (>3 m/s), which can lead to the formation of adiabatic shear bands in the blanking surface. The produced surfaces have excellent properties, such as high hardness, low roll-over, and low roughness. However, details about the qualitative and quantitative influence of significant process parameters on the quality of the blanked surface are still lacking. In the presented study, a variable tool is used for a systematic investigation of different process parameters and their influences on the blanked surface of a hardened 22MnB5 steel. Different relative clearances (1.67% to 16.67%), velocities (7 to 12.5 m/s), and impact energies (250 J to 1000 J) were studied in detail. It is demonstrated that a relative clearance of ≤6.67% and an impact velocity of ≥7 m/s lead to adiabatic shear band formation, regardless of the impact energy. Further, an initiated shear band results in the formation of an S-shaped surface. Unexpectedly, a low impact energy results in the highest geometric accuracy. The influence of the clearance, the velocity, and the impact energy on the evolution of adiabatic shear band formation is shown for the first time. The gained knowledge can enable a functionalization of the blanked surfaces in the future.

1. Introduction

The conservation of resources and the saving of energy-intensive process steps is a constant challenge in the field of materials and production technology. Here, adiabatic blanking offers high potential, because it has several technological and economic advantages when compared to other cutting processes, such as laser cutting and conventional or fine blanking [1,2]. The process is lubricant free with short cycle times, very small web widths, and low component deformation [3]. Due to the high blanking speed, the kinetic energy of the tool is strongly localized in the shear zone and therefore almost completely converted into cutting energy. The resulting blanking surfaces feature excellent properties, such as high hardness, low roll-over, and low roughness [4,5]. Due to these properties, time-consuming mechanical reworking and subsequent hardening is avoided, which significantly shortens the process chain.
The adiabatic blanking process typically features tool velocities of >3 m/s [6], local strain rates of >102 s−1, and process times in the magnitude of a millisecond. These conditions cause a local temperature increase in the shear zone, because the generated heat cannot dissipate that quickly especially if the thermal conductivity of the material is only moderate. As a consequence, quasi-adiabatic or, in simplified terms, adiabatic behavior is forced. The local heating leads to thermal softening and a locally reduced strength followed by an enhanced strain localization in these areas. This self-reinforcing process of thermal softening and strain localization leads to the formation of an adiabatic shear band (ASB) in the shear zone [7,8].
The microstructure and properties of ASBs directly depend on the deformation and strain rate [9] and the bands are classified into deformation and transformation shear bands [10]. Deformation shear bands exhibit a pronounced strain localization without phase transformation. They represent a precursor to transformation shear bands, which are narrower than deformation shear bands and clearly separated from the surrounding microstructure [11]. The microstructure in transformation shear bands is nano-crystalline [12], thus influencing the local material properties in the shear band. It appears as a bright band when observed under an optical microscope, due to a higher chemical resistance to the etchant [13]. According to Nesterenko et al. [14], this microstructural transformation is caused by dynamic recrystallization under compressive or shear stress. High elastic energy in the material (typically coupled to high strain hardening) leads to a much easier initiation of the ASB [15,16] and furthermore to a blanked surface of higher quality. Therefore, the technology is particularly suitable for high-strength and ultra-high-strength steels, such as the manganese-boron press-hardening steels used primarily in automotive applications.
Schmitz et al. [4] identified dynamically recrystallized microstructures on a 20MnB5 and a C75S steel after adiabatic blanking and showed that the ASB has a significantly higher hardness than the surrounding microstructure and a brittle character. This results in material failure almost always occurring directly in the shear band [17,18]. The investigations by Schmitz et al. [4] demonstrated that adiabatic blanking can lead to the formation of an S-shaped blanking surface, especially if materials with high rate sensitivities m are regarded.
Due to the extreme stress and temperature conditions in the shear zone during adiabatic blanking [19], the numerical prediction of the formation of the blanking surface is very complex. Most approaches use the Johnson–Cook damage model [4,20], which considers material specifications at very high strain rates and temperatures for sufficiently accurate modeling. The required material data can be determined, e.g., via Split–Hopkinson pressure bar tests for strain rates of up to 103 s−1 and temperatures of up to 1000 °C [21]. An alternative approach allowing strain rates of up to 104 s−1 uses a test setup with an electromagnetically accelerated punch (up to 50 m/s) and subsequent inverse numerical simulation [22]. However, experimental tests with varying process parameters are indispensable for validating the numerical simulation.
In summary, adiabatic blanking has high potential to influence the local microstructure of the blanked surfaces and thus the blanked surface properties of ultra-high-strength steel sheets in a target-oriented manner. The sophisticated exploitation of the adiabatic effect can enable the blanking of sheet metal, which currently must be laser cut, resulting in long process duration and high processing costs. However, for a target-oriented design of the adiabatic blanking process, detailed knowledge about the qualitative and quantitative influences of adjustable process parameters on the process and the resulting quality properties of the blanked part is necessary. It is well known that the initiation and propagation of ASB requires a compressive or shear stress state or a combination of both [23] and that in adiabatic blanking, the stress state in the shear zone can be varied by adjusting the clearance. Furthermore, it is obvious that the tool speed and impact energy mainly determine the strain rate during the process. However, there is still a lack of systematic studies investigating the influence of these parameters on the resulting blanked surface. Therefore, the presented study focuses on identifying and quantifying these correlations. Thus, it contributes to understanding ASB formation specifically as a function of different process parameters (clearance, impact energy, and impact velocity) on shear band initiation and blanking surface geometry. The focus is on analyzing the qualitative and quantitative influence of the process parameters on the properties of the produced blanked surface and the utilization of this surface as a potential functional area.

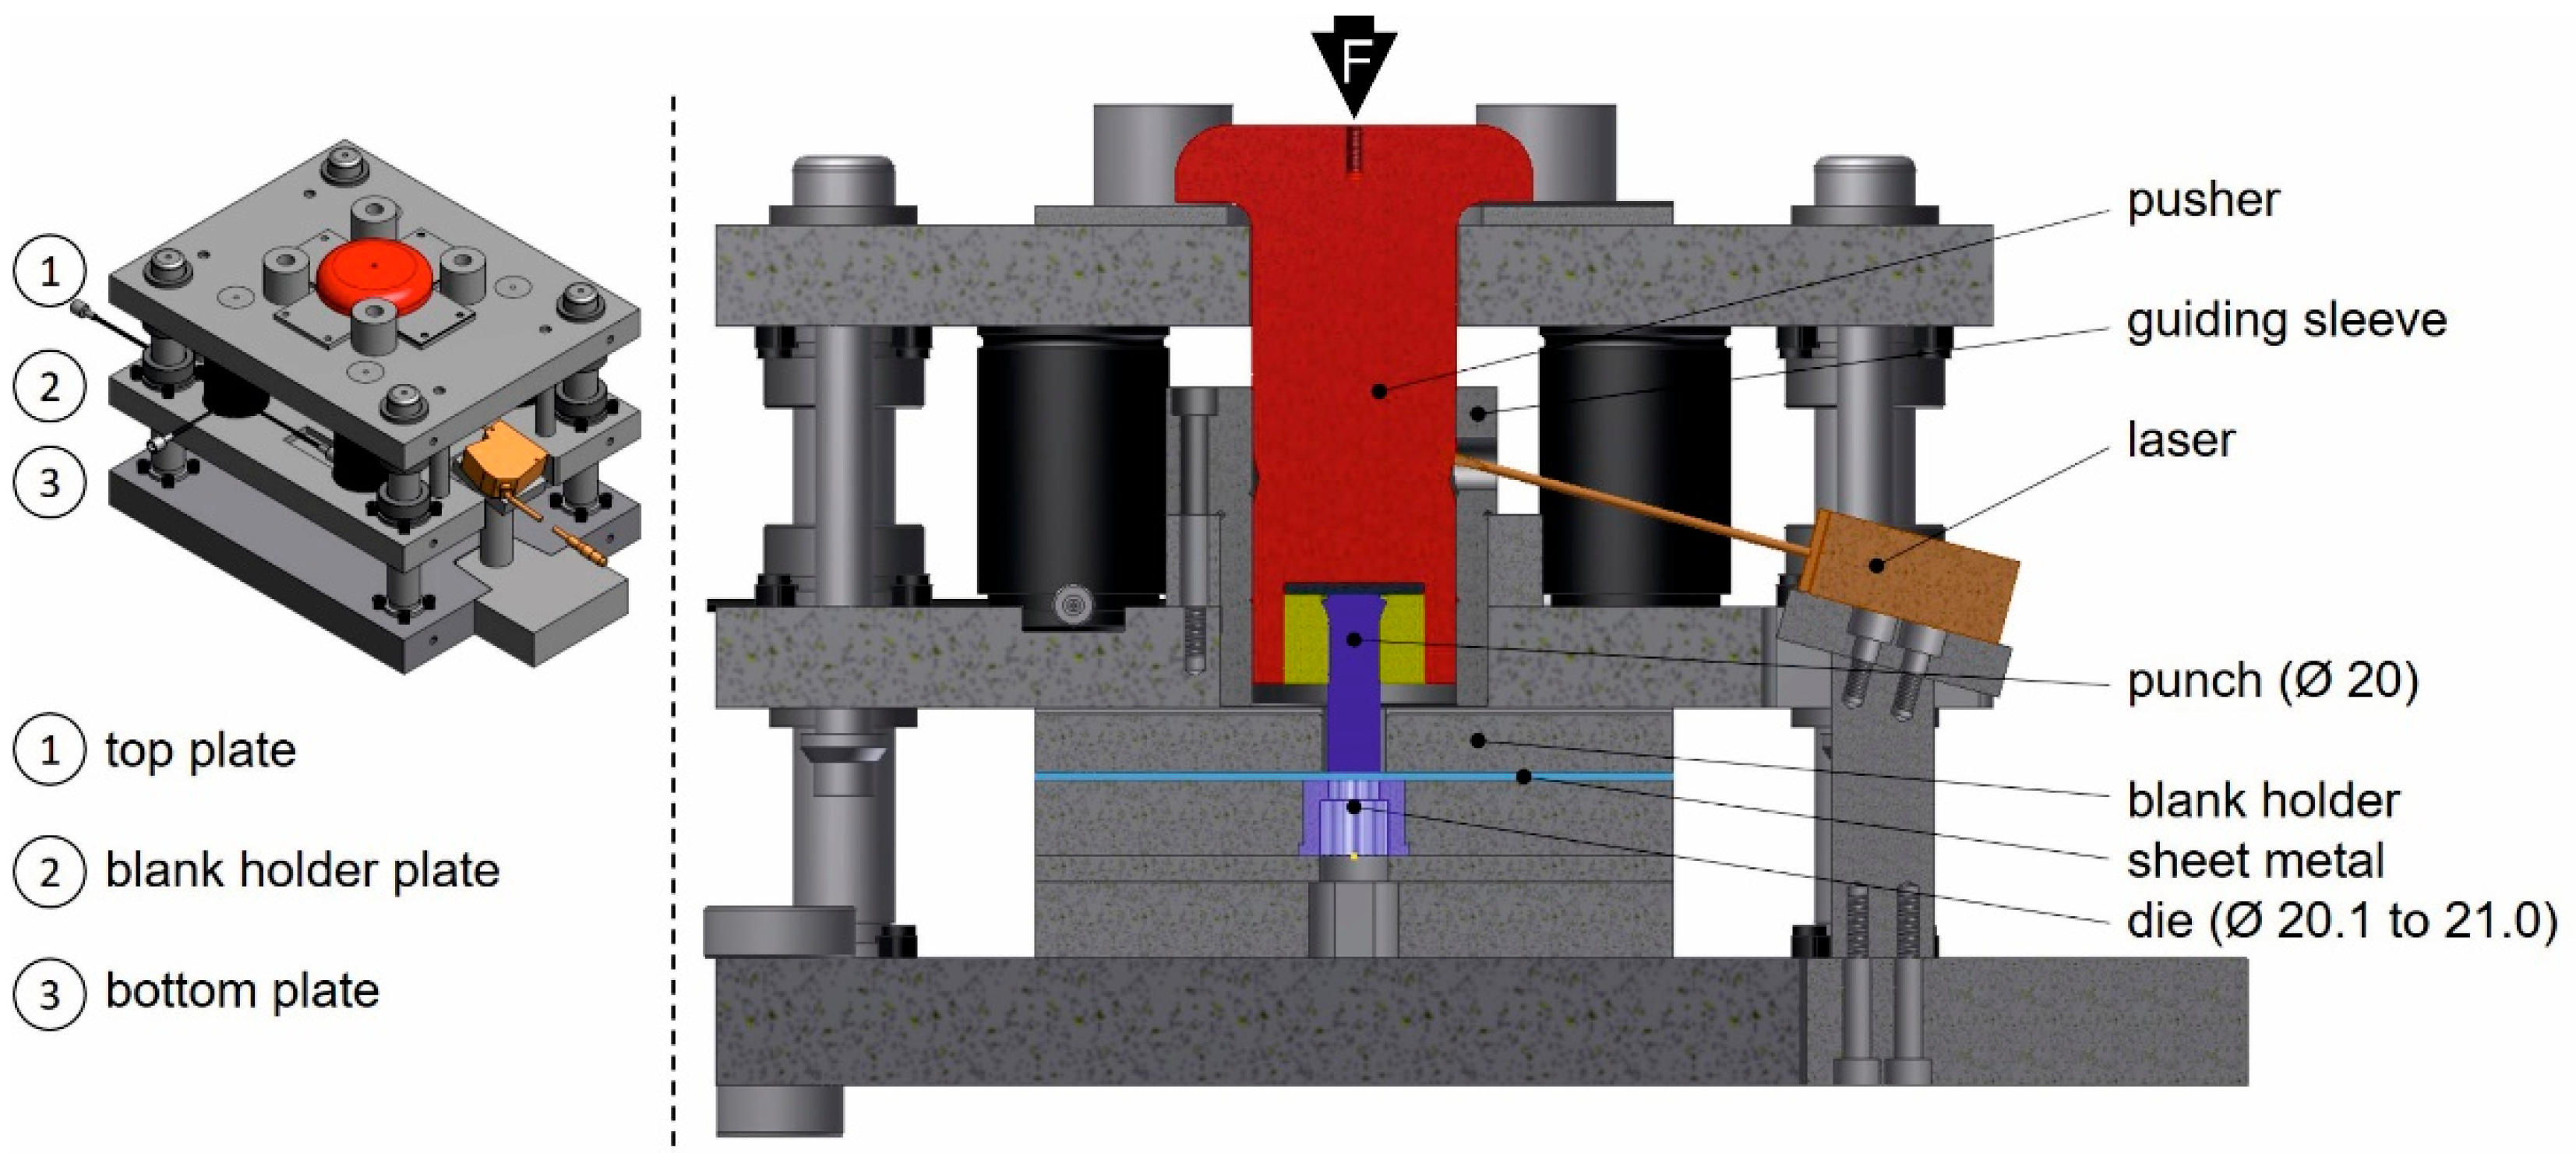
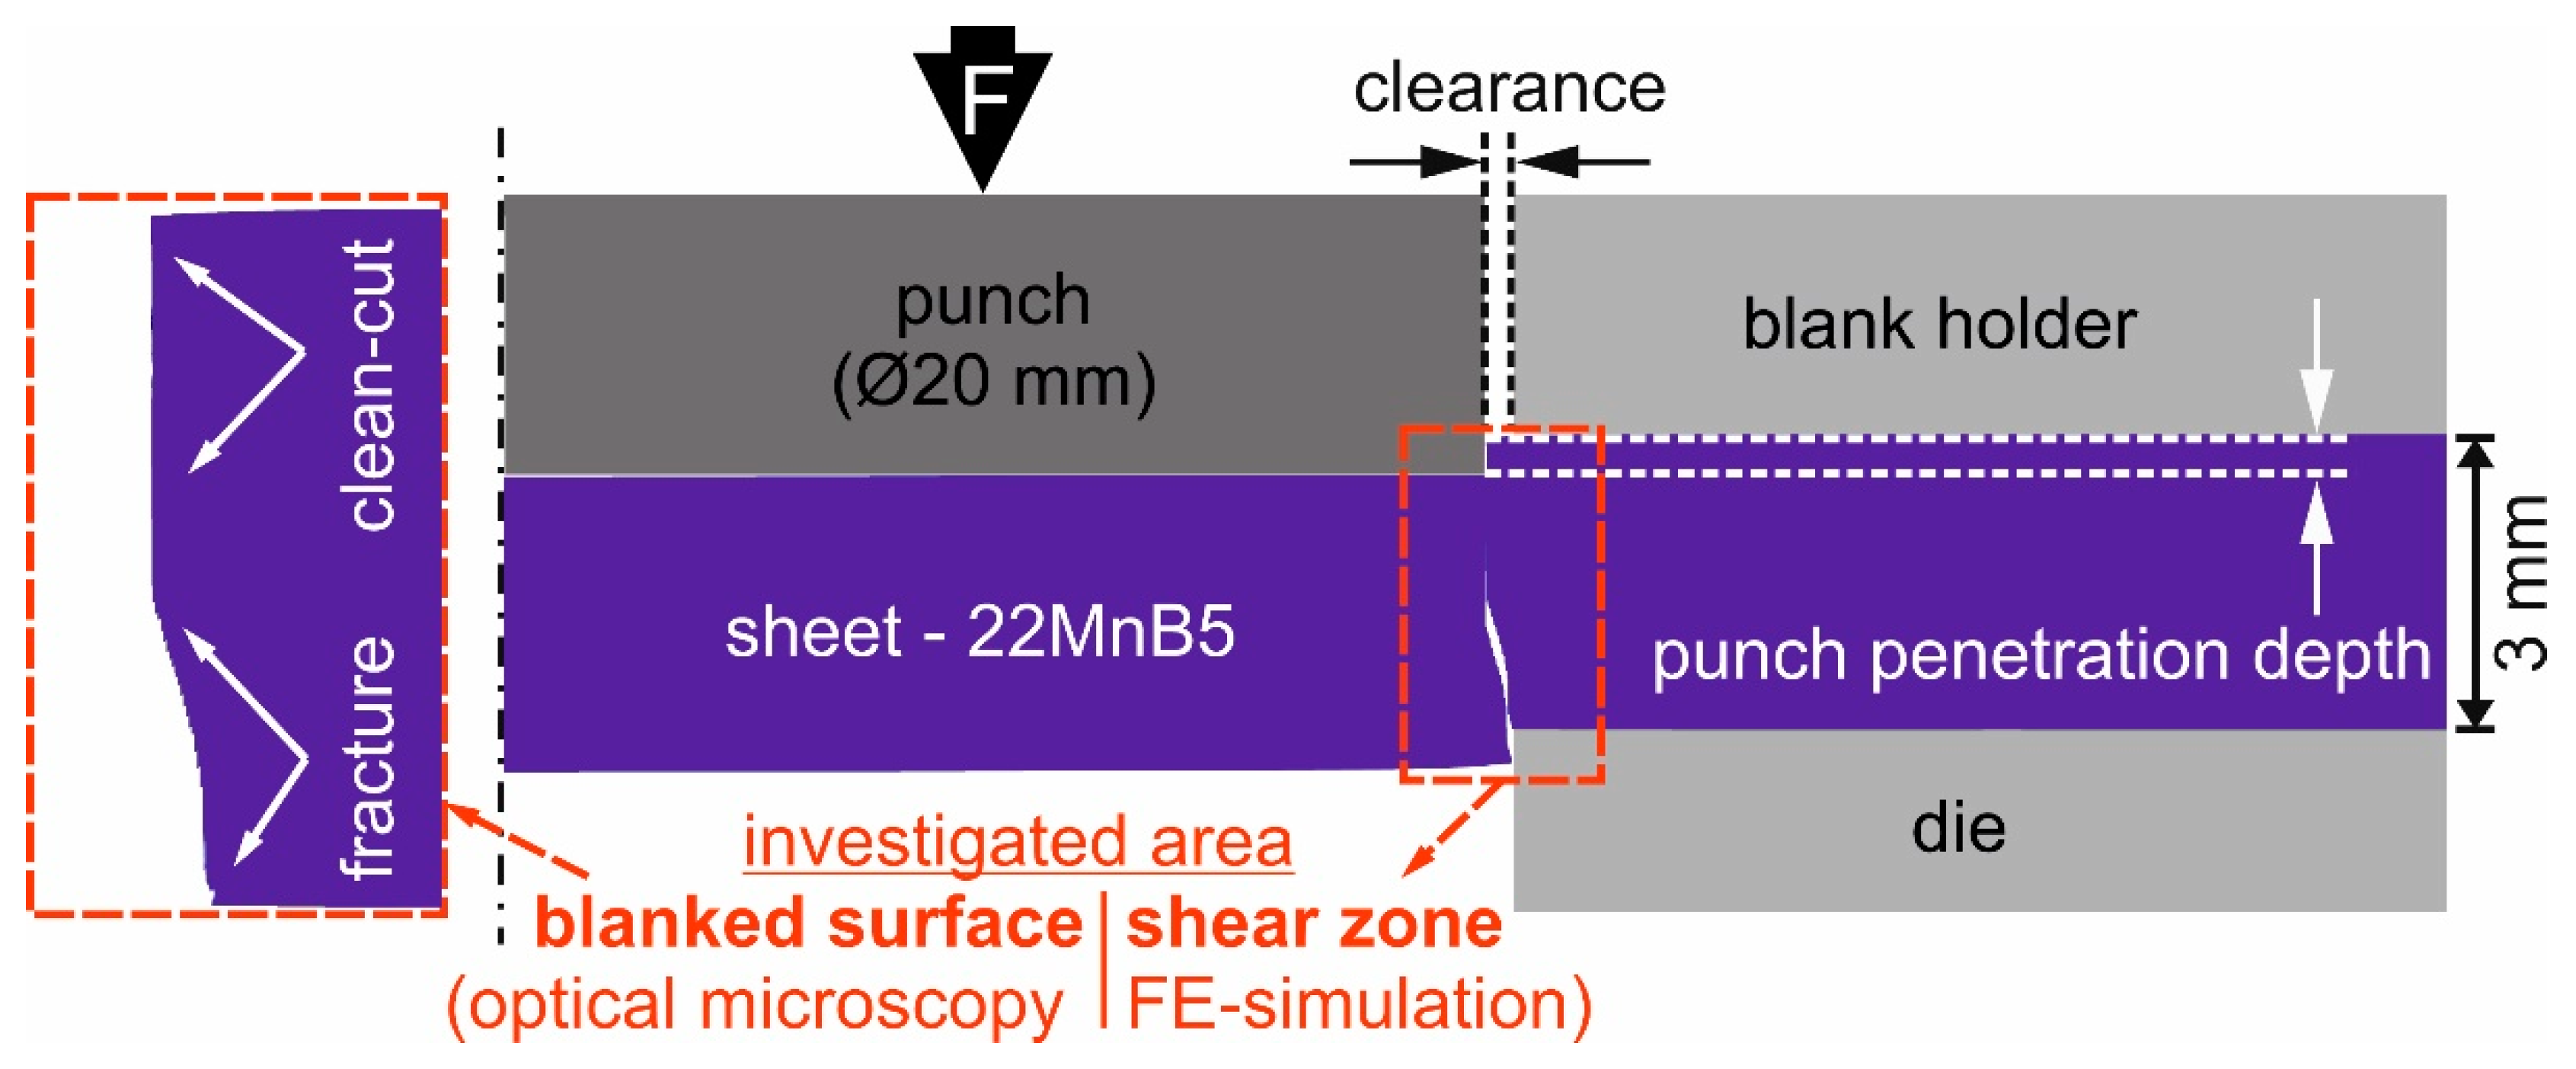
2. Materials and Methods

For the investigation, the press hardening steel 22MnB5 (chemical composition in Table 1) in sheet form was used. The sheet thickness was 3 mm, and the width of the sheet strips was 50 mm. The material was hardened to 430 ± 8 HV10. The heat treatment was carried out under an active carbon gas atmosphere with a carbon content of 0.2%, so that decarburization could be reduced to a minimum.
The blanking tests were performed using an ADIAflex® adiabatic blanking machine from MPM France (formerly ADIAPRESS). A 15-kg striking unit is accelerated to various speeds via high-speed hydraulics. This allows for variation of the impact energy introduced into the tool. The energy was varied from 250 J to 1000 J in 250-J steps. The principal setup of the tool specially designed for the investigations and used in the experimental tests is illustrated in Figure 1. The process starts when the striker unit (not depicted in Figure 1) impacts the so-called pusher (mushroom-shaped, Toolox44 steel from SSAB, m = 9.95 kg, shown in red in Figure 1). A powder metallurgical steel CPM Rex76 punch (blue, Figure 1) with a diameter of 20 mm is screwed and therefore firmly integrated into the pusher and stands directly on the sheet to be blanked. The maximum punch penetration depth was 2 mm (defined in Figure 2). The die (light blue, Figure 1) is located under the sheet. Different dies were used (Ø 20.1 to 21.0 mm) to vary the blanking clearance from 0.05 mm to 0.5 mm. The used dies and the resulting clearance (absolute value and relative value, referring the clearance to the sheet thickness) are shown in Table 2. The blank holder force was 100 kN. The displacement of the pusher was recorded during the process by an LK-H157 Ultra High Speed High Precision Laser Displacement Sensor (brown, Figure 1) from KEYENCE. The corresponding pusher velocity was calculated by differentiating the measured displacement over time curve.
In addition to the tests with the described steel pusher, further experiments were carried out using a pusher made of the aluminum alloy EN AW‑7075 with identical dimensions and a mass of m = 3.44 kg. This allowed for investigating the influence of a tool velocity increase in the system, with identical impact energy of the striker unit. Due to the lower mass and constant impact energy, the velocity must increase during blanking according to the conservation of momentum. This effect was investigated on an exemplary relative clearance of 10% (die Ø 20.6 mm). After the blanking tests with different parameter sets, the blanked surfaces of the sheets were examined and evaluated by optical microscopy. The used optical microscope was the BX53 from Olympus.
According to [9,23], the local stress state in the shear zone is important for the formation of adiabatic shear bands and significantly influences the blanked surface topography. Higher local compressive stresses inhibit cracking and enable the material to plastically flow for a longer period of time. In order to determine the influence of the clearance on the stress triaxiality, numerical simulations of the adiabatic blanking process were performed. The finite element simulation was carried out with the explicit solver of LS-DYNA (DYNAmore GmbH). The 2-D axisymmetric model illustrated in Figure 2 was used. The punch, blank holder, and die were modelled as rigid bodies, while the sheet was considered to be deformable. The punch velocity was assumed to be 10 m/s, and the blank holder force and the coefficient of friction were set to 10 kN and µ = 0.15, respectively. The mesh size was 0.01 mm in the shear zone. The damage in the shear zone was calculated using the Johnson–Cook model Equation (1). The required material constants A, B, C, n, k, the heat conductivity λ (at room temperature), and the strain rate sensitivity m were taken from Schmitz et al. [4] and are listed in Table 3. The other parameters in the Johnson–Cook model are the effective plastic strain ε ¯ , the effective strain rate ε ¯ ˙ , the reference strain rate ε ¯ ˙ 0 , the room temperature T r o o m , and the melting point T m e l t . The stress triaxiality in the shear zone (Figure 2, red marking) was investigated for two exemplary blanking clearances (Ø 20.2 and 20.6) and different punch penetration depths:
σ ¯   =   [ A + B ε ¯ n ] · ( 1 + C · l n ( ε ¯ ˙ ε ¯ ˙ 0 ) ) · ( 1 ( T T r o o m T m e l t T r o o m ) k )

3. Results and Discussions

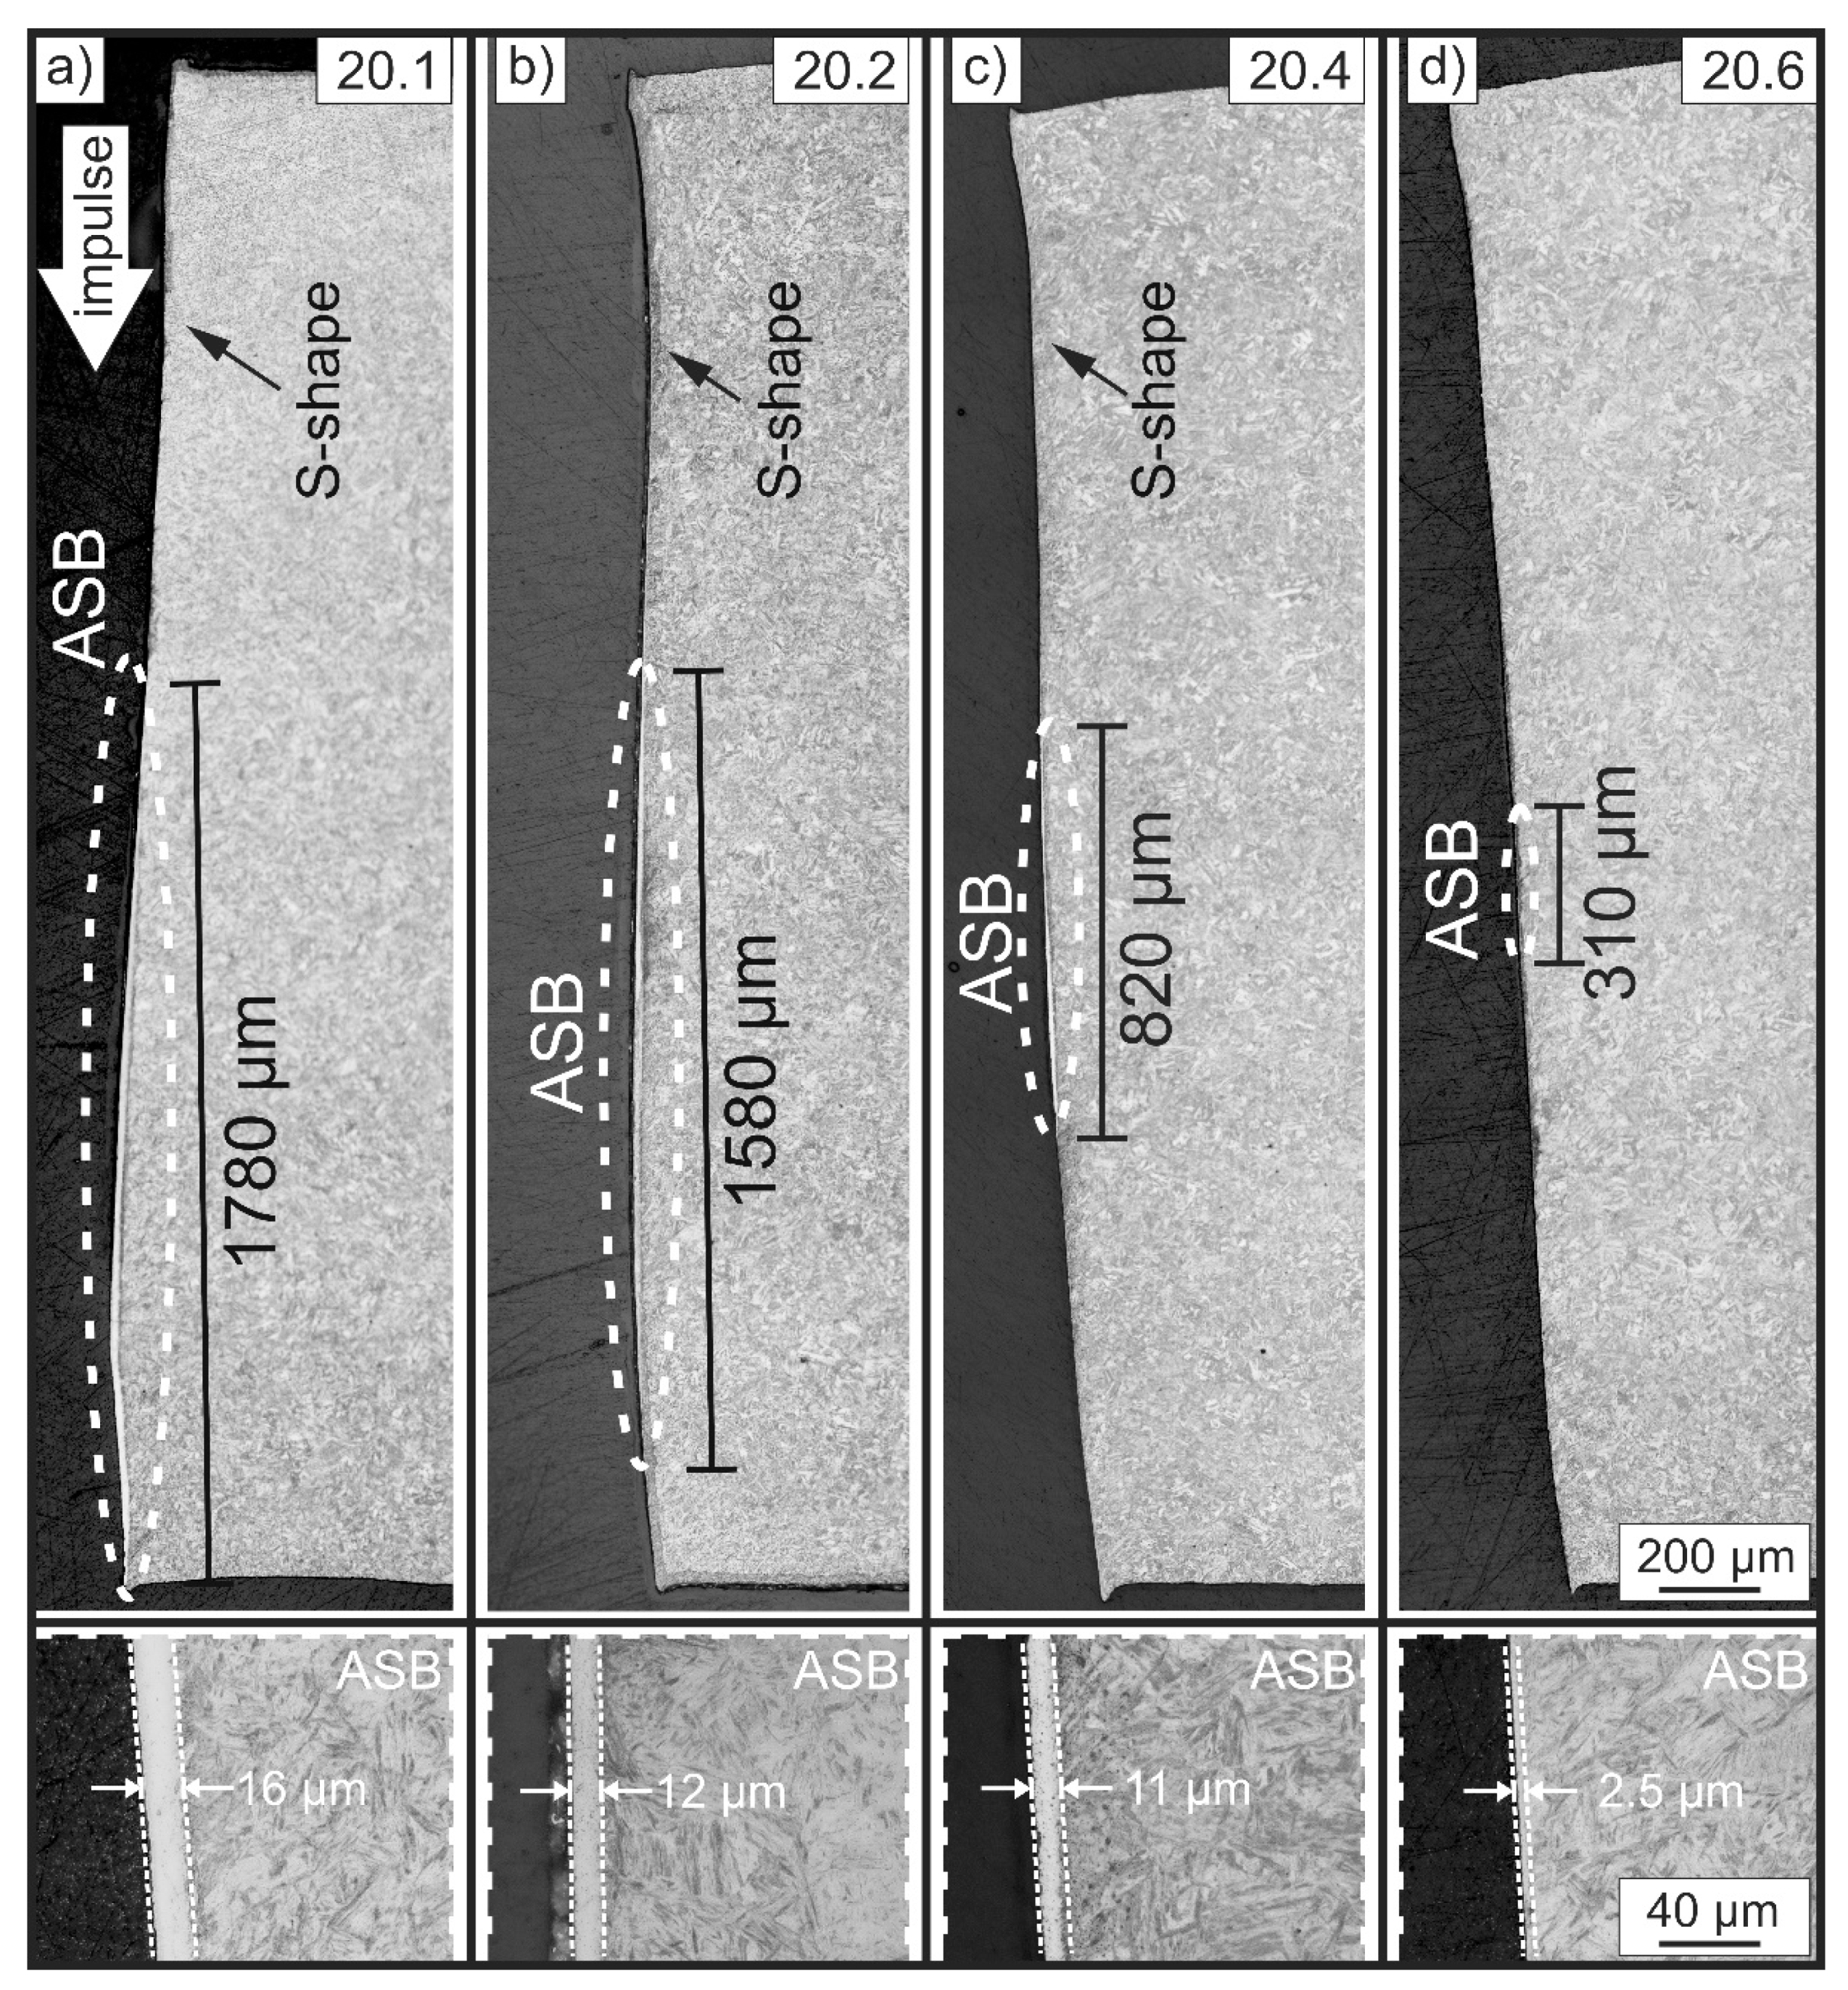
3.1. Influence of the Clearance on the Adiabatic Shear Band Initiation and the Blanked Surface Geometry

Figure 3 illustrates the influence of the blanking clearance on the microstructure of the blanked surface by comparing micrographs of the specimens, which were adiabatically blanked using an impact energy of 1000 J and varying the die diameters of 20.1 mm to 20.6 mm, which corresponds to a variation of the relative clearance between 1.67% and 10% (see Table 2). For larger clearances, no adiabatic shear bands were detected and therefore the corresponding specimens are not shown.
The bright lines on the surface indicate the typical nano-crystalline microstructure of a transformation shear band as explained in Section 1. It is obvious that the smallest blanking clearance resulted in the longest and widest adiabatic shear band (Figure 3a) and that the length and width of the ASB decreases continuously with increasing clearance (Figure 3b–d). It should be noted that the ASB, which was actually formed in the experimental process, was cut lengthwise in the area of most significant thermal softening, i.e., in the middle of the shear band and the blanked surfaces of both the blanked part and punched sheet feature identical halves of the ASB. Thus, the actual with of the ASB is twice as high as the values given in Figure 3, i.e., 32 µm in case of the smallest blanking clearance.
The microstructure near the shear band is almost undeformed in all cases. This is a well-known effect [24] and an advantage of adiabatic blanking. Due to the high local energy input, very limited thermal deformation occurs. The deformation is concentrated directly in the shear zone and thus the deformation in the surrounding microstructure is minimal. Another effect of adiabatic blanking is the change in the shape of the blanked surface. Specimen 20.6 still exhibits a classic fracture surface with minimal clean-cut. In contrast, specimen 20.1, 20.2, and 20.4 show an S-shaped blanked surface without commonly observed roll-over and burr. This phenomenon in correlation with the formation of ASBs was also observed in [4] and explained by the influence of the strain rate sensitivity m of the different investigated materials. However, Figure 3 clearly shows the direct relation of the initiation of the ASB to the resulting blanked surface. The larger the ASB, the more pronounced the formation of an S-shaped blanked edge. Consequently, the initiation of an ASB causes a significant change in the blanked surface.
The micrographs shown in Figure 3 also suggest that the shear band formation is initiated in the center of the respective fracture surfaces. This effect becomes evident, when the blanked surfaces from the largest clearance (10%, sample 20.6, Figure 3d) to the smallest clearance (1.67%, sample 20.1, Figure 3a) are compared. The barely detectable ASB in specimen 20.6 is nearly centered in the blanked surface. If the clearance is reduced further, the ASBs become longer and spread further to the outer edge of the blanked surface. In sample 20.1, the ASB extends almost to the outer edge. Presumably, this effect is a result of the predominantly compressive stresses in the middle region of the shear zone. This is particularly evident in Figure 5a–c, where the stress triaxiality at a relative clearance of 3.34% is depicted and discussed in detail. The outer regions are more dominated by shear stresses, while compressive stresses are more dominant in the center of the blanking surface. According to [14,23], compressive stresses significantly favor shear band formation and are considered as a reason for shear band initiation in the center, while shear stresses are more likely to promote failure.
Figure 4 summarizes the results of the experimental tests concerning the ASB formation in dependence of the clearance and the impact energy. Lower impact energies do not promote the formation of an ASB in the tests with a relative clearance of 10% or more. However, at lower clearances (sample 20.1–20.4), ASB formation already occurs at relatively low impact energies of 250 J. In general, the length and width of the ASB increases with increasing energy. Consequently, the longest ASB can be observed on the specimen produced with the smallest blanking clearance (1.67%) and the highest impact energy (1000 J). In summary, reducing the blanking clearance and increasing the impact energy raise the length and width of the ASB. Thus, blanking clearance and impact energy are dominant factors influencing the formation of the ASB.
To achieve a deeper understanding of the influence of the blanking clearance on the shear band formation, numerical simulations were performed to determine stress triaxiality in the shear zone. According to [14,25], an adiabatic shear band can only evolve under a dominant compressive or shear stress condition. Dynamic recrystallization and the transformation of the initial microstructure to a nanocrystalline structure can only occur under compressive or shear stresses [14]. Contrary, tensile stresses promote crack initiation and consequently failure of the material, thus preventing transformation of the microstructure. Figure 5 shows the stress triaxiality for two exemplary relative clearances (3.34% and 10%) as a function of the punch penetration depth. Even at a low penetration depth, the smaller clearance (Figure 5a) leads to a significantly higher and more concentrated proportion of compressive stresses in the shear zone than the higher clearance (Figure 5e), which consequently promotes shear band formation.
As the penetration depth of the punch progresses, the smaller clearance results in a much higher concentration of compressive and shear stresses in the shear zone. As already mentioned in Figure 3, both specimens, but especially specimen 20.2, exhibit significantly higher compressive stresses in the center of the shear zone than at the edge. This favors the initiation of the ASB in the center of the blanking surfaces observed in Figure 3. The S-shaped formation in the shear zone at the smaller clearance also becomes visible (Figure 5b). The larger clearance leads to a significant distribution and splitting, respectively, of the occurring stresses and to dominating shear stresses in the shear zone. When compared to Figure 5c,g depicts that smaller clearances result in an earlier failure due to the larger concentration of stress. The initiated crack has already grown through more than 50% of the sheet thickness here, while the initiation of the crack has just begun for the larger clearance. Finally, it is noticeable in Figure 5d,h that the tensile stresses occurring in the shear zone are significantly lower when the clearance is reduced. A stronger localization of stresses and, consequently, of deformation and impact energy is more significant at a clearance of 3.34% (20.2) than at a clearance of 10% (20.6). Higher local energy input possibly results in higher local temperature in the shear zone during adiabatic blanking [4,20]. Due to the dynamic recrystallization, the formation of adiabatic shear bands is enabled. Moreover, the necessary proportion of compressive stresses is significantly higher with a reduced clearance and thus supports the formation of the ASB further.

3.2. Influence of Impact Energy and Velocity on the Blanked Surface

In order to vary the velocity independently from the impact energy, an aluminum pusher (EN AW‑7075) was used in addition to the steel pusher. Due to the conservation of momentum, the impact velocity increases during blanking, if the pusher mass is lower and the same impact energy is constant. The tests presented in the following were performed with a relative clearance of 10% and are referred to as samples 20.6 v↑. Due to the identical blanking clearance, these tests were compared with the 20.6 tests with a steel pusher. Figure 6 shows the results of the laser velocity measurement directly at the pusher. Obviously, the velocity increases with increasing impact energy. The specimens 20.6 with the steel pusher showed velocities from 7.2 to 9.7 m/s. As expected, the tests carried out with the aluminum pusher showed a higher impact velocity. Already at an impact energy of 250 J, the measured velocity of 9.8 m/s is higher than the fastest velocity measured during the test series with the steel pusher. With an increase in impact energy, the velocity increases continuously to a maximum of 12.5 m/s. This demonstrates that the speed in adiabatic blanking can be significantly increased by varying the mass of the pusher. The 20.6 v↑ samples reach a maximum velocity that is about 28% higher than the maximum of the samples with the steel pusher.
Regardless of the formation of adiabatic shear bands, the high velocity and especially the impact energy in adiabatic blanking affects the blanked surface in several ways. Figure 7 shows the influence of the impact energy exemplarily on the specimen cut with a die diameter of 20.6 mm and with a relative clearance of 10%, respectively. In this test series, the energy varied between 250 J and 1000 J. All samples show similar blanked surfaces, which exhibit a predominantly fractured surface. The clean-cut fraction seen in the upper part of the blanked surface is less than 100 µm for all specimens. In the 750 J impact energy sample, it is almost non-existent. The S-shaped surface, as shown by the specimens with smaller clearances (see Figure 3a–c), cannot be observed with a 10% relative clearance, regardless of the impact energy. On the contrary, the fracture surface of the specimens is very straight but inclined. It is clearly visible that the angle α between the fracture surface and the normal to the sheet surfaces becomes smaller with increasing impact energy. In case of the specimen cut with an impact energy of 250 J, the angle α amounts to 8°, while the specimen cut with an impact energy of 1000 J features an α of 4.5°. Consequently, the angle is reduced by more than 40% for the largest impact energy due to a significant increase of impact velocity and energy. The displacement measurements in the tool by laser triangulation showed that the velocity in the process increases from about 7.2 m/s for the 250 J sample to over 9.7 m/s for the 1000 J sample (Figure 6). The higher velocity leads to a stronger localization of the deformation in the shear zone. The heat generated during blanking cannot dissipate quickly enough due to the high velocity and the correspondingly short process time, resulting in a very strong local increase in temperature followed by thermal softening of the material. Further deformation takes place in the thermally softened area due to the locally lower flow stress. Thus, strain localization occurs. Consequently, as the velocity increases, the deformed material volume is reduced, and the fracture angle must become smaller. This effect was also observed in [5,26]. For smaller clearances (Figure 3), the higher stress concentration (see Figure 5) and the increased proportion of compressive stresses can lead to shear band initiation, which influences the fracture surface as a result. It must be taken into account that the influence of velocity, energy, and clearance always depends on the material to be blanked and its mechanical, thermal, and microstructural properties.
The effect of the increased velocity is clearly evident in the optical micrographs of the 20.6 v↑ samples in Figure 8. For impact energies of 250 J to 750 J (Figure 8a–c), the combination of speed and energy leads to the formation of an almost vertical blanked surface despite the large relative clearance of 10%. These blanked surfaces have the highest geometric accuracy in the entire parameter space investigated, especially in direct comparison with the specimens of the same clearance in Figure 7a–c. The sample cut with an impact energy of 750 J (Figure 8c) shows a larger deviation from the vertical dotted line in the upper part of the blanked surface compared to those cut with lower impact energies. This seems to be a starting formation of the S-shaped blanked surface, indicating the formation of a shear band, which is only detectable to a limited extent by optical microscopy methods, however (see details in Figure 9b). Figure 8d shows a stronger offset and the occurrence of a fracture angle. This principal shape is similar to the specimens cut with the steel pusher at a correspondingly lower impact velocity (Figure 7d), but the angle is smaller here due to the increased velocity. Although, the blanked surface also has a much wavier (slightly more S-shaped) character than the 20.6 specimen at 1000 J. However, the clear formation of an ASB in the center area of the blanked surface is evident (see Figure 3). This demonstrates again that the initiation of shear band formation changes the geometry and further the quality of the fracture surface. In this case, the ASB forms despite the large blanking clearance due to the increased velocity and the resulting reduced time for heat conduction from the shear zone. When compared to lower velocities, the local temperature increases more significantly and the dynamic recrystallization processes for the transformation of the microstructure can start. However, the impact velocity cannot be discussed separately without considering the impact energy. Above a critical velocity, the energy is the driving force for the microstructural transformation and the resulting surface geometry. Therefore, specimens with identical impact velocities and blanking clearances (e.g., 20.6: 750 J, v = 9.7 m/s and 20.6 v↑: 250 J, v = 9.8 m/s) show different blanking surfaces due to varying energies.
Figure 9 shows that due to the increased velocity, shear band formation is detectable from an impact energy of 500 J (Figure 9a). However, the length of the ASB cannot be analyzed meaningfully at either 500 J or 750 J (Figure 9b), although qualitatively the ASB is slightly longer for the 750 J sample. Both specimens show a jagged ASB, because the thermal softening in the ASB is too low to cause plain failure here. This shows that the parameter set of a blanking clearance of 10%, an impact energy of 500 J, and an impact velocity of 10.6 m/s describes a lower limit for the formation of an adiabatic shear band for this material. Very high-quality and perpendicular blanked surfaces are achieved if the process is carried out just below this limit. The best blanked surfaces were reached for the samples cut with an impact energy of 250 J and 500 J. This clearly shows the different evolutions of the blanking surface as a function of the blanking parameters. The predominant shear band type here is presumably a deformation shear band and not the classical transformation shear band. However, for accurate identification, the blanked surfaces need to be further examined using scanning electron microscopy techniques.
With increasing impact energy and correspondingly increasing impact velocity, the amount of converted microstructure and thus ASB becomes larger. Figure 9c–e show the ASB of the 1000 J sample blanked with the aluminum pusher at a velocity of 12.5 m/s. The length of the ASB was determined to be 730 µm, which is more than 100% longer than the 310-µm-long ASB detected for the specimen cut with the steel pusher using the same impact energy but significantly lower speed (Figure 3d). Furthermore, the increased velocity and temperature in the shear zone lead to a three times thicker ASB due to the facilitated dynamic recrystallization and the resulting transformation of the microstructure [27]. Precisely, the width is 7 µm in case of the specimen cut with the aluminum pusher compared to 2.5 µm in case of the specimen cut with the steel pusher. However, the large blanking clearance and especially the initiated ASB change the quality of the fracture surface to negative due to a fracture angle of α = 4°. If higher velocities and higher energies are used in adiabatic blanking, the formation of an ASB over the whole cross-section of the blanked surface could probably significantly improve the quality further and enhance the cutting surface with unique properties, such as a very high hardness [4].

4. Summary and Conclusions

The presented study systematically investigated the influence of the blanking clearance (relative clearance: 1.67–16.67%), the impact energy (250 J–1000 J), and the impact velocity (7–12.5 m/s) on the adiabatic blanking process of a hardened 22MnB5 steel sheet (3 mm thickness) and on the quality of the resulting blanking surface. Numerical simulation served for determining the stress state during the process and corresponding experiments were carried out. The blanked surfaces were analyzed by optical microscopy.
The investigated blanking parameters were proven to have a significant effect on the geometry of the blanking surface. Certain parameter combinations promote the initiation of ASB. Especially, the blanking clearance, which highly influences the stress triaxiality in the shear zone, is an important factor. Surprisingly, not the blanked surfaces with ASB, but those that are close to forming an ASB showed the highest quality in terms of geometric accuracy. The following key results were determined:
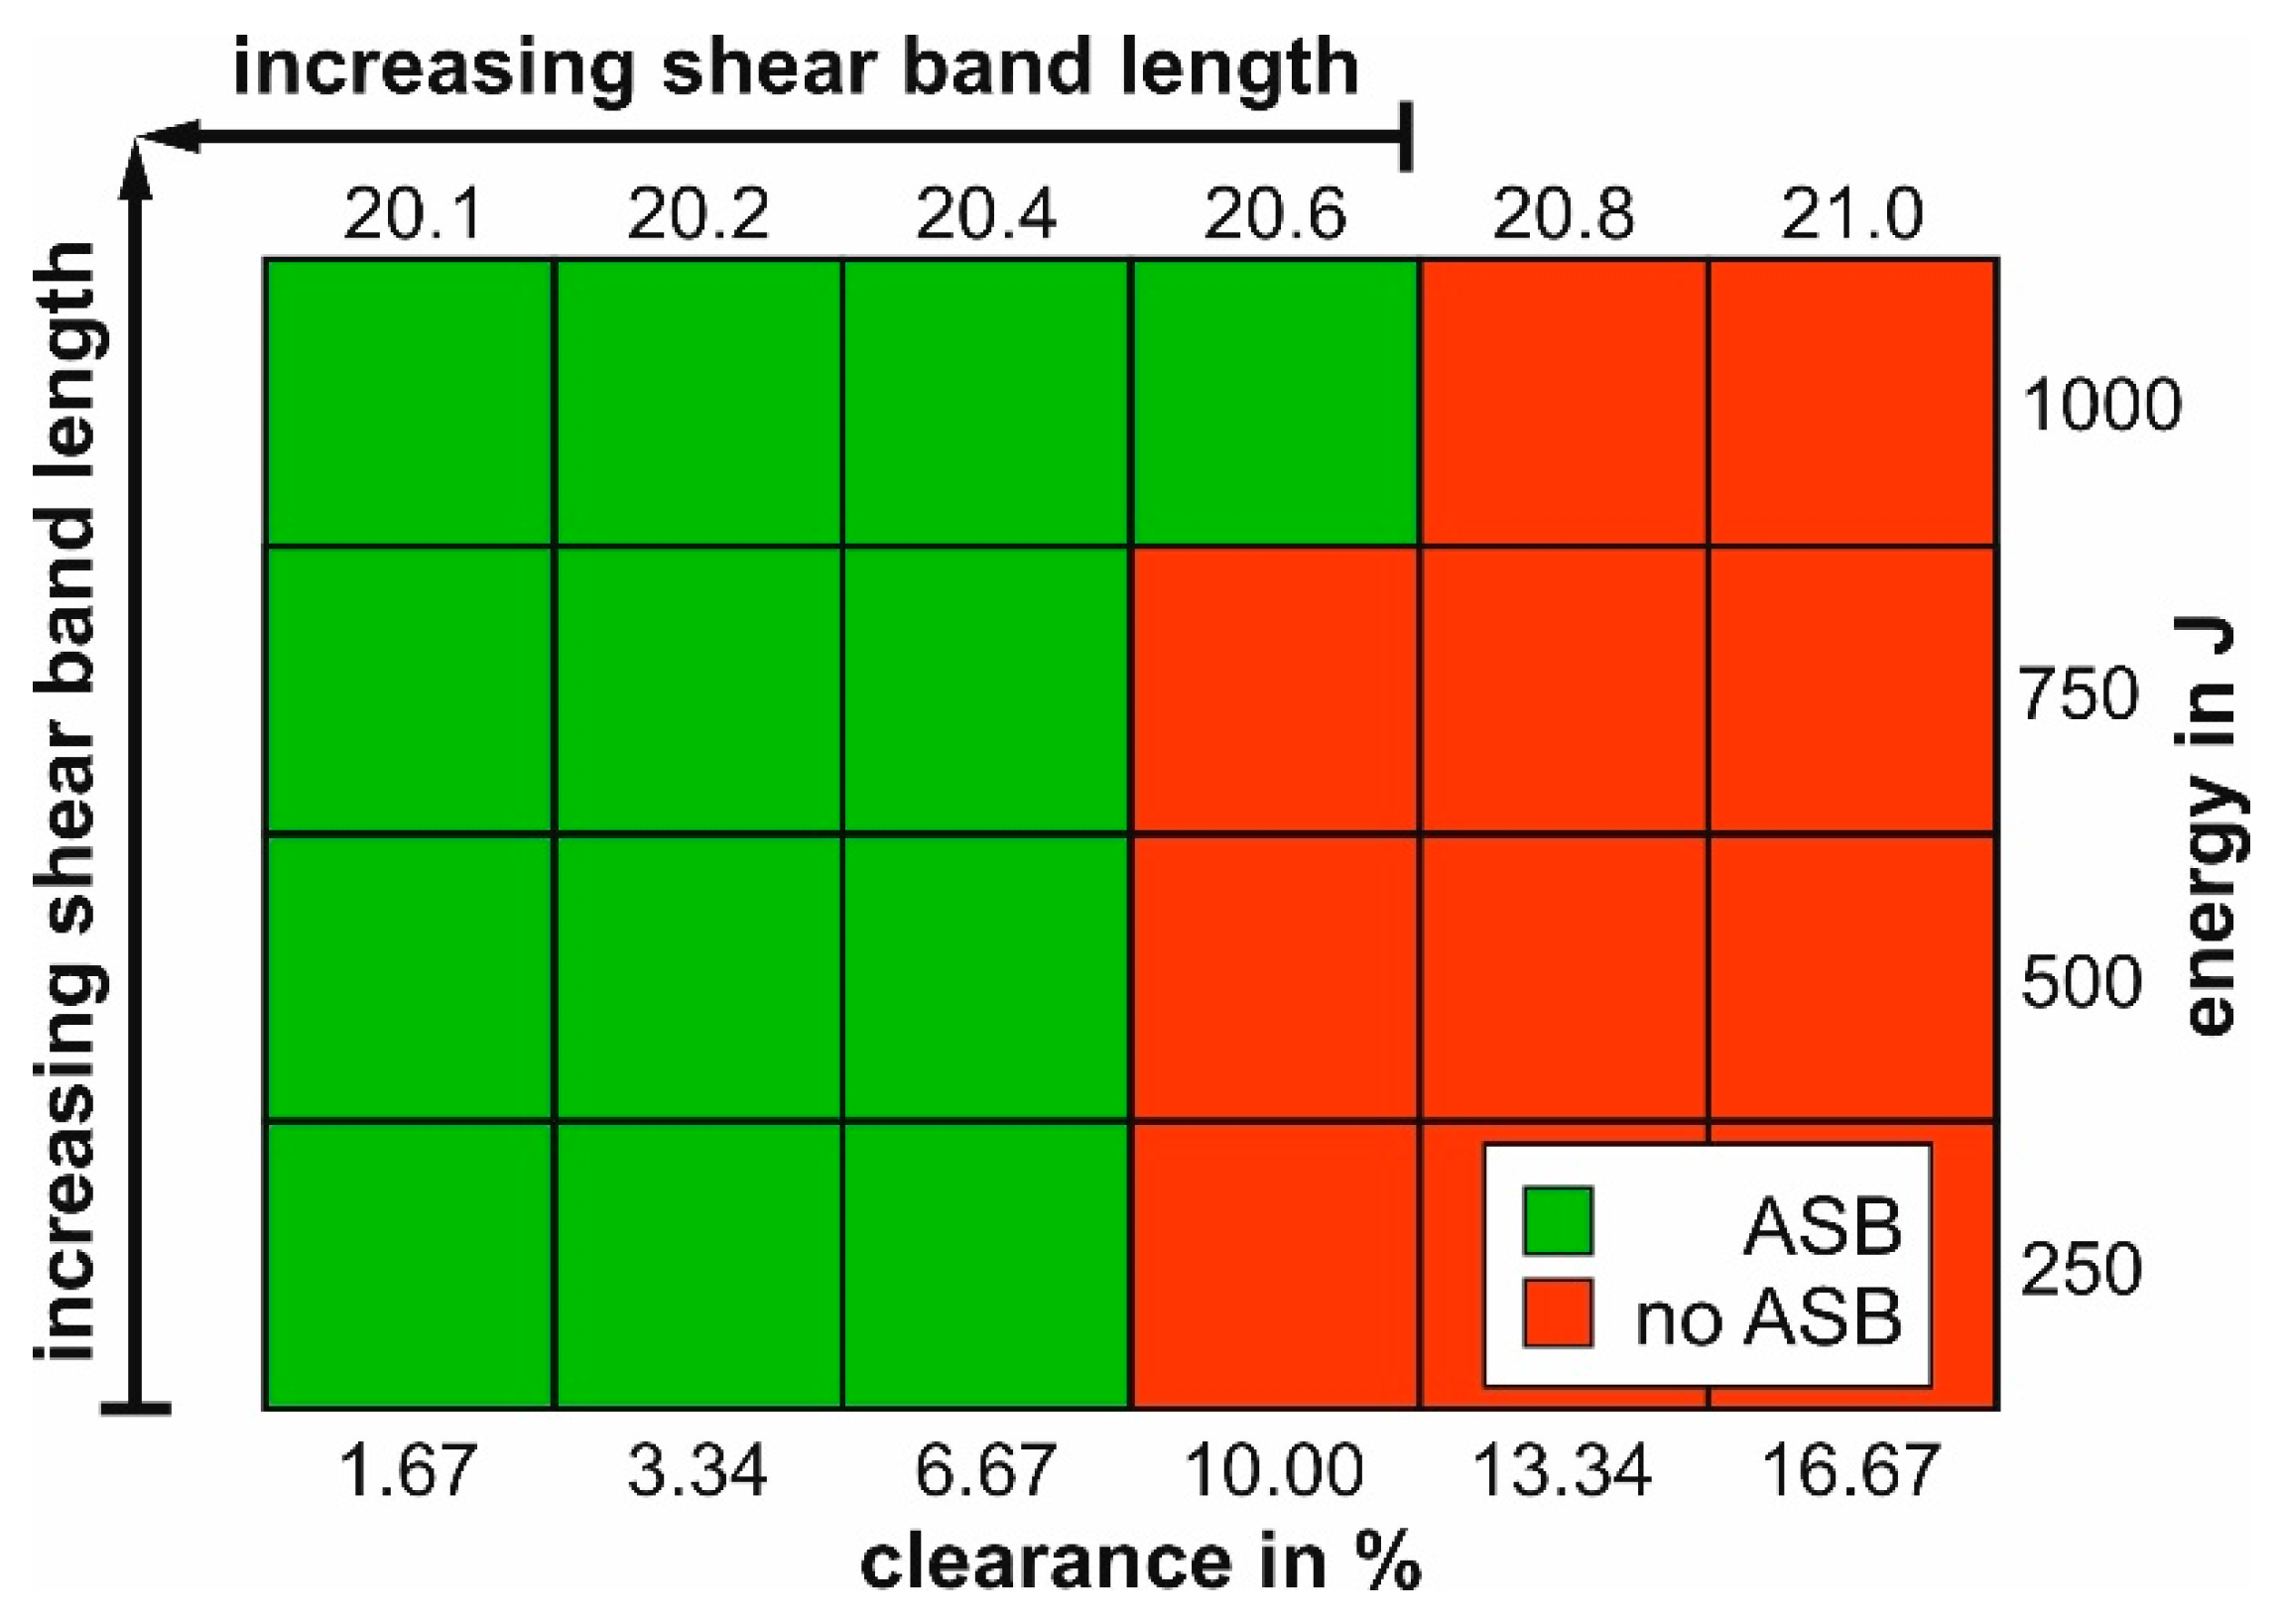
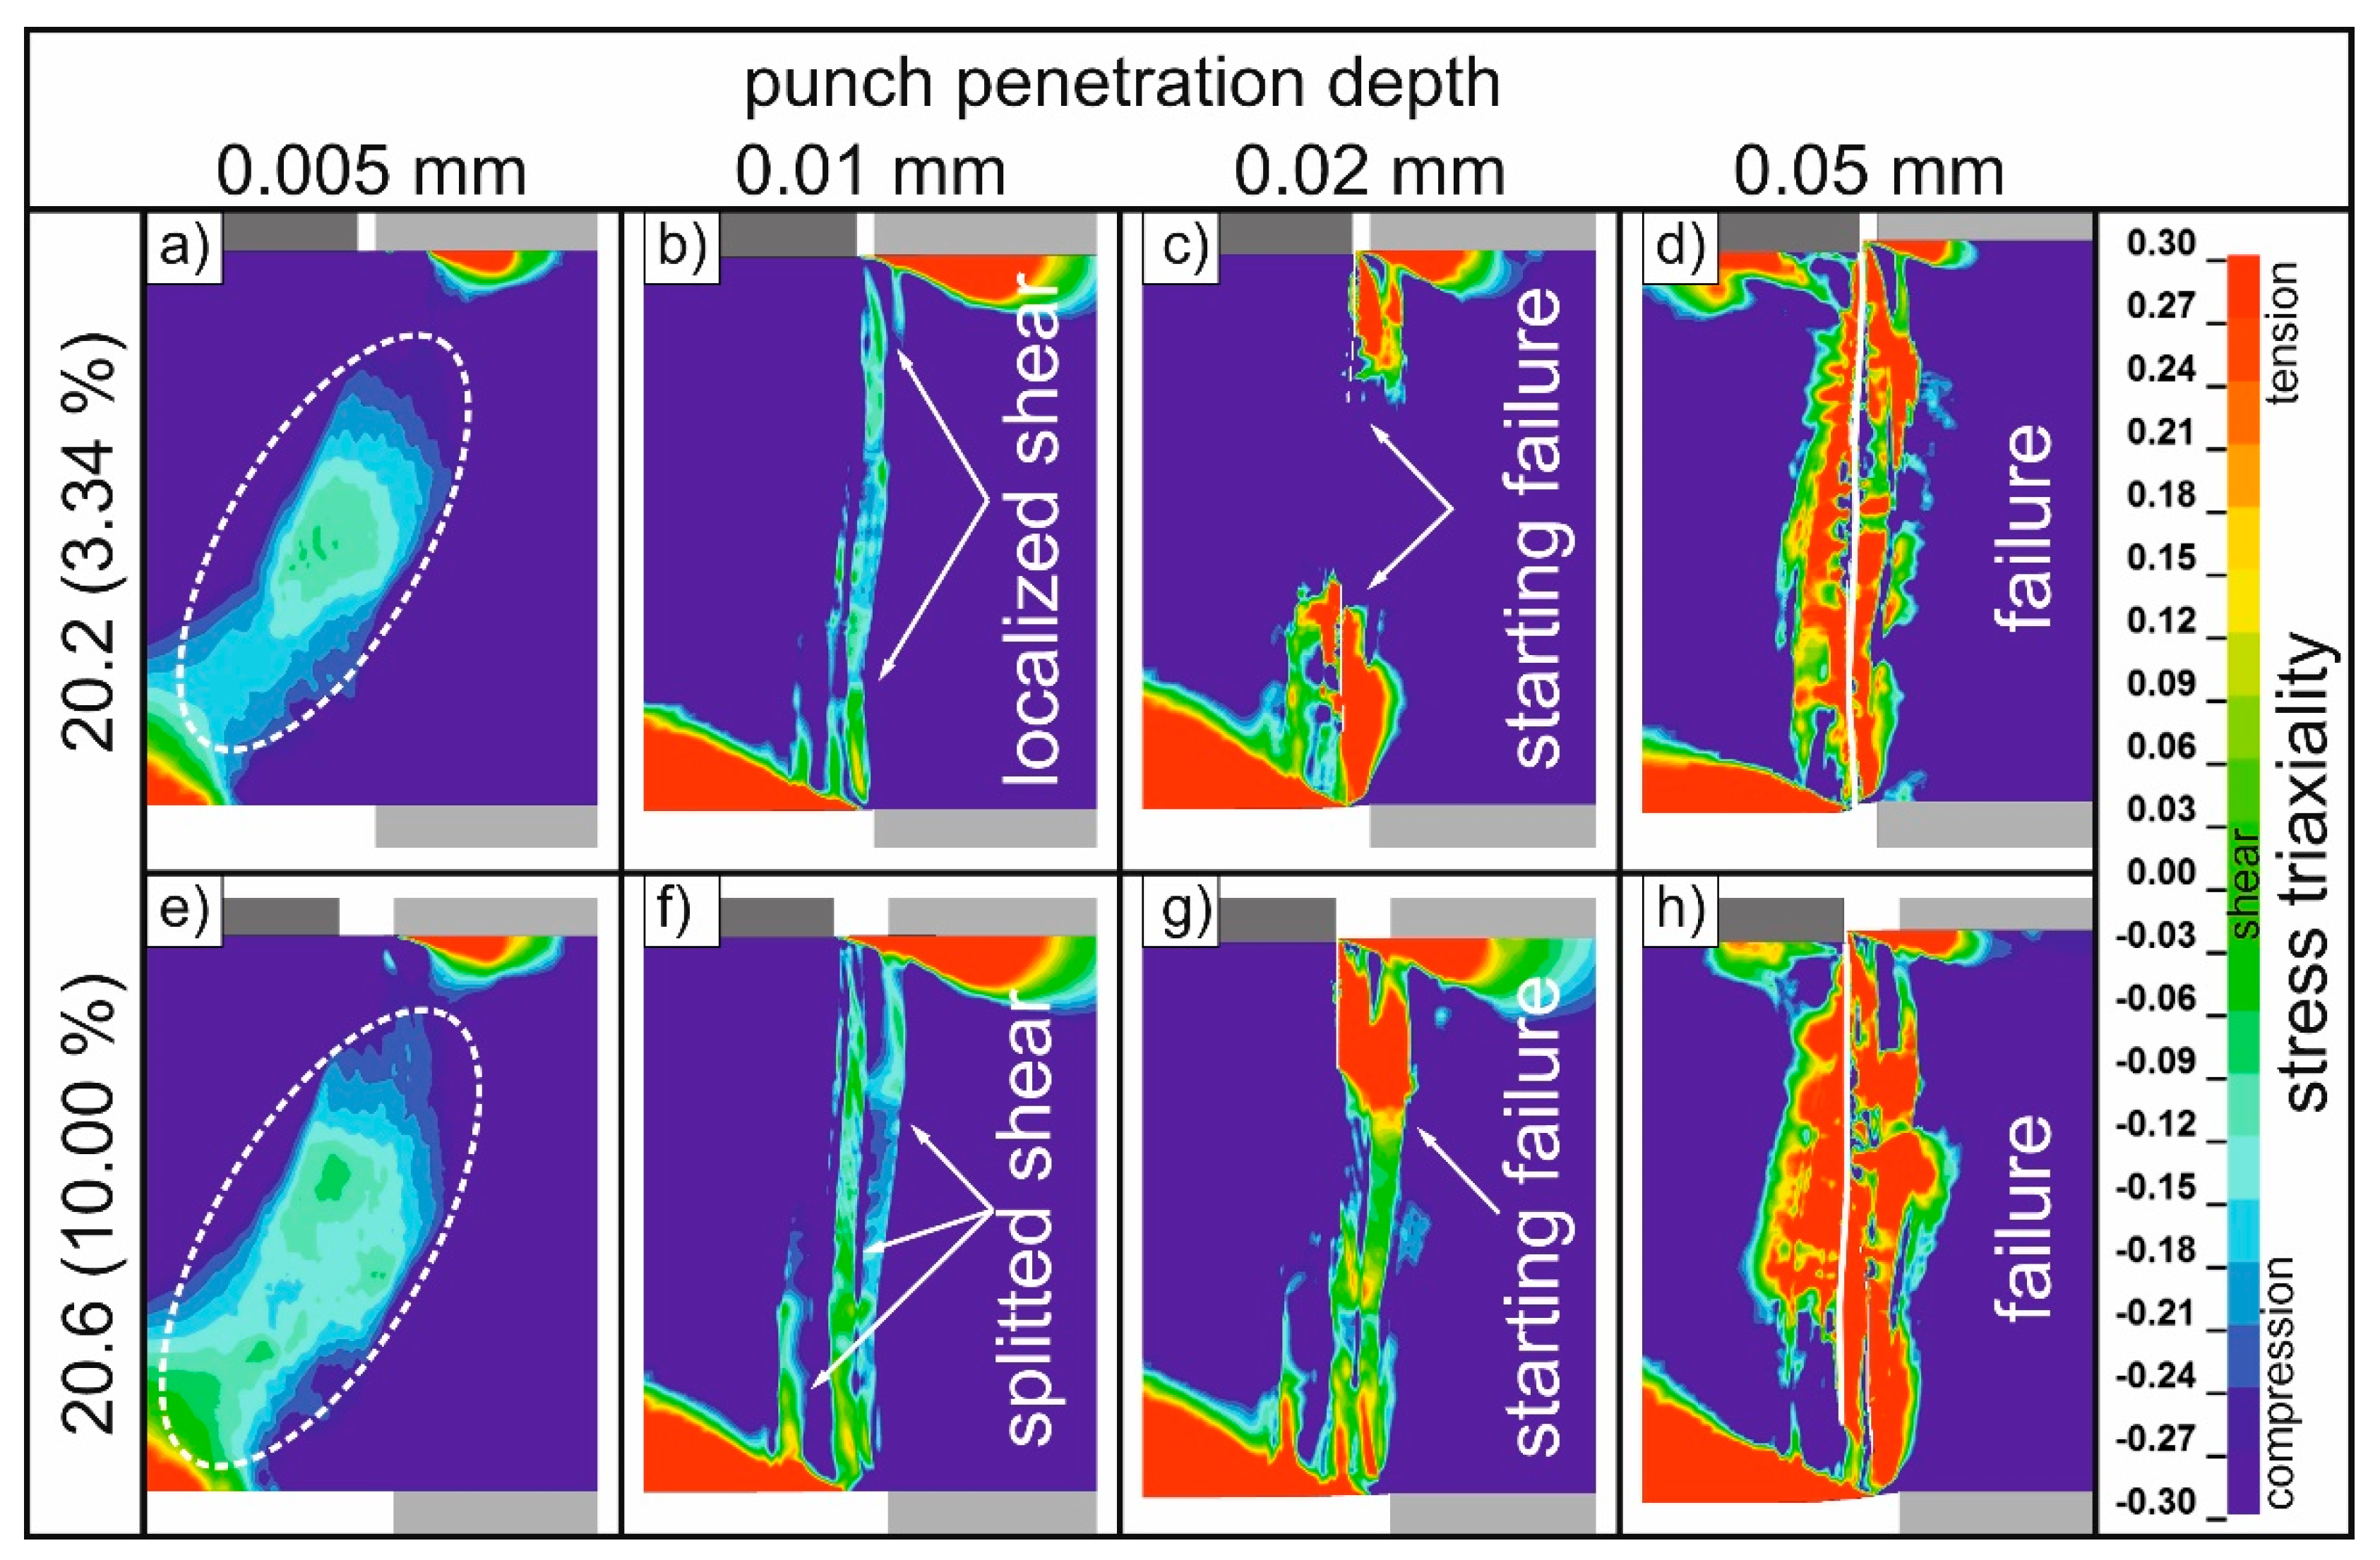
  • If the relative clearance is ≤6.67% and the impact velocity is ≥7 m/s, an ASB is always formed regardless of the investigated impact energies (250 J to 1000 J). A smaller blanking clearance increases the amount of compressive stress in the shear zone, which is necessary for dynamic recrystallization and for the formation of an ASB. For larger clearances, the energy and velocity must be increased to form an ASB. Thereby, the impact velocity cannot be considered separately from the impact energy.
  • The initiation of the ASB is centered in the shear zone in the area of the highest compressive stresses. A smaller blanking clearance, a higher impact energy, and a higher speed result in longer and wider ASB.
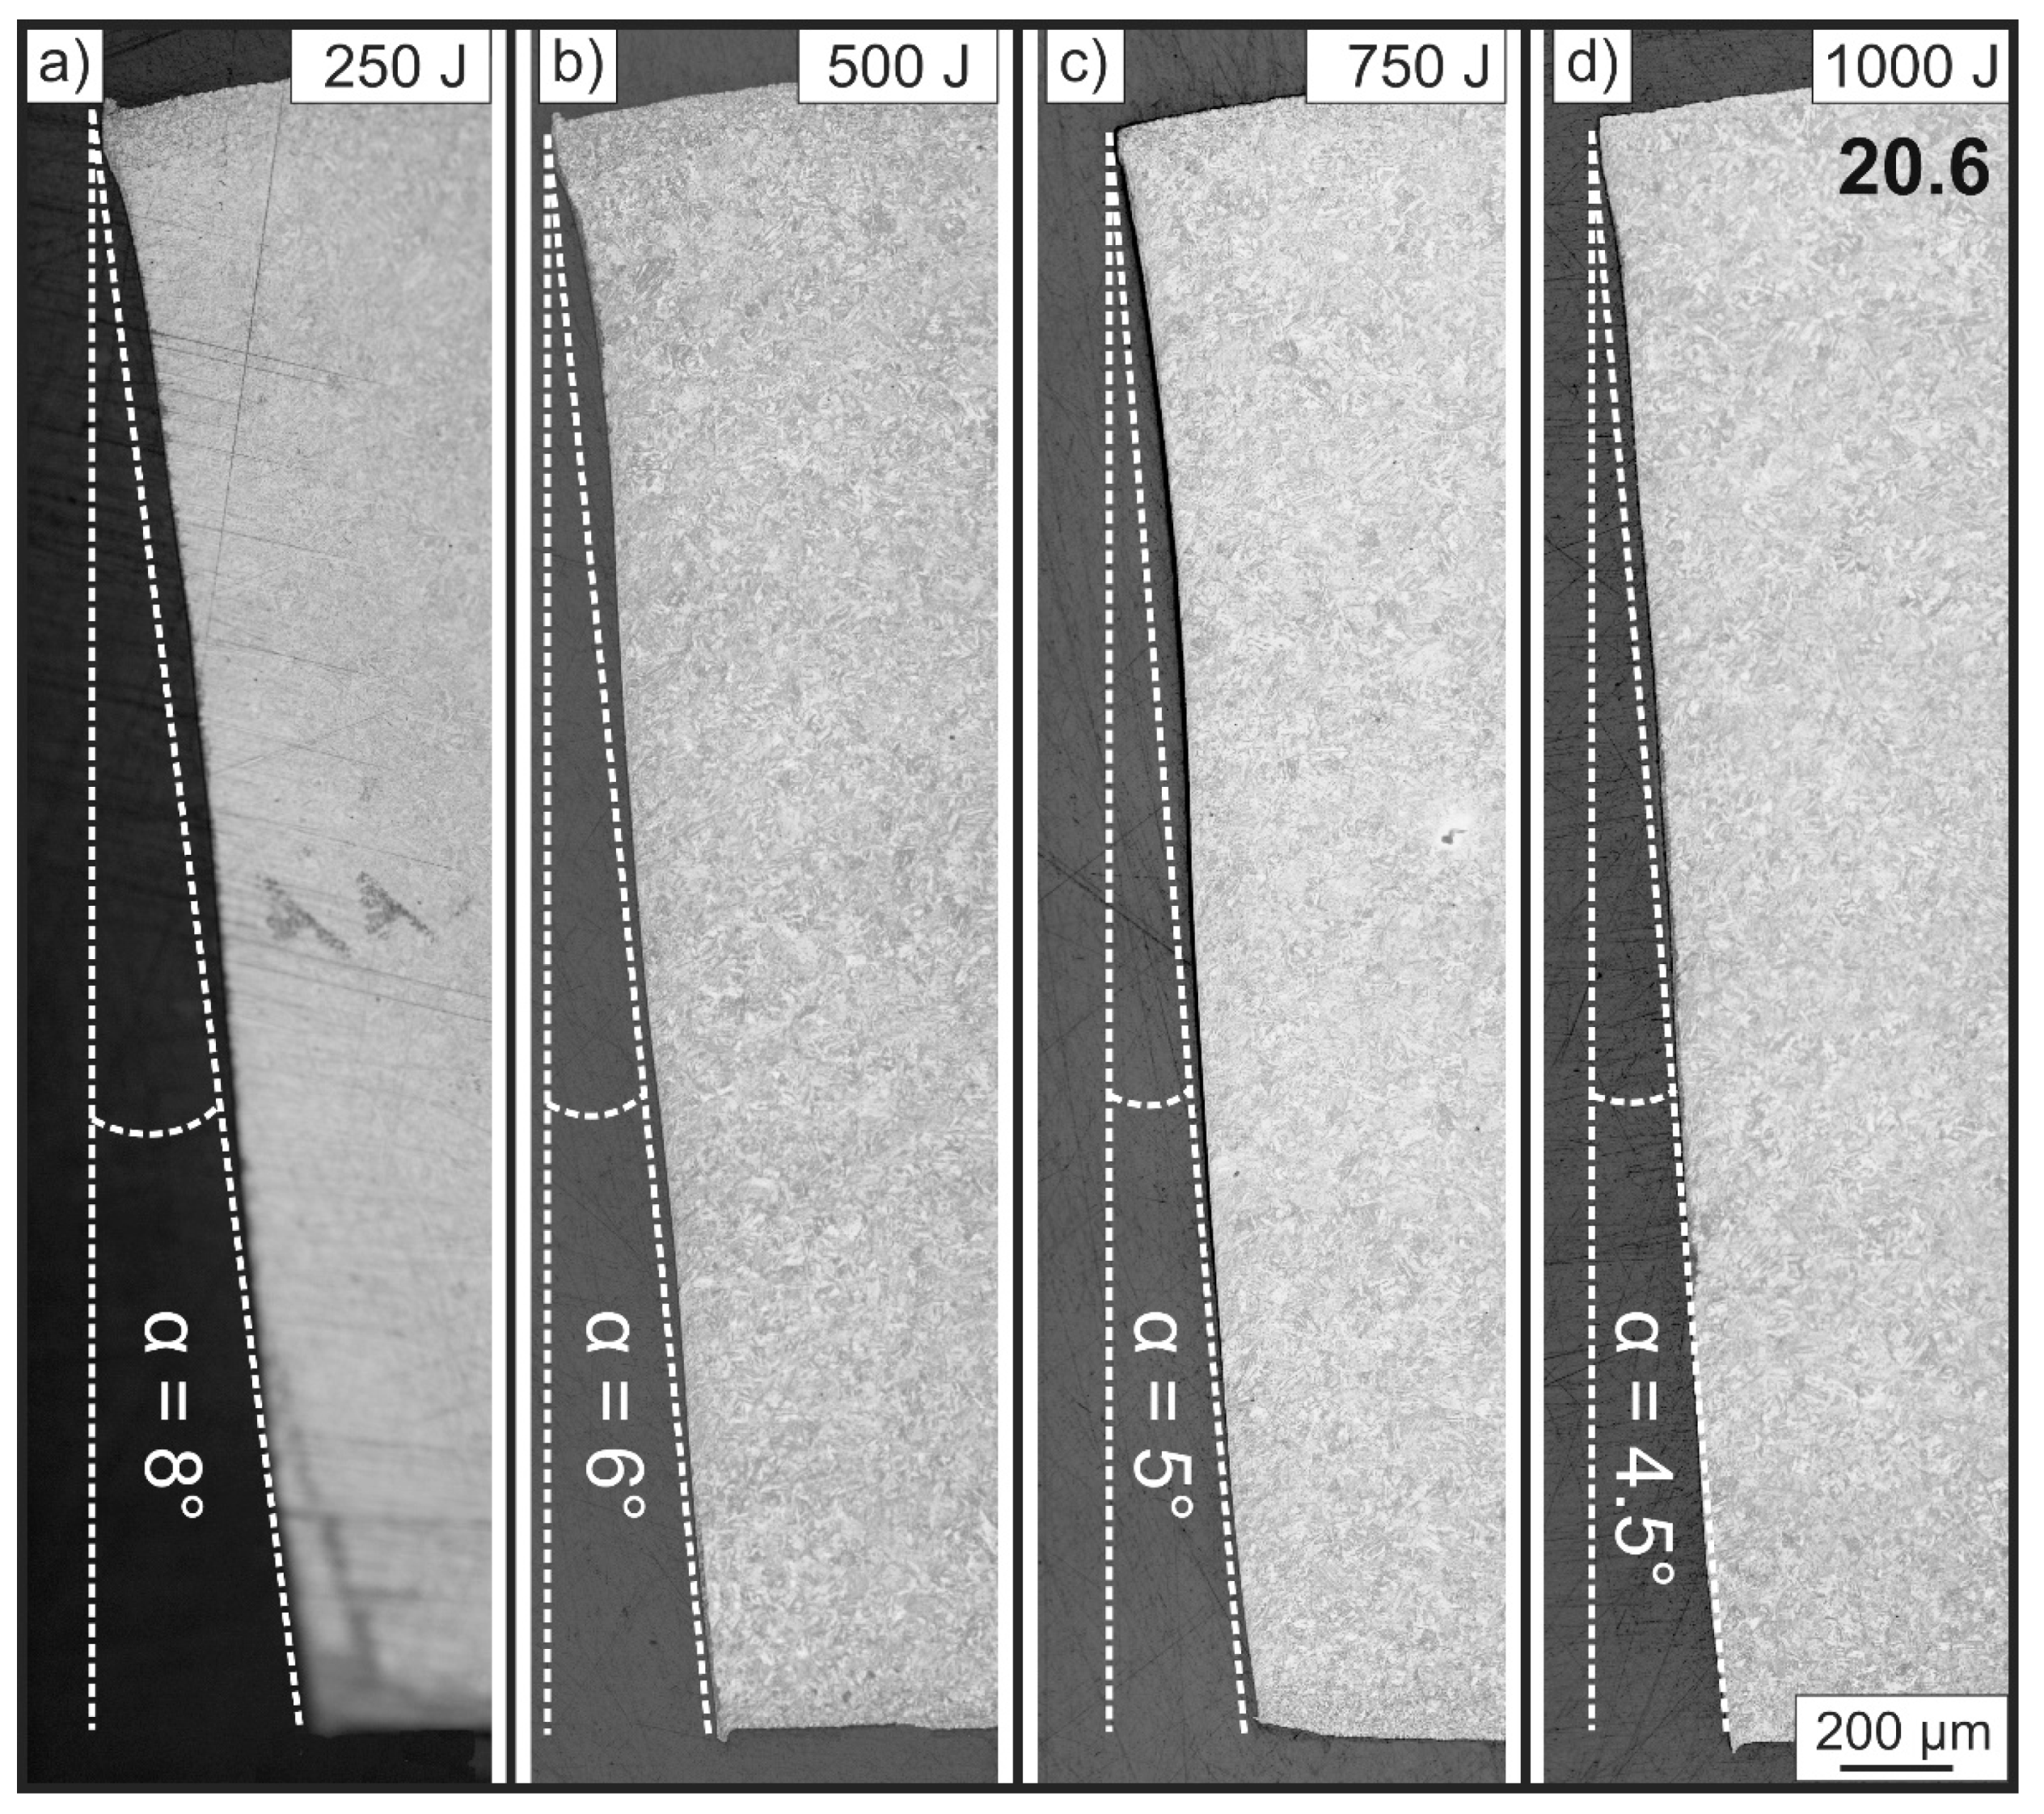
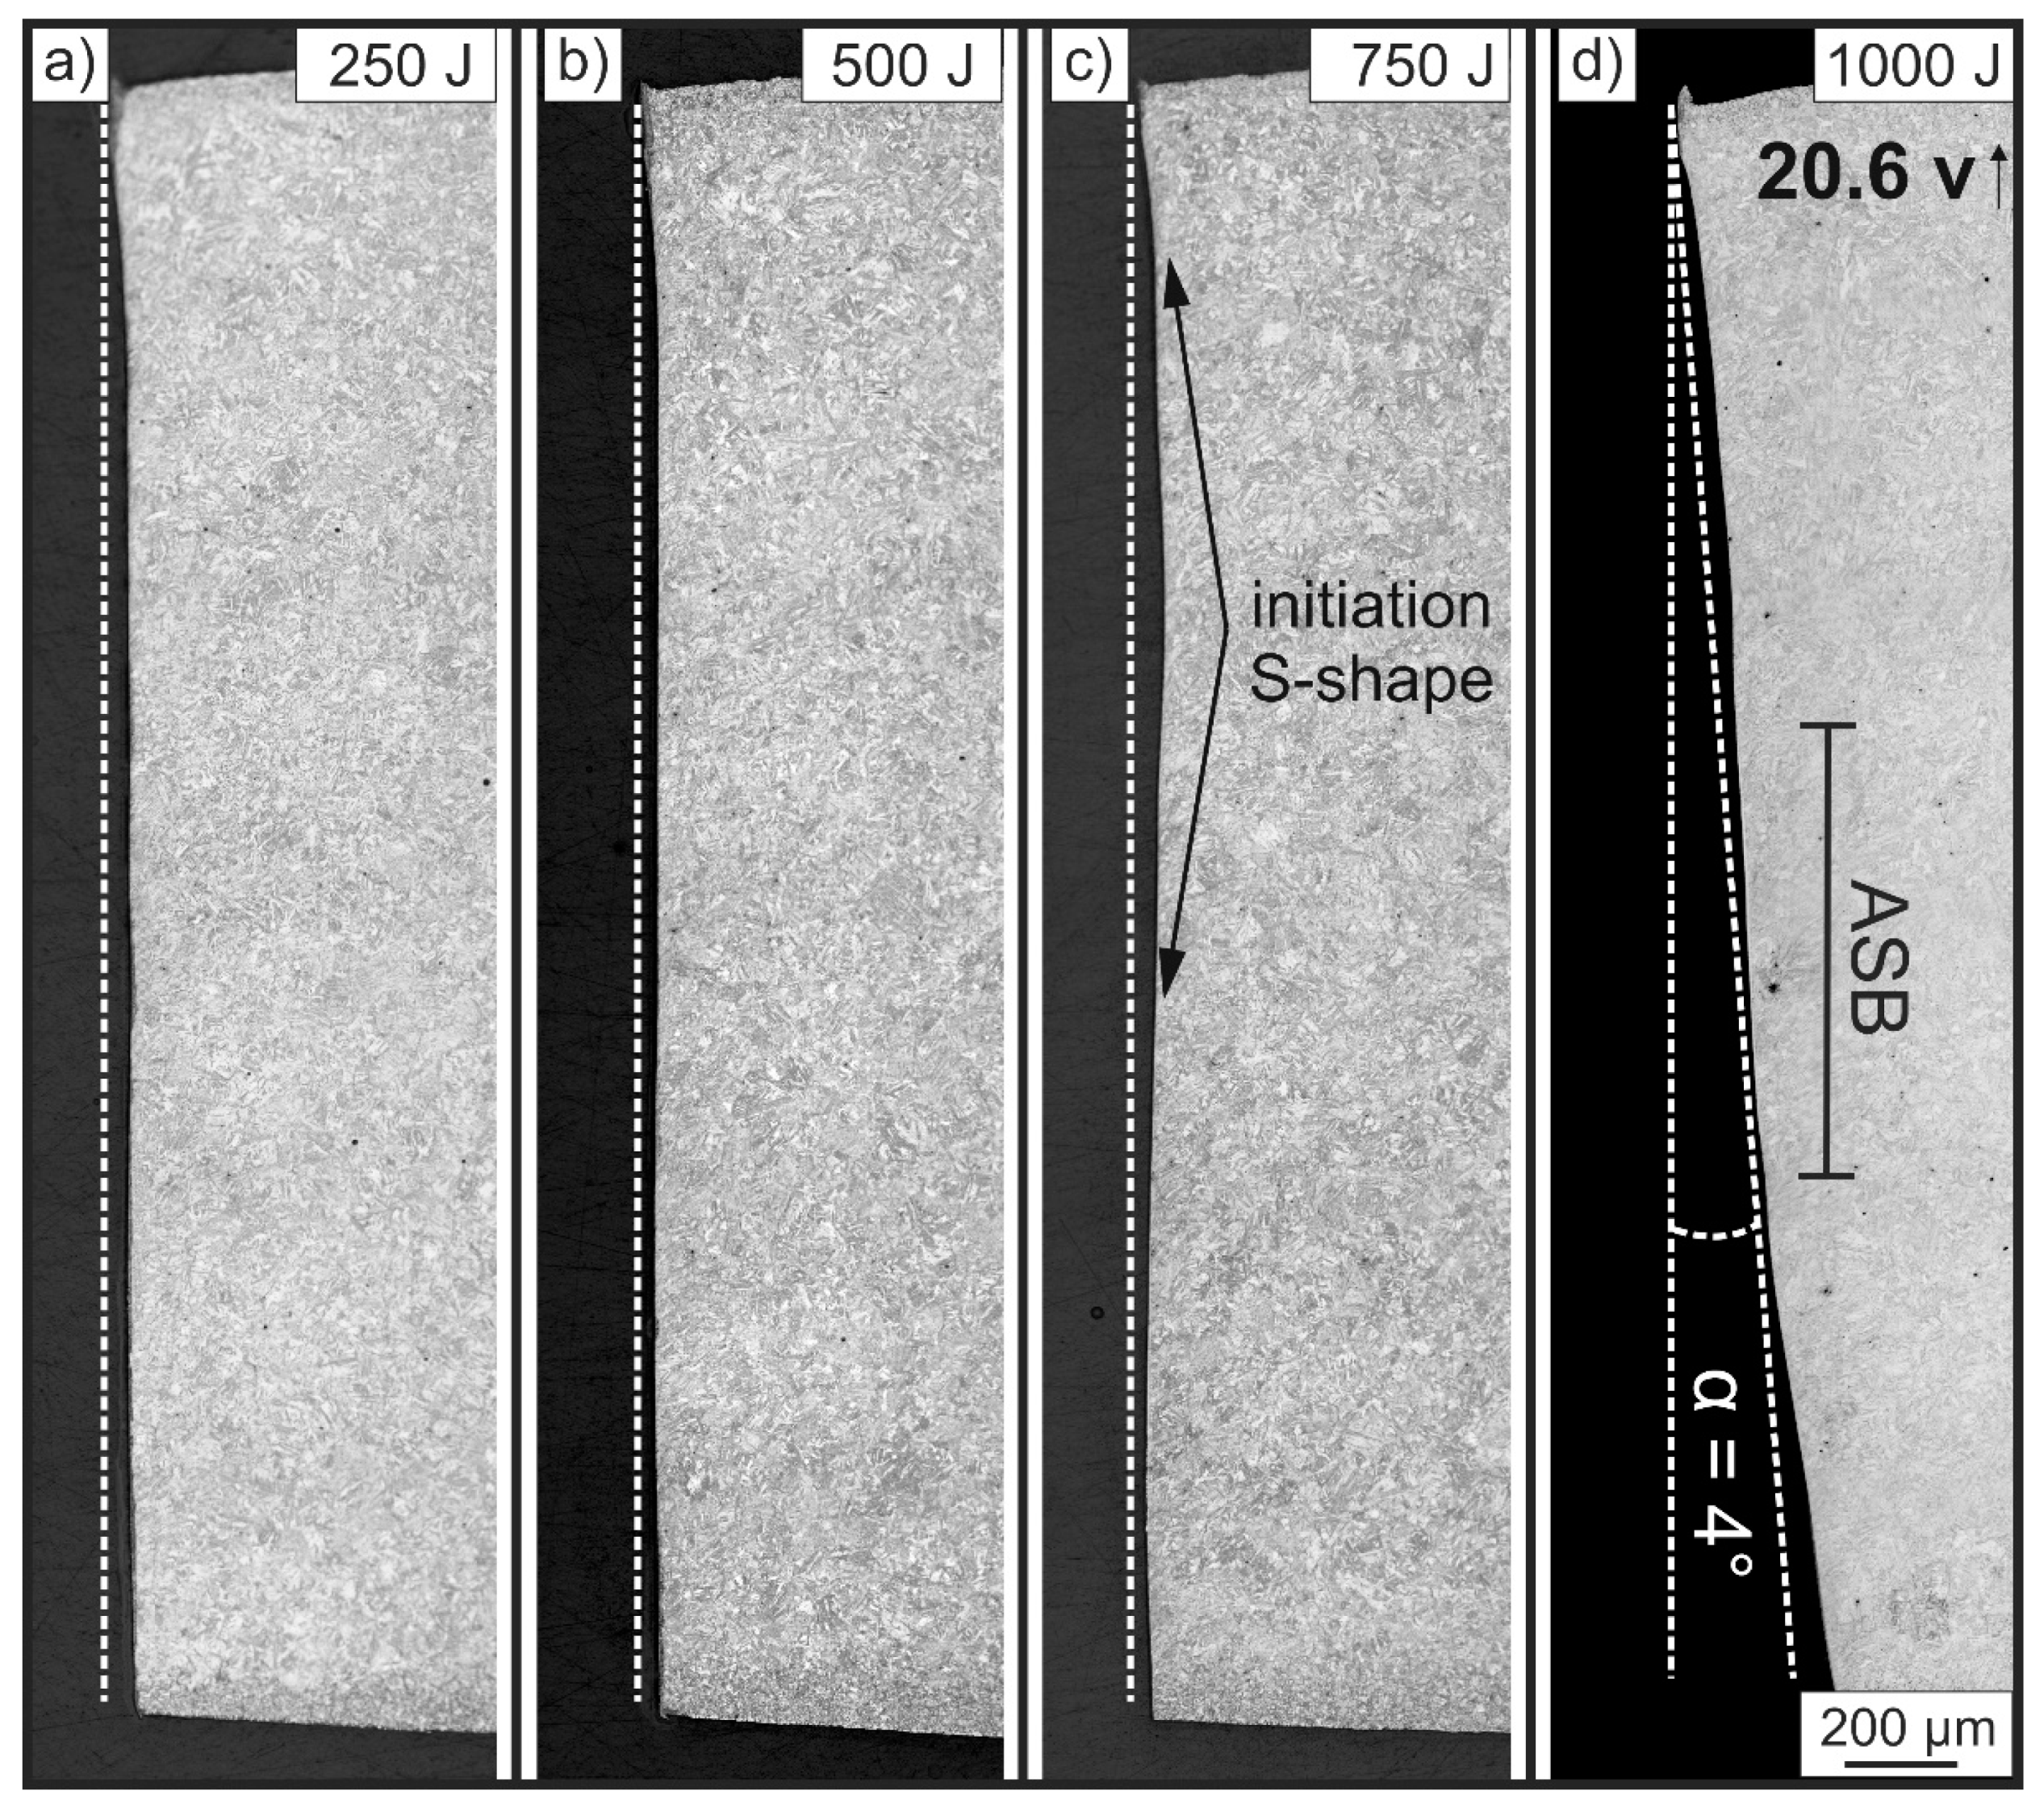
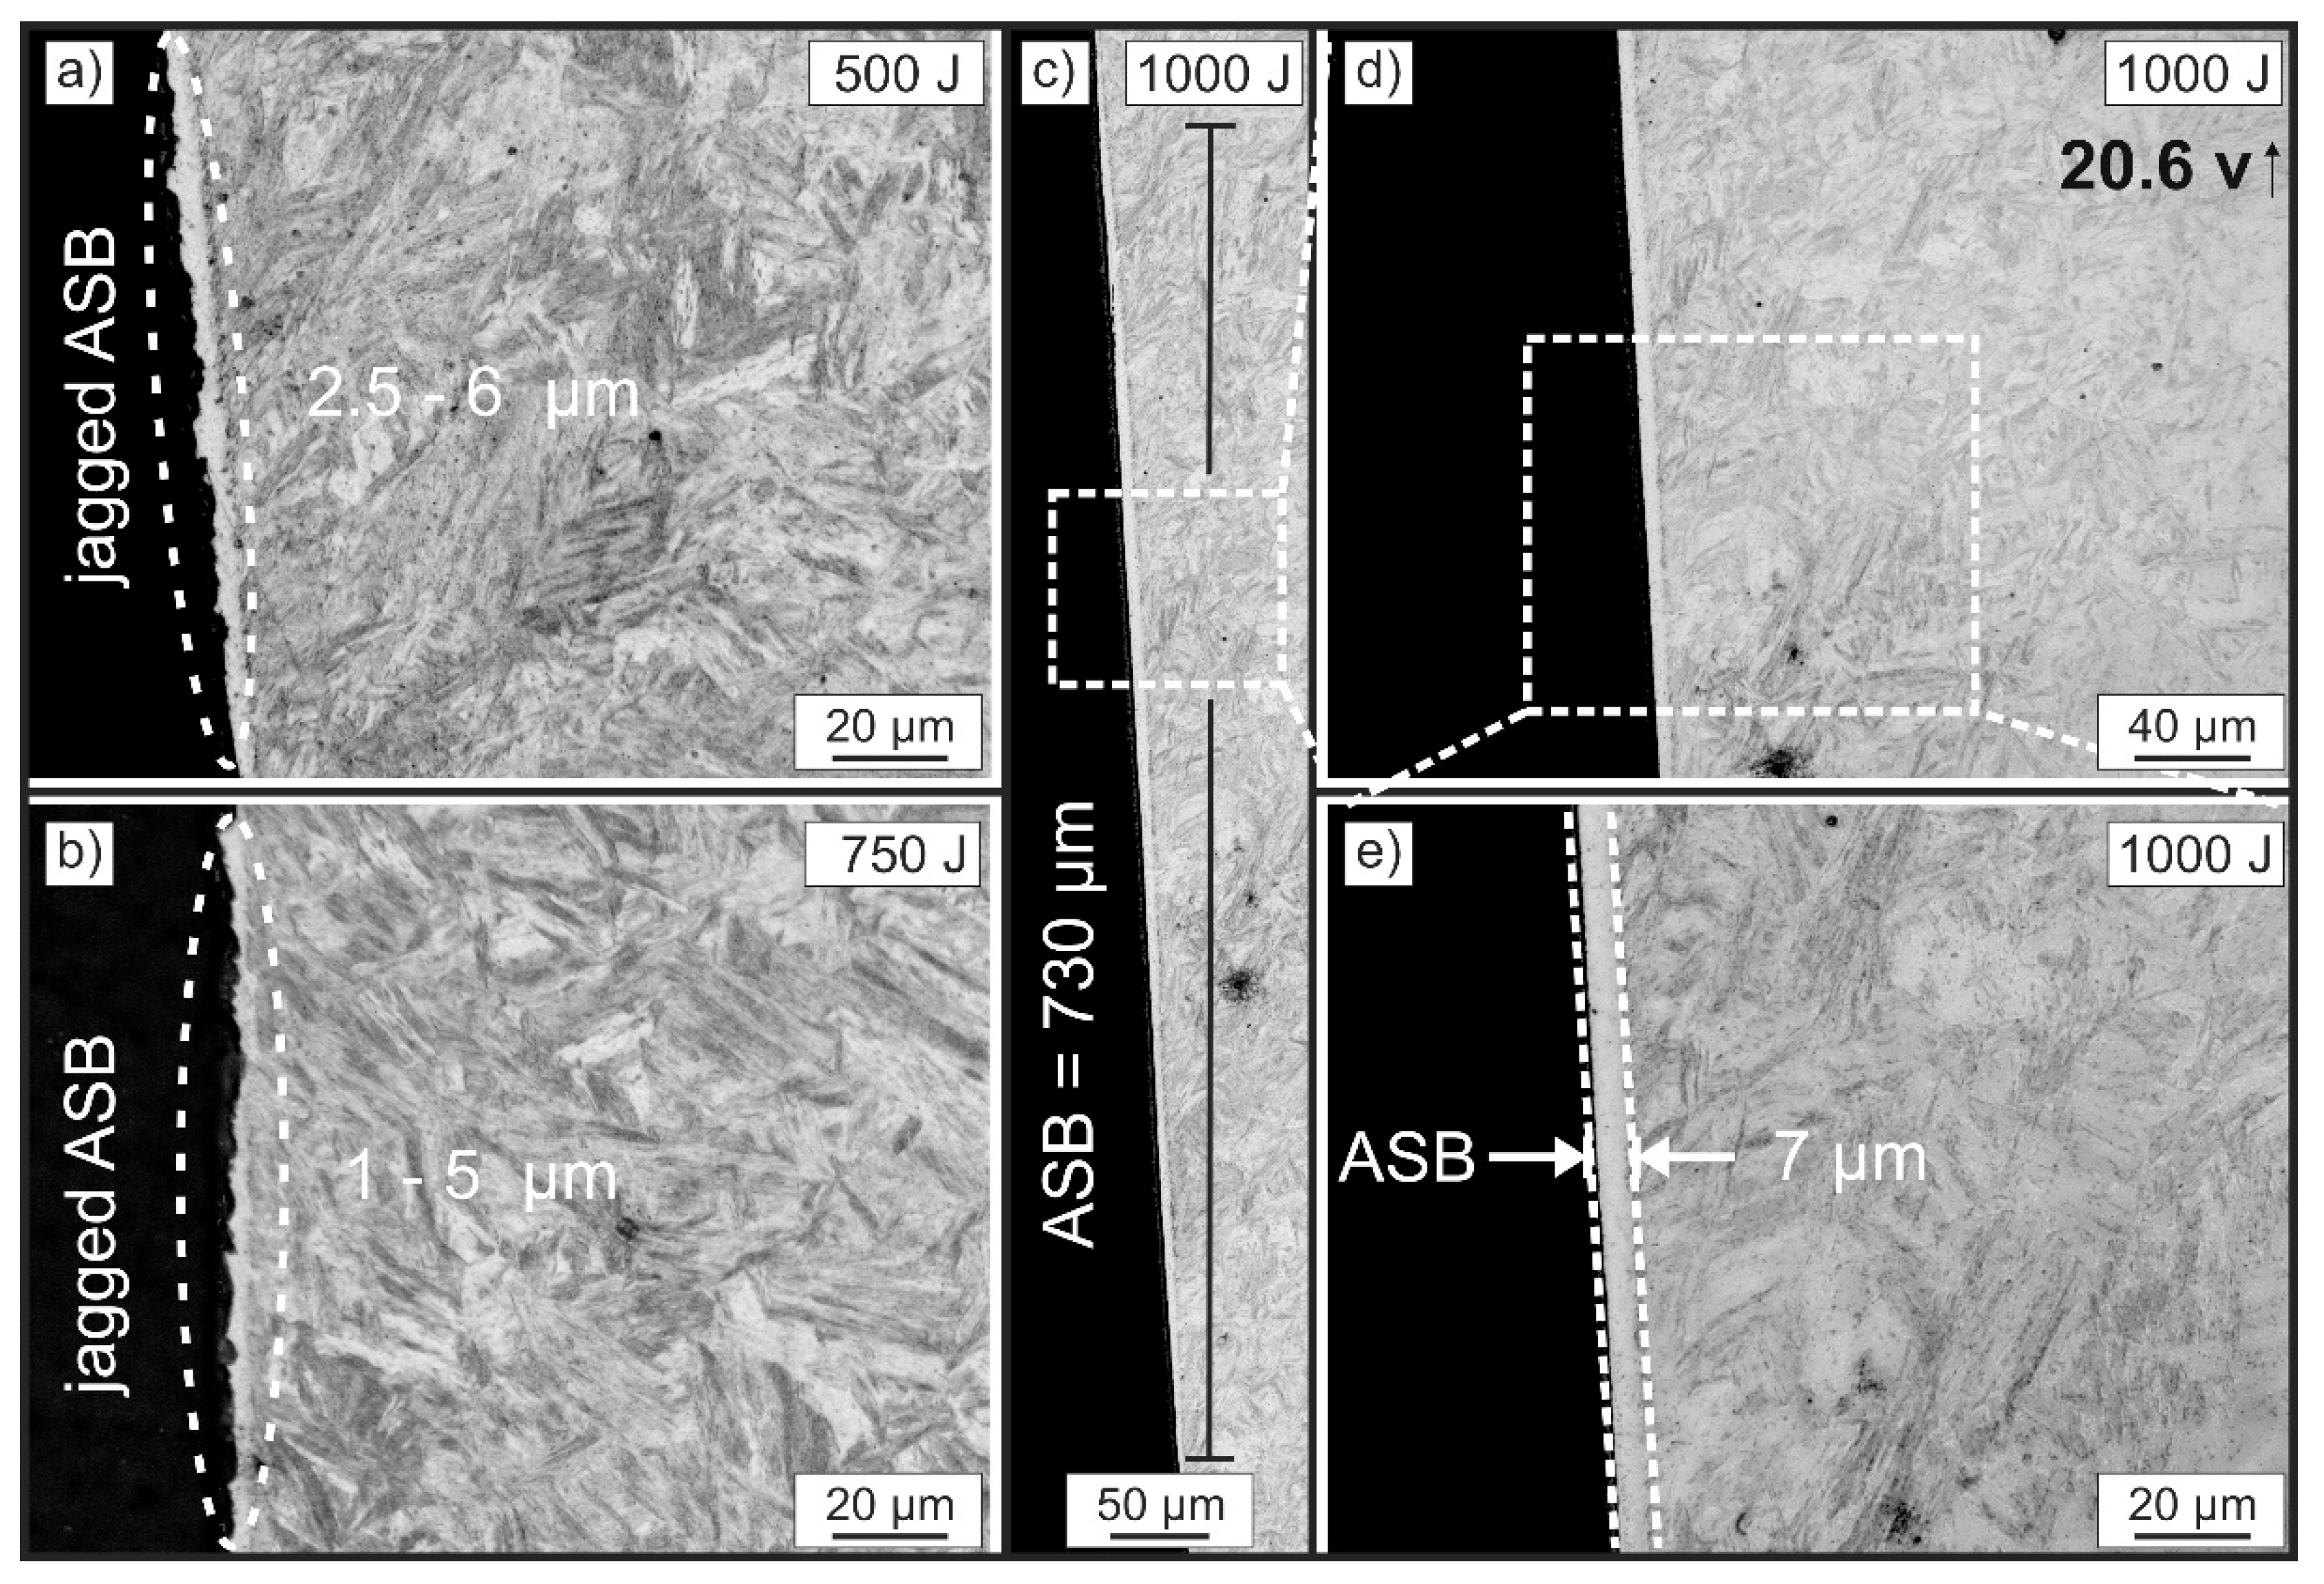
  • Three different blanking surface types were identified depending on the process parameters. The initiation of an ASB promotes the formation of an S-shaped blanking surface. If the relative clearance is ≥10% and the velocity is less than 10 m/s, an angled fracture surface occurs, whereby an increase in velocity results in smaller angles. High velocity (10–12.5 m/s) combined with a blanking clearance of 10% and a maximum impact energy of 500 J results in a very straight blanking surface with high quality. This surface exhibits selectively jagged and very small ASB. This demonstrates that lower impact energies combined with increased velocity can lead to blanked surfaces of very high quality.
As ASB provide special properties, such as very high hardness [4], an aim for further research is the formation of an ASB over the entire blanked surface. For this purpose, the impact energy and the velocity must be increased while maintaining a small relative blanking clearance (≤3.34%). Under these conditions, the benefits of the ASB can be further utilized for the blanked surfaces.

Author Contributions

Conceptualization, S.W. and M.N.; methodology, S.W.; investigation, S.W., M.N., E.G. and F.H.; resources, M.D.; writing—original draft preparation, S.W.; writing—review and editing, S.W., M.N., V.P., V.K.; visualization, S.W.; supervision, M.D., V.K., V.P.; project administration S.W.; funding acquisition, S.W. All authors have read and agreed to the published version of the manuscript.

Funding

The authors would like to thank the Free State of Saxony for their financial support of the study, which was funded by the European Regional Development Fund (EFRE) together with the state funds made available by the Free State of Saxony. Jmmp 05 00035 i001

Institutional Review Board Statement

Not applicable.

Informed Consent Statement

Not applicable.

Data Availability Statement

Not applicable.

Conflicts of Interest

The authors declare no conflict of interest.

References

  1. Sachnik, P.; Hoque, S.E.; Volk, W. Burr-free cutting edges by notch-shear cutting. J. Mater. Process. Technol. 2017, 249, 229–245. [Google Scholar] [CrossRef]
  2. Sahli, M.; Roizard, X.; Assoul, M.; Colas, G.; Giampiccolo, S.; Barbe, J.P. Finite element simulation and experimental investigation of the effect of clearance on the forming quality in the fine blanking process. Microsyst. Technol. 2020, 7. [Google Scholar] [CrossRef]
  3. Neugebauer, R.; Weigel, P.; Westkämpfer, E.; Verl, A.; Eicher, F. Investigation of Application Potentials and Limits of Adiabatic Cutting and Punching Operations; Germany Report P774; Verlag und Vertriebsgesellschaft mbH: Düsseldorf, Germany, 2010. [Google Scholar]
  4. Schmitz, F.; Winter, S.; Clausmeyer, T.; Wagner, M.F.X.; Tekkaya, A.E. Adiabatic blanking of advanced high-strength steels. CIRP Ann. 2020, 69, 269–272. [Google Scholar] [CrossRef]
  5. Neugebauer, R.; Kräusel, V.; Weigel, P. Hochgeschwindigkeitsscherschneiden hält Einzug in die Blechbearbeitung. Wt. Werkstattstech. Online 2008, 98, 813–814. [Google Scholar]
  6. Rosenthal, S.; Maaß, F.; Kamaliev, M.; Hahn, M.; Gies, S.; Tekkaya, A.E. Lightweight in Automotive Components by Forming Technology. Automot. Innov. 2020. [Google Scholar] [CrossRef]
  7. Zener, C.; Hollomon, J.H. Effect of Strain Rate Upon Plastic Flow of Steel. J. Appl. Phys. 1944, 15, 22–32. [Google Scholar] [CrossRef]
  8. Meyers, M.A.; Xu, Y.B.; Xue, Q.; Pérez-Prado, M.T.; McNelley, T.R. Microstructural evolution in adiabatic shear localization in stainless steel. Acta Mater. 2003, 51, 1307–1325. [Google Scholar] [CrossRef]
  9. Bai, Y.; Dodd, B. Adiabatic Shear Localization; Pergamon Press: Oxford, UK, 2012; ISBN 978-0-08-097781-2. [Google Scholar]
  10. Rogers, H. Adiabatic plastic deformation. Annu. Rev. Mater. Sci. 1979, 9, 283–311. [Google Scholar] [CrossRef]
  11. Wang, B.; Sun, J.; Wang, X.; Fu, A. Adiabatic shear localization in a near beta Ti-5Al-5Mo-5 V-1Cr-1Fe alloy. Mater. Sci. Eng. A 2015. [Google Scholar] [CrossRef]
  12. Xu, Y.; Bai, Y.; Meyers, M.A. Deformation, phase transformation and recrystallization in the shear bands induced by high-strain rate loading in titanium and its alloys. J. Mater. Sci. Technol. 2006, 22, 737–746. [Google Scholar]
  13. Meyers, M.A.; Wittman, C.L. Effect of metallurgical parameters on shear band formation in low-carbon (approx. 0.20 wt pct) steels. Metall. Trans. A, Phys. Metall. Mater. Sci. 1990, 21A, 3153–3164. [Google Scholar] [CrossRef]
  14. Nesterenko, V.F.; Meyers, M.A.; LaSalvia, J.C.; Bondar, M.P.; Chen, Y.J.; Lukyanov, Y.L. Shear localization and recrystallization in high-strain, high-strain-rate deformation of tantalum. Mater. Sci. Eng. A 1997, 229, 23–41. [Google Scholar] [CrossRef]
  15. Osovski, S.; Rittel, D.; Landau, P.; Venkert, A. Microstructural effects on adiabatic shear band formation. Scr. Mater. 2012, 66, 9–12. [Google Scholar] [CrossRef]
  16. Rittel, D.; Wang, Z.G.; Merzer, M. Adiabatic shear failure and dynamic stored energy of cold work. Phys. Rev. Lett. 2006, 96, 1–4. [Google Scholar] [CrossRef] [PubMed] [Green Version]
  17. Mendoza, I.; Villalobos, D.; Alexandrov, B.T. Crack propagation of Ti alloy via adiabatic shear bands. Mater. Sci. Eng. A 2015, 645, 306–310. [Google Scholar] [CrossRef]
  18. Gaudillière, C.; Ranc, N.; Larue, A.; Lorong, P. Investigations in high speed blanking: Cutting forces and microscopic observations. EPJ Web Conf. 2010, 6, 19003. [Google Scholar] [CrossRef] [Green Version]
  19. Winter, S.; Pfeiffer, S.; Bergelt, T.; Wagner, M.F.-X. Finite element simulations on the relation of microstructural characteristics and the formation of different types of adiabatic shear bands in a β-titanium alloy. IOP Conf. Ser. Mater. Sci. Eng. 2019, 480, 012022. [Google Scholar] [CrossRef]
  20. Winter, S.; Schmitz, F.; Clausmeyer, T.; Tekkaya, A.E.; Wagner, M.F.-X. High temperature and dynamic testing of AHSS for an analytical description of the adiabatic cutting process. IOP Conf. Ser. Mater. Sci. Eng. 2017, 181, 012026. [Google Scholar] [CrossRef] [Green Version]
  21. Pouya, M.; Winter, S.; Fritsch, S.; Wagner, M.F.-X. A numerical and experimental study of temperature effects on deformation behavior of carbon steels at high strain rates. IOP Conf. Ser. Mater. Sci. Eng. 2017, 181, 012022. [Google Scholar] [CrossRef] [Green Version]
  22. Psyk, V.; Scheffler, C.; Tulke, M.; Winter, S.; Guilleaume, C.; Brosius, A. Determination of Material and Failure Characteristics for High-Speed Forming via High-Speed Testing and Inverse Numerical Simulation. J. Manuf. Mater. Process. 2020, 4, 31. [Google Scholar] [CrossRef] [Green Version]
  23. Dodd, B.; Bai, Y. Width of adiabatic shear bands formed under combined stresses. Mater. Sci. Technol. 1989, 5, 557–559. [Google Scholar] [CrossRef]
  24. Xue, Q.; Meyers, M.A.; Nesterenko, V.F. Self-organization of shear bands in titanium and Ti-6Al-4V alloy. Acta Mater. 2002, 50, 575–596. [Google Scholar] [CrossRef]
  25. Nesterenko, V.F.; Meyers, M.A.; Wright, T.W. Self-organization in the initiation of adiabatic shear bands. Acta Mater. 1998, 46, 327–340. [Google Scholar] [CrossRef]
  26. Landgrebe, D.; Müller, R.; Sterzing, A.; Mauermann, R.; Rennau, A. Hochfeste Stähle—Chance für Leichtbau und für Effizienzsteigerung in der Produktion. In Proceedings of the 18 Werkstofftechnischen Kolloquium in Chemnitz 2016; Lampke, T., Ed.; Schriftenreihe Werkstoffe und Werkstofftechnische Anwendungen 59; Technische Universität Chemnitz: Chemnitz, Germany, 2016; pp. 34–44. [Google Scholar]
  27. Rodríguez-Martínez, J.A.; Vadillo, G.; Rittel, D.; Zaera, R.; Fernández-Sáez, J. Dynamic recrystallization and adiabatic shear localization. Mech. Mater. 2015, 81, 41–55. [Google Scholar] [CrossRef] [Green Version]
Figure 1. Setup of the tool used for adiabatic blanking. The force is applied to the pusher via a striker unit of the ADIAflex® machine.
Jmmp 05 00035 g001
Figure 2. Two-dimensional model for the numerical calculation of the stress triaxiality in the shear zone in LS-DYNA. Additionally, the investigated area (blanked surface) for the optical microscopy is schematically shown.
Jmmp 05 00035 g002
Figure 3. Blanked surface of the sheet for 1000 J impact energy and a relative clearance of (a) 1.67%, (b) 3.34 %, (c) 6.67% and (d) 10.00%. With decreasing blanking clearance, the adiabatic shear band (ASB) becomes longer and wider.
Jmmp 05 00035 g003
Figure 4. Process windows of the blanking tests performed with varying clearance and impact energies and their influence on the formation of an ASB.
Jmmp 05 00035 g004
Figure 5. Results of the finite element simulation of the stress triaxiality in the shear zone with two blanking clearances ((ad) 20.2 and (eh) 20.6) and different punch penetration depths.
Jmmp 05 00035 g005
Figure 6. Evaluation of the impact velocity for a relative clearance of 10% with varying impact energies and different pushers.
Jmmp 05 00035 g006
Figure 7. The blanked surface of the sheet is shown for a relative clearance of 10% (specimen 20.6) and varying impact energies from (a) 250 J, (b) 500 J, (c) 750 J to (d) 1000 J. The fracture angle α becomes smaller with increasing impact energy.
Jmmp 05 00035 g007
Figure 8. Blanked surfaces of the sheet cut with a relative clearance of 10% (sample 20.6 v↑) and varying impact energies from (a) 250 J, (b) 500 J, (c) 750 J to (d) 1000 J and velocities, respectively.
Jmmp 05 00035 g008
Figure 9. Optical microscopy images with increased resolution of the ASB of the 20.6 v↑ samples from (a) 500 J, (b) 750 J and (ce) 1000 J.
Jmmp 05 00035 g009
Table 1. Chemical composition of the used 22MnB5 steel in wt.-%.
in wt.-%CMnSiCrB (ppm)Fe
22MnB50.231.210.150.1821.00balance
Table 2. Investigated dies (sample designation) and the resulting blanking and relative clearances.
Ø Die in mm
(Sample Designation)
20.120.220.420.620.821.0
blanking clearance in mm0.050.100.200.300.400.50
relative clearance in%1.673.346.6710.0013.3416.67
Table 3. Parameters used for the Johnson–Cook model from Schmitz et al. [4].
A in MPaB in MPaCnkmλ in W/(mK)
13805020.00110.150.410.004048.7
Publisher’s Note: MDPI stays neutral with regard to jurisdictional claims in published maps and institutional affiliations.

