1. Introduction
The Arctic, and northern regions of Russia, the USA and Canada in particular, are rich in valuable resources like timber, gas, oil, precious metals, ores and other minerals. However, the development of these hard-to-reach territories demands enormous capital investment. Building roads, runways, crossings, bridges, buildings, etc., requires a large amount of construction materials that have to be delivered from remote industrialized regions. Ideal cheap construction materials could be ice, snow and other local geophysical materials. They are renewable, ecologically safe and easily available in cold regions. They have low density and do not demand special utilization procedures at the end of the life cycle. However, despite all above advantages, the ice as a main component of such composite materials has a number of significant internal drawbacks including low strength, low fracture toughness and high creep rate [
1,
2,
3] at typical Arctic winter ambient temperatures. During the last century it incites many teams to work on ice strengthening using various approaches [
4,
5,
6].
Historically, the first approach to ice strengthening was based on its reinforcement by macroscopic additives. Usually, it was cheap waste from the forestry industry (sawdust, shavings and wood chips) [
7]. There was a famous project named Habbakuk [
8] consisting of the construction of giant aircraft carriers made of ice composites (IC) in the northern Atlantic during World War II to counter the threat posed by German submarines. The addition of the optimal quantity of sawdust to the water to be frozen, which turned out to be 14 wt.% or around one-third of solid material volume, resulted in fourfold ice strengthening. Later, various high-strength microfibers ranging from microcellulose and basalt to Kevlar and carbon nanotubes were tested as reinforcing additives [
9,
10,
11,
12]. For more than a century, working on ice strengthening using various macro- and microscopic additives resulted in the development of various approaches and technologies for an increase in the strength of constructions made of IC. It allows the building of large-scale dams and dome-shaped buildings with diameters of tens of meters [
13,
14]. However, the potential of ice strengthening using macro and micro additives is quite limited, and it prevents the wide application of such techniques to the construction of winter roads, river crossings, airfields, etc. Additionally, these techniques are difficult to implement due to stratification or coagulation/sedimentation of additives. Strengthening using long microfibers requires layer-by-layer placement and freezing while employing a fiber matrix for this purpose requires complex techniques of elimination of air bubbles trapped in the matrix. Usually, all the above techniques of IC manufacturing result in ice strengthening by a factor of 3–4, and reaching 5–6 in rare cases. They are not perfect from an ecological point of view and require some special measures for additive utilization after the end of the construction life cycle. Now it is clear that a radical increase in ice strength using only macro- and micro-sized additives is impossible because of the low strength of the ice that is the main component of IC no matter which high-strength reinforcing elements are used.
As can be deduced from the general considerations, the low strength of ice is determined by imperfections of its structure, i.e., by a large number of structural defects in it. In the above context, it is essential to estimate the strength of chemically pure defect-free ice. Though the mechanical characteristics of ice originate from weak hydrogen bonds between H
2O molecules [
15], its theoretical strength limit σ
th is quite high. It is well-known that the strength of ideal defect-free crystals named ideal or theoretical strength, as well as Young’s modulus
E, is determined by the properties of interatomic bonds and their density at the unit area. Different theories from solid state physics (both classic and quantum ones) give (0.07–0.1)
E for σ
th [
16]. For the ice at temperatures not too close to its melting point, one can accept σ
th ≈ 0.07
Ed ≈ 700 MPa as the lower estimate, where
Ed ≈ 10 GPa is the dynamic value of Young’s modulus of pure ice [
1,
2].
However, the experimental strength of natural ice is 2–3 orders of magnitude lower than σ
th and lies between 0.5 and 10 MPa usually [
1,
2,
3]. It implies the existence of a large and currently unemployed potential for ice and IC strengthening. The origins of so strong discrepancy between theoretical and experimental results are in the presence of a wide variety of structural defects in real ice and IC. The defects with the strongest effect on strength are micro- and macroscopic cracks, air bubbles and other discontinuities of material. It is the reason for the modest results of the efforts on ice strengthening using modifications of hydrogen bonds in ice by macro- and micro-scale additives and chemical doping taken in the last two decades [
17,
18,
19,
20,
21]. So, the search for new ideas and approaches to ice strengthening still remains.
As far as we know, NPs with 10–100 nm size have not ever been added to the ice intentionally for the purpose of its strengthening. There are scarce and scattered non-systematic data concerning the effect of NPs on ice crystallite nucleation, its growth, strength and recrystallization of polycrystalline ice. For example, refs. [
22,
23] have described the mechanical properties of ice in wastewater basins, and ref. [
24] has presented the data concerning ice on the Yellow River in China, where the water contains up to 0.06 wt.% of suspended particles. Refs. [
25,
26] report the inhibition of ice grain growth by cellulose NPs during recrystallization.
Summing up this brief review of the current state of ice strengthening problem, one can assert that despite the range of characteristic sizes of additives starting from atomic-molecular and up to macroscopic that have been tested, radical (more than by a factor of 3–5) well reproducible strengthening of IC has not been achieved yet. However, there are still some white spots in the field of ice strengthening. The most promising and the least studied areas in this field lie in the nano- and sub-micro-scale between atomic–molecular and microscopic levels. This level can be utilized by means of adding natural or synthetic nanoparticles (NP) to the water to be frozen.
As follows from the general principles well known in physical material science, a significant strengthening of polycrystalline material and approaching its theoretical strength limit can be achieved on two different paths. The first one is the reduction of defect concentration so that the material approaches the ideal monocrystalline state. The second one is increasing the defect concentration to a level so high that the material approaches an amorphous state. The second path explored in our recent paper [
27] reveals its potential. It renders it possible for strengthening in the uniaxial compression test to reach the factor of 2.5 in some cases. However, this approach requires further systematic research, as long as, unlike microfiber reinforcement, strengthening by NPs can employ many different micro-mechanisms, including grain size reduction, dispersion strengthening of grains, prevention of grain boundary slipping or crack growth and many others.
The aim of this work is experimental proof of the concept of ice strengthening by hydrophilic organic and inorganic NPs. Highly dispersive (10–100 nm) NPs of cellulose and silica have been used as accessible and ecologically safe representatives of the above two types of material
2. Materials and Methods
Organic and inorganic NPs were used to fabricate ice composites. Organic NPs were prepared by wet milling of microcrystalline cellulose (Mingtai Chemical, Taoyuan, China) with an average particle size of 70 μm. The obtained cellulose NPs will be referred to below as NPs-cellulose. Silica NPs (hereinafter NPs-SiO2) (Sigma-Aldrich, Saint Louis, MO, USA) with a declared particle size of 10–20 nm were used as inorganic nanoparticles. Cellulose and silica NPs differ significantly in their physical–chemical properties, in particular in water absorption and conditions at their surface in water suspension.
Wet milling of microcrystalline cellulose was carried out in a planetary mill Pulverisette 7 Premium Line (Fritsch, Idar-Oberstein, Germany) for 2 h using 0.6 mm yttria-stabilized zirconia beads (Zhejiang Jinkun Sili Ceramic Beads, Hangzhou, China). The mass ratio of microcrystalline cellulose powder, distilled water and milling media was 1:10:100. The prepared NPs-cellulose slurry was diluted to a mass fraction (c) of 2 wt.% by adding distilled water. To homogenize the resulting suspension, it was sonicated at a frequency of 20 kHz using a Vibra-Cell VCX 750 ultrasound processor (Sonics & Materials, Newtown, CT, USA). To prevent heating of the suspension, the ultrasound power was limited to 100 W. Suspensions with a lower mass fraction of NPs-cellulose were prepared from a 2 wt.% suspension by sampling and their successive dilution with distilled water. As a result, suspensions of NPs-cellulose with c = 0.003–2 wt.% were obtained.
To prepare suspensions of NPs-SiO2 with c = 0.003–10 wt.%, a 10 wt.% suspension was first obtained by dispersing an appropriate amount of NPs-SiO2 in distilled water using ultrasonic treatment similar to that described above. Suspensions with a lower mass fraction of NPs-SiO2 were prepared in the same way as in the case of suspensions of NPs-Cellulose.
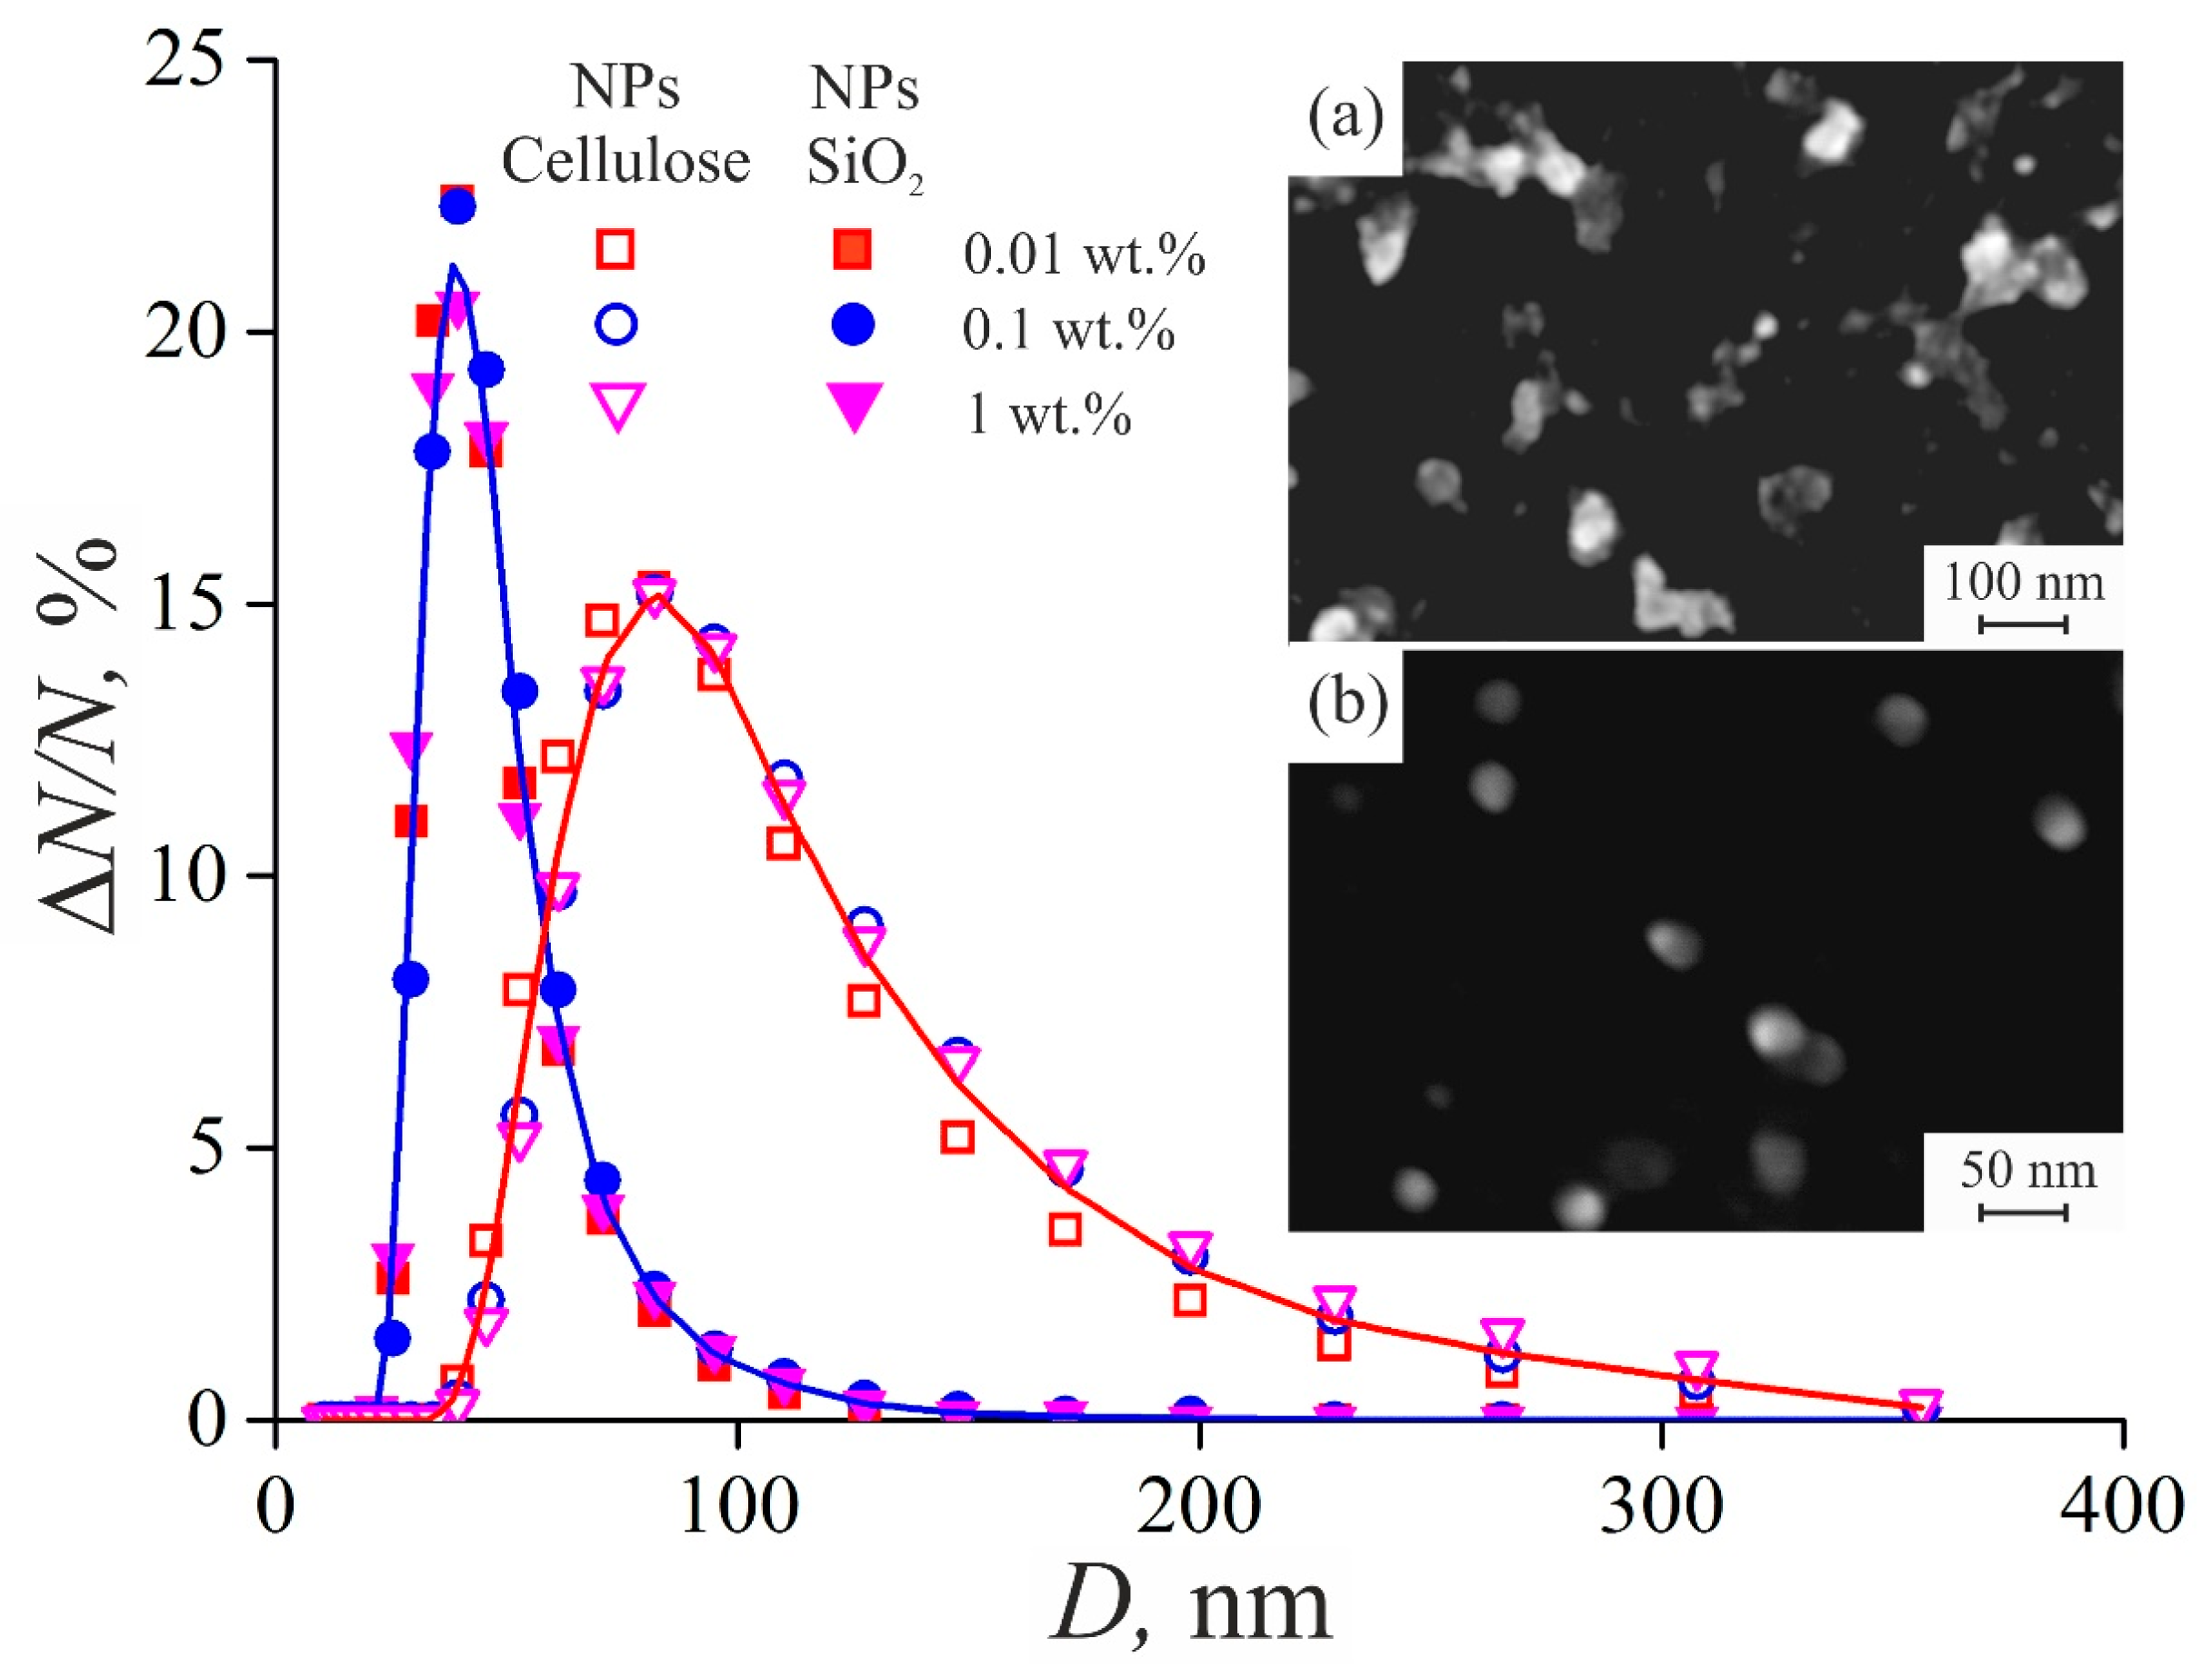
The size (
D) distribution of NPs-cellulose and NPs-SiO
2 in the prepared suspensions was analyzed by dynamic light scattering method (DLS) using a Zetasizer Nano ZS analyzer (Malvern Instruments, Malvern, UK).
Figure 1 shows a monomodal size distribution for NPs-cellulose and NPs-SiO
2 with a maximum at about 80 and 40 nm, respectively. For both NPs-cellulose and NPs-SiO
2, the position of the distribution maximum does not depend on the mass fraction of nanoparticles in the prepared suspensions. The average size of NPs-cellulose and NPs-SiO
2 in the prepared suspensions, calculated from the curves shown in
Figure 1, is 97 and 44 nm, respectively. The images of NPs-cellulose and NPs-SiO
2 in a scanning electron microscope (SEM) Merlin (Carl Zeiss, Oberkochen, Germany) are shown in the insert of
Figure 1. The larger size of NPs-SiO
2, determined by DLS measurements, compared to that declared by the manufacturer may be due to the hygroscopicity of NPs-SiO
2, which leads to an increase in the size of NPs-SiO
2 in the aquatic environment.
The samples of plain ice and IC were fabricated at a temperature of −10 °C in a freezer. The use of fluoroplastic cuvette with individual cells made it possible to prepare 48 samples 10 × 10 × 20 mm3 in size for mechanical tests and microstructural studies in one freezing. The cuvette had a thin bottom wall (~1 mm) and was placed on a massive metal plate. After pouring the samples, the cuvette was thermally insulated from the top and sides with a thick-walled foam box from the freezer atmosphere. Since the coefficient of thermal conductivity of ice is more than an order of magnitude higher than that of fluoroplast at −10 °C, this layout arranged bottom to top uniaxial heat flow in the samples during crystallization.
The microstructure of the obtained samples of ice and ICs was studied in the reflected light mode using an Axio Observer A1m optical microscope (Carl Zeiss, Oberkochen, Germany) equipped with an image capture and analysis system and a detachable thermal chamber with adjustable forced cooling. The grain boundaries were visualized due to thermal etching and segregation of impurities at the boundaries.
The mechanical properties of plain ice and ICs were studied by the uniaxial compression method on an MTS 870 Landmark servo-hydraulic machine (MTS, Eden Prairie, MN, USA) equipped with an environmental chamber. The temperature inside the chamber was maintained at −10 °C by liquid nitrogen vapor entering the chamber from a Dewar vessel. The absolute strain rate in all experiments was 4.8 mm/min, which corresponded to a relative strain rate of 4·10−3 s−1. For each additive concentration, at least eight samples were subjected to mechanical testing.
3. Results
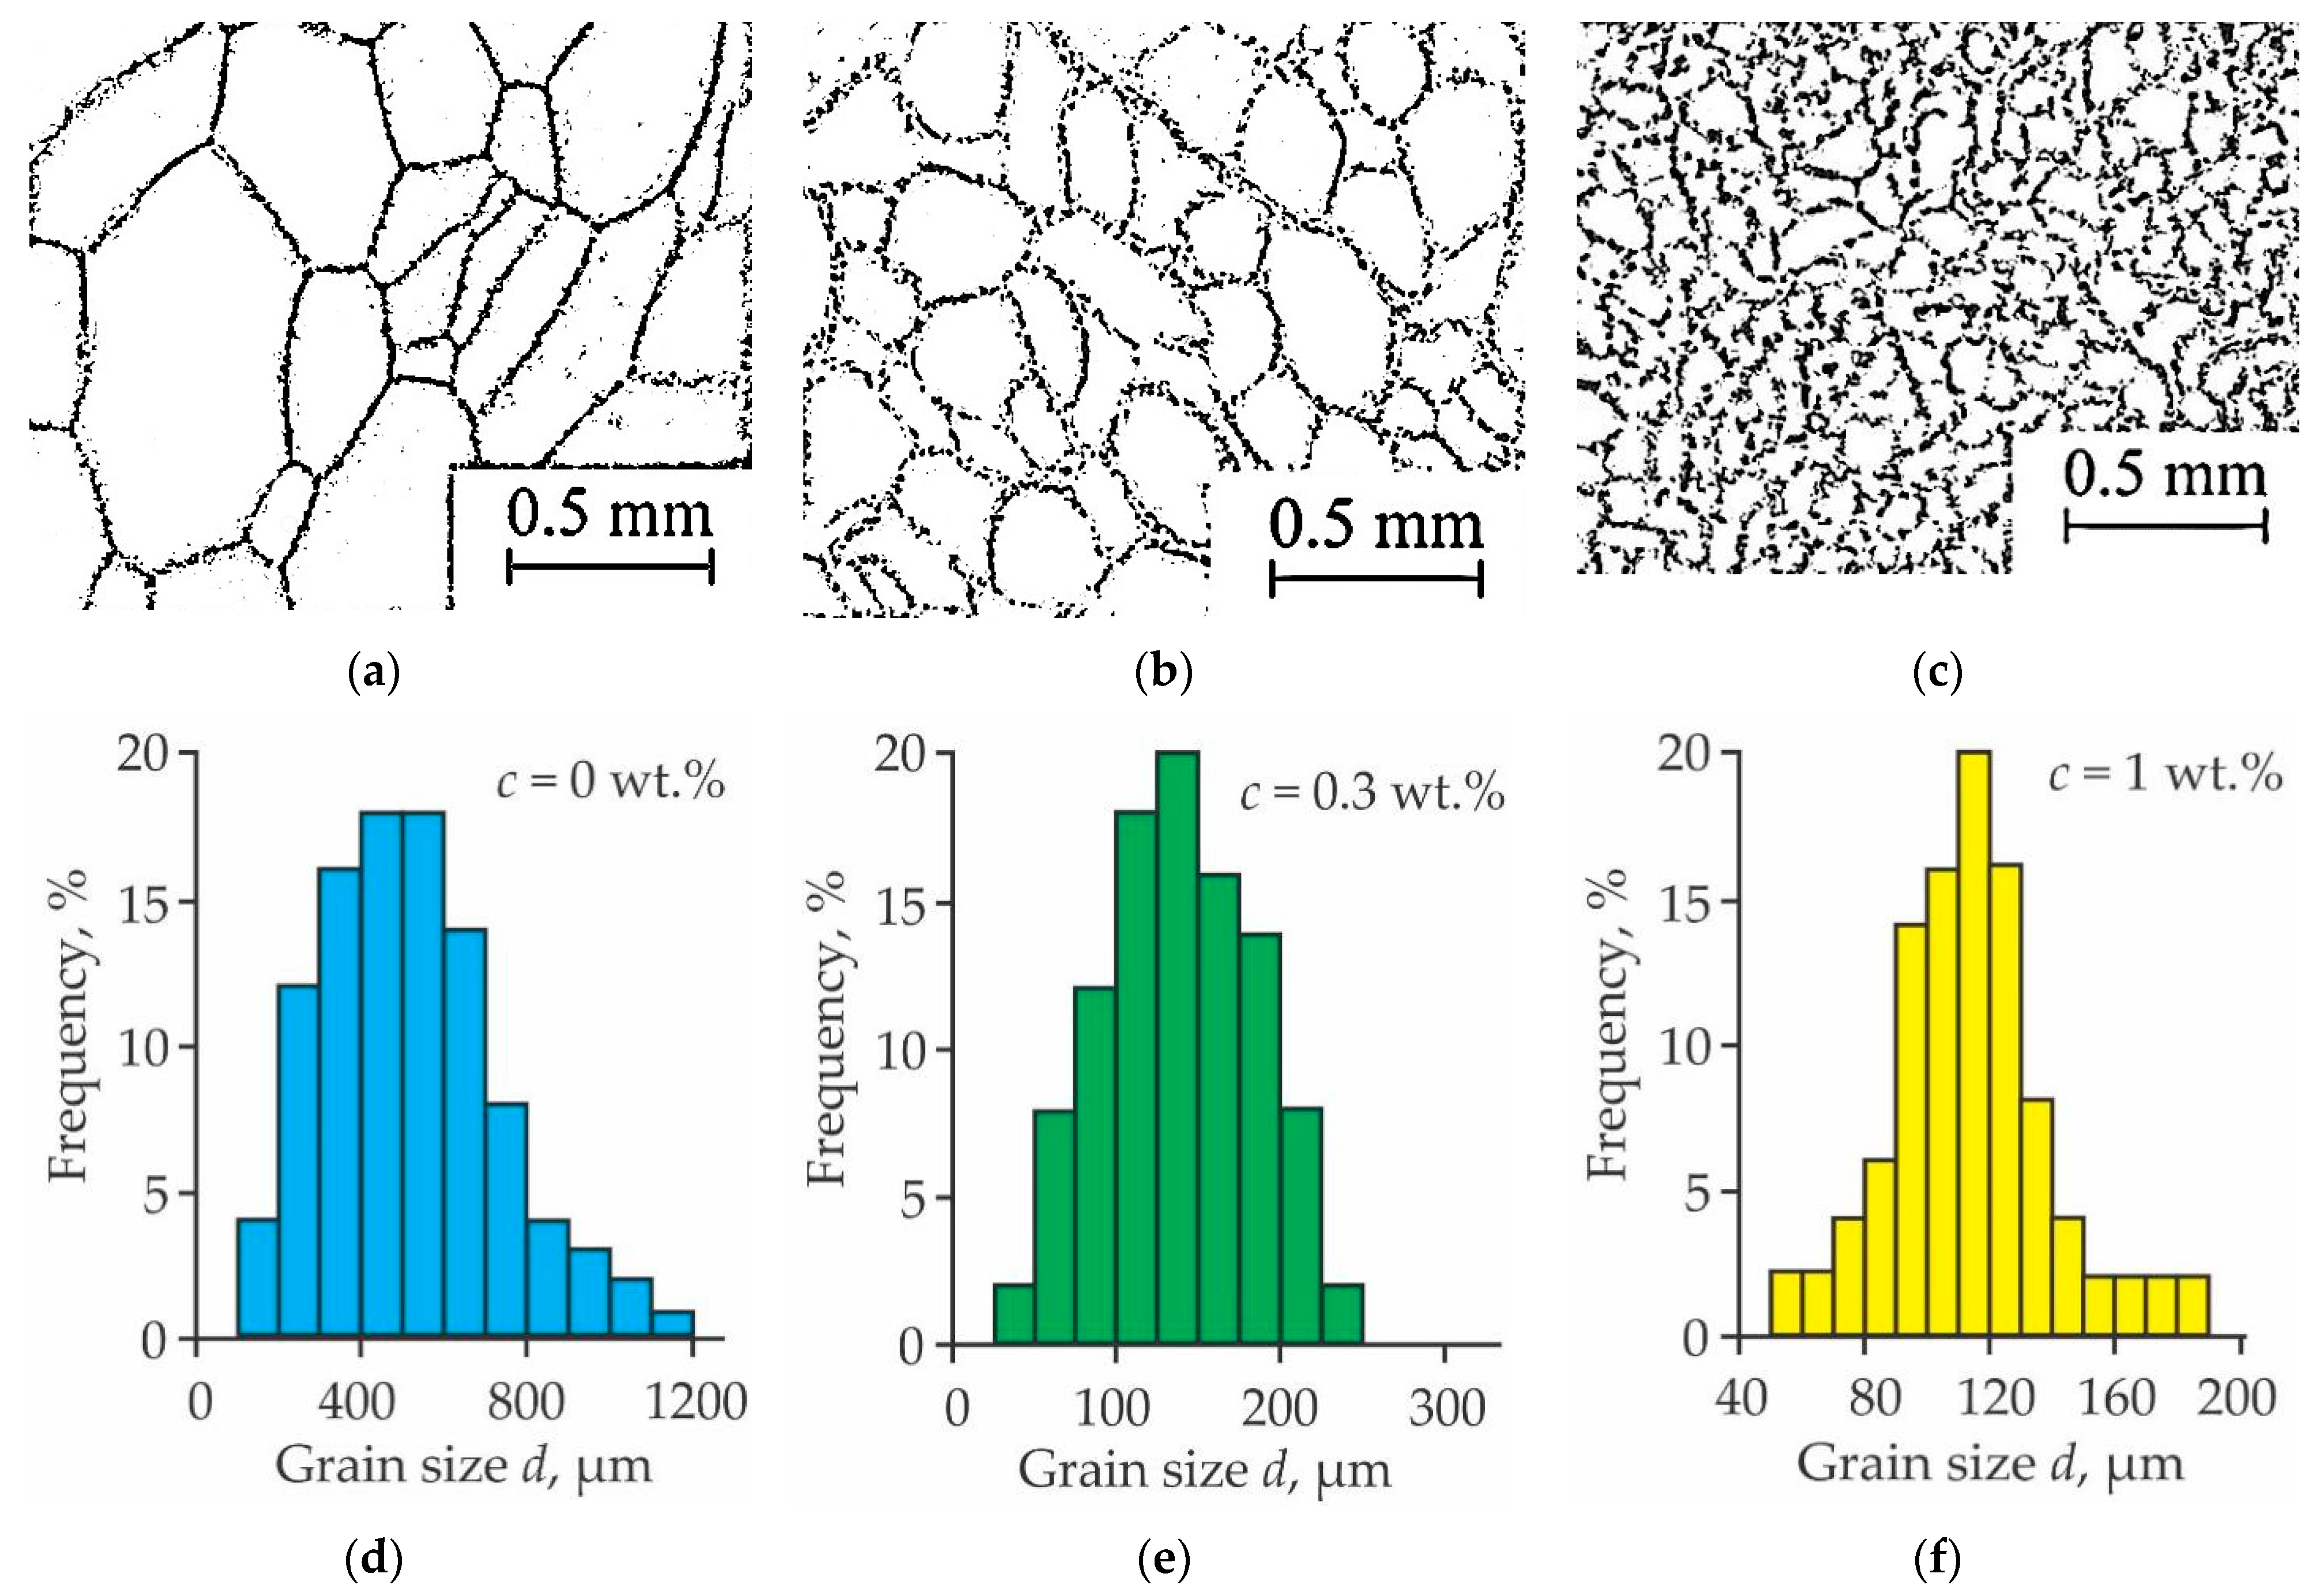
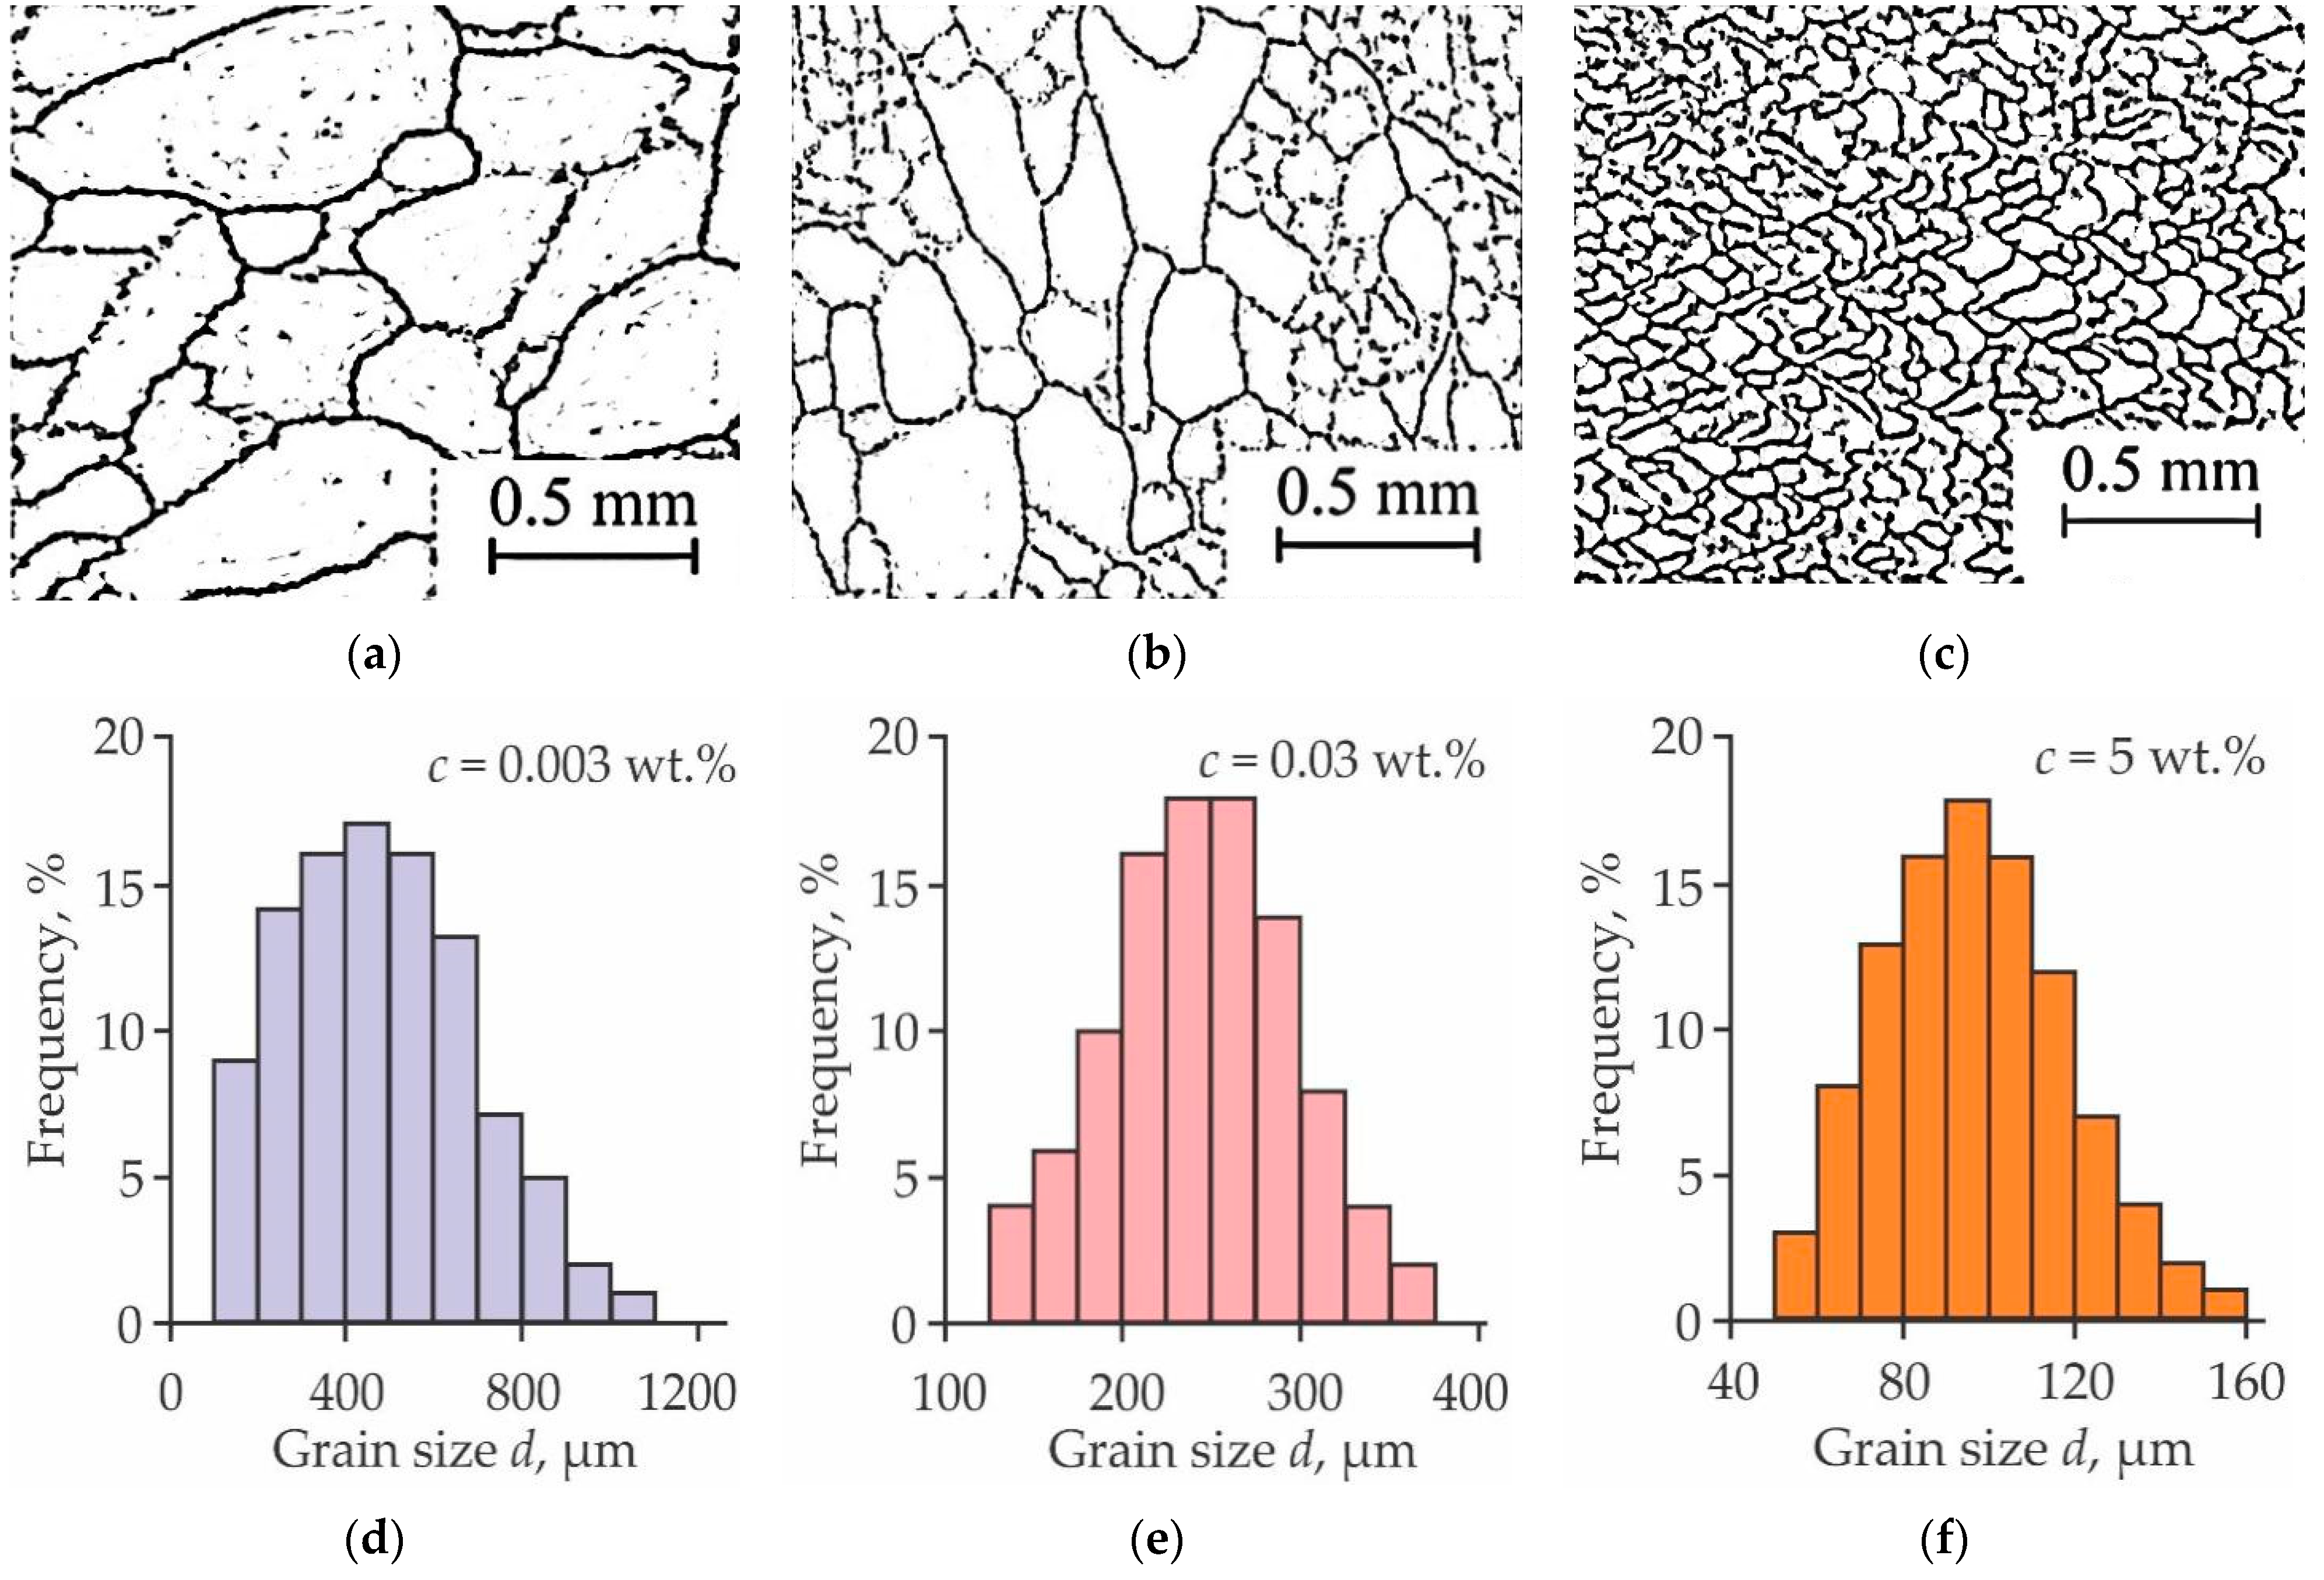
Typical optical images of ice and IC microstructure are shown in
Figure 2a–c and
Figure 3a–c for samples with different concentrations of cellulose and SiO
2 NPs, respectively. As could be seen, higher NP concentration leads to smaller grain sizes for both NP types. Technical vision technique was used to obtain grain size distribution. Characteristic grain size
d was determined as an average of grain dimensions in two perpendicular axes. The distributions corresponding to images shown in
Figure 2a–c and
Figure 3a–c are presented in
Figure 2d–f and
Figure 3d–f accordingly. On processing images of grain structure at various NPs concentrations, we have found that the size distribution
d for plain ice is wider than that of ICs and spans the ~100–~1200 µm range with
dm = 500 ± 50 µm as the most probable value. Both cellulose and SiO
2 NPs introduction results in diminishing IC grain size and narrowing size distribution with growing NP concentration. For example, the addition of 1 wt.% of cellulose NPs results in a reduction of
dm to 115 ± 5 µm, which is more than four times lower than that of pure ice, and on adding 5 wt.% of SiO
2 NPs, the
dm drops more than five times down to 95 ± 5 µm. Grains with
d 400 µm vanish completely in the presence of NPs.
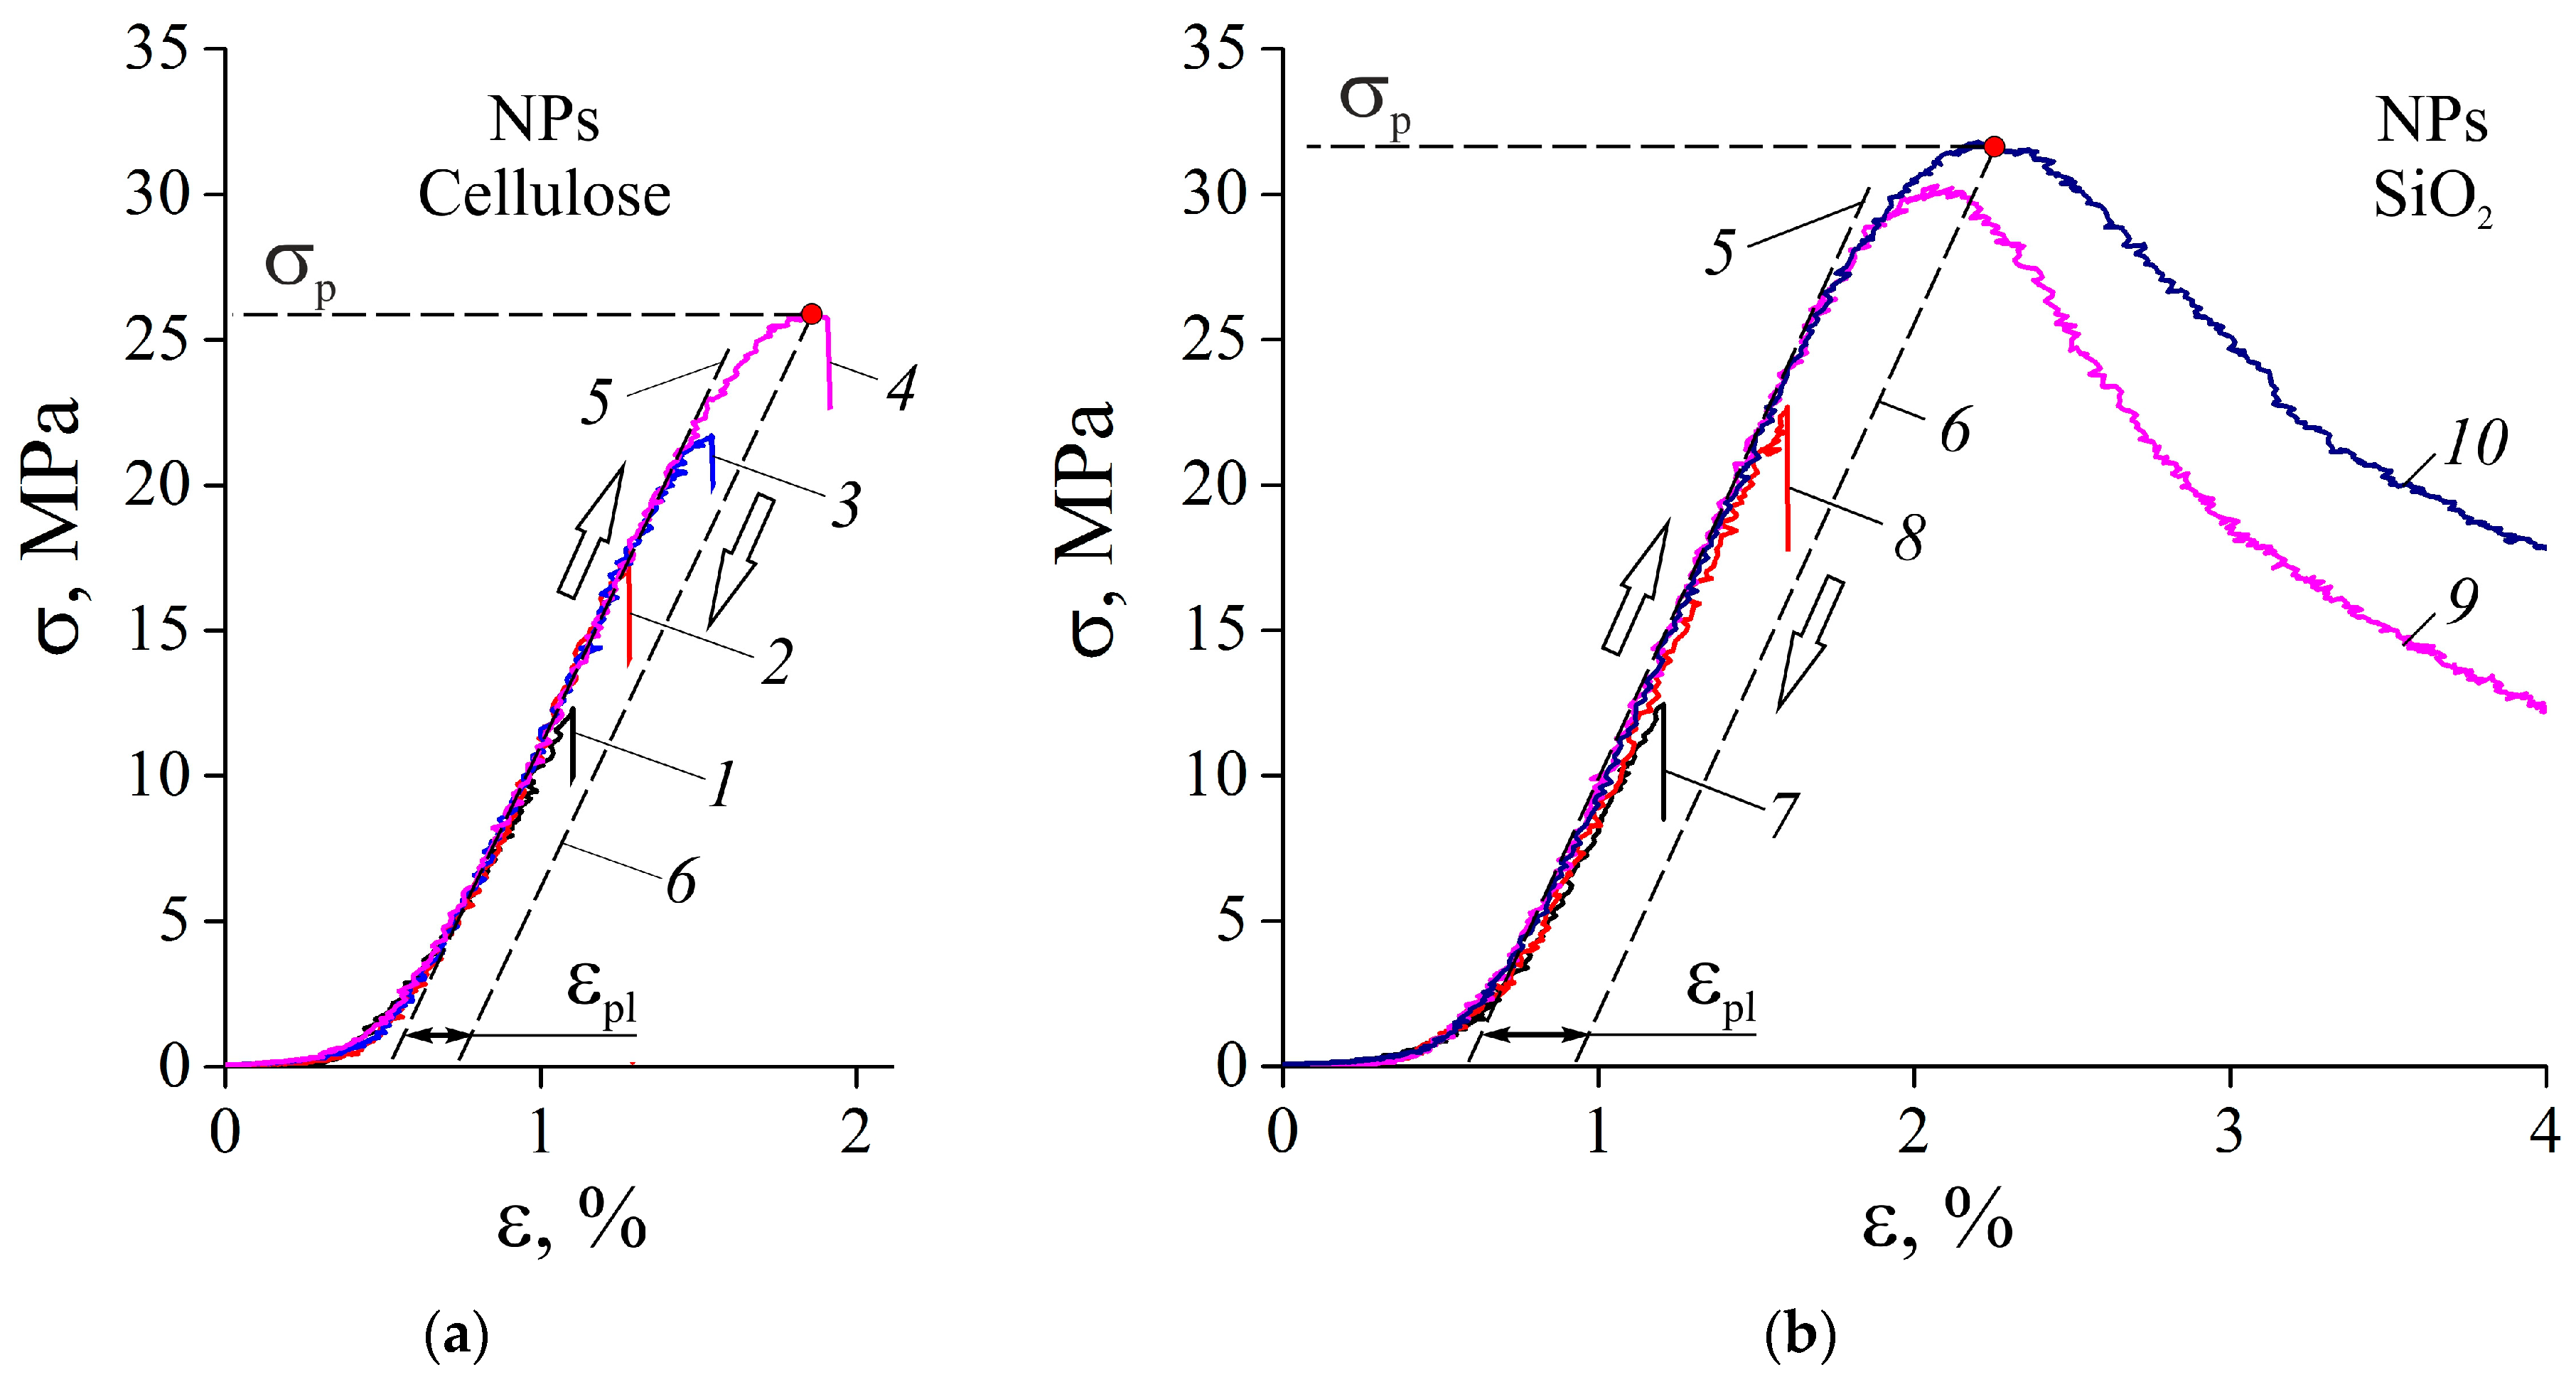
Figure 4 presents typical loading diagrams in standard σ − ε coordinates for plain ice and IC containing cellulose or SiO
2 NPs, where σ is engineering uniaxial compression stress, and ε is relative deformation. Plain ice demonstrated linear dependence of strain on stress up to sample brittle fracture without noticeable inelastic deformation except in the initial deformation stage, where the roughness of sample edges was being squashed. This initial stage has been excluded from the loading diagram analysis. The slope at the linear section of the dependence was taken as a conventional value of Young’s modulus
E. However, even a small NP concentration such as
c = 0.01–0.03% gives rise to inelastic deformation ε
pl before fracture and reliable strengthening of IC compared to plain ice. At SiO
2 NP concentration
c > 3% stress did not drop to zero abruptly on reaching peak value σ
p, but reduced gradually, and the sample kept its integrity. As a result, such ICs demonstrate some peak at the diagram and following quasiplastic flow section up to ε > 10%. It distinguished such samples from samples with lesser
c qualitatively, as long as the latter underwent brittle fracture immediately after reaching the peak load. Cellulose NP suspension was unstable at
c > 3% so we could not obtain the samples with uniform spatial distribution of NPs at higher concentrations and study their mechanical properties. We will characterize IC strengthening induced by NP additive by factor
k = σ
p/σ
p*, where σ
p* is the peak stress the plain ice can endure.
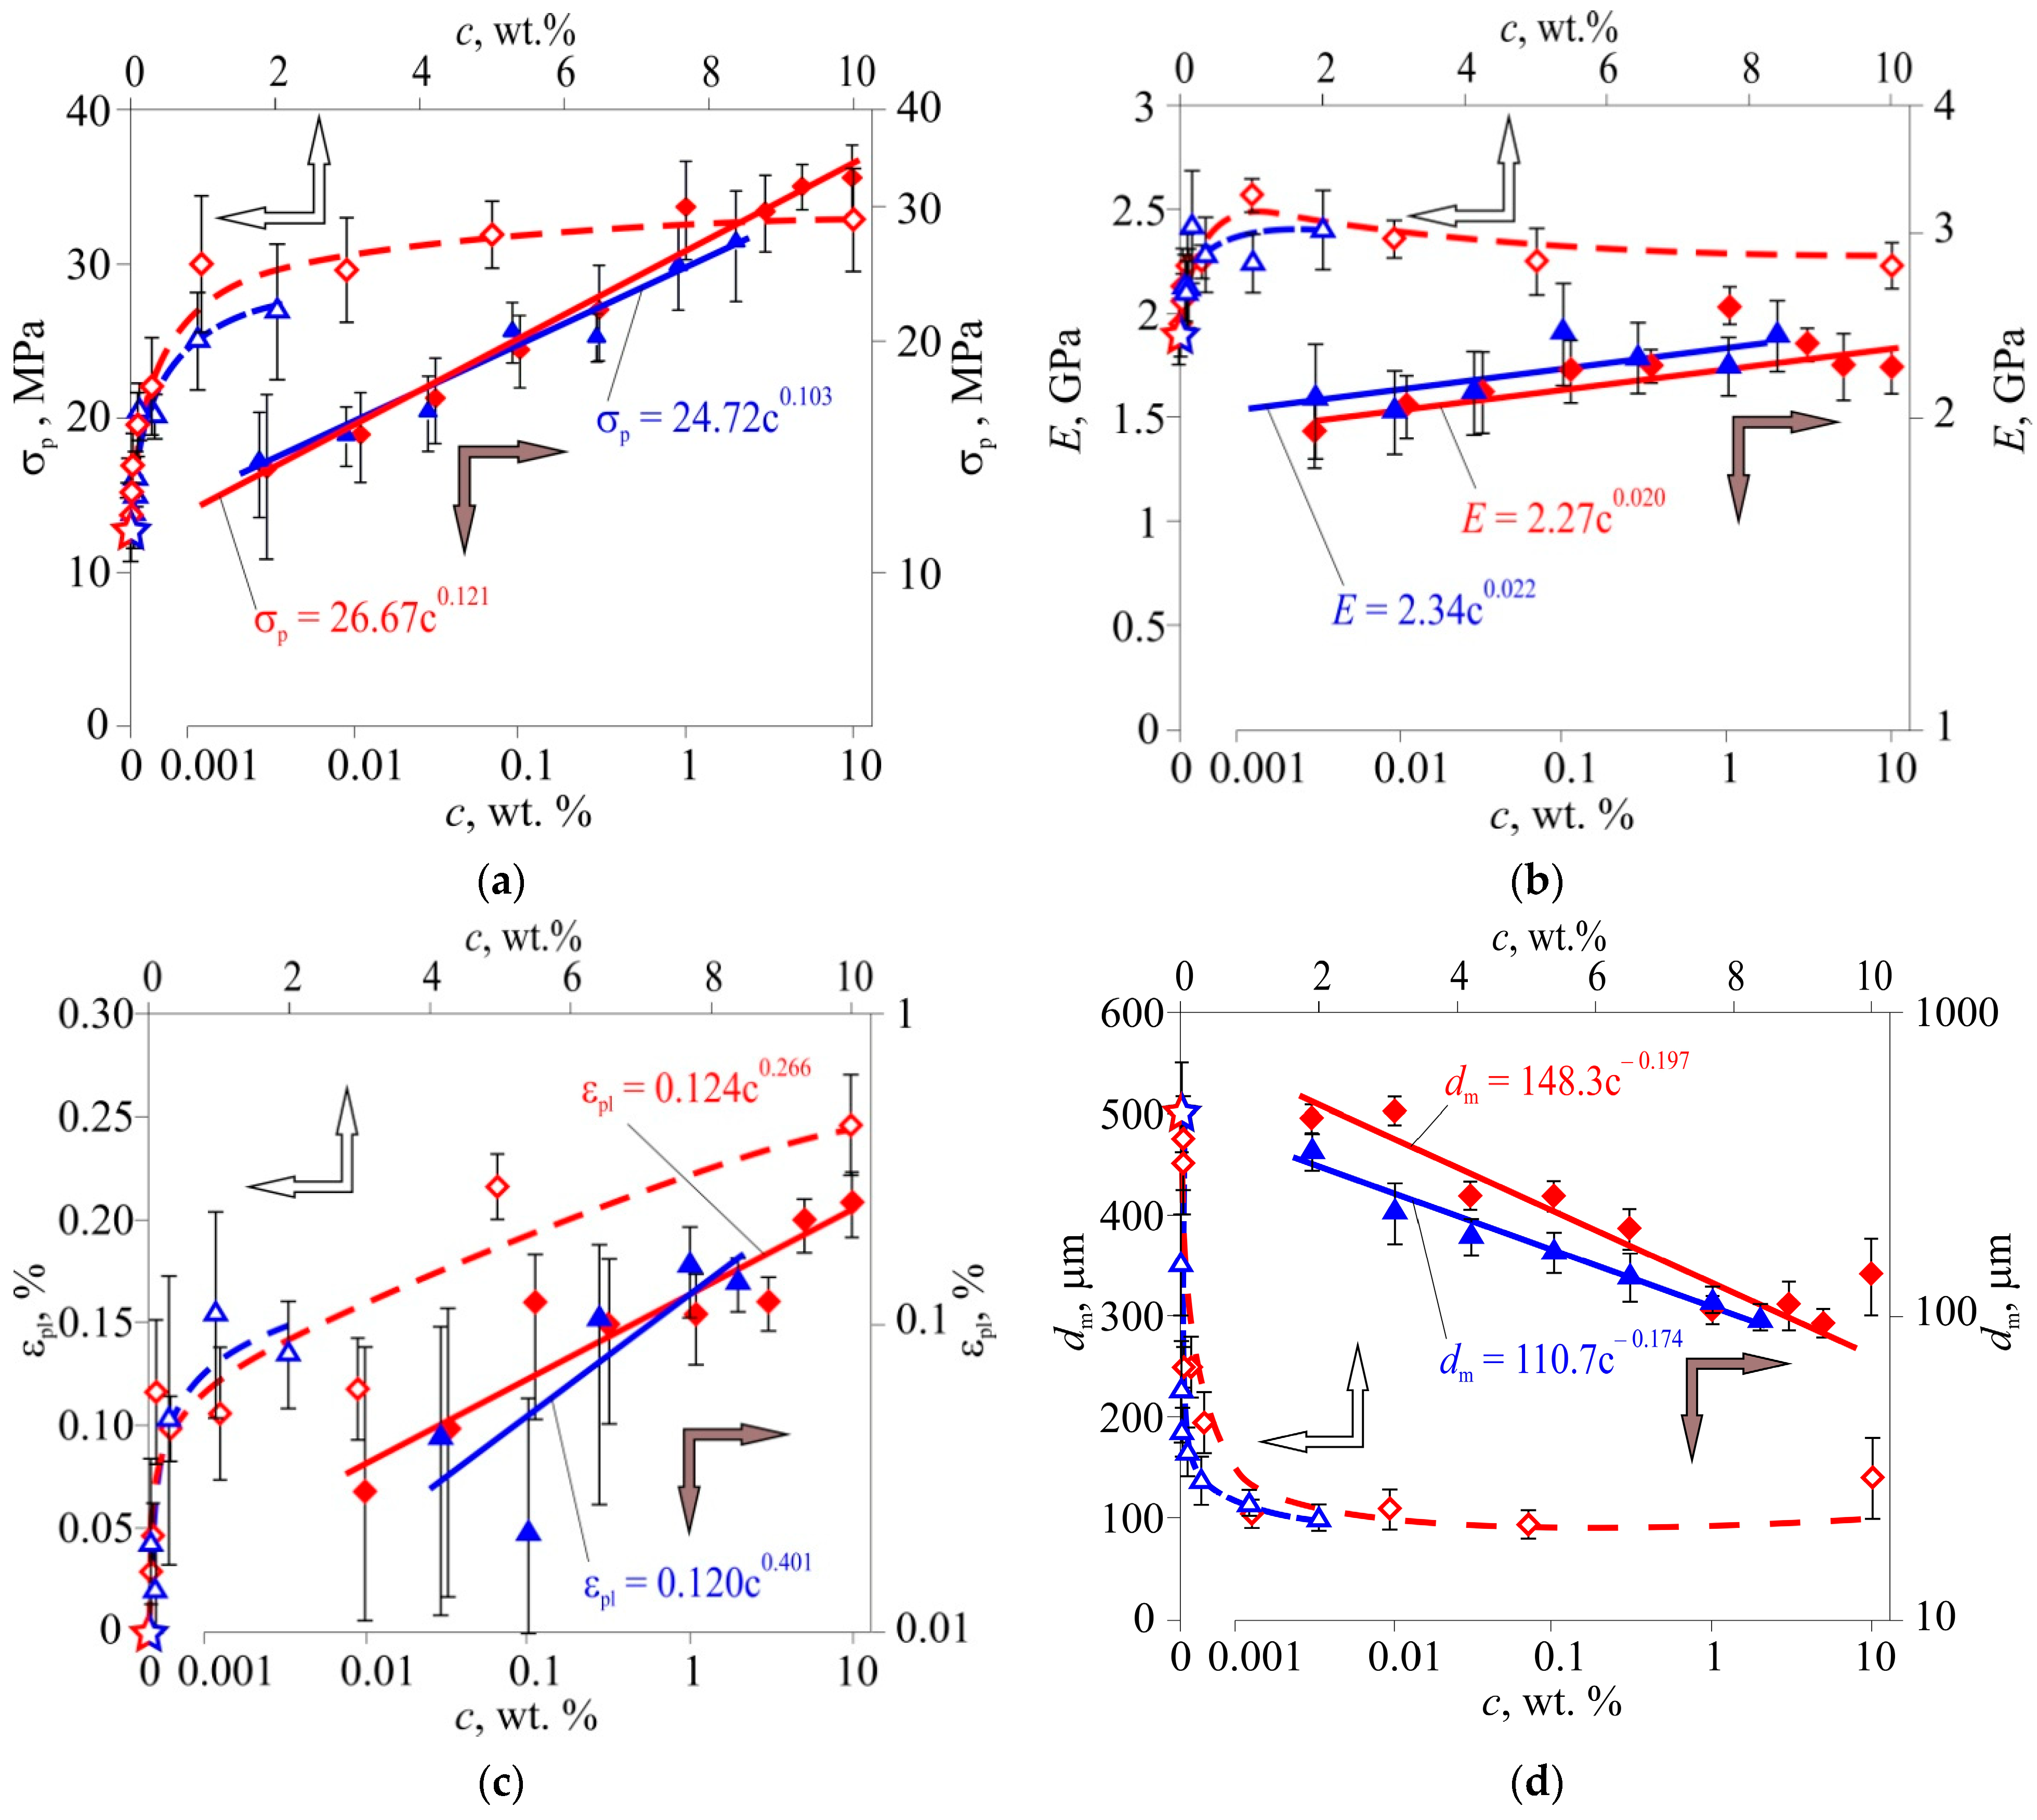
Concentration dependences of σ
p,
E, ε
pl and
dm are shown in
Figure 5. Around 150 samples were frozen and tested to reveal them. In general, these dependences demonstrated improving mechanical characteristics (
Figure 5a–c), diminishing grain size (
Figure 5d) and reducing results dispersion with growing
c. However, the sensitivity of the above characteristics to
c changes differed. The value of
k for IC with cellulose NPs reached 2 at
c = 1%, and for IC with SiO
2 NPs, it reached 2.5 at
c = 5%
, though its growth at
c > 1% slowed down substantially, and
k(
c) dependence tended to saturate. The effect of additive on Young’s modulus
E was much less pronounced than on σ
p (
Figure 5b). Peak
E value at
c = 1% did not exceed that of plain ice more than by 25%, and at higher
c it even dropped slightly (
Figure 5b).
As mentioned above, unlike plain ice, IC manifested noticeable inelastic deformation at
c > 0.01% for both studied NP types. It showed up as a deviation from linear σ–ε dependence (line 5 in
Figure 4) when stress exceeded σ
p* for the plain ice. The value of inelastic deformation ε
pl grew with
c both for cellulose and SiO
2 NPs (
Figure 5c). It should be noted that at
c > 1–3% all three studied mechanical characteristics reach saturation, so NP concentrations above 2–3% are unreasonable.
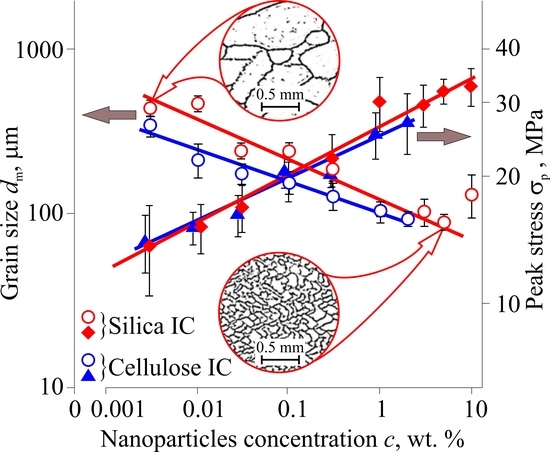
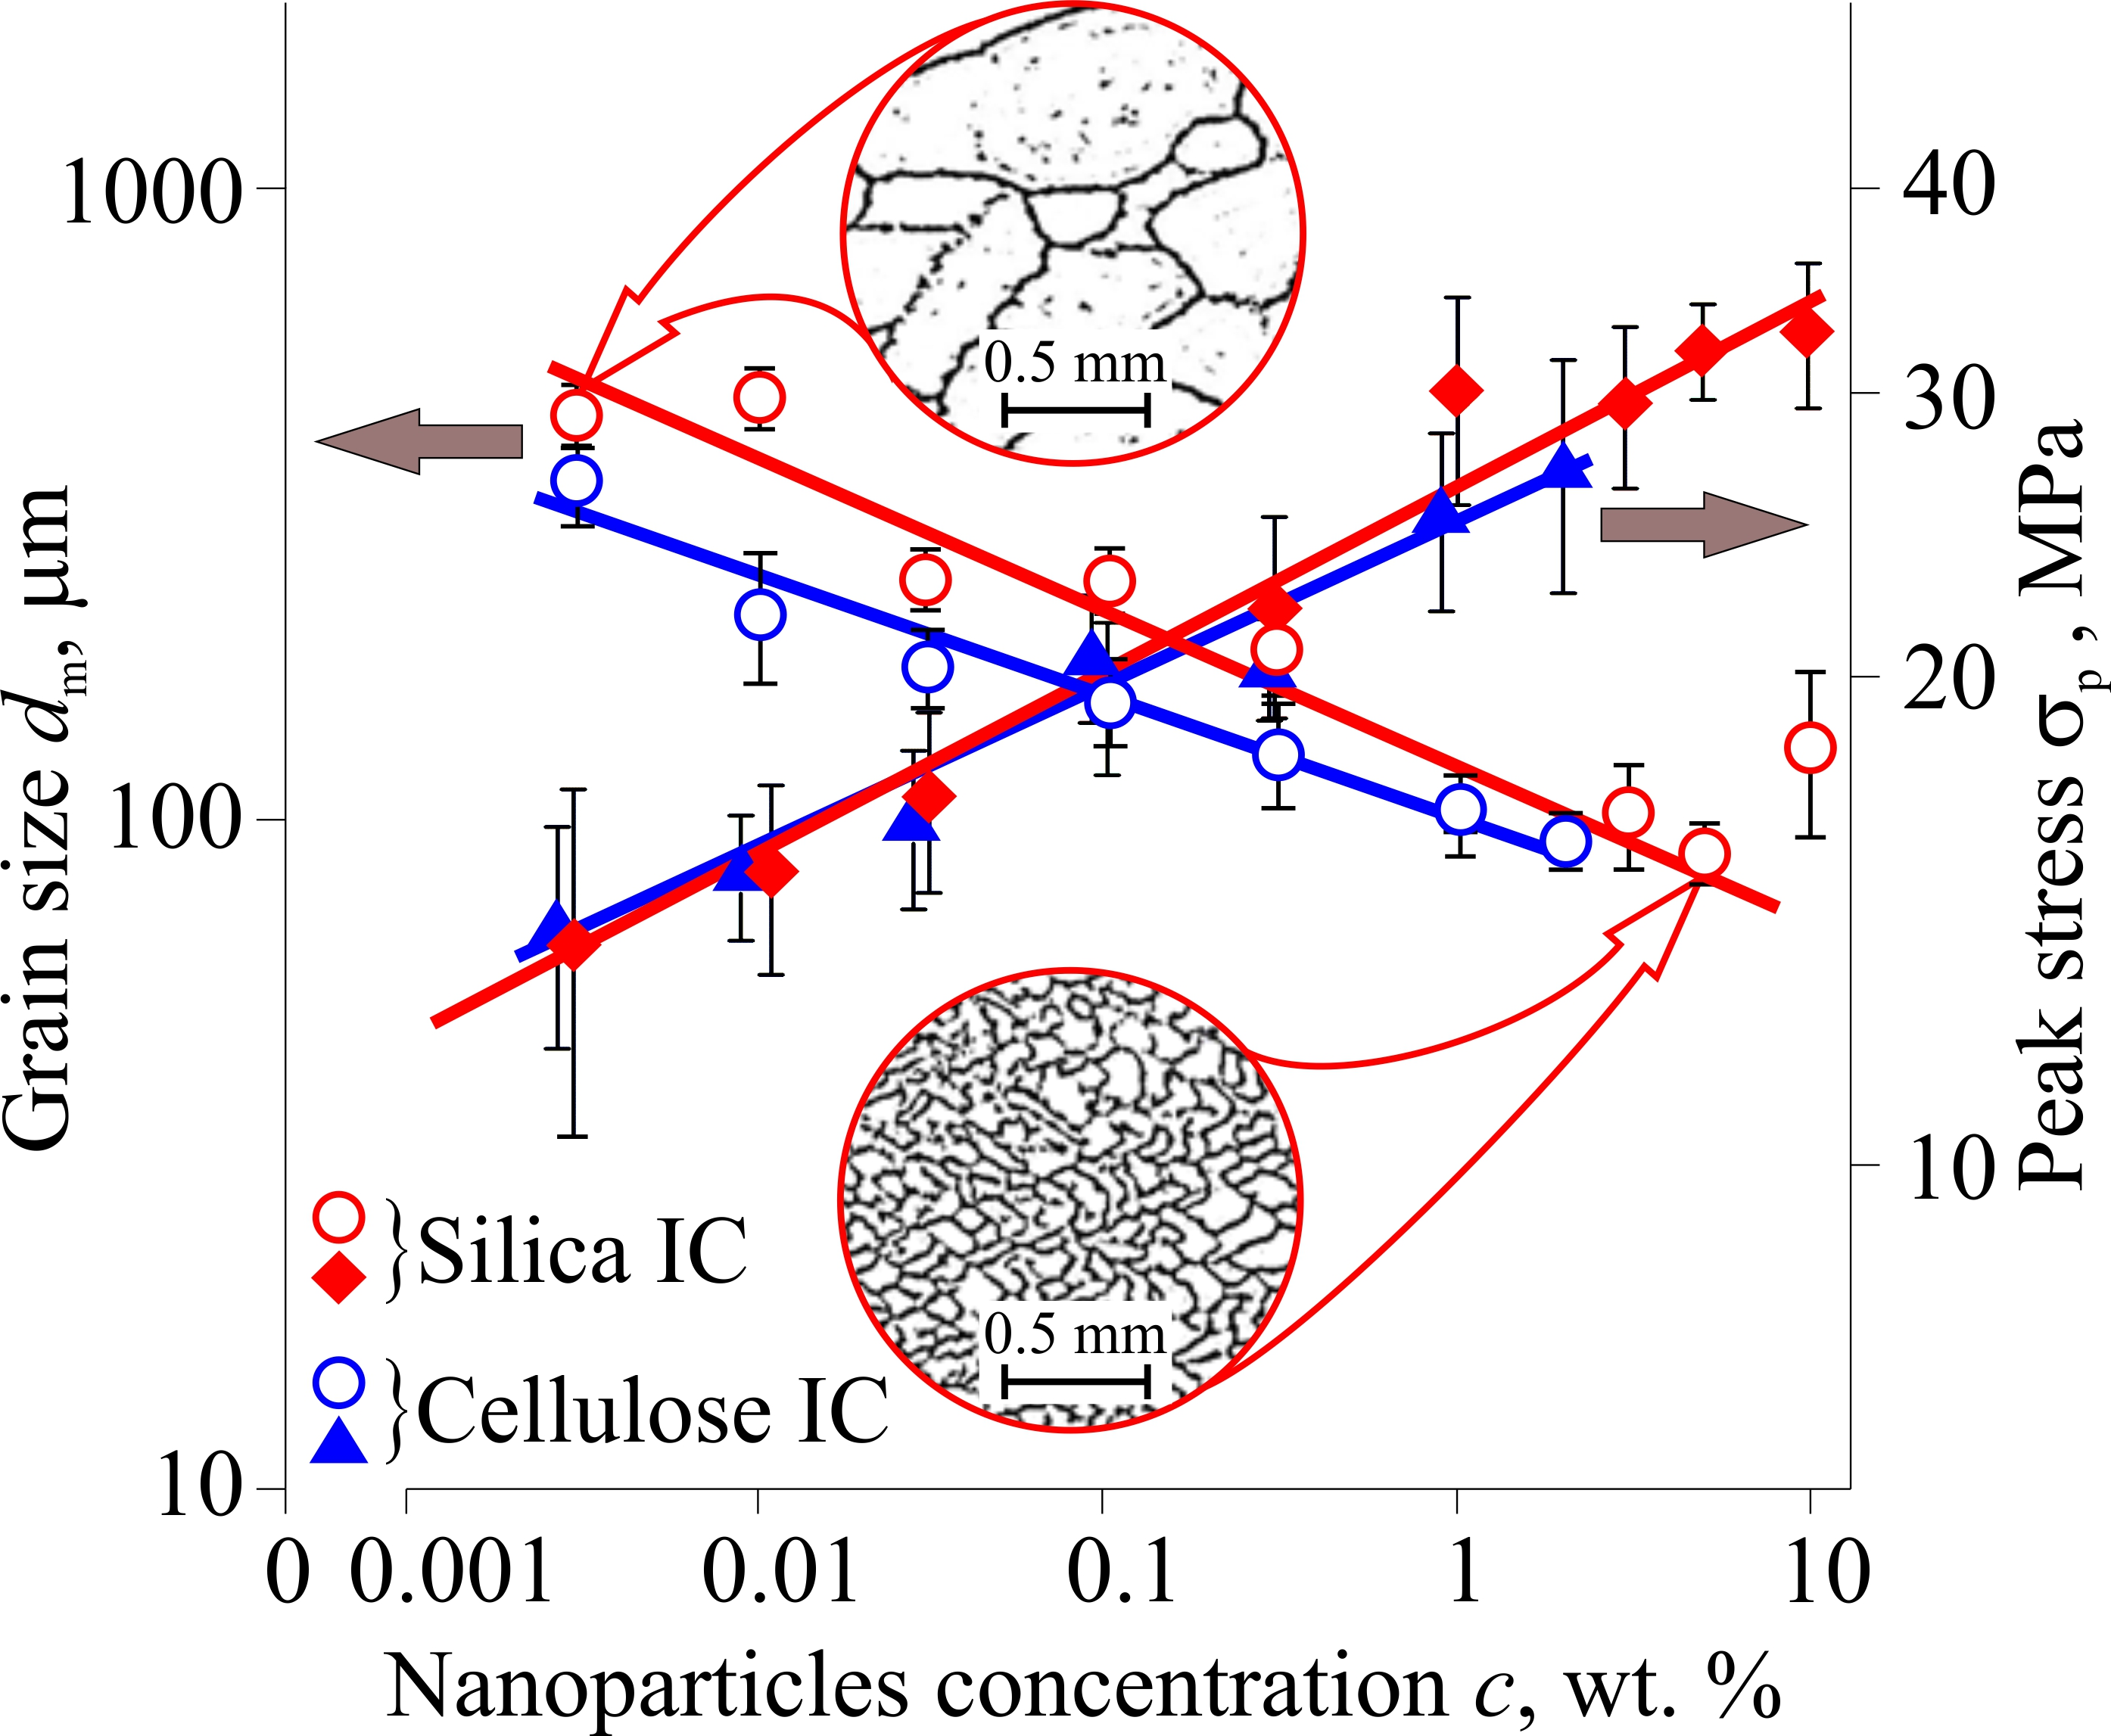
Grain size and intergrain boundaries strength can affect polycrystal’s mechanical properties significantly [
28]. As follows from
dm(
c) dependence shown in
Figure 5d, the introduction of NPs of both types at concentration 1–2% results in diminishing
dm up to sixfold compared to plain ice. In further
c increasing,
dm(
c) saturates just as concentration depends on mechanical properties. It is evidence of a strong connection between mechanical properties and the grain structure of the ice matrix.
Summing up the raw results of the experiments, one can note that IC mechanical characteristics are the most sensitive to NP concentration when the latter is in the range between 0.01 and 1–2%. Redrawing experimental data at the above
c range in double logarithmic coordinates reveals linear dependences with high correlation coefficients
r for all studied mechanical characteristics (
Table 1). For Young’s modulus, in which concentration dependence was very weak, the
r value was much lower than that for any other property. A good approximation of experimental data for mechanical properties and grain size over-concentration by linear functions in double logarithmic coordinates means power law concentration dependences for these properties with power indices
n equal to the approximation line slopes in double logarithmic coordinates. Such data representation is also shown in
Figure 5. It allows quantitative characterization and comparison of properties sensitivity to NP concentration by dimensionless
n value.
4. Discussion
Let us consider plausible mechanisms of revealed IC strengthening caused by cellulose and SiO
2 NPs introduction. As long as significant grain size reduction with growing NP concentration is established, let us discuss the related mechanisms above all. This grain diminishing is obviously due to the increase in heterogeneous crystallization centers number at higher
c. Grain size, grain boundaries, triple joints and texture are the most important elements of polycrystal ice structure. Grain boundaries are dislocations source and drains, stress concentrators, and places for easy crack nucleation and boundary slipping [
28]. It is known that the strengthening effect of grain boundaries, in general, can be described by empiric Hall–Petch relation [
1,
2,
28]
where
A,
K and
n ≈ 0.5 can be treated as material constants at the first approximation. Similar relations govern the inhibition of dislocation multiplication, mobility in basic slip planes due to dispersion strengthening, and breaking of dislocation ensembles through grain boundary. In the latter case,
n can differ from 0.5 slightly and lie between 0.3 and 0.8.
The low crack resistance of ice which is an order of magnitude lower than that of silicate glasses means easy microcrack nucleation in it. The strength of grain boundaries in ice is usually many times lower than that of grains themselves, so the cracks nucleate mostly at grain boundaries. The crack’s initial mean length is determined by grain size so that lower
dm can result in strengthening according to Griffith’s relation [
3]
where
B = (2
Eγ)
1/2 and γ is effective surface energy.
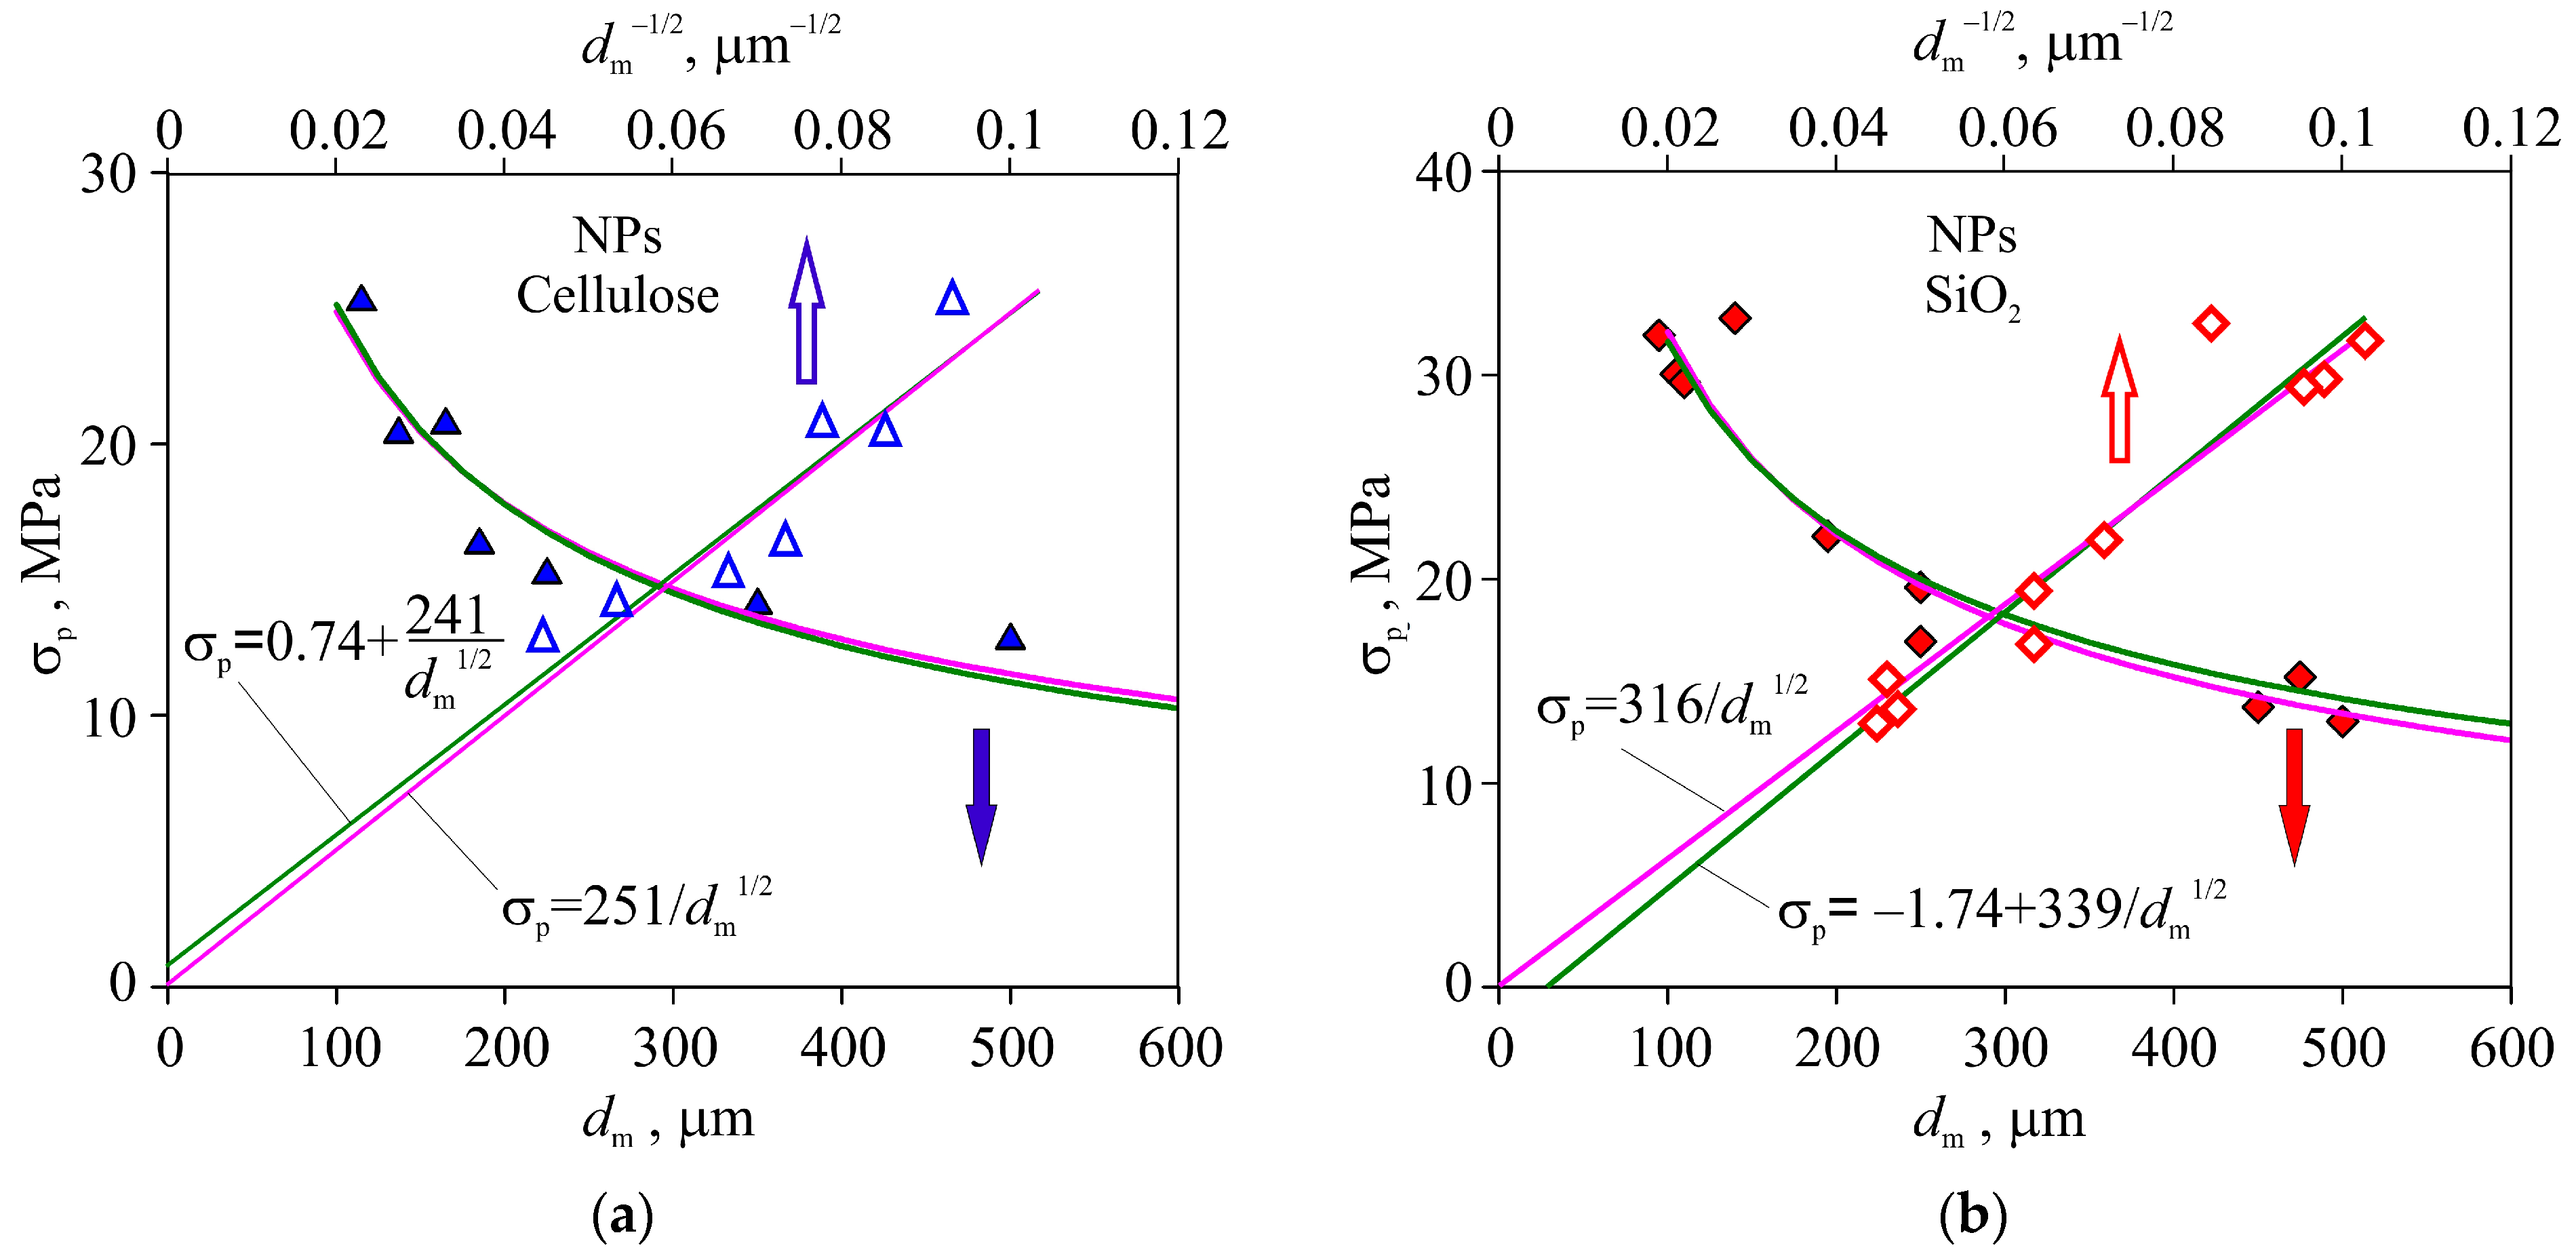
To choose an actual strengthening mechanism from the above alternatives, which are governed by resembling relations, σ
p(dm) dependence has been plotted and analyzed (
Figure 6). As long as concentration dependences of both maximal stress and grain size obey a power law, one should expect the dependence of stress upon grain size obeys it as well. Combining data for σ
p(
c) and
dm(
c) and reducing the
c variable, one can obtain the power law relation for σ
p(
dm) with power index
n = −0.6 ± 0.1. Additionally, as discussed in [
27], non-linear regression [
29] of experimental data on σ
p(
dm) in IC containing SiO
2 NPs by power law functions gives a power index close to −0.5, too.
On this basis, we have used linear regression in σ
p—
dm−1/2 coordinates in this paper. As a result, the following values of additive term
A in (1) and correlation coefficient
r have been found:
A = −1.7 ± 2.2 MPa with
r = 0.956 for SiO
2 NPs, and
A = 0.7 ± 2.2 MPa with
r = 0.932 for cellulose NPs. As long as the above two samples turn out to be statistically indiscernible, the datasets have been joined, and the following results have been obtained:
A = 1.8 ± 3.5 MPa with
r = 0.893 for the generalized sample. Taking high values of correlation coefficients and the range 10–30 MPa of σ
p into account, the value of additive term can be considered as zero within experiment accuracy, and the experimental dependence σ
p(
dm) as obeying power law σ
p =
B dm−1/2 coinciding to (2). This dependence is shown in
Figure 6 both in linear σ
p—
dm and linearizing σ
p—
dm−1/2 coordinates.
So, the processing of experimental data is evidence that the most preferable mechanism of IC deformation and fracture involves intergrain propagation of the cracks nucleated at the basis of defects with initial size strictly and linearly related to grain size.
In addition to grain diminish and related effects, other mechanisms of NPs’ impact on mechanical properties are plausible including dispersion strengthening, grain boundary strengthening, hindering dislocation nucleation and movement within the grain and breakthrough grain boundaries, crack nucleation and propagation, grain slippage, and others. Emergence and development of irreversible deformation before reaching peak stress and afterward means the transition from brittle fracture typical for plain ice to ductile fracture at larger c. The nature of such transition can be very diverse, too. However, the similarity of results for two significantly different types of NPs and high correlation coefficient for σp—dm−1/2 dependence for the generalized sample means that in the first approximation, the NPs effect is mainly determined by the induced change of grain size in the studied range of NPs concentration. Obvious restrictions on NP properties include their ability to serve as nucleation centers in ice crystallization and NPs suspension stability relative to aggregation, but otherwise, the physical and chemical properties of utilized NPs are of minimal importance.
Elucidation of detailed mechanisms of NP effect on IC mechanical properties and their potential requires more thorough and systematic experimental research employing NPs of various nature, morphology, size and concentration.
5. Conclusions
The paper presents an experimental study of ice strengthening by adding cellulose and silica nanoparticles to the distilled water to be frozen. It is shown that the highest gain in compressive strength and inelastic deformation before fracture takes place at NP concentration changing from 0.01 to 1 wt.%. Further concentration increase affects mechanical characteristics only slightly, reaching saturation at c = 3–5%, and can even lead to their deterioration at c higher than that. Additionally, NP introduction results in changing fracture mode from brittle to ductile with total deformation before disintegration exceeding 10%. Within the experiment accuracy, the effect of cellulose and silica NPs cannot be discerned despite significant differences in NP composition, morphology and some difference in average size. It is found that inelastic deformation before fracture is the property the most sensitive to NP concentration, while Young’s modulus is the least one, and compressive strength lies in between. Emergence and growth of inelastic deformation before reaching peak stress and after that means an increase in fracture energy and transition from brittle fracture typical for plain ice to ductile fracture in growing c.
Introduction of NPs acting as additional nuclei for heterogeneous crystallization results in diminishing grain size of polycrystalline ice with increasing NP concentration. Experimental dependence of strength upon average grain size obeys the law similar to Hall–Petch or Griffith’s, but is in much better accordance with the latter. It means that the prevailing factor limiting polycrystalline ice strength is the length of Griffith’s cracks at grain boundaries determined by grain size. This result points out the direction for further search and development of techniques for IC strengthening consisting of prevention or impeding crack propagation. In addition to the effect on grain size, NPs could possibly modify the grain morphology and structure of the grain interior and boundaries in some cases, impeding dislocation multiplication and mobility and microcracks development. Revealing contributions of other micromechanisms of ice strengthening by NPs of various natures, morphology, size, and concentration, the optimal choice of NP properties, methods of NPs preparation and introduction to suspension require additional complex studies.
Obtained results suggest directions for further search and development of IC strengthening techniques by modifying ice microstructure and stimulating the development and employment of novel physical approaches and techniques for ice strengthening on the basis of various possible strengthening mechanisms known in physical material science. These mechanisms are proven reliable for many other structured materials, and there is no reason for them to fail on ice.
Strengthening techniques employing NPs can be developed and applied both as standalone and in conjunction with other ice strengthening techniques, such as chemical modification of ice matrix using soluble polymeric additives, reinforcement by natural or synthetic microfiber, thermal and mechanical processing and others.
Author Contributions
Conceptualization, Y.I.G. and V.M.B.; methodology, Y.I.G. and D.Y.G.; software, D.Y.G.; validation, A.I.T.; formal analysis, D.Y.G.; investigation, A.A.S., V.V.R., V.M.V. and S.S.R.; resources, A.I.T. and A.A.S.; data curation, V.M.V. and S.S.R.; writing—original draft preparation, Y.I.G., D.Y.G. and V.V.R.; writing—review and editing, Y.I.G. and D.Y.G.; visualization, A.I.T. and A.A.S.; supervision, Y.I.G.; project administration, Y.I.G.; funding acquisition, Y.I.G. and V.M.B. All authors have read and agreed to the published version of the manuscript.
Funding
This research was funded by the Russian Scientific Foundation, grant number 22-19-00577, and experimental results were obtained using the equipment of the Center for Collective Use of Scientific Equipment of Tambov State University named after G.R. Derzhavin.
Data Availability Statement
All data included in this study are available upon request from the corresponding author.
Conflicts of Interest
The authors declare no conflict of interest. The funders had no role in the design of the study; in the collection, analyses, or interpretation of data; in the writing of the manuscript; or in the decision to publish the results.
References
- Arenson, L.U.; Colgan, W.; Marshall, H.P. Physical, thermal, and mechanical properties of snow, ice, and permafrost. In Snow and Ice-Related Hazards, Risks, and Disasters; Haeberli, W., Whiteman, C., Shroder, J.F., Eds.; Elsevier Inc.: Amsterdam, The Netherlands, 2015; pp. 35–71. [Google Scholar] [CrossRef]
- Timco, G.W.; Weeks, W.F. A review of the engineering properties of sea ice. Cold Reg. Sci. Technol. 2010, 60, 107–129. [Google Scholar] [CrossRef]
- Schulson, E.M.; Duval, P. Creep and Fracture of Ice; Cambridge University Press: Cambridge, UK, 2009; 401p. [Google Scholar]
- Li, J.H.; Wei, Z.; Wu, C. Preparation and properties of novel building materials at low temperature. Mater. Des. 2015, 67, 464–468. [Google Scholar] [CrossRef]
- Vasiliev, N.K.; Pronk, A.D.C.; Shatalina, I.N.; Janssen, F.H.M.E.; Houben, R.W.G. A review on the development of reinforced ice for use as a building material in cold regions. Cold Reg. Sci. Technol. 2015, 115, 56–63. [Google Scholar] [CrossRef]
- Wu, Y.; Lou, X.; Liu, X.; Pronk, A. The property of fiber reinforced ice under uniaxial compression. Mater. Struct. 2020, 53, 29. [Google Scholar] [CrossRef]
- Pronk, A.; Vasiliev, N.; Belis, J. Historical development of structural ice. In Structures and Architecture; Cruz, P.J., Ed.; CRC Press: Boca Raton, FL, USA, 2016; pp. 339–347. [Google Scholar] [CrossRef]
- Gold, L.W. Building ships from ice: Habbakuk and after. Interdiscip. Sci. Rev. 2004, 29, 373–384. [Google Scholar] [CrossRef]
- Vasiliev, N.K. On development of fibre-ice-composites. Cold Reg. Sci. Technol. 1993, 21, 195–199. [Google Scholar] [CrossRef]
- Buznik, V.M.; Goncharova, G.Y.; Grinevich, D.V.; Nuzhny, G.A.; Razomasov, N.D.; Turalin, D.O. Strengthening of ice with basalt materials. Cold Reg. Sci. Technol. 2022, 196, 103490. [Google Scholar] [CrossRef]
- Nuzhnyi, G.A.; Buznik, V.M.; Cherepanin, R.N.; Razomasov, N.D.; Goncharova, G.Y. Physicomechanical Properties of Ice Composite Materials Reinforced with Carbon Fillers. Inorg. Mater. Appl. Res. 2021, 12, 236–241. [Google Scholar] [CrossRef]
- Lou, X.; Wu, Y. Splitting tensile mechanical properties of plain ice and fiber—Reinforced ice. Cold Reg. Sci. Technol. 2021, 192, 103381. [Google Scholar] [CrossRef]
- Pronk, A.; Mistur, M.; Li, Q.; Liu, X.; Blok, R.; Liu, R.; Wu, Y.; Luo, P.; Dong, Y. The 2017–18 design and construction of ice composite structures in Harbin. Structures 2019, 18, 117–127. [Google Scholar] [CrossRef]
- Wu, Y.; Liu, X.; Chen, B.; Li, Q.; Luo, P.; Pronk, A. Design, construction and monitoring of an ice composite shell structure. Autom. Constr. 2019, 106, 102862. [Google Scholar] [CrossRef]
- Petrenko, V.F.; Whitworth, R.W. Physics of Ice; Oxford University Press: Oxford, UK, 2002; 392p. [Google Scholar]
- Pokluda, J.; Černý, M.; Šandera, P.; Šob, M. Calculations of theoretical strength: State of the art and history. J. Comput.-Aided Mater. Des. 2004, 11, 1–28. [Google Scholar] [CrossRef]
- Lu, Q.; Ma, Y.; Yang, W. Effect of high molecular weight PVA on mechanical properties of ice. Acta Polym. Sin. 2009, 009, 1166–1169. [Google Scholar] [CrossRef]
- Goncharova, G.Y.; Razomasov, N.D.; Borshchev, G.V.; Buznik, V.M. Chemically Modifying Ice and Ice-Based Materials to Control Their Properties. Theor. Found. Chem. Eng. 2021, 55, 1045–1055. [Google Scholar] [CrossRef]
- Goncharova, G.Y.; Stepanov, R.O.; Razomasova, T.S.; Korolev, I.A.; Turalin, D.O.; Kulagin, Y.A.; Parshikov, Y.G. A new method of strengthening of ice blocks formed under conditions of natural cold. Russ. J. Gen. Chem. 2021, 91 (Suppl. S1), S34–S40. [Google Scholar] [CrossRef]
- Xie, J.; Yan, M.-L.; Yan, J.-B. Experimental study on PVA reinforced salt-water ice under uniaxial-compression at arctic low temperatures. Cold Reg. Sci. Technol. 2022, 206, 103751. [Google Scholar] [CrossRef]
- Yan, M.-L.; Xie, J.; Yan, J.-B. Experimental study on size effect and durability properties of PVA reinforced ice at Arctic low temperatures. J. Build. Eng. 2023, 65, 105757. [Google Scholar] [CrossRef]
- Gao, W.; Smith, D.W.; Sego, D.C. Ice nucleation in industrial wastewater. Cold Reg. Sci. Technol. 1999, 29, 121–133. [Google Scholar] [CrossRef]
- John, M.; Suominen, M.; Sormunen, O.-V.; Hasan, M.; Kurvinen, E.; Kujala, P.; Mikkola, A.; Louhi-Kultanen, M. Purity and mechanical strength of naturally frozen ice in wastewater basins. Water Res. 2018, 145, 418–428. [Google Scholar] [CrossRef]
- Deng, Y.; Li, Z.; Li, Z.; Wang, J. The experiment of fracture mechanics characteristics of Yellow River Ice. Cold Reg. Sci. Technol. 2019, 168, 102896. [Google Scholar] [CrossRef]
- Li, T.; Zhao, Y.; Zhong, Q.; Wu, T. Inhibiting ice recrystallization by nanocelluloses. Biomacromolecules 2019, 20, 1667–1674. [Google Scholar] [CrossRef] [PubMed]
- Li, T.; Zhong, Q.; Zhao, B.; Lenaghan, S.; Wang, S.; Wu, T. Effect of surface charge density on the ice recrystallization inhibition activity of nanocelluloses. Carbohydr. Polym. 2020, 234, 115863. [Google Scholar] [CrossRef] [PubMed]
- Golovin, Y.I.; Samodurov, A.A.; Rodaev, V.V.; Tyurin, A.I.; Golovin, D.Y.; Razlivalova, S.S.; Buznik, V.M. Strengthening of polycrystalline ice by silica nanoparticles. Tech. Phys. Lett. 2023, in press.
- Cole, D.M. The microstructure of ice and its influence on mechanical properties. Eng. Fract. Mech. 2001, 68, 1797–1822. [Google Scholar] [CrossRef]
- Press, W.H.; Teukolsky, S.A.; Vetterling, W.T.; Flannery, B.P. Numerical Recipes in C: The Art of Scientific Computing, 2nd ed.; Cambridge University Press: Cambridge, UK, 1992; 1018p. [Google Scholar]
| Disclaimer/Publisher’s Note: The statements, opinions and data contained in all publications are solely those of the individual author(s) and contributor(s) and not of MDPI and/or the editor(s). MDPI and/or the editor(s) disclaim responsibility for any injury to people or property resulting from any ideas, methods, instructions or products referred to in the content. |
© 2023 by the authors. Licensee MDPI, Basel, Switzerland. This article is an open access article distributed under the terms and conditions of the Creative Commons Attribution (CC BY) license (https://creativecommons.org/licenses/by/4.0/).


