Sarcopenia in Neurological Patients: Standard Values for Temporal Muscle Thickness and Muscle Strength Evaluation

 , , , , and
Abstract
:1. Introduction
2. Methods
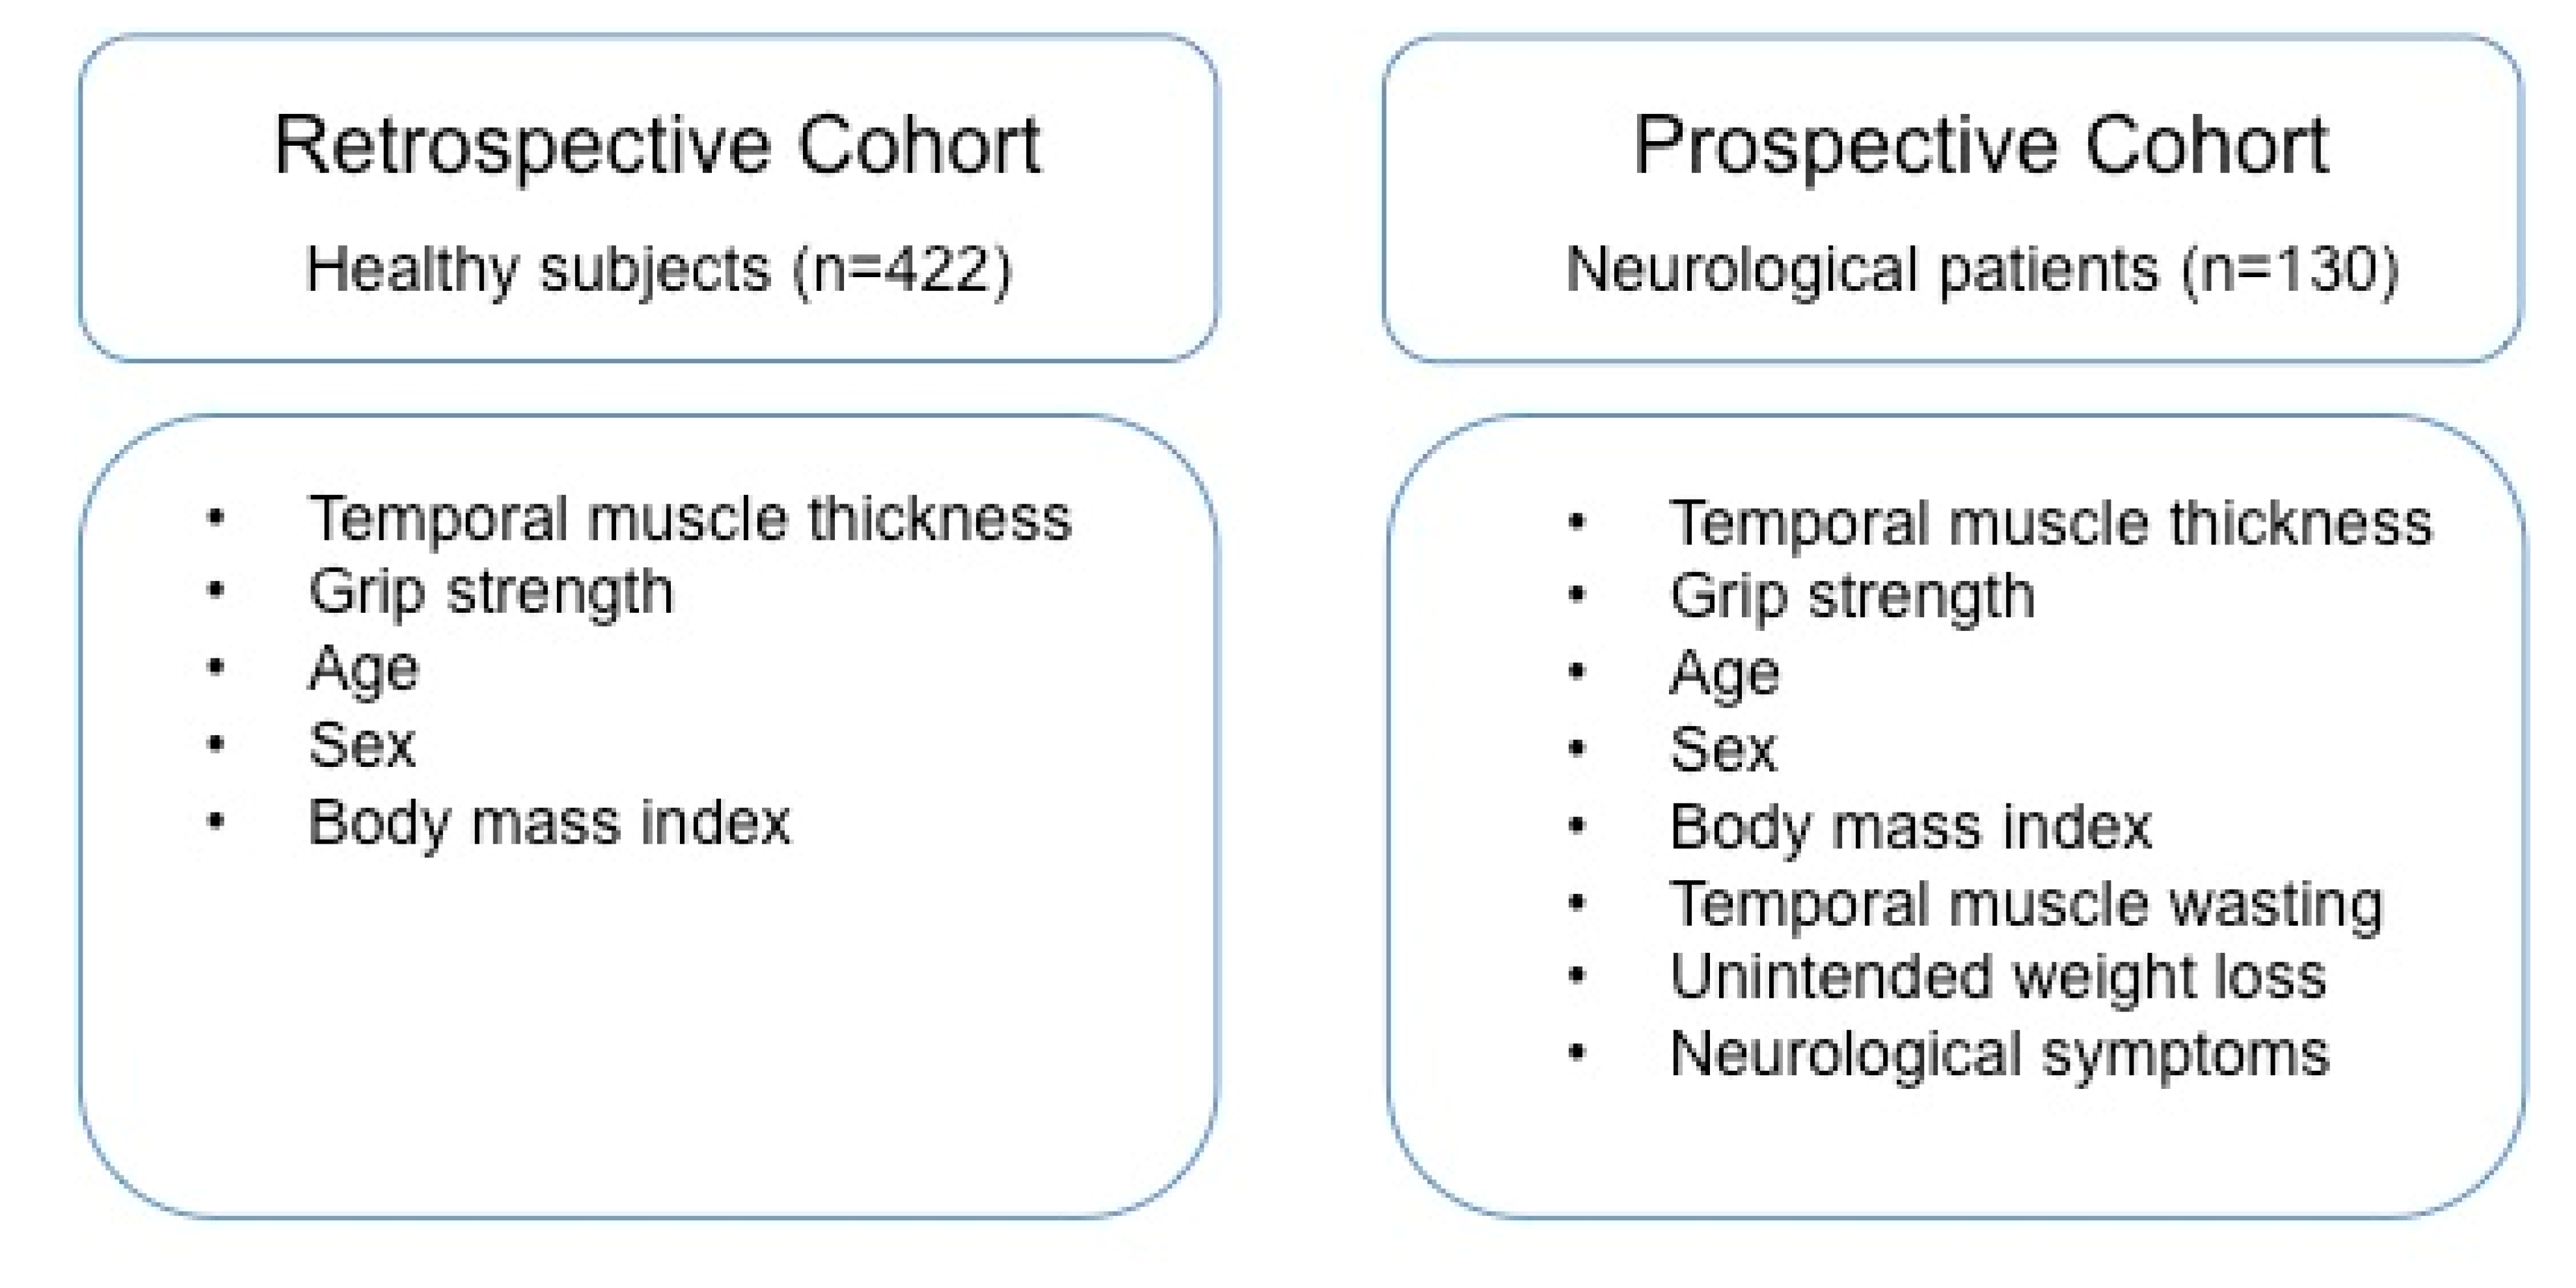
2.1. Study Cohorts
2.2. TMT Measurements
2.3. Clinical Examinations
2.4. Statistical Analysis
3. Results
3.1. Reference Mean TMT Values
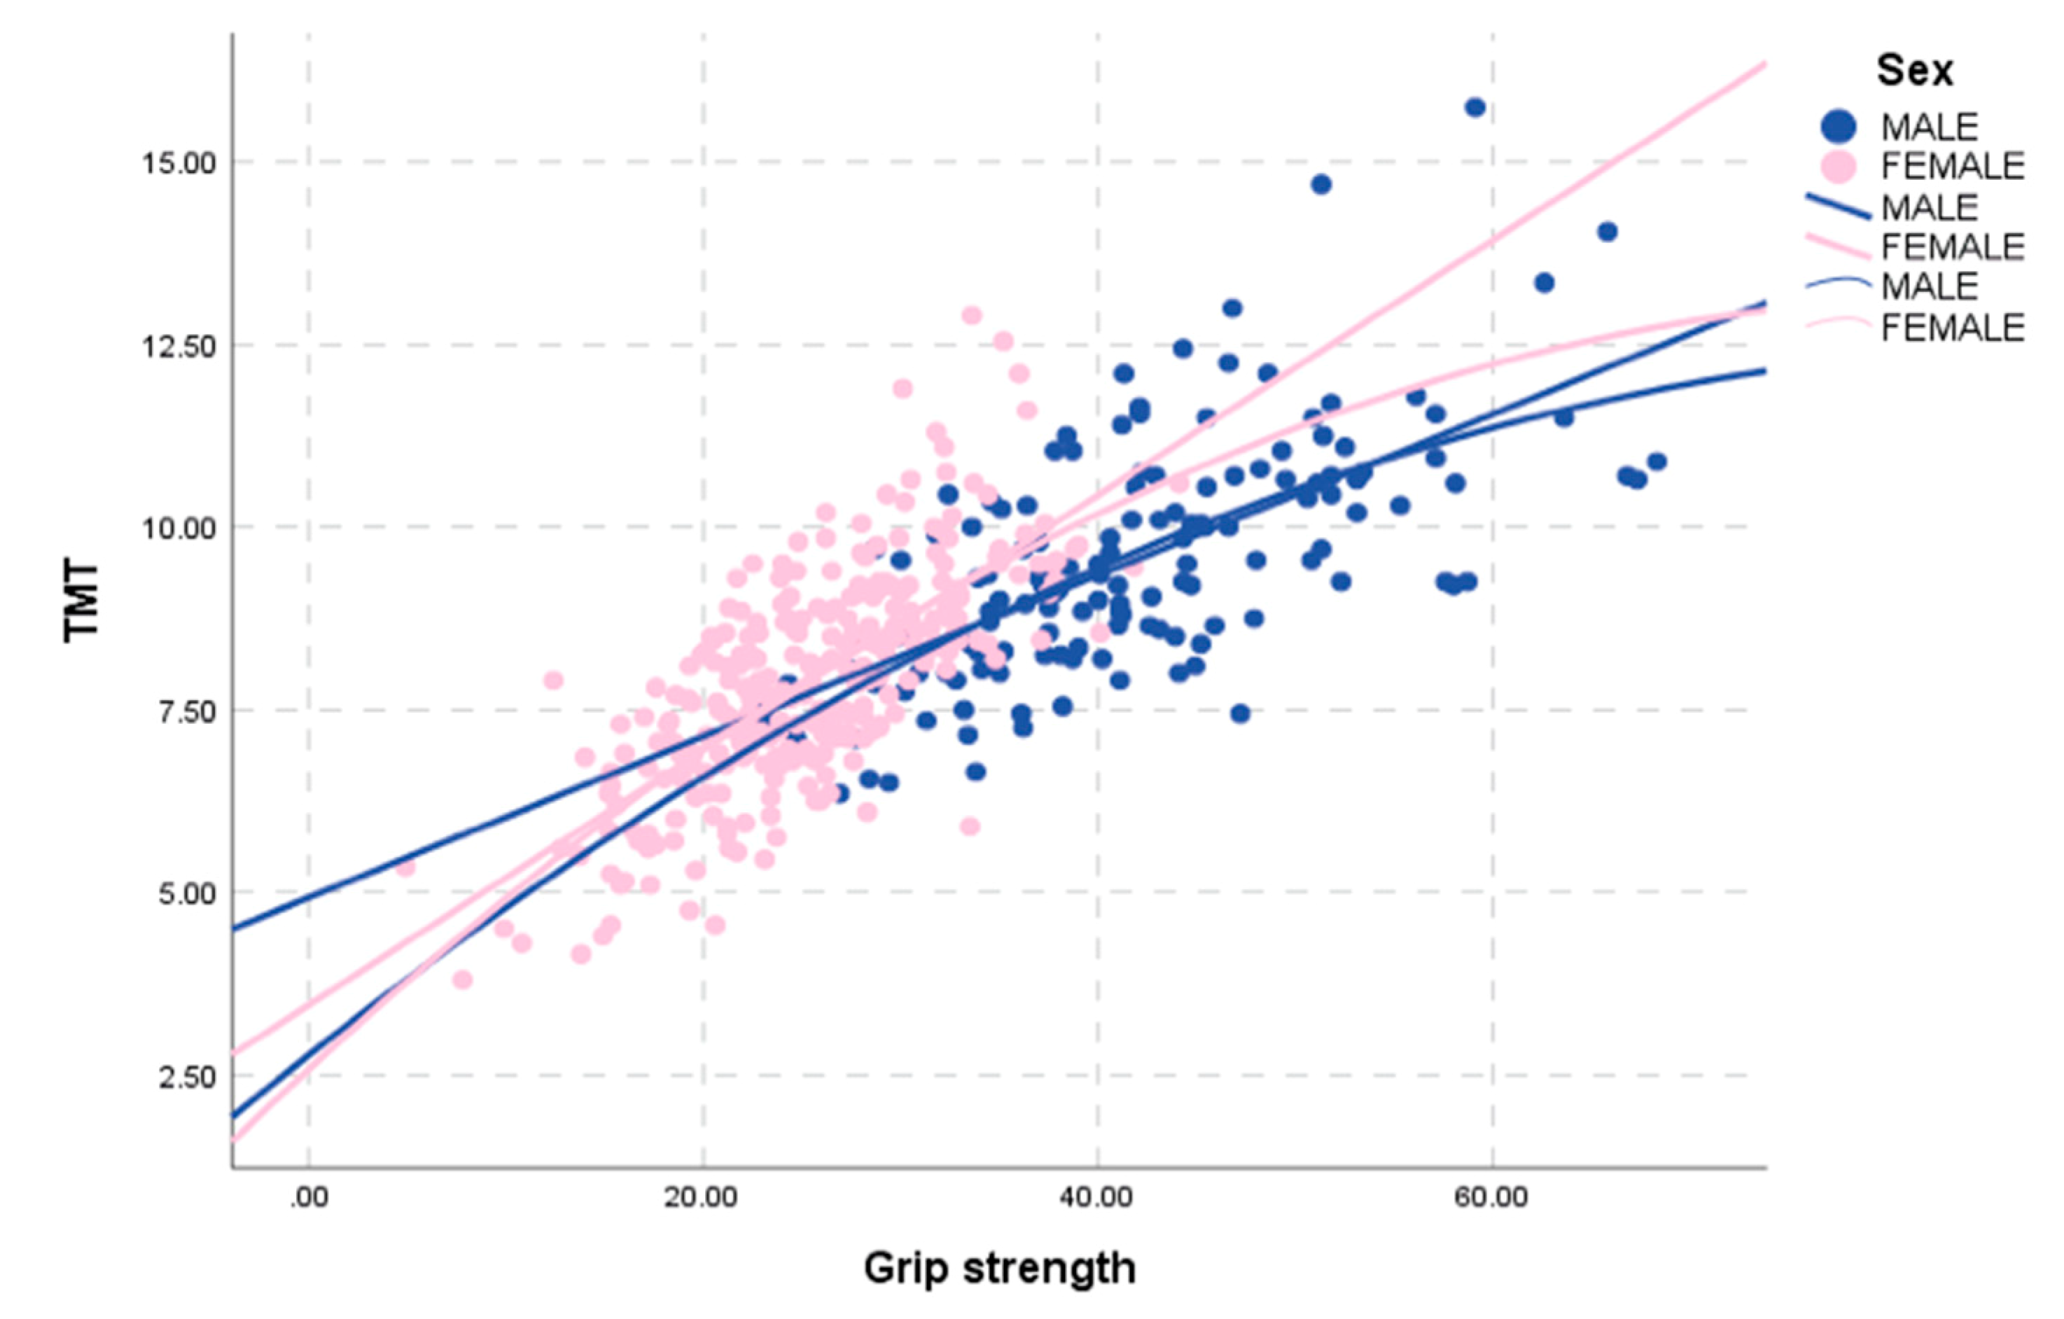
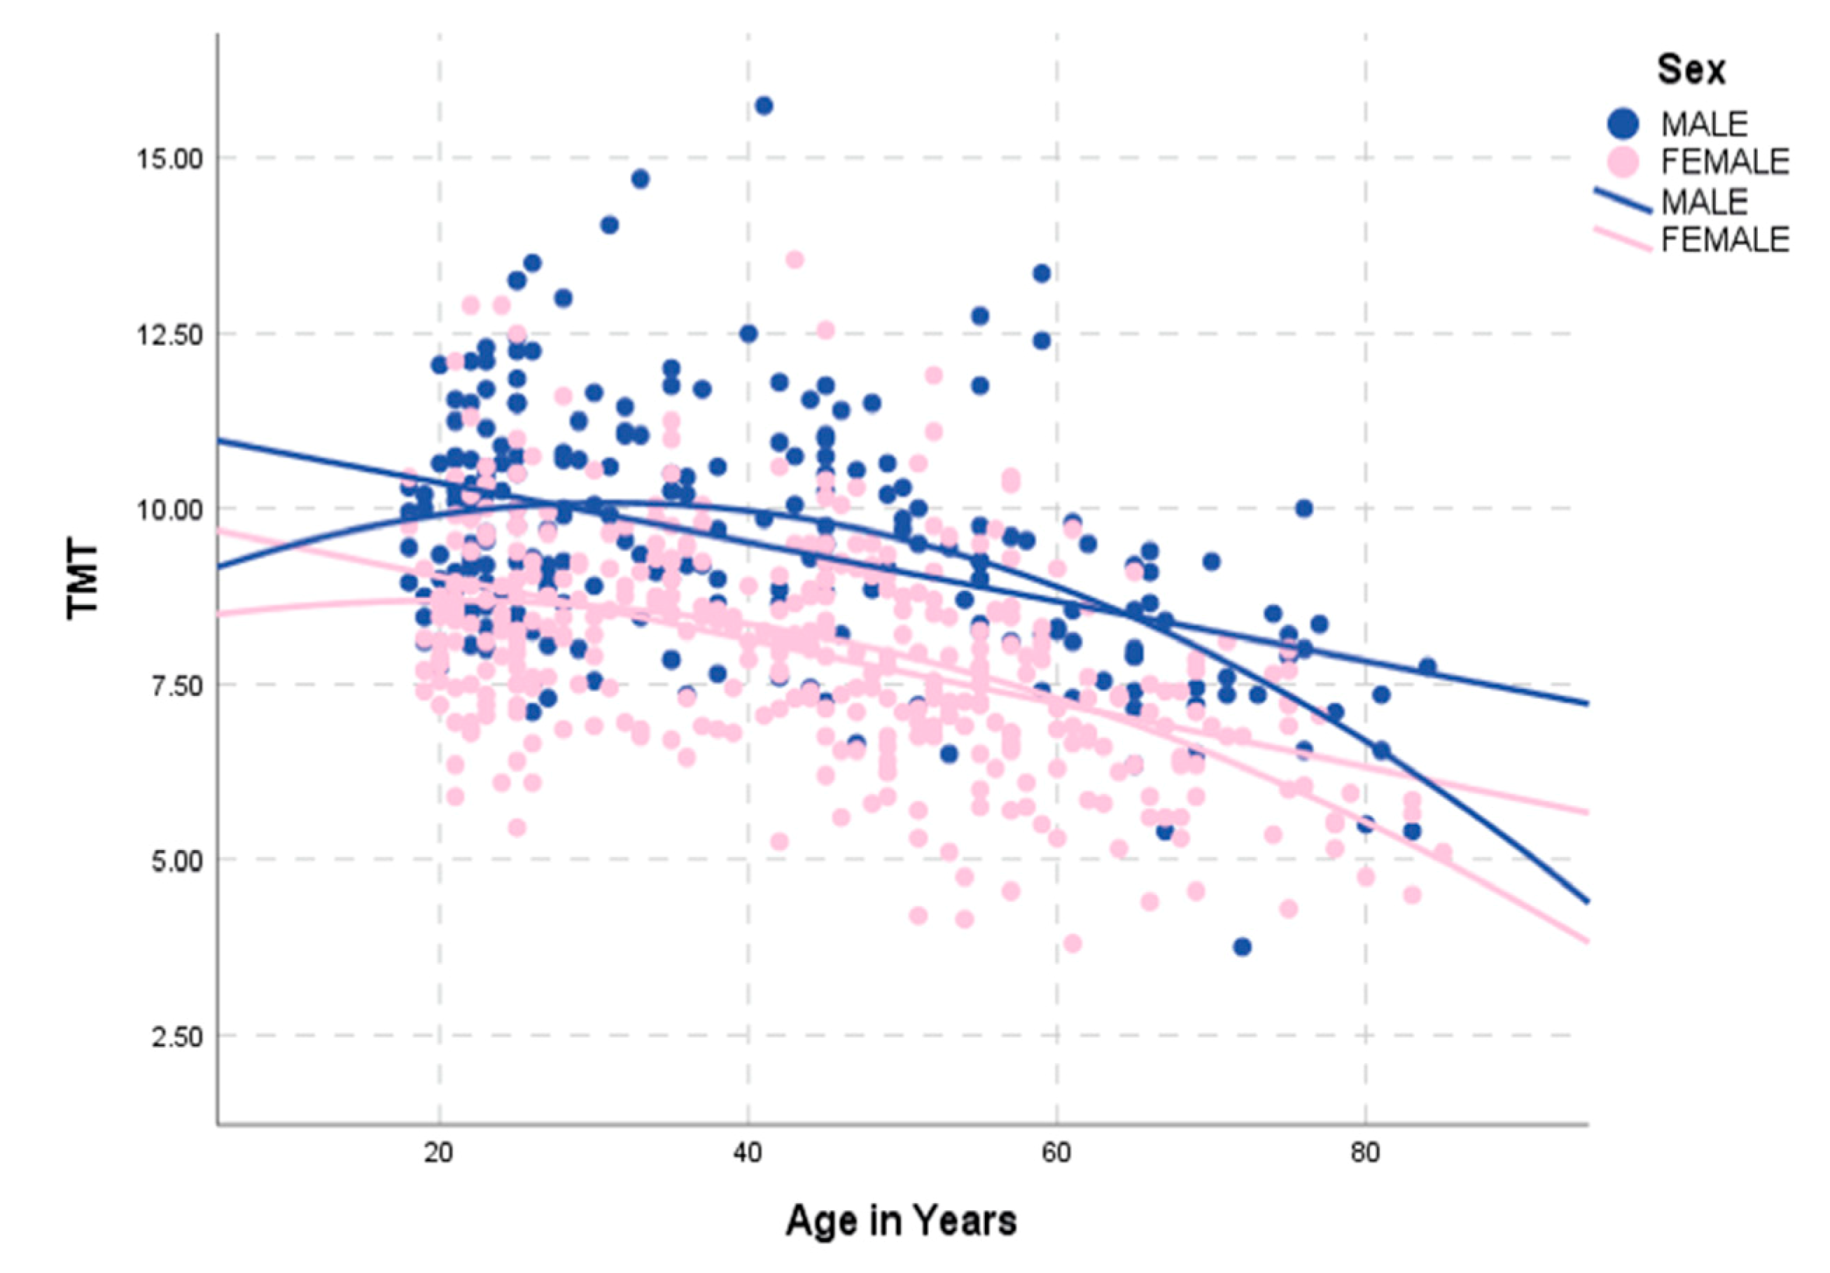
3.2. Correlation of TMT with Clinical Characteristics in the Retrospective Normal Collective
3.3. Correlation of TMT with Clinical Patient Characteristics in the Prospective Validation Patient Cohort
3.4. Assessment of Inter- and Intra-Rater Agreement
4. Discussion
4.1. Correlation of TMT and Grip Strength
4.2. Reference Values and Gender-Related TMT Cutoff Points
4.3. Correlation of TMT with Further Clinical Parameters
4.4. TMT Measurements
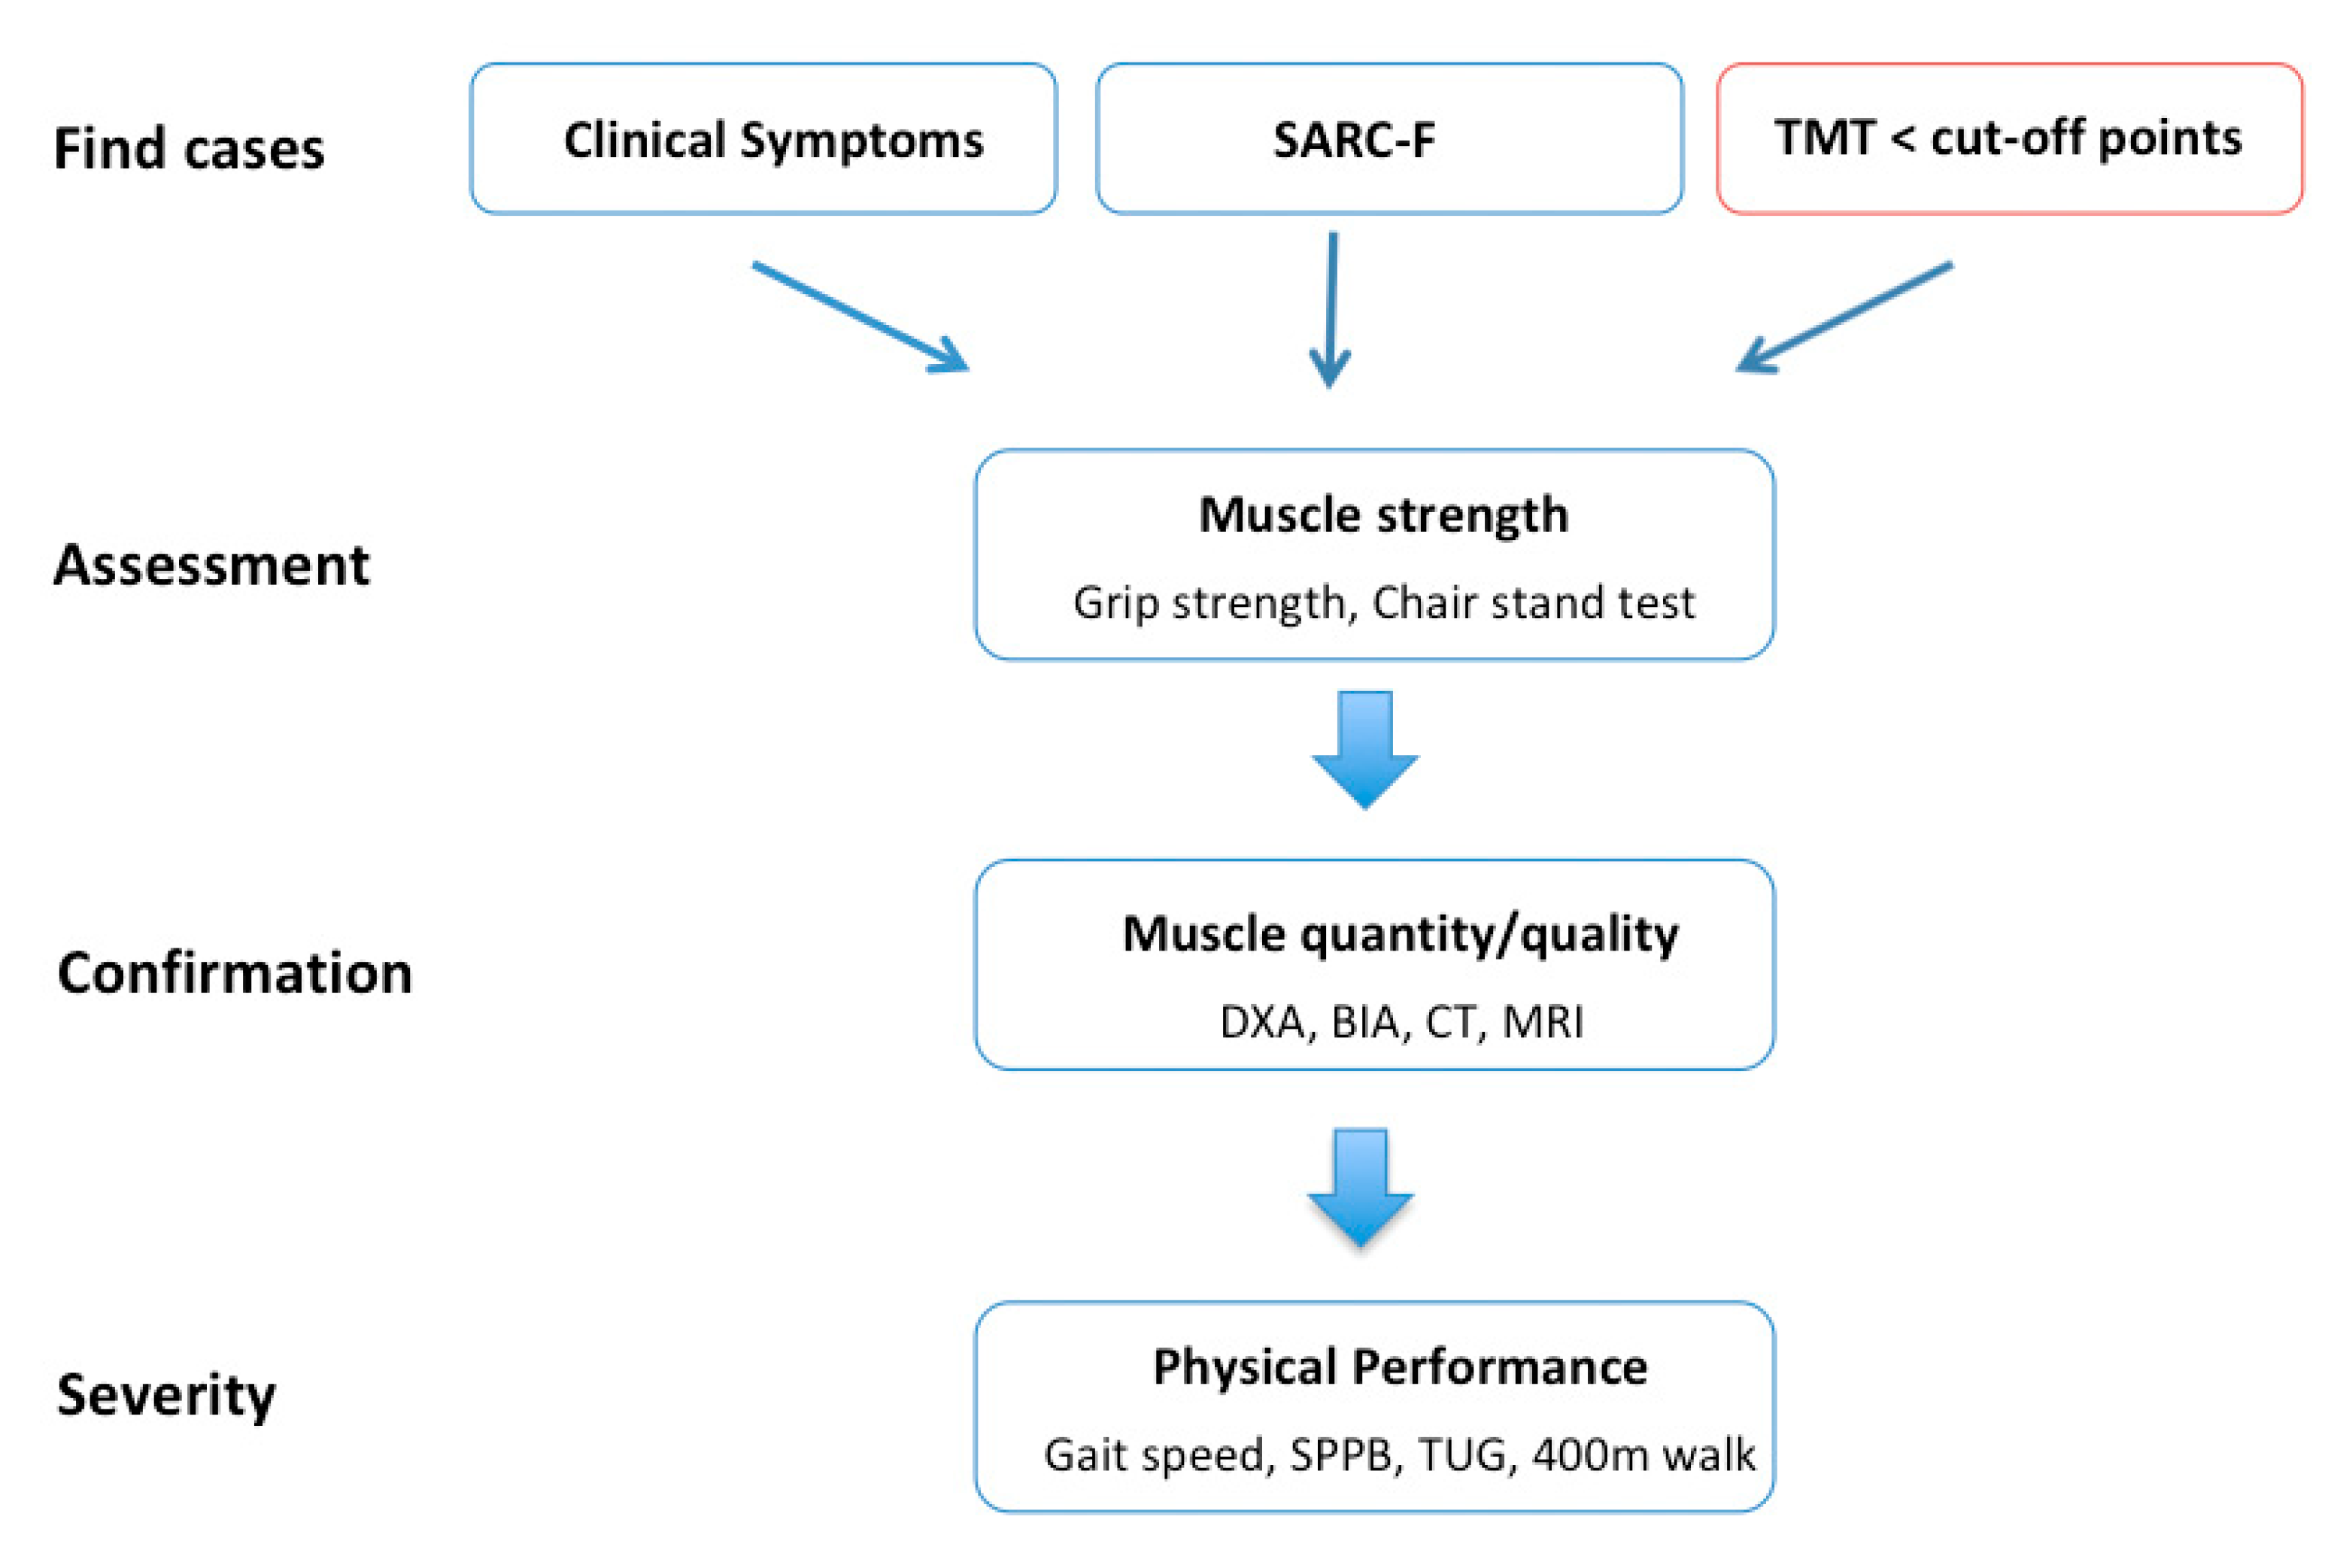
4.5. Adapted Diagnostic Algorithm with Which to Identify Neurological Patients at Risk for Sarcopenia
4.6. Limitations
5. Conclusions
Supplementary Materials
Author Contributions
Funding
Acknowledgments
Conflicts of Interest
Abbreviations
| BIA | bioelectrical impedance analysis |
| CT | computed tomography |
| DXA | dual-energy X-ray absorptiometry |
| EWGOP | European Working Group on Sarcopenia in Older People |
| MRI | magnetic resonance imaging |
| NANO | Neurologic Assessment in Neuro-oncology |
| TMT | temporal muscle thickness |
References
- Bauer, J.; Morley, J.E.; Schols, A.M.; Ferrucci, L.; Cruz-Jentoft, A.J.; Dent, E.; Baracos, V.E.; Crawford, J.A.; Doehner, W.; Heymsfield, S.B.; et al. Sarcopenia: A time for action. An SCWD position paper. J. Cachexia Sarcopenia Muscle 2019, 10, 956–961. [Google Scholar] [CrossRef] [PubMed]
- Cruz-Jentoft, A.J.; Bahat, G.; Bauer, J.; Boirie, Y.; Bruyère, O.; Cederholm, T.; Cooper, C.; Landi, F.; Rolland, Y.; Sayer, A.A.; et al. Sarcopenia: Revised European consensus on definition and diagnosis. Age Ageing 2019, 48, 16–31. [Google Scholar] [CrossRef] [PubMed] [Green Version]
- De Buyser, S.L.; Petrovic, M.; Taes, Y.E.; Toye, K.R.C.; Kaufman, J.-M.; Lapauw, B.; Goemaere, S. Validation of the FNIH sarcopenia criteria and SOF frailty index as predictors of long-term mortality in ambulatory older men. Age Ageing 2016, 45, 603–608. [Google Scholar] [CrossRef] [PubMed] [Green Version]
- Malmstrom, T.K.; Miller, U.K.; Simonsick, E.M.; Ferrucci, L.; Morley, J.E. SARC-F: A symptom score to predict persons with sarcopenia at risk for poor functional outcomes. J. Cachexia Sarcopenia Muscle 2015, 7, 28–36. [Google Scholar] [CrossRef]
- Schaap, L.; Van Schoor, N.; Lips, P.; Visser, M. Associations of sarcopenia definitions, and their components, with the incidence of recurrent falling and fractures: The longitudinal aging study Amsterdam. J. Gerontol. Ser. A Boil. Sci. Med. Sci. 2017, 73, 1199–1204. [Google Scholar] [CrossRef]
- Bischoff-Ferrari, H.A.; Orav, J.E.; Kanis, J.A.; Rizzoli, R.; Schlogl, M.; Staehelin, H.B.; Willett, W.C.; Dawson-Hughes, B. Comparative performance of current definitions of sarcopenia against the prospective incidence of falls among community-dwelling seniors age 65 and older. Osteoporos. Int. 2015, 26, 2793–2802. [Google Scholar] [CrossRef]
- Mijnarends, D.M.; Luiking, Y.C.; Halfens, R.J.G.; Evers, S.M.A.A.; Lenaerts, E.L.A.; Verlaan, S.; Wallace, M.; Schols, J.M.G.A.; Meijers, J.M.M. Muscle, health and costs: A glance at their relationship. J. Nutr. Health Aging 2018, 22, 766–773. [Google Scholar] [CrossRef] [Green Version]
- Beaudart, C.; McCloskey, E.V.; Bruyère, O.; Cesari, M.; Rolland, Y.; Rizzoli, R.; De Carvalho, I.A.; Thiyagarajan, J.A.; Bautmans, I.; Bertière, M.-C.; et al. Sarcopenia in daily practice: Assessment and management. BMC Geriatr. 2016, 16, 170. [Google Scholar] [CrossRef]
- Buckinx, F.; Landi, F.; Cesari, M.; Fielding, R.A.; Visser, M.; Engelke, K.; Maggi, S.; Dennison, E.M.; Al-Daghri, N.M.; Allepaerts, S.; et al. Pitfalls in the measurement of muscle mass: A need for a reference standard. J. Cachexia Sarcopenia Muscle 2018, 9, 269–278. [Google Scholar] [CrossRef]
- Masanés, F.; Luque, X.R.I.; Salvà, A.; Serra-Rexach, J.A.; Artaza, I.; Formiga, F.; Cuesta, F.; Soto, A.L.; Ruiz, D.; Cruz-Jentoft, A.J. Cut-off points for muscle mass—Not grip strength or gait speed—Determine variations in sarcopenia prevalence. J. Nutr. Health Aging 2016, 21, 825–829. [Google Scholar] [CrossRef]
- Hull, H.; He, Q.; Thornton, J.; Javed, F.; Allen, L.; Wang, J.; Pierson, R.N.; Gallagher, D. iDXA, prodigy, and DPXL dual-energy X-ray absorptiometry whole-body scans: A cross-calibration study. J. Clin. Densitom. 2008, 12, 95–102. [Google Scholar] [CrossRef] [PubMed] [Green Version]
- Sergi, G.; De Rui, M.; Veronese, N.; Bolzetta, F.; Berton, L.; Carraro, S.; Bano, G.; Coin, A.; Manzato, E.; Perissinotto, E. Assessing appendicular skeletal muscle mass with bioelectrical impedance analysis in free-living Caucasian older adults. Clin. Nutr. 2015, 34, 667–673. [Google Scholar] [CrossRef] [PubMed]
- Reiss, J.; Iglseder, B.; Kreutzer, M.; Weilbuchner, I.; Treschnitzer, W.; Kässmann, H.; Pirich, C.; Reiter, R. Case finding for sarcopenia in geriatric inpatients: Performance of bioimpedance analysis in comparison to dual X-ray absorptiometry. BMC Geriatr. 2016, 16, 52. [Google Scholar] [CrossRef] [PubMed] [Green Version]
- Gonzalez, M.C.; Heymsfield, S.B. Bioelectrical impedance analysis for diagnosing sarcopenia and cachexia: What are we really estimating? J. Cachexia Sarcopenia Muscle 2017, 8, 187–189. [Google Scholar] [CrossRef] [PubMed]
- Tamandl, D.; Paireder, M.; Asari, R.; Baltzer, P.A.T.; Schoppmann, S.F.; Ba-Ssalamah, A. Markers of sarcopenia quantified by computed tomography predict adverse long-term outcome in patients with resected oesophageal or gastro-oesophageal junction cancer. Eur. Radiol. 2015, 26, 1359–1367. [Google Scholar] [CrossRef] [PubMed]
- Shachar, S.S.; Williams, G.R.; Muss, H.B.; Funakoshi, T. Prognostic value of sarcopenia in adults with solid tumours: A meta-analysis and systematic review. Eur. J. Cancer 2016, 57, 58–67. [Google Scholar] [CrossRef]
- Prado, C.M.; Lieffers, J.R.; McCargar, L.J.; Reiman, T.; Sawyer, M.B.; Martin, L.; Baracos, V. Prevalence and clinical implications of sarcopenic obesity in patients with solid tumours of the respiratory and gastrointestinal tracts: A population-based study. Lancet Oncol. 2008, 9, 629–635. [Google Scholar] [CrossRef]
- Leitner, J.; Pelster, S.; Schöpf, V.; Berghoff, A.S.; Woitek, R.; Asenbaum, U.; Nenning, K.-H.; Widhalm, G.; Kiesel, B.; Gatterbauer, B.; et al. High correlation of temporal muscle thickness with lumbar skeletal muscle cross-sectional area in patients with brain metastases. PLoS ONE 2018, 13, e0207849. [Google Scholar] [CrossRef]
- Bullitt, E.; Zeng, N.; Gerig, G.; Aylward, S.; Joshi, S.; Smith, J.K.; Lin, W.; Ewend, M.G. Vessel tortuosity and brain tumor malignancy: A blinded study. Acad. Radiol. 2005, 12, 1232–1240. [Google Scholar] [CrossRef] [Green Version]
- Nooner, K.B.; Colcombe, S.; Tobe, R.H.; Mennes, M.; Benedict, M.M.; Moreno, A.L.; Panek, L.J.; Brown, S.; Zavitz, S.T.; Li, Q.; et al. The NKI-rockland sample: A model for accelerating the pace of discovery science in psychiatry. Front. Behav. Neurosci. 2012, 6, 152. [Google Scholar] [CrossRef] [Green Version]
- Furtner, J.; Berghoff, A.S.; Albtoush, O.M.; Woitek, R.; Asenbaum, U.; Prayer, D.; Widhalm, G.; Gatterbauer, B.; Dieckmann, K.; Birner, P.; et al. Survival prediction using temporal muscle thickness measurements on cranial magnetic resonance images in patients with newly diagnosed brain metastases. Eur. Radiol. 2017, 27, 3167–3173. [Google Scholar] [CrossRef] [PubMed] [Green Version]
- Nayak, L.; DeAngelis, L.M.; Brandes, A.A.; Peereboom, D.M.; Galanis, E.; Lin, N.U.; Soffietti, R.; Macdonald, D.R.; Chamberlain, M.; Perry, J.; et al. The Neurologic Assessment in Neuro-Oncology (NANO) scale: A tool to assess neurologic function for integration into the Response Assessment in Neuro-Oncology (RANO) criteria. Neuro-Oncol. 2017, 19, 625–635. [Google Scholar] [CrossRef] [PubMed]
- Fried, L.P.; Tangen, C.M.; Walston, J.; Newman, A.B.; Hirsch, C.; Gottdiener, J.; Seeman, T.; Tracy, R.; Kop, W.J.; Burke, G.; et al. Frailty in older adults: Evidence for a phenotype. J. Gerontol. Ser. A Boil. Sci. Med. Sci. 2001, 56, M146–M157. [Google Scholar] [CrossRef] [PubMed]
- Coleman, S.R.; Grover, R. The anatomy of the aging face: Volume loss and changes in 3-dimensional topography. Aesthet. Surg. J. 2006, 26. [Google Scholar] [CrossRef] [Green Version]
- Janssen, I.; Heymsfield, S.B.; Ross, R. Low relative skeletal muscle mass (sarcopenia) in older persons is associated with functional impairment and physical disability. J. Am. Geriatr. Soc. 2002, 50, 889–896. [Google Scholar] [CrossRef] [Green Version]
- Kumar, A.; Langstraat, C.; DeJong, S.R.; McGree, M.E.; Bakkum-Gamez, J.N.; Weaver, A.L.; Lebrasseur, N.; Cliby, W.A. Functional not chronologic age: Frailty index predicts outcomes in advanced ovarian cancer. Gynecol. Oncol. 2017, 147, 104–109. [Google Scholar] [CrossRef]
- Mitnitski, A.B.; Graham, J.E.; Mogilner, A.J.; Rockwood, K. Frailty, fitness and late-life mortality in relation to chronological and biological age. BMC Geriatr. 2002, 2, 1. [Google Scholar] [CrossRef] [Green Version]
- Cosway, B.; Easby, M.; Covington, S.; Bowe, I.; Paleri, V. Hand-grip strength does not correlate with treatment-related weight loss in patients with head and neck cancer. J. Laryngol. Otol. 2015, 129, 706–709. [Google Scholar] [CrossRef]
- Lisiecki, J.; Zhang, P.; Wang, L.; Rinkinen, J.; De La Rosa, S.; Enchakalody, B.; Brownley, R.C.; Wang, S.C.; Buchman, S.R.; Levi, B. Morphomic measurement of the temporalis muscle and zygomatic bone as novel predictors of hospital-based clinical outcomes in patients with mandible fracture. J. Craniofacial Surg. 2013, 24, 1577–1581. [Google Scholar] [CrossRef]
- Katsuki, M.; Yamamoto, Y.; Uchiyama, T.; Wada, N.; Kakizawa, Y. Clinical characteristics of aneurysmal subarachnoid hemorrhage in the elderly over 75; would temporal muscle be a potential prognostic factor as an indicator of sarcopenia? Clin. Neurol. Neurosurg. 2019, 186, 105535. [Google Scholar] [CrossRef]
- Furtner, J.; Berghoff, A.S.; Schöpf, V.; Reumann, R.; Pascher, B.; Woitek, R.; Asenbaum, U.; Pelster, S.; Leitner, J.; Widhalm, G.; et al. Temporal muscle thickness is an independent prognostic marker in melanoma patients with newly diagnosed brain metastases. J. Neuro-Oncol. 2018, 140, 173–178. [Google Scholar] [CrossRef] [Green Version]
- Furtner, J.; Genbrugge, E.; Gorlia, T.; Bendszus, M.; Nowosielski, M.; Golfinopoulos, V.; Weller, M.; Bent, M.J.V.D.; Wick, W.; Preusser, M. Temporal muscle thickness is an independent prognostic marker in patients with progressive glioblastoma: Translational imaging analysis of the EORTC 26101 trial. Neuro-Oncol. 2019, 21, 1587–1594. [Google Scholar] [CrossRef] [PubMed]
- Rinkinen, J.; Zhang, P.; Wang, L.; Enchakalody, B.; Terjimanian, M.; Holcomb, S.; Wang, S.C.; Buchman, S.R.; Levi, B. Novel temporalis muscle and fat pad morphomic analyses aids preoperative risk evaluation and outcome assessment in nonsyndromic craniosynostosis. J. Craniofacial Surg. 2013, 24, 250–255. [Google Scholar] [CrossRef] [PubMed]
- Grünheid, T.; Langenbach, G.E.J.; Korfage, J.A.M.; Zentner, A.; Van Eijden, T.M.G.J. The adaptive response of jaw muscles to varying functional demands. Eur. J. Orthod. 2009, 31, 596–612. [Google Scholar] [CrossRef] [PubMed] [Green Version]


| SEX | Age-Group | n | Minimum (mm) | Maximum (mm) | Mean (mm) | SD | |
|---|---|---|---|---|---|---|---|
| MALE | 18–29 | TMTmean | 98 | 7.10 | 13.50 | 9.9709 | 1.42971 |
| 30–39 | TMTmean | 39 | 7.35 | 14.70 | 9.9654 | 1.60813 | |
| 40–49 | TMTmean | 35 | 6.65 | 15.75 | 10.0300 | 1.71679 | |
| 50–59 | TMTmean | 26 | 6.50 | 13.35 | 9.4769 | 1.63139 | |
| 60–69 | TMTmean | 24 | 5.40 | 9.80 | 7.9958 | 1.06157 | |
| 70–79 | TMTmean | 13 | 3.75 | 10.00 | 7.6846 | 1.49086 | |
| 80+ | TMTmean | 5 | 5.40 | 7.75 | 6.5100 | 1.06031 | |
| FEMALE | 18–29 | TMTmean | 108 | 5.45 | 12.90 | 8.6167 | 1.44770 |
| 30–39 | TMTmean | 54 | 6.45 | 11.25 | 8.6806 | 1.16309 | |
| 40–49 | TMTmean | 77 | 5.25 | 13.55 | 8.2065 | 1.43282 | |
| 50–59 | TMTmean | 77 | 4.15 | 11.90 | 7.5916 | 1.53549 | |
| 60–69 | TMTmean | 43 | 3.80 | 9.70 | 6.6570 | 1.22200 | |
| 70–79 | TMTmean | 20 | 4.30 | 8.10 | 6.5075 | 1.03151 | |
| 80+ | TMTmean | 5 | 4.50 | 5.85 | 5.1700 | 1.57511 | |
© 2020 by the authors. Licensee MDPI, Basel, Switzerland. This article is an open access article distributed under the terms and conditions of the Creative Commons Attribution (CC BY) license (http://creativecommons.org/licenses/by/4.0/).
Share and Cite
Steindl, A.; Leitner, J.; Schwarz, M.; Nenning, K.-H.; Asenbaum, U.; Mayer, S.; Woitek, R.; Weber, M.; Schöpf, V.; Berghoff, A.S.; et al. Sarcopenia in Neurological Patients: Standard Values for Temporal Muscle Thickness and Muscle Strength Evaluation. J. Clin. Med. 2020, 9, 1272. https://doi.org/10.3390/jcm9051272
Steindl A, Leitner J, Schwarz M, Nenning K-H, Asenbaum U, Mayer S, Woitek R, Weber M, Schöpf V, Berghoff AS, et al. Sarcopenia in Neurological Patients: Standard Values for Temporal Muscle Thickness and Muscle Strength Evaluation. Journal of Clinical Medicine. 2020; 9(5):1272. https://doi.org/10.3390/jcm9051272
Chicago/Turabian StyleSteindl, Ariane, Johannes Leitner, Matthias Schwarz, Karl-Heinz Nenning, Ulrika Asenbaum, Sophie Mayer, Ramona Woitek, Michael Weber, Veronika Schöpf, Anna S. Berghoff, and et al. 2020. "Sarcopenia in Neurological Patients: Standard Values for Temporal Muscle Thickness and Muscle Strength Evaluation" Journal of Clinical Medicine 9, no. 5: 1272. https://doi.org/10.3390/jcm9051272