
Cardiovascular/Stroke Risk Stratification in Diabetic Foot Infection Patients Using Deep Learning-Based Artificial Intelligence: An Investigative Study

 , , , , , , , , , , , , , , , ,
  ,
,  ,
,
Abstract
:1. Introduction
2. Search Strategy Using PRISMA Model
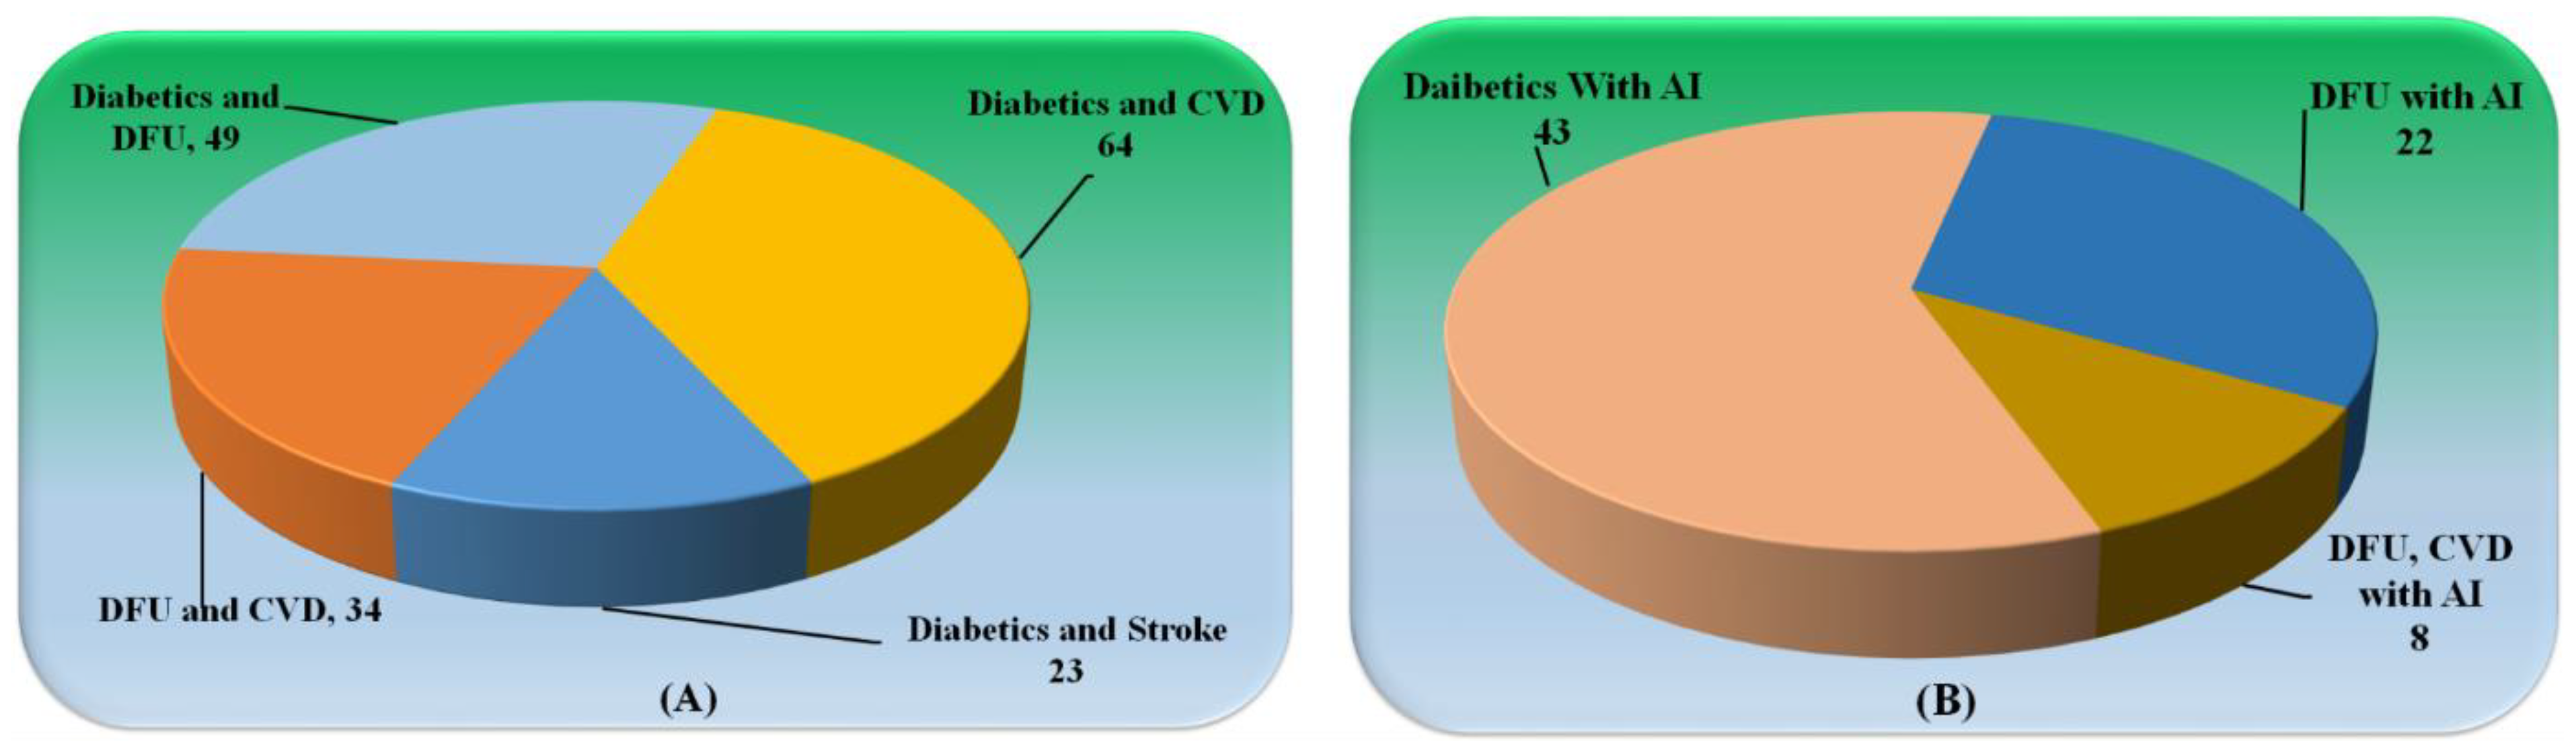
Statistical Distribution
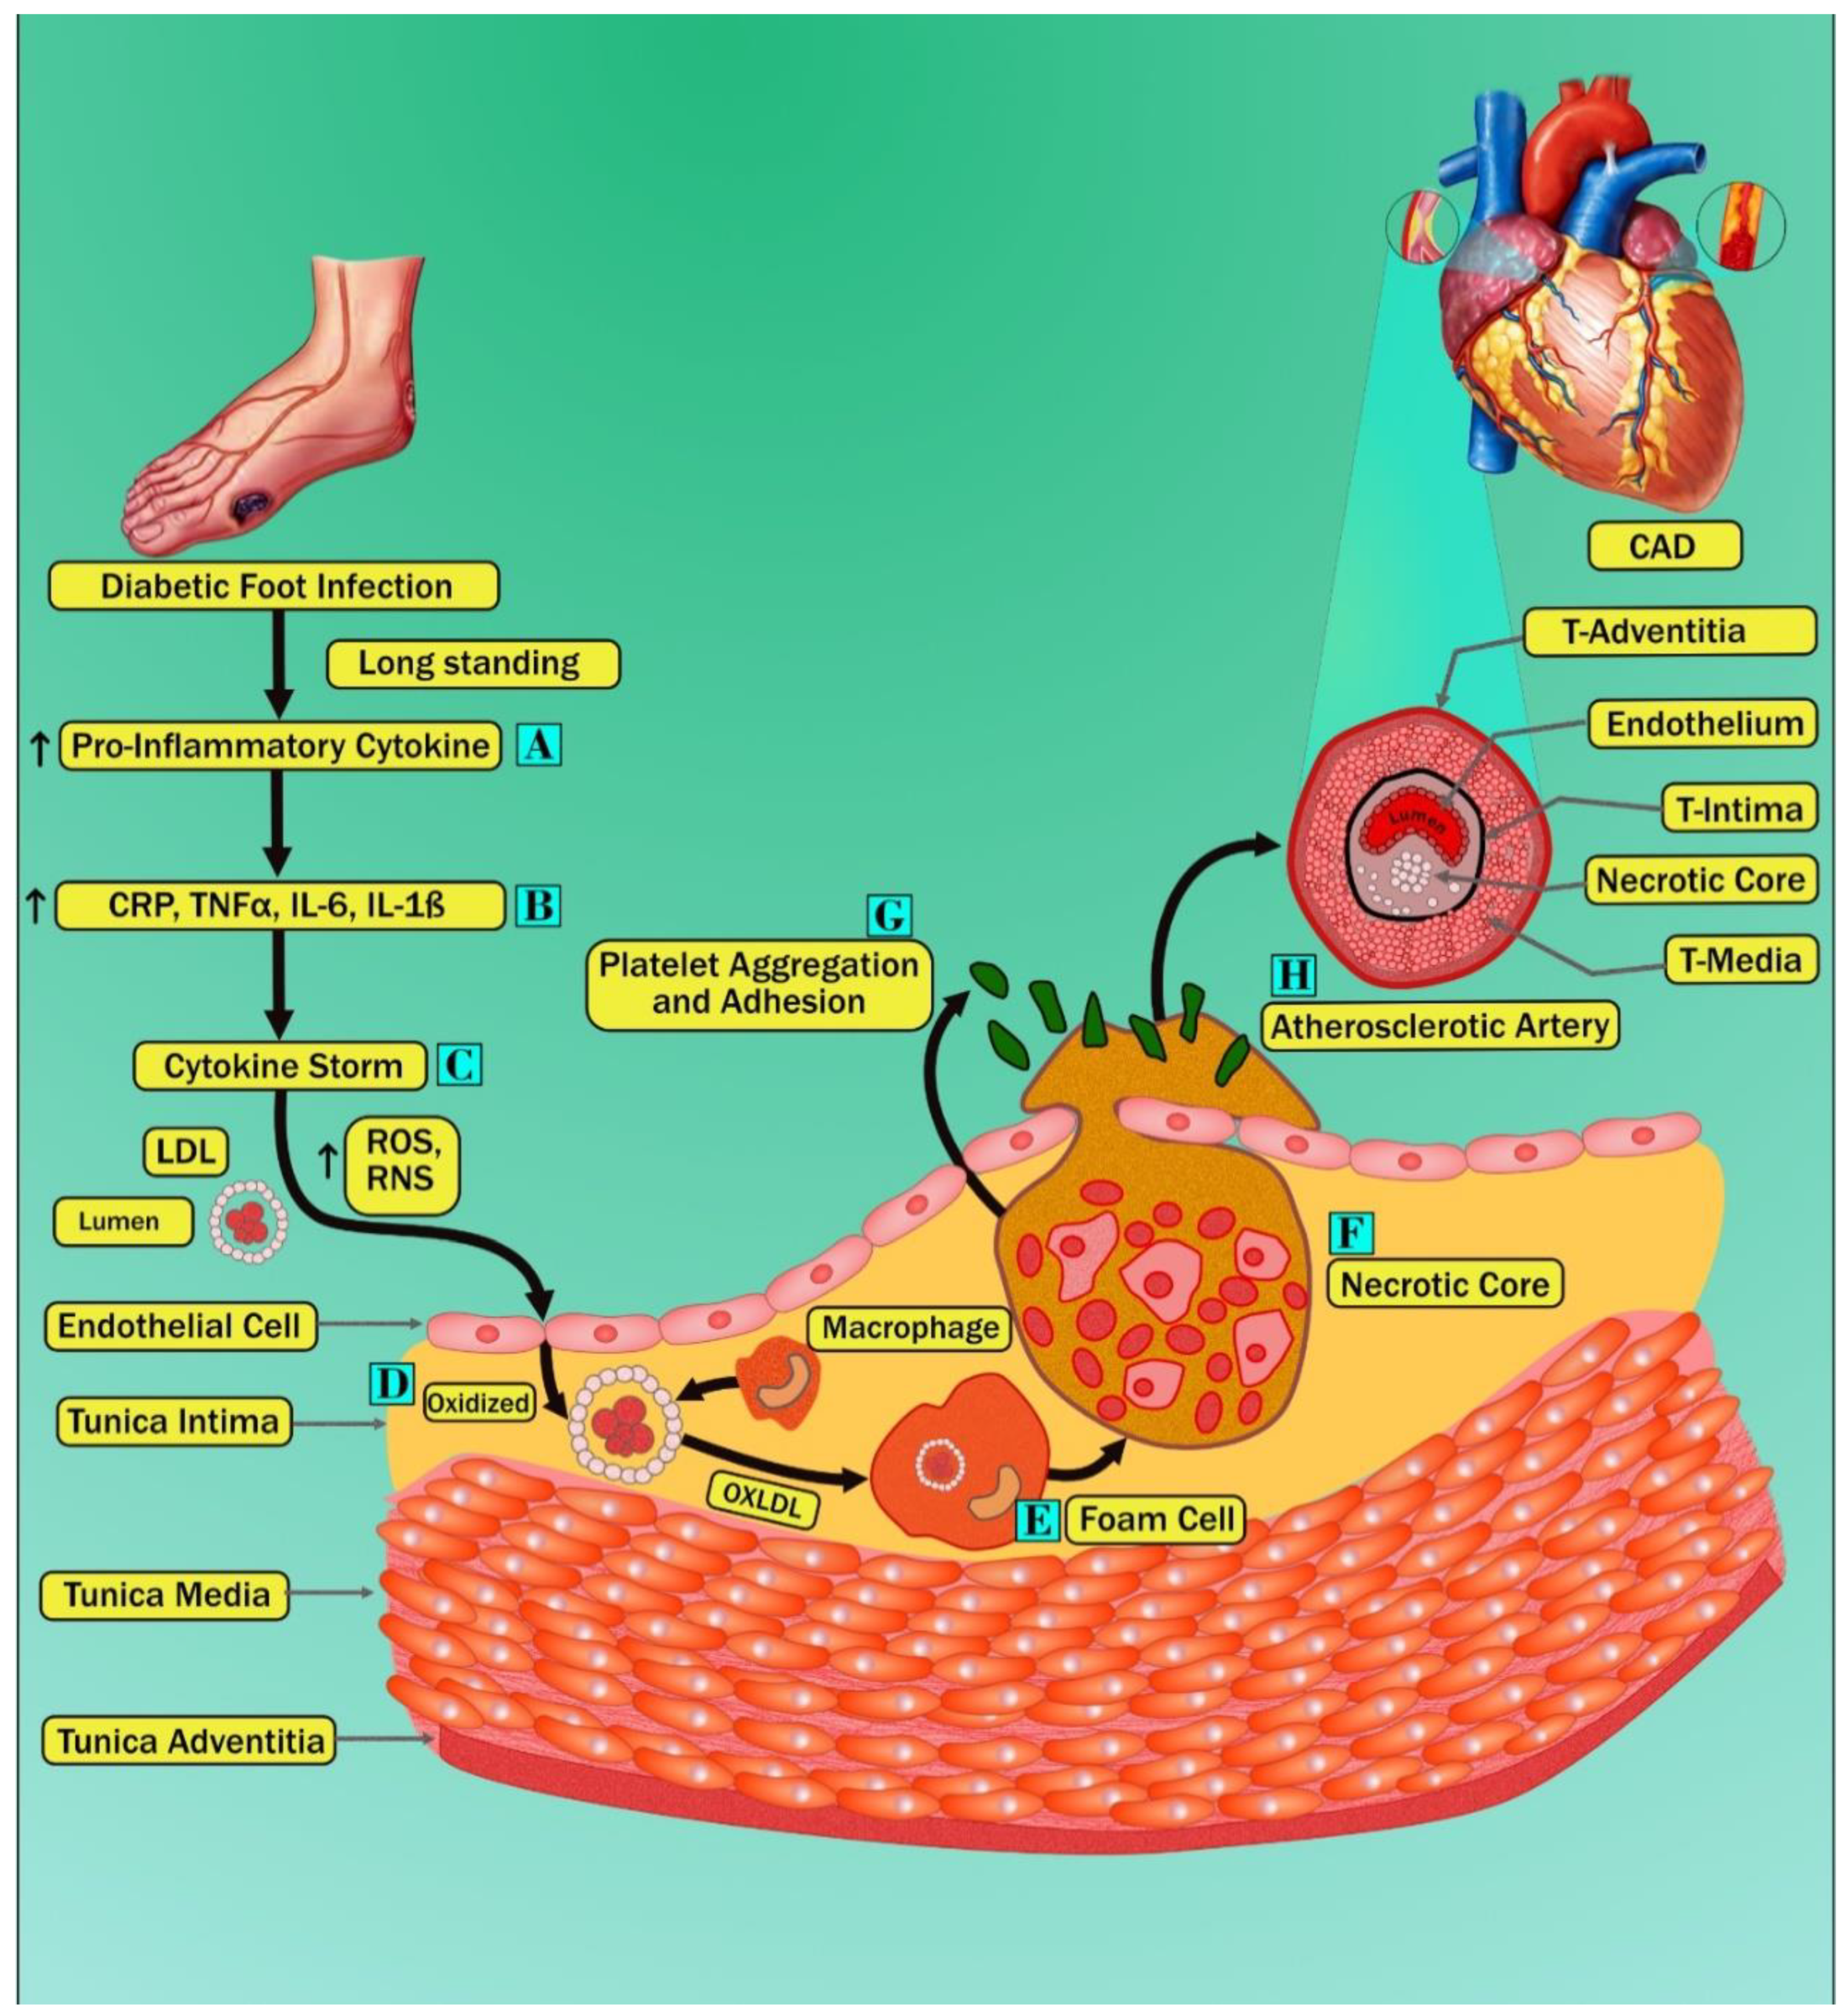
3. Pathobiological Mechanisms of Diabetes, CVD, and Diabetic Foot
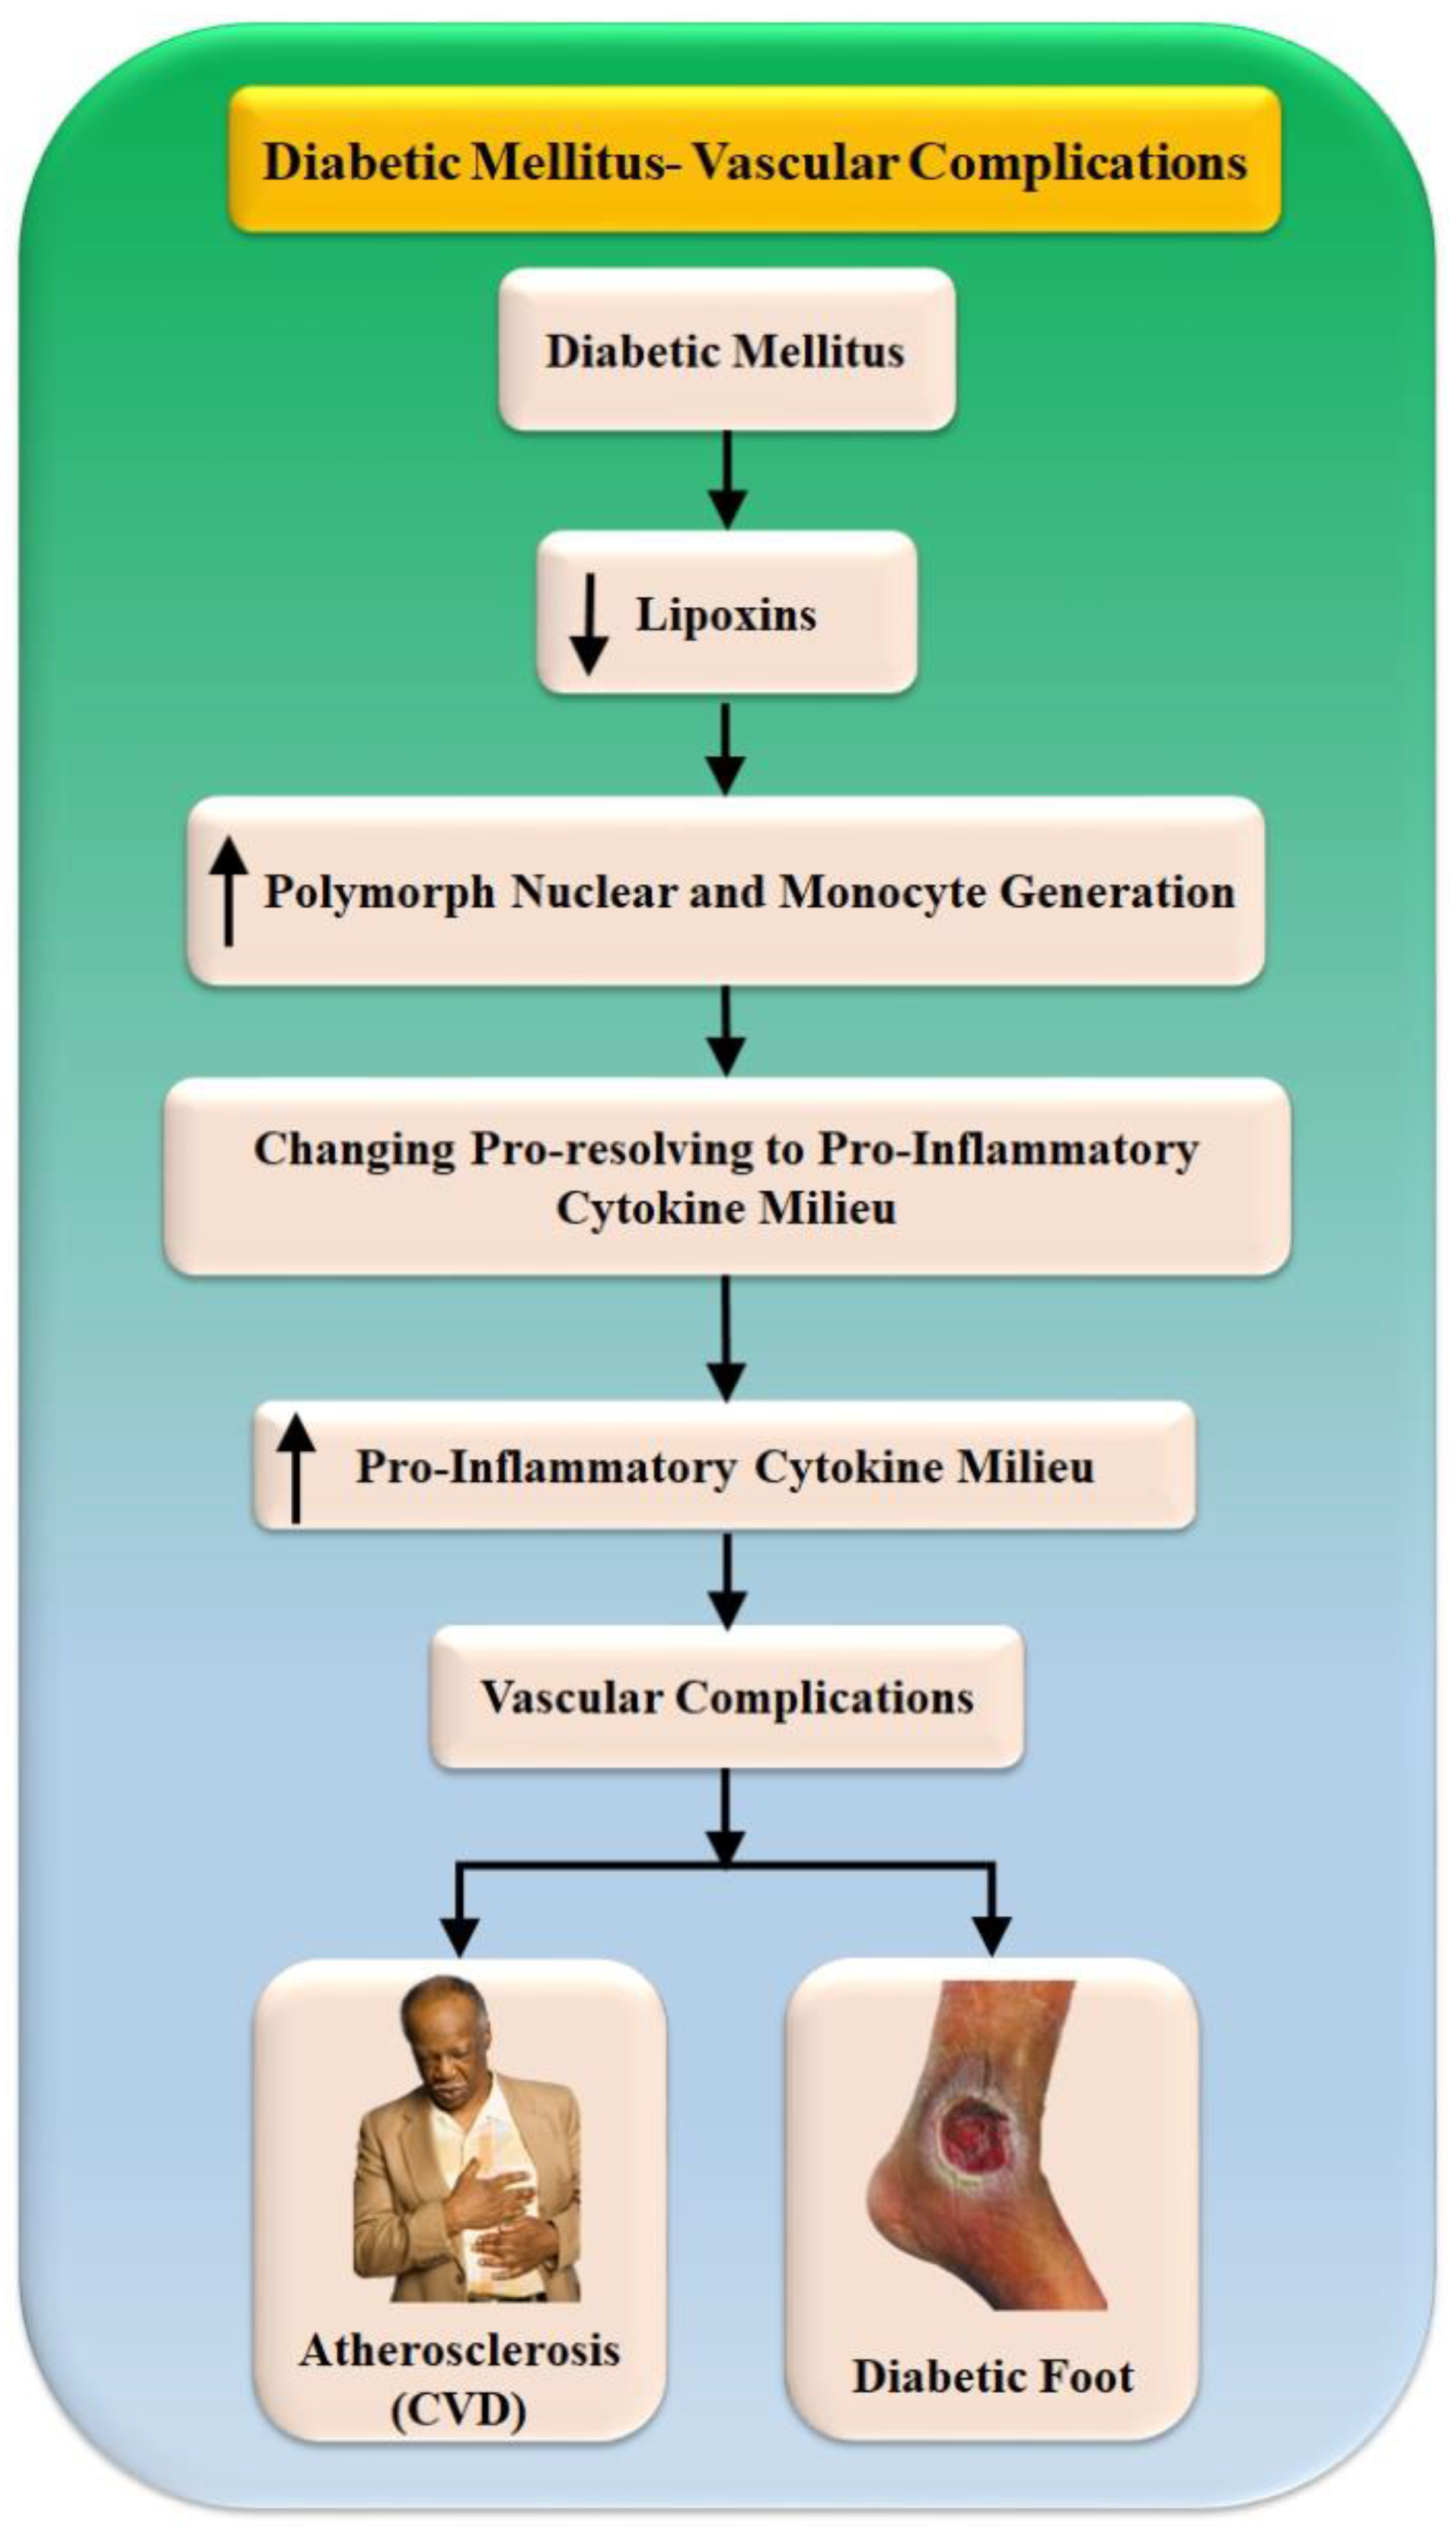
Vascular Complications in Diabetes Mellitus
4. ML/DL-Based CVD/Stroke Risk Assessment in Diabetics Foot Ulcer Patients
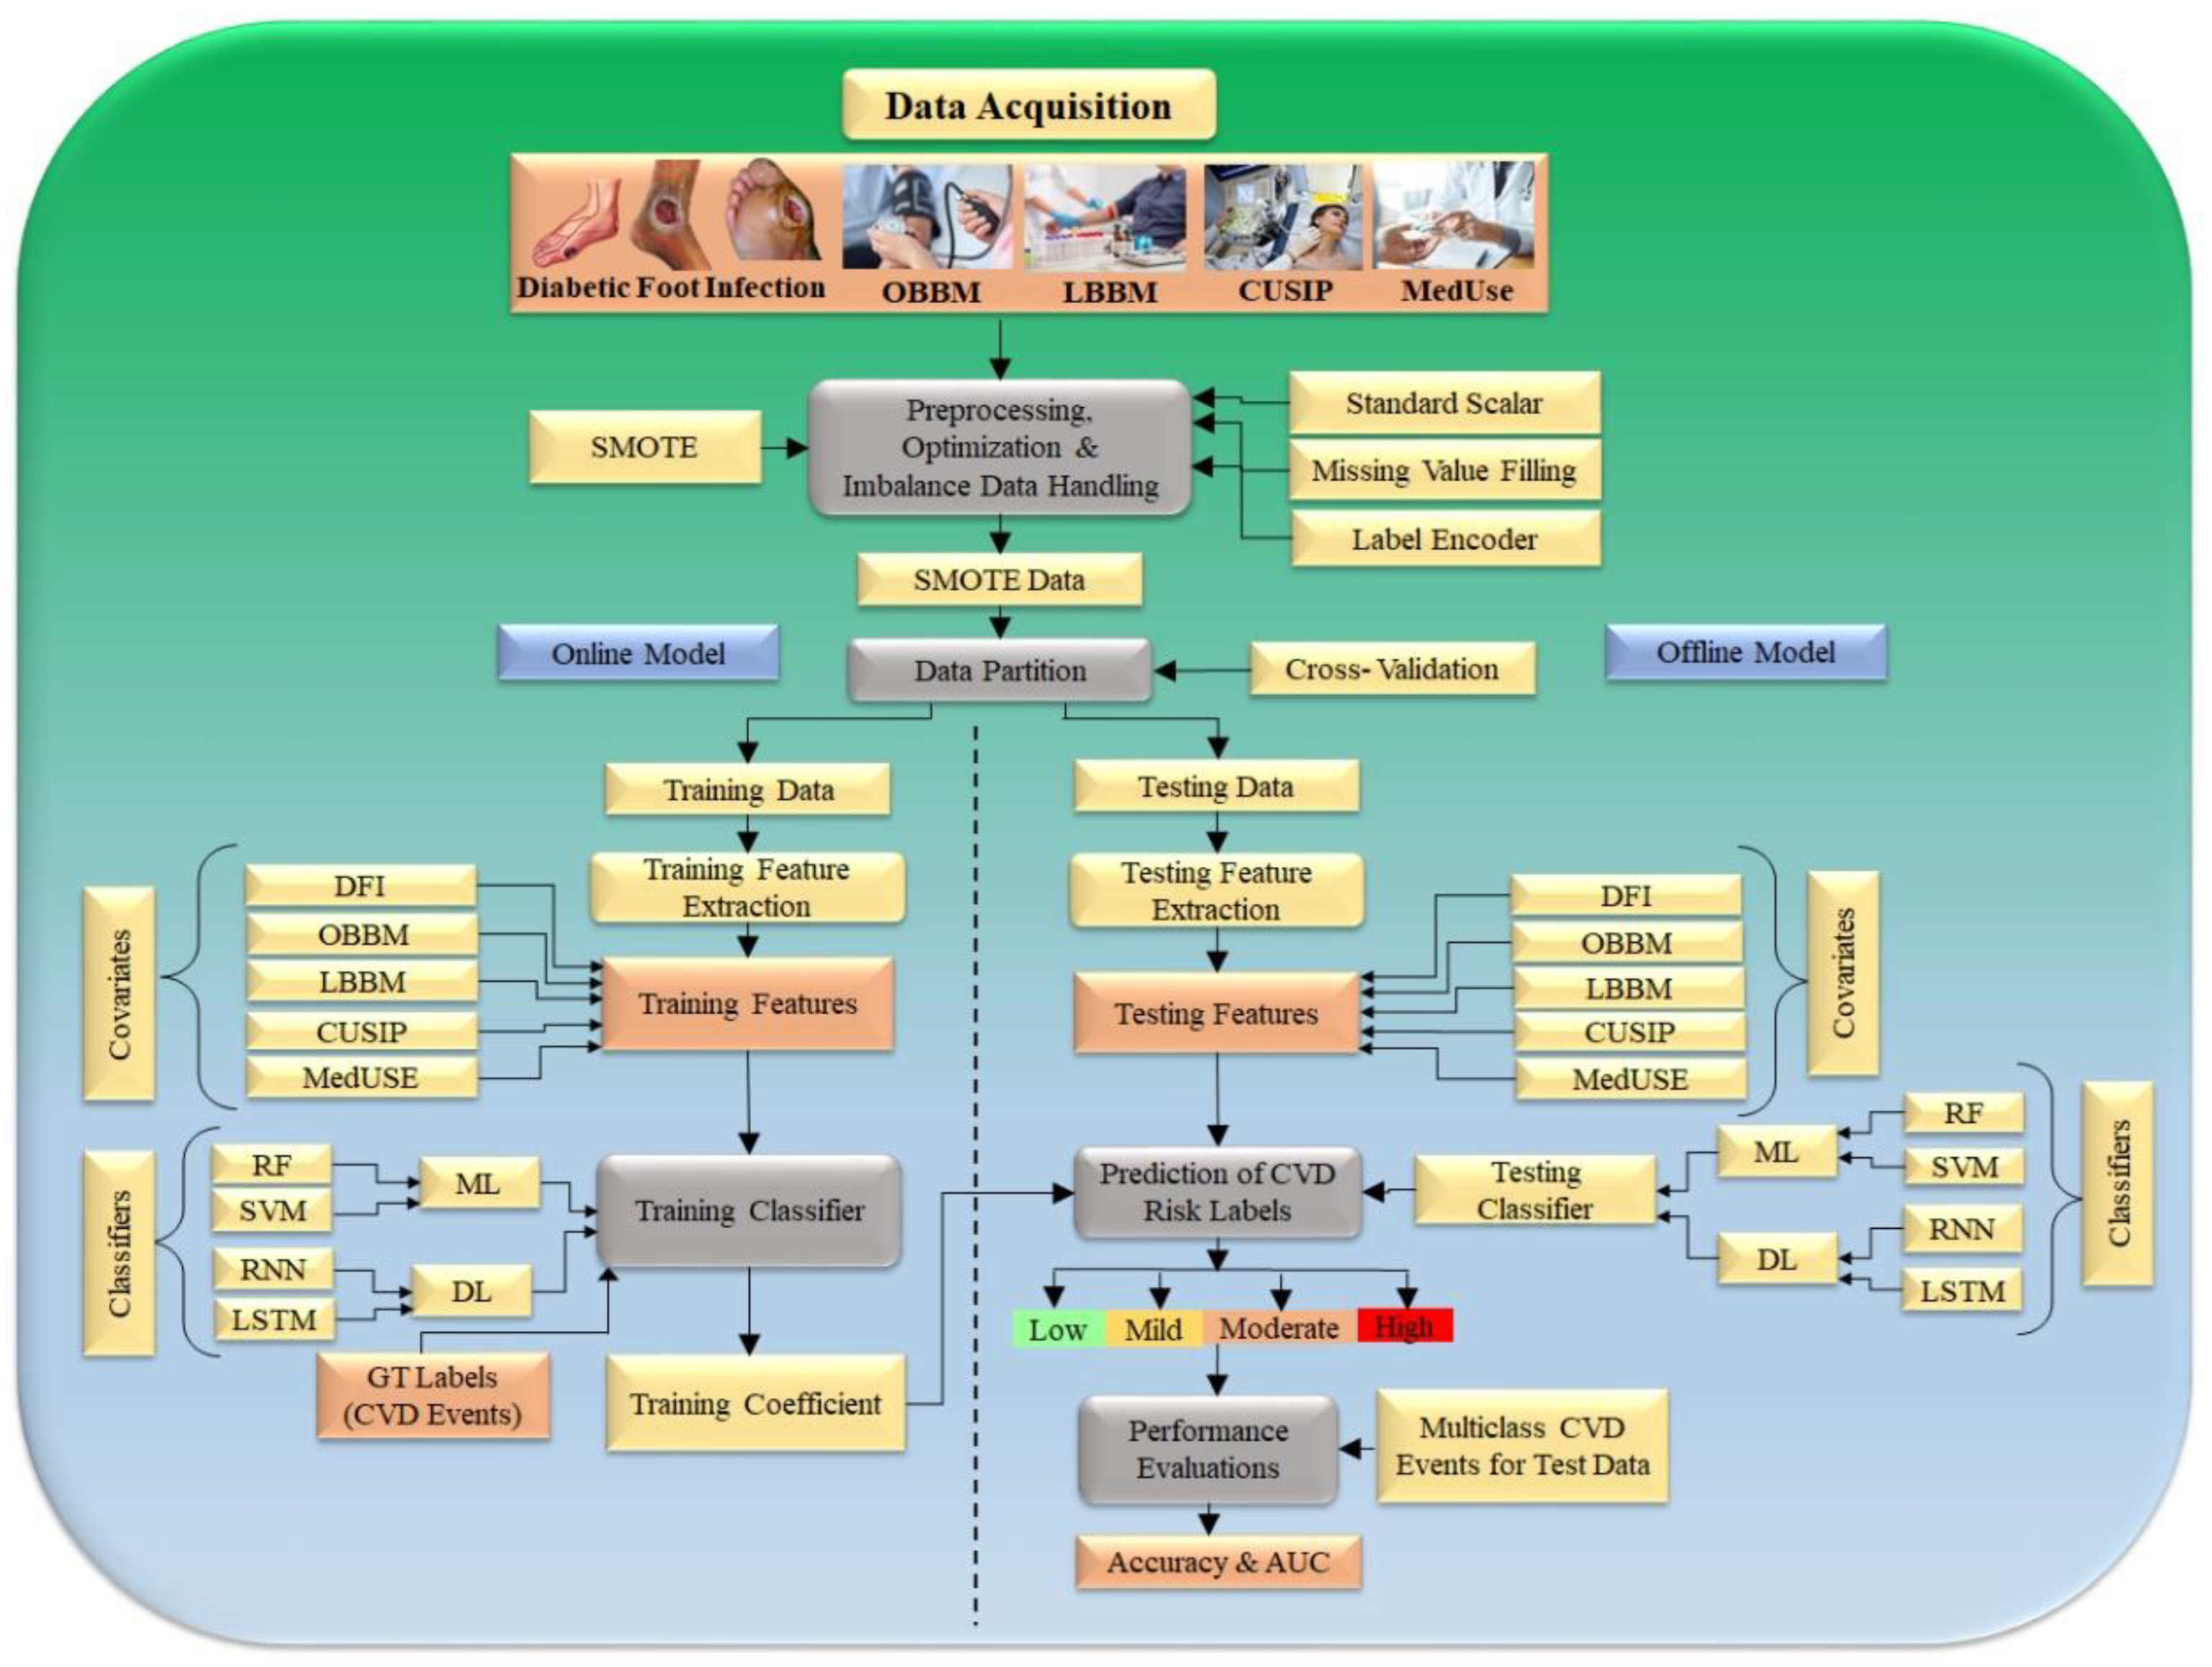
4.1. ML/DL-Based Architecture for Evaluating the Risk of CVD/Stroke in DFI Patients
4.1.1. CVD Risk Stratification Using ML-Based Classifiers
4.1.2. CVD Risk Stratification Using DL Classifiers
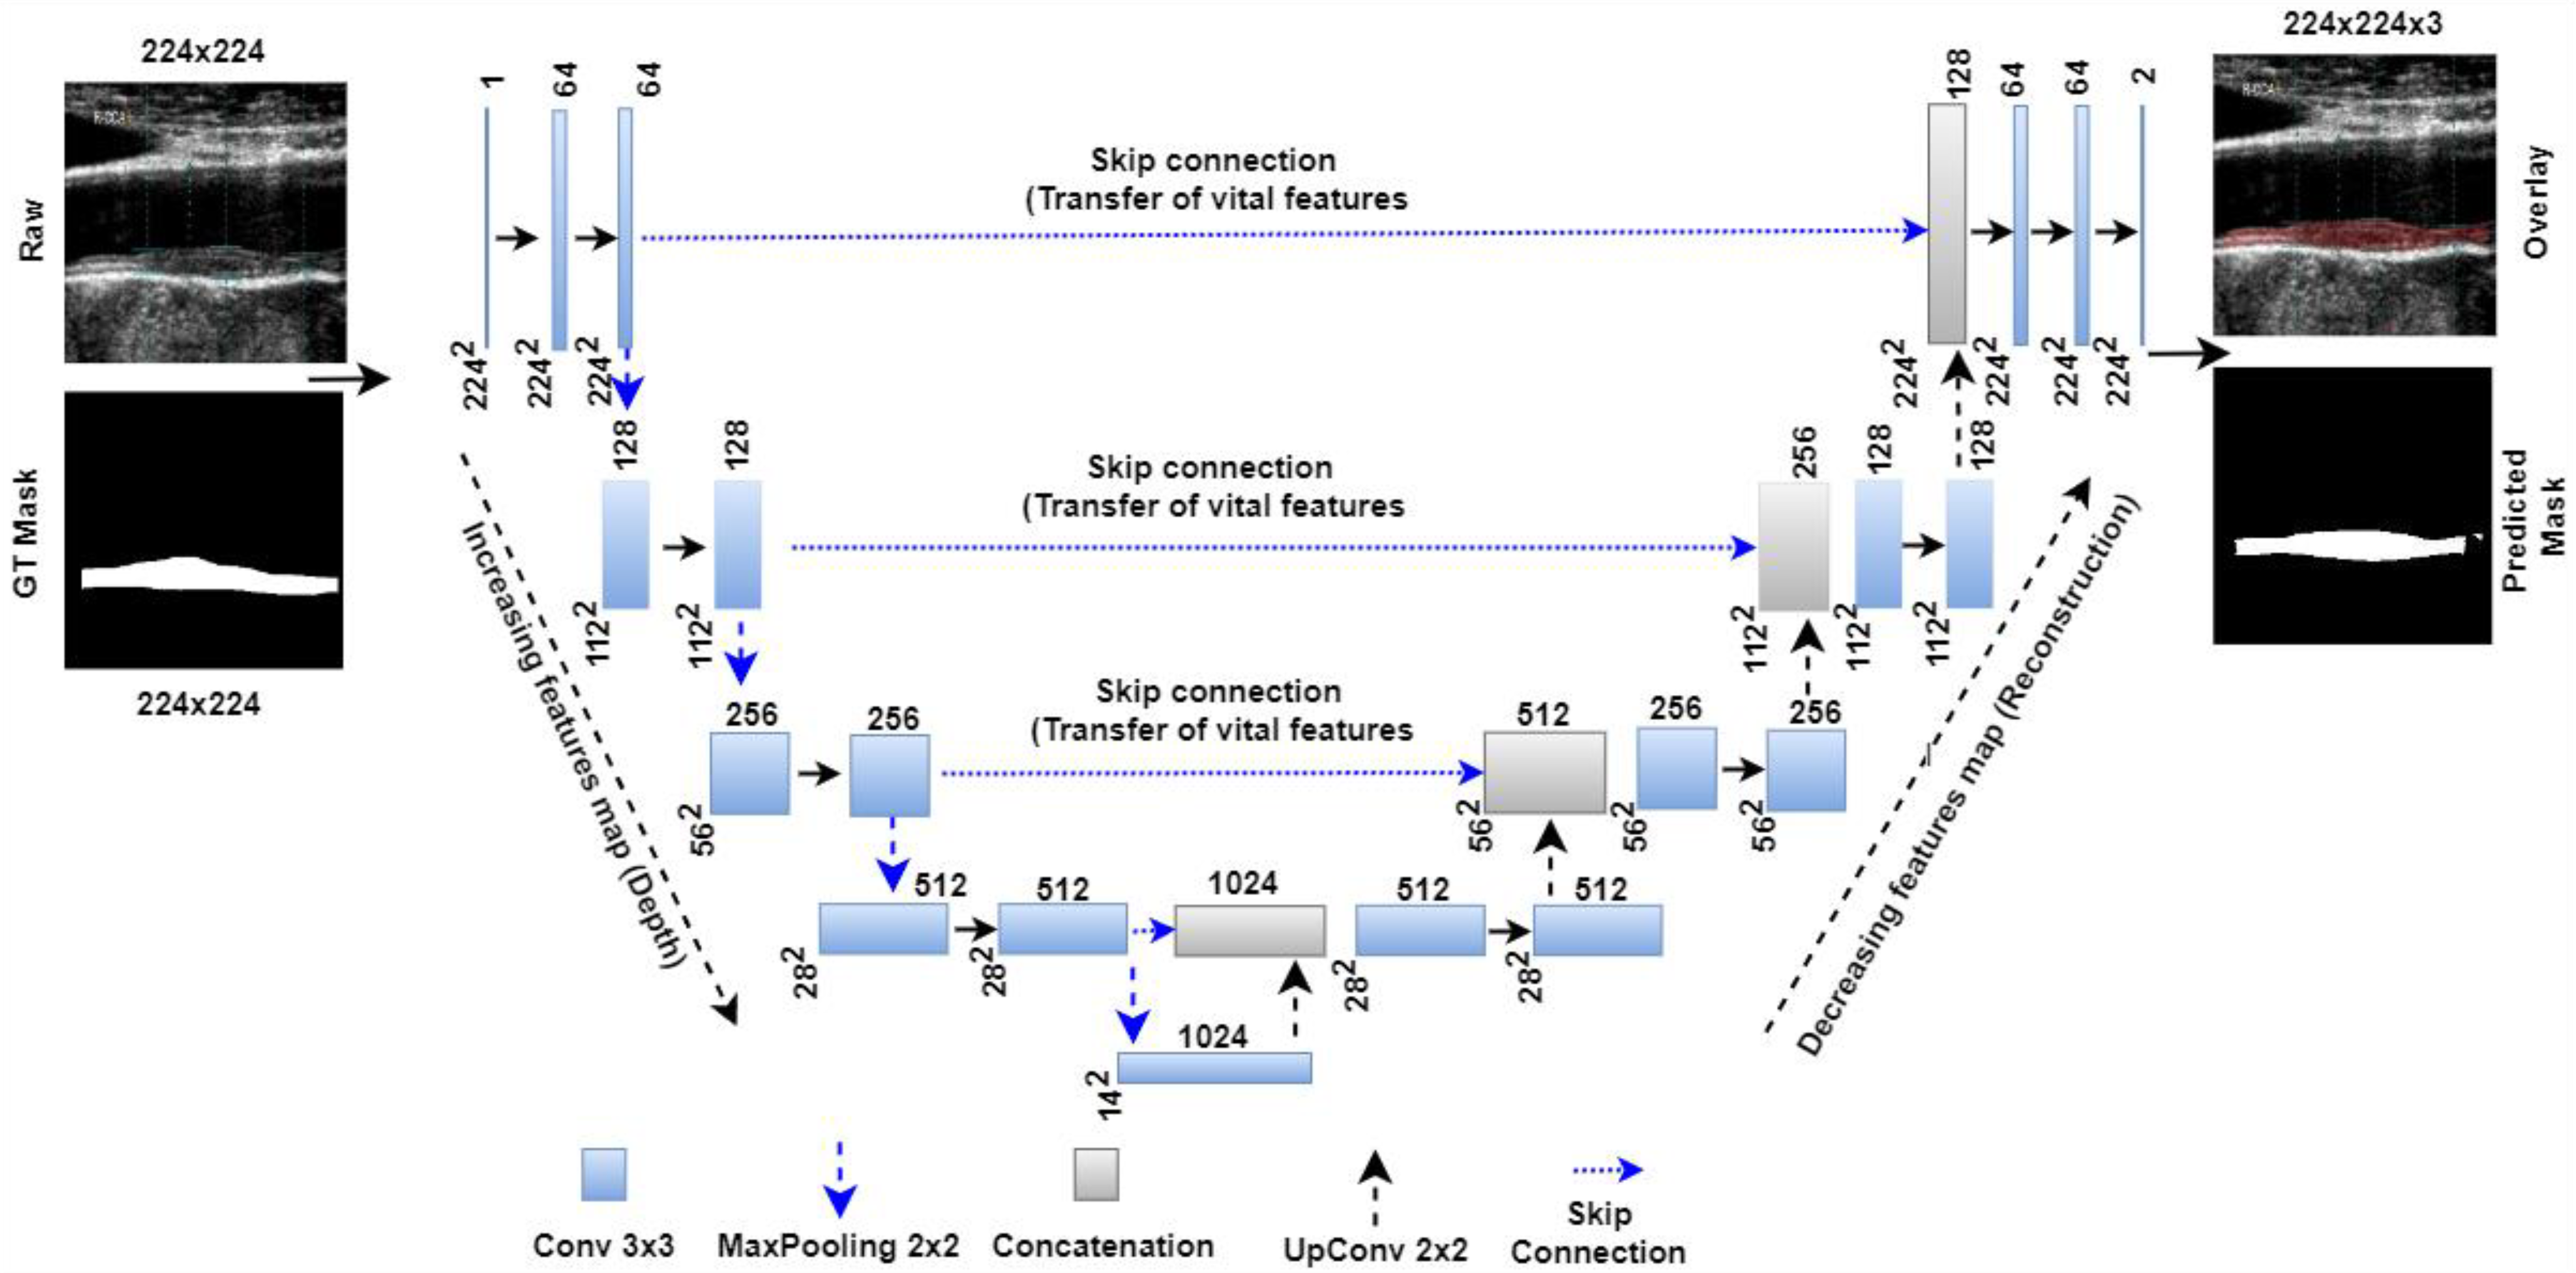
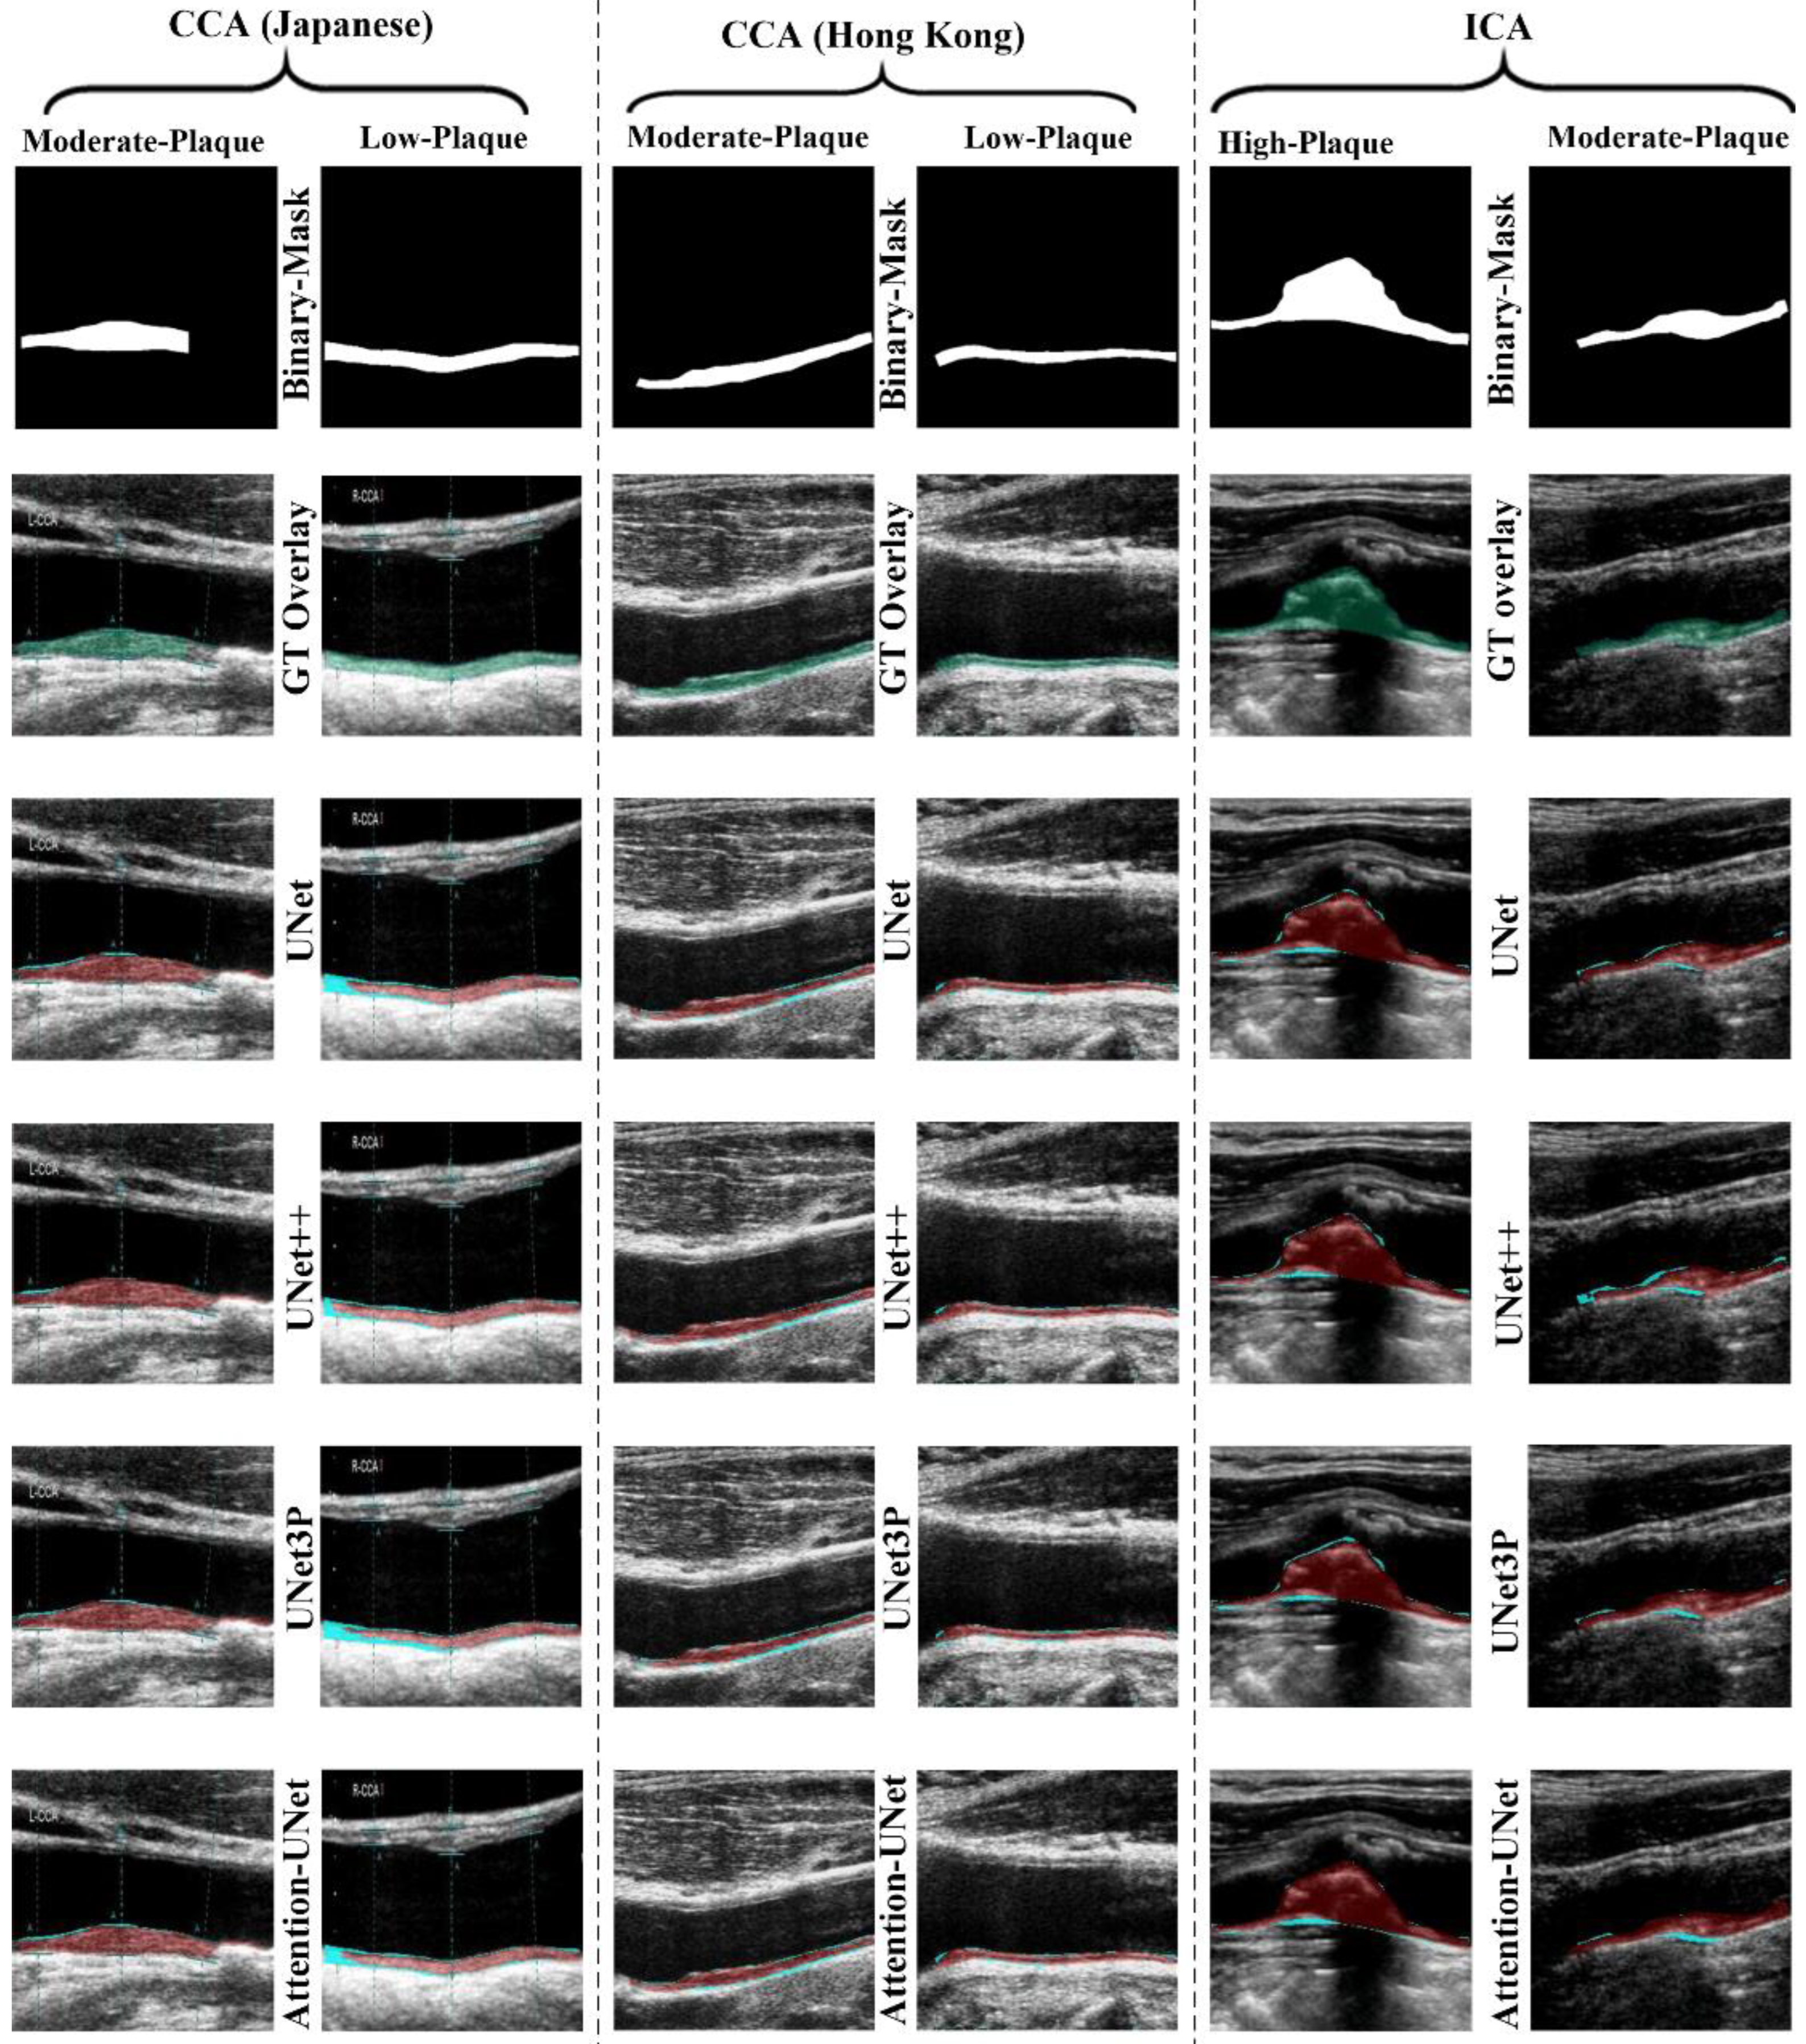
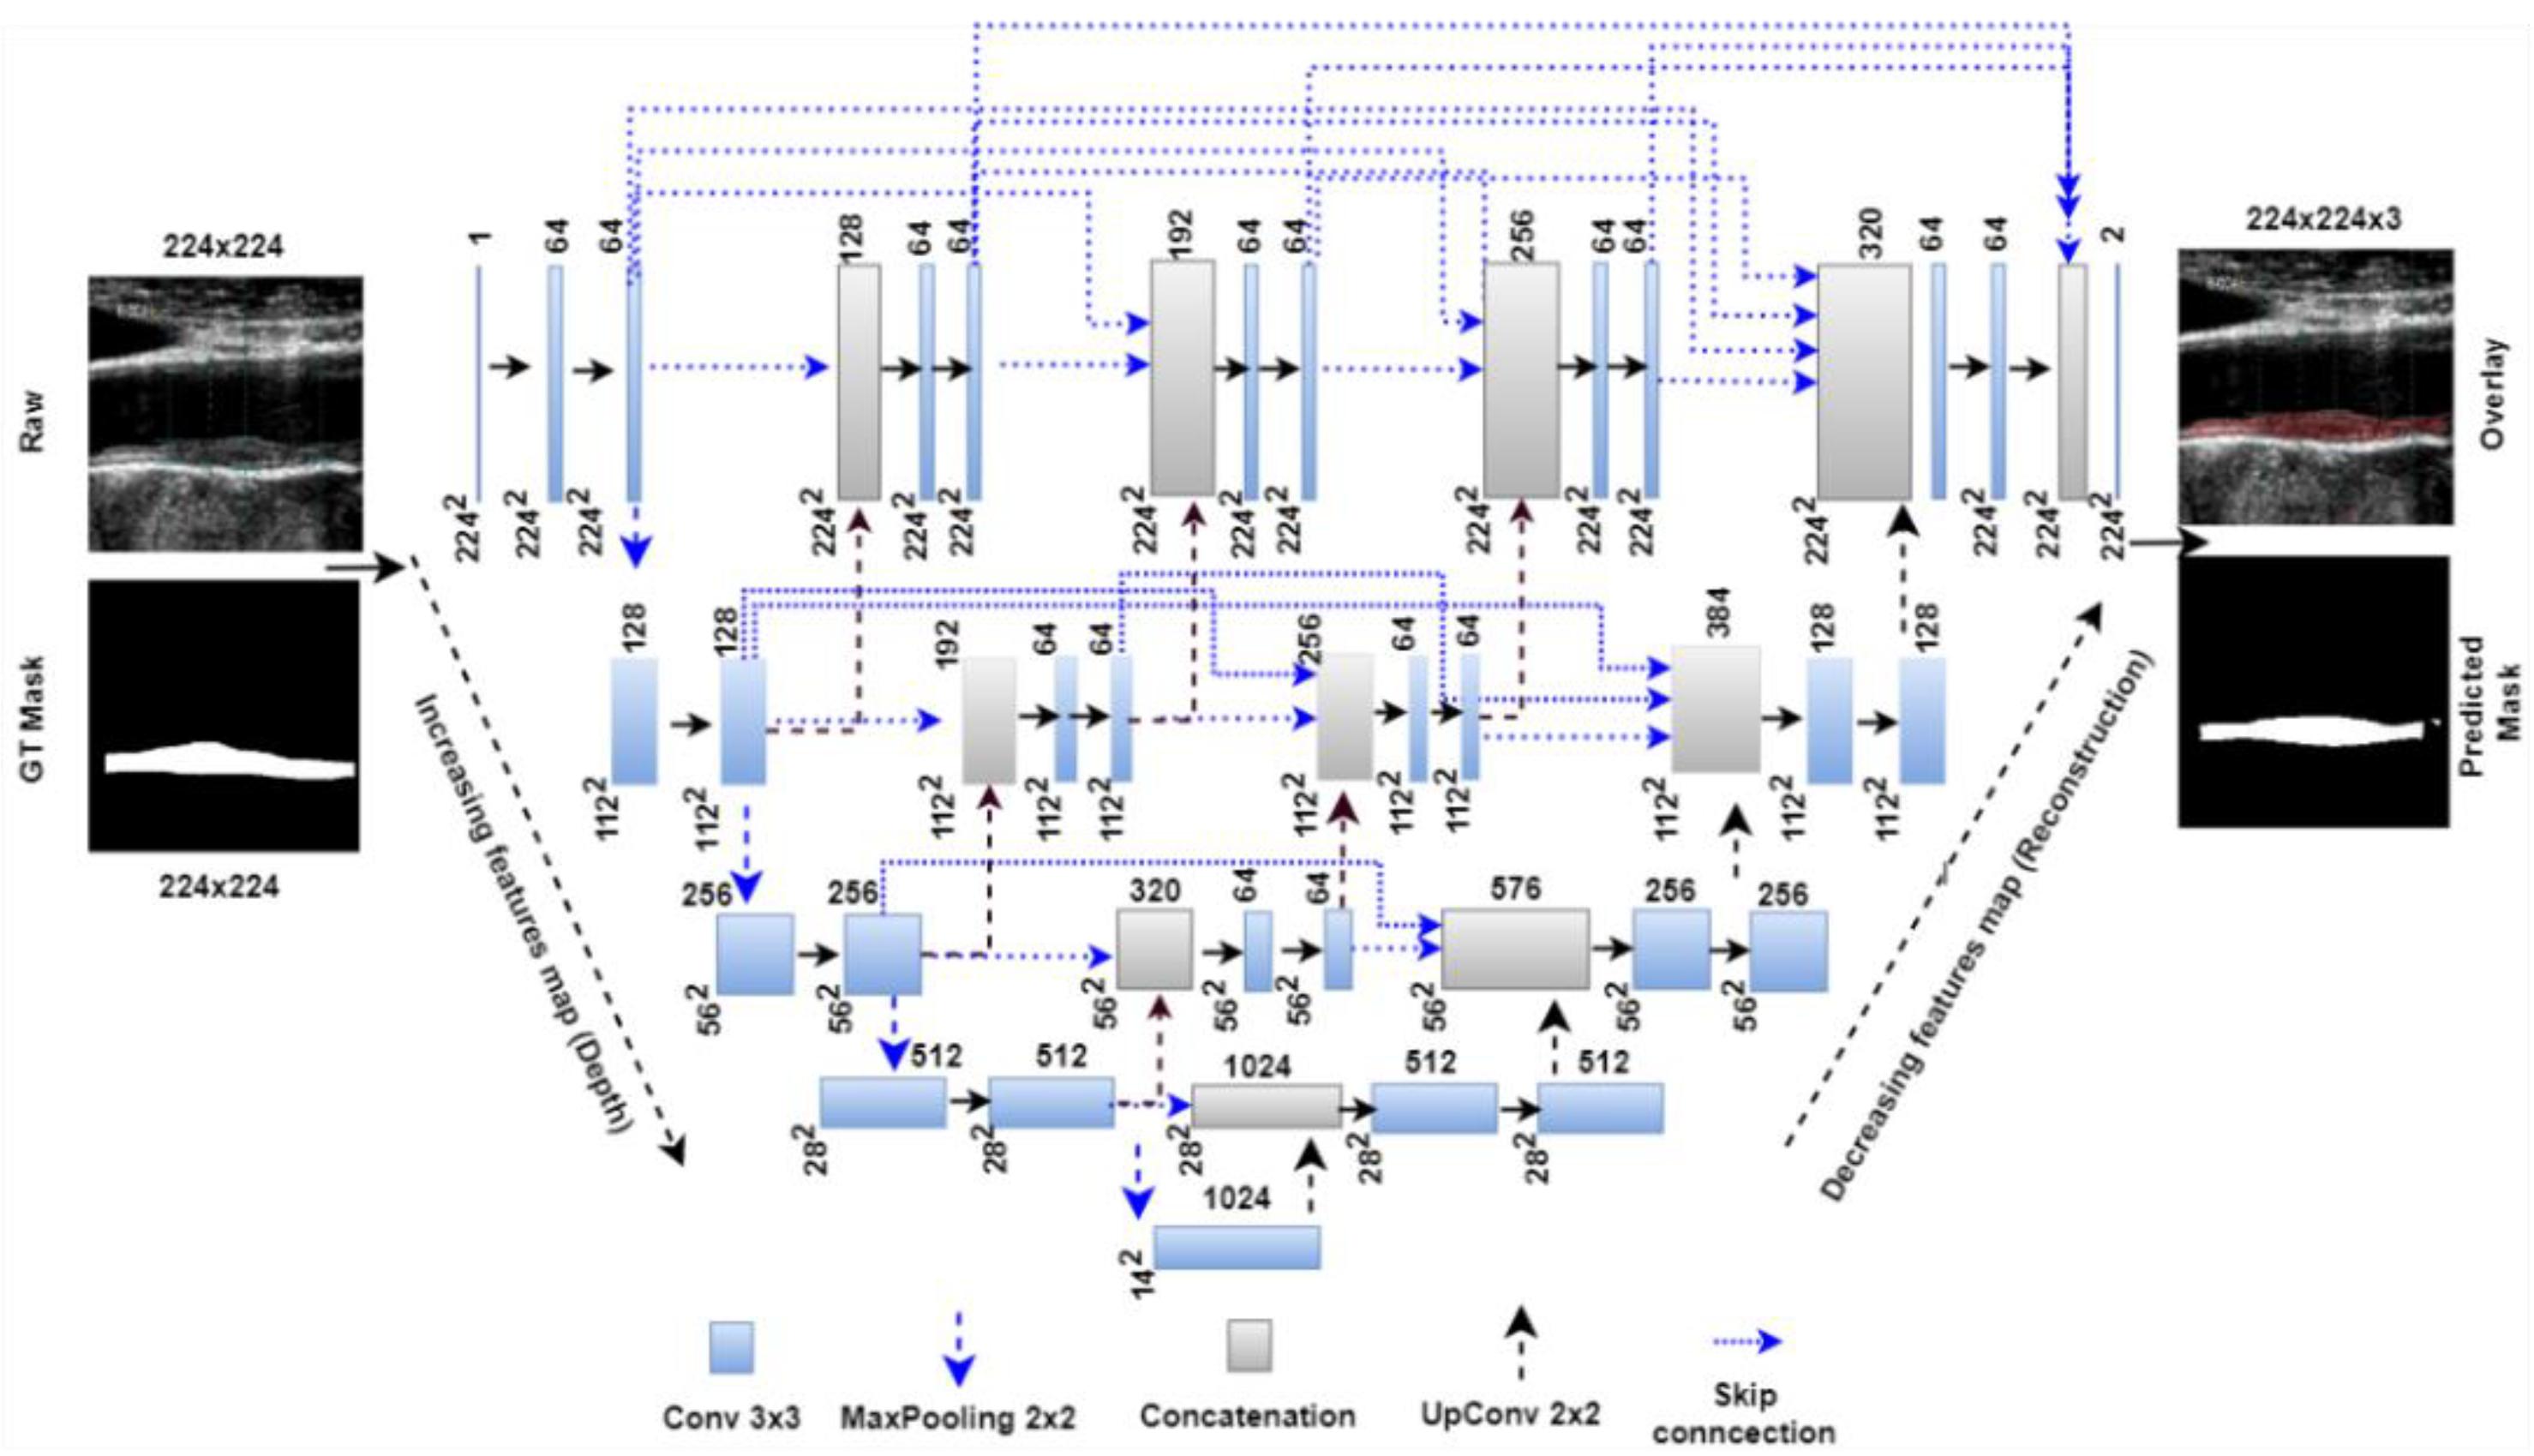
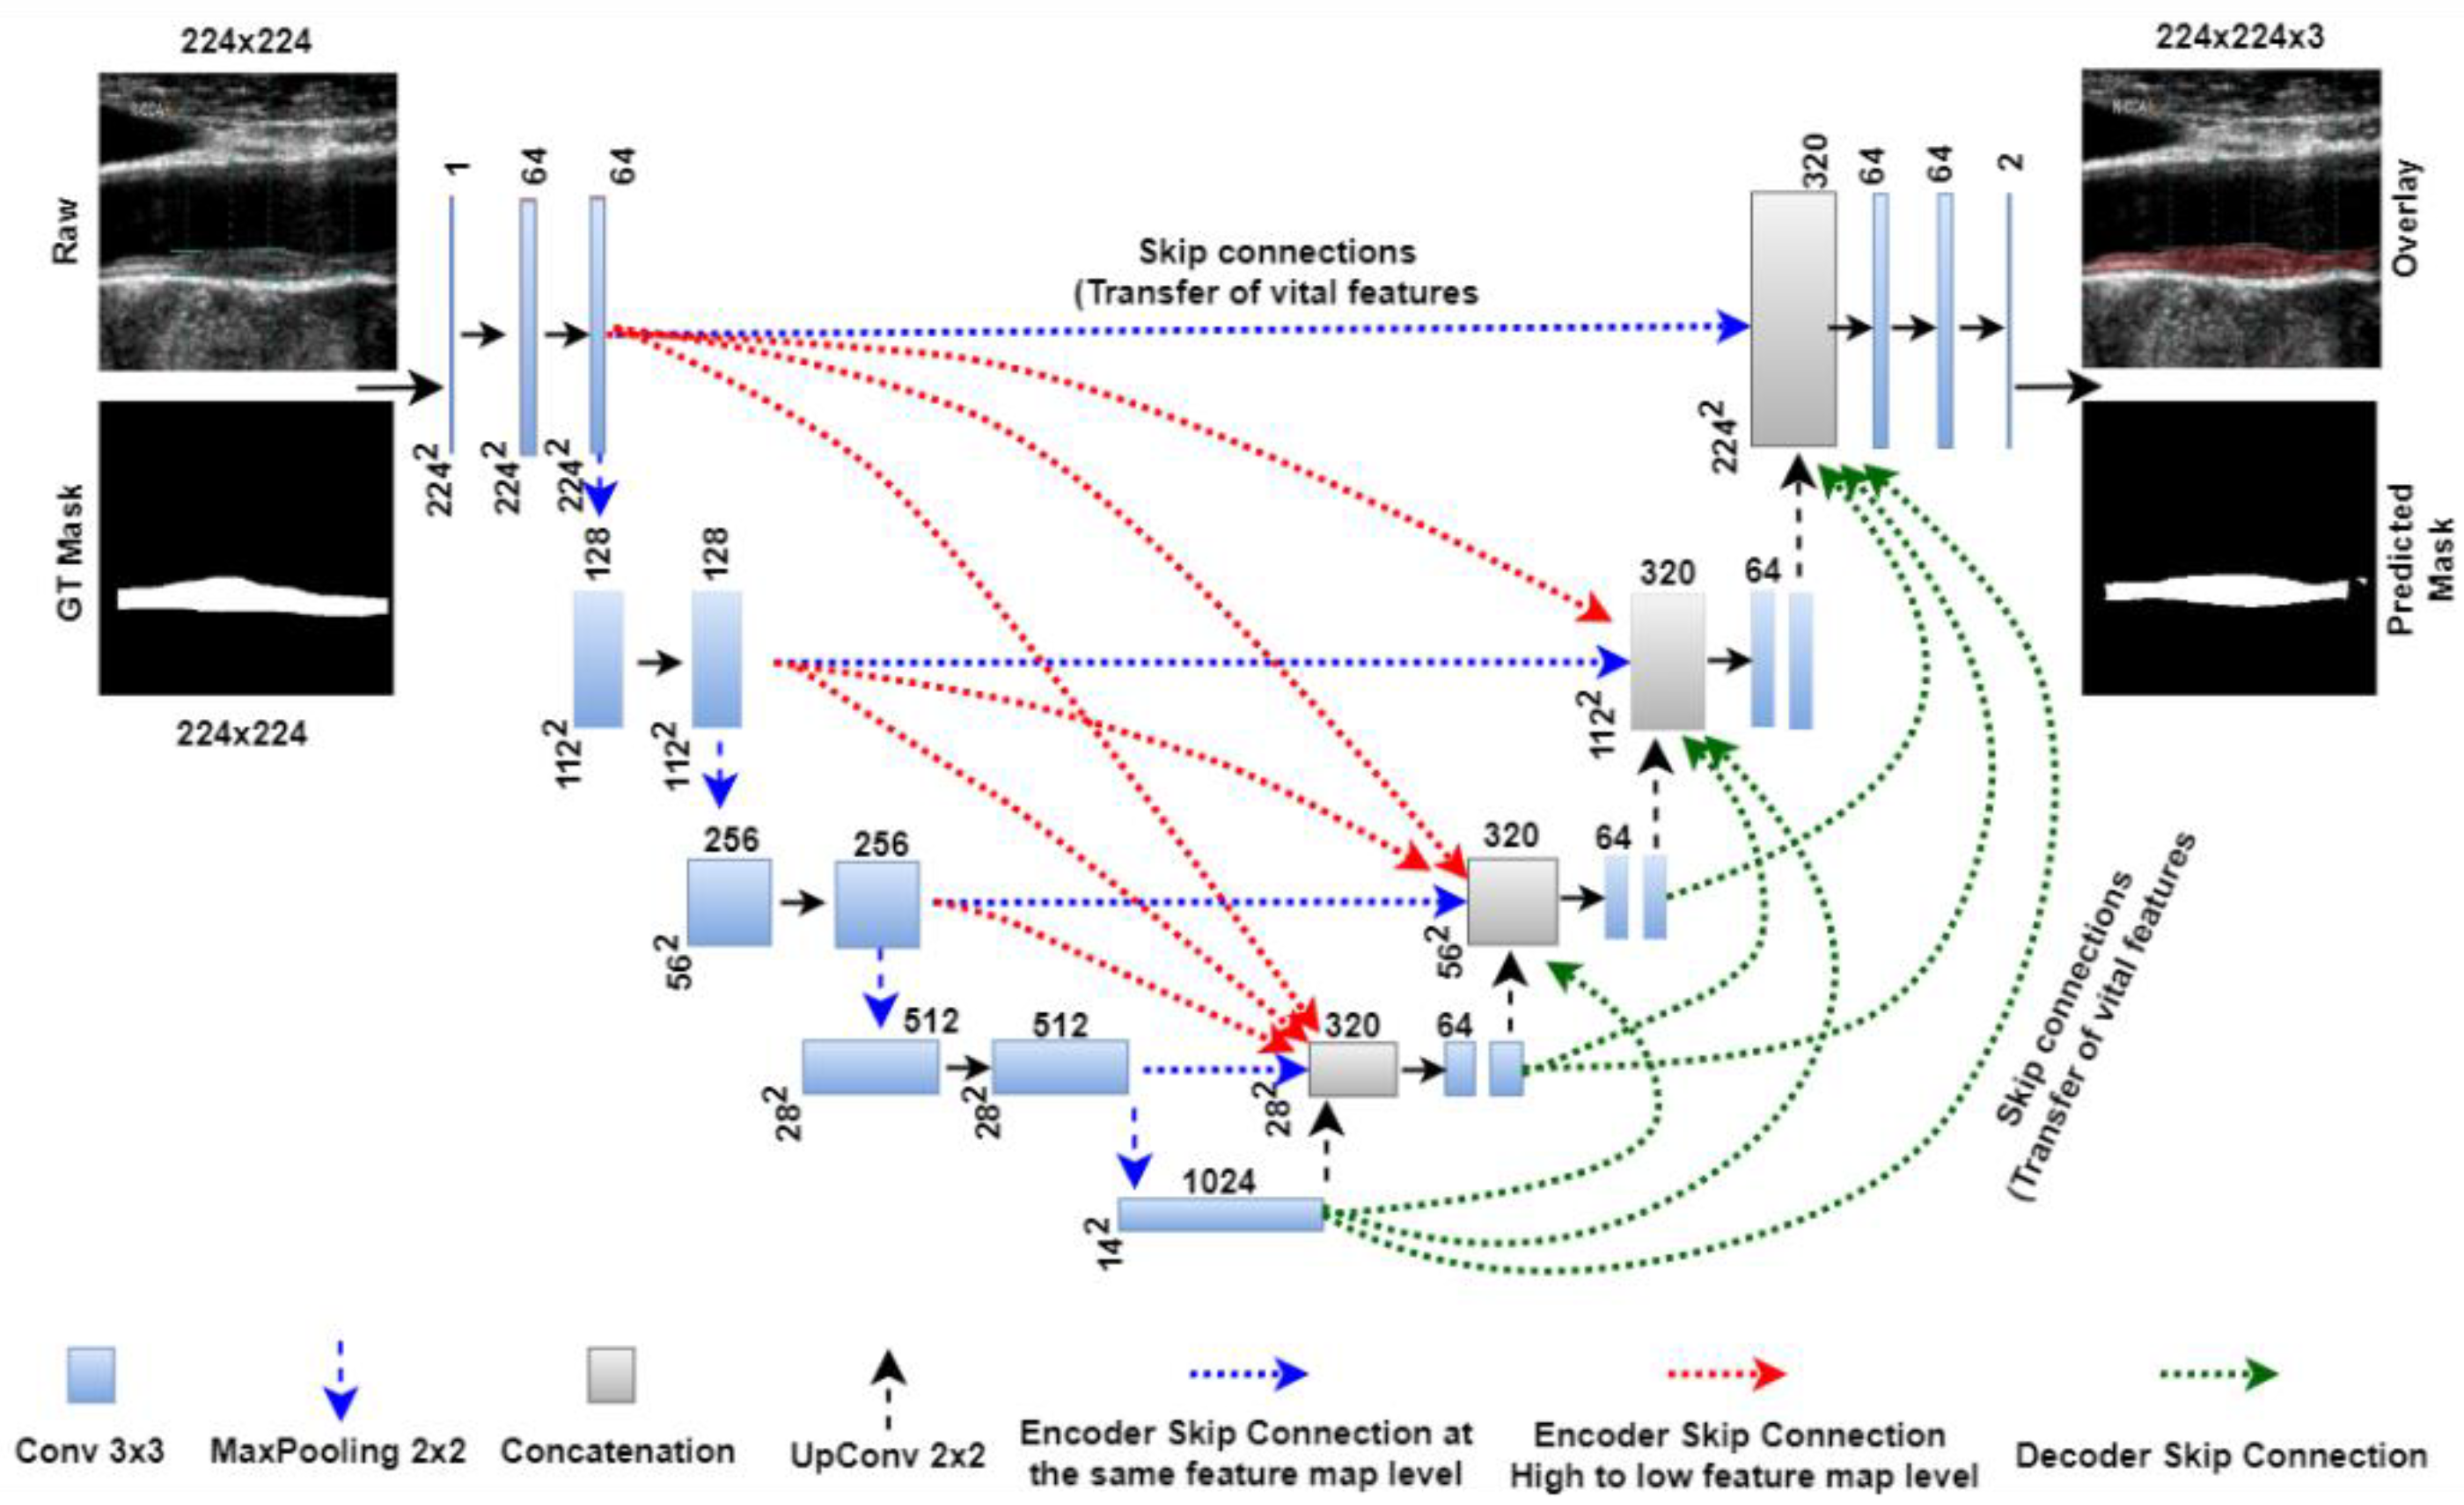
4.2. CUSIP Quantification Using UNet Architectures: UNet, UNet+, UNet++, UNet3P
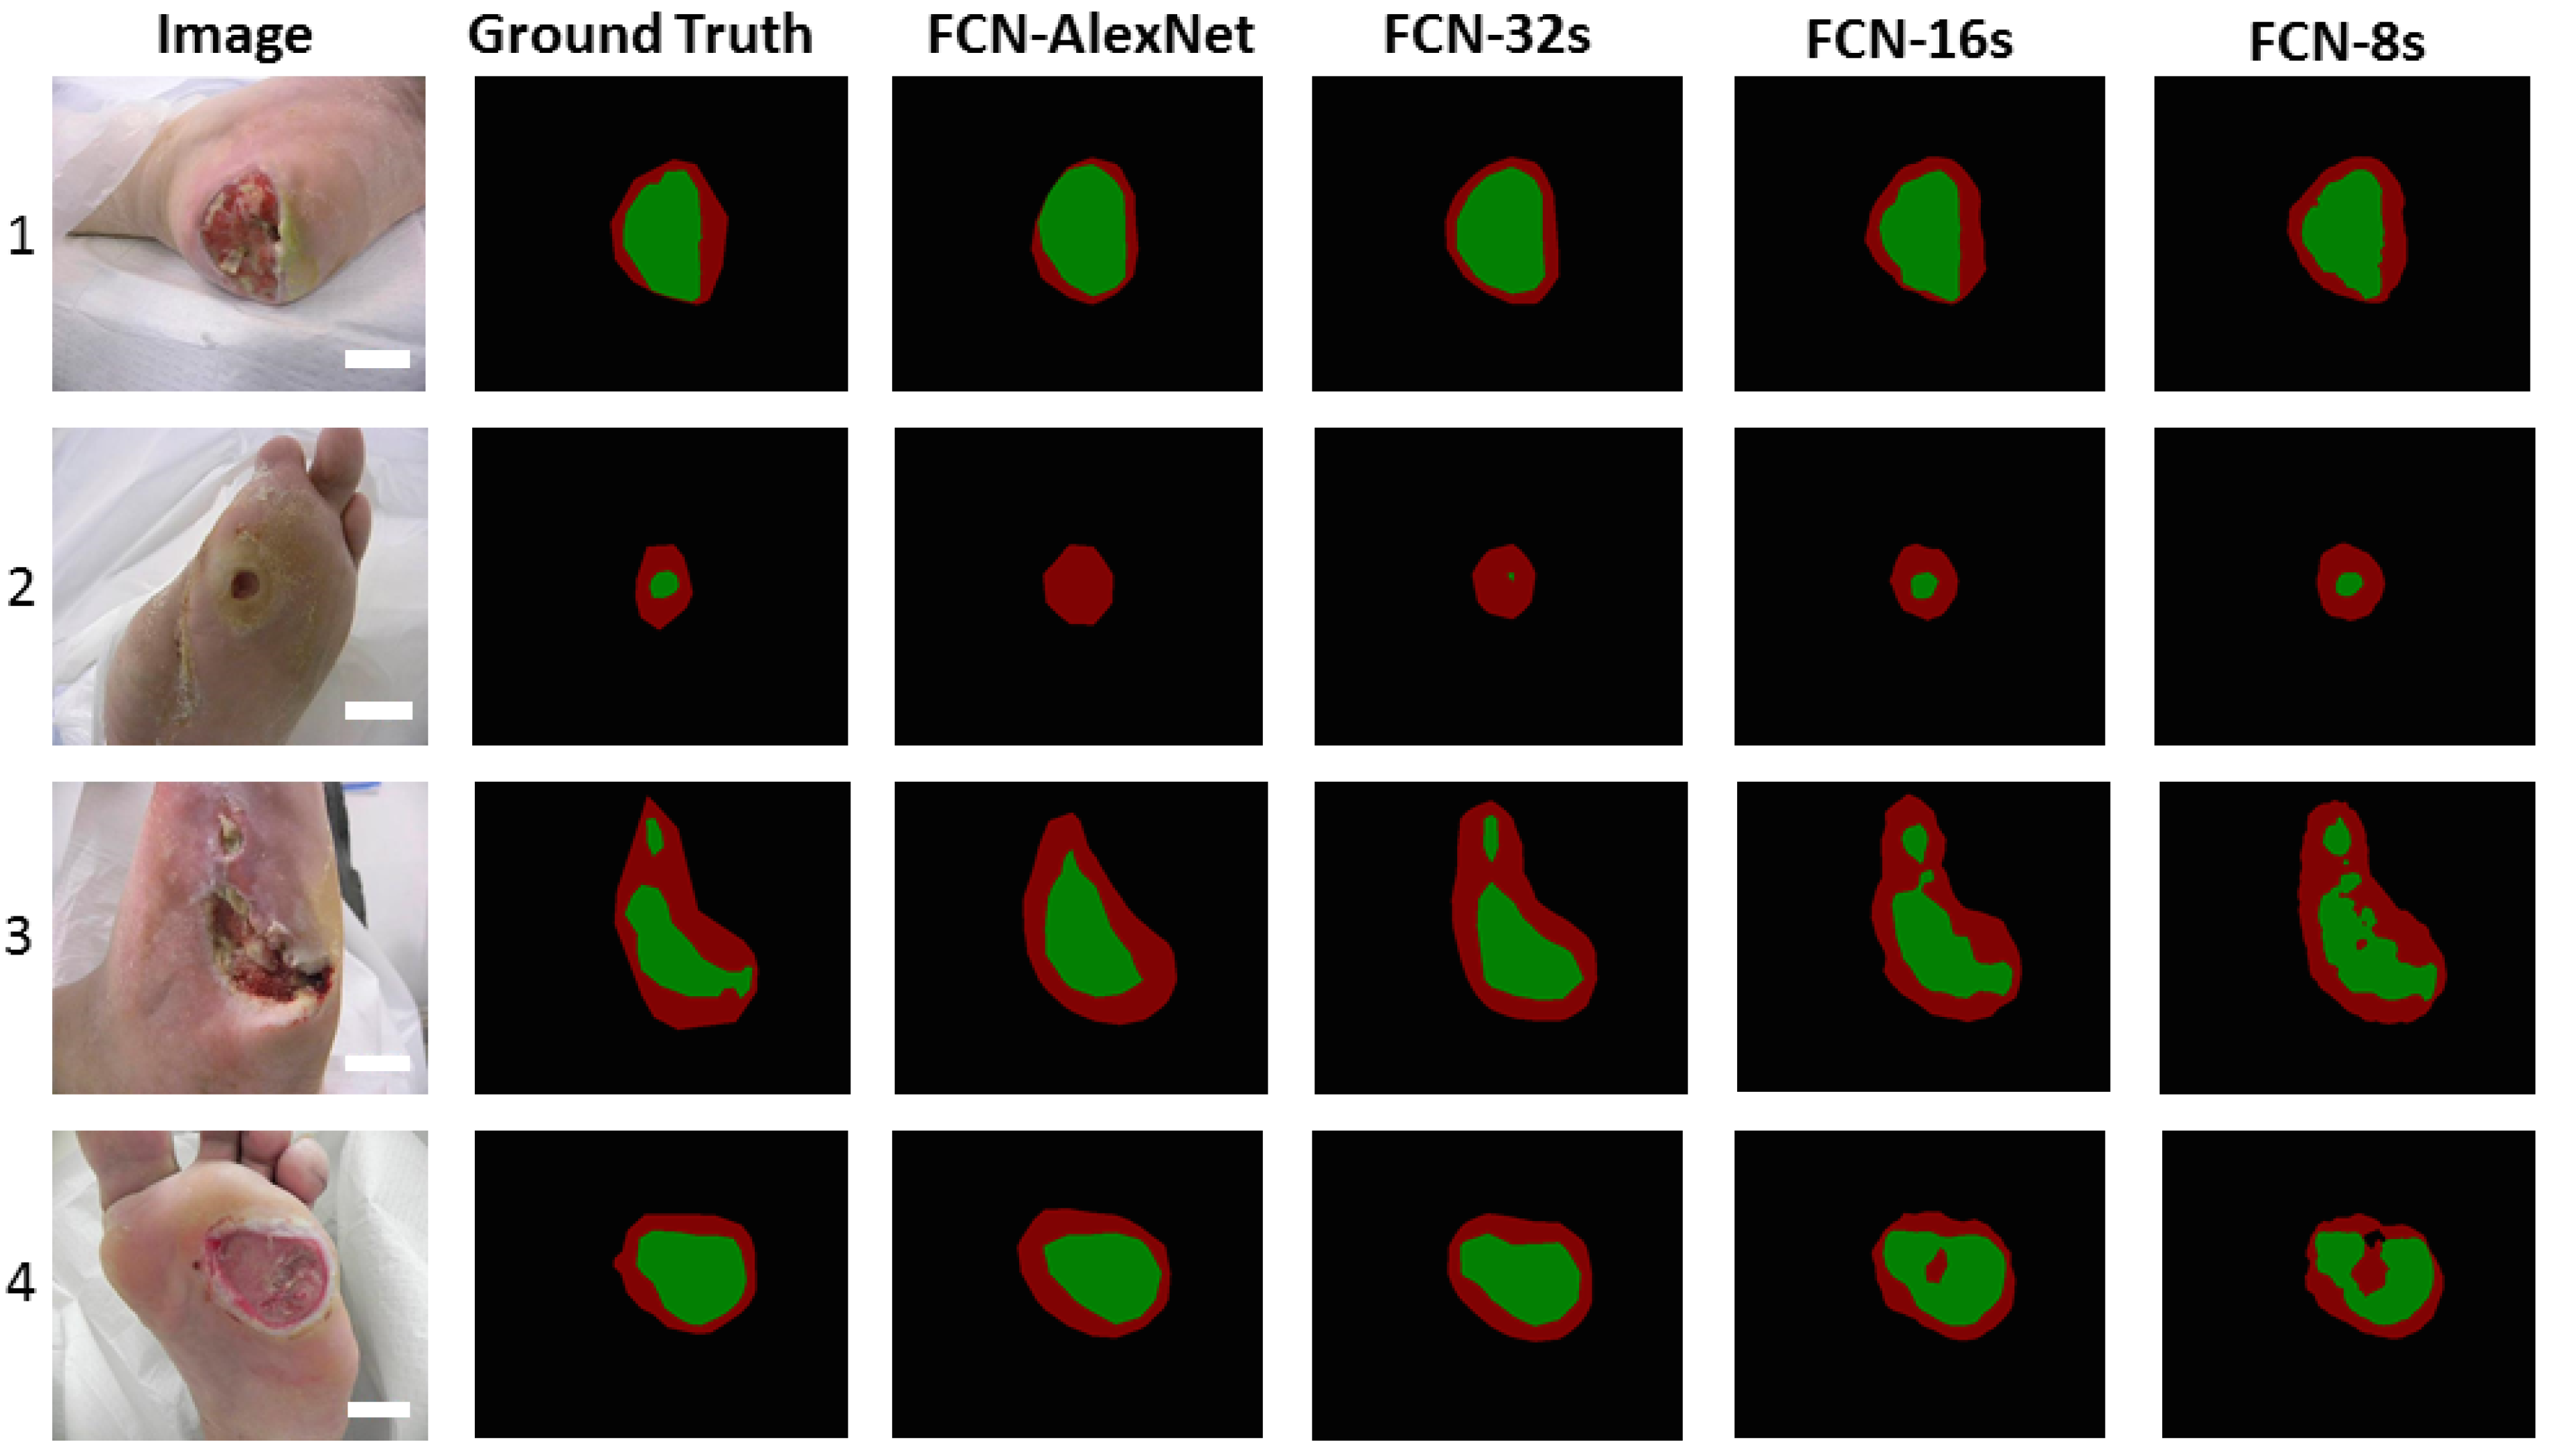
4.3. Deep Learning for Diabetic Foot Ulcer Lesion Segmentation and Its Quantification
4.4. Challenges in CVD Risk Stratification on DFI Patients
5. Discussion
5.1. Principal Findings
5.2. Benchmarking
5.3. Special Note on Casual Relationship between DFI and CVD
5.4. A Short Note on the Effect of COVID-19 on DFI Patients
5.5. A Short Note on Bias in Deep Learning Systems for CVD/Stroke Risk, DFI, CUSIP Measurements
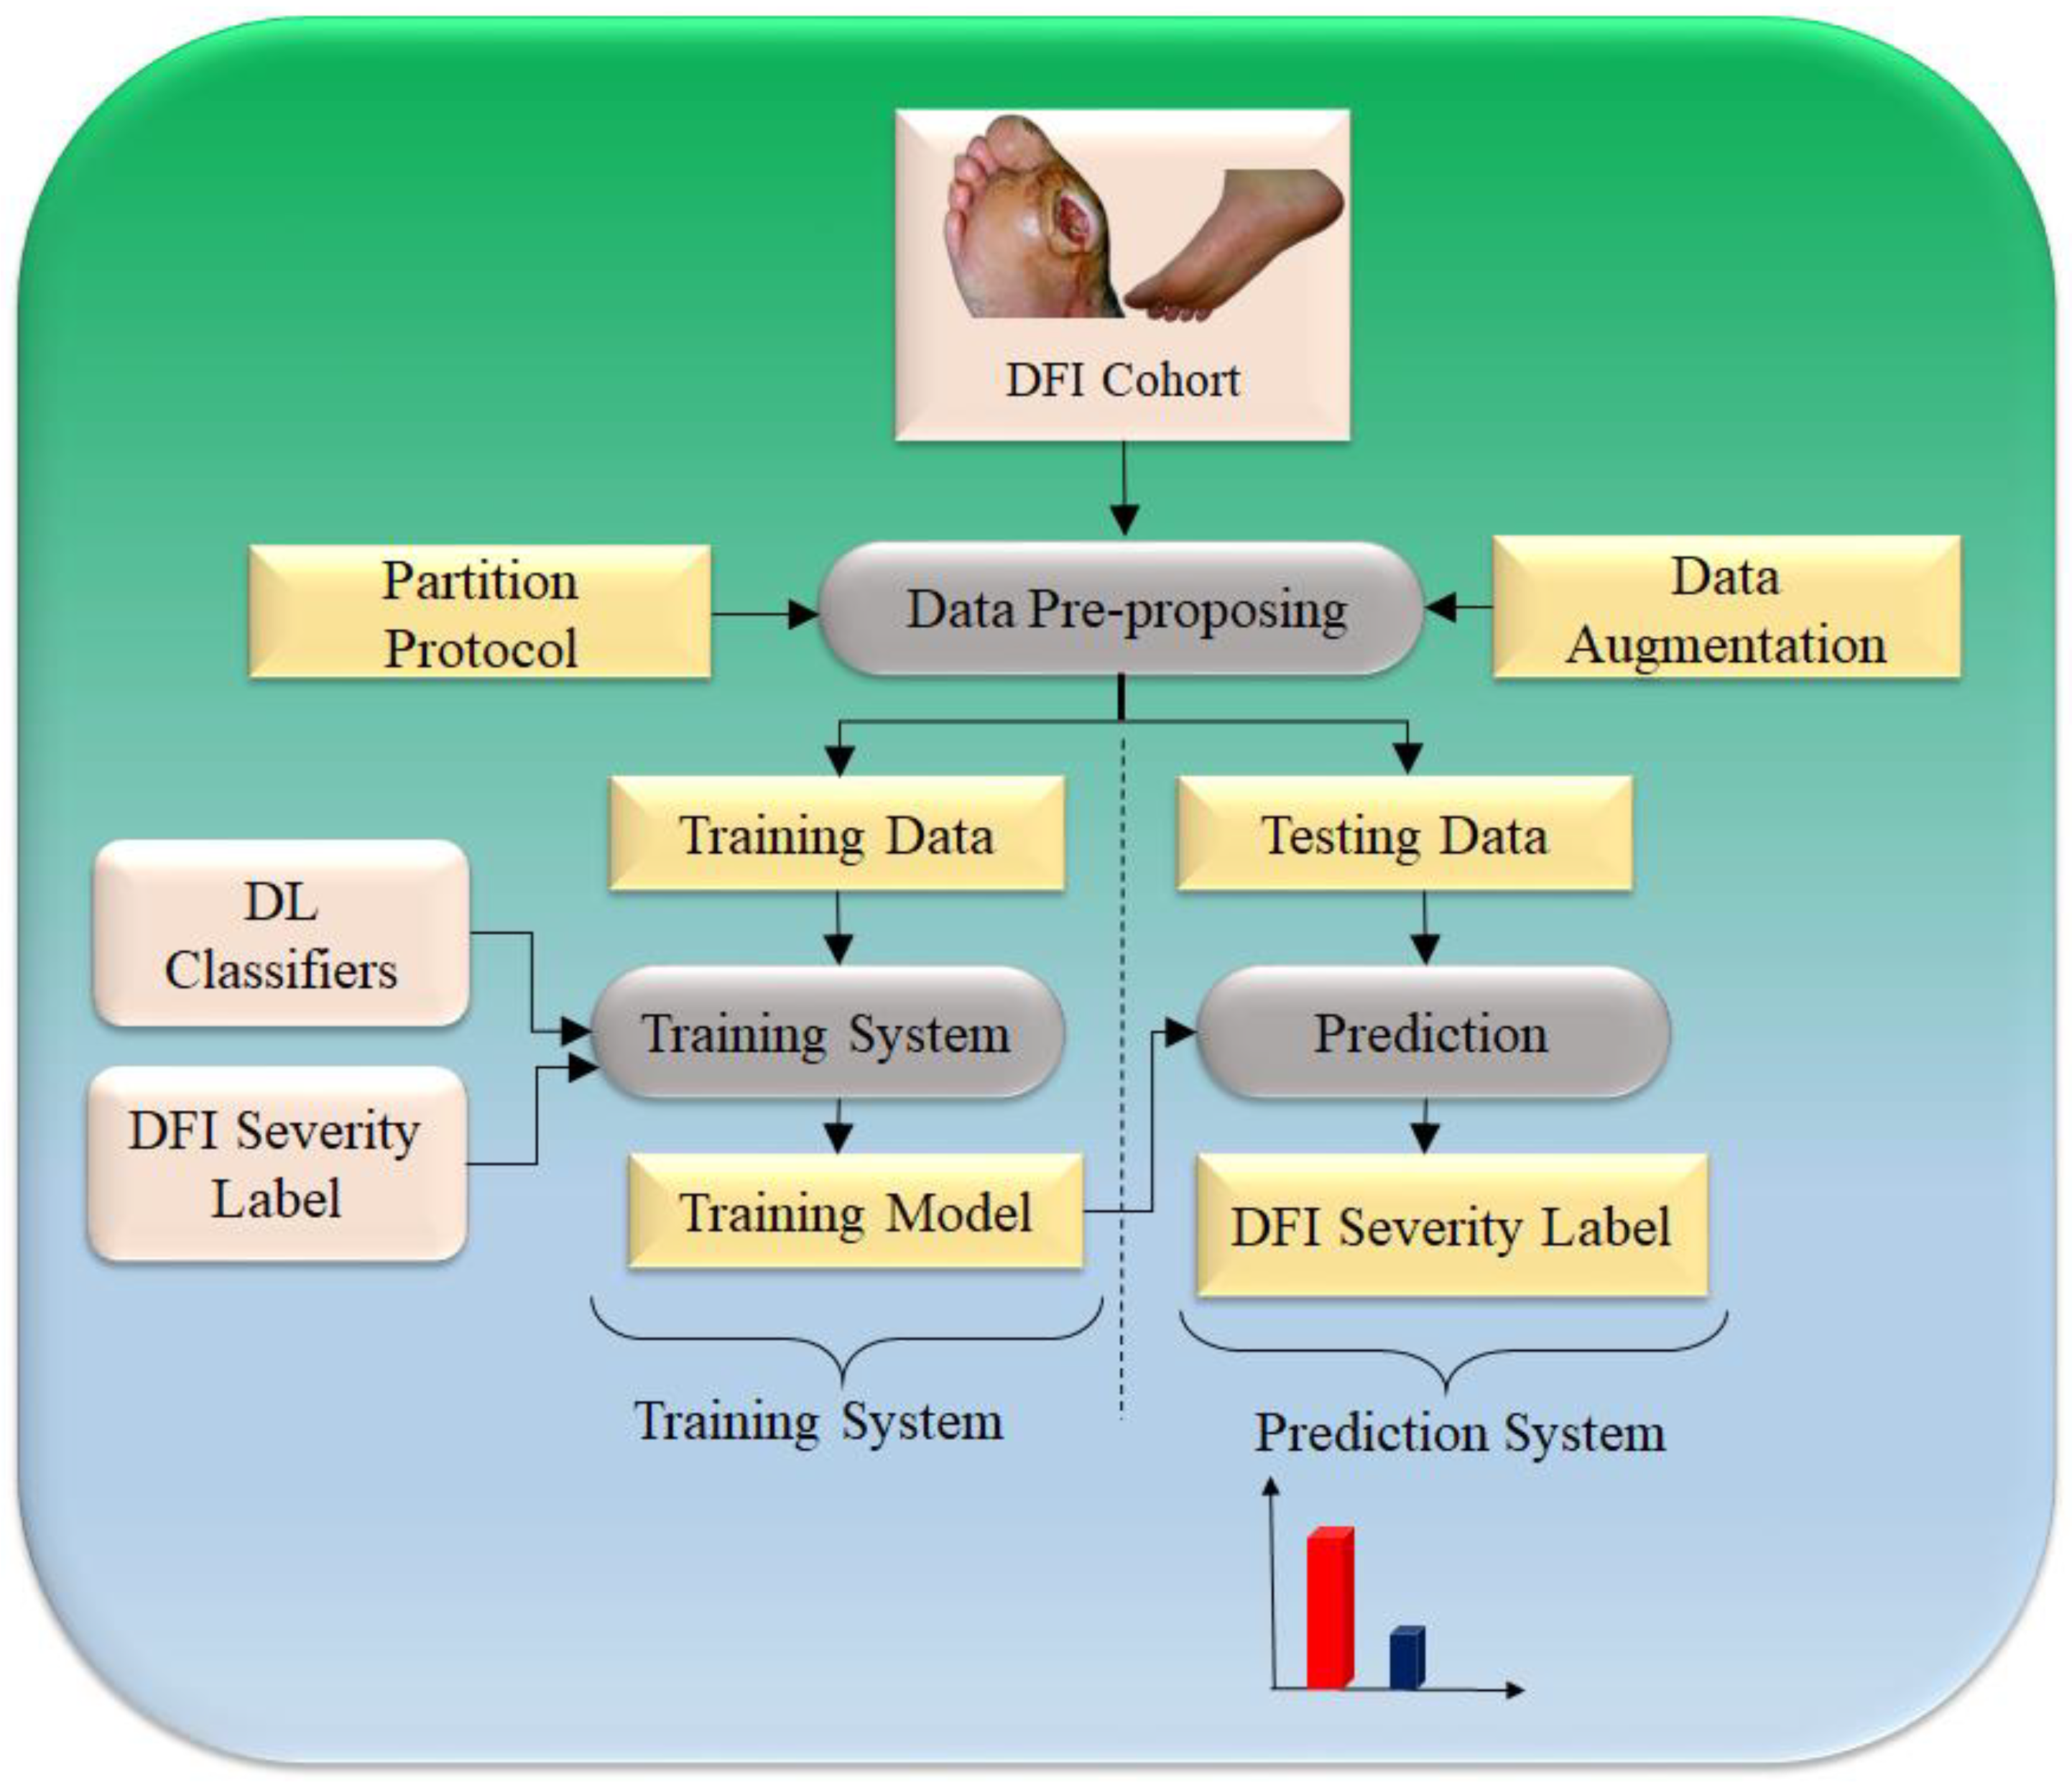
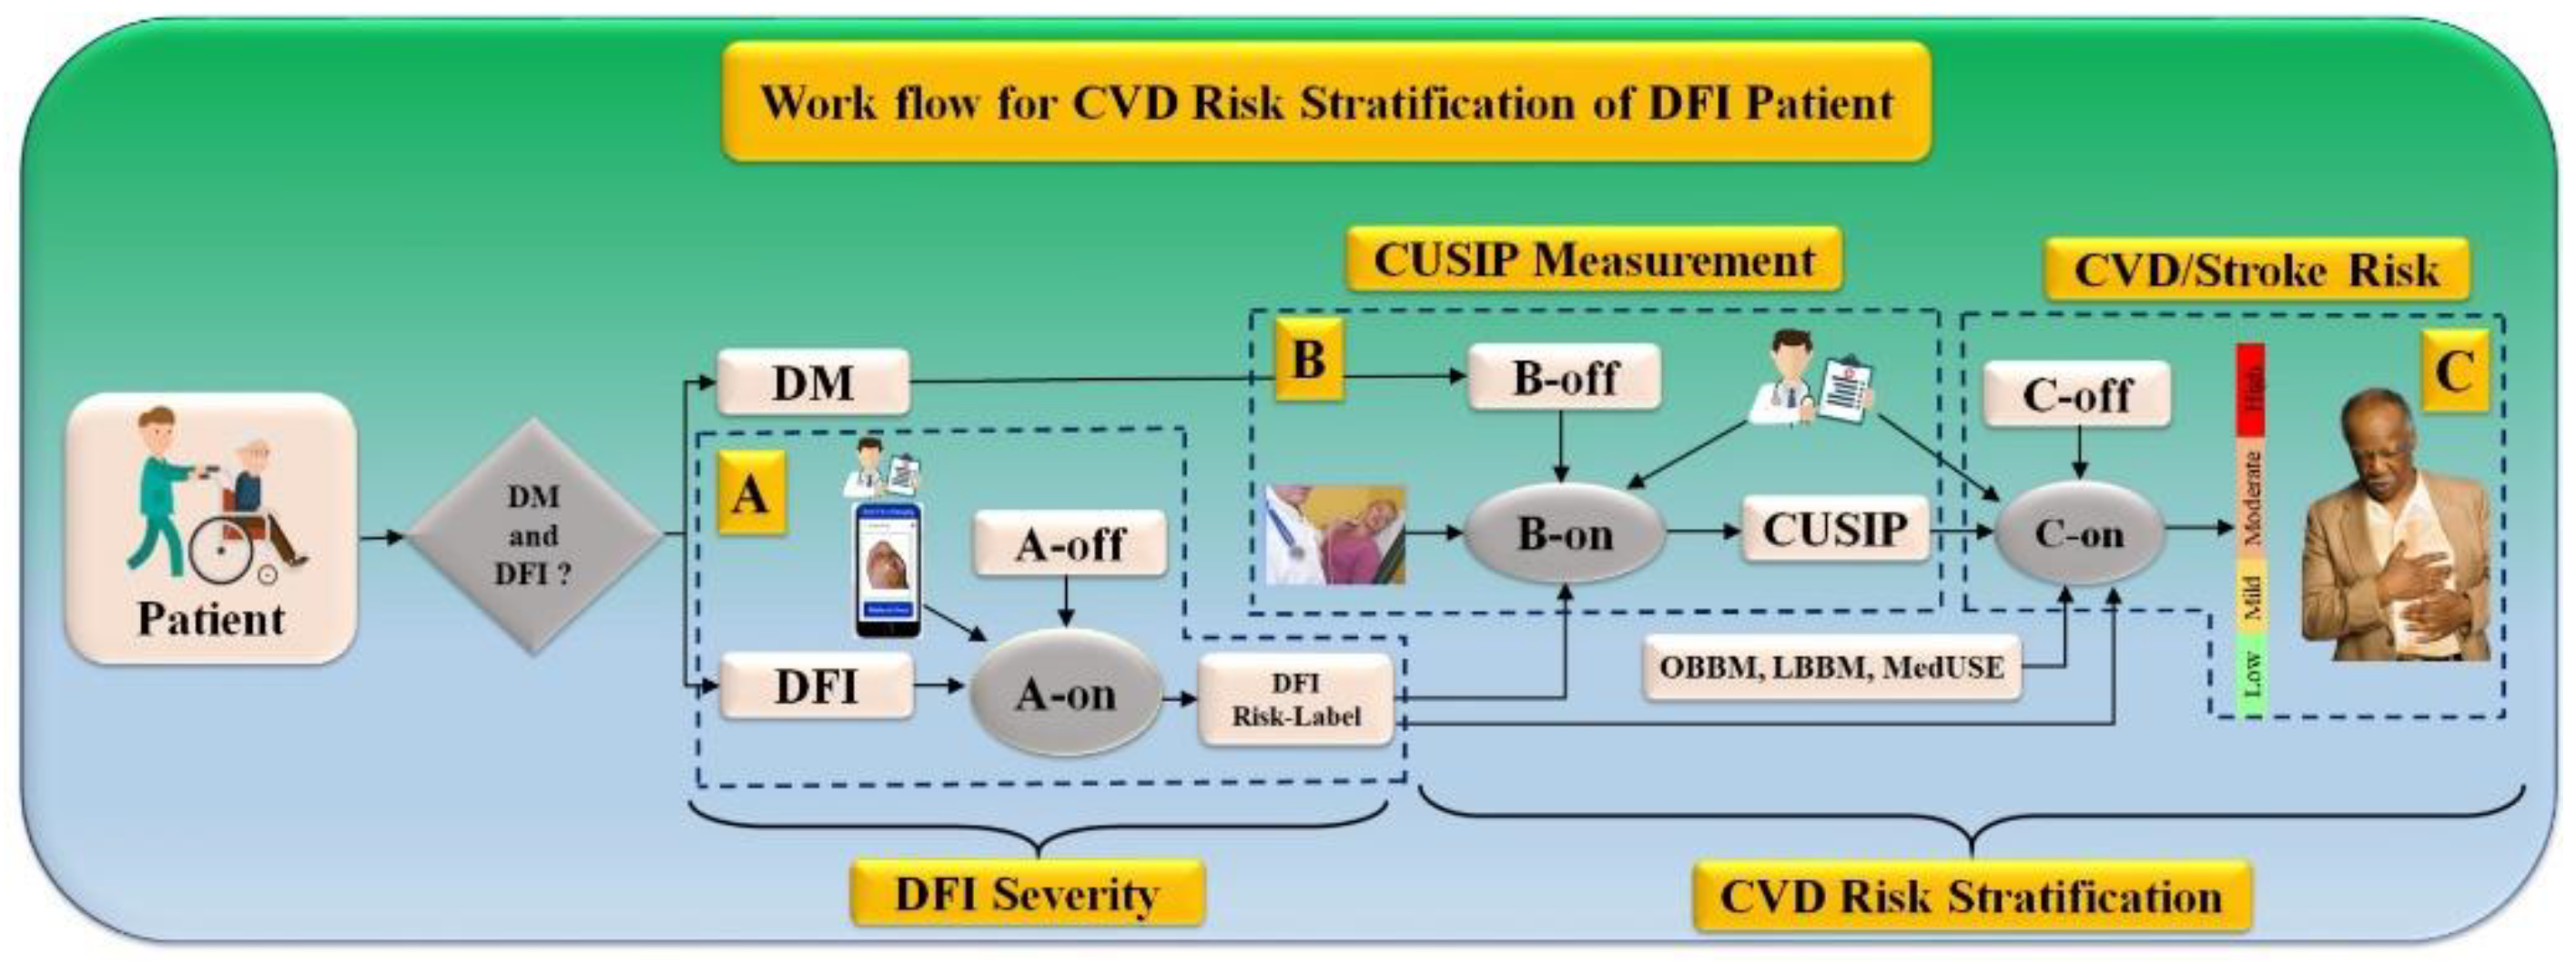
5.6. Work Flow for CVD Risk Stratification for DFI Patients
5.7. Strengths, Weakness, and Extensions
6. Conclusions
Author Contributions
Funding
Institutional Review Board Statement
Informed Consent Statement
Data Availability Statement
Conflicts of Interest
Appendix A. UNet+ and UNet++, and UNet3P Architecture


References
- Apelqvist, J.; Bakker, K.; van Houtum, W.H.; Schaper, N.C.; International Working Group on the Diabetic Foot (IWGDF) Editorial Board. Practical guidelines on the management and prevention of the diabetic foot: Based upon the International Consensus on the Diabetic Foot (2007) Prepared by the International Working Group on the Diabetic Foot. Diabetes/Metab. Res. Rev. 2008, 24, S181–S187. [Google Scholar]
- Boulton, A.J.; Vileikyte, L.; Ragnarson-Tennvall, G.; Apelqvist, J. The global burden of diabetic foot disease. Lancet 2005, 366, 1719–1724. [Google Scholar] [CrossRef]
- Wang, C.-J.; Ko, J.-Y.; Kuo, Y.-R.; Yang, Y.-J. Molecular changes in diabetic foot ulcers. Diabetes Res. Clin. Pract. 2011, 94, 105–110. [Google Scholar] [CrossRef]
- ElTanboly, A.; Shalaby, A.; Mahmoud, A.; Ghazal, M.; Switala, A.; Taher, F.; Suri, J.S.; Keynton, R.; El-Baz, A. Computer Aided Diagnosis System for Early Detection of Diabetic Retinopathy Using OCT Images. In Big Data in Multimodal Medical Imaging; CRC Press: Boca Raton, FL, USA, 2019; pp. 281–299. [Google Scholar]
- El-Baz, A.; Gimel’Farb, G.; Suri, J.S. Stochastic Modeling for Medical Image Analysis; CRC Press: Boca Raton, FL, USA, 2015. [Google Scholar]
- Centers for Disease Control and Prevention. National Diabetes Fact Sheet: National Estimates and General Information on Diabetes and Prediabetes in the United States; US Department of Health Human Services, Centres for Disease Control Prevention: Atlanta, GA, UA, 2022; Volume 201, pp. 2568–2569.
- American Diabetes Association. Consensus Development Conference on Diabetic Foot Wound Care: 7–8 April 1999, Boston, Massachusetts. Diabetes Care 1999, 22, 1354–1360. [Google Scholar] [CrossRef] [PubMed]
- E Pecoraro, R.; E Reiber, G.; Burgess, E.M. Pathways to Diabetic Limb Amputation: Basis for Prevention. Diabetes Care 1990, 13, 513–521. [Google Scholar] [CrossRef] [PubMed]
- Khanolkar, M.; Bain, S.; Stephens, J. The diabetic foot. QJM An. Int. J. Med. 2008, 101, 685–695. [Google Scholar] [CrossRef] [PubMed]
- Reiber, G. Epidemiology of foot ulcers and amputations in the diabetic foot. Diabet. Foot 2001, 71, 73–82. [Google Scholar]
- Bertoluci, M.C.; Rocha, V.Z. Cardiovascular risk assessment in patients with diabetes. Diabetol. Metab. Syndr. 2017, 9, 25. [Google Scholar] [CrossRef] [Green Version]
- Islam, S.M.S.; Ahmed, S.; Uddin, R.; Siddiqui, M.U.; Malekahmadi, M.; Al Mamun, A.; Alizadehsani, R.; Khosravi, A.; Nahavandi, S. Cardiovascular diseases risk prediction in patients with diabetes: Posthoc analysis from a matched case-control study in Bangladesh. J. Diabetes Metab. Disord. 2021, 20, 417–425. [Google Scholar] [CrossRef]
- Domingueti, C.P.; Dusse, L.M.S.A.; Carvalho, M.d.G.; de Sousa, L.P.; Gomes, K.B.; Fernandes, A.P. Diabetes mellitus: The linkage between oxidative stress, inflammation, hypercoagulability and vascular complications. J. Diabetes Its Complicat. 2016, 30, 738–745. [Google Scholar] [CrossRef]
- Brownrigg, J.R.W.; Davey, J.; Holt, P.J.; Davis, W.A.; Thompson, M.M.; Ray, K.K.; Hinchliffe, R.J. The association of ulceration of the foot with cardiovascular and all-cause mortality in patients with diabetes: A meta-analysis. Diabetologia 2012, 55, 2906–2912. [Google Scholar] [CrossRef] [Green Version]
- Dietrich, I.; Braga, G.A.; De Melo, F.G.; Silva, A.C.C.D.C.S. The Diabetic Foot as a Proxy for Cardiovascular Events and Mortality Review. Curr. Atheroscler. Rep. 2017, 19, 44. [Google Scholar] [CrossRef] [PubMed]
- Tuttolomondo, A.; Maida, C.; Pinto, A. Diabetic Foot Syndrome as a Possible Cardiovascular Marker in Diabetic Patients. J. Diabetes Res. 2015, 2015, 268390. [Google Scholar] [CrossRef] [Green Version]
- Most, A.S.; A Ruocco, N.; Gewirtz, H. Effect of a reduction in blood viscosity on maximal myocardial oxygen delivery distal to a moderate coronary stenosis. Circulation 1986, 74, 1085–1092. [Google Scholar] [CrossRef] [Green Version]
- Munjral, S.; Ahluwalia, P.; Jamthikar, A.D.; Puvvula, A.; Saba, L.; Faa, G.; Singh, I.M.; Chadha, P.S.; Turk, M.; Johri, A.M.; et al. Nutrition, atherosclerosis, arterial imaging, cardiovascular risk stratification, and manifestations in COVID-19 framework: A narrative review. Front. Biosci. 2021, 26, 1312. [Google Scholar] [CrossRef]
- Munjral, S.; Maindarkar, M.; Ahluwalia, P.; Puvvula, A.; Jamthikar, A.; Jujaray, T.; Suri, N.; Paul, S.; Pathak, R.; Saba, L. Cardiovascular Risk Stratification in Diabetic Retinopathy via Atherosclerotic Pathway in COVID-19/Non-COVID-19 Frameworks Using Artificial Intelligence Paradigm: A Narrative Review. Diagnostics 2022, 12, 1234. [Google Scholar] [CrossRef] [PubMed]
- Balasubramanian, G.V.; Chockalingam, N.; Naemi, R. The Role of Cutaneous Microcirculatory Responses in Tissue Injury, Inflammation and Repair at the Foot in Diabetes. Front. Bioeng. Biotechnol. 2021, 28, 814. [Google Scholar] [CrossRef]
- Maskrey, B.H.; Megson, I.L.; Whitfield, P.D.; Rossi, A.G. Mechanisms of resolution of inflammation: A focus on cardio-vascular disease. Arterioscler. Thromb. Vasc. Biol. 2011, 31, 1001–1006. [Google Scholar] [CrossRef] [Green Version]
- Bolla, A.M.; Loretelli, C.; Montefusco, L.; Finzi, G.; Abdi, R.; Ben Nasr, M.; Lunati, M.E.; Pastore, I.; Bonventre, J.V.; Nebuloni, M.; et al. Inflammation and vascular dysfunction: The negative synergistic combination of diabetes and COVID-19. Diabetes/Metab. Res. Rev. 2022, 38, e3565. [Google Scholar] [CrossRef]
- Meloni, M.; Bellia, A.; Giurato, L.; Lauro, D.; Uccioli, L. Below-the-ankle arterial disease: A new marker of coronary artery disease in patients with diabetes and foot ulcers. Acta Diabetol. 2022, 59, 1331–1338. [Google Scholar] [CrossRef]
- Mishra, S.C.; Chhatbar, K.C.; Kashikar, A.; Mehndiratta, A. Diabetic foot. BMJ 2017, 359. [Google Scholar] [CrossRef] [PubMed] [Green Version]
- Pinto, A.; Tuttolomondo, A.; Di Raimondo, D.; Fernandez, P.; La Placa, S.; Di Gati, M.; Licata, G. Cardiovascular risk profile and morbidity in subjects affected by type 2 diabetes mellitus with and without diabetic foot. Metabolism 2008, 57, 676–682. [Google Scholar] [CrossRef] [PubMed]
- Tuttolomondo, A.; Del Cuore, A.; La Malfa, A.; Casuccio, A.; Daidone, M.; Maida, C.D.; Di Raimondo, D.; Di Chiara, T.; Puleo, M.G.; Norrito, R.; et al. Assessment of heart rate variability (HRV) in subjects with type 2 diabetes mellitus with and without diabetic foot: Correlations with endothelial dysfunction indices and markers of adipo-inflammatory dysfunction. Cardiovasc. Diabetol. 2021, 20, 142. [Google Scholar] [CrossRef] [PubMed]
- Al-Rubeaan, K.; al Derwish, M.; Ouizi, S.; Youssef, A.M.; Subhani, S.N.; Ibrahim, H.M.; Alamri, B.N. Diabetic foot com-plications and their risk factors from a large retrospective cohort study. PLoS ONE 2015, 10, e0124446. [Google Scholar] [CrossRef] [PubMed]
- Feleke, Y.; Mengistu, Y.; Enquselassie, F. Diabetic infections: Clinical and bacteriological study at Tikur Anbessa Specialized University Hospital, Addis Ababa, Ethiopia. Ethiop. Med. J. 2007, 45, 171–179. [Google Scholar] [PubMed]
- Anaya-Isaza, A.; Zequera-Diaz, M. Fourier transform-based data augmentation in deep learning for diabetic foot ther-mograph classification. Biocybern. Biomed. Eng. 2022, 42, 437–452. [Google Scholar] [CrossRef]
- Goyal, M.; Reeves, N.D.; Davison, A.K.; Rajbhandari, S.; Spragg, J.; Yap, M.H. DFUNet: Convolutional Neural Networks for Diabetic Foot Ulcer Classification. IEEE Trans. Emerg. Top. Comput. Intell. 2018, 4, 728–739. [Google Scholar] [CrossRef] [Green Version]
- Saba, L.; Jain, P.K.; Suri, H.S.; Ikeda, N.; Araki, T.; Singh, B.K.; Nicolaides, A.; Shafique, S.; Gupta, A.; Laird, J.R.; et al. Plaque Tissue Morphology-Based Stroke Risk Stratification Using Carotid Ultrasound: A Polling-Based PCA Learning Paradigm. J. Med. Syst. 2017, 41, 98. [Google Scholar] [CrossRef] [PubMed]
- Jain, P.K.; Sharma, N.; Giannopoulos, A.A.; Saba, L.; Nicolaides, A.; Suri, J.S. Hybrid deep learning segmentation models for atherosclerotic plaque in internal carotid artery B-mode ultrasound. Comput. Biol. Med. 2021, 136, 104721. [Google Scholar] [CrossRef] [PubMed]
- Banchhor, S.K.; Londhe, N.D.; Araki, T.; Saba, L.; Radeva, P.; Laird, J.R.; Suri, J.S. Wall-based measurement features provides an improved IVUS coronary artery risk assessment when fused with plaque texture-based features during machine learning paradigm. Comput. Biol. Med. 2017, 91, 198–212. [Google Scholar] [CrossRef]
- Araki, T.; Ikeda, N.; Shukla, D.; Jain, P.K.; Londhe, N.D.; Shrivastava, V.K.; Banchhor, S.K.; Saba, L.; Nicolaides, A.; Shafique, S. PCA-based polling strategy in machine learning framework for coronary artery disease risk assessment in intra-vascular ultrasound: A link between carotid and coronary grayscale plaque morphology. Comput. Methods Programs Biomed. 2016, 128, 137–158. [Google Scholar] [CrossRef] [PubMed]
- Johri, A.M.; Chitty, D.W.; Matangi, M.; Malik, P.; Mousavi, P.; Day, A.; Gravett, M.; Simpson, C. Can Carotid Bulb Plaque Assessment Rule Out Significant Coronary Artery Disease? A Comparison of Plaque Quantification by Two- and Three-Dimensional Ultrasound. J. Am. Soc. Echocardiogr. 2013, 26, 86–95. [Google Scholar] [CrossRef] [PubMed]
- Saba, L.; Biswas, M.; Kuppili, V.; Godia, E.C.; Suri, H.S.; Edla, D.R.; Omerzu, T.; Laird, J.R.; Khanna, N.N.; Mavrogeni, S.; et al. The present and future of deep learning in radiology. Eur. J. Radiol. 2019, 114, 14–24. [Google Scholar] [CrossRef] [PubMed]
- Ayman, J.S.S.; El-Baz, S. Machine Learning in Medicine—Chapman & Hall/CRC Healthcare Informatics Series; CRC Press: Boca Raton, FL, USA, 2021. [Google Scholar]
- El-Baz, A.; Suri, J.S. Big Data in Multimodal Medical Imaging; CRC Press: Boca Raton, FL, USA, 2019. [Google Scholar]
- Maniruzzaman; Kumar, N.; Abedin, M.; Islam, S.; Suri, H.S.; El-Baz, A.S.; Suri, J.S. Comparative approaches for classification of diabetes mellitus data: Machine learning paradigm. Comput. Methods Programs Biomed. 2017, 152, 23–34. [Google Scholar] [CrossRef] [PubMed]
- Maniruzzaman; Rahman, J.; Hasan, A.M.; Suri, H.S.; Abedin, M.; El-Baz, A.; Suri, J.S. Accurate Diabetes Risk Stratification Using Machine Learning: Role of Missing Value and Outliers. J. Med. Syst. 2018, 42, 92. [Google Scholar] [CrossRef] [Green Version]
- Kuppili, V.; Biswas, M.; Sreekumar, A.; Suri, H.S.; Saba, L.; Edla, D.R.; Marinhoe, R.T.; Sanches, J.; Suri, J.S. Extreme Learning Machine Framework for Risk Stratification of Fatty Liver Disease Using Ultrasound Tissue Characterization. J. Med. Syst. 2017, 41, 152. [Google Scholar] [CrossRef]
- Acharya, U.R.; Faust, O.; Sree, S.V.; Molinari, F.; Suri, J.S. ThyroScreen system: High resolution ultrasound thyroid image characterization into benign and malignant classes using novel combination of texture and discrete wavelet transform. Comput. Methods Programs Biomed. 2011, 107, 233–241. [Google Scholar] [CrossRef]
- Shrivastava, V.K.; Londhe, N.D.; Sonawane, R.S.; Suri, J.S. A novel and robust Bayesian approach for segmentation of psoriasis lesions and its risk stratification. Comput. Methods Programs Biomed. 2017, 150, 9–22. [Google Scholar] [CrossRef]
- Goldstein, B.A.; Navar, A.M.; Carter, R.E. Moving beyond regression techniques in cardiovascular risk prediction: Ap-plying machine learning to address analytic challenges. Eur. Heart J. 2016, 38, 1805–1814. [Google Scholar] [CrossRef] [Green Version]
- Khanna, N.N.; Maindarkar, M.; Puvvula, A.; Paul, S.; Bhagawati, M.; Ahluwalia, P.; Ruzsa, Z.; Sharma, A.; Munjral, S.; Kolluri, R. Vascular Implications of COVID-19: Role of Radiological Imaging, Artificial Intelligence, and Tissue Characterization: A Special Report. J. Cardiovasc. Dev. Dis. 2022, 9, 268. [Google Scholar] [CrossRef]
- Ming, C.; Viassolo, V.; Probst-Hensch, N.; Chappuis, P.O.; Dinov, I.D.; Katapodi, M.C. Machine learning techniques for personalized breast cancer risk prediction: Comparison with the BCRAT and BOADICEA models. Breast Cancer Res. 2019, 21, 75. [Google Scholar] [CrossRef] [PubMed] [Green Version]
- Biswas, M.; Kuppili, V.; Saba, L.; Edla, D.R.; Suri, H.S.; Cuadrado-Godia, E.; Laird, J.; Marinhoe, R.; Sanches, J.; Nicolaides, A. State-of-the-art review on deep learning in medical imaging. Front. Biosci. 2019, 24, 392–426. [Google Scholar]
- Khanna, N.N.; Maindarkar, M.; Saxena, A.; Ahluwalia, P.; Paul, S.; Srivastava, S.K.; Cuadrado-Godia, E.; Sharma, A.; Omerzu, T.; Saba, L.; et al. Cardiovascular/Stroke Risk Assessment in Patients with Erectile Dysfunction—A Role of Carotid Wall Arterial Imaging and Plaque Tissue Characterization Using Artificial Intelligence Paradigm: A Narrative Review. Diagnostics 2022, 12, 1249. [Google Scholar] [CrossRef] [PubMed]
- Chalakkal, R.; Hafiz, F.; Abdulla, W.; Swain, A. An efficient framework for automated screening of Clinically Significant Macular Edema. Comput. Biol. Med. 2020, 130, 104128. [Google Scholar] [CrossRef]
- Karbhari, Y.; Basu, A.; Geem, Z.W.; Han, G.-T.; Sarkar, R. Generation of Synthetic Chest X-ray Images and Detection of COVID-19: A Deep Learning Based Approach. Diagnostics 2021, 11, 895. [Google Scholar] [CrossRef]
- Alzubaidi, L.; Fadhel, M.A.; Oleiwi, S.R.; Al-Shamma, O.; Zhang, J. DFU_QUTNet: Diabetic foot ulcer classification using novel deep convolutional neural network. Multimed. Tools Appl. 2019, 79, 15655–15677. [Google Scholar] [CrossRef]
- Khanna, N.N.; Jamthikar, A.D.; Gupta, D.; Nicolaides, A.; Araki, T.; Saba, L.; Cuadrado-Godia, E.; Sharma, A.; Omerzu, T.; Suri, H.S.; et al. Performance evaluation of 10-year ultrasound image-based stroke/cardiovascular (CV) risk calculator by comparing against ten conventional CV risk calculators: A diabetic study. Comput. Biol. Med. 2019, 105, 125–143. [Google Scholar] [CrossRef]
- Molinari, F.; Liboni, W.; Giustetto, P.; Badalamenti, S.; Suri, J.S. Automatic Computer-Based Tracings (Act) in Longitudinal 2-D Ultrasound Images using Different Scanners. J. Mech. Med. Biol. 2009, 9, 481–505. [Google Scholar] [CrossRef]
- Suri, J.S.; Paul, S.; Maindarkar, M.A.; Puvvula, A.; Saxena, S.; Saba, L.; Turk, M.; Laird, J.R.; Khanna, N.N.; Viskovic, K.; et al. Cardiovascular/Stroke Risk Stratification in Parkinson’s Disease Patients Using Atherosclerosis Pathway and Artificial Intelligence Paradigm: A Systematic Review. Metabolites 2022, 12, 312. [Google Scholar] [CrossRef]
- Bruder, O.; Wagner, A.; Jensen, C.J.; Schneider, S.; Ong, P.; Kispert, E.-M.; Nassenstein, K.; Schlosser, T.; Sabin, G.V.; Sechtem, U.; et al. Myocardial Scar Visualized by Cardiovascular Magnetic Resonance Imaging Predicts Major Adverse Events in Patients With Hypertrophic Cardiomyopathy. J. Am. Coll. Cardiol. 2010, 56, 875–887. [Google Scholar] [CrossRef] [Green Version]
- Erbel, R.; Möhlenkamp, S.; Moebus, S.; Schmermund, A.; Lehmann, N.; Stang, A.; Dragano, N.; Grönemeyer, D.; Seibel, R.; Kälsch, H.; et al. Coronary Risk Stratification, Discrimination, and Reclassification Improvement Based on Quantification of Subclinical Coronary Atherosclerosis: The Heinz Nixdorf Recall Study. J. Am. Coll. Cardiol. 2010, 56, 1397–1406. [Google Scholar] [CrossRef] [PubMed] [Green Version]
- Qiu, L.; Li, Y.; Yang, C.; Mao, X.; Mai, L.; Zhu, L.; Xie, W. Influence of Foot Ulceration on All-Cause and Cardiovascular Mortality in Diabetic Patients: A Case-Control Study. J. Wound Ostomy Cont. Nurs. 2022, 49, 175–179. [Google Scholar] [CrossRef]
- Huang, J.; Li, W.; Wei, S.; Zhou, X.; Nong, Y.; Sun, J.; Zhai, Z.; Lu, W. Associations of Estimated Glomerular Filtration Rate with All-Cause Mortality and Cardiovascular Mortality in Patients with Diabetic Foot Osteomyelitis. Int. J. Gen. Med. 2021, 14, 4499–4509. [Google Scholar] [CrossRef]
- Yahagi, K.; Kolodgie, F.D.; Lutter, C.; Mori, H.; Romero, M.E.; Finn, A.V.; Virmani, R. Pathology of Human Coronary and Carotid Artery Atherosclerosis and Vascular Calcification in Diabetes Mellitus. Arter. Thromb. Vasc. Biol. 2017, 37, 191–204. [Google Scholar] [CrossRef] [PubMed] [Green Version]
- García-Malpartida, K.; Mármol, R.; Jover, A.; Gómez-Martínez, M.J.; Solá-Izquierdo, E.; Victor, V.M.; Rocha, M.; Sanmiguel, D.; Hernández-Mijares, A. Relationship between erectile dysfunction and silent myocardial ischemia in type 2 diabetic pa-tients with no known macrovascular complications. J. Sex. Med. 2011, 8, 2606–2616. [Google Scholar] [CrossRef] [PubMed]
- Pinto, A.; Tuttolomondo, A.; Di Raimondo, D.; La Placa, S.; Di Sciacca, R.; Fernandez, P.; Di Gati, M.; Raffa, A.; Licata, G. Ischemic stroke in patients with diabetic foot. Int. Angiol. 2007, 26, 266. [Google Scholar]
- Roper, N.A.; Bilous, R.W.; Kelly, W.F.; Unwin, N.C.; Connolly, V.M. Excess mortality in a population with diabetes and the impact of material deprivation: Longitudinal, population based study. BMJ 2001, 322, 1389–1393. [Google Scholar] [CrossRef] [Green Version]
- Kannel, W.B. Elevated systolic blood pressure as a cardiovascular risk factor. Am. J. Cardiol. 2000, 85, 251–255. [Google Scholar] [CrossRef]
- Rana, J.; Nieuwdorp, M.; Jukema, J.; Kastelein, J. Cardiovascular metabolic syndrome–an interplay of, obesity, inflamma-tion, diabetes and coronary heart disease. Diabetes Obes. Metab. 2007, 9, 218–232. [Google Scholar] [CrossRef]
- Jeffcoate, W.J.; Game, F.; Cavanagh, P.R. The role of proinflammatory cytokines in the cause of neuropathic osteoar-thropathy (acute Charcot foot) in diabetes. Lancet 2005, 366, 2058–2061. [Google Scholar] [CrossRef]
- Weigelt, C.; Rose, B.; Poschen, U.; Ziegler, D.; Friese, G.; Kempf, K.; Koenig, W.; Martin, S.; Herder, C. Immune Mediators in Patients With Acute Diabetic Foot Syndrome. Diabetes Care 2009, 32, 1491–1496. [Google Scholar] [CrossRef] [PubMed] [Green Version]
- Yang, D.; Elner, S.G.; Bian, Z.-M.; Till, G.O.; Petty, H.R.; Elner, V.M. Pro-inflammatory cytokines increase reactive oxygen species through mitochondria and NADPH oxidase in cultured RPE cells. Exp. Eye Res. 2007, 85, 462–472. [Google Scholar] [CrossRef] [PubMed] [Green Version]
- Ghaffari, S.; Jang, E.; Nabi, F.N.; Sanwal, R.; Khosraviani, N.; Wang, C.; Steinberg, B.E.; Goldenberg, N.M.; Ikeda, J.; Lee, W.L. Endothelial HMGB1 Is a Critical Regulator of LDL Transcytosis via an SREBP2–SR-BI Axis. Arter. Thromb. Vasc. Biol. 2020, 41, 200–216. [Google Scholar] [CrossRef]
- Moore, K.J.; Sheedy, F.J.; Fisher, E.A. Macrophages in atherosclerosis: A dynamic balance. Nat. Rev. Immunol. 2013, 13, 709–721. [Google Scholar] [CrossRef] [PubMed] [Green Version]
- Yu, X.-H.; Fu, Y.-C.; Zhang, D.-W.; Yin, K.; Tang, C.-K. Foam cells in atherosclerosis. Clin. Chim. Acta 2013, 424, 245–252. [Google Scholar] [CrossRef] [PubMed] [Green Version]
- Palinski, W.; E Rosenfeld, M.; Ylä-Herttuala, S.; Gurtner, G.C.; Socher, S.S.; Butler, S.W.; Parthasarathy, S.; E Carew, T.; Steinberg, D.; Witztum, J.L. Low density lipoprotein undergoes oxidative modification in vivo. Proc. Natl. Acad. Sci. USA 1989, 86, 1372–1376. [Google Scholar] [CrossRef] [Green Version]
- Small, D.M. George Lyman Duff memorial lecture. Progression and regression of atherosclerotic lesions. Insights from lipid physical biochemistry. Arter. Off. J. Am. Heart Assoc. Inc. 1988, 8, 103–129. [Google Scholar] [CrossRef] [Green Version]
- Atherogenesis, A.O. Apoptosis and plaque destabilization in atherosclerosis: The role of macrophage apoptosis induced by cholesterol. Cell Death Differ. 2004, 11, S12–S16. [Google Scholar]
- Maiolino, G.; Rossitto, G.; Caielli, P.; Bisogni, V.; Rossi, G.P.; Calò, L.A. The Role of Oxidized Low-Density Lipoproteins in Atherosclerosis: The Myths and the Facts. Mediat. Inflamm. 2013, 2013, 714653. [Google Scholar] [CrossRef] [Green Version]
- Reddy, M.A.; Zhang, E.; Natarajan, R. Epigenetic mechanisms in diabetic complications and metabolic memory. Diabetologia 2014, 58, 443–455. [Google Scholar] [CrossRef] [Green Version]
- Yamagishi, S.-I.; Matsui, T. Role of hyperglycemia-induced advanced glycation end product (AGE) accumulation in atherosclerosis. Ann. Vasc. Dis. 2018, 67, ra-18. [Google Scholar] [CrossRef] [PubMed] [Green Version]
- Suzuki, K.; Nakagawa, K.; Miyazawa, T. Augmentation of blood lipid glycation and lipid oxidation in diabetic patients. Clin. Chem. Lab. Med. (CCLM) 2014, 52, 47–52. [Google Scholar] [CrossRef] [PubMed]
- Nor, N.A.M.; Budin, S.B.; Zainalabidin, S.; Jalil, J.; Sapian, S.; Jubaidi, F.F.; Anuar, N.N.M. The Role of Pol-yphenol in Modulating Associated Genes in Diabetes-Induced Vascular Disorders. Int. J. Mol. Sci. 2022, 23, 6396. [Google Scholar]
- Barbu, E.; Popescu, M.-R.; Popescu, A.-C.; Balanescu, S.-M. Inflammation as A precursor of atherothrombosis, diabetes and early vascular aging. Int. J. Mol. Sci. 2022, 23, 963. [Google Scholar] [CrossRef]
- Börgeson, E.; Godson, C. Resolution of inflammation: Therapeutic potential of pro-resolving lipids in type 2 diabetes mellitus and associated renal complications. Front. Immunol. 2012, 3, 318. [Google Scholar] [CrossRef] [Green Version]
- Ngcobo, S.R.; Nkambule, B.B.; Nyambuya, T.M.; Mokgalaboni, K.; Ntsethe, A.; Mxinwa, V.; Ziqubu, K.; Ntamo, Y.; Nyawo, T.A.; Dludla, P.V. Activated monocytes as a therapeutic target to attenuate vascular inflammation and lower cardiovascular disease-risk in patients with type 2 diabetes: A systematic review of preclinical and clinical studies. Biomed. Pharmacother. 2021, 146, 112579. [Google Scholar] [CrossRef]
- White, P.J.; Arita, M.; Taguchi, R.; Kang, J.X.; Marette, A. Transgenic Restoration of Long-Chain n-3 Fatty Acids in Insulin Target Tissues Improves Resolution Capacity and Alleviates Obesity-Linked Inflammation and Insulin Resistance in High-Fat–Fed Mice. Diabetes 2010, 59, 3066–3073. [Google Scholar] [CrossRef] [Green Version]
- Matheus, A.S.D.M.; Tannus, L.R.M.; Cobas, R.A.; Palma, C.C.S.; Negrato, C.A.; Gomes, M.D.B. Impact of Diabetes on Cardiovascular Disease: An Update. Int. J. Hypertens. 2013, 2013, 653789. [Google Scholar] [CrossRef] [Green Version]
- Petrie, J.; Guzik, T.J.; Touyz, R.M. Diabetes, Hypertension, and Cardiovascular Disease: Clinical Insights and Vascular Mechanisms. Can. J. Cardiol. 2017, 34, 575–584. [Google Scholar] [CrossRef] [Green Version]
- Serhiyenko, V.A.; Serhiyenko, A.A. Cardiac autonomic neuropathy: Risk factors, diagnosis and treatment. World J. Diabetes 2018, 9, 1. [Google Scholar] [CrossRef]
- Karhu, T.; Myllymaa, S.; Nikkonen, S.; Mazzotti, D.R.; Kulkas, A.; Töyräs, J.; Leppänen, T. Diabetes and cardiovascular diseases are associated with the worsening of intermittent hypoxaemia. J. Sleep Res. 2021, 31, e13441. [Google Scholar] [CrossRef] [PubMed]
- Schuett, K.; Forst, T.; Birkenfeld, A.L.; Zirlik, A.; Müller-Wieland, D.; Marx, N. Diabetes mellitus and the heart. Exp. Clin. Endocrinol. Diabetes 2022, 130, S123–S126. [Google Scholar] [CrossRef] [PubMed]
- Winston, P.H. Artificial Intelligence; Addison-Wesley Longman Publishing Co., Inc.: Boston, MA, USA, 1992. [Google Scholar]
- Ramesh, A.; Kambhampati, C.; Monson, J.R.; Drew, P. Artificial intelligence in medicine. Ann. R. Coll. Surg. Engl. 2004, 86, 334. [Google Scholar] [CrossRef] [PubMed] [Green Version]
- Nillmani; Jain, P.K.; Sharma, N.; Kalra, M.K.; Viskovic, K.; Saba, L.; Suri, J.S. Four Types of Multiclass Frameworks for Pneumonia Classification and Its Validation in X-ray Scans Using Seven Types of Deep Learning Artificial Intelligence Models. Diagnostics 2022, 12, 652. [Google Scholar] [CrossRef] [PubMed]
- Saba, L.; Agarwal, M.; Patrick, A.; Puvvula, A.; Gupta, S.K.; Carriero, A.; Laird, J.R.; Kitas, G.D.; Johri, A.M.; Balestrieri, A.; et al. Six artificial intelligence paradigms for tissue characterisation and classification of non-COVID-19 pneumonia against COVID-19 pneumonia in computed tomography lungs. Int. J. Comput. Assist. Radiol. Surg. 2021, 16, 423–434. [Google Scholar] [CrossRef]
- Biswas, M.; Kuppili, V.; Saba, L.; Edla, D.R.; Suri, H.S.; Sharma, A.; Cuadrado-Godia, E.; Laird, J.R.; Nicolaides, A.; Suri, J.S. Deep learning fully convolution network for lumen characterization in diabetic patients using carotid ultrasound: A tool for stroke risk. Med. Biol. Eng. Comput. 2018, 57, 543–564. [Google Scholar] [CrossRef]
- Hesamian, M.H.; Jia, W.; He, X.; Kennedy, P. Deep Learning Techniques for Medical Image Segmentation: Achievements and Challenges. J. Digit. Imaging 2019, 32, 582–596. [Google Scholar] [CrossRef] [Green Version]
- Fourcade, A.; Khonsari, R. Deep learning in medical image analysis: A third eye for doctors. J. Stomatol. Oral Maxillofac. Surg. 2019, 120, 279–288. [Google Scholar] [CrossRef]
- Konstantonis, G.; Singh, K.V.; Sfikakis, P.P.; Jamthikar, A.D.; Kitas, G.D.; Gupta, S.K.; Saba, L.; Verrou, K.; Khanna, N.N.; Ruzsa, Z. Cardiovascular disease detection using machine learning and carotid/femoral arterial imaging frameworks in rheumatoid arthritis patients. Rheumatol. Int. 2022, 42, 215–239. [Google Scholar] [CrossRef]
- Johri, A.M.; Singh, K.V.; Mantella, L.E.; Saba, L.; Sharma, A.; Laird, J.R.; Utkarsh, K.; Singh, I.M.; Gupta, S.; Kalra, M.S. Deep learning artificial intelligence framework for multiclass coronary artery disease prediction using combination of conventional risk factors, carotid ultrasound, and intraplaque neovascularization. Comput. Biol. Med. 2022, 150, 106018. [Google Scholar] [CrossRef]
- Jamthikar, A.D.; Gupta, D.; Mantella, L.E.; Saba, L.; Laird, J.R.; Johri, A.M.; Suri, J.S. Multiclass machine learning vs. conventional calculators for stroke/CVD risk assessment using carotid plaque predictors with coronary angiography scores as gold standard: A 500 participants study. Int. J. Cardiovasc. Imaging 2020, 37, 1171–1187. [Google Scholar] [CrossRef] [PubMed]
- Jamthikar, A.; Gupta, D.; Khanna, N.N.; Saba, L.; Laird, J.R.; Suri, J.S. Cardiovascular/stroke risk prevention: A new machine learning framework integrating carotid ultrasound image-based phenotypes and its harmonics with conventional risk factors. Indian Heart J. 2020, 72, 258–264. [Google Scholar] [CrossRef] [PubMed]
- Jamthikar, A.D.; Gupta, D.; Johri, A.M.; Mantella, L.E.; Saba, L.; Kolluri, R.; Sharma, A.M.; Viswanathan, V.; Nicolaides, A.; Suri, J.S. Low-Cost Office-Based Cardiovascular Risk Stratification Using Machine Learning and Focused Carotid Ultrasound in an Asian-Indian Cohort. J. Med. Syst. 2020, 44, 208. [Google Scholar] [CrossRef] [PubMed]
- Khandakar, A.; Chowdhury, M.E.; Reaz, M.B.I.; Ali, S.H.; Hasan, A.; Kiranyaz, S.; Rahman, T.; Alfkey, R.; Bakar, A.A.A.; Malik, R.A. A machine learning model for early detection of diabetic foot using thermogram images. Comput. Biol. Med. 2021, 137, 104838. [Google Scholar] [CrossRef] [PubMed]
- Dinh, A.; Miertschin, S.; Young, A.; Mohanty, S.D. A data-driven approach to predicting diabetes and cardiovascular disease with machine learning. BMC Med. Inform. Decis. Mak. 2019, 19, 211. [Google Scholar] [CrossRef] [PubMed] [Green Version]
- Kim, H.; Lim, D.; Kim, Y. Classification and Prediction on the Effects of Nutritional Intake on Overweight/Obesity, Dyslipidemia, Hypertension and Type 2 Diabetes Mellitus Using Deep Learning Model: 4–7th Korea National Health and Nutrition Examination Survey. Int. J. Environ. Res. Public Health 2021, 18, 5597. [Google Scholar] [CrossRef]
- Longato, E.; Fadini, G.P.; Sparacino, G.; Avogaro, A.; Tramontan, L.; Di Camillo, B. A Deep Learning Approach to Predict Diabetes’ Cardiovascular Complications From Administrative Claims. IEEE J. Biomed. Health Inform. 2021, 25, 3608–3617. [Google Scholar] [CrossRef]
- Goyal, M.; Yap, M.H.; Reeves, N.D.; Rajbhandari, S.; Spragg, J. Fully convolutional networks for diabetic foot ulcer seg-mentation. In Proceedings of the 2017 IEEE International conference on Systems, Man, and Cybernetics (SMC), Banff, AB, Canada, 5–8 October 2017; IEEE: Piscataway, NJ, USA; pp. 618–623. [Google Scholar]
- Viswanathan, V.; Puvvula, A.; Jamthikar, A.D.; Saba, L.; Johri, A.M.; Kotsis, V.; Khanna, N.N.; Dhanjil, S.K.; Majhail, M.; Misra, D.P.; et al. Bidirectional link between diabetes mellitus and coronavirus disease 2019 leading to cardiovascular disease: A narrative review. World J. Diabetes 2021, 12, 215–237. [Google Scholar] [CrossRef]
- Moore, S.T.; MacDougall, H.G.; Ondo, W.G. Ambulatory monitoring of freezing of gait in Parkinson’s disease. J. Neurosci. Methods 2008, 167, 340–348. [Google Scholar] [CrossRef]
- Mandal, I.; Sairam, N. New machine-learning algorithms for prediction of Parkinson’s disease. Int. J. Syst. Sci. 2012, 45, 647–666. [Google Scholar] [CrossRef]
- Sriram, T.V.; Rao, M.V.; Narayana, G.S.; Kaladhar, D.; Vital, T.P.R. Intelligent Parkinson disease prediction using machine learning algorithms. Int. J. Eng. Innov. Technol. (IJEIT) 2013, 3, 1568–1572. [Google Scholar]
- Pereira, C.R.; Pereira, D.R.; da Silva, F.A.; Hook, C.; Weber, S.A.; Pereira, L.A.; Papa, J.P. A Step Towards the Automated Diagnosis of Parkinson’s Disease: Analyzing Handwriting Movements. In Proceedings of the 2015 IEEE 28th International Symposium on Computer-Based Medical Systems, Ribeirão Preto, Brazil, 22–25 June 2015; IEEE: Piscataway, NJ, USA; pp. 171–176. [Google Scholar]
- Adams, W.R. High-accuracy detection of early Parkinson’s Disease using multiple characteristics of finger movement while typing. PLoS ONE 2017, 12, e0188226. [Google Scholar] [CrossRef] [PubMed] [Green Version]
- Jamthikar, A.D.; Gupta, D.; Puvvula, A.; Johri, A.M.; Khanna, N.N.; Saba, L.; Mavrogeni, S.; Laird, J.R.; Pareek, G.; Miner, M.; et al. Cardiovascular risk assessment in patients with rheumatoid arthritis using carotid ultrasound B-mode imaging. Rheumatol. Int. 2020, 40, 1921–1939. [Google Scholar] [CrossRef] [PubMed]
- Nillmani; Sharma, N.; Saba, L.; Khanna, N.N.; Kalra, M.K.; Fouda, M.M.; Suri, J.S. Segmentation-Based Classification Deep Learning Model Embedded with Explainable AI for COVID-19 Detection in Chest X-ray Scans. Diagnostics 2022, 12, 2132. [Google Scholar] [CrossRef] [PubMed]
- Viswanathan, V.; Jamthikar, A.; Gupta, D.; Shanu, N.; Puvvula, A.; Khanna, N.N.; Saba, L.; Omerzum, T.; Viskovic, K.; Mavrogeni, S. Low-cost preventive screening using carotid ultrasound in patients with diabetes. Front. Biosci. Landark 2020, 25, 1132–1171. [Google Scholar]
- Jamthikar, A.; Gupta, D.; Saba, L.; Khanna, N.N.; Viskovic, K.; Mavrogeni, S.; Laird, J.R.; Sattar, N.; Johri, A.M.; Pareek, G. Artificial intelligence framework for predictive cardiovascular and stroke risk assessment models: A narrative review of in-tegrated approaches using carotid ultrasound. Comput. Biol. Med. 2020, 12, 404–418. [Google Scholar] [CrossRef]
- Derevitskii, I.V.; Kovalchuk, S.V. Machine Learning-Based Predictive Modeling of Complications of Chronic Diabetes. Procedia Comput. Sci. 2020, 178, 274–283. [Google Scholar] [CrossRef]
- Aggarwal, Y.; Das, J.; Mazumder, P.M.; Kumar, R.; Sinha, R.K. Heart rate variability features from nonlinear cardiac dynamics in identification of diabetes using artificial neural network and support vector machine. Biocybern. Biomed. Eng. 2020, 40, 1002–1009. [Google Scholar] [CrossRef]
- Suri, J.S.; Maindarkar, M.A.; Paul, S.; Ahluwalia, P.; Bhagawati, M.; Saba, L.; Faa, G.; Saxena, S.; Singh, I.M.; Chadha, P.S.; et al. Deep Learning Paradigm for Cardiovascular Disease/Stroke Risk Stratification in Parkinson’s Disease Affected by COVID-19: A Narrative Review. Diagnostics 2022, 12, 1543. [Google Scholar] [CrossRef]
- Biswas, M.; Saba, L.; Omerzu, T.; Johri, A.M.; Khanna, N.N.; Viskovic, K.; Mavrogeni, S.; Laird, J.R.; Pareek, G.; Miner, M.; et al. A Review on Joint Carotid Intima-Media Thickness and Plaque Area Measurement in Ultrasound for Cardiovascular/Stroke Risk Monitoring: Artificial Intelligence Framework. J. Digit. Imaging 2021, 34, 581–604. [Google Scholar] [CrossRef]
- Jain, P.K.; Sharma, N.; Saba, L.; Paraskevas, K.I.; Kalra, M.K.; Johri, A.; Nicolaides, A.N.; Suri, J.S. Automated deep learning-based paradigm for high-risk plaque detection in B-mode common carotid ultrasound scans: An asymptomatic Jap-anese cohort study. Int. Angiol. A J. Int. Union Angiol. 2021, 41, 9–23. [Google Scholar] [CrossRef] [PubMed]
- Sanagala, S.S.; Nicolaides, A.; Gupta, S.K.; Koppula, V.K.; Saba, L.; Agarwal, S.; Johri, A.M.; Kalra, M.S.; Suri, J.S. Ten Fast Transfer Learning Models for Carotid Ultrasound Plaque Tissue Characterization in Augmentation Framework Embedded with Heatmaps for Stroke Risk Stratification. Diagnostics 2021, 11, 2109. [Google Scholar] [CrossRef] [PubMed]
- Jain, P.K.; Sharma, N.; Saba, L.; Paraskevas, K.I.; Kalra, M.K.; Johri, A.; Laird, J.R.; Nicolaides, A.N.; Suri, J.S. Unseen artificial intelligence—Deep learning paradigm for segmentation of low atherosclerotic plaque in carotid ultrasound: A multi-center cardiovascular study. Diagnostics 2021, 11, 2257. [Google Scholar] [CrossRef] [PubMed]
- Shrivastava, V.; Londhe, N.D.; Sonawane, R.; Suri, J.S. Reliable and accurate psoriasis disease classification in dermatology images using comprehensive feature space in machine learning paradigm. Expert Syst. Appl. 2015, 42, 6184–6195. [Google Scholar] [CrossRef]
- Teji, J.S.; Jain, S.; Gupta, S.K.; Suri, J.S. NeoAI 1.0: Machine learning-based paradigm for prediction of neonatal and infant risk of death. Comput. Biol. Med. 2022, 147, 105639. [Google Scholar] [CrossRef] [PubMed]
- Jamthikar, A.; Gupta, D.; Johri, A.M.; Mantella, L.E.; Saba, L.; Suri, J.S. A machine learning framework for risk prediction of multi-label cardiovascular events based on focused carotid plaque B-Mode ultrasound: A Canadian study. Comput. Biol. Med. 2021, 140, 105102. [Google Scholar] [CrossRef]
- Acharya, U.R.; Faust, O.; Alvin, A.G.; Krishnamurthi, G.; Seabra, J.; Sanches, J.; Suri, J.S. Understanding symptomatology of atherosclerotic plaque by image-based tissue characterization. Comput. Methods Programs Biomed. 2013, 110, 66–75. [Google Scholar] [CrossRef]
- Suri, J.S.; Puvvula, A.; Majhail, M.; Biswas, M.; Jamthikar, A.D.; Saba, L.; Faa, G.; Singh, I.M.; Oberleitner, R.; Turk, M. In-tegration of cardiovascular risk assessment with COVID-19 using artificial intelligence. Rev. Cardiovasc. Med. 2020, 21, 541–560. [Google Scholar]
- Parthiban, G.; Srivatsa, S.K. Applying Machine Learning Methods in Diagnosing Heart Disease for Diabetic Patients. Int. J. Appl. Inf. Syst. 2012, 3, 25–30. [Google Scholar] [CrossRef]
- Jelinek, H.F.; Cornforth, D.J.; Kelarev, A.V. Machine Learning Methods for Automated Detection of Severe Diabetic Neuropathy. J. Diabet. Complicat. Med. 2016, 1, 1–7. [Google Scholar] [CrossRef] [Green Version]
- Zarkogianni, K.; Athanasiou, M.; Thanopoulou, A.C.; Nikita, K.S. Comparison of Machine Learning Approaches Toward Assessing the Risk of Developing Cardiovascular Disease as a Long-Term Diabetes Complication. IEEE J. Biomed. Health Inform. 2017, 22, 1637–1647. [Google Scholar] [CrossRef] [PubMed]
- Basu, S.; Raghavan, S.; Wexler, D.J.; Berkowitz, S.A. Characteristics Associated With Decreased or Increased Mortality Risk From Glycemic Therapy Among Patients With Type 2 Diabetes and High Cardiovascular Risk: Machine Learning Analysis of the ACCORD Trial. Diabetes Care 2017, 41, 604–612. [Google Scholar] [CrossRef] [PubMed] [Green Version]
- Segar, M.W.; Vaduganathan, M.; Patel, K.V.; McGuire, D.K.; Butler, J.; Fonarow, G.C.; Basit, M.; Kannan, V.; Grodin, J.L.; Everett, B.; et al. Machine Learning to Predict the Risk of Incident Heart Failure Hospitalization Among Patients With Diabetes: The WATCH-DM Risk Score. Diabetes Care 2019, 42, 2298–2306. [Google Scholar] [CrossRef]
- Hossain, M.E.; Uddin, S.; Khan, A. Network analytics and machine learning for predictive risk modelling of cardiovas-cular disease in patients with type 2 diabetes. Expert Syst. Appl. 2021, 164, 113918. [Google Scholar] [CrossRef]
- Tseng, P.-Y.; Chen, Y.-T.; Wang, C.-H.; Chiu, K.-M.; Peng, Y.-S.; Hsu, S.-P.; Chen, K.-L.; Yang, C.-Y.; Lee, O.K.-S. Prediction of the development of acute kidney injury following cardiac surgery by machine learning. Crit. Care 2020, 24, 478. [Google Scholar] [CrossRef] [PubMed]
- Ho, T.K. Random decision forests. In Proceedings of the 3rd International Conference on Document Analysis and Recognition, Montreal, QC, Canada, 14–16 August 1995; IEEE: Piscataway, NJ, USA, 1995; Volume 1, pp. 278–282. [Google Scholar]
- Dimitriadis, S.I.; Liparas, D.; Dni, A. How random is the random forest? Random forest algorithm on the service of structural imaging biomarkers for Alzheimer’s disease: From Alzheimer’s disease neuroimaging initiative (ADNI) database. Neural Regen. Res. 2018, 13, 962–970. [Google Scholar] [CrossRef]
- Robinson, R.L.M.; Palczewska, A.; Palczewski, J.; Kidley, N. Comparison of the predictive performance and in-terpretability of random forest and linear models on benchmark data sets. J. Chem. Inf. Model. 2017, 57, 1773–1792. [Google Scholar] [CrossRef]
- Jamthikar, A.; Gupta, D.; Khanna, N.N.; Saba, L.; Araki, T.; Viskovic, K.; Suri, H.S.; Gupta, A.; Mavrogeni, S.; Turk, M.; et al. A low-cost machine learning-based cardiovascular/stroke risk assessment system: Integration of conventional factors with image phenotypes. Cardiovasc. Diagn. Ther. 2019, 9, 420–430. [Google Scholar] [CrossRef] [Green Version]
- Rumelhart, D.E.; Hinton, G.E.; Williams, R.J. Learning Internal Representations by Error Propagation; California Univ San Diego La Jolla Inst for Cognitive Science: La Jolla, CA, USA, 1985. [Google Scholar]
- Durstewitz, D. A state space approach for piecewise-linear recurrent neural networks for identifying computational dynamics from neural measurements. PLOS Comput. Biol. 2017, 13, e1005542. [Google Scholar] [CrossRef]
- Razaghi, H.S.; Paninski, L. Filtering normalizing flows. In Proceedings of the Bayesian Deep Learning Workshop at NeurIPS, Vancouver, BC, Canada, 13 December 2019. [Google Scholar]
- Bengio, Y.; Simard, P.; Frasconi, P. Learning long-term dependencies with gradient descent is difficult. IEEE Trans. Neural Netw. 1994, 5, 157–166. [Google Scholar] [CrossRef]
- Amin, J.; Sharif, M.; Raza, M.; Saba, T.; Sial, R.; Shad, S.A. Brain tumor detection: A long short-term memory (LSTM)-based learning model. Neural Comput. Appl. 2019, 32, 15965–15973. [Google Scholar] [CrossRef]
- An, Y.; Tang, K.; Wang, J. Time-Aware Multi-Type Data Fusion Representation Learning Framework for Risk Prediction of Cardiovascular Diseases. IEEE/ACM Trans. Comput. Biol. Bioinform. 2021. [Google Scholar] [CrossRef] [PubMed]
- Tan, L.; Yu, K.; Bashir, A.K.; Cheng, X.; Ming, F.; Zhao, L.; Zhou, X. Toward real-time and efficient cardiovascular monitoring for COVID-19 patients by 5G-enabled wearable medical devices: A deep learning approach. Neural Comput. Appl. 2021, 4, 1–14. [Google Scholar] [CrossRef] [PubMed]
- Priyanga, P.; Pattankar, V.V.; Sridevi, S. A hybrid recurrent neural network - logistic chaos-based whale optimization framework for heart disease prediction with electronic health records. Comput. Intell. 2020, 37, 315–343. [Google Scholar] [CrossRef]
- Jamthikar, A.; Gupta, D.; Saba, L.; Khanna, N.N.; Araki, T.; Viskovic, K.; Mavrogeni, S.; Laird, J.R.; Pareek, G.; Miner, M.; et al. Cardiovascular/stroke risk predictive calculators: A comparison between statistical and machine learning models. Cardiovasc. Diagn. Ther. 2020, 10, 919–938. [Google Scholar] [CrossRef]
- Brindisino, F.; Pennella, D.; Giovannico, G.; Rossettini, G.; Heick, J.D.; Maselli, F. Low back pain and calf pain in a recreational runner masking peripheral artery disease: A case report. Physiother. Theory Pract. 2021, 37, 1146–1157. [Google Scholar] [CrossRef]
- Ikeda, N.; Gupta, A.; Dey, N.; Bose, S.; Shafique, S.; Arak, T.; Godia, E.C.; Saba, L.; Laird, J.R.; Nicolaides, A.; et al. Improved Correlation between Carotid and Coronary Atherosclerosis SYNTAX Score Using Automated Ultrasound Carotid Bulb Plaque IMT Measurement. Ultrasound Med. Biol. 2015, 41, 1247–1262. [Google Scholar] [CrossRef]
- Sanches, J.M.; Laine, A.F.; Suri, J.S. Ultrasound Imaging; Springer: Berlin/Heidelberg, Germany, 2012. [Google Scholar]
- Khaksar, G.M.; Nunes, A.; Ferreira, H.; Serranho, P.; Bernardes, R. Texture analysis and its applications in biomedical imaging: A survey. IEEE Rev. Biomed. Eng. 2021, 15, 222–246. [Google Scholar]
- Sree, A.O.; Vinitha, S.; Molinari Filippo, L.; Nicolaide Andrew Suri Jasjit, S. An accurate and generalized approach to plaque characterization in 346 carotid ultrasound scans. IEEE Trans. Instrum. Meas. 2011, 61, 1045–1053. [Google Scholar]
- Sudeep, P.; Palanisamy, P.; Rajan, J.; Baradaran, H.; Saba, L.; Gupta, A.; Suri, J.S. Speckle reduction in medical ultrasound images using an unbiased non-local means method. Biomed. Signal Process. Control 2016, 28, 1–8. [Google Scholar] [CrossRef]
- Pewowaruk, R.J.; Tedla, Y.; Korcarz, C.E.; Tattersall, M.C.; Stein, J.H.; Chesler, N.C.; Gepner, A.D. Carotid Artery Stiffening With Aging: Structural Versus Load-Dependent Mechanisms in MESA (the Multi-Ethnic Study of Atherosclerosis). Hypertension 2022, 79, 150–158. [Google Scholar] [CrossRef] [PubMed]
- El-Baz, A.S.; Acharya, R.; Mirmehdi, M.; Suri, J.S. Multi Modality State-of-the-Art Medical Image Segmentation and Registration Methodologies; Springer Science & Business Media: Berlin/Heidelberg, Germany, 2011. [Google Scholar]
- Boi, A.; Jamthikar, A.D.; Saba, L.; Gupta, D.; Sharma, A.; Loi, B.; Laird, J.R.; Khanna, N.N.; Suri, J.S. A Survey on Coronary Atherosclerotic Plaque Tissue Characterization in Intravascular Optical Coherence Tomography. Curr. Atheroscler. Rep. 2018, 20, 33. [Google Scholar] [CrossRef] [PubMed]
- Suri, J.S.; Bhagawati, M.; Paul, S.; Protogeron, A.; Sfikakis, P.P.; Kitas, G.D.; Khanna, N.N.; Ruzsa, Z.; Sharma, A.M.; Saxena, S.; et al. Understanding the bias in machine learning systems for cardiovascular disease risk assessment: The first of its kind review. Comput. Biol. Med. 2022, 142, 105204. [Google Scholar] [CrossRef] [PubMed]
- Banchhor, S.K.; Araki, T.; Londhe, N.D.; Ikeda, N.; Radeva, P.; Elbaz, A.; Saba, L.; Nicolaides, A.; Shafique, S.; Laird, J.R.; et al. Five multiresolution-based calcium volume measurement techniques from coronary IVUS videos: A comparative approach. Comput. Methods Programs Biomed. 2016, 134, 237–258. [Google Scholar] [CrossRef]
- Banchhor, S.K.; Londhe, N.D.; Saba, L.; Radeva, P.; Laird, J.R.; Suri, J.S. Relationship between automated coronary calcium volumes and a set of manual coronary lumen volume, vessel volume and atheroma volume in japanese diabetic cohort. J. Clin. Diagn. Res. JCDR 2017, 11, TC09. [Google Scholar] [CrossRef]
- Pai Ramdas, G.; Vyas, V. Implications of ethnicity in subclinical atherosclerosis in underserved populations: Inadequacy of coronary risk score models. J. Am. Coll. Cardiol. 2022, 80, 230–232. [Google Scholar]
- Jena, B.; Saxena, S.; Nayak, G.K.; Saba, L.; Sharma, N.; Suri, J.S. Artificial intelligence-based hybrid deep learning models for image classification: The first narrative review. Comput. Biol. Med. 2021, 137, 104803. [Google Scholar] [CrossRef]
- Skandha, S.S.; Nicolaides, A.; Gupta, S.K.; Koppula, V.K.; Saba, L.; Johri, A.M.; Kalra, M.S.; Suri, J.S. A hybrid deep learning paradigm for carotid plaque tissue characterization and its validation in multicenter cohorts using a supercomputer framework. Comput. Biol. Med. 2021, 141, 105131. [Google Scholar] [CrossRef]
- Suri, J.; Agarwal, S.; Pathak, R.; Ketireddy, V.; Columbu, M.; Saba, L.; Gupta, S.; Faa, G.; Singh, I.; Turk, M.; et al. COVLIAS 1.0: Lung Segmentation in COVID-19 Computed Tomography Scans Using Hybrid Deep Learning Artificial Intelligence Models. Diagnostics 2021, 11, 1405. [Google Scholar] [CrossRef]
- Muñoz, P.; Rodríguez, R.; Montalvo, N. Automatic segmentation of diabetic foot ulcer from mask region-based convolu-tional neural networks. J. Biomed. Res. Clin. Investig. 2020, 1, 1006. [Google Scholar]
- Wang, L.; Pedersen, P.C.; Strong, D.M.; Tulu, B.; Agu, E.; Ignotz, R.; He, Q. An automatic assessment system of diabetic foot ulcers based on wound area determination, color segmentation, and healing score evaluation. J. Diabetes Sci. Tech-Nology 2016, 10, 421–428. [Google Scholar] [CrossRef] [PubMed]
- Jawahar, M.; Anbarasi, L.J.; Jasmine, S.G.; Narendra, M. Diabetic foot ulcer segmentation using color space models. In Proceedings of the 2020 5th International Conference on Communication and Electronics Systems (ICCES), Coimbatore, India, 10–12 June 2020; IEEE: Piscataway, NJ, USA; pp. 742–747. [Google Scholar]
- Saba, L.; Sanagala, S.S.; Gupta, S.K.; Koppula, V.K.; Johri, A.M.; Sharma, A.M.; Kolluri, R.; Bhatt, D.L.; Nicolaides, A.; Suri, J.S. Ultrasound-based internal carotid artery plaque characterization using deep learning paradigm on a supercomputer: A cardiovascular disease/stroke risk assessment system. Int. J. Cardiovasc. Imaging 2021, 37, 1511–1528. [Google Scholar] [CrossRef] [PubMed]
- Araki, T.; Ikeda, N.; Dey, N.; Chakraborty, S.; Saba, L.; Kumar, D.; Godia, E.C.; Jiang, X.; Gupta, A.; Radeva, P.; et al. A comparative approach of four different image registration techniques for quantitative assessment of coronary artery calcium lesions using intravascular ultrasound. Comput. Methods Programs Biomed. 2015, 118, 158–172. [Google Scholar] [CrossRef] [PubMed]
- Murgia, A.; Balestrieri, A.; Crivelli, P.; Suri, J.S.; Conti, M.; Cademartiri, F.; Saba, L. Cardiac computed tomography radi-omics: An emerging tool for the non-invasive assessment of coronary atherosclerosis. Cardiovasc. Diagn. Ther. 2020, 10, 2005. [Google Scholar] [CrossRef]
- Saba, L.; Sanfilippo, R.; Porcu, M.; Lucatelli, P.; Montisci, R.; Zaccagna, F.; Suri, J.S.; Anzidei, M.; Wintermark, M. Relationship between white matter hyperintensities volume and the circle of Willis configurations in patients with carotid artery pathology. Eur. J. Radiol. 2017, 89, 111–116. [Google Scholar] [CrossRef]
- Tandel, G.S.; Balestrieri, A.; Jujaray, T.; Khanna, N.N.; Saba, L.; Suri, J.S. Multiclass magnetic resonance imaging brain tumor classification using artificial intelligence paradigm. Comput. Biol. Med. 2020, 122, 103804. [Google Scholar] [CrossRef]
- Das, S.; Nayak, G.; Saba, L.; Kalra, M.; Suri, J.S.; Saxena, S. An artificial intelligence framework and its bias for brain tumor segmentation: A narrative review. Comput. Biol. Med. 2022, 143, 105273. [Google Scholar] [CrossRef]
- Cau, R.; Pacielli, A.; Fatemeh, H.; Vaudano, P.; Arru, C.; Crivelli, P.; Stranieri, G.; Suri, J.S.; Mannelli, L.; Conti, M. Complications in COVID-19 patients: Characteristics of pulmonary embolism. Clin. Imaging 2021, 77, 244–249. [Google Scholar] [CrossRef]
- Suri, J.S.; Agarwal, S.; Carriero, A.; Paschè, A.; Danna, P.S.; Columbu, M.; Saba, L.; Viskovic, K.; Mehmedović, A.; Agarwal, S. COVLIAS 1.0 vs. MedSeg: Artificial Intelligence-Based Comparative Study for Automated COVID-19 Computed Tomog-raphy Lung Segmentation in Italian and Croatian Cohorts. Diagnostics 2021, 11, 2367. [Google Scholar] [CrossRef]
- Lipsky, B.A.; Berendt, A.R.; Deery, H.G.; Embil, J.M.; Joseph, W.S.; Karchmer, A.W.; LeFrock, J.L.; Lew, D.P.; Mader, J.T.; Norden, C. Diagnosis and treatment of diabetic foot infections. Clin. Infect. Dis. 2004, 1, 885–910. [Google Scholar] [CrossRef]
- Steed, D.L.; Donohoe, D.; Webster, M.W.; Lindsley, L. Effect of extensive debridement and treatment on the healing of diabetic foot ulcers. Diabetic Ulcer Study Group. J. Am. Coll. Surg. 1996, 183, 61–64. [Google Scholar] [PubMed]
- Rajbhandari, S.M.; Harris, N.D.; Sutton, M.; Lockett, C.; Eaton, S.; Gadour, M.; Tesfaye, S.; Ward, J.D. Digital imaging: An accurate and easy method of measuring foot ulcers. Diabet. Med. 1999, 16, 339–342. [Google Scholar] [CrossRef] [PubMed]
- Kolesnik, M.; Fexa, A. Multi-dimensional Color Histograms for Segmentation of Wounds in Images. In International Conference Image Analysis and Recognition; Springer: Berlin/Heidelberg, Germany, 2005; pp. 1014–1022. [Google Scholar]
- Kolesnik, M.; Fexa, A. How robust is the SVM wound segmentation? In Proceedings of the 7th Nordic Signal. Processing Symposium-NORSIG, Piscataway, NJ, USA, 7–9 June 2006; IEEE: Piscataway, NJ, USA; pp. 50–53. [Google Scholar]
- Papazoglou, E.S.; Zubkov, L.; Mao, X.; Neidrauer, M.; Rannou, N.; Weingarten, M.S. Image analysis of chronic wounds for determining the surface area. Wound Repair Regen. 2010, 18, 349–358. [Google Scholar] [CrossRef]
- Veredas, F.; Mesa, H.; Morente, L. Binary tissue classification on wound images with neural networks and bayesian clas-sifiers. IEEE Trans. Med. Imaging 2009, 29, 410–427. [Google Scholar] [CrossRef] [PubMed]
- Alzubaidi, L.; Fadhel, M.A.; Al-Shamma, O.; Zhang, J.; Santamaría, J.; Duan, Y.; Oleiwi, S.R. Towards a better under-standing of transfer learning for medical imaging: A case study. Appl. Sci. 2020, 10, 4523. [Google Scholar] [CrossRef]
- Sarp, S.; Kuzlu, M.; Wilson, E.; Cali, U.; Guler, O. The Enlightening Role of Explainable Artificial Intelligence in Chronic Wound Classification. Electronics 2021, 10, 1406. [Google Scholar] [CrossRef]
- Agarwal, M.; Saba, L.; Gupta, S.K.; Johri, A.M.; Khanna, N.N.; Mavrogeni, S.; Laird, J.R.; Pareek, G.; Miner, M.; Sfikakis, P.P. Wilson disease tissue classification and characterization using seven artificial intelligence models embedded with 3D opti-mization paradigm on a weak training brain magnetic resonance imaging datasets: A supercomputer application. Med. Biol. Eng. Comput. 2021, 59, 511–533. [Google Scholar] [CrossRef]
- Jo, T.; Nho, K.; Saykin, A.J. Deep Learning in Alzheimer’s Disease: Diagnostic Classification and Prognostic Prediction Using Neuroimaging Data. Front. Aging Neurosci. 2019, 11, 220. [Google Scholar] [CrossRef] [Green Version]
- Hanna, S.; Hansen, L.; Heinrich, M.P. Learning a Metric for Multimodal Medical Image Registration without Supervision Based on Cycle Constraints. Sensors 2022, 3, 1107. [Google Scholar]
- Saba, L.; Sanagala, S.S.; Gupta, S.K.; Koppula, V.K.; Johri, A.M.; Khanna, N.N.; Mavrogeni, S.; Laird, J.R.; Pareek, G.; Miner, M. Multimodality carotid plaque tissue characterization and classification in the artificial intelligence paradigm: A nar-rative review for stroke application. Ann. Transl. Med. 2021, 9. [Google Scholar] [CrossRef]
- Retnakaran, R.; Shah, B.R. Role of Type 2 Diabetes in Determining Retinal, Renal, and Cardiovascular Outcomes in Women With Previous Gestational Diabetes Mellitus. Diabetes Care 2016, 40, 101–108. [Google Scholar] [CrossRef] [PubMed] [Green Version]
- Atri, A.; Kocherlakota, C.M.; Dasgupta, R. Managing diabetic foot in times of COVID-19: Time to put the best ‘foot’forward. Int. J. Diabetes Dev. Ctries. 2020, 40, 321–328. [Google Scholar] [CrossRef] [PubMed]
- Apelqvist, J. Diagnostics and treatment of the diabetic foot. Endocrine 2012, 41, 384–397. [Google Scholar] [CrossRef] [PubMed]
- Suri, J.S.; Puvvula, A.; Biswas, M.; Majhail, M.; Saba, L.; Faa, G.; Singh, I.M.; Oberleitner, R.; Turk, M.; Chadha, P.S. COVID-19 pathways for brain and heart injury in comorbidity patients: A role of medical imaging and artificial intelligence-based COVID severity classification: A review. Comput. Biol. 2020, 124, 103960. [Google Scholar] [CrossRef] [PubMed]
- Shin, L.; Bowling, F.L.; Armstrong, D.G.; Boulton, A.J. Saving the Diabetic Foot During the COVID-19 Pandemic: A Tale of Two Cities. Diabetes Care 2020, 43, 1704–1709. [Google Scholar] [CrossRef]
- Kelahmetoglu, O.; Camlı, M.F.; Kirazoglu, A.; Erbayat, Y.; Asgarzade, S.; Durgun, U.; Mehdizade, T.; Yeniocak, A.; Yildiz, K.; Ergun, S.S.; et al. Recommendations for management of diabetic foot ulcers during COVID-19 outbreak. Int. Wound J. 2020, 17, 1424–1427. [Google Scholar] [CrossRef] [PubMed]
- Jaly, I.; Iyengar, K.; Bahl, S.; Hughes, T.; Vaishya, R. Redefining diabetic foot disease management service during COVID-19 pandemic. Diabetes Metab. Syndr. Clin. Res. Rev. 2020, 14, 833–838. [Google Scholar] [CrossRef]
- Boulton, A. Diabetic Foot Disease during the COVID-19 Pandemic. Medicina 2021, 57, 97. [Google Scholar] [CrossRef]
- Tao, F.; Tang, X.; Tao, H.; Luo, Y.; Cao, H.; Xiang, W.; Zhao, Y.; Jin, L. Surgical treatment of diabetic foot ulcers during the COVID-19 pandemic in China. J. Diabetes Its Complicat. 2020, 34, 107622. [Google Scholar] [CrossRef]
- Urbančič-Rovan, V. Diabetic Foot Care Before and During the COVID-19 Epidemic: What Really Matters? Diabetes Care 2020, 44, e27–e28. [Google Scholar] [CrossRef]
- Mariet, A.S.; Benzenine, E.; Bouillet, B.; Vergès, B.; Quantin, C.; Petit, J.M. Impact of the COVID-19 Epidemic on hospi-talization for diabetic foot ulcers during lockdown: A French nationwide population-based study. Diabet. Med. 2021, 38, e14577. [Google Scholar] [CrossRef] [PubMed]
- Suri, J.S.; Rangayyan, R.M. Breast Imaging, Mammography, and Computer-Aided Diagnosis of Breast Cancer; SPIE: Bellingham, WA, USA, 2006. [Google Scholar]
- Acharya, U.R.; Joseph, K.P.; Kannathal, N.; Lim, C.M.; Suri, J.S. Heart rate variability: A review. Med. Biol. Eng. Comput. 2006, 44, 1031–1051. [Google Scholar] [CrossRef] [PubMed]
- Paul, S.; Maindarkar, M.; Saxena, S.; Saba, L.; Turk, M.; Kalra, M.; Krishnan, P.R.; Suri, J.S. Bias Investigation in Artificial Intelligence Systems for Early Detection of Parkinson’sDisease: A Narrative Review. Diagnostics 2022, 12, 166. [Google Scholar] [CrossRef] [PubMed]
- Suri, J.S.; Agarwal, S.; Jena, B.; Saxena, S.; El-Baz, A.; Agarwal, V.; Kalra, M.K.; Saba, L.; Viskovic, K.; Fatemi, M.; et al. Five Strategies for Bias Estimation in Artificial Intelligence-based Hybrid Deep Learning for Acute Respiratory Distress Syn-drome COVID-19 Lung Infected Patients using AP(ai)Bias 2.0: A Systematic Review. IEEE Trans. Instrum. Meas. 2022, 27, 140–148. [Google Scholar]
- Murray, C.J.; Lopez, A.D. Alternative projections of mortality and disability by cause 1990–2020: Global Burden of Disease Study. Lancet 1997, 349, 1498–1504. [Google Scholar] [CrossRef]
- Saba, L.; Sanfilippo, R.; Sannia, S.; Anzidei, M.; Montisci, R.; Mallarini, G.; Suri, J.S. Association Between Carotid Artery Plaque Volume, Composition, and Ulceration: A Retrospective Assessment With MDCT. Am. J. Roentgenol. 2012, 199, 151–156. [Google Scholar] [CrossRef]
- Khalifa, F.; Beache, G.M.; Gimel’farb, G.; Suri, J.S.; El-Baz, A. State-of-the-Art Medical Image; Springer: Mountain View, CA, USA, 2011. [Google Scholar]
- Agarwal, M.; Agarwal, S.; Saba, L.; Chabert, G.L.; Gupta, S.; Carriero, A.; Pasche, A.; Danna, P.; Mehmedovic, A.; Faa, G.; et al. Eight pruning deep learning models for low storage and high-speed COVID-19 computed tomography lung segmentation and heatmap-based lesion localization: A multicenter study using COVLIAS 2.0. Comput. Biol. Med. 2022, 146, 105571. [Google Scholar] [CrossRef]
- Acharya, U.R.; Mookiah, M.R.K.; Sree, S.V.; Yanti, R.; Martis, R.; Saba, L.; Molinari, F.; Guerriero, S.; Suri, J.S. Evolutionary algorithm-based classifier parameter tuning for automatic ovarian cancer tissue characterization and classification. Ultraschall Med. -Eur. J. Ultrasound 2014, 35, 237–245. [Google Scholar]
- Zhou, R.; Guo, F.; Azarpazhooh, M.R.; Hashemi, S.; Cheng, X.; Spence, J.D.; Ding, M.; Fenster, A. Deep Learning-Based Measurement of Total Plaque Area in B-Mode Ultrasound Images. IEEE J. Biomed. Health Inform. 2021, 25, 2967–2977. [Google Scholar] [CrossRef]


| SN | Citations | Relationship | ME | PS | OUTCOME | TRE |
|---|---|---|---|---|---|---|
| 1 | Feleke et al. [28] (2007) | DFI and CVD | LBBM, OBBM | 2818 | DFI Infections led to morbidity, with the combined effect of CVD leading to mortality. Following diabetic foot ulcers came TB, skin and subcutaneous infections, and pneumonia. | NR |
| 2 | Brownrigg et al. [14] (2012) | DFI with CVD risk of mortality | LBBM | 3619 | DFI patients have a higher risk of all-cause mortality than other diabetics. CVD contributes to this risk. | NR |
| 3 | Matheus et al. [83] (2013) | Diabetes and CVD | LBBM | NR | Diabetes prevention is the most effective way to lower CVD risk. Traditional, changeable heart disease risk factors are still essential for diabetes people. | NR |
| 4 | Tuttolomondo et al. [16] (2015) | DFS as a Cardiovascular Marker | LBBM | NR | In addition to peripheral sensory neuropathy, deformity, and trauma, other risk factors, including calluses, edema, and peripheral vascular disease, have been identified as etiological contributors to the formation of diabetic foot ulcers. | NR |
| 5 | Domingueti et al. [13] (2015) | Diabetes and CVD | LBBM | NR | Vascular problems in type 1 and type 2 diabetes are closely linked to endothelial dysfunction, hypercoagulability, inflammation, and the poor resolution of inflammation. | NR |
| 6 | Al-Rubeaan et al. [27] (2015) | DFI and CVD | LBBM | NR | Neuropathy and PVD are major risk factors for diabetic foot problems. Diabetic retinopathy is a major independent risk factor for diabetic foot issues. CVD risk factors are common among diabetics, and primary and secondary prevention strategies are essential to reduce morbidity and expense from this chronic condition. | NR |
| 7 | Bertoluci et al. [11] (2017) | Diabetes and CVD | LBBM | NR | CVD risk is increased 2- to 4-fold in people with type 2 diabetes, however, due to the disease’s extreme variability, the two conditions cannot be regarded as risk equivalents. To tailor care to each patient, risk assessment is essential. | NR |
| 8 | Dietrich et al. [15] (2017) | DFI as a Predictor of CVD and Mortality | LBBM | NR | DFS is linked to CVD and death. DFI’s connection with renal failure and retinopathy indicates the evolution of micro- and macrovasculopathy, neuropathy, chronic inflammation, and lipotoxicity. | NR |
| 9 | Mishra et al. [24] (2017) | DFI and CVD | LBBM | NR | Patients diagnosed with DFI have an increased risk of death from any cause compared to other diabetics. The risk is increased by cardiovascular disease. | NR |
| SN | Citations | Relationship | ME | PS | OUTCOME | TRE |
| 10 | Petrie et al. [84] (2018) | Diabetes and vascular complication | LBBM | NR | Diabetes and hypertension increase the possibility of CVD. Oxidative stress, inflammation, and fibrosis, which cause microvascular and macrovascular problems of diabetes, also cause vascular modification. | NR |
| 11 | Serhiyenko et al. [85] (2018) | Cardiac autonomic neuropathy in diabetes | LBBM | NR | CAN is a frequent, undiagnosed consequence of DM that increases CV morbidity and mortality. As cardiac denervation could be prevented and partially reversed in early disease stages, DM patients should be screened for it. | Yes |
| 12 | Shariful et al. [12] (2020) | Diabetes and CVD | LBBM | 1262 | Diabetes increased CVD risk at an early age. To reduce future CVD risks, diabetics must reduce cigarette usage and improve BP control. | NR |
| 13 | Balasubramanian et al. [20] (2021) | DFI and Microcirculation | LBBM | NR | Microcirculation plays a crucial function in tissue injury and inflammation homeostasis and resistance. Furthermore, the latest evidence supports the disruption of microcirculation as the weak link in the sequence of events that leads to DFI. | NR |
| 14 | Karhu et al. [86] (2022) | Diabetes and CVD | LBBM | 2535 | Intermittent hypoxia is worse in people with preexisting CVD, and diabetes and CVD accelerate IH deterioration. Intermittent hypoxia is a pathophysiological hallmark of sleep anemia that increases the risk for severe health consequences. Patients with diabetes or CVD should receive additional attention for sleep anemia screening and follow-up monitoring. | NR |
| 15 | Schuett et al. [87] (2022) | Diabetes and CVD | LBBM | NR | Diabetes and hypertension trigger CVD. Oxidative stress, inflammation, and fibrosis promote microvascular and macrovascular diabetic complications. | NR |
| 16 | Qiu et al. [57] (2022) | DFI and CVD | LBBM | 423 | The development of a diabetic foot ulcer was associated with a considerably greater death risk from all causes as well as from cardiovascular disease compared to that of a control group of those who had diabetes mellitus but did not have DFI. | NR |
| SN | Citations | IC | DS | REL | PRE | ClassTy | TOC | ML/DL | ACC % | AUC | SEN | SPE | F1 | MCC |
|---|---|---|---|---|---|---|---|---|---|---|---|---|---|---|
| 1 | Parthiban et al. [127] (2012) | LBBM | 341 | DM, CVD, and AI | CVD | SVM | NB | ML | 74.23 | 0.73 | 0.79 | NR | NR | NR |
| 2 | Jelinek et al. [128] (2016) | OBBM, LBBM | 88 | DM, CVD, and AI | CVD | SVM | RF | ML | 81.00 | 0.89 | 0.91 | 0.89 | NR | NR |
| 3 | Zarkogianni et al. [129] (2017) | OBBM, LBBM | 560 | DM, CVD, and AI | CVD | SVM | NB | ML | 76.34 | 0.87 | 0.79 | 0.76 | NR | NR |
| 4 | Basu et al. [130] (2018) | OBBM, LBBM | 2529 | DM, CVD, and AI | Death | PCA | KNN, DT | ML | 84.34 | 0.843 | 0.87 | NR | 0.76 | 0.843 |
| 5 | Dinh et al. [101] (2019) | OBBM, LBBM | 131 | DM, CVD, and AI | DM, CVD | XGBoost | RF | ML | 84.10 | 0.81 | 0.78 | 0.73 | NR | NR |
| 6 | Segar et al. [131] (2019) | OBBM, LBBM | 319 | DM, CVD, and AI | Heart Failure | LDA | RF | ML | 76.00 | 0.778 | 0.76 | NR | 0.79 | 0.778 |
| 7 | Aggarwal et al. [116] (2020) | OBBM, LBBM | 526 | DM, CVD, and AI | CVD | SVM | ANN | ML | 86.00 | 0.863 | NR | 0.81 | 0.71 | NR |
| 8 | Derevitskii et al. [115] (2020) | OBBM, LBBM | 8139 | DM, CVD, and AI | Stroke, DM | XGBoost | NB | ML | 84.53 | 0.87 | 0.91 | 0.86 | NR | NR |
| 10 | Hossain et al. [132] (2021) | OBBM, LBBM | 4819 | DM, CVD, and AI | CVD | SVM | RF | ML | 88.16 | 0.80 | NR | NR | 0.88 | NR |
| 11 | Longato et al. [103] (2021) | OBBM, LBBM | 24676 | DM, CVD, and AI | CVD | SVM | CNN | DL | 79.81 | 0.76 | 0.84 | NR | 0.79 | NR |
| SN | Citations | IC | DS | REL | PRE | ClassTy | TOC | ML/DL | ACC % | AUC | SEN | SPE | F1 | MCC |
| 13 | Hyerim et al. [102] (2022) | OBBM, LBBM | 10442 | DM, CVD, and AI | DM, CVD | LR, DT | CNN | DL | 80.88 | 0.86 | 0.81 | NR | NR | NR |
| 14 | Goyal et al. [30] (2020) | OBBM, LBBM | 7136 | DFI and AI | Diabetic foot Infection | NR | CNN | DL | 91.21 | 0.93 | 0.84 | 0.89 | NR | NR |
| 15 | Alzubaidi et al. [51] (2020) | OBBM, LBBM | 754 | DFI and AI | DFI | KNN | DNN | DL | 93.04 | 0.91 | 0.87 | 0.83 | 0.94 | NR |
| 16 | Khandekar et al. [100] (2021) | LBBM (IR) | 202 | DFI and AI | Diabetic foot | 6 Models | CNN | DL | 92.51 | 0.92 | NR | NR | 0.81 | NR |
| 17 | Isaza et al. [29] (2021) | OBBM, LBBM | 146 | DFI, CVD, and AI | DFI | PCA | CNN | DL | 88.24 | 0.84 | 0.86 | 0.79 | NR | NR |
| SN | Citations | Year | DFIa | DMb | CVDc | DId | WIe | AIf | RSg | ClassTyh | ML/DLj | ACC %k | AUCl | SENm | SPEn | F1o |
|---|---|---|---|---|---|---|---|---|---|---|---|---|---|---|---|---|
| 1 | Parthiban et al. [127] | 2012 | ✕ | ✓ | ✓ | ✕ | ✕ | ✓ | ✕ | ✓ | ✓ | ✓ | ✓ | ✕ | ✕ | ✕ |
| 2 | Jelinek et al. [128] | 2016 | ✓ | ✓ | ✓ | ✕ | ✕ | ✕ | ✕ | ✕ | ✕ | ✕ | ✕ | ✕ | ✕ | ✕ |
| 3 | Zarkogianni et al. [129] | 2017 | ✕ | ✕ | ✓ | ✓ | ✕ | ✓ | ✕ | ✓ | ✓ | ✓ | ✕ | ✕ | ✕ | ✕ |
| 4 | Segar et al. [131] | 2019 | ✓ | ✓ | ✓ | ✕ | ✕ | ✕ | ✕ | ✕ | ✕ | ✕ | ✕ | ✕ | ✕ | ✕ |
| 5 | Dinh et al. [101] | 2019 | ✓ | ✓ | ✓ | ✓ | ✓ | ✓ | ✓ | ✓ | ✓ | ✓ | ✕ | ✕ | ✕ | ✕ |
| 6 | Aggarwal et al. [116] | 2020 | ✓ | ✕ | ✕ | ✓ | ✕ | ✓ | ✕ | ✓ | ✓ | ✓ | ✓ | ✕ | ✕ | ✕ |
| 7 | Derevitskii et al. [115] | 2020 | ✓ | ✓ | ✓ | ✕ | ✕ | ✕ | ✕ | ✕ | ✕ | ✕ | ✕ | ✕ | ✕ | ✕ |
| 8 | Karhu et al. [86] | 2022 | ✓ | ✓ | ✓ | ✕ | ✕ | ✕ | ✕ | ✕ | ✕ | ✕ | ✕ | ✕ | ✕ | ✕ |
| 9 | Schuett et al. [87] | 2022 | ✓ | ✓ | ✓ | ✕ | ✕ | ✕ | ✕ | ✕ | ✕ | ✕ | ✕ | ✕ | ✕ | ✕ |
| 10 | Hossain et al. [132] | 2021 | ✓ | ✓ | ✓ | ✕ | ✓ | ✓ | ✕ | ✓ | ✓ | ✓ | ✓ | ✕ | ✕ | ✕ |
| 11 | Longato et al. [103] | 2021 | ✓ | ✓ | ✓ | ✕ | ✕ | ✓ | ✕ | ✓ | ✓ | ✓ | ✓ | ✕ | ✕ | ✕ |
| 12 | Hyerim et al. [102] | 2021 | ✓ | ✓ | ✓ | ✕ | ✕ | ✓ | ✕ | ✓ | ✓ | ✓ | ✓ | ✕ | ✕ | ✕ |
| 13 | Maindarkar et al. (proposed) | 2022 | ✓ | ✓ | ✓ | ✓ | ✓ | ✓ | ✓ | ✓ | ✓ | ✓ | ✓ | ✓ | ✓ | ✓ |
Publisher’s Note: MDPI stays neutral with regard to jurisdictional claims in published maps and institutional affiliations. |
© 2022 by the authors. Licensee MDPI, Basel, Switzerland. This article is an open access article distributed under the terms and conditions of the Creative Commons Attribution (CC BY) license (https://creativecommons.org/licenses/by/4.0/).
Share and Cite
Khanna, N.N.; Maindarkar, M.A.; Viswanathan, V.; Puvvula, A.; Paul, S.; Bhagawati, M.; Ahluwalia, P.; Ruzsa, Z.; Sharma, A.; Kolluri, R.; et al. Cardiovascular/Stroke Risk Stratification in Diabetic Foot Infection Patients Using Deep Learning-Based Artificial Intelligence: An Investigative Study. J. Clin. Med. 2022, 11, 6844. https://doi.org/10.3390/jcm11226844
Khanna NN, Maindarkar MA, Viswanathan V, Puvvula A, Paul S, Bhagawati M, Ahluwalia P, Ruzsa Z, Sharma A, Kolluri R, et al. Cardiovascular/Stroke Risk Stratification in Diabetic Foot Infection Patients Using Deep Learning-Based Artificial Intelligence: An Investigative Study. Journal of Clinical Medicine. 2022; 11(22):6844. https://doi.org/10.3390/jcm11226844
Chicago/Turabian StyleKhanna, Narendra N., Mahesh A. Maindarkar, Vijay Viswanathan, Anudeep Puvvula, Sudip Paul, Mrinalini Bhagawati, Puneet Ahluwalia, Zoltan Ruzsa, Aditya Sharma, Raghu Kolluri, and et al. 2022. "Cardiovascular/Stroke Risk Stratification in Diabetic Foot Infection Patients Using Deep Learning-Based Artificial Intelligence: An Investigative Study" Journal of Clinical Medicine 11, no. 22: 6844. https://doi.org/10.3390/jcm11226844