
The Pandora’s Box of Frailty Assessments: Which Is the Best for Clinical Purposes in TAVI Patients? A Critical Review

 , , and
Abstract
:1. Introduction
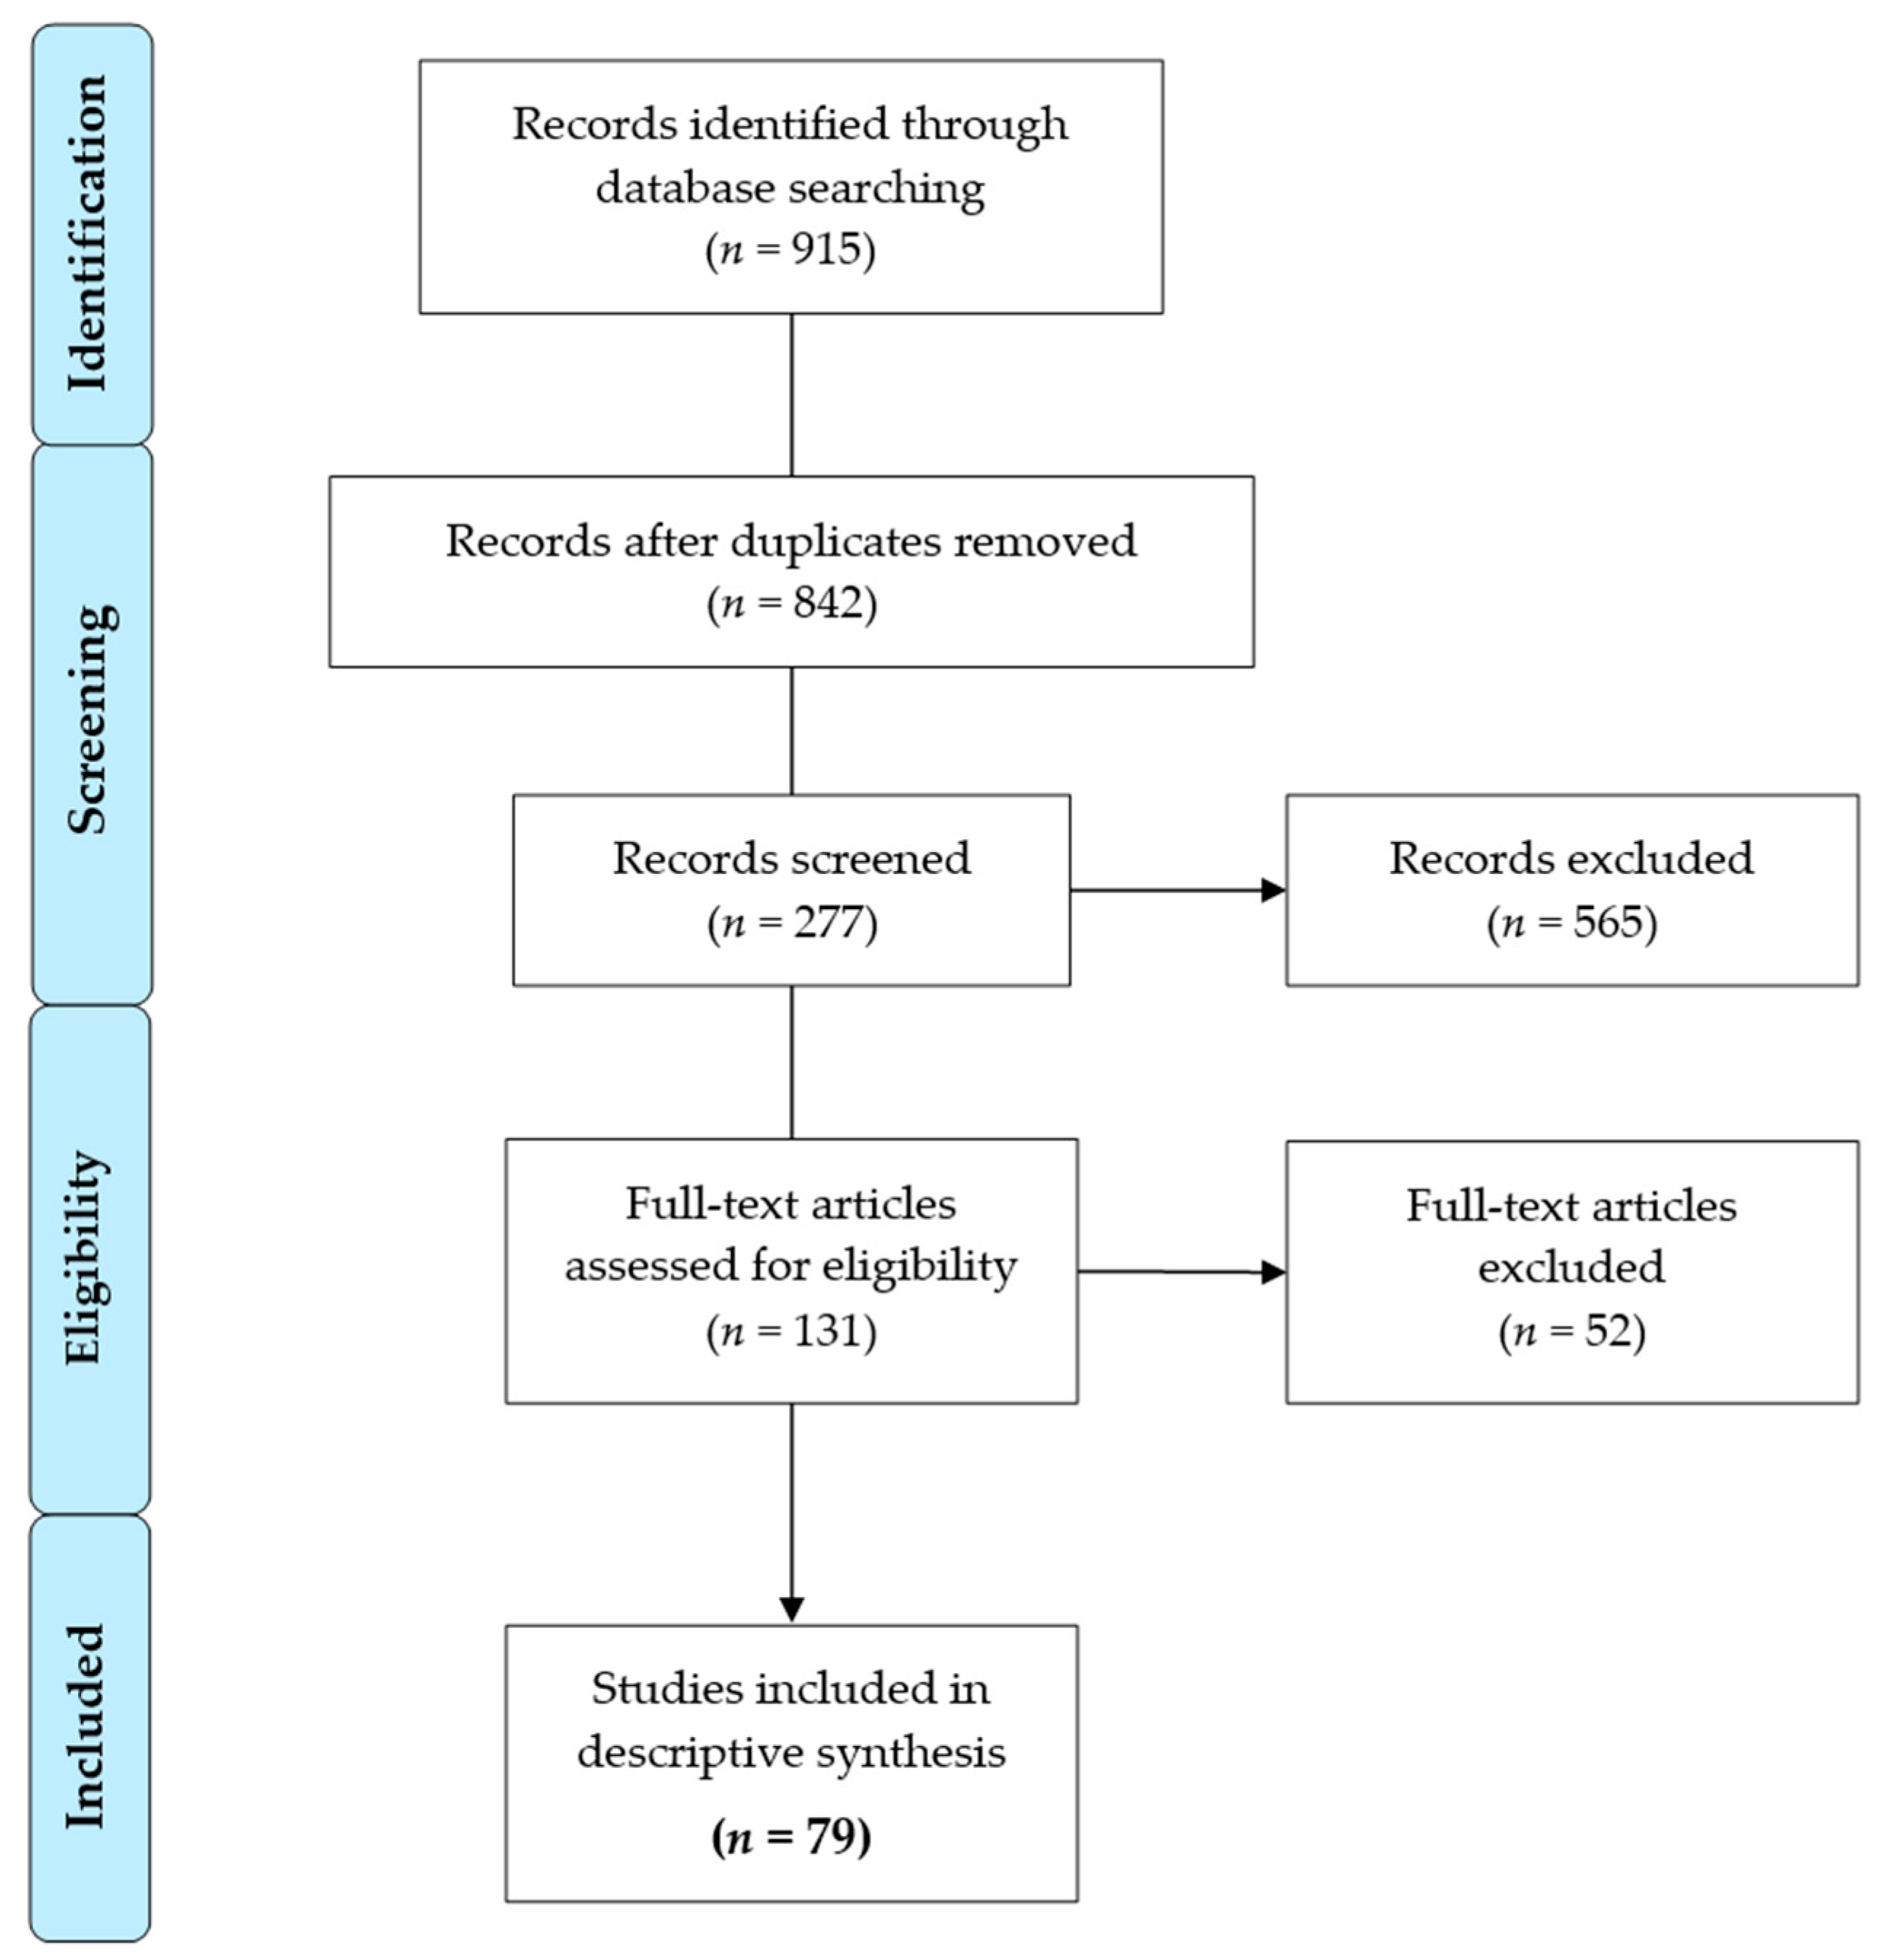
2. Materials and Methods
3. Results
3.1. Single Markers of Frailty
3.2. Multidimensional Frailty Scales
3.3. Composite Indices
4. Discussion
5. Conclusions
Supplementary Materials
Author Contributions
Funding
Institutional Review Board Statement
Informed Consent Statement
Acknowledgments
Conflicts of Interest
References
- Chłoń-Domińczak, A.; Kotowska, I.E.; Kurkiewicz, J.; Abramowska-Kmon, A.; Stonawski, M.; Sobczak, D. Population Ageing in Europe: Facts, Implications and Policies; EUROPEAN COMMISSION, Directorate-General for Research and Innovation: Bruxelles, Belgium, 2014. [Google Scholar]
- Vigorito, C.; Abreu, A.; Ambrosetti, M.; Belardinelli, R.; Corrà, U.; Cupples, M.; Davos, C.; Hoefer, S.; Iliou, M.-C.; Schmid, J.-P.; et al. Frailty and cardiac rehabilitation: A call to action from the EAPC cardiac rehabilitation section. Eur. J. Prev. Cardiol. 2016, 24, 577–590. [Google Scholar] [CrossRef] [Green Version]
- Hoogendijk, E.O.; Afilalo, J.; Ensrud, K.; Kowal, P.; Onder, G.; Fried, L.P. Frailty: Implications for clinical practice and public health. Lancet 2019, 394, 1365–1375. [Google Scholar] [CrossRef]
- Morley, J.E.; Vellas, B.; Van Kan, G.A.; Anker, S.D.; Bauer, J.M.; Bernabei, R.; Cesari, M.; Chumlea, W.; Doehner, W.; Evans, J.; et al. Frailty Consensus: A Call to Action. J. Am. Med. Dir. Assoc. 2013, 14, 392–397. [Google Scholar] [CrossRef] [Green Version]
- Clegg, A.; Young, J.; Iliffe, S.; Rikkert, M.O.; Rockwood, K. Frailty in elderly people. Lancet 2013, 381, 752–762. [Google Scholar] [CrossRef] [Green Version]
- Afilalo, J.; Alexander, K.P.; Mack, M.J.; Maurer, M.S.; Green, P.; Allen, L.A.; Popma, J.J.; Ferrucci, L.; Forman, D.E. Frailty Assessment in the cardiovascular care of older adults. J. Am. Coll. Cardiol. 2013, 63, 747–762. [Google Scholar] [CrossRef] [Green Version]
- Cruz-Jentoft, A.J.; Kiesswetter, E.; Drey, M.; Sieber, C.C. Nutrition, frailty, and sarcopenia. Aging Clin. Exp. Res. 2017, 29, 43–48. [Google Scholar] [CrossRef]
- Morley, J.E.; Von Haehling, S.; Anker, S.D.; Vellas, B. From sarcopenia to frailty: A road less traveled. J. Cachex-Sarcopenia Muscle 2014, 5, 5–8. [Google Scholar] [CrossRef]
- Stortecky, S.; Schoenenberger, A.W.; Moser, A.; Kalesan, B.; Jüni, P.; Carrel, T.; Bischoff, S.; Schoenenberger, C.-M.; Stuck, A.E.; Windecker, S.; et al. Evaluation of multidimensional geriatric assessment as a predictor of mortality and cardiovascular events after transcatheter aortic valve implantation. JACC Cardiovasc. Interv. 2012, 5, 489–496. [Google Scholar] [CrossRef] [Green Version]
- Eichler, S.; Hadzic, M.; Völler, H.; Salzwedel, A. Octogenarians in interventional cardiology: Feasibility and safety of functional and nutritional assessments for a new patient group in cardiac rehabilitation. Eur. J. Prev. Cardiol. 2020, 27, 2345–2347. [Google Scholar] [CrossRef]
- Kappetein, A.P.; Head, S.J.; Généreux, P.; Piazza, N.; van Mieghem, N.M.; Blackstone, E.H.; Brott, T.G.; Cohen, D.J.; Cutlip, D.E.; van Es, G.-A.; et al. Updated standardized endpoint definitions for transcatheter aortic valve implantation: The Valve Academic Research Consortium-2 consensus document. J. Thorac. Cardiovasc. Surg. 2013, 145, 6–23. [Google Scholar] [CrossRef] [Green Version]
- Eichler, S.; Salzwedel, A.; Harnath, A.; Butter, C.; Wegscheider, K.; Chiorean, M.; Völler, H.; Reibis, R. Nutrition and mobility predict all-cause mortality in patients 12 months after transcatheter aortic valve implantation. Clin. Res. Cardiol. 2017, 107, 304–311. [Google Scholar] [CrossRef] [Green Version]
- Afilalo, J.; Lauck, S.; Kim, D.H.; Lefèvre, T.; Piazza, N.; Lachapelle, K.; Martucci, G.; Lamy, A.; Labinaz, M.; Peterson, M.D.; et al. Frailty in older adults undergoing aortic valve replacement. J. Am. Coll. Cardiol. 2017, 70, 689–700. [Google Scholar] [CrossRef]
- Schoenenberger, A.W.; Stortecky, S.; Neumann, S.; Moser, A.; Jüni, P.; Carrel, T.; Huber, C.; Gandon, M.; Bischoff, S.; Schoenenberger, C.-M.; et al. Predictors of functional decline in elderly patients undergoing transcatheter aortic valve implantation (TAVI). Eur. Heart J. 2012, 34, 684–692. [Google Scholar] [CrossRef] [PubMed] [Green Version]
- Hayden, J.A.; van der Windt, D.A.; Cartwright, J.L.; Côté, P.; Bombardier, C. Assessing bias in studies of prognostic factors. Ann. Intern. Med. 2013, 158, 280–286. [Google Scholar] [CrossRef] [PubMed]
- Wells, G.A.; Shea, B.; Higgins, J.; Sterne, J.; Tugwell, P.; Reeves, B.C. Checklists of methodological issues for review authors to consider when including non-randomized studies in systematic reviews. Res. Synth. Methods 2013, 4, 63–77. [Google Scholar] [CrossRef] [PubMed]
- Afilalo, J.; Eisenberg, M.J.; Morin, J.-F.; Bergman, H.; Monette, J.; Noiseux, N.; Perrault, L.P.; Alexander, K.P.; Langlois, Y.; Dendukuri, N.; et al. Gait speed as an incremental predictor of mortality and major morbidity in elderly patients undergoing cardiac surgery. J. Am. Coll. Cardiol. 2010, 56, 1668–1676. [Google Scholar] [CrossRef] [PubMed] [Green Version]
- Forcillo, J.; Condado, J.F.; Ko, Y.-A.; Yuan, M.; Binongo, J.N.; Ndubisi, N.M.; Kelly, J.J.; Babaliaros, V.; Guyton, R.A.; Devireddy, C.; et al. Assessment of commonly used frailty markers for high- and extreme-risk patients undergoing transcatheter aortic valve replacement. Ann. Thorac. Surg. 2017, 104, 1939–1946. [Google Scholar] [CrossRef] [PubMed] [Green Version]
- Kiani, S.; Stebbins, A.; Thourani, V.H.; Forcillo, J.; Vemulapalli, S.; Kosinski, A.S.; Babaliaros, V.; Cohen, D.; Kodali, S.K.; Kirtane, A.J.; et al. The effect and relationship of frailty indices on survival after transcatheter aortic valve replacement. JACC Cardiovasc. Interv. 2020, 13, 219–231. [Google Scholar] [CrossRef]
- Alfredsson, J.; Stebbins, A.; Brennan, J.M.; Matsouaka, R.; Afilalo, J.; Peterson, E.D.; Vemulapalli, S.; Rumsfeld, J.S.; Sha-Hian, D.; Mack, M.J.; et al. gait speed predicts 30-day mortality after transcatheter aortic valve replacement: Results from the Society of Thoracic Surgeons/American College of Cardiology Transcatheter Valve Therapy registry. Circulation 2016, 136, 1351–1359. [Google Scholar] [CrossRef]
- Steinvil, A.; Buchanan, K.D.; Kiramijyan, S.; Bond, E.; Rogers, T.; Koifman, E.; Shults, C.; Xu, L.; Torguson, R.; Okubagzi, P.G.; et al. Utility of an additive frailty tests index score for mortality risk assessment following transcatheter aortic valve replacement. Am. Heart J. 2018, 200, 11–16. [Google Scholar] [CrossRef]
- van der Wulp, K.; van Wely, M.H.; Schoon, Y.; Vart, P.; Rikkert, M.G.O.; Morshuis, W.J.; van Royen, N.; Verkroost, M.W.; Gehlmann, H.R.; Van Garsse, L.A.; et al. Geriatric assessment in the prediction of delirium and long-term survival after transcatheter aortic valve implantation. J. Thorac. Cardiovasc. Surg. 2020, 161, 2095–2102. [Google Scholar] [CrossRef]
- Chauhan, D.; Haik, N.; Merlo, A.; Haik, B.J.; Chen, C.; Cohen, M.; Mosenthal, A.; Russo, M. Quantitative increase in frailty is associated with diminished survival after transcatheter aortic valve replacement. Am. Heart J. 2016, 182, 146–154. [Google Scholar] [CrossRef] [PubMed]
- Kleczynski, P.; Dziewierz, A.; Bagienski, M.; Rzeszutko, L.; Sorysz, D.; Trebacz, J.; Sobczynski, R.; Tomala, M.; Stapor, M.; Dudek, D. Impact of frailty on mortality after transcatheter aortic valve implantation. Am. Heart J. 2017, 185, 52–58. [Google Scholar] [CrossRef] [PubMed]
- Kleczynski, P.; Tokarek, T.; Dziewierz, A.; Sorysz, D.; Bagienski, M.; Rzeszutko, L.; Dudek, D. Usefulness of psoas muscle area and volume and frailty scoring to predict outcomes after transcatheter aortic valve implantation. Am. J. Cardiol. 2018, 122, 135–140. [Google Scholar] [CrossRef] [PubMed]
- Dziewierz, A.; Tokarek, T.; Kleczynski, P.; Sorysz, D.; Bagieński, M.; Rzeszutko, L.; Dudek, D. Impact of chronic obstructive pulmonary disease and frailty on long-term outcomes and quality of life after transcatheter aortic valve implantation. Aging Clin. Exp. Res. 2017, 30, 1033–1040. [Google Scholar] [CrossRef] [PubMed] [Green Version]
- Green, P.; Cohen, D.J.; Généreux, P.; McAndrew, T.; Arnold, S.V.; Alu, M.; Beohar, N.; Rihal, C.S.; Mack, M.J.; Kapadia, S.; et al. Relation between six-minute walk test performance and outcomes after transcatheter aortic valve implantation (from the PARTNER trial). Am. J. Cardiol. 2013, 112, 700–706. [Google Scholar] [CrossRef] [PubMed] [Green Version]
- Altisent, O.A.-J.; Puri, R.; Regueiro, A.; Chamandi, C.; Rodriguez-Gabella, T.; del Trigo, M.; Campelo-Parada, F.; Couture, T.; Marsal, J.R.; Côté, M.; et al. Predictors and association with clinical outcomes of the changes in exercise capacity after transcatheter aortic valve replacement. Circulation 2017, 136, 632–643. [Google Scholar] [CrossRef] [PubMed]
- Dvir, D.; Waksman, R.; Barbash, I.M.; Kodali, S.K.; Svensson, L.G.; Tuzcu, E.M.; Xu, K.; Minha, S.; Alu, M.C.; Szeto, W.Y.; et al. Outcomes of patients with chronic lung disease and severe aortic stenosis treated with transcatheter versus surgical aortic valve replacement or standard therapy. J. Am. Coll. Cardiol. 2013, 63, 269–279. [Google Scholar] [CrossRef] [Green Version]
- Kano, S.; Yamamoto, M.; Shimura, T.; Kagase, A.; Tsuzuki, M.; Kodama, A.; Koyama, Y.; Kobayashi, T.; Shibata, K.; Tada, N.; et al. Gait speed can predict advanced clinical outcomes in patients who undergo transcatheter aortic valve replacement. Circ. Cardiovasc. Interv. 2017, 10, e00508. [Google Scholar] [CrossRef]
- Arnold, S.V.; O’Brien, S.M.; Vemulapalli, S.; Cohen, D.J.; Stebbins, A.; Brennan, J.M.; Shahian, D.M.; Grover, F.L.; Holmes, D.R.; Thourani, V.H.; et al. Inclusion of functional status measures in the risk adjustment of 30-day mortality after transcatheter aortic valve replacement. JACC Cardiovasc. Interv. 2018, 11, 581–589. [Google Scholar] [CrossRef]
- Shimura, T.; Yamamoto, M.; Kano, S.; Kagase, A.; Kodama, A.; Koyama, Y.; Tsuchikane, E.; Suzuki, T.; Otsuka, T.; Kohsaka, S.; et al. Impact of the clinical frailty scale on outcomes after transcatheter aortic valve replacement. Circulation 2017, 135, 2013–2024. [Google Scholar] [CrossRef]
- Assmann, P.; Kievit, P.; van der Wulp, K.; Verkroost, M.; Noyez, L.; Bor, H.; Schoon, Y. Frailty is associated with delirium and mortality after transcatheter aortic valve implantation. Open Heart 2016, 3, e000478. [Google Scholar] [CrossRef] [Green Version]
- Hermiller, J.B.; Yakubov, S.J.; Reardon, M.J.; Deeb, G.M.; Adams, D.H.; Afilalo, J.; Huang, J.; Popma, J.J. Predicting early and late mortality after transcatheter aortic valve replacement. J. Am. Coll. Cardiol. 2016, 68, 343–352. [Google Scholar] [CrossRef]
- Patel, J.N.; Ahmad, M.; Kim, M.; Banga, S.; Asche, C.; Barzallo, M.; Mungee, S. Relation of frailty to cost for patients undergoing transcatheter aortic valve implantation. Am. J. Cardiol. 2019, 125, 469–474. [Google Scholar] [CrossRef]
- Saji, M.; Lim, D.S.; Ragosta, M.; LaPar, D.J.; Downs, E.; Ghanta, R.K.; Kern, J.A.; Dent, J.M.; Ailawadi, G. Usefulness of psoas muscle area to predict mortality in patients undergoing transcatheter aortic valve replacement. Am. J. Cardiol. 2016, 118, 251–257. [Google Scholar] [CrossRef]
- Sathananthan, J.; Lauck, S.; Piazza, N.; Martucci, G.; Kim, D.H.; Popma, J.J.; Asgar, A.W.; Perrault, L.P.; Lefèvre, T.; Labinaz, M.; et al. Habitual physical activity in older adults undergoing TAVR. JACC Cardiovasc. Interv. 2019, 12, 781–789. [Google Scholar] [CrossRef]
- Green, P.; Arnold, S.V.; Cohen, D.J.; Kirtane, A.J.; Kodali, S.K.; Brown, D.L.; Rihal, C.S.; Xu, K.; Lei, Y.; Hawkey, M.C.; et al. Relation of frailty to outcomes after transcatheter aortic valve replacement (from the PARTNER trial). Am. J. Cardiol. 2015, 116, 264–269. [Google Scholar] [CrossRef] [PubMed] [Green Version]
- Green, P.; Woglom, A.E.; Genereux, P.; Daneault, B.; Paradis, J.-M.; Schnell, S.; Hawkey, M.; Maurer, M.S.; Kirtane, A.J.; Kodali, S.; et al. The impact of frailty status on survival after transcatheter aortic valve replacement in older adults with severe aortic stenosis. JACC Cardiovasc. Interv. 2012, 5, 974–981. [Google Scholar] [CrossRef] [PubMed] [Green Version]
- Shimura, T.; Yamamoto, M.; Kano, S.; Hosoba, S.; Sago, M.; Kagase, A.; Koyama, Y.; Tsujimoto, S.; Otsuka, T.; Tada, N.; et al. Patients Refusing Transcatheter Aortic Valve Replacement Even Once Have Poorer Clinical Outcomes. J. Am. Heart Assoc. 2018, 7, e009195. [Google Scholar] [CrossRef] [PubMed] [Green Version]
- Grossman, Y.; Barbash, I.M.; Fefer, P.; Goldenberg, I.; Berkovitch, A.; Regev, E.; Fink, N.; Ben-Zekry, S.; Brodov, Y.; Kogan, A.; et al. Addition of albumin to Traditional Risk Score Improved Prediction of Mortality in Individuals Undergoing Transcatheter Aortic Valve Replacement. J. Am. Geriatr. Soc. 2017, 65, 2413–2417. [Google Scholar] [CrossRef]
- Bogdan, A.; Barbash, I.M.; Segev, A.; Fefer, P.; Bogdan, S.N.; Asher, E.; Fink, N.; Hamdan, A.; Spiegelstein, D.; Raanani, E.; et al. Albumin correlates with all-cause mortality in elderly patients undergoing transcatheter aortic valve implantation. EuroIntervention 2016, 12, e1057–e1064. [Google Scholar] [CrossRef]
- Berkovitch, A.; Barbash, I.M.; Finkelstein, A.; Assali, A.R.; Danenberg, H.; Fefer, P.; Maor, E.; Zhitomirsky, S.; Orvin, K.; Ben Zekry, S.; et al. Validation of cardiac damage classification and addition of albumin in a large cohort of patients undergoing transcatheter aortic valve replacement. Int. J. Cardiol. 2020, 304, 23–28. [Google Scholar] [CrossRef] [PubMed]
- Michel, J.; Pellegrini, C.; Rheude, T.; von Scheidt, M.; Trenkwalder, T.; Elhmidi, Y.; Mayr, N.P.; Brecker, S.; Kasel, A.M.; Kastrati, A.; et al. The clinical impact of psoas muscle cross-sectional area on medium-term mortality after transcatheter aortic valve implantation. Hear. Lung Circ. 2019, 29, 904–913. [Google Scholar] [CrossRef]
- Krishnan, A.; Suarez-Pierre, A.; Zhou, X.; Lin, C.T.; Fraser, C.D.; Crawford, T.C.; Hsu, J.; Hasan, R.K.; Resar, J.; Chacko, M.; et al. Comparing frailty markers in predicting poor outcomes after transcatheter aortic valve replacement. Innov. Technol. Tech. Cardiothorac. Vasc. Surg. 2019, 14, 43–54. [Google Scholar] [CrossRef]
- Koifman, E.; Magalhaes, M.A.; Ben-Dor, I.; Kiramijyan, S.; Escarcega, R.O.; Fang, C.; Torguson, R.; Okubagzi, P.; Negi, S.I.; Baker, N.C.; et al. Impact of pre-procedural serum albumin levels on outcome of patients undergoing transcatheter aortic valve replacement. Am. J. Cardiol. 2015, 115, 1260–1264. [Google Scholar] [CrossRef]
- Puls, M.; Sobisiak, B.; Bleckmann, A.; Jacobshagen, C.; Danner, B.C.; Hünlich, M.; Beißbarth, T.; Schöndube, F.; Hasenfuß, G.; Seipelt, R.; et al. Impact of frailty on short- and long-term morbidity and mortality after transcatheter aortic valve implantation: Risk assessment by Katz Index of activities of daily living. EuroIntervention 2014, 10, 609–619. [Google Scholar] [CrossRef]
- Martin, G.P.; Sperrin, M.; Ludman, P.F.; Debelder, M.A.; Gunning, M.; Townend, J.; Redwood, S.R.; Kadam, U.T.; Buchan, I.; Mamas, M. Do frailty measures improve prediction of mortality and morbidity following transcatheter aortic valve implantation? An analysis of the UK TAVI registry. BMJ Open 2018, 8, e022543. [Google Scholar] [CrossRef]
- Martin, G.P.; Sperrin, M.; Ludman, P.F.; De Belder, M.A.; Redwood, S.R.; Townend, J.; Gunning, M.; Moat, N.E.; Banning, A.; Buchan, I.; et al. Novel United Kingdom prognostic model for 30-day mortality following transcatheter aortic valve implantation. Heart 2017, 104, 1109–1116. [Google Scholar] [CrossRef]
- Bureau, M.-L.; Liuu, E.; Christiaens, L.; Pilotto, A.; Mergy, J.; Bellarbre, F.; Ingrand, P.; Paccalin, M.; Cruz-Jentoft, A.J.; Maggi, S.; et al. Using a multidimensional prognostic index (MPI) based on comprehensive geriatric assessment (CGA) to predict mortality in elderly undergoing transcatheter aortic valve implantation. Int. J. Cardiol. 2017, 236, 381–386. [Google Scholar] [CrossRef] [PubMed]
- Goudzwaard, J.A.; de Ronde-Tillmans, M.J.; El Faquir, N.; Acar, F.; Van Mieghem, N.M.; Lenzen, M.J.; de Jaegere, P.P.; Mattace-Raso, F.U. The Erasmus Frailty Score is associated with delirium and 1-year mortality after Transcatheter Aortic Valve Implantation in older patients. The TAVI Care & Cure program. Int. J. Cardiol. 2018, 276, 48–52. [Google Scholar] [CrossRef] [PubMed]
- Cockburn, J.; Singh, M.S.; Rafi, N.H.M.; Dooley, M.; Hutchinson, N.; Hill, A.; Trivedi, U.; De Belder, A.; Hildick-Smith, D. Poor mobility predicts adverse outcome better than other frailty indices in patients undergoing transcatheter aortic valve implantation. Catheter. Cardiovasc. Interv. 2015, 86, 1271–1277. [Google Scholar] [CrossRef] [PubMed]
- Szekely, Y.; Finkelstein, A.; Bazan, S.; Halkin, A.; Younis, M.A.; Erez, J.; Keren, G.; Banai, S.; Arbel, Y. Red blood cell distribution width as a prognostic factor in patients undergoing transcatheter aortic valve implantation. J. Cardiol. 2019, 74, 212–216. [Google Scholar] [CrossRef] [PubMed]
- Boureau, A.S.; Trochu, J.N.; Rouaud, A.; Hureau, R.; Jaafar, P.; Manigold, T.; Letocart, V.; Guerin, P.; Berrut, G.; De Decker, L. Predictors of health-related quality of life decline after transcatheter aortic valve replacement in older patients with severe aortic stenosis. J. Nutr. Health Aging 2017, 21, 105–111. [Google Scholar] [CrossRef] [PubMed]
- Schoenenberger, A.W.; Moser, A.; Bertschi, D.; Wenaweser, P.; Windecker, S.; Carrel, T.; Stuck, A.E.; Stortecky, S. Improvement of risk prediction after transcatheter aortic valve replacement by combining frailty with conventional risk scores. JACC Cardiovasc. Interv. 2018, 11, 395–403. [Google Scholar] [CrossRef] [PubMed]
- Kofler, M.; Reinstadler, S.J.; Mayr, A.; Stastny, L.; Reindl, M.; Dumfarth, J.; Dachs, T.M.; Wachter, K.; Rustenbach, C.J.; Friedrich, G.; et al. Prognostic implications of psoas muscle area in patients undergoing transcatheter aortic valve implantation. Eur. J. Cardio-Thoracic Surg. 2018, 55, 210–216. [Google Scholar] [CrossRef] [PubMed] [Green Version]
- Van Mourik, M.S.; Janmaat, Y.C.; Van Kesteren, F.; Vendrik, J.; Planken, R.N.; Henstra, M.J.; Velu, J.F.; Vlastra, W.; Zwinderman, A.H.; Koch, K.T.; et al. CT determined psoas muscle area predicts mortality in women undergoing transcatheter aortic valve implantation. Catheter. Cardiovasc. Interv. 2018, 93, E248–E254. [Google Scholar] [CrossRef] [Green Version]
- Mamane, S.; Mullie, L.; Piazza, N.; Martucci, G.; Morais, J.; Vigano, A.; Levental, M.; Nelson, K.; Lange, R.; Afilalo, J. Psoas muscle area and all-cause mortality after transcatheter aortic valve replacement: The Montreal-Munich study. Can. J. Cardiol. 2015, 32, 177–182. [Google Scholar] [CrossRef] [Green Version]
- Foldyna, B.; Troschel, F.M.; Addison, D.; Fintelmann, F.J.; Elmariah, S.; Furman, D.; Eslami, P.; Ghoshhajra, B.; Lu, M.T.; Murthy, V.L.; et al. Computed tomography-based fat and muscle characteristics are associated with mortality after transcatheter aortic valve replacement. J. Cardiovasc. Comput. Tomogr. 2018, 12, 223–228. [Google Scholar] [CrossRef]
- Garg, L.; Agrawal, S.; Pew, T.; Hanzel, G.S.; Abbas, A.E.; Gallagher, M.J.; Shannon, F.L.; Hanson, I.D. Psoas muscle area as a predictor of outcomes in transcatheter aortic valve implantation. Am. J. Cardiol. 2016, 119, 457–460. [Google Scholar] [CrossRef]
- Honda, Y.; Yamawaki, M.; Shigemitsu, S.; Kenji, M.; Tokuda, T.; Tsutumi, M.; Mori, S.; Sakamoto, Y.; Kobayashi, N.; Araki, M.; et al. Prognostic value of objective nutritional status after transcatheter aortic valve replacement. J. Cardiol. 2019, 73, 401–407. [Google Scholar] [CrossRef]
- Seiffert, M.; Sinning, J.-M.; Meyer, A.; Wilde, S.; Conradi, L.; Nicotera, M.; Ghanem, A.; Kempfert, J.; Hammerstingl, C.; Ojeda, F.M.; et al. Development of a risk score for outcome after transcatheter aortic valve implantation. Clin. Res. Cardiol. 2014, 103, 631–640. [Google Scholar] [CrossRef]
- Miura, M.; Shirai, S.; Uemura, Y.; Jinnouchi, H.; Morinaga, T.; Isotani, A.; Watanabe, S.; Hayashi, M.; Kamioka, N.; Nagasawa, A.; et al. Early safety and efficacy of transcatheter aortic valve implantation for asian nonagenarians (from KMH Registry). Int. Heart J. 2017, 58, 900–907. [Google Scholar] [CrossRef]
- Yokoyama, H.; Tobaru, T.; Muto, Y.; Hagiya, K.; Higuchi, R.; Saji, M.; Takamisawa, I.; Shimizu, J.; Takanashi, S.; Takayama, M.; et al. Long-term outcomes in Japanese nonagenarians undergoing transcatheter aortic valve implantation: A multi-center analysis. Clin. Cardiol. 2019, 42, 605–611. [Google Scholar] [CrossRef]
- Saji, M.; Tobaru, T.; Higuchi, R.; Hagiya, K.; Takamisawa, I.; Shimizu, J.; Iguchi, N.; Takanashi, S.; Takayama, M.; Isobe, M. Cognitive assessment using the revised Hasegawa's dementia scale to determine the mid-term outcomes following transcatheter aortic valve replacement. J. Cardiol. 2019, 74, 206–211. [Google Scholar] [CrossRef] [PubMed]
- Okoh, A.K.; Chauhan, D.; Kang, N.; Haik, N.; Merlo, A.; Cohen, M.; Haik, B.; Chen, C.; Russo, M.J. The impact of frailty status on clinical and functional outcomes after transcatheter aortic valve replacement in nonagenarians with severe aortic stenosis. Catheter. Cardiovasc. Interv. 2017, 90, 1000–1006. [Google Scholar] [CrossRef]
- Okoh, A.K.; Kang, N.; Haik, N.; Fugar, S.; Chunguang, C.; Bruce, H.; Cohen, M.; Russo, M.J. Clinical and functional outcomes associated with age after transapical transcatheter aortic valve replacement. Innov. Technol. Tech. Cardiothorac. Vasc. Surg. 2019, 14, 151–158. [Google Scholar] [CrossRef]
- Huded, C.P.; Huded, J.M.; Friedman, J.L.; Benck, L.R.; Lindquist, L.; Holly, T.A.; Sweis, R.N.; Ricciardi, M.J.; Malaisrie, S.C.; Davidson, C.J.; et al. Frailty status and outcomes after transcatheter aortic valve implantation. Am. J. Cardiol. 2016, 117, 1966–1971. [Google Scholar] [CrossRef] [PubMed]
- Rogers, T.; Alraies, M.C.; Pacha, H.M.; Bond, E.; Buchanan, K.D.; Steinvil, A.; Gai, J.; Torguson, R.; Ben-Dor, I.; Satler, L.F.; et al. Clinical frailty as an outcome predictor after transcatheter aortic valve implantation. Am. J. Cardiol. 2018, 121, 850–855. [Google Scholar] [CrossRef] [PubMed]
- Shi, S.; Afilalo, J.; Lipsitz, L.A.; Popma, J.J.; Khabbaz, K.R.; Laham, R.J.; Guibone, K.; Grodstein, F.; Lux, E.; Kim, D.H. Frailty phenotype and deficit accumulation frailty index in predicting recovery after transcatheter and surgical aortic valve replacement. J. Gerontol. Ser. A Boil. Sci. Med. Sci. 2018, 74, 1249–1256. [Google Scholar] [CrossRef]
- Ewe, S.H.; Marsan, N.A.; Pepi, M.; Delgado, V.; Tamborini, G.; Muratori, M.; Ng, A.; van der Kley, F.; de Weger, A.; Schalij, M.J.; et al. Impact of left ventricular systolic function on clinical and echocardiographic outcomes following transcatheter aortic valve implantation for severe aortic stenosis. Am. Heart J. 2010, 160, 1113–1120. [Google Scholar] [CrossRef] [PubMed]
- Abramowitz, Y.; Chakravarty, T.; Jilaihawi, H.; Cox, J.; Sharma, R.P.; Mangat, G.; Nakamura, M.; Cheng, W.; Makkar, R.R. Impact of body mass index on the outcomes following transcatheter aortic valve implantation. Catheter. Cardiovasc. Interv. 2016, 88, 127–134. [Google Scholar] [CrossRef]
- Drudi, L.M.; Ades, M.; Asgar, A.; Perrault, L.; Lauck, S.; Webb, J.G.; Rassi, A.; Lamy, A.; Noiseux, N.; Peterson, M.D.; et al. Interaction between frailty and access site in older adults undergoing transcatheter aortic valve replacement. JACC Cardiovasc. Interv. 2018, 11, 2185–2192. [Google Scholar] [CrossRef]
- Pighi, M.; Piazza, N.; Martucci, G.; Lachapelle, K.; Perrault, L.P.; Asgar, A.W.; Lauck, S.; Webb, J.G.; Popma, J.J.; Kim, D.H.; et al. Sex-specific determinants of outcomes after transcatheter aortic valve replacement. Circ. Cardiovasc. Qual. Outcomes 2019, 12, e005363. [Google Scholar] [CrossRef]
- Skaar, E.; Eide, L.S.P.; Norekvål, T.M.; Ranhoff, A.H.; Nordrehaug, J.E.; Forman, D.E.; Schoenenberger, A.W.; Hufthammer, K.O.; Kuiper, K.K.-J.; Bleie, O.; et al. A novel geriatric assessment frailty score predicts 2-year mortality after transcatheter aortic valve implantation. Eur. Heart J.-Qual. Care Clin. Outcomes 2018, 5, 153–160. [Google Scholar] [CrossRef] [PubMed]
- Katz, S.; Ford, A.B.; Moskowitz, R.W.; Jackson, B.A.; Jaffe, M.W. Studies of illness in the aged: The index of ADL: A standardized measure of biological and psychological function. JAMA 1963, 185, 914–919. [Google Scholar] [CrossRef]
- Lawton, M.P.; Brody, A.E.M. Assessment of older people: Self-maintaining and instrumental activities of daily living. Gerontology 1969, 9, 179–186. [Google Scholar] [CrossRef] [Green Version]
- Folstein, M.F.; Folstein, S.E.; McHugh, P.R. Mini-mental state: A practical method for grading the cognitive state of patients for the clinician. J. Psychiatr. Res. 1975, 12, 189–198. [Google Scholar] [CrossRef]
- Rockwood, K.; Song, X.; MacKnight, C.; Bergman, H.; Hogan, D.B.; McDowell, I.; Mitnitski, A. A global clinical measure of fitness and frailty in elderly people. Can. Med. Assoc. J. 2005, 173, 489–495. [Google Scholar] [CrossRef] [PubMed] [Green Version]
- Jerome, G.J.; Ko, S.-U.; Kauffman, D.; Studenski, S.A.; Ferrucci, L.; Simonsick, E.M. Gait characteristics associated with walking speed decline in older adults: Results from the Baltimore longitudinal study of aging. Arch. Gerontol. Geriatr. 2015, 60, 239–243. [Google Scholar] [CrossRef] [Green Version]
- Castell, V.; Sánchez, M.; Julián, R.; Queipo, R.; Martín, S.; Otero, A. Frailty prevalence and slow walking speed in persons age 65 and older: Implications for primary care. BMC Fam. Pr. 2013, 14, 86. [Google Scholar] [CrossRef] [Green Version]
- Binotto, M.A.; Lenardt, M.H.; Rodríguez-Martínez, M.D.C. Fragilidade física e velocidade da marcha em idosos da comunidade: Uma revisão sistemática. Rev. Esc. Enferm. USP 2018, 52, e03392. [Google Scholar] [CrossRef] [PubMed] [Green Version]
- Phillips, A.; Shaper, A.G.; Whincup, P. Association between serum albumin and mortality from cardiovascular disease, cancer, and other causes. Lancet 1989, 334, 1434–1436. [Google Scholar] [CrossRef]
- Al-Kassou, B.; Shamekhi, J.; Weber, M.; Germeroth, J.; Gillrath, J.; Feldmann, K.; Sedaghat, A.; Werner, N.; Treede, H.; Becher, M.U.; et al. Frailty, malnutrition, and the endocrine system impact outcome in patients undergoing aortic valve replacement. Catheter. Cardiovasc. Interv. 2021, 1–13. [Google Scholar] [CrossRef]
- Dent, E.; Morley, J.E.; Cruz-Jentoft, A.J.; Woodhouse, L.; Rodríguez-Mañas, L.; Fried, L.P.; Woo, J.; Aprahamian, I.; Sanford, A.; Lundy, J.; et al. Physical frailty: ICFSR international clinical practice guidelines for identification and management. J. Nutr. Health Aging 2019, 23, 771–787. [Google Scholar] [CrossRef] [Green Version]
- Fried, L.P.; Tangen, C.M.; Walston, J.D.; Newman, A.B.; Hirsch, C.; Gottdiener, J.S.; Seeman, T.E.; Tracy, R.P.; Kop, W.J.; Burke, G.L.; et al. Frailty in older adults: Evidence for a phenotype. J. Gerontol. Ser. A Boil. Sci. Med. Sci. 2001, 56, M146–M157. [Google Scholar] [CrossRef]
- Mitnitski, A.B.; Mogilner, A.J.; Rockwood, K. Accumulation of deficits as a proxy measure of aging. Sci. World J. 2001, 1, 323–336. [Google Scholar] [CrossRef] [Green Version]
- Studenski, S.; Perera, S.; Wallace, D.; Chandler, J.M.; Duncan, P.; Rooney, E.; Fox, M.; Guralnik, J.M. Physical performance measures in the clinical setting. J. Am. Geriatr. Soc. 2003, 51, 314–322. [Google Scholar] [CrossRef] [Green Version]
- Guralnik, J.M.; Ferrucci, L.; Pieper, C.F.; Leveille, S.G.; Markides, K.S.; Ostir, G.V.; Studenski, S.; Berkman, L.F.; Wallace, R.B. Lower extremity function and subsequent disability: Consistency across studies, predictive models, and value of gait speed alone compared with the short physical performance battery. J. Gerontol. Ser. A Boil. Sci. Med. Sci. 2000, 55, M221–M231. [Google Scholar] [CrossRef] [Green Version]
- Boreskie, K.F.; Hay, J.L.; Kehler, D.S.; Johnston, N.M.; Rose, A.V.; Oldfield, C.J.; Kumar, K.; Toleva, O.; Arora, R.C.; Duhamel, T.A. Prehabilitation. Clin. Geriatr. Med. 2019, 35, 571–585. [Google Scholar] [CrossRef]


| Number of Studies and Assessment Type (Frailty Cut-Off) | Time Frame of Mortality Assesment | Predictive of Mortality Risk | ||
|---|---|---|---|---|
| Predictive | Not Predictive | |||
| Single Markers of Frailty | ||||
| 23 | Gait Speed (5-mWT; ≥6 s/6 MWT; unable/slow walker) | Short-term Intermediate Long-term | 4 (44,773) [17,18,19,20] - 11 (41,376) [19,21,22,23,24,25,26,27,28,29,30] | 6 (27,581) [21,31,32,33,34,35] 1 (232) [36] 5 (5206) [18,34,37,38,39] |
| 16 | Serum albumin (≤3.5 g/dL) | Short-term Long-term | 5 (42,330) [18,19,21,34,40] 13 (48,844) [19,21,22,23,34,35,39,40,41,42,43,44,45,46] | 1 (431) [35] 2 (605) [18,38] |
| 15 | ADL (Katz-index; ≥1 impaired activity) | Short-term Intermediate Long-term | 4 (9624) [18,47,48,49] 2 (2740) [48,50] 6 (1405) [18,23,24,25,26,47] | 3 (1023) [21,51,52] - 8 (5195) [21,38,39,48,50,51,52,53] |
| 11 | Handgrip strength (BMI normalized/sex stratified) | Short-term Long-term | - 5 (1105) [18,23,24,25,26] | 5 (5974) [18,21,32,34,51] 4 (4588) [21,34,38,39] |
| 9 | IADL (Lawton-index; ≥1 impaired activity) | Short-term Intermediate Long-term | - 1 (116) [50] 2 (329) [50,51] | 3 (402) [9,33,51] 2 (269) [14,54] 4 (1285) [9,12,22,55] |
| 9 | MMSE (score ≥ 27/30) | Short-term Intermediate Long-term | 1 (100) [9] 1 (119) [14] 2 (430) [9,55] | 2 (302) [33,51] 1 (150) [54] 4 (2610) [12,22,40,51] |
| 9 | PMAi (CT-scan; tertile BSA normalized/sex stratified) | Short-term Intermediate Long-term | 1 (1076) [56] 1 (232) [36] 6 (2804) [25,45,56,57,58,59] | 1 (583) [57] - 2 (1883) [44,60] |
| 7 | TUG (≥20 s) | Short-term Intermediate Long-term | 1 (100) [9] 1 (119) [14] 3 (774) [9,12,55] | 2 (302) [33,51] 1 (150) [54] 1 (213) [51] |
| Number of Studies and Assessment Type (Frailty Cut-Off) | Time Frame of Mortality Assessment | Predictive of Mortality Risk | ||
|---|---|---|---|---|
| Predictive | Not Predictive | |||
| Multidimensional Frailty Scales | ||||
| 9 | CFS (score ≥ 5/9) | Short-term Long-term | 2 (2757) [32,40] 4 (3557) [13,40,61,62] | 1 (1020) [13] 4 (2099) [37,63,64,65] |
| 6 | CSHA (score ≥ 5/7) | Short-term Intermediate Long-term | 1 (6339) [49] - 4 (3026) [24,25,26,48] | 2 (2936) [48,52] 1 (2624) [48] 1 (312) [52] |
| Composite indices | ||||
| 7 | 4 items (score ≥ 3/4; gait speed, serum albumin, handgrip strength, ADL) | Short-term Long-term | 3 (1254) [13,39,66] 6 (1957) [13,23,38,39,66,67] | 2 (533) [23,68] - |
| 6 | 5 items (score ≥ 3/5; gait speed, handgrip strength, exhaustion, low physical activity, unintentional weight loss) | Short-term Intermediate Long-term | 3 (2062) [13,21,69] 1 (137) [70] 5 (3014) [13,21,69,71,72] | - - - |
| 5 | EFT (score ≥ 3/5; chair rise test, MMSE, serum albumin, hemoglobin) | Short-term Long-term | 3 (2502) [13,73,74] 4 (3257) [13,37,73,74] | - 1 (142) [75] |
| 5 | Bern scale (score ≥ 3/7; MMSE, MNA, TUG, BADL, IADL, pre-clinical mobility disability) | Short-term Intermediate Long-term | 2 (1120) [9,13] 1 (119) [14] 3 (1450) [9,13,55] | - - 1 (344) [12] |
| Assessment Type and Authors | Frailty Cut-Off (n.s.: Not Specified) | Mortality | ||
|---|---|---|---|---|
| Short-Term | Intermediate | Long-Term | ||
| Gait speed: 5-mWT or 6MWT | ||||
| Afilalo et al., 2010 [17] | ≥6 s | OR 3.17 (95% CI 1.17–8.59) | ||
| Chauhan et al., 2016 [23] | HR 2.62 (95% CI 1.25–5.52) | |||
| Dziewierz et al., 2017 [26] | HR 14.71 (95% CI 6.50–33.30) | |||
| Forcillo et al., 2017 [18] | predictive | OR 0.45; p = 0.06 | ||
| Hermiller et al., 2016 [34] | not predictive | HR 1.42 (95% CI 1.06–1.91) | ||
| Kiani et al., 2020 [19] | dichotomous ≤ 0.83: HR 1.21 (95% CI 1.00–1.47) | dichotomous ≤ 0.83; HR 1.36 (95% CI 1.23–1.50) | ||
| Kleczynski et al., 2017 [24] | linear: HR 2.83 (95% CI 2.01–3.98) dichotomous: HR 124.12 (95% CI 21.92–702.72) | |||
| Patel et al., 2019 [35] | OR 2.21 (95% CI 0.63–7.74) | |||
| Sathananthan et al., 2019 [37] | OR 0.78 (95% CI 0.35–1.72) | |||
| A.J. Altisent et al., 2017 [28] | unable/slow/fast | slow walker: HR 2.30 (95% CI 1.35–3.93) | ||
| Green et al., 2013 [27] | unable: HR 1.85 (95% CI 1.26–2.72) | |||
| Alfredsson et al., 2016 [20] | per 0.2 m/s decrease: OR 1.16 (95% CI 1.06–1.28) | |||
| Steinvil et al., 2018 [21] | dichotomous: OR 1.74 (95% CI 0.36–8.50) | dichotomous: OR 2.34 (95% CI 1.03–5.32) | ||
| Kano et al., 2017 [30] | dichotomous: OR 2.01 (95% CI 1.20–3.38) | |||
| van der Wulp et al., 2020 [22] | ≤0.8 m/s | HR 2.5 (95% CI 1.4–4.5) | ||
| Green et al., 2015 [38] | per unit decrease: HR 1.37 (95% CI 0.53–3.45) | |||
| Green et al., 2012 [39] | each quartile: HR 1.19 (95% CI 0.82–1.66) | |||
| Assmann et al., 2016 [33] | 0.75 m/s | HR 0.11 (95% CI 0.10–1.43) | ||
| Saji et al., 2016 [36] | 0.5 m/s | dichotomous: not predictive; p = 0.174 | ||
| Dvir et al., 2013 [29] | <50 m | <50m: HR 1.69 (95% CI 1.28–2.47) | ||
| Arnold te al. 2018 [31] | unable/quartile | linear: OR 0.95 (95% CI 0.89–1.02); dichotomous: OR 1.27 (95% CI 1.02–1.58) | ||
| Shimura et al., 2017 [32] | n.s. | not predictive | ||
| Serum albumin | ||||
| Bogdan et al., 2016 [42] | ≤3.5 g/dL | baseline low level: HR 2.02 (95% CI 1.04–3.91) | ||
| Berkovitch et al., 2020 [43] | low level: HR 1.92 (95% CI 1.09–3.38) | |||
| Chauhan et al., 2016 [23] | HR 3.12 (95% CI 1.80–5.42) | |||
| Green et al., 2015 [38] | per unit decrease: HR 1.25 (95% CI 0.88–1.79) | |||
| Green et al., 2012 [39] | HR 1.51 (95% CI 1.03–2.21) | |||
| Kiani et al., 2020 [19] | dichotomous: HR 1.29 (95% CI 1.12–1.48) | dichotomous: HR 1.50 (95% CI 1.40–1.60) | ||
| Michel et al., 2019 [44] | dicohtomous: HR 2.10 (95% CI 1.53–2.87) | |||
| Patel et al., 2019 [35] | not predictive | |||
| Shimura et al., 2018 [40] | HR 2.36 (95% CI 1.64–3.40) | not predictive | ||
| Steinvil et al., 2018 [21] | dichotomous: OR 8.21 (95% CI 1.04–64.70) | dichotomous: OR 2.21 (95% CI 1.12–4.37) | ||
| van der Wulp et al., 2020 [22] | HR 2.30 (95% CI 1.30–4.00) | |||
| Hermiller et al., 2016 [34] | ≤3.3 g/dL | dichotomous: HR 1.60 (95% CI 1.04–2.47) | dichotomous: HR 1.40 (95% CI 1.04–1.91) | |
| Forcillo et al., 2017 [18] | ≤3.4 g/dL | per 1g/dL decrease: OR 0.26; p = 0.02 | not predictive; OR 0.53; p = 0.07 | |
| Grossman et al., 2017 [41] | ≤4.0 g/dL | per 0.5 g/dL decrease: HR 3.03 (95% CI 1.66–5.26) | ||
| Krishnan et al., 2019 [45] | n.s. | higher level: HR 0.30 (95% CI 0.20–0.50) | ||
| ADL—Katz-index | ||||
| Cockburn et al., 2015 [52] | score < 6/6 | OR 1.07 (95% CI 0.64–1.77) | HR 0.86 (95% CI 0.71–1.05) | |
| Dziewierz et al., 2017 [26] | dichotomous; HR 13.92 (95% CI 6.29–30.79) | |||
| Green et al., 2015 [38] | HR 1.59 (95% CI 0.93–2.70) | |||
| Green et al., 2012 [39] | HR: 2.13 (95% CI 0.97–4.71) | |||
| Kleczynski et al., 2017 [24] | per point decrease: HR 6.06 (95% CI 3.15–11.64) dichotomous: HR 20.06 (95% CI 6.93–58.02) | |||
| Kleczynski et al., 2018 [25] | predictive | |||
| Martin et al., 2017 [49] | per point drop: OR 1.27 (95% CI 1.11–1.44) | |||
| Martin et al., 2018 [48] | OR 2.10 (95% CI 1.39–3.15) | HR 1.74 (95% CI 1.19–2.55) | HR 1.23 (95% CI 0.86–1.75) | |
| Puls et al., 2014 [47] | HR 3.05 (95% CI 1.40–5.70) | higher score: HR 2.50 (95% CI 1.60–3.90) | ||
| Forcillo et al., 2017 [18] | score ≤ 4/6 | not predictive | OR 0.80; p = 0.04 | |
| Steinvil et al., 2018 [21] | OR 2.43 (95% CI 0.58–10.20) | OR 1.43 (95% CI 0.59–3.45) | ||
| Goudzwaard et al., 2018 [51] | not predictive | linear: HR 1.50 (95% CI 1.21–1.90) dichotomous: HR 1.80 (95% CI 0.85–3.70) | ||
| Bureau et al., 2017 [50] | score < 5/6 | predictive | not predictive | |
| Chauhan et al., 2016 [23] | HR 2.45 (95% CI 1.42–4.22) | |||
| Szekely et al., 2019 [53] | n.s. | not predictive | ||
| Handgrip strength | ||||
| Chauhan et al., 2016 [23] | BMI/sex | HR 3.31 (95% CI 1.01–10.85) | ||
| Forcillo et al., 2017 [18] | not predictive | predictive | ||
| Green et al., 2015 [38] | HR 1.02 (95% CI 0.99–1.05) | |||
| Green et al., 2012 [39] | HR 1.18 (95% CI 0.84–1.66) | |||
| Goudzwaard et al., 2018 [51] | not predictive | |||
| Hermiller et al., 2016 [34] | not predictive | not predictive | ||
| Steinvil et al., 2018 [21] | dichotomous: OR 2.24 (95% CI 0.28–17.80) | dichotomous: OR 1.63 (95% CI 0.66–4.06) | ||
| Dziewierz et al., 2017 [26] | weak/mild/strong | HR 28.84 (95% CI 10.54–78.87) | ||
| Kleczynski et al., 2017 [24] | HR 37.93 (95% CI 10.63–135.35) | |||
| Kleczynski et al., 2018 [25] | predictive | |||
| Shimura et al., 2017 [32] | n.s. | not predictive | ||
| IADL—Lawton index | ||||
| Assmann et al., 2016 [33] | score < 8/8 | HR 0.92 (95% CI 0.71–1.20) | ||
| Boureau et al., 2017 [54] | not predictive | |||
| Bureau et al., 2017 [50] | predictive (p = 0.065) | predictive (p = 0.0061) | ||
| Eichler et al., 2017 [12] | not predictive | |||
| Goudzwaard et al., 2018 [51] | not predictive | linear: HR 1.20 (95% CI 1.07–1.33) dichotomous: HR 2.30 (95% CI 1.06–4.90) | ||
| Schoenenberger et al., 2018 [55] | HR 1.23 (95% CI 0.67–2.28) | |||
| Schoenenberger et al., 2012 [14] | linear: OR 1.46 (95% CI 1.13–1.89) dichotom: OR 2.19 (95% CI 0.91–5.27) | |||
| Stortecky et al., 2012 [9] | linear: OR 1.39 (95% CI 0.91–2.11) dichotom: OR 1.19 (95% CI 0.27–5.31) | linear: OR 1.25 (95% CI 0.92–1.70) dichotomous: OR 1.52 (95% CI 0.92–9.83) | ||
| van der Wulp et al., 2020 [22] | HR 1.50 (95% CI 0.90–2.30) | |||
| Mini-Mental State Examination (MMSE) | ||||
| Assmann et al., 2016 [33] | score < 27/30 | HR 0.98 (95% CI 0.77–1.25) | ||
| Boureau et al., 2017 [54] | HR 1.02 (95% CI 0.82–1.26) | |||
| Eichler et al., 2017 [12] | not predictive | |||
| Goudzwaard et al., 2018 [51] | not predictive | dichotomous: HR 1.60 (95% CI 0.76–3.22) | ||
| Schoenenberger et al., 2018 [55] | dichotomous: HR 2.35 (95% CI 1.33–4.14) | |||
| Schoenenberger et al., 2012 [14] | linear: OR 2.64 (95% CI 1.55–4.50) dichotomous: OR 3.18 (95% CI 1.38–7.29) | |||
| Shimura et al., 2018 [40] | not predictive | |||
| Stortecky et al., 2012 [9] | linear: OR 2.85 (95% CI 1.35–6.17) dichotomous: OR 7.62 (95% CI 1.44–40.19) | linear: OR 2.72 (95% CI 1.40–5.31) dichotomous: OR 2.98 (95% CI 1.07–8.31) | ||
| van der Wulp et al., 2020 [22] | not predictive | |||
| Psoas muscle area index (PMAi) | ||||
| Mamane et al., 2015 [58] | tertile/sex | female: HR 0.88 (95% CI 0.78–0.99) | ||
| Kleczynski et al., 2018 [25] | predictive | |||
| Kofler et al., 2018 [56] | L3: OR 0.082 (95% CI 0.011–0.589) L4: OR 0.049 (95% CI 0.005–0.536) | L3: OR 0.200 (95% CI 0.083–0.482) L4: OR 0.083 (95% CI 0.029–0.235) | ||
| Saji et al., 2016 [36] | HR 1.53 (95% CI 1.06–2.21) | |||
| van Mourik et al., 2018 [57] | HR 0.32 (95% CI 0.05–1.91) | female mid-PMA: HR 0.14 (95% CI 0.05–0.45) female high PMA: HR 0.38 (95% CI 0.16–0.99) | ||
| Garg et al., 2016 [60] | 2 groups (cut-off/sex) | not predictive | ||
| Krishnan et al., 2019 [45] | HR 2.50 (95% CI 1.10–4.60) | |||
| Foldyna et al., 2018 [59] | quartile/sex | HR 1.90 (95% CI 1.35–2.68) | ||
| Michel et al., 2019 [44] | not predictive | |||
| Timed Up-and-Go test (TUG) | ||||
| Boureau et al., 2017 [54] | ≥20 sec | dichotomous: OR 0.39 (95%CI 0.11–1.41) | ||
| Eichler et al., 2017 [12] | dichotomous: OR 5.12 (95% CI 1.64–16.01) | |||
| Goudzwaard et al., 2018 [51] | not predictive | linear: HR 1.10 (95% CI 1.02–1.09) dichotomous: HR 1.80 (95% CI 0.77–4.18) | ||
| Schoenenberger et al., 2018 [55] | dichotomous: HR 3.41 (95% CI 1.95–5.97) | |||
| Schoenenberger et al., 2012 [14] | linear: OR 1.64 (95% CI 1.26–2.12) dichotom: OR 4.23 (95% CI 1.83–9.77) | |||
| Stortecky et al., 2012 [9] | linear: OR 1.83 (95% CI 1.10–3.05) dichotomous: OR 13.77 (95% CI 1.62–111.01) | linear: OR 1.74 (95% CI 1.24–2.45) dichotomous: OR 6.65 (95% CI 2.15–20.52) | ||
| Assmann et al., 2016 [33] | ≤12.5 sec | HR 1.04 (95% CI 0.94-1.16) | ||
| Clinical Frailty Scale (CFS) | ||||
| Miura et al., 2017 [63] | score ≥ 4/9 | HR 1.84 (95% CI 0.45–7.55) | ||
| Yokoyama et al., 2019 [64] | HR 1.03 (95% CI 0.60–1.86) | |||
| Afilalo et al., 2017 [13] | score ≥ 5/9 | dichotomous: OR 1.87 (95% CI 0.99–3.53) | dichotomous: OR 2.40 (95% CI 1.63–3.52) | |
| Sathananthan et al., 2019 [37] | not predictive | |||
| Seiffert et al., 2014 [62] | score ≥ 6/9 | per SD increase: HR 1.31 (95% CI 1.13–1.52) | ||
| Shimura et al., 2017 [32] | 5 classes | HR 1.42 (95% CI 1.04–1.95) | per class increment: HR 1.28 (95% CI 1.10–1.49) | |
| Honda et al., 2019 [61] | n.s. | HR 1.44 (95% CI 1.04–1.99) | ||
| Shimura et al., 2018 [40] | per point increase: HR 1.17 (95% CI 1.01–1.35) | |||
| Canadian Study of Health Aging scale (CSHA) | ||||
| Martin et al., 2018 [48] | score ≥ 5/7 | OR 1.46 (95% CI 0.96–2.23) | HR 1.37 (95% CI 0.94–2.01) | HR 1.61 (95% CI 1.14–2.29) |
| Dziewierz et al., 2017 [26] | score > 5: HR 39.10 (95% CI 15.85–96.46) | |||
| Kleczynski et al., 2018 [25] | 4 classes | predictive | ||
| Kleczynski et al., 2017 [24] | per point increase: HR 3.82 (95% CI 2.46–5.94) dichotomous: HR 64.65 (95% CI 17.35–240.94) | |||
| Cockburn et al., 2015 [52] | n.s. | OR 0.99 (95% CI 0.63–1.57) | not predictive | |
| Martin et al., 2017 [49] | not predictive | |||
| 4 items composite index | ||||
| Afilalo et al., 2017 [13] | score ≥ 3/4 | dichotomous: OR 2.65 (95% CI 1.28–5.49) | dichotomous: OR 3.04 (95% CI 1.98–4.66) | |
| Huded et al., 2016 [68] | not predictive | |||
| Okoh et al., 2017 [66] | higher score: HR 1.65 (95% CI 1.01–2.66) | score 4/4: HR 1.84 (95% CI 1.06–3.17) | ||
| Okoh et al., 2019 [67] | HR 1.84 (95% CI 1.23–2.69) | |||
| Green et al., 2015 [38] | score ≥ 5–6/12 | linear: HR 1.12 (95% CI 1.02–1.22) dichotomous: HR 2.18 (95% CI 1.27–3.75) | ||
| Green et al., 2012 [39] | OR 2.20 (95% CI 1.02–4.60) | linear: HR 1.15 (95% CI 1.02–1.30) dichotomous: predictive tertile: HR 1.71 (95% CI 1.01–2.89) | ||
| Chauhan et al., 2016 [23] | n.s. | not predictive | score ≤ 2: HR 2.00 (95% CI 0.85–4.71) score 3: HR 3.05 (95% CI 1.24–7.46) score 4: HR 8.56 (95% CI 3.38–21.67) | |
| 5 items composite index | ||||
| Afilalo et al., 2017 [13] | score ≥ 3/5 | dichotomous: OR 1.45 (95% CI 0.77–2.72) | dichotomous: OR 1.63 (95% CI 1.12–2.37) | |
| Ewe et al., 2010 [71] | HR 4.20 (95% CI 2.00–8.84) | |||
| Rogers et al., 2018 [69] | dichotomous: OR 5.06 (95% CI 1.36–18.80) | dichotomous: OR 2.75 (95% CI 1.55–4.87) | ||
| Shi et al., 2018 [70] | OR 2.20 (95% CI 0.20–8.00) | |||
| Steinvil et al., 2018 [21] | higher score: OR 15.30 (95% CI 2.71–86.10) | score ≥3: OR 2.23 (95% CI 1.14–4.34) | ||
| Abramowitz et al., 2016 [72] | n.s. | HR 2.04 (95% CI 1.31–3.20) | ||
| Elderly Frailty Toolset (EFT) | ||||
| Afilalo et al., 2017 [13] | score ≥ 3/5 | dichotomous: OR 3.29 (95% CI 1.73–6.26) | dichotomous: OR 3.72 (95% CI 2.54–5.45) | |
| Drudi et al., 2018 [73] | dichotomous: OR 3.50 (95% CI 1.74–7.07) | dichotomous: OR 3.33 (95% CI 2.21–5.04) | ||
| Pighi et al., 2019 [74] | per point increase: OR 1.27 (95% CI 1.07–1.50) | dichotomous: OR 1.83 (95% CI 1.33–2.50) | ||
| Sathananthan et al., 2019 [37] | per point increase: OR 1.72 (95% CI 1.39–2.14) | |||
| Skaar et al., 2018 [75] | HR 1.36 (95% CI 0.87–2.21) | |||
| Bern scale | ||||
| Afilalo et al., 2017 [13] | score ≥ 3/7 | dichotomous: OR 3.29 (95% CI 1.53–7.07) | dichotomous: OR 2.57 (95% CI 1.69–3.91) | |
| Eichler et al., 2017 [12] | not predictive | |||
| Schoenenberger et al., 2018 [55] | per IQR increase of 3 points: HR 3.29 (95% CI 1.98–3.91) | |||
| Schoenenberger et al., 2012 [14] | linear: OR 1.73 (95% CI 1.36–2.20) dichotomous: OR 1.69 (95% CI 1.32–2.16) | |||
| Stortecky et al., 2012 [9] | per point increase; OR 2.18 (95% CI 1.32–3.61) dichotomous: OR 8.33 (95% CI 0.99–70.48) | per point increase: OR 1.80 (95% CI 1.31–2.47) dichotomous: OR 3.68 (95% CI 1.21–11.19) | ||
Publisher’s Note: MDPI stays neutral with regard to jurisdictional claims in published maps and institutional affiliations. |
© 2021 by the authors. Licensee MDPI, Basel, Switzerland. This article is an open access article distributed under the terms and conditions of the Creative Commons Attribution (CC BY) license (https://creativecommons.org/licenses/by/4.0/).
Share and Cite
Baritello, O.; Salzwedel, A.; Sündermann, S.H.; Niebauer, J.; Völler, H. The Pandora’s Box of Frailty Assessments: Which Is the Best for Clinical Purposes in TAVI Patients? A Critical Review. J. Clin. Med. 2021, 10, 4506. https://doi.org/10.3390/jcm10194506
Baritello O, Salzwedel A, Sündermann SH, Niebauer J, Völler H. The Pandora’s Box of Frailty Assessments: Which Is the Best for Clinical Purposes in TAVI Patients? A Critical Review. Journal of Clinical Medicine. 2021; 10(19):4506. https://doi.org/10.3390/jcm10194506
Chicago/Turabian StyleBaritello, Omar, Annett Salzwedel, Simon H. Sündermann, Josef Niebauer, and Heinz Völler. 2021. "The Pandora’s Box of Frailty Assessments: Which Is the Best for Clinical Purposes in TAVI Patients? A Critical Review" Journal of Clinical Medicine 10, no. 19: 4506. https://doi.org/10.3390/jcm10194506