
Diffusion-Weighted Imaging and Mapping of T1 and T2 Relaxation Time for Evaluation of Chronic Renal Allograft Rejection in a Translational Mouse Model

 , ,
, ,
Abstract
:1. Introduction
2. Materials and Methods
2.1. Animals
2.2. Kidney Transplantation in Mice
2.3. Functional MRI for Assessment of Renal Allograft Pathophysiology
2.4. Histology and Immunohistochemistry for Assessment of Renal Allograft Morphology
2.5. Statistical Analysis
3. Results
3.1. Characterization of Tissue Composition in Kidney Grafts by Mapping of T1 and T2 Relaxation Times with fMRI
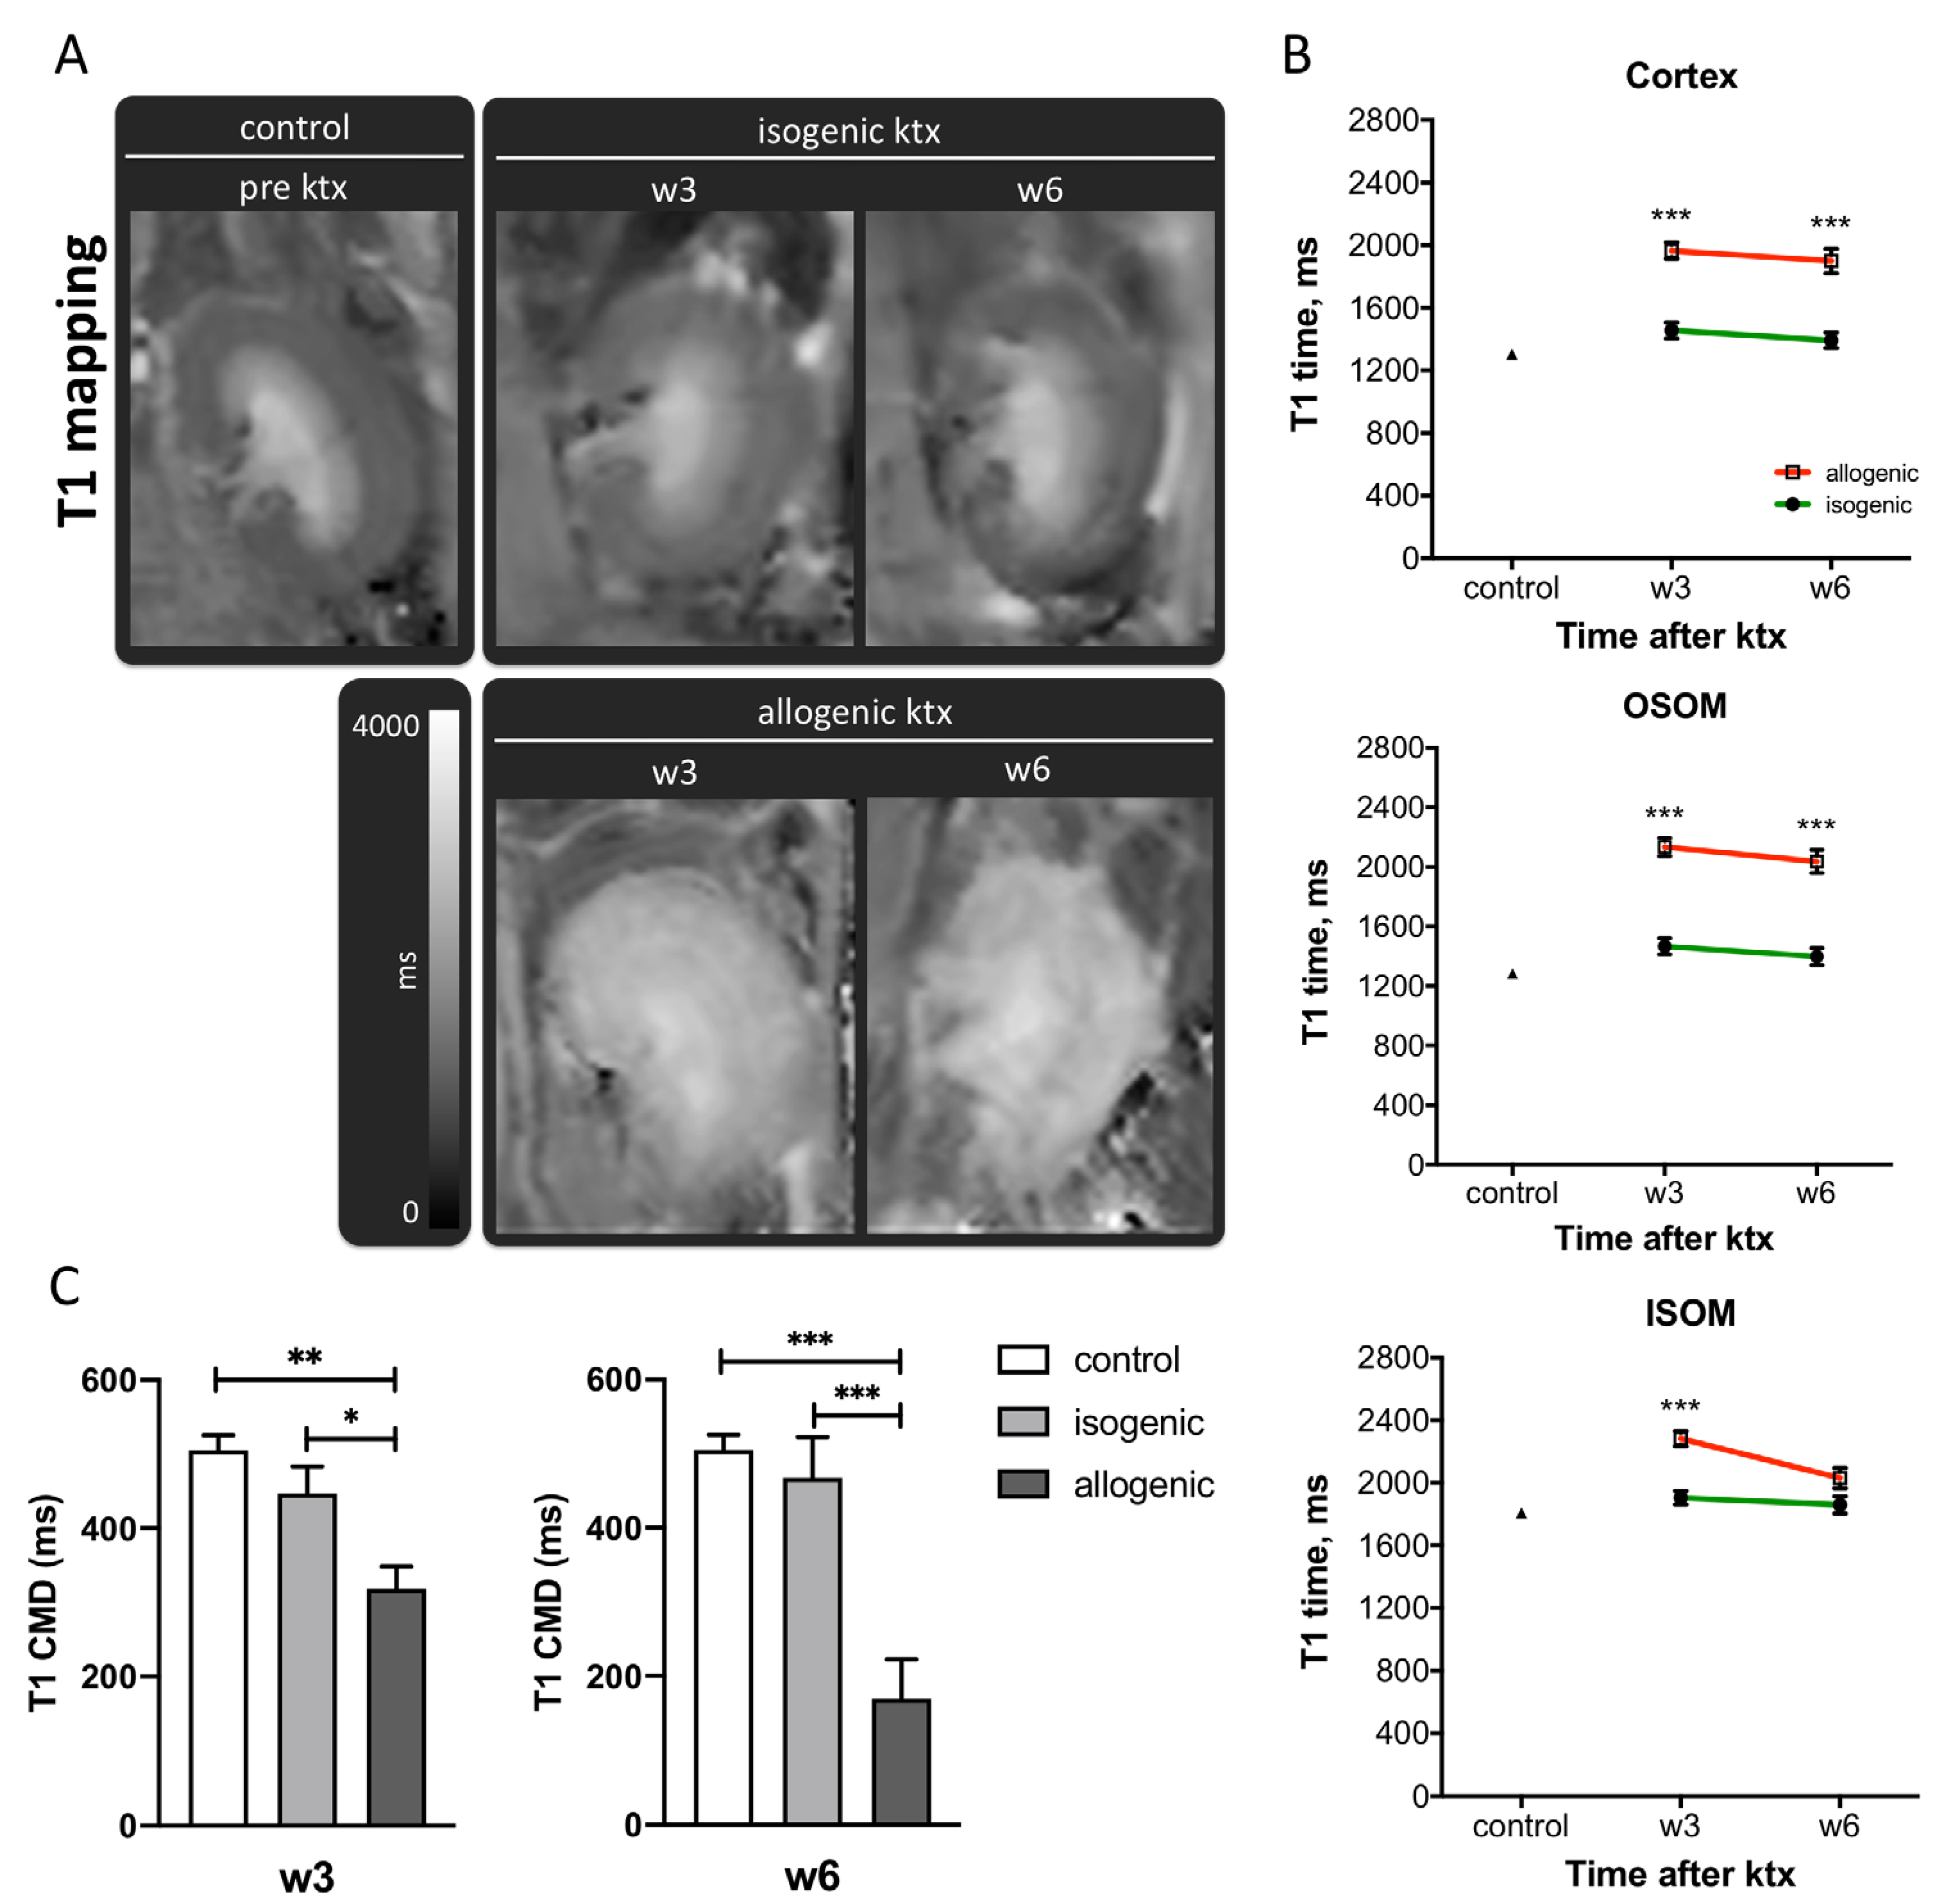
3.1.1. T1-Mapping
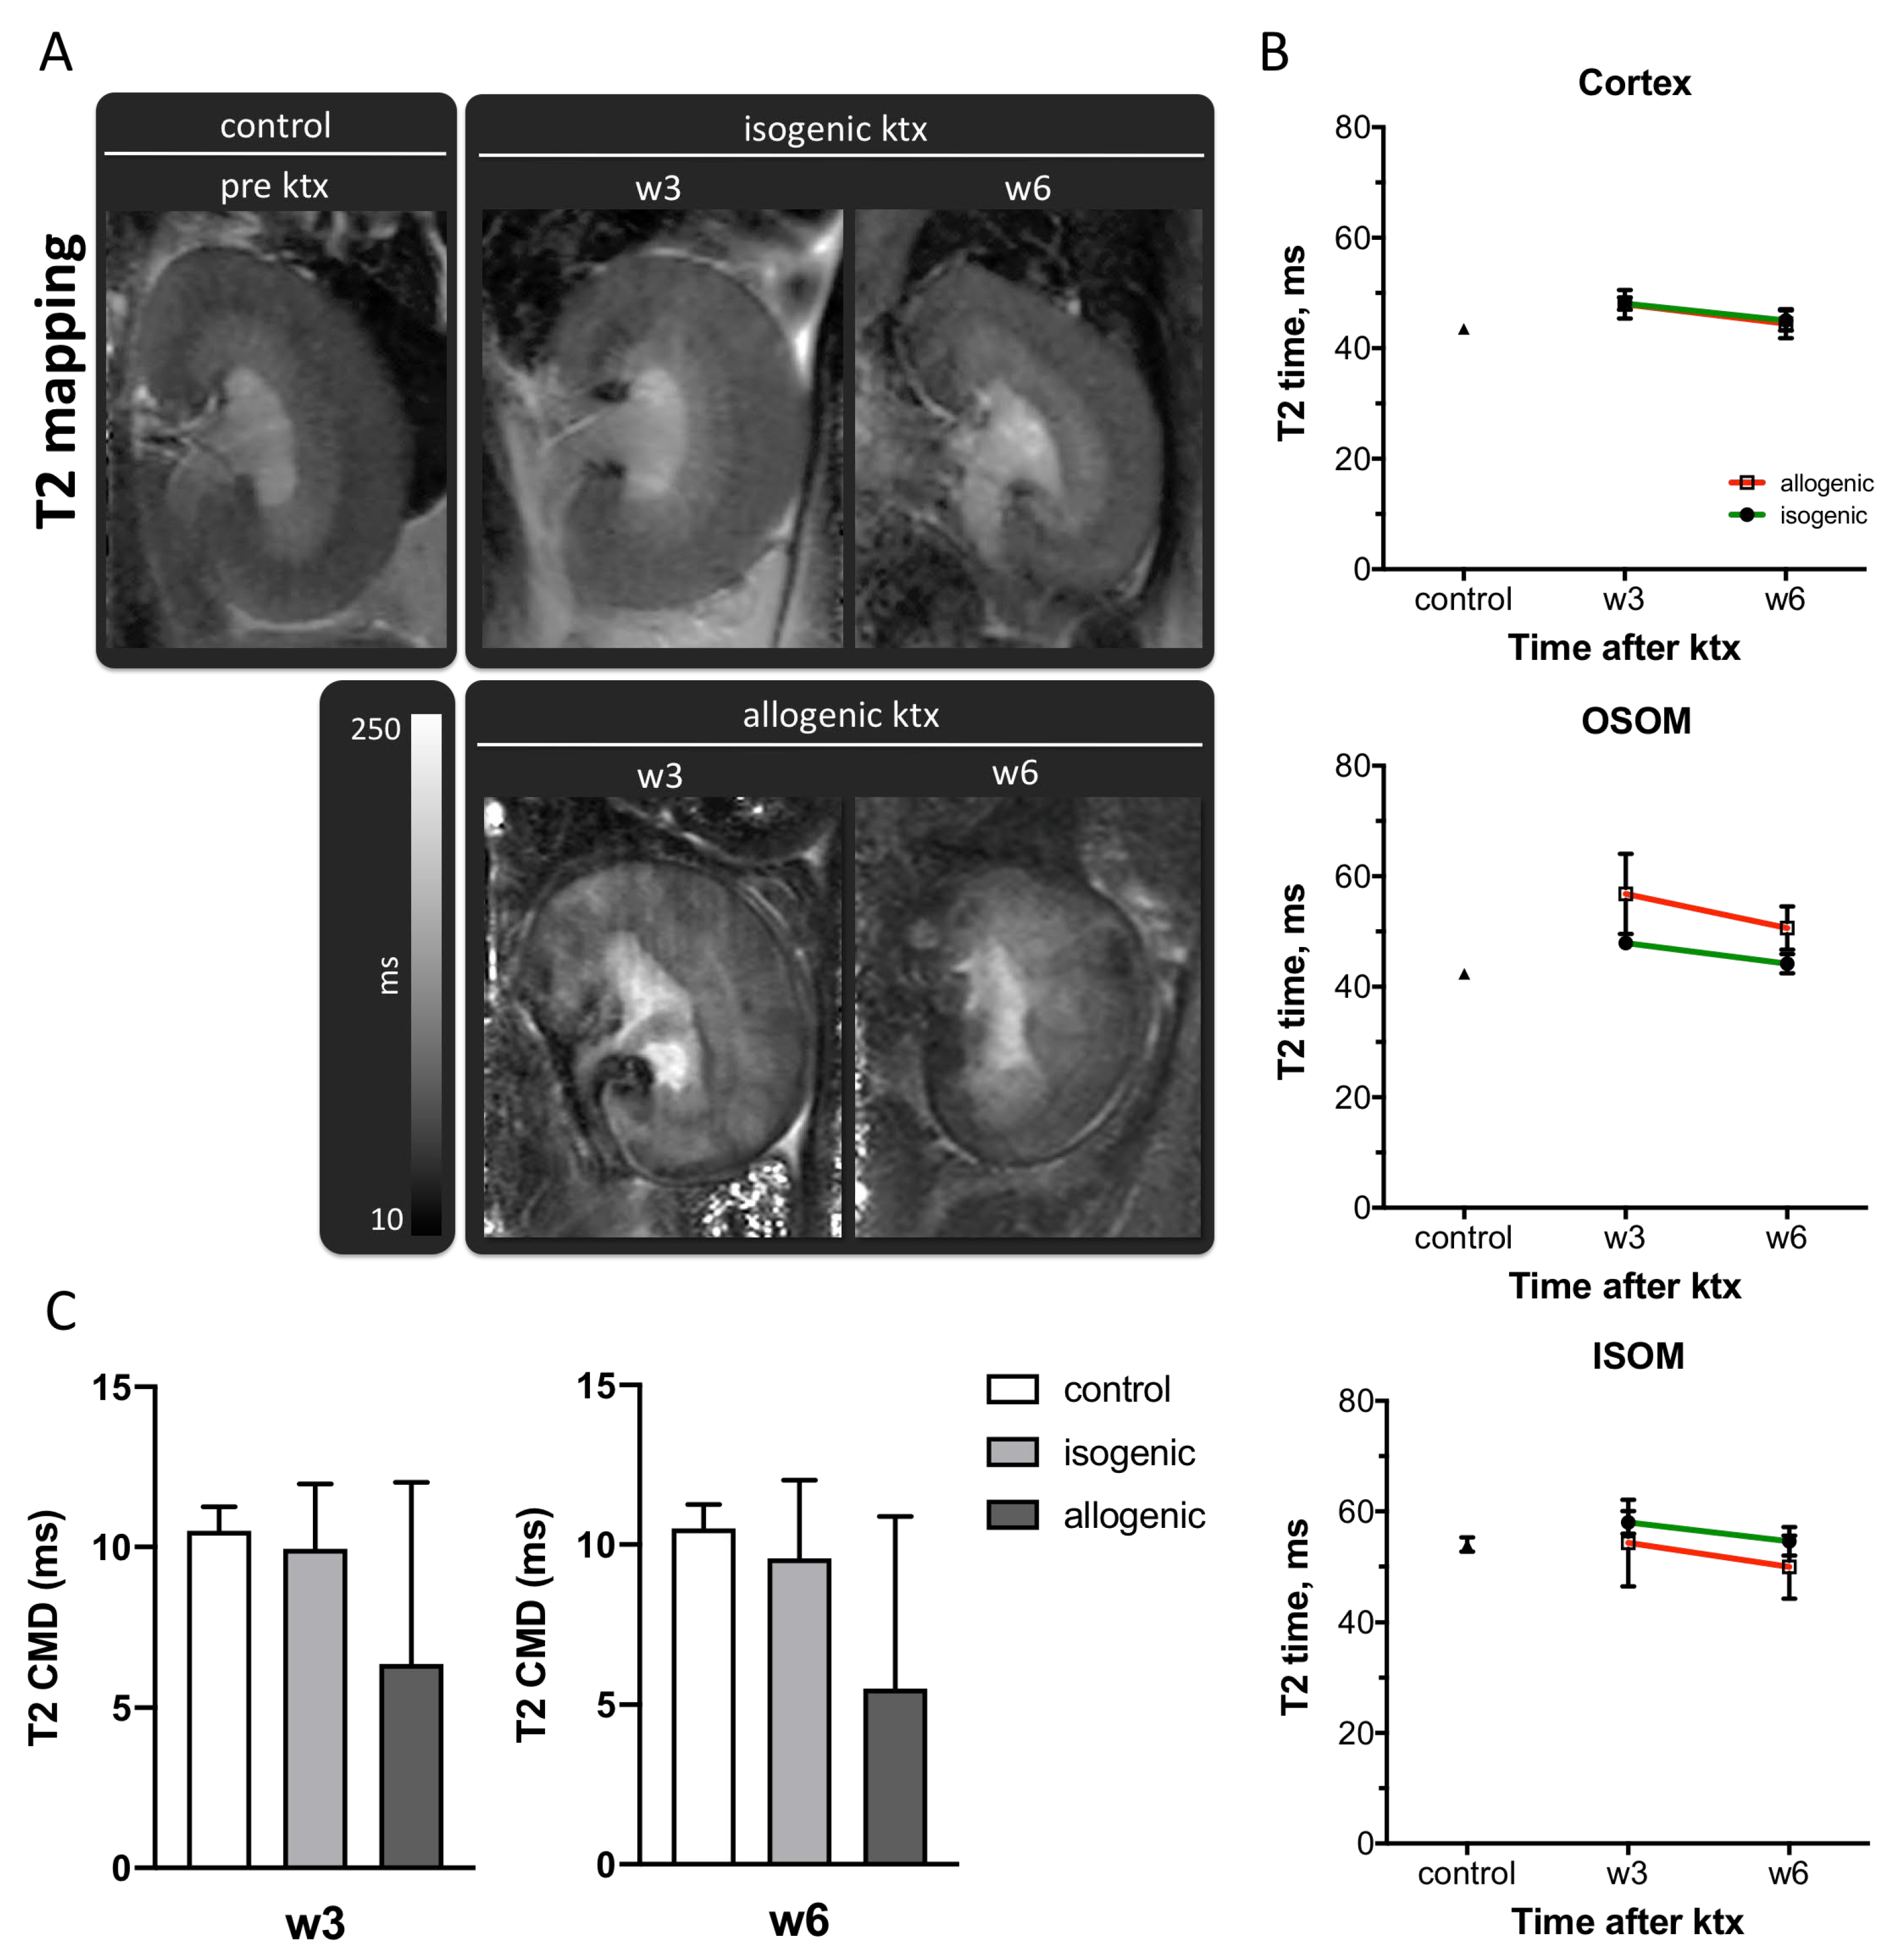
3.1.2. T2-Mapping
3.2. Assessment of Inflammation and Heterogeneity of Graft Pathology by DWI
3.2.1. Renal Diffusivity
3.2.2. Assessment of Tissue Heterogeneity by Histogram Analysis of ADC Maps
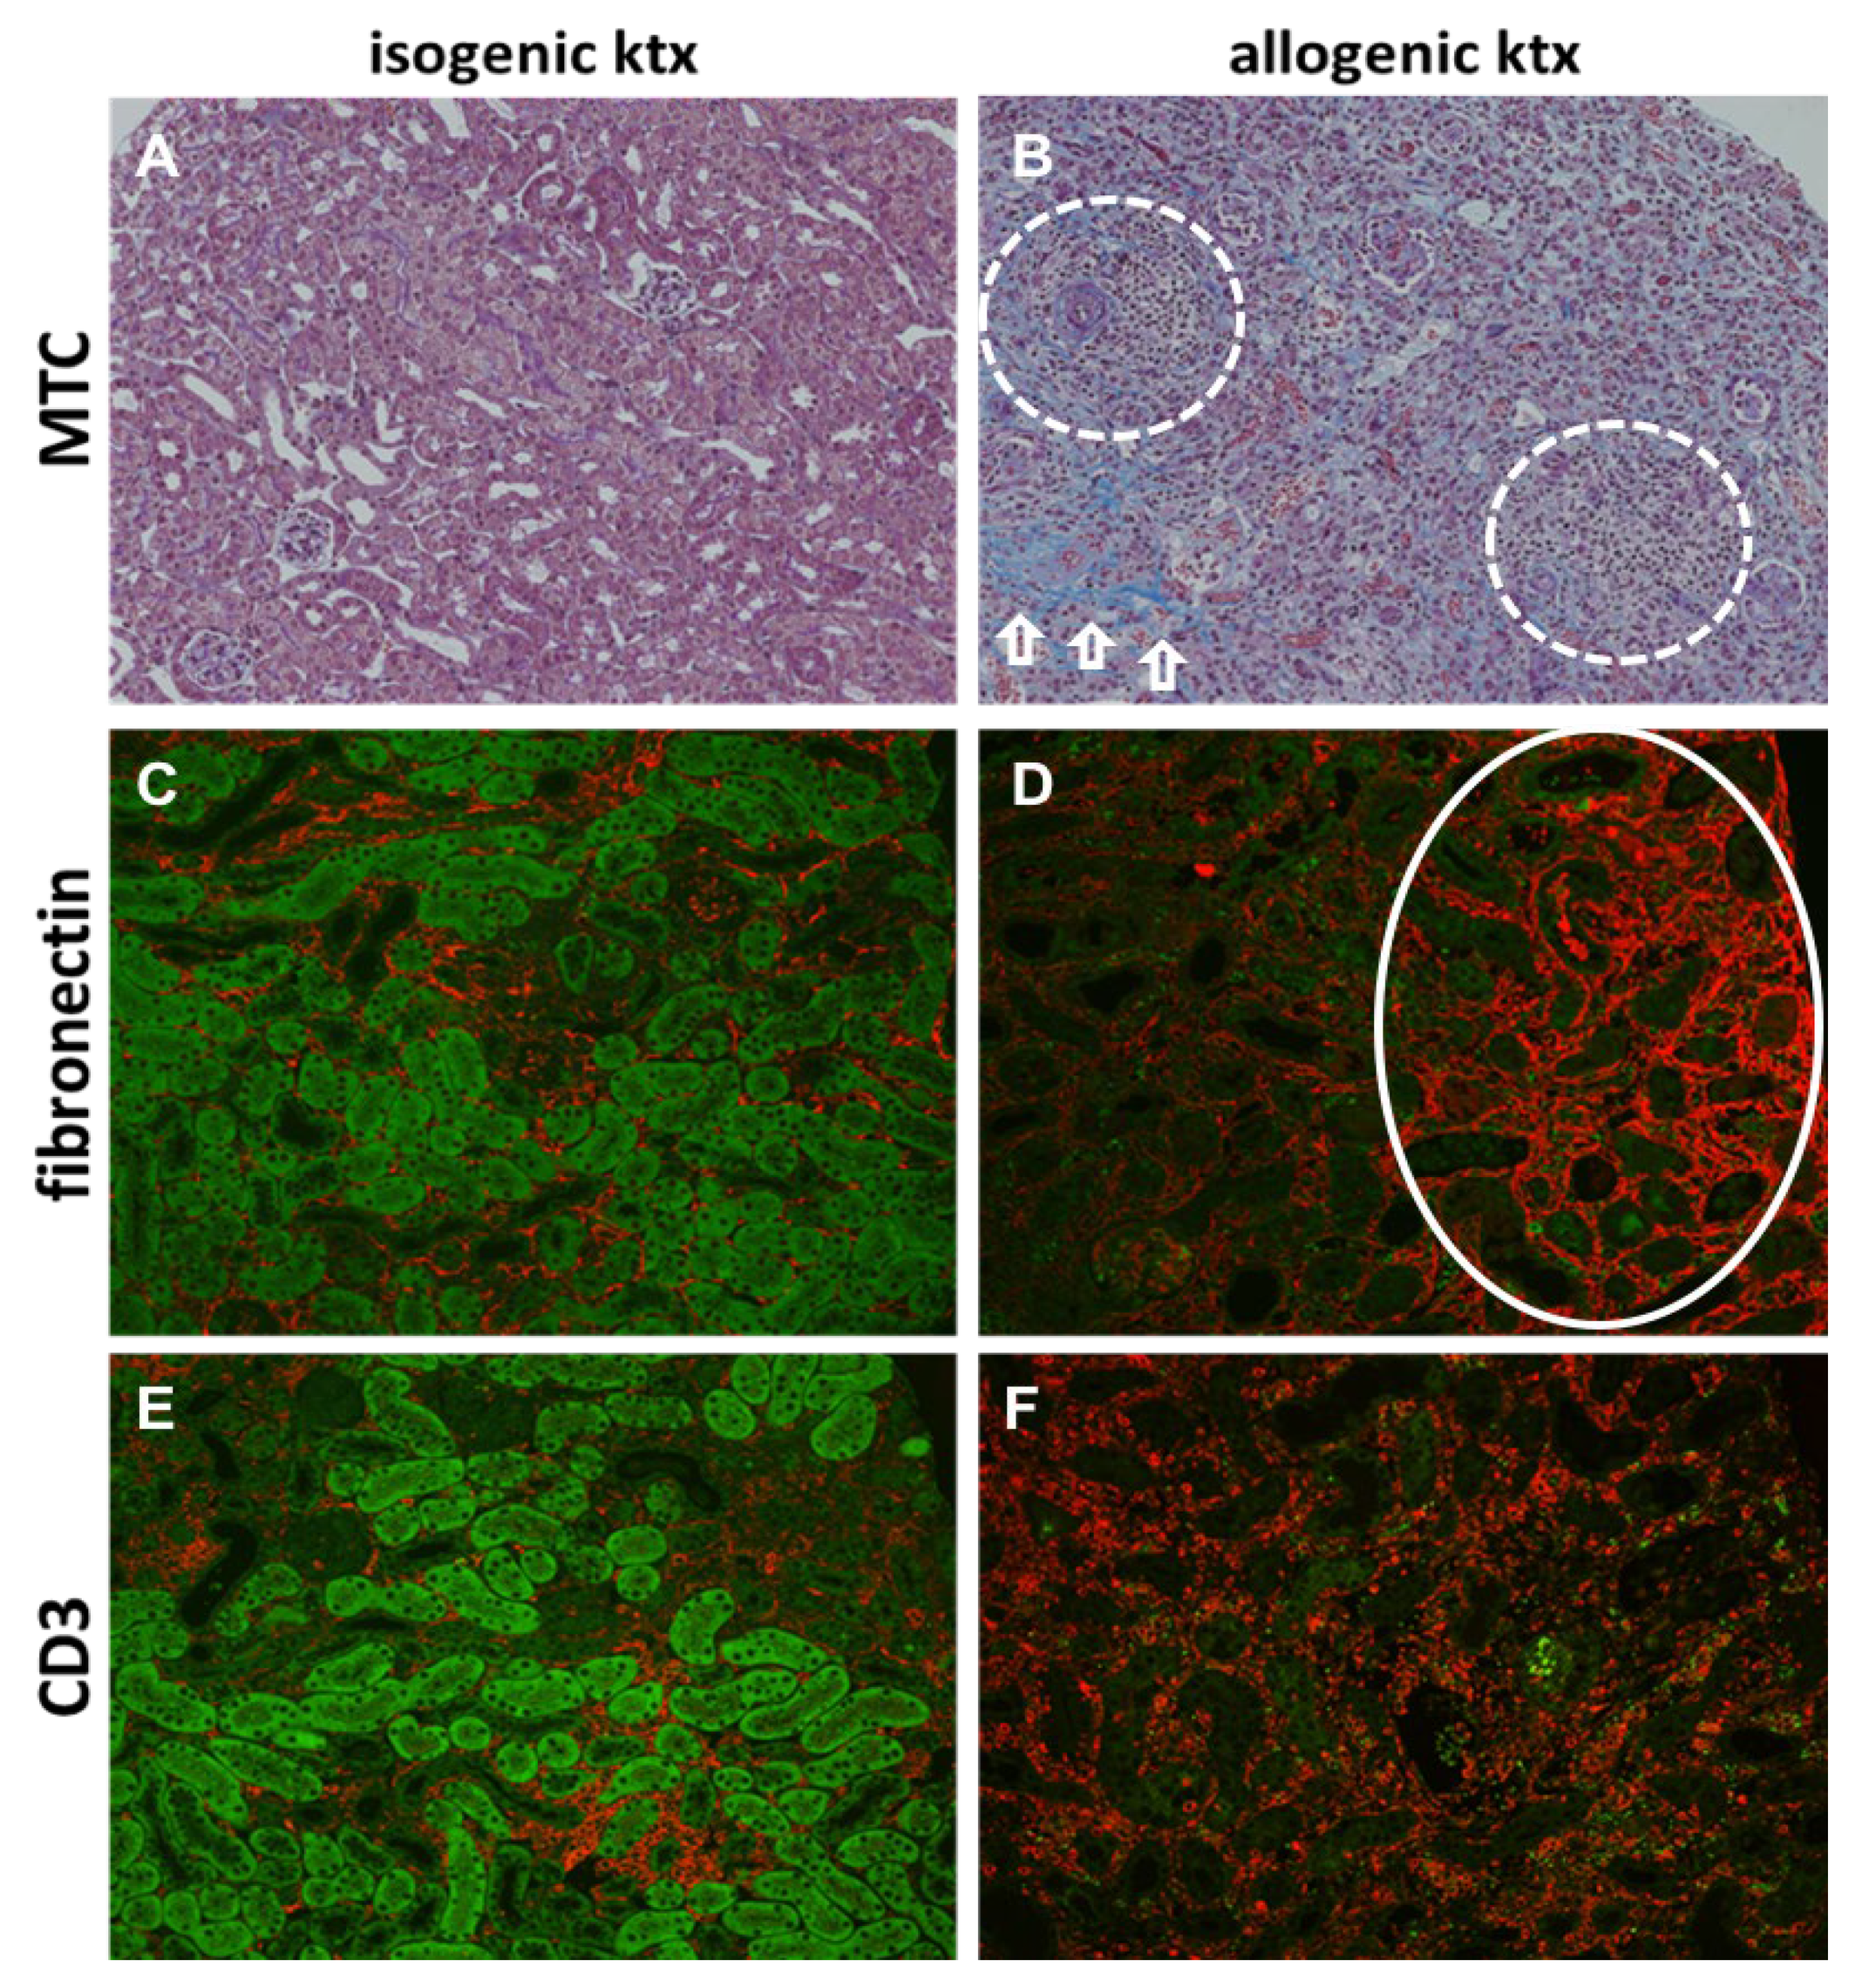
3.3. Histology and Immunohistochemistry in Kidney Grafts
4. Discussion
5. Conclusions
Author Contributions
Funding
Institutional Review Board Statement
Informed Consent Statement
Data Availability Statement
Acknowledgments
Conflicts of Interest
References
- Gaston, R.S.; Fieberg, A.; Hunsicker, L. Late graft failure after kidney transplantation as the consequence of late versus early events. Am. J. Transplant. 2018, 18, 1158–1167. [Google Scholar] [CrossRef]
- Lamb, K.E.; Lodhi, S.; Meier-Kriesche, H.U. Long-Term Renal Allograft Survival in the United States: A Critical Reappraisal. Am. J. Transplant. 2011, 11, 450–462. [Google Scholar] [CrossRef] [PubMed]
- Keith, D.S.; Vranic, G.; Nishio-Lucar, A. Graft Function and Intermediate-Term Outcomes of Kidney Transplants Improved in the Last Decade: Analysis of the United States Kidney Transplant Database. Transpl. Direct. 2017, 3, e166. [Google Scholar] [CrossRef] [PubMed]
- Jeremy, R.; Chapman, P.J.; O’Connell, B.J.N. Chronic Renal Allograft Dysfunction. JASN 2005, 16, 3015–3026. [Google Scholar]
- Roufosse, C. A 2018 Reference Guide to the Banff Classification of Renal Allograft Pathology. Transplantation 2018, 102, 1795–1814. [Google Scholar] [CrossRef]
- Raul, N.U.; Mukesh, G.H.; Debra, A.G. Imaging-Guided Percutaneous Renal Biopsy: Rationale and Approach. Am. J. Roentgenol. 2010, 6, 1443–1449. [Google Scholar]
- Zhang, J.L.; Rusinek, H.; Chandarana, H.; Lee, V.S. Functional MRI of the kidneys. J. Magn. Reson. Imaging 2013, 37, 282–293. [Google Scholar] [CrossRef] [Green Version]
- Nicholas, M.S.; Blankestijn, P.J.; Boor, P. Magnetic resonance imaging biomarkers for chronic kidney disease: A position paper from the European Cooperation in Science and Technology Action PARENCHIMA. Nephrol. Dial. Transplant. 2018, 33, ii4–ii14. [Google Scholar]
- van Eijs, M.J.M.; van Zuilen, A.D.; de Boer, A.; Froeling, M.; Nguyen, T.Q.; Joles, J.A.; Leiner, T.; Verhaar, M.C. Innovative Perspective: Gadolinium-Free Magnetic Resonance Imaging in Long-Term Follow-Up after Kidney Transplantation. Front. Physiol. 2017, 8, 296. [Google Scholar] [CrossRef] [Green Version]
- Ankur, G.; Raju, S.; Ashu, S.B.; Shivanand, G.; Amlesh, S. Diffusion-weighted MRI in assessment of renal dysfunction. Indian J. Radiol. Imaging 2012, 22, 155–159. [Google Scholar]
- Xu, X.; Fang, W.; Ling, H.; Chai, W.; Chen, K. Diffusion-weighted MR imaging of kidneys in patients with chronic kidney disease: Initial study. Eur. Radiol. 2010, 20, 978–983. [Google Scholar] [CrossRef]
- Togao, O.; Doi, S.; Kuro-o, M.; Masaki, T.; Yorioka, N.; Takahashi, M. Assessment of renal fibrosis with diffusion-weighted MR imaging: Study with murine model of unilateral ureteral obstruction. Radiology 2010, 255, 772–780. [Google Scholar] [CrossRef] [PubMed] [Green Version]
- Thoeny, H.C.; De Keyzer, F. Diffusion-weighted MR imaging of native and transplanted kidneys. Radiology 2011, 259, 25–38. [Google Scholar] [CrossRef] [PubMed] [Green Version]
- Thoeny, H.C.; de Keyzer, F.; Oyen, R.H.; Peeters, R.R. Diffusion-weighted MR Imaging of Kidneys in Healthy Volunteers and Patients with Parenchymal Diseases: Initial Experience. Radiology 2005, 235, 911–917. [Google Scholar] [CrossRef] [PubMed]
- Hueper, K.; Peperhove, M.; Rong, S. T1-mapping for assessment of ischemia-induced acute kidney injury and prediction of chronic kidney disease in mice. Eur. Radiol. 2014, 24, 2252–2260. [Google Scholar] [CrossRef]
- Hueper, K.; Hensen, B.; Gutberlet, M. Kidney transplantation: Multiparametric functional magnetic resonance imaging for assessment of renal allograft pathophysiology in mice. Investig. Radiol. 2016, 51, 58–65. [Google Scholar] [CrossRef]
- Tewes, S.; Gueler, F.; Chen, R. Functional MRI for characterization of renal perfusion impairment and edema formation due to acute kidney injury in different mouse strains. PLoS ONE 2017, 12, e0173248. [Google Scholar] [CrossRef] [PubMed]
- Friedli, I.; Crowe, L.A.; Berchtold, L. New magnetic resonance imaging index for renal fibrosis assessment: A comparison between diffusion-weighted imaging and T1 mapping with histological validation. Sci. Rep. 2016, 6, 30088. [Google Scholar] [CrossRef] [PubMed]
- Peperhove, M.; Vo Chieu, V.D.; Jang, M.S. Assessment of acute kidney injury with T1 mapping MRI following solid organ transplantation. Eur. Radiol. 2018, 28, 44–50. [Google Scholar] [CrossRef] [PubMed]
- Huang, Y.; Sadowski, E.A.; Artz, N.S. Measurement and comparison of T1 relaxation times in native and transplanted kidney cortex and medulla. J. Magn. Reson. Imaging 2011, 33, 1241–1247. [Google Scholar] [CrossRef] [PubMed] [Green Version]
- Hueper, K.; Rong, S.; Gutberlet, M. T2 Relaxation Time and Apparent Diffusion Coefficient for Noninvasive Assessment of Renal Pathology After Acute Kidney Injury in Mice: Comparison with Histopathology. Investig. Radiol. 2013, 48, 834–842. [Google Scholar] [CrossRef] [PubMed]
- Ko, S.F.; Yip, H.K.; Zhen, Y.Y. Severe bilateral ischemic-reperfusion renal injury: Hyperacute and acute changes in apparent diffusion coefficient, T1, and T2 mapping with immunohistochemical correlations. Sci. Rep. 2017, 7, 1725. [Google Scholar] [CrossRef] [PubMed] [Green Version]
- Pohlmann, A.; Hentschel, J.; Fechner, M.; Hoff, U.; Bubalo, G. High Temporal Resolution Parametric MRI Monitoring of the Initial Ischemia/Reperfusion Phase in Experimental Acute Kidney Injury. PLoS ONE 2013, 8, e57411. [Google Scholar] [CrossRef] [PubMed]
- Eisenberger, U.; Thoeny, H.C.; Binser, T. Evaluation of renal allograft function early after transplantation with diffusion-weighted MR imaging. Eur. Radiol. 2010, 20, 1374–1383. [Google Scholar] [CrossRef] [Green Version]
- Zhao, J.; Wang, Z.J.; Liu, M. Assessment of renal fibrosis in chronic kidney disease using diffusion-weighted MRI. Clin. Radiol. 2014, 69, 1117–1122. [Google Scholar] [CrossRef]
- Hueper, K.; Khalifa, A.A.; Bräsen, J.H. Diffusion-Weighted imaging and diffusion tensor imaging detect delayed graft function and correlate with allograft fibrosis in patients early after kidney transplantation. J. Magn. Reson. Imaging 2016, 44, 112–121. [Google Scholar] [CrossRef] [PubMed]
- Zarjou, A.; Guo, L.; Sanders, P.W.; Mannon, R.B.; Agarwal, A.; George, J.F. A reproducible mouse model of chronic allograft nephropathy with vasculopathy. Kidney Int. 2012, 82, 1231–1235. [Google Scholar] [CrossRef] [PubMed] [Green Version]
- Hueper, K.; Schmidbauer, M.; Thorenz, A. Longitudinal evaluation of perfusion changes in acute and chronic renal allograft rejection using arterial spin labeling in translational mouse models. J. Magn. Reson. Imaging 2017, 46, 1664–1672. [Google Scholar] [CrossRef] [PubMed]
- Rong, S.; Lewis, A.G.; Kunter, U.; Haller, H.; Gueler, F. A knotless technique for kidney transplantation in the mouse. J. Transpl. 2012, 2012, 127215. [Google Scholar] [CrossRef] [Green Version]
- Wolf, M.; de Boer, A.; Sharma, K. Magnetic resonance imaging T1- and T2-mapping to assess renal structure and function: A systematic review and statement paper. Nephrol. Dial. Transpl. 2018, 33, ii41–ii50. [Google Scholar] [CrossRef] [Green Version]
- Marotti, M.; Hricak, H.; Terrier, F. MR in renal disease: Importance of cortical–medullary distinction. Magn. Reson. Med. 1987, 5, 160–172. [Google Scholar] [CrossRef]
- O’Connor, J.P.B.; Jackson, A.; Buonaccorsi, G.A. Organ-specific effects of oxygen and carbogen gas inhalation on tissue longitudinal relaxation times. Magn. Reson. Med. 2007, 58, 490–496. [Google Scholar] [CrossRef] [PubMed]
- Jones, R.A.; Ries, M.; Moonen, C.T.W. Imaging the changes in renal T1 induced by the inhalation of pure oxygen: A feasibility study. Magn. Reson. Med. 2002, 47, 728–735. [Google Scholar] [CrossRef] [PubMed] [Green Version]
- Cox, E.F.; Buchanan, C.E.; Bradley, C.R.; Prestwich, B.; Mahmoud, H.; Taal, M.; Selby, N.M.; Francis, S.T. Multiparametric Renal Magnetic Resonance Imaging: Validation, Interventions, and Alterations in Chronic Kidney Disease. Front. Physiol. 2017, 8, 696. [Google Scholar] [CrossRef] [PubMed]
- Adams, L.C.; Bressem, K.K.; Scheibl, S. Multiparametric Assessment of Changes in Renal Tissue after Kidney Transplantation with Quantitative MR Relaxometry and Diffusion-Tensor Imaging at 3 T. J. Clin. Med. 2020, 9, 1551. [Google Scholar] [CrossRef] [PubMed]
- Caroli, A.; Schneider, M.; Friedli, I. Diffusion-weighted magnetic resonance imaging to assess diffuse renal pathology: A systematic review and statement paper. Nephrol. Dial. Transpl. 2018, 33, ii29–ii40. [Google Scholar] [CrossRef] [Green Version]
- Steiger, P.; Barbieri, S.; Kruse, A.; Ith, M.; Thoeny, H.C. Selection for biopsy of kidney transplant patients by diffusion-weighted MRI. Eur. Radiol. 2017, 27, 4336–4344. [Google Scholar] [CrossRef] [PubMed]
- Abou-El-Ghar, M.E.; El-Diasty, T.A.; El-Assmy, A.M.; Refaie, H.F.; Refaie, A.F.; Ghoneim, M.A. Role of diffusion-weighted MRI in diagnosis of acute renal allograft dysfunction: A prospective preliminary study. Br. J. Radiol. 2012, 85, e206–e211. [Google Scholar] [CrossRef] [Green Version]


| Control | Isogenic ktx | Allogenic ktx | |||
|---|---|---|---|---|---|
| w3 | w6 | w3 | w6 | ||
| T1 Cortex (ms) | 1304 ± 10 | 1457 ± 52, ### | 1393 ± 51 ### | 1965 ± 53 *** | 1899 ± 79 *** |
| T1 OSOM (ms) | 1283 ± 11 | 1466 ± 56, ### | 1399 ± 59 ### | 2134 ± 61 *** | 2036 ± 78 *** |
| T1 ISOM (ms) | 1808 ± 19 | 1904 ± 45 ### | 1859 ± 55 | 2282 ± 49 ***, §§§ | 2031 ± 66 ** |
| T1 CMD (ms) | 505 ± 20 | 447 ± 36 | 467 ± 55 ### | 318 ± 30 **, §§ | 169 ± 53 *** |
| T2 Cortex (ms) | 44 ± 1 | 48 ± 1 | 45 ± 2 | 48 ± 3 | 44 ± 3 |
| T2 OSOM (ms) | 42 ± 1 | 48 ± 1 | 44 ± 2 | 57 ± 7 *** | 51 ± 4 |
| T2 ISOM (ms) | 54 ± 1 | 58 ± 2 | 55 ± 3 | 54 ± 8 | 50 ± 6 |
| T2 CMD (ms) | 10.5 ± 0.8 | 10 ± 2 | 9.6 ± 2.4 | 6.4 ± 5.7 | 5.5 ± 5.4 |
| ADC Cortex (−10−3 mm2/s) | 1.61 ± 0.06 | 1.29 ± 0.10 | 1.40 ± 0.11 | 1.47 ± 0.14 | 1.44 ± 0.17 |
| ADC OM (−10−3 mm2/s) | 1.72 ± 0.06 | 1.43 ± 0.10 | 1.56 ± 0.12 | 1.47 ± 0.06 | 1.27 ± 0.14 ** |
| Isogenic ktx | Allogenic ktx | |||
|---|---|---|---|---|
| w3 | w6 | w3 | w6 | |
| ADCmean (×10−3 mm2/s) | 1.39 ± 0.12 | 1.52 ± 0.10 | 1.16 ± 0.09 | 1.47 ± 0.14 |
| SD (×10−3 mm2/s) | 0.13 ± 0.02 | 0.15 ± 0.03 | 0.33 ± 0.02 *** | 0.32 ± 0.03 ** |
| Kurtosis | 3.42 ± 0.30 | 2.96 ± 0.29 | 2.89 ± 0.23 | 3.31 ± 0.34 |
| Skewness | −0.29 ± 0.29 | 0.14 ± 0.18 | −0.14 ± 0.09 | 0.02 ± 0.19 |
| Entropy | 0.16 ± 0.008 | 0.17 ± 0.001 | 0.23 ± 0.004 *** | 0.22 ± 0.007 * |
| IQR (×10−3 mm2/s) | 0.17 ± 0.03 | 0.12 ± 0.03 | 0.45 ± 0.02 *** | 0.43 ± 0.04 ** |
| Isogenic ktx | Allogenic ktx | p-Value | |
|---|---|---|---|
| Fibrosis (%) | 4.8 ± 1.2 | 43.8 ± 6.5 | <0.001 |
| Inflammation score | 1.0 ± 0.5 | 3.1 ± 0.3 | <0.001 |
Publisher’s Note: MDPI stays neutral with regard to jurisdictional claims in published maps and institutional affiliations. |
© 2021 by the authors. Licensee MDPI, Basel, Switzerland. This article is an open access article distributed under the terms and conditions of the Creative Commons Attribution (CC BY) license (https://creativecommons.org/licenses/by/4.0/).
Share and Cite
Schmidbauer, M.; Rong, S.; Gutberlet, M.; Chen, R.; Bräsen, J.H.; Hartung, D.; Meier, M.; Wacker, F.; Haller, H.; Gueler, F.; et al. Diffusion-Weighted Imaging and Mapping of T1 and T2 Relaxation Time for Evaluation of Chronic Renal Allograft Rejection in a Translational Mouse Model. J. Clin. Med. 2021, 10, 4318. https://doi.org/10.3390/jcm10194318
Schmidbauer M, Rong S, Gutberlet M, Chen R, Bräsen JH, Hartung D, Meier M, Wacker F, Haller H, Gueler F, et al. Diffusion-Weighted Imaging and Mapping of T1 and T2 Relaxation Time for Evaluation of Chronic Renal Allograft Rejection in a Translational Mouse Model. Journal of Clinical Medicine. 2021; 10(19):4318. https://doi.org/10.3390/jcm10194318
Chicago/Turabian StyleSchmidbauer, Martina, Song Rong, Marcel Gutberlet, Rongjun Chen, Jan Hinrich Bräsen, Dagmar Hartung, Martin Meier, Frank Wacker, Hermann Haller, Faikah Gueler, and et al. 2021. "Diffusion-Weighted Imaging and Mapping of T1 and T2 Relaxation Time for Evaluation of Chronic Renal Allograft Rejection in a Translational Mouse Model" Journal of Clinical Medicine 10, no. 19: 4318. https://doi.org/10.3390/jcm10194318