
Impact of Different JAK Inhibitors and Methotrexate on Lymphocyte Proliferation and DNA Damage

 , , and
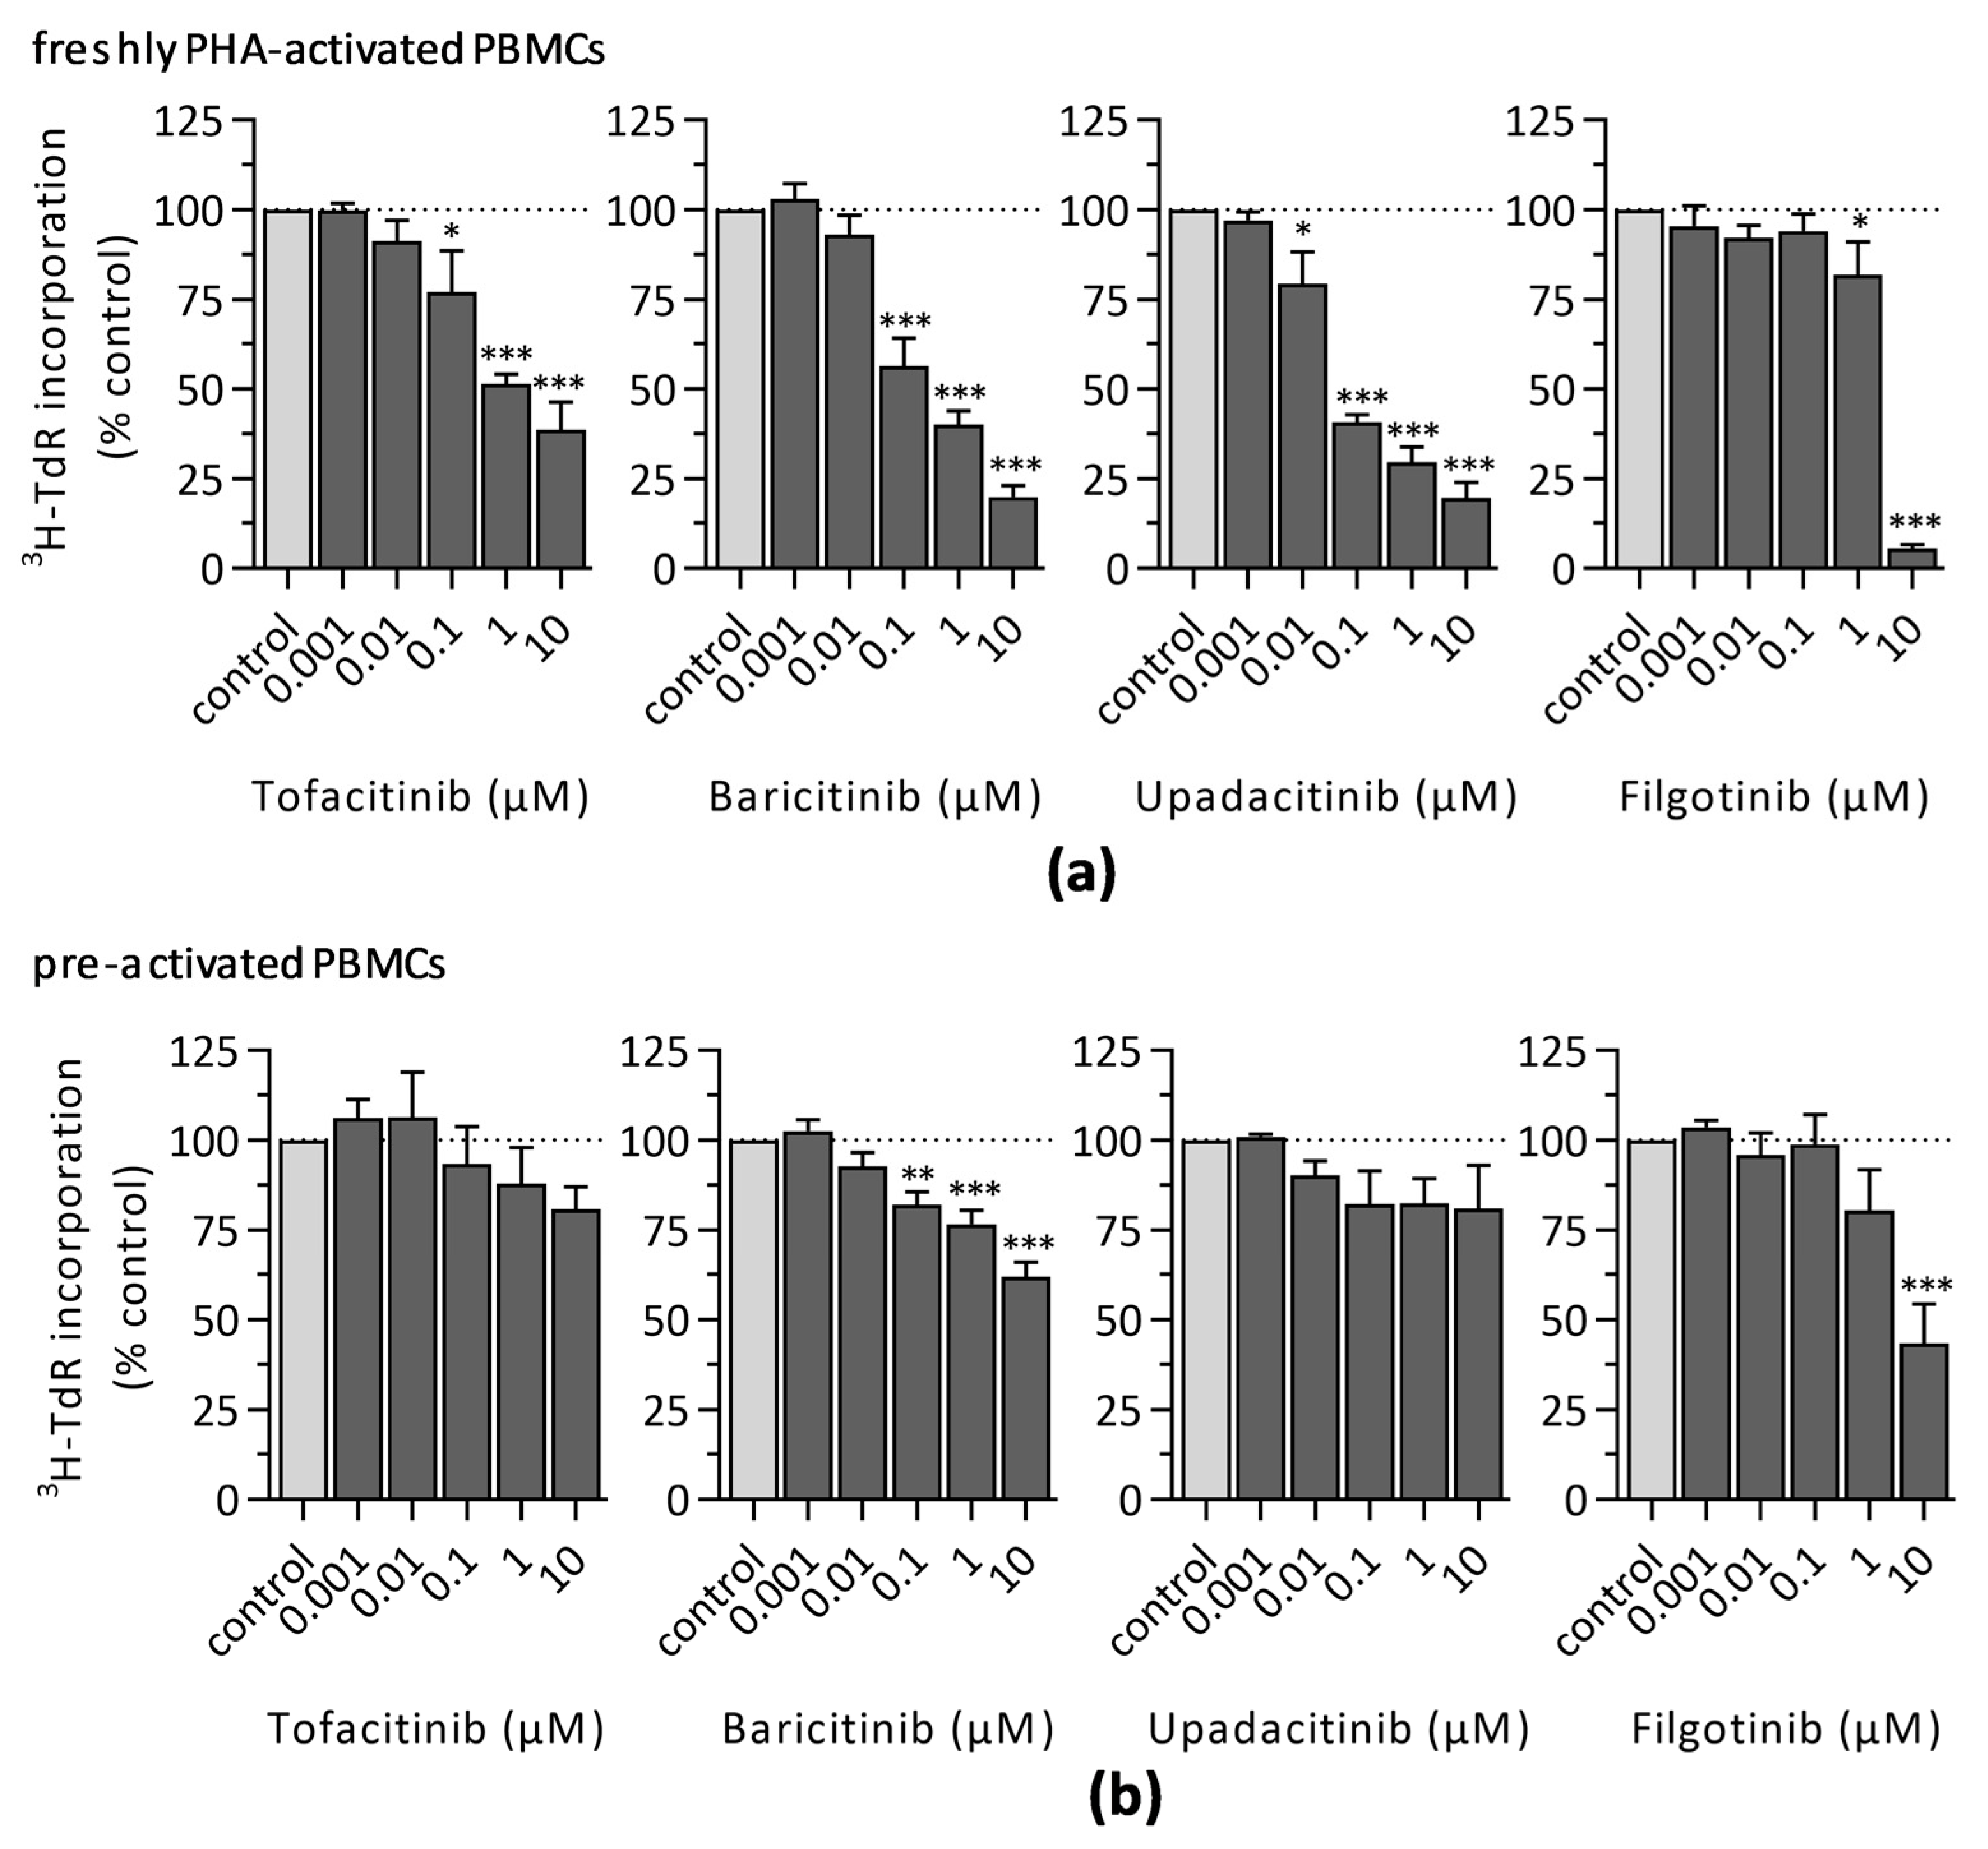
Abstract
:1. Introduction
2. Experimental Section
2.1. Ethics Statement
2.2. Cell Culture
2.3. Proliferation Analysis by 3H-Thymidine Incorporation
2.4. Proliferation Analysis by the CFSE Dilution Assay
2.5. Analysis of CD25 Expression
2.6. Viability Assessment
2.7. Detection of γH2AX and 53BP1 Foci
2.8. Statistical Analysis
3. Results
3.1. Impact of JAKi and MTX on Lymphocyte Activation and Proliferation
3.1.1. 3H-Thymidine Incorporation
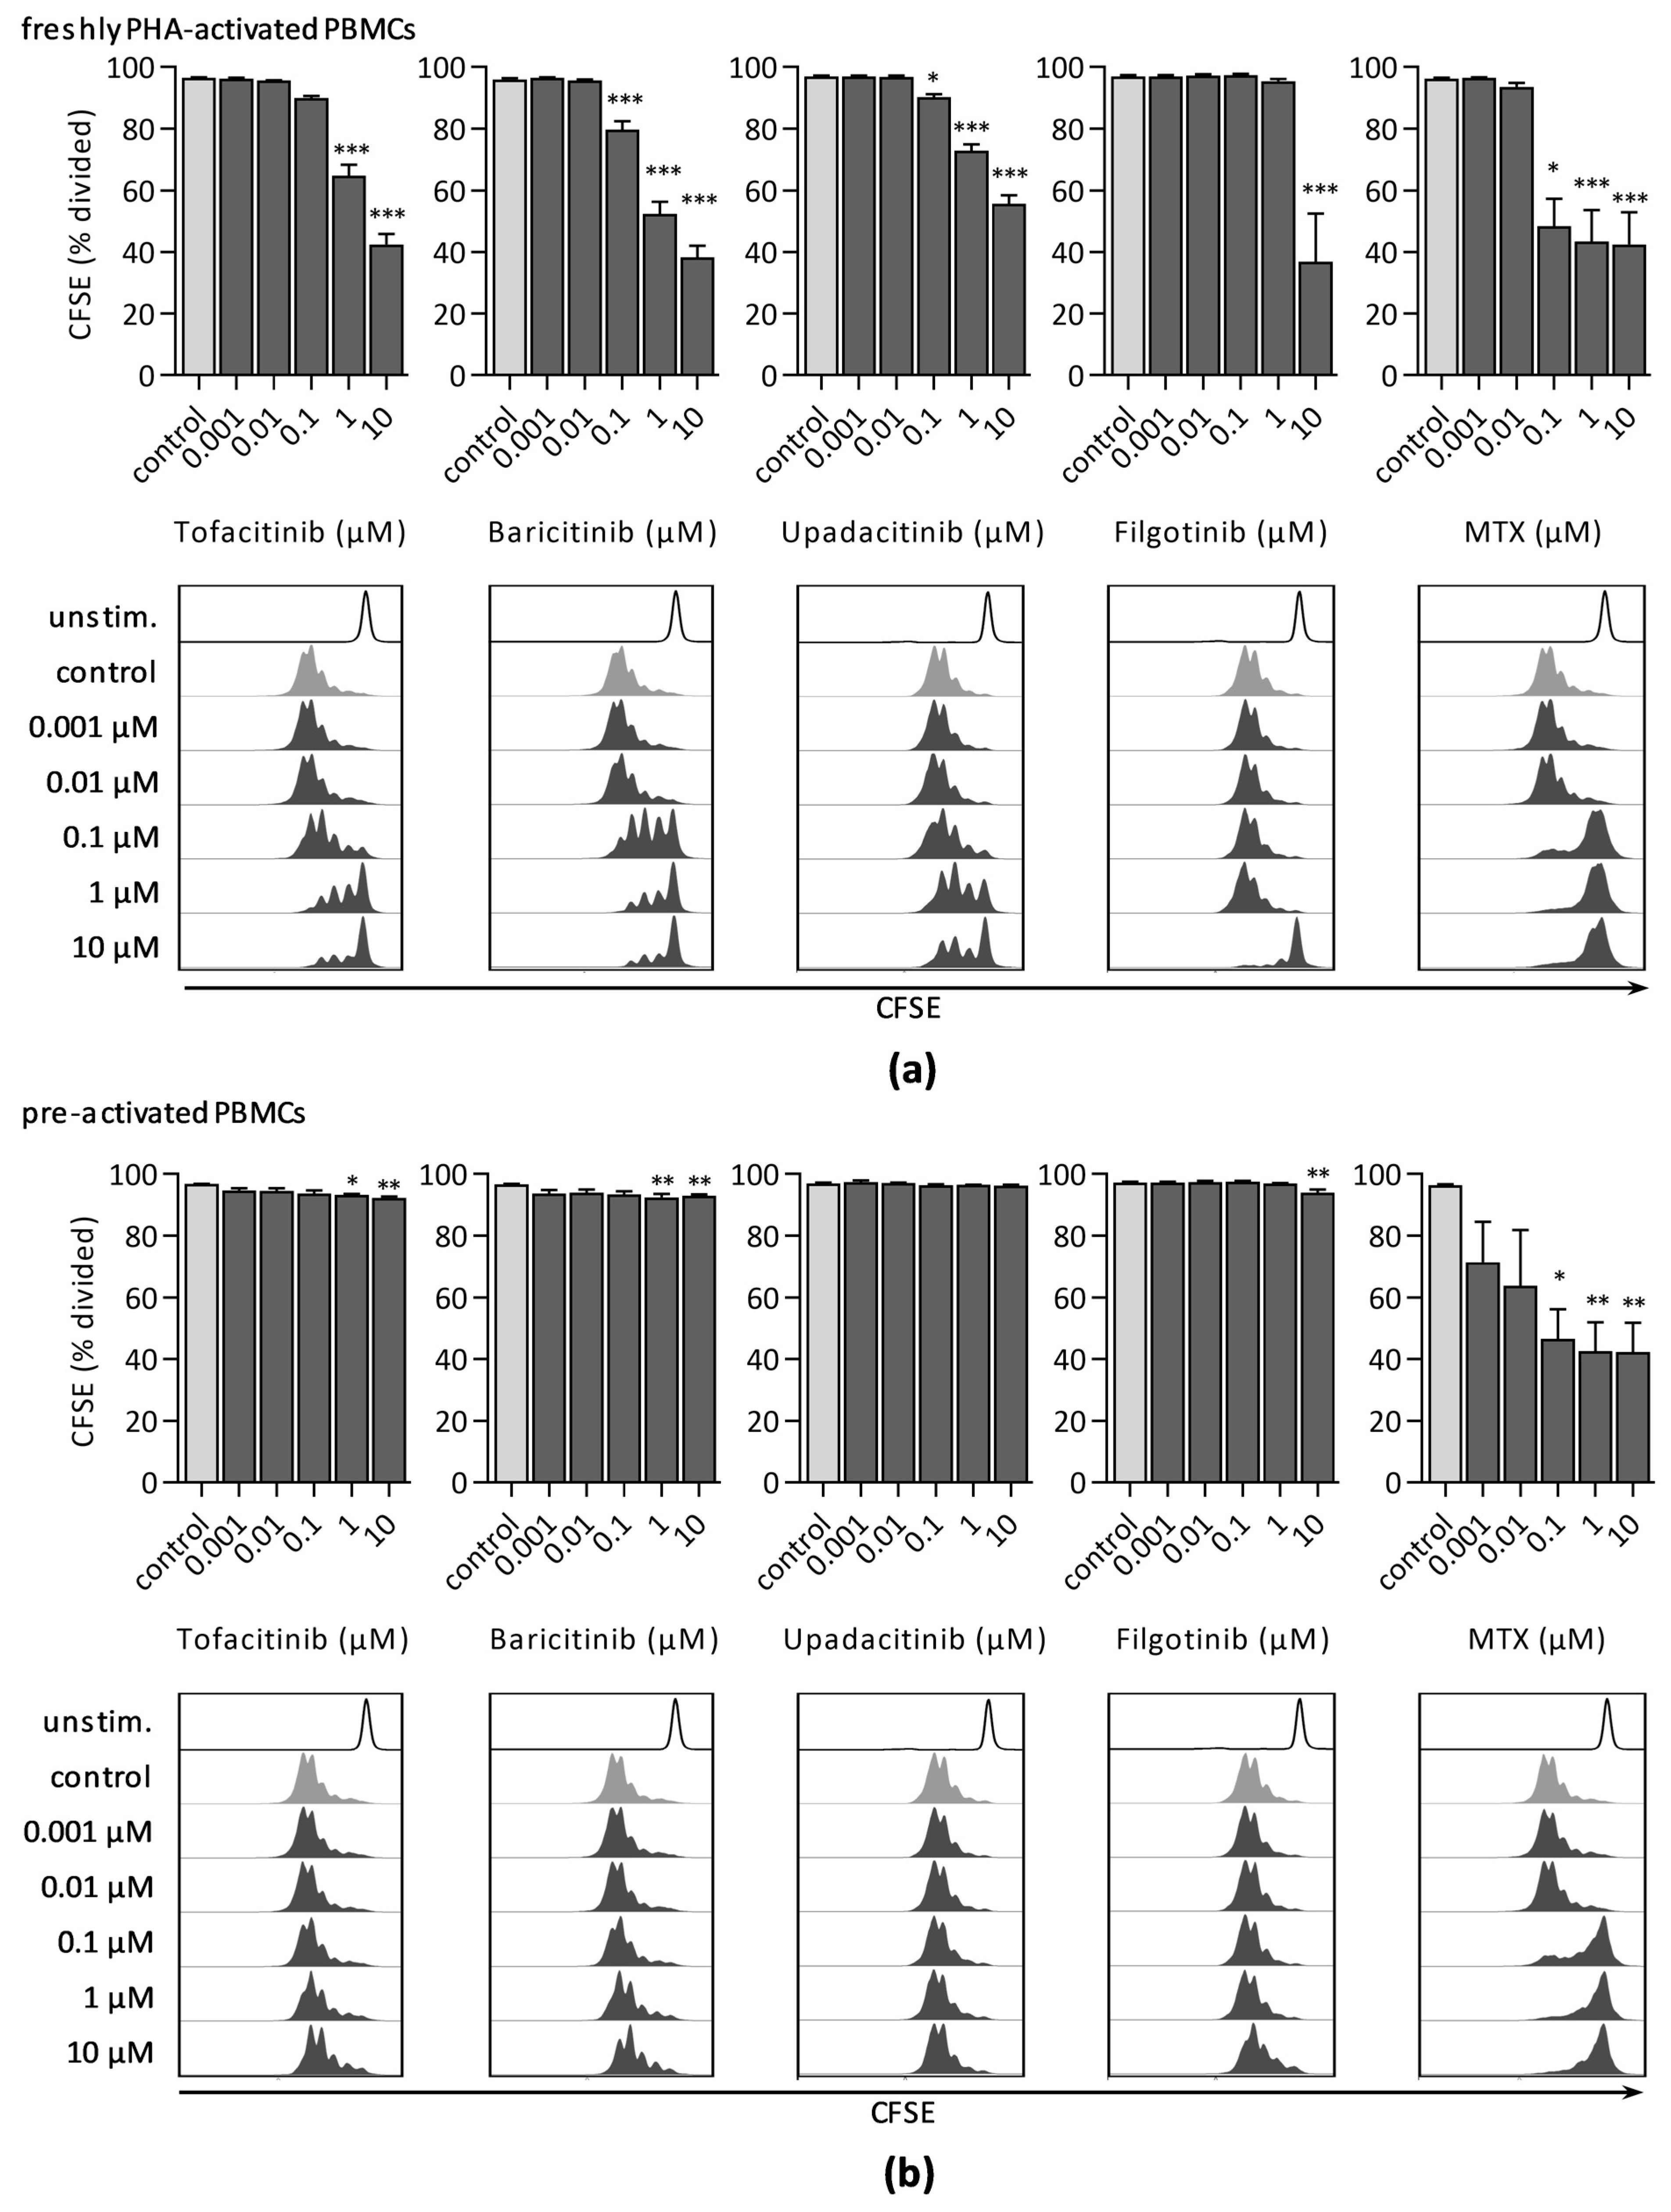
3.1.2. CFSE Dilution Assay
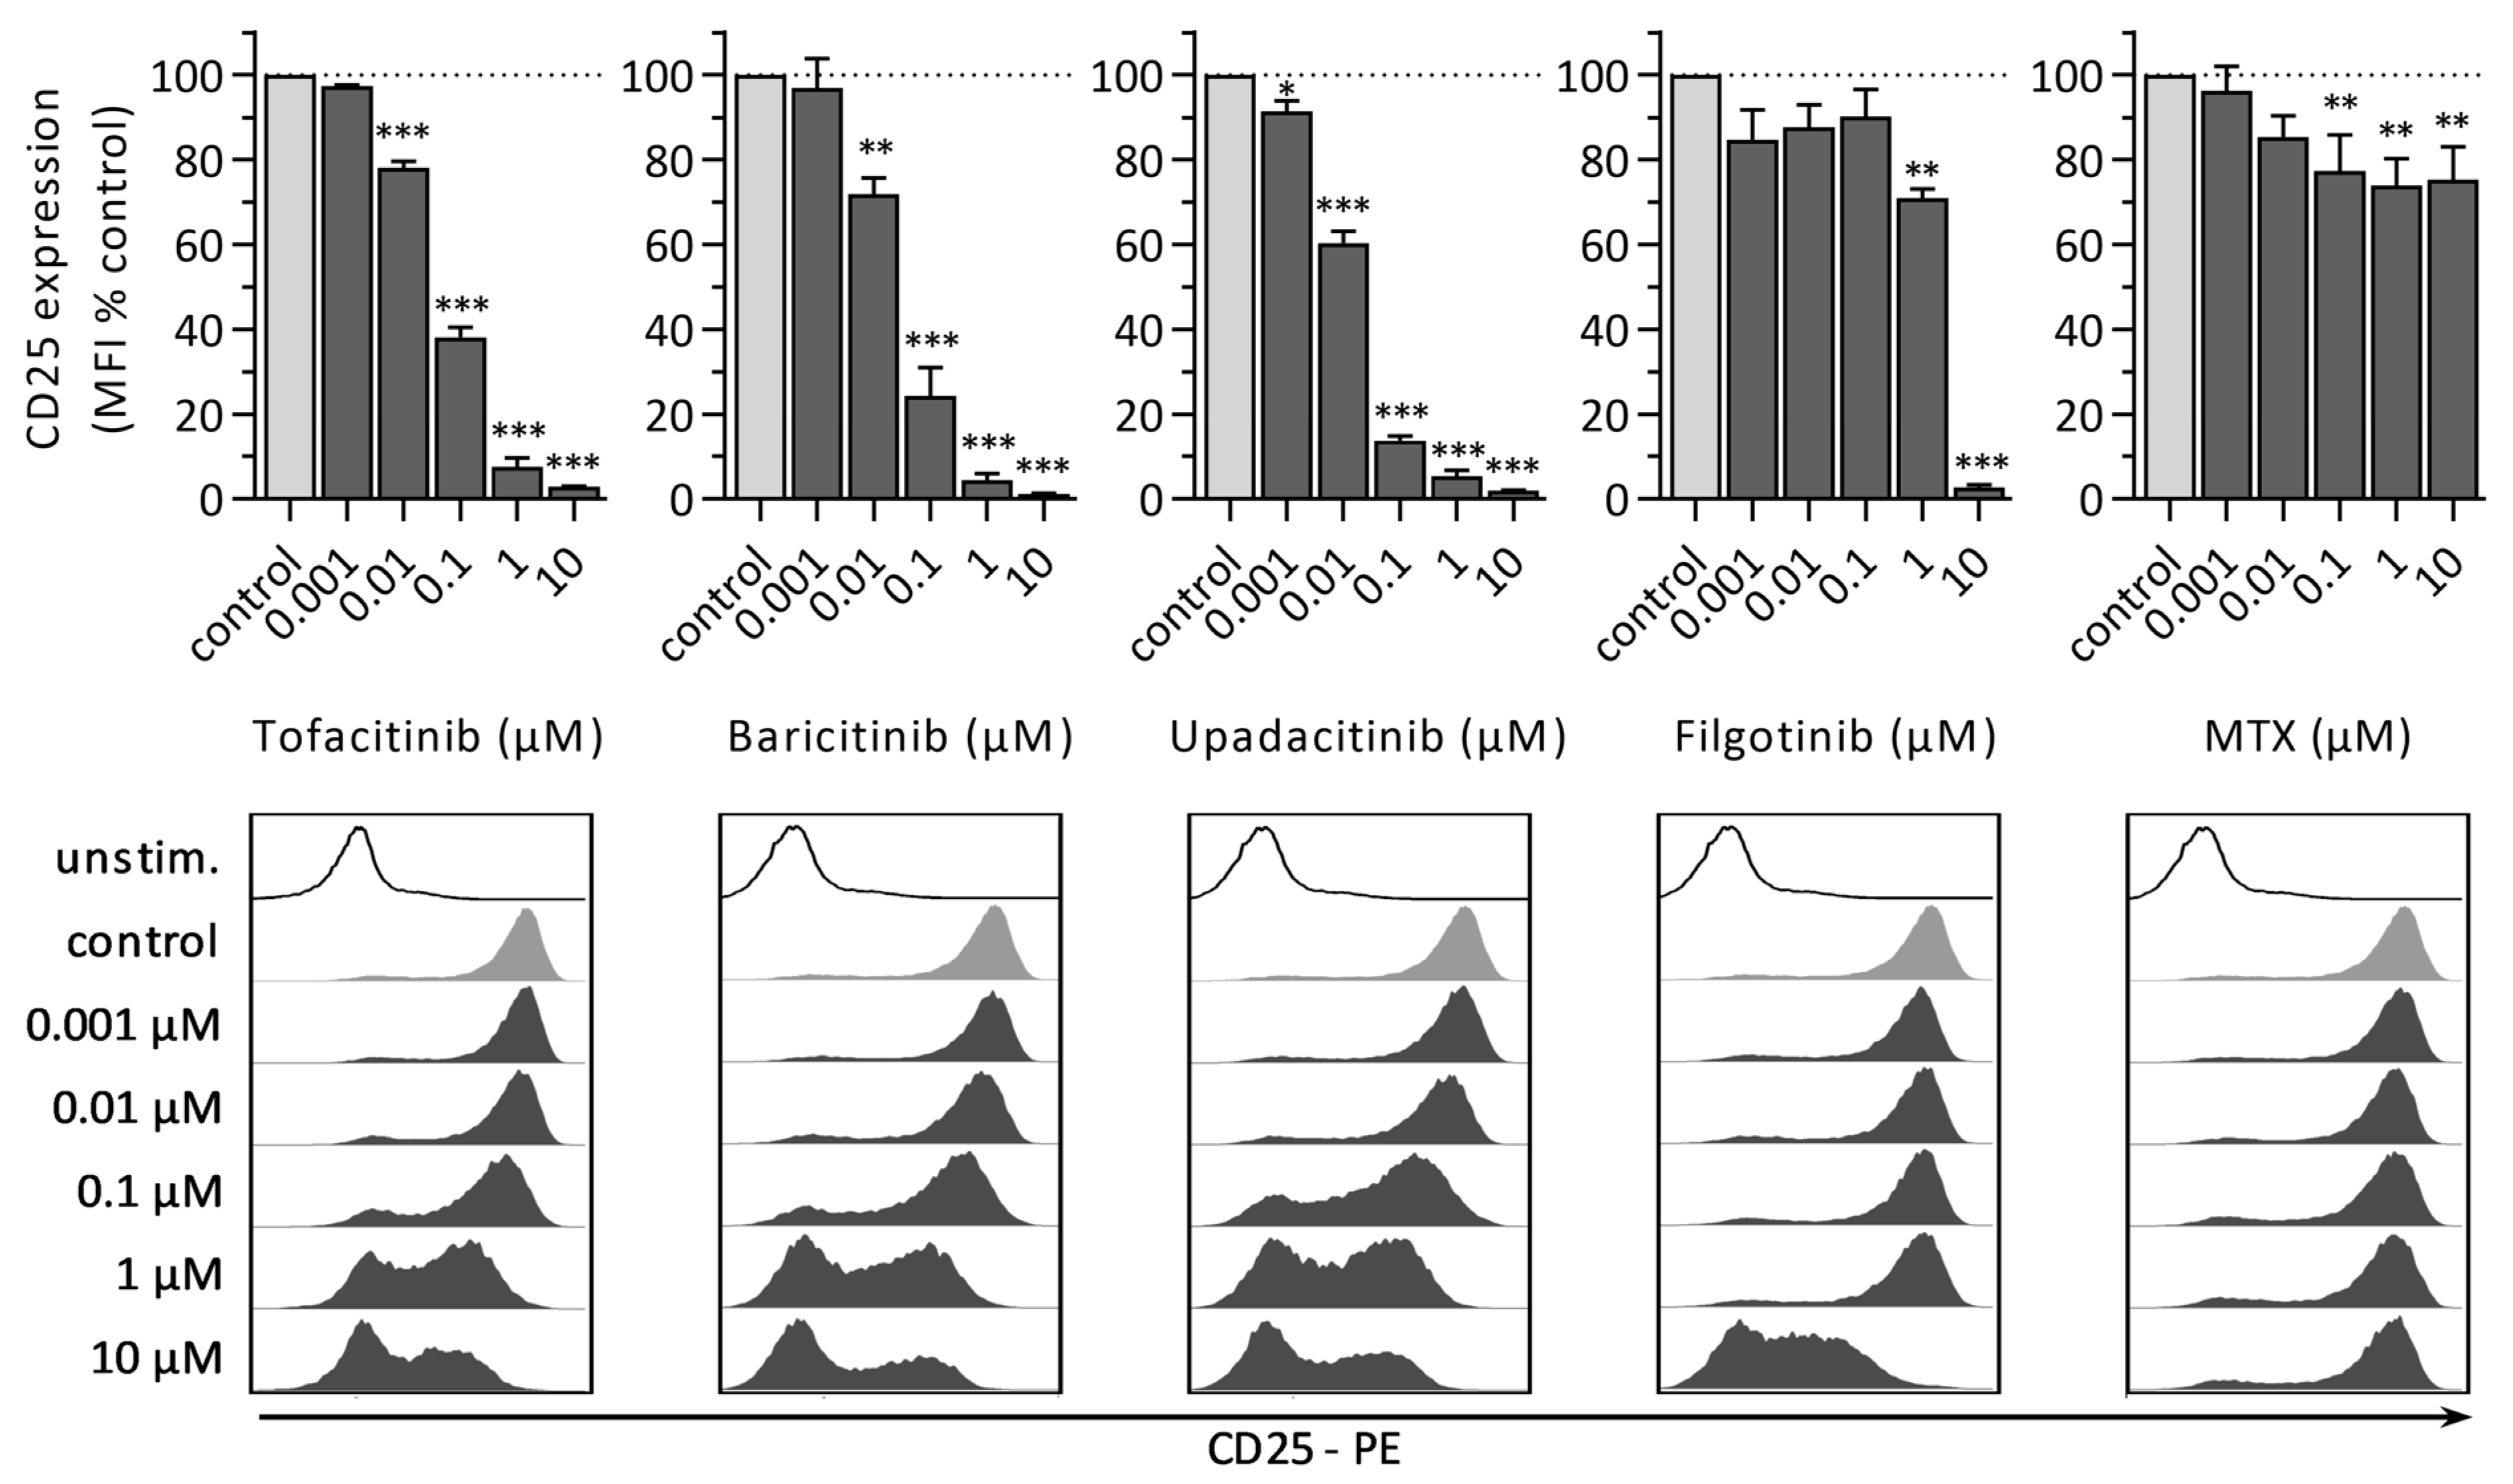
3.1.3. CD25 Expression
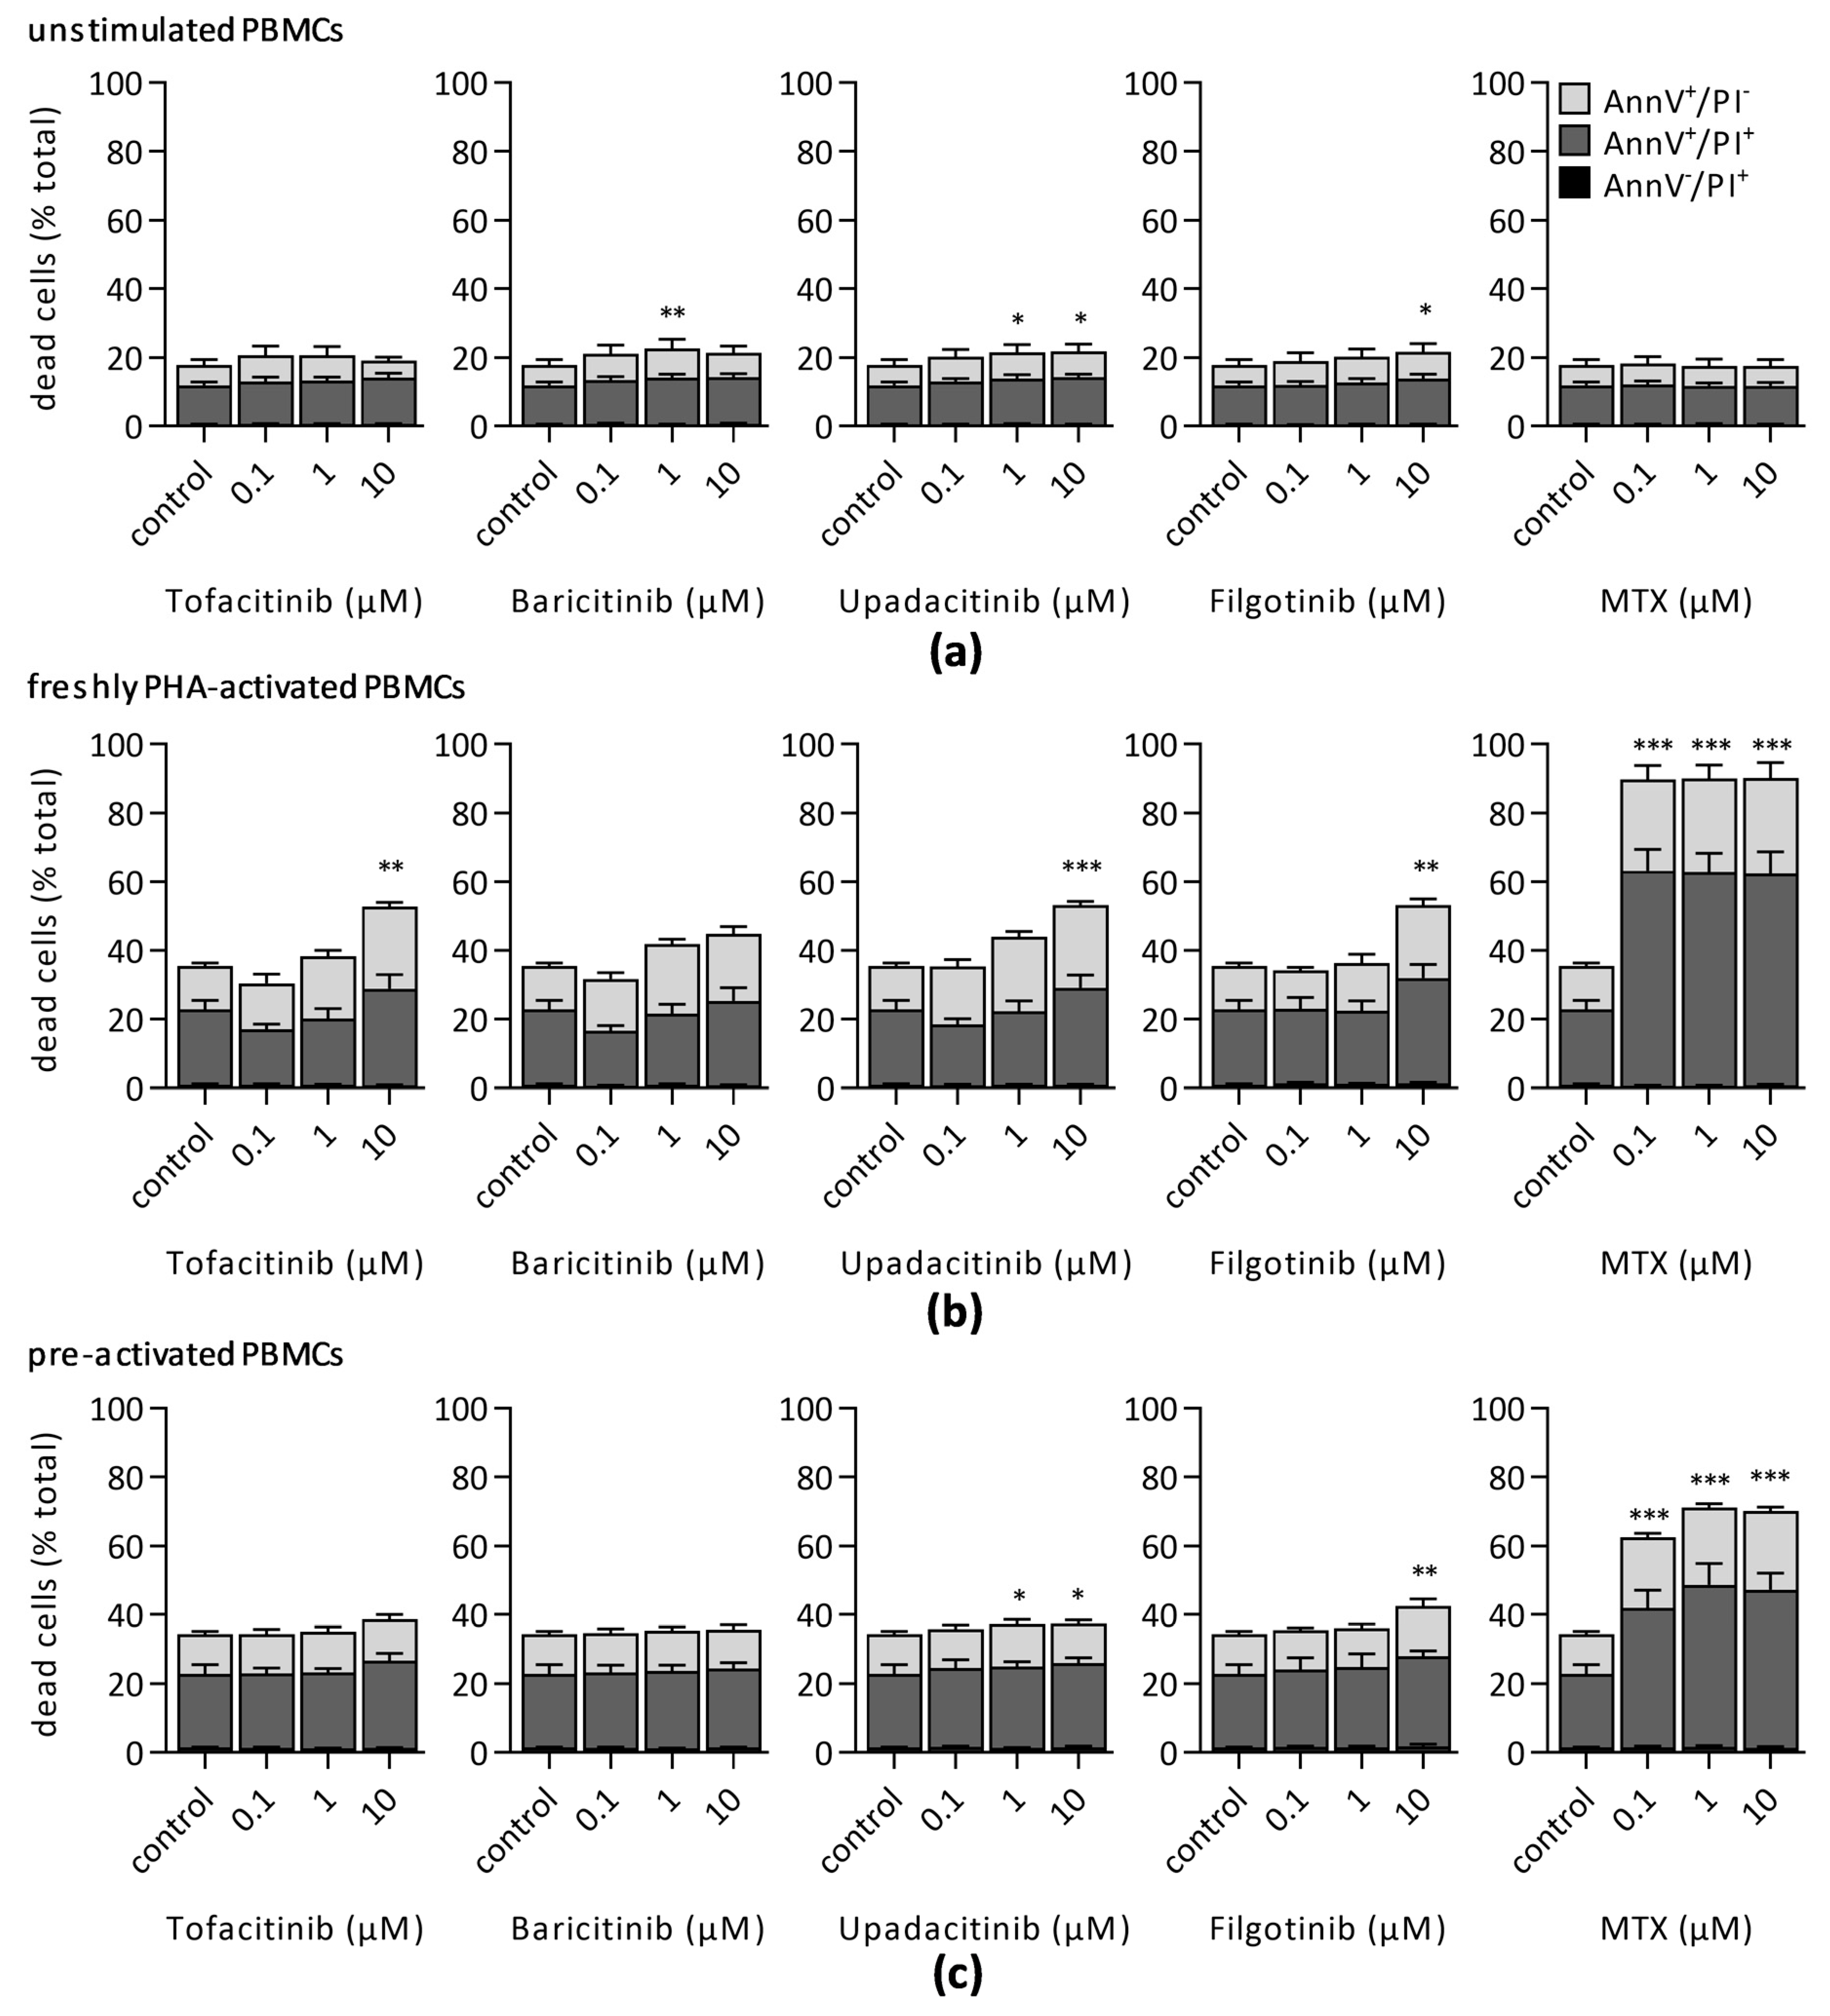
3.2. Impact of JAKi and MTX on Lymphocyte Viability
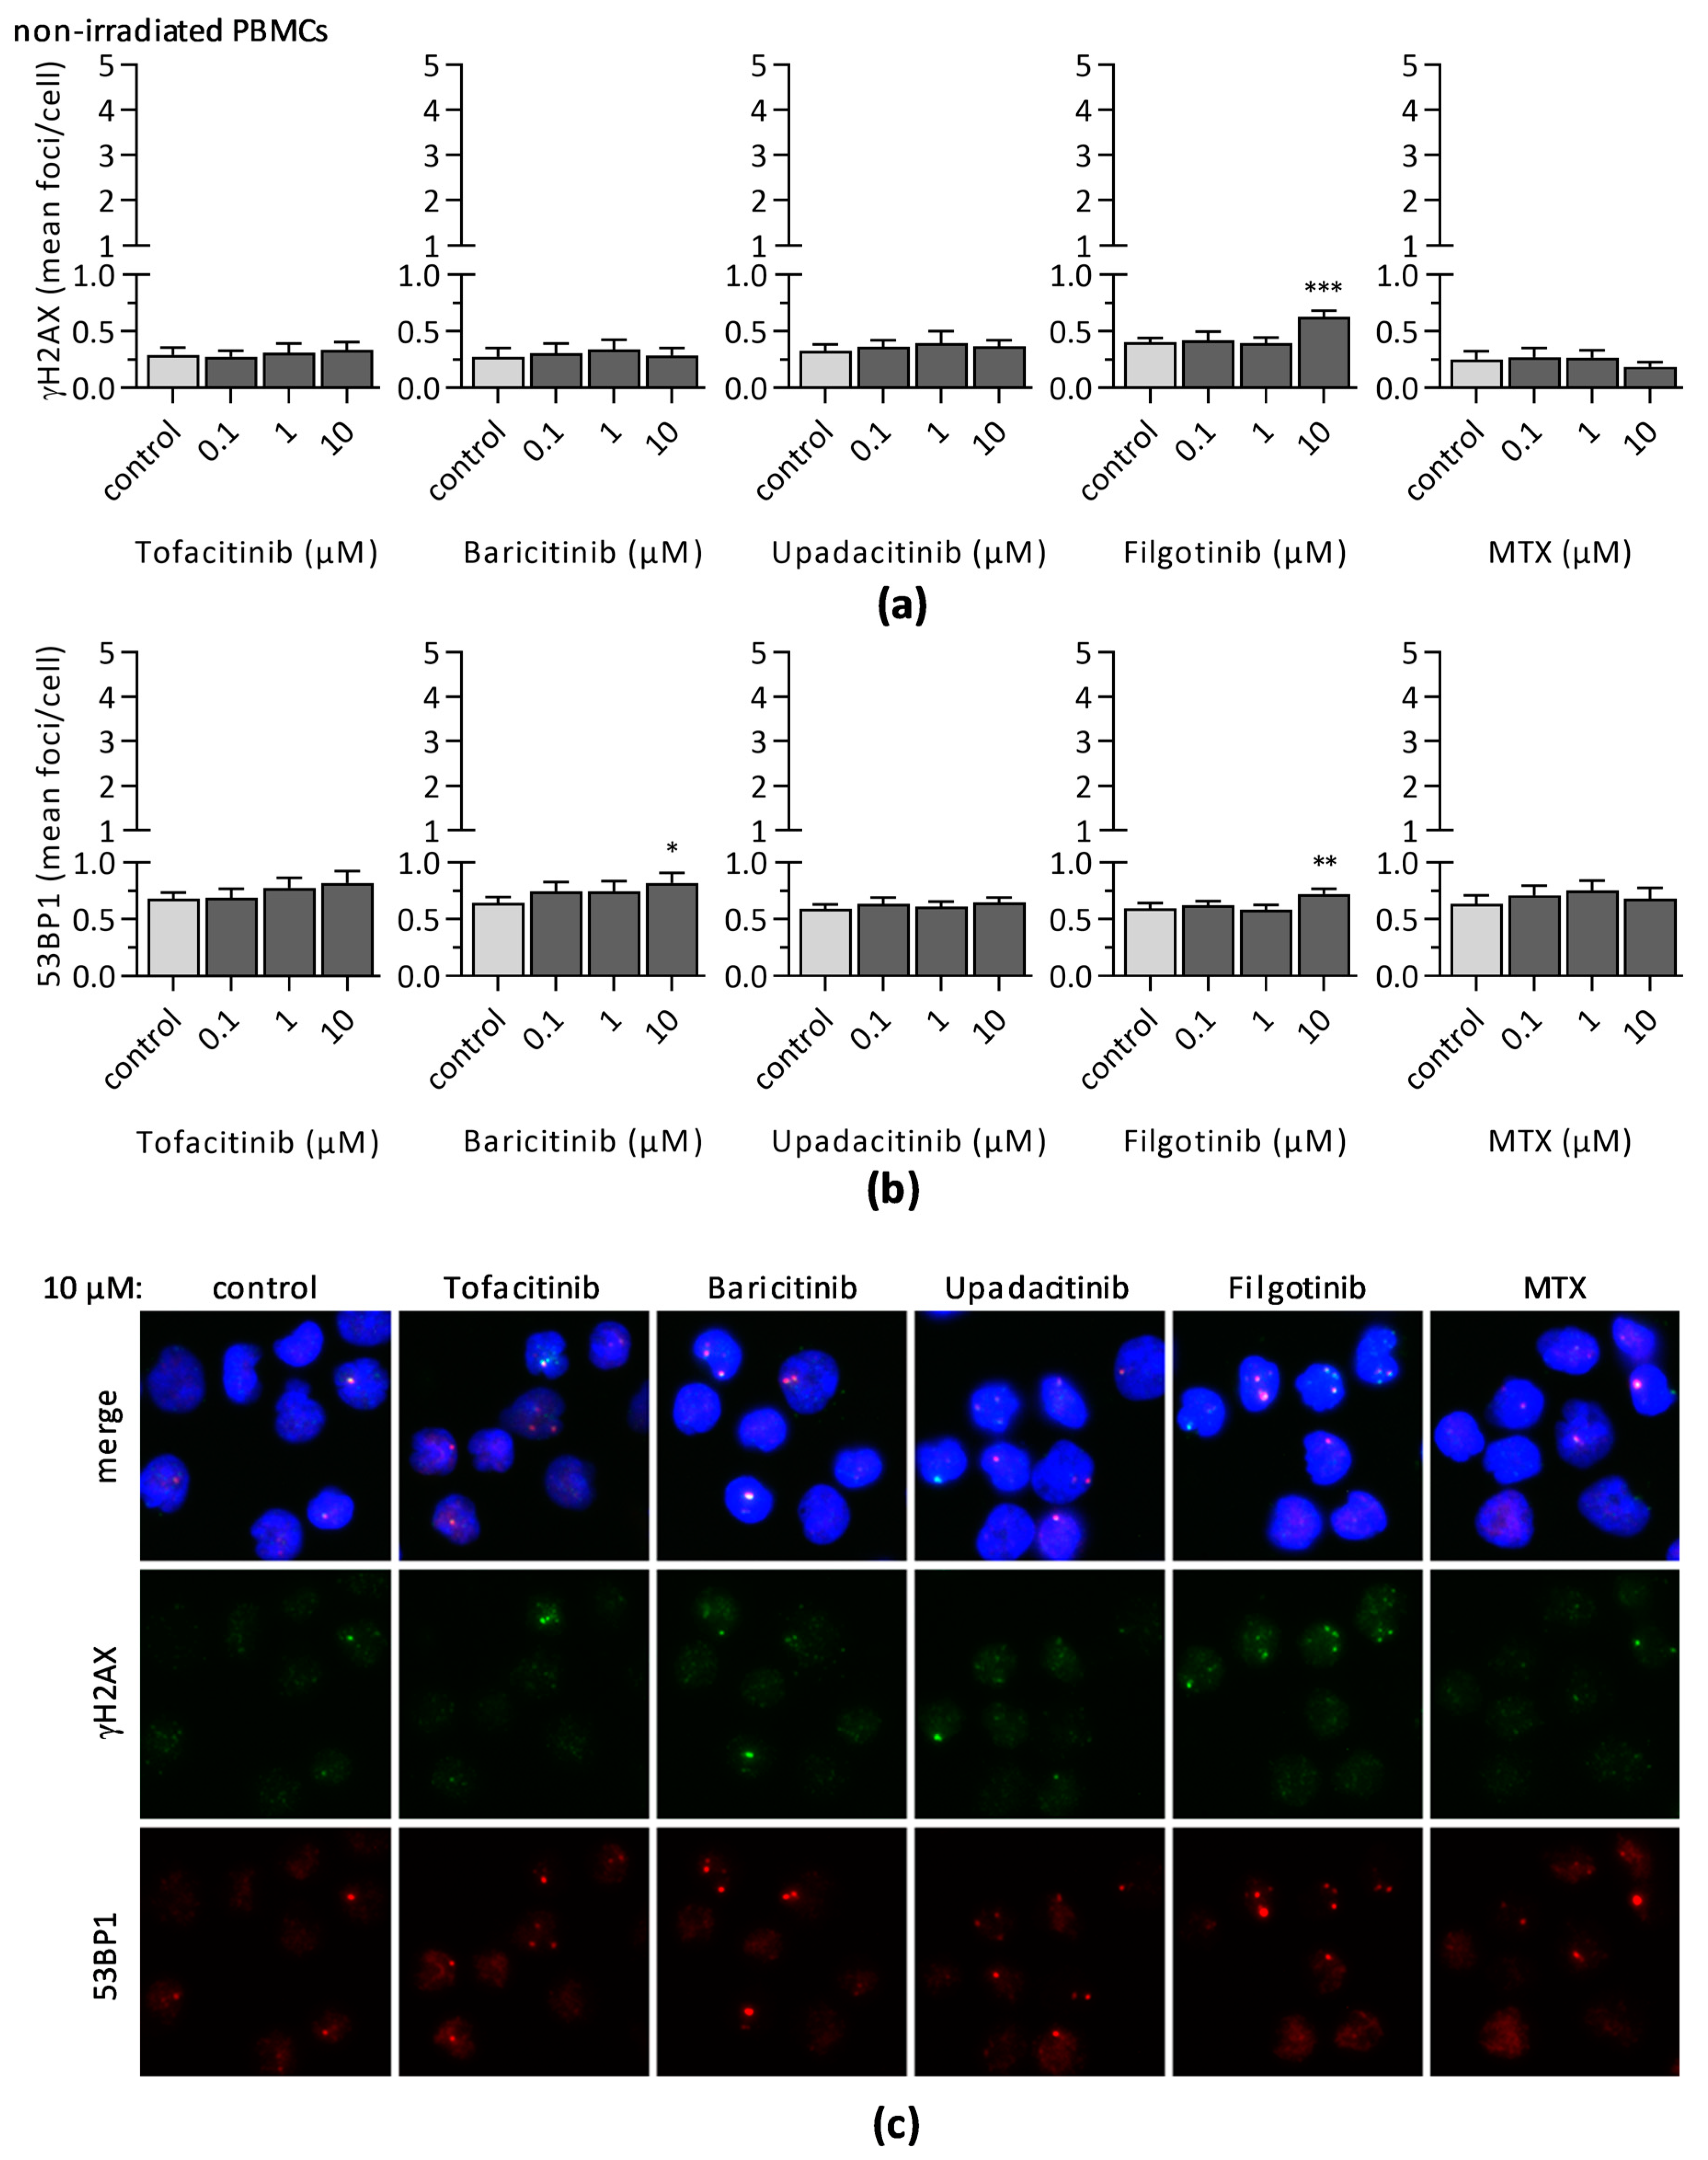
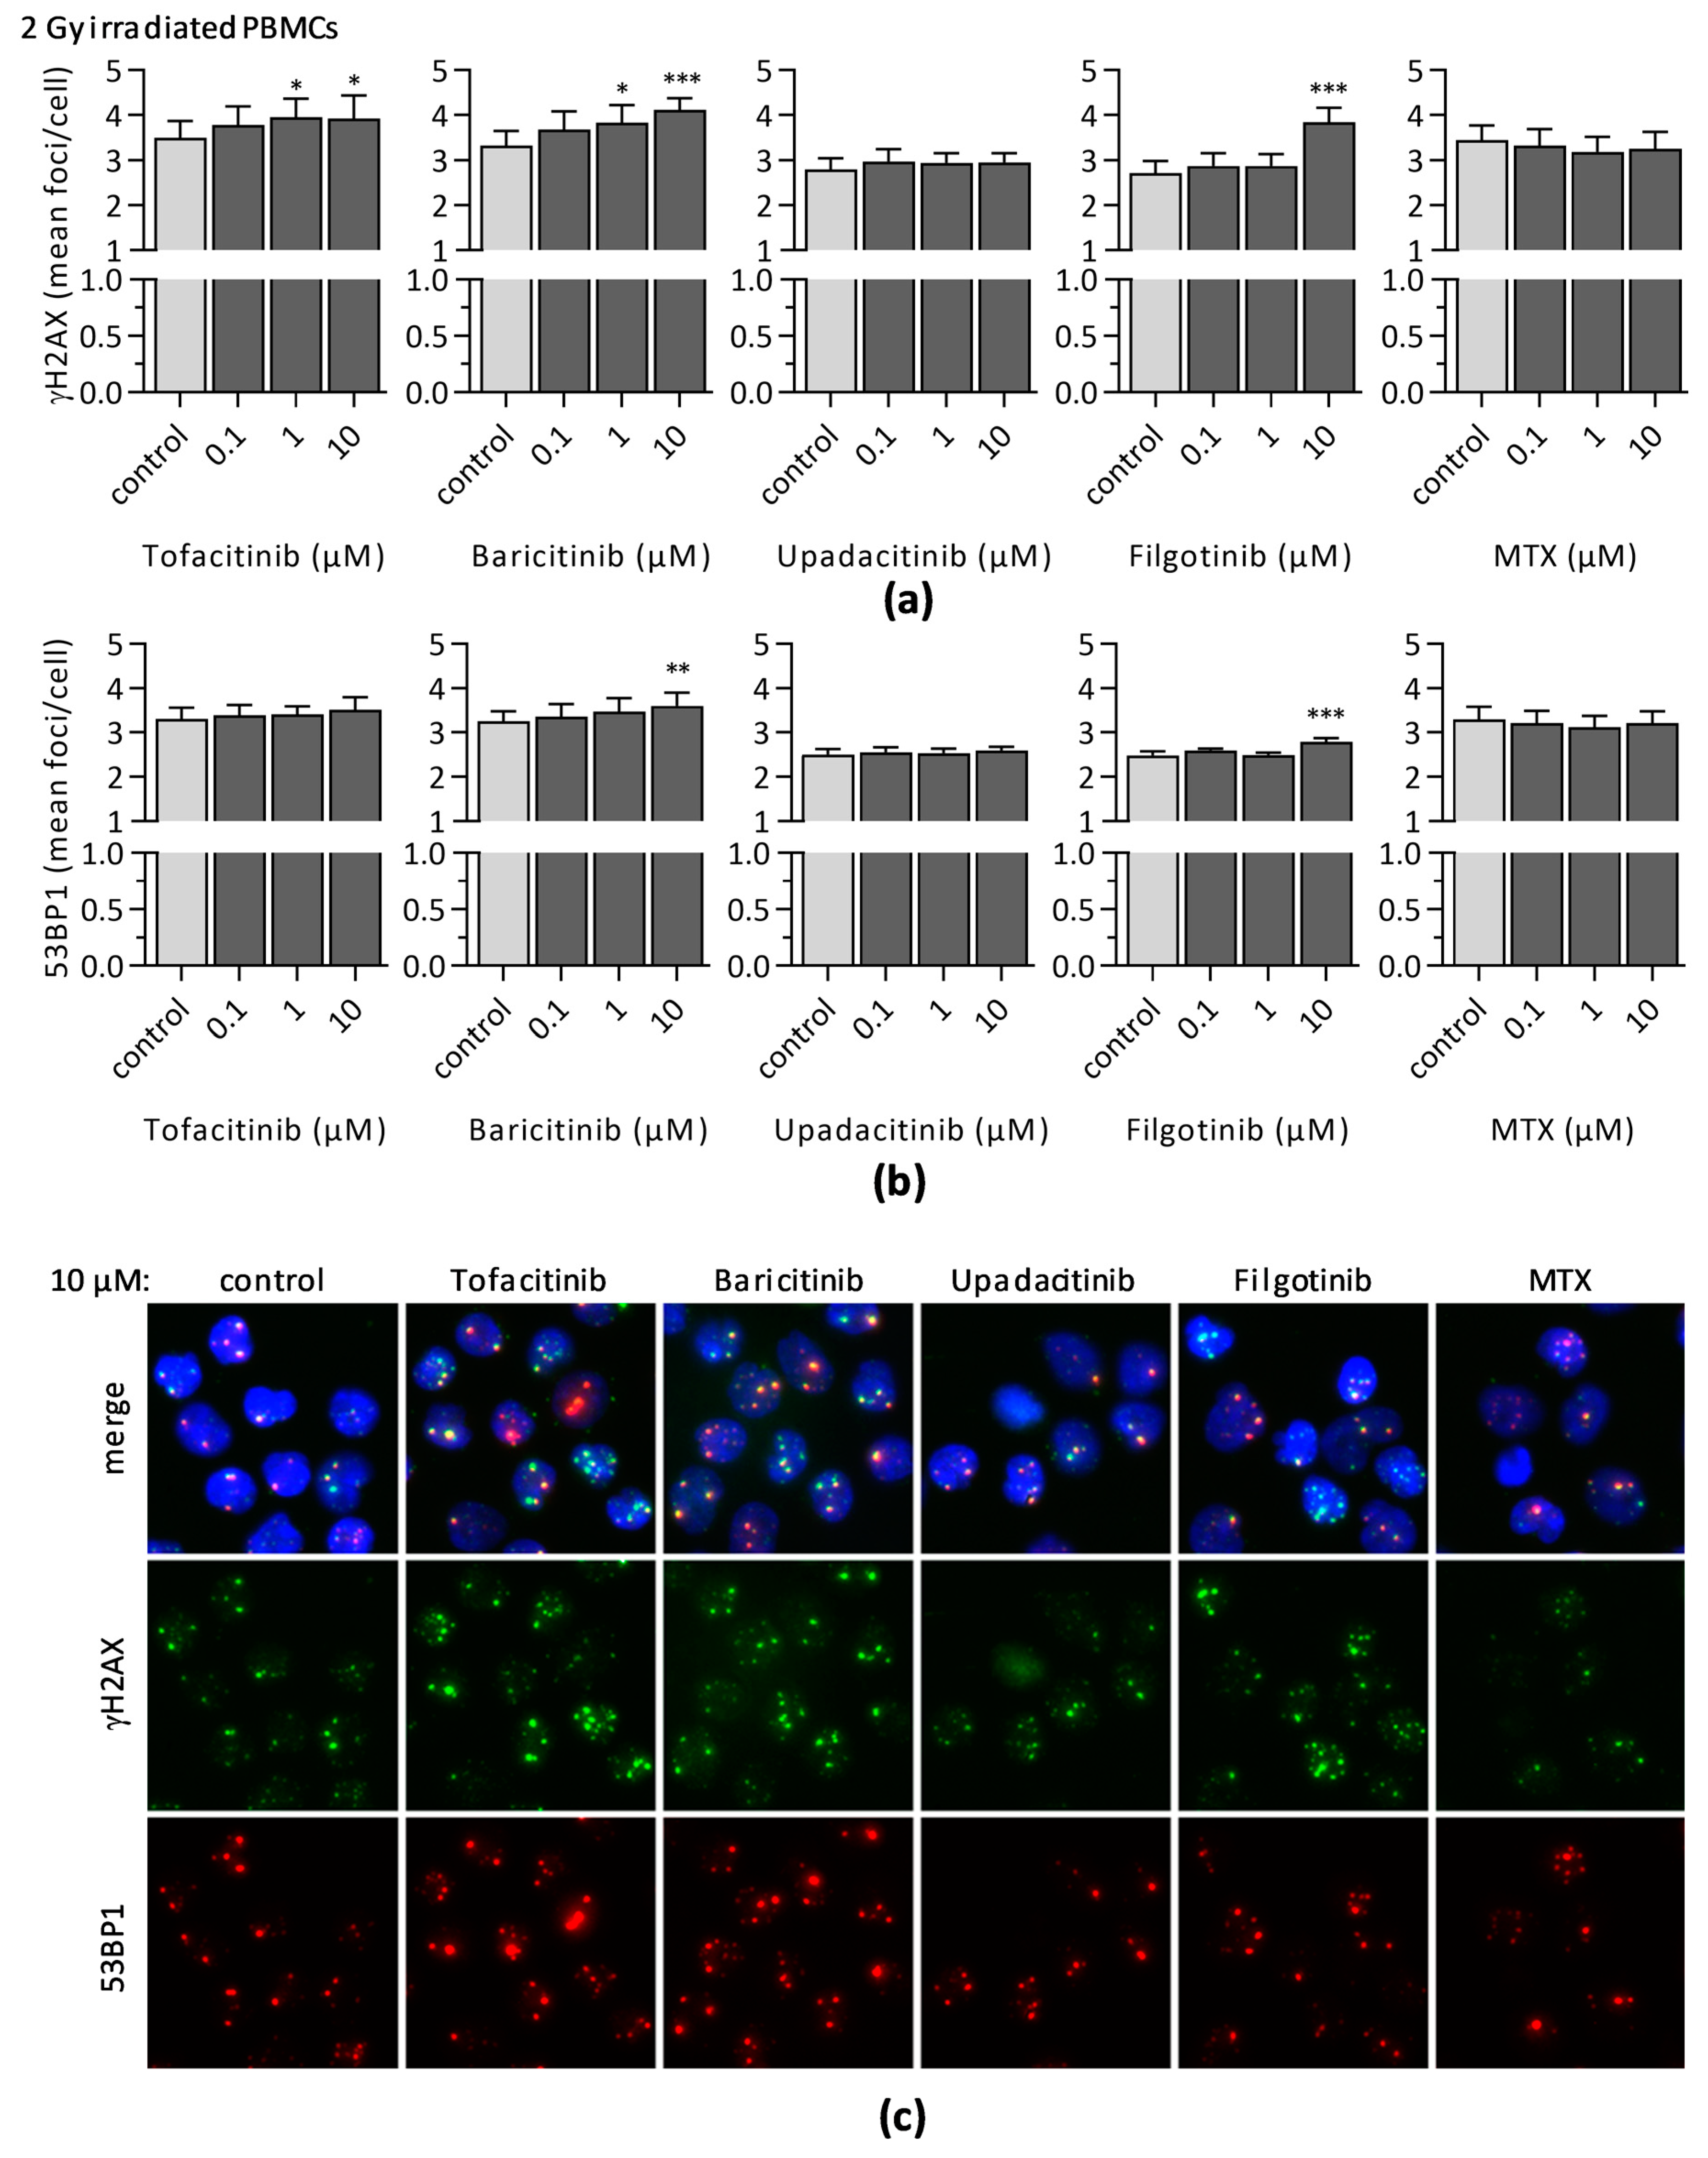
3.3. Impact of JAKi and MTX on DNA Double-Strand Break Formation and DNA Repair
4. Discussion
5. Conclusions
Supplementary Materials
Author Contributions
Funding
Institutional Review Board Statement
Informed Consent Statement
Conflicts of Interest
References
- Smolen, J.S.; Aletaha, D.; Barton, A.; Burmester, G.R.; Emery, P.; Firestein, G.S.; Kavanaugh, A.; McInnes, I.B.; Solomon, D.H.; Strand, V.; et al. Rheumatoid arthritis. Nat. Rev. Dis. Prim. 2018, 4, 1–23. [Google Scholar] [CrossRef] [PubMed]
- Semerano, L.; Decker, P.; Clavel, G.; Boissier, M.C. Developments with investigational Janus kinase inhibitors for rheumatoid arthritis. Expert Opin. Investig. Drugs 2016, 25, 1355–1359. [Google Scholar] [CrossRef] [Green Version]
- Burmester, G.R.; Bijlsma, J.W.J.; Cutolo, M.; McInnes, I.B. Managing rheumatic and musculoskeletal diseases-past, present and future. Nat. Rev. Rheumatol. 2017, 13, 443–448. [Google Scholar] [CrossRef] [Green Version]
- Bechman, K.; Yates, M.; Galloway, J.B. The new entries in the therapeutic armamentarium: The small molecule JAK inhibitors. Pharmacol. Res. 2019, 147, 104392. [Google Scholar] [CrossRef]
- Krüger, K. Role of janus kinase inhibitors in the treatment of rheumatic diseases. Internist 2019, 60, 1215–1220. [Google Scholar] [CrossRef] [PubMed]
- Winthrop, K.L. The emerging safety profile of JAK inhibitors in rheumatic disease. Nat. Rev. Rheumatol. 2017, 13, 234–243. [Google Scholar] [CrossRef] [PubMed]
- Damsky, W.; Peterson, D.; Ramseier, J.; Al-Bawardy, B.; Chun, H.; Proctor, D.; Strand, V.; Flavell, R.A.; King, B. The emerging role of Janus kinase inhibitors in the treatment of autoimmune and inflammatory diseases. J. Allergy Clin. Immunol. 2020. [Google Scholar] [CrossRef] [PubMed]
- Menet, C.J.; Van Rompaey, L.; Geney, R. Advances in the Discovery of Selective JAK Inhibitors. Prog. Med. Chem. 2013, 52, 153–223. [Google Scholar] [PubMed]
- Salas, A.; Hernandez-Rocha, C.; Duijvestein, M.; Faubion, W.; McGovern, D.; Vermeire, S.; Vetrano, S.; Vande Casteele, N. JAK–STAT pathway targeting for the treatment of inflammatory bowel disease. Nat. Rev. Gastroenterol. Hepatol. 2020, 17, 323–337. [Google Scholar] [CrossRef]
- Schwartz, D.M.; Kanno, Y.; Villarino, A.; Ward, M.; Gadina, M.; O’Shea, J.J. JAK inhibition as a therapeutic strategy for immune and inflammatory diseases. Nat. Rev. Drug Discov. 2017, 16, 843–862. [Google Scholar] [CrossRef]
- O’Shea, J.J.; Plenge, R. JAKs and STATs in Immunoregulation and Immune-Mediated Disease. Immunity 2013, 36, 542–550. [Google Scholar] [CrossRef] [PubMed] [Green Version]
- Villarino, A.V.; Kanno, Y.; O’Shea, J.J. Mechanisms and consequences of Jak-STAT signaling in the immune system. Nat. Immunol. 2017, 18, 374–384. [Google Scholar] [CrossRef] [PubMed]
- Harrington, R.; Al Nokhatha, S.A.; Conway, R. Jak inhibitors in rheumatoid arthritis: An evidence-based review on the emerging clinical data. J. Inflamm. Res. 2020, 13, 519–531. [Google Scholar] [CrossRef]
- Dhillon, S.; Keam, S.J. Filgotinib: First Approval. Drugs 2020, 80, 1987–1997. [Google Scholar] [CrossRef] [PubMed]
- O’Shea, J.J.; Gadina, M. Selective Janus kinase inhibitors come of age. Nat. Rev. Rheumatol. 2019, 15, 74–75. [Google Scholar] [CrossRef] [PubMed]
- Choy, E.H. Clinical significance of Janus Kinase inhibitor selectivity. Rheumatology 2019, 58, 953–962. [Google Scholar] [CrossRef] [Green Version]
- McInnes, I.B.; Byers, N.L.; Higgs, R.E.; Lee, J.; Macias, W.L.; Na, S.; Ortmann, R.A.; Rocha, G.; Rooney, T.P.; Wehrman, T.; et al. Comparison of baricitinib, upadacitinib, and tofacitinib mediated regulation of cytokine signaling in human leukocyte subpopulations. Arthritis Res. Ther. 2019, 21, 1–10. [Google Scholar] [CrossRef] [Green Version]
- Russell, A.S. Activated lymphocytes in the peripheral blood of patients with rheumatoid arthritis. J. Rheumatol. 1990, 17, 589–596. [Google Scholar]
- Kitanaga, Y.; Imamura, E.; Nakahara, Y.; Fukahori, H.; Fujii, Y.; Kubo, S.; Nakayamada, S.; Tanaka, Y. In vitro pharmacological effects of peficitinib on lymphocyte activation: A potential treatment for systemic sclerosis with JAK inhibitors. Rheumatology 2020, 59, 1957–1968. [Google Scholar] [CrossRef] [Green Version]
- Barry, S.P.; Townsend, P.A.; Knight, R.A.; Scarabelli, T.M.; Latchman, D.S.; Stephanou, A. STAT3 modulates the DNA damage response pathway. Int. J. Exp. Pathol. 2010, 91, 506–514. [Google Scholar] [CrossRef]
- Bonner, J.A.; Trummell, H.Q.; Bonner, A.B.; Willey, C.D.; Bredel, M.; Yang, E.S. Enhancement of Cetuximab-Induced Radiosensitization by JAK-1 Inhibition. BMC Cancer 2015, 15, 1–12. [Google Scholar] [CrossRef] [Green Version]
- Gupta, P.; Sharma, Y.; Viswanathan, P.; Gupta, S. Cellular cytokine receptor signaling and ATM pathway intersections affect hepatic DNA repair. Cytokine 2020, 127, 154946. [Google Scholar] [CrossRef] [PubMed]
- Nieborowska-Skorska, M.; Maifrede, S.; Dasgupta, Y.; Sullivan, K.; Flis, S.; Le, B.V.; Solecka, M.; Belyaeva, E.A.; Kubovcakova, L.; Nawrocki, M.; et al. Ruxolitinib-induced defects in DNA repair cause sensitivity to PARP inhibitors in myeloproliferative neoplasms. Blood 2017, 130, 2848–2859. [Google Scholar] [CrossRef] [PubMed] [Green Version]
- Yang, P.L.; Liu, L.X.; Li, E.M.; Xu, L.Y. Stat3, the challenge for chemotherapeutic and radiotherapeutic efficacy. Cancers 2020, 12, 2459. [Google Scholar] [CrossRef]
- Bonner, W.M.; Redon, C.E.; Dickey, J.S.; Nakamura, A.J.; Sedelnikova, O.A.; Solier, S.; Pommier, Y. GammaH2AX and cancer. Nat. Rev. Cancer 2008, 8, 957–967. [Google Scholar] [CrossRef]
- Marková, E.; Schultz, N.; Belyaev, I.Y. Kinetics and dose-response of residual 53BP1/γ-H2AX foci: Co-localization, relationship with DSB repair and clonogenic survival. Int. J. Radiat. Biol. 2007, 83, 319–329. [Google Scholar] [CrossRef]
- Rothkamm, K.; Barnard, S.; Moquet, J.; Ellender, M.; Rana, Z.; Burdak-Rothkamm, S. DNA damage foci: Meaning and significance. Environ. Mol. Mutagen. 2015, 56, 491–504. [Google Scholar] [CrossRef] [PubMed]
- Reddig, A.; Roggenbuck, D.; Reinhold, D. Comparison of different immunoassays for γH2AX quantification. J. Lab. Precis. Med. 2018, 3, 80. [Google Scholar] [CrossRef]
- Willitzki, A.; Lorenz, S.; Hiemann, R.; Guttek, K.; Goihl, A.; Hartig, R.; Conrad, K.; Feist, E.; Sack, U.; Schierack, P.; et al. Fully automated analysis of chemically induced γH2AX foci in human peripheral blood mononuclear cells by indirect immunofluorescence. Cytom. A 2013, 83, 1017–1026. [Google Scholar] [CrossRef]
- Wöltgens, J.H.M.; Lyaruu, D.M.; Bronckers, A.L.J.J.; Van Duin, M.A.; Bervoets, T.J.M. Effect of methotrexate on cell proliferation in developing hamster molar tooth germs in vitro. Eur. J. Oral Sci. 1998, 106, 156–159. [Google Scholar] [CrossRef]
- Lefevre, P.L.C.; Vande Casteele, N. Clinical Pharmacology of Janus Kinase Inhibitors in Inflammatory Bowel Disease. J. Crohns. Colitis 2020, 14, S725–S736. [Google Scholar] [CrossRef]
- Angelini, J.; Talotta, R.; Roncato, R.; Fornasier, G.; Barbiero, G.; Cin, L.D.; Brancati, S.; Scaglione, F. JAK-inhibitors for the treatment of rheumatoid arthritis: A focus on the present and an outlook on the future. Biomolecules 2020, 10, 1002. [Google Scholar] [CrossRef]
- Gilead Sciences Gilead Receives Complete Response Letter for Filgotinib for the Treatment of Moderately to Severely Active Rheumatoid Arthritis. Available online: https://www.businesswire.com/news/home/20200818005811/en/ (accessed on 30 December 2020).
- Markham, A.; Keam, S.J. Peficitinib: First Global Approval. Drugs 2019, 79, 887–891. [Google Scholar] [CrossRef]
- Tanaka, Y.; Izutsu, H. Peficitinib for the treatment of rheumatoid arthritis: An overview from clinical trials. Expert Opin. Pharmacother. 2020, 21, 1015–1025. [Google Scholar] [CrossRef]
- Pope, J.; Sawant, R.; Tundia, N.; Du, E.X.; Qi, C.Z.; Song, Y.; Tang, P.; Betts, K.A. Comparative Efficacy of JAK Inhibitors for Moderate-To-Severe Rheumatoid Arthritis: A Network Meta-Analysis. Adv. Ther. 2020, 37, 2356–2372. [Google Scholar] [CrossRef] [Green Version]
- Lee, Y.H.; Song, G.G. Comparative efficacy and safety of tofacitinib, baricitinib, upadacitinib, and filgotinib in active rheumatoid arthritis refractory to biologic disease-modifying antirheumatic drugs. Z. Rheumatol. 2020. [Google Scholar] [CrossRef]
- Dowty, M.E.; Lin, T.H.; Jesson, M.I.; Hegen, M.; Martin, D.A.; Katkade, V.; Menon, S.; Telliez, J.B. Janus kinase inhibitors for the treatment of rheumatoid arthritis demonstrate similar profiles of in vitro cytokine receptor inhibition. Pharmacol. Res. Perspect. 2019, 7, 1–11. [Google Scholar] [CrossRef] [PubMed] [Green Version]
- Damoiseaux, J. The IL-2—IL-2 receptor pathway in health and disease: The role of the soluble IL-2 receptor. Clin. Immunol. 2020, 218, 108515. [Google Scholar] [CrossRef] [PubMed]
- Shatrova, A.N.; Mityushova, E.V.; Vassilieva, I.O.; Aksenov, N.D.; Zenin, V.V.; Nikolsky, N.N.; Marakhova, I.I. Time-dependent regulation of IL-2R α-chain (CD25) expression by TCR signal strength and IL-2-induced STAT5 signaling in activated human blood T lymphocytes. PLoS ONE 2016, 11, e167215. [Google Scholar] [CrossRef] [PubMed] [Green Version]
- Nakajima, H.; Liu, X.W.; Wynshaw-Boris, A.; Rosenthal, L.A.; Imada, K.; Finbloom, D.S.; Hennighausen, L.; Leonard, W.J. An indirect effect of Stat5a in IL-2-induced proliferation: A critical role for stat5a in IL-2-mediated IL-2 receptor α chain induction. Immunity 1997, 7, 691–701. [Google Scholar] [CrossRef] [Green Version]
- Parampalli Yajnanarayana, S.; Stübig, T.; Cornez, I.; Alchalby, H.; Schönberg, K.; Rudolph, J.; Triviai, I.; Wolschke, C.; Heine, A.; Brossart, P.; et al. JAK1/2 inhibition impairs T cell function in vitro and in patients with myeloproliferative neoplasms. Br. J. Haematol. 2015, 169, 824–833. [Google Scholar] [CrossRef] [PubMed]
- Nesher, G.; Moore, T.L. The in vitro effects of methotrexate on peripheral blood mononuclear cells: Modulation by methyl donors and spermidine. Arthritis Rheum. 1990, 33, 954–959. [Google Scholar] [CrossRef] [PubMed]
- Genestier, L.; Paillot, R.; Fournel, S.; Ferraro, C.; Miossec, P.; Revillard, J.P. Immunosuppressive properties of methotrexate: Apoptosis and clonal deletion of activated peripheral T cells. J. Clin. Investig. 1998, 102, 322–328. [Google Scholar] [CrossRef] [PubMed]
- Fairbanks, L.D.; Rückemann, K.; Qiu, Y.; Hawrylowicz, C.M.; Richards, D.F.; Swaminathan, R.; Kirschbaum, B.; Simmonds, H.A. Methotrexate inhibits the first committed step of purine biosynthesis in mitogen-stimulated human T-lymphocytes: A metabolic basis for efficacy in rheumatoid arthritis? Biochem. J. 1999, 342, 143–152. [Google Scholar] [CrossRef]
- Herman, S.; Zurgil, N.; Deutsch, M. Low dose methotrexate induces apoptosis with reactive oxygen species involvement in T lymphocytic cell lines to a greater extent than in monocytic lines. Inflamm. Res. 2005, 54, 273–280. [Google Scholar] [CrossRef] [PubMed]
- Romão, V.C.; Lima, A.; Bernardes, M.; Canhão, H.; Fonseca, J.E. Three decades of low-dose methotrexate in rheumatoid arthritis: Can we predict toxicity? Immunol. Res. 2014, 60, 289–310. [Google Scholar] [CrossRef]
- Bedoui, Y.; Guillot, X.; Sélambarom, J.; Guiraud, P.; Giry, C.; Jaffar-Bandjee, M.C.; Ralandison, S.; Gasque, P. Methotrexate an old drug with new tricks. Int. J. Mol. Sci. 2019, 20, 5023. [Google Scholar] [CrossRef] [Green Version]
- Vítor, A.C.; Huertas, P.; Legube, G.; de Almeida, S.F. Studying DNA Double-Strand Break Repair: An Ever-Growing Toolbox. Front. Mol. Biosci. 2020, 7, 24. [Google Scholar] [CrossRef] [Green Version]
- Jeggo, P.A.; Löbrich, M. How cancer cells hijack DNA double-strand break repair pathways to gain genomic instability. Biochem. J. 2015, 471, 1–11. [Google Scholar] [CrossRef]
- Turinetto, V.; Giachino, C. Survey and summary multiple facets of histone variant H2AX: A DNA double-strand-break marker with several biological functions. Nucleic Acids Res. 2015, 43, 2489–2498. [Google Scholar] [CrossRef] [Green Version]
- Tanaka, T.; Kajstura, M.; Halicka, H.D.; Traganos, F.; Darzynkiewicz, Z. Constitutive histone H2AX phosphorylation and ATM activation are strongly amplified during mitogenic stimulation of lymphocytes. Cell Prolif. 2007, 40, 1–13. [Google Scholar] [CrossRef] [PubMed]
- Vignon, C.; Debeissat, C.; Georget, M.T.; Bouscary, D.; Gyan, E.; Rosset, P.; Herault, O. Flow Cytometric Quantification of All Phases of the Cell Cycle and Apoptosis in a Two-Color Fluorescence Plot. PLoS ONE 2013, 8, e68425. [Google Scholar] [CrossRef] [PubMed] [Green Version]
- Hall, W.A.; Sabharwal, L.; Udhane, V.; Maranto, C.; Nevalainen, M.T. Cytokines, JAK-STAT Signaling and Radiation-Induced DNA Repair in Solid Tumors: Novel Opportunities for Radiation Therapy. Int. J. Biochem. Cell Biol. 2020, 127, 105827. [Google Scholar] [CrossRef] [PubMed]
- Spitzner, M.; Ebner, R.; Wolff, H.A.; Michael Ghadimi, B.; Wienands, J.; Grade, M. STAT3: A novel molecular mediator of resistance to chemoradiotherapy. Cancers 2014, 6, 1986–2011. [Google Scholar] [CrossRef]
- Wang, X.; Zhang, X.; Qiu, C.; Yang, N. STAT3 Contributes to Radioresistance in Cancer. Front. Oncol. 2020, 10, 1–8. [Google Scholar] [CrossRef] [PubMed]
- Maranto, C.; Udhane, V.; Hoang, D.T.; Gu, L.; Alexeev, V.; Malas, K.; Cardenas, K.; Brody, J.R.; Rodeck, U.; Bergom, C.; et al. STAT5A/B Blockade Sensitizes Prostate Cancer to Radiation through Inhibition of RAD51 and DNA Repair. Clin. Cancer Res. 2018, 24, 1917–1931. [Google Scholar] [CrossRef] [Green Version]
- Pharmacology Review NDAReference ID: 3205502. Available online: https://www.accessdata.fda.gov/drugsatfda_docs/nda/2012/203214Orig1s000PharmR.pdf (accessed on 18 March 2021).
- Pharmacology Review NDAReference ID: 4261989. Available online: https://www.accessdata.fda.gov/drugsatfda_docs/nda/2018/207924Orig1s000PharmR.pdf (accessed on 18 March 2021).
- Clinical Pharmacology and Biopharmaceutics Review NDAReference ID: 4435111. Available online: https://www.accessdata.fda.gov/drugsatfda_docs/nda/2019/211675Orig1s000ClinPharmR.pdf (accessed on 18 March 2021).
- Assessment Report EMA/CHMP/853224/2016. Available online: https://www.ema.europa.eu/en/documents/assessment-report/xeljanz-epar-public-assessment-report_en.pdf (accessed on 18 March 2021).
- Assessment Report EMA/520470/2020. Available online: https://www.ema.europa.eu/en/documents/variation-report/olumiant-h-c-4085-ii-0016-epar-assessment-report-variation_en.pdf (accessed on 18 March 2021).
- Assessment Report EMA/608624/2019. Available online: https://www.ema.europa.eu/en/documents/assessment-report/rinvoq-epar-public-assessment-report_en.pdf (accessed on 18 March 2021).
- Assessment Report EMA/424374/2020. Available online: https://www.ema.europa.eu/en/documents/assessment-report/jyseleca-epar-public-assessment-report_en.pdf (accessed on 18 March 2021).
- Vanhoutte, F.; Mazur, M.; Voloshyn, O.; Stanislavchuk, M.; Van der Aa, A.; Namour, F.; Galien, R.; Meuleners, L.; van ’t Klooster, G. Efficacy, Safety, Pharmacokinetics, and Pharmacodynamics of Filgotinib, a Selective JAK-1 Inhibitor, After Short-Term Treatment of Rheumatoid Arthritis: Results of Two Randomized Phase IIa Trials. Arthritis Rheumatol. 2017, 69, 1949–1959. [Google Scholar] [CrossRef] [Green Version]
- Traves, P.G.; Murray, B.; Campigotto, F.; Galien, R.; Meng, A.; Di Paolo, J.A. JAK selectivity and the implications for clinical inhibition of pharmacodynamic cytokine signalling by filgotinib, upadacitinib, tofacitinib and baricitinib. Ann. Rheum. Dis. 2021. [Google Scholar] [CrossRef]
- Kameda, H.; Takeuchi, T.; Yamaoka, K.; Oribe, M.; Kawano, M.; Zhou, Y.; Othman, A.A.; Pangan, A.L.; Kitamura, S.; Meerwein, S.; et al. Efficacy and safety of upadacitinib in Japanese patients with rheumatoid arthritis (SELECT-SUNRISE): A placebo-controlled phase IIb/III study. Rheumatology 2020, 59, 3303–3313. [Google Scholar] [CrossRef]
- Weinhold, K.J.; Bukowski, J.F.; Brennan, T.V.; Noveck, R.J.; Staats, J.S.; Lin, L.; Stempora, L.; Hammond, C.; Wouters, A.; Mojcik, C.F.; et al. Reversibility of peripheral blood leukocyte phenotypic and functional changes after exposure to and withdrawal from tofacitinib, a Janus kinase inhibitor, in healthy volunteers. Clin. Immunol. 2018, 191, 10–20. [Google Scholar] [CrossRef]
- Nocturne, G.; Pascaud, J.; Ly, B.; Tahmasebi, F.; Mariette, X. JAK inhibitors alter NK cell functions and may impair immunosurveillance against lymphomagenesis. Cell. Mol. Immunol. 2020, 17, 552–553. [Google Scholar] [CrossRef]
- Parmentier, J.M.; Voss, J.; Graff, C.; Schwartz, A.; Argiriadi, M.; Friedman, M.; Camp, H.S.; Padley, R.J.; George, J.S.; Hyland, D.; et al. In vitro and in vivo characterization of the JAK1 selectivity of upadacitinib (ABT-494). BMC Rheumatol. 2018, 2, 1–11. [Google Scholar] [CrossRef] [Green Version]
- Genovese, M.C.; Smolen, J.S.; Weinblatt, M.E.; Burmester, G.R.; Meerwein, S.; Camp, H.S.; Wang, L.; Othman, A.A.; Khan, N.; Pangan, A.L.; et al. Efficacy and Safety of ABT-494, a Selective JAK-1 Inhibitor, in a Phase IIb Study in Patients With Rheumatoid Arthritis and an Inadequate Response to Methotrexate. Arthritis Rheumatol. 2016, 68, 2857–2866. [Google Scholar] [CrossRef] [Green Version]
- Tarrant, J.M.; Galien, R.; Li, W.; Goyal, L.; Pan, Y.; Hawtin, R.; Zhang, W.; Van der Aa, A.; Taylor, P.C. Filgotinib, a JAK1 Inhibitor, Modulates Disease-Related Biomarkers in Rheumatoid Arthritis: Results from Two Randomized, Controlled Phase 2b Trials. Rheumatol. Ther. 2020, 7, 173–190. [Google Scholar] [CrossRef] [PubMed] [Green Version]
- Galien, R.; Brys, R.; Van Der Aa, A.; Harrison, P.; Tasset, C. Absence of effects of filgotinib on erythrocytes, CD8+ and NK cells in rheumatoid arthritis patients brings further evidence for the JAK1 selectivity of filgotinib. Arthritis Rheumatol. 2015, 67, 3–4. [Google Scholar]
- Bottos, A.; Gotthardt, D.; Gill, J.W.; Gattelli, A.; Frei, A.; Tzankov, A.; Sexl, V.; Wodnar-Filipowicz, A.; Hynes, N.E. Decreased NK-cell tumour immunosurveillance consequent to JAK inhibition enhances metastasis in breast cancer models. Nat. Commun. 2016, 7, 1–12. [Google Scholar] [CrossRef] [PubMed] [Green Version]
- Galita, G.; Brzezińska, O.; Gulbas, I.; Sarnik, J.; Poplawska, M.; Makowska, J.; Poplawski, T. Increased Sensitivity of PBMCs Isolated from Patients with Rheumatoid Arthritis to DNA Damaging Agents Is Connected with Inefficient DNA Repair. J. Clin. Med. 2020, 9, 988. [Google Scholar] [CrossRef] [PubMed] [Green Version]
- Souliotis, V.L.; Vlachogiannis, N.I.; Pappa, M.; Argyriou, A.; Sfikakis, P.P. DNA damage accumulation, defective chromatin organization and deficient DNA repair capacity in patients with rheumatoid arthritis. Clin. Immunol. 2019, 203, 28–36. [Google Scholar] [CrossRef]
- Shao, L. Dna damage response signals transduce stress from rheumatoid arthritis risk factors into t cell dysfunction. Front. Immunol. 2018, 9, 1–8. [Google Scholar] [CrossRef] [Green Version]
- Li, Y.; Goronzy, J.J.; Weyand, C.M. DNA damage, metabolism and aging in pro-inflammatory T cells: Rheumatoid arthritis as a model system. Exp. Gerontol. 2018, 105, 118–127. [Google Scholar] [CrossRef]
- Gremese, E.; Alivernini, S.; Tolusso, B.; Zeidler, M.P.; Ferraccioli, G. JAK inhibition by methotrexate (and csDMARDs) may explain clinical efficacy as monotherapy and combination therapy. J. Leukoc. Biol. 2019, 106, 1063–1068. [Google Scholar] [CrossRef] [PubMed] [Green Version]
- Thomas, S.; Fisher, K.H.; Snowden, J.A.; Danson, S.J.; Brown, S.P. Methotrexate is a JAK/STAT pathway inhibitor. PLoS ONE 2015, 10, e130078. [Google Scholar] [CrossRef]


Publisher’s Note: MDPI stays neutral with regard to jurisdictional claims in published maps and institutional affiliations. |
© 2021 by the authors. Licensee MDPI, Basel, Switzerland. This article is an open access article distributed under the terms and conditions of the Creative Commons Attribution (CC BY) license (https://creativecommons.org/licenses/by/4.0/).
Share and Cite
Reddig, A.; Voss, L.; Guttek, K.; Roggenbuck, D.; Feist, E.; Reinhold, D. Impact of Different JAK Inhibitors and Methotrexate on Lymphocyte Proliferation and DNA Damage. J. Clin. Med. 2021, 10, 1431. https://doi.org/10.3390/jcm10071431
Reddig A, Voss L, Guttek K, Roggenbuck D, Feist E, Reinhold D. Impact of Different JAK Inhibitors and Methotrexate on Lymphocyte Proliferation and DNA Damage. Journal of Clinical Medicine. 2021; 10(7):1431. https://doi.org/10.3390/jcm10071431
Chicago/Turabian StyleReddig, Annika, Linda Voss, Karina Guttek, Dirk Roggenbuck, Eugen Feist, and Dirk Reinhold. 2021. "Impact of Different JAK Inhibitors and Methotrexate on Lymphocyte Proliferation and DNA Damage" Journal of Clinical Medicine 10, no. 7: 1431. https://doi.org/10.3390/jcm10071431