
Assessing Ground Support of Plastic Pipes Using Ultrasound
by
 , , , ,
Juanjuan Zhu
1,* ,
,
Joby B. Boxall
2,
Andrew F. Hills
3 ,
,
Rob S. Dwyer-Joyce
1 ,
,
Sean R. Anderson
3 and
Richard P. Collins
2 1
Leonardo Centre for Tribology, Department of Mechanical Engineering, University of Sheffield, Sheffield S1 3JD, UK
2
Sheffield Water Centre and Department of Civil and Structural Engineering, University of Sheffield, Sheffield S1 3JD, UK
3
Department of Automatic Control and Systems Engineering, The University of Sheffield, Sheffield S1 3JD, UK
*
Author to whom correspondence should be addressed.
Infrastructures 2021, 6(2), 30; https://doi.org/10.3390/infrastructures6020030
Submission received: 26 December 2020
/
Revised: 1 February 2021
/
Accepted: 17 February 2021
/
Published: 19 February 2021
(This article belongs to the Section Infrastructures Inspection and Maintenance)
Abstract
:The ability to detect early signs of failure in buried pipe infrastructure is necessary to facilitate the continued use of ageing infrastructure for delivery of society’s essential services and move beyond disruptive and expensive reactive maintenance and repair. This paper reports detailed experiments on the use of in-pipe ultrasound techniques for assessment of ground conditions around buried plastic pipes. Two sets of ultrasonic experiment on the soil conditions are presented: (1) existence, shape, and dimension of void, and (2) water content in the soil. The ultrasound technique is shown to be capable for detecting water filled voids and assessing the soil support, critical early indicators of failure. The technique requires water as the transmission media hence is naturally suited to application in operational water distribution systems. The work represents an important advance in in-pipe condition assessment of plastic pipes, demonstrates the practical capability of the ultrasound technique, which is critical for progression towards proactive maintenance, offering cost and service improvements.
1. Introduction
Pressurized pipes transport large volumes of some of the world’s most precious and vital resources, whether that is oil, gas or drinking water. In the past 40 years, a new generation of low cost and highly durable polymeric materials, such as polyethylene, have been extensively used in pressurized pipe systems due to good temperature, chemical and abrasion resistance, low cost, and fast installation. Of the new pipes being installed in the US, approximately 39% are PVC [1] while over 70% of Finland’s water supply infrastructure is plastic [2]. Compared to metallic pipelines, limited experimental data have been recorded for a fully understanding of their long-term performance [3]. A 50-year service time is expected for these plastic pipes, but a large number of burst occurrences have been reported, particularly for smaller diameter mains [4].
It has been reported that in 2013–14, about 22% of the water put into the system was lost each day through leakage in the UK [5]. Any type of pipeline failure can be extremely costly, resulting from repair costs, disruption and associated collateral damage [6]. Therefore, inspection and intervention prior to failures is vitally important to ensure that they are working optimally.
The structural behavior of a buried plastic pipe is influenced by the external loading, the pipe stiffness, and the stiffness of the surrounding soil, which is considered to be one of the key factors. This is because essential support should be provided by the soil for buried pipes. The soil stiffness depends primarily on the water content, the nature of the soil grains and the current stress. Faragher and Fleming [7] studied the soil stiffness with different compaction methods for sand and gravel by experiments. Selig stressed that the soil consolidation, moisture level, loading changes and erosion strongly influence the soil deformation and therefore influence the stress on the plastic pipe wall [8]. Rajani et al. built a statistical model for studying the interaction between fully bond pipe and soil [9,10]. However, limited real-time field data, i.e., soil water content, for immediate surrounding soil have been achieved due to the measuring difficulty within the buried pipelines.
The stiffness and volume of soil surrounding pipes changes due to wetting and drying cycles, especially for silty and clay soils. On one hand, the softened soil provides insufficient support for the pipe wall; on the other hand, the presence of voids in the soil inevitably results in a lack of support, leading to potential pipe failures. It was found that the unsupported length of the pipe and the temperature differential have the greatest influence on the integrity of small-diameter pipes [9,10]. In other words, small-diameter pipes are particularly sensitive to the extent of loss of bedding support. The unsupported length of pipe is caused by soil differential movement, or voids in bedding near the pipe as a result of leaks. Therefore, detection of the water content and the existence of voids would facilitate targeted maintenance or replacement of pipes prior to breakages, leading to economic, loss of disruption and system performance benefits.
Ground electrical resistivity has been used to evaluate moisture level of the ground [11,12]. Ground penetrating radar (GPR) is another dominant technique that can be used to assess ground water levels and the existence of voids [13]. However, these methods are not always reliable and are highly site specific and are often compromised by the complexity of busy urban underground environments. Materials with high conductivity, such as clay soils, will rapidly attenuate the signal, causing a reduction in penetration depth. Currently, there is no in situ method that can overcome these limitations. This gap in pipe condition monitoring capability motivates the development of new in situ sensing solutions that are capable for inspecting the water content and voids in the soil, the key parameters in soil-pipe interaction and early detection of onset of failure.
Ultrasound has been reported to be capable for assessing pipeline conditions, including measuring wall thickness, material loss and cracking [14,15,16]. However, there is no research reported towards using the ultrasonic technique to measure the ground conditions beyond the pipe wall, i.e., existence of voids, shape and dimension of voids and moisture levels. The aim of this study is to validate the use of in-pipe ultrasound techniques for assessment of ground conditions, provide a practical solution for the pipe inspection. To achieve this, two sets of experiment were conducted to assess the soil support for the plastic pipe. Firstly, voids, with varying shapes and dimensions, were investigated by sensing through different plastic pipe materials for varying soil media using a range of transducer frequencies. Secondly, a series of ultrasound tests were conducted for investigating soil water content using a specially constructed soil test cell modified from a standard compaction mold. In this study, the voids in the soil are assumed to be filled with water, which is working as the transmission media for the ultrasound waves. Based on the experimental findings in this study, the ultrasonic method has shown the capability to investigate the water content and void existence in the ground around buried plastic pipes.
2. Experimental Method
2.1. Ultrasonic Measurement Principle
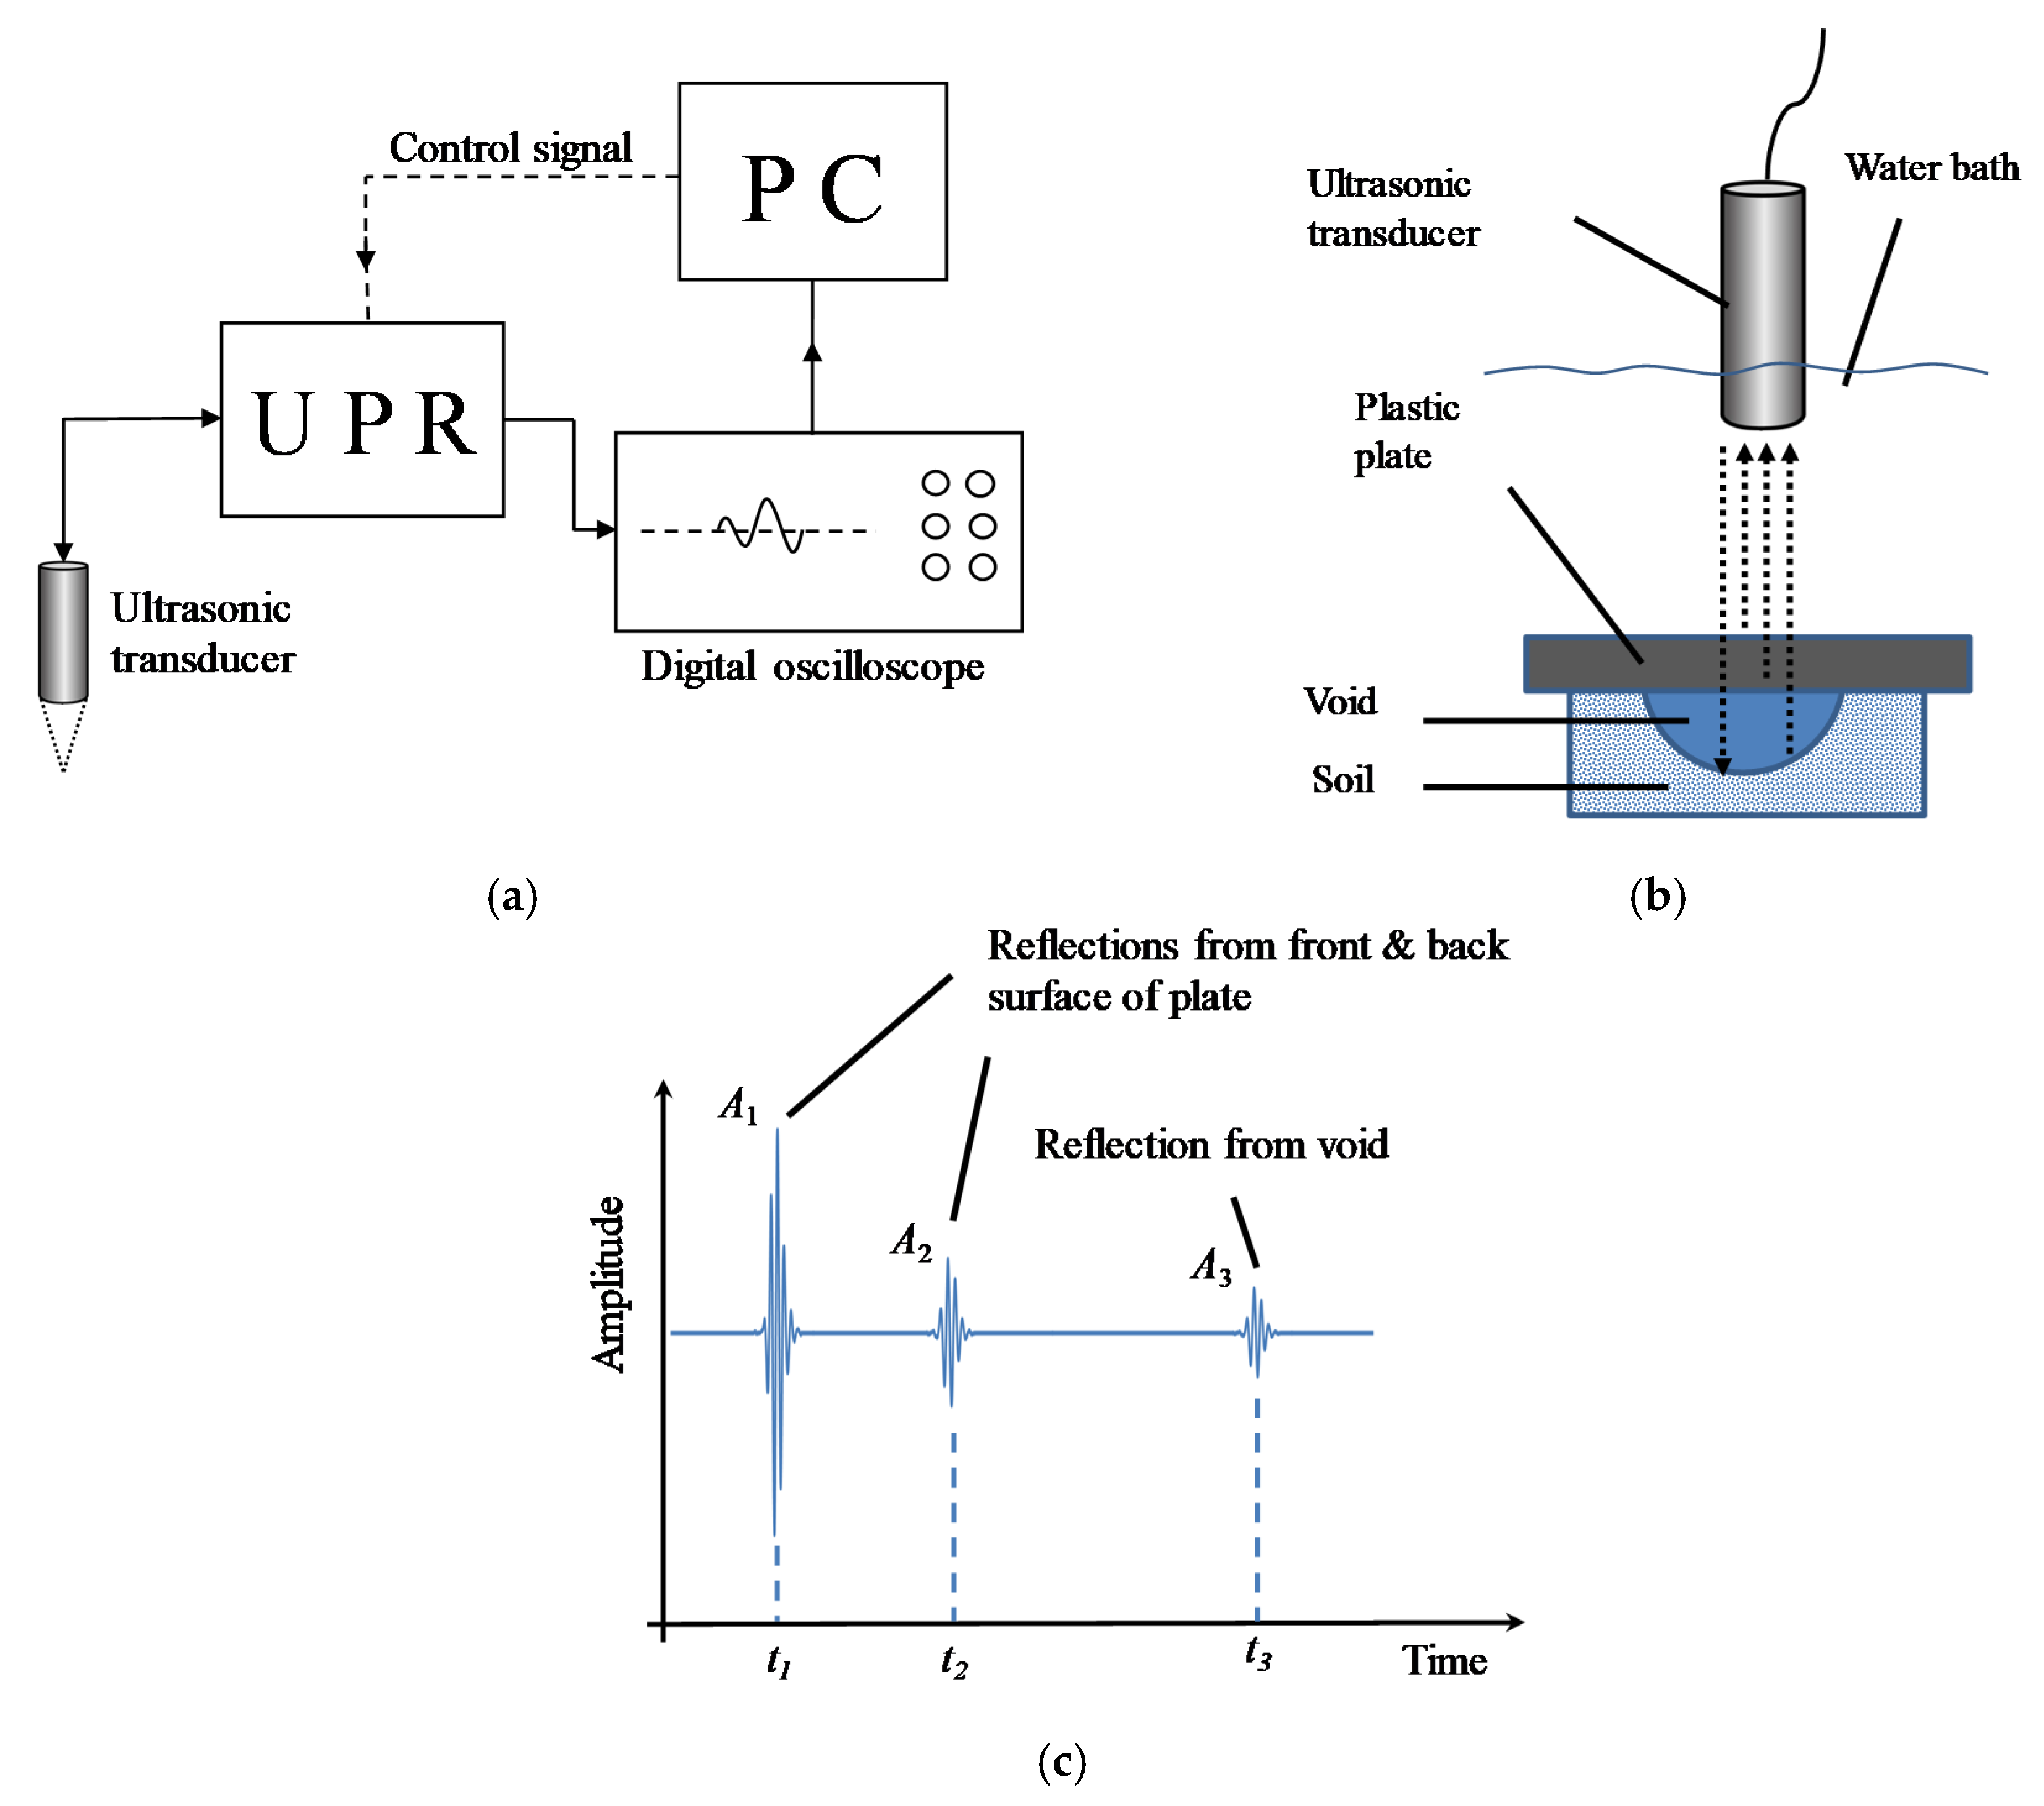
Figure 1a shows a sketch the ultrasonic unit used in this study which consists of an ultrasonic-pulse receiver (UPR), a digital oscilloscope, a PC, and an ultrasound transducer. The UPR, which is controlled by a PC, generates a series of short duration voltage pulses that excite the piezoelectric transducer causing it to resonate, thus sending the required ultrasonic pulse through the medium. The transducer operates in pulse-echo mode and so receives reflections back from the interface. Reflected pulses were stored on a digital oscilloscope and passed to a PC for data processing and analysis. To optimize the transducer frequency, three water-coupled focused ultrasound transducers with central excitation frequencies of 1, 5 and 10 MHz and a focal length of 75 mm were used in the void detection test. In the second part of this study, one optimized transducer was adopted for a soil water content detection test. Control and processing were carried out using the LabVIEW program. Figure 1c presents an example of the resultant ultrasonic signal where reflections from upper/lower surfaces of the plate and the extremities of the void are shown, with the peak amplitude indicated by A1, A2 and A3 individually. For void detection, the principle is to measure the transmission time of the third peak, t3, travelling from the transducer, through the plastic pipe wall and to the soil surface before being reflected to the transducer. The roundtrip flight time of the ultrasound signal between the back surface of the plate and the void surface is Δt = t3 − t2. Therefore, the depth of the void, D, is calculated by multiplying the acoustic velocity of water, vwater, with the single trip flight time, Δt/2, shown in Equation (1).
In assessing the soil water content beyond the plastic pipeline, the reflection signal amplitudes, A1 and A2 were recorded and analyzed. This is based on the principle that how much of the ultrasound transmission and reflection is determined by the interfacial acoustic properties [17], critically at the ground/pipe interface, while varying reflection is expected for soils with different water content. In other words, the ultrasonic reflection from the interface between the back surface of the plastic plate and the soil is determined by the moisture level in the soil. As the incident ultrasound waves propagate through the same media prior being reflected from the plate/soil interface, the moisture level can then be quantitatively indicated by the amplitude ratio A2/A1.
2.2. Void Detection
2.2.1. Experimental Preparation
Buried pipelines are intended to be surrounded by soil materials. This bedding and side-filling provides structural support. A particle size of nominally 10 mm diameter is suggested for flexible pipes (plastic pipes) up to a nominal pipe bore of 100 mm. In this work, to get a better understanding of ultrasonic reflectivity from varying bedding particle size, four bedding materials with a range of particle sizes up to 10 mm were tested. The specifications of the bedding materials are shown in Table 1.
To create regular and repeatable void shapes an impression former was used to indent shapes in the bedding media, as shown in Figure 2. The specific former shapes include a narrow half cylinder, a hemispherical depression, a cubic depression, and a sharp-edged hexagonal star. Details of the shapes are presented in Table 2.
In this study, a soil bed with a thickness of approximately 200 mm was prepared in a plastic box. The soil surface was manually levelled. The box was filled with water to a height of 80 mm above the soil. High Performance Polyethylene (HPPE) and Polyvinyl chloride (PVC) were chosen as testing pipe materials as they comprise the majority of the installed water pipes. The plates were 6 mm thick, again representative of the wall thickness of installed plastic pipes. To validate the testing procedure, scans of the void surface were taken before, after and with the plastic plates in place. This was done to assess the amount of movement of the media particles and changes in the void shape caused by the placement of the plastic plates. An initial scan was performed after the void impressions were made in the soil media, a second scan was performed after placing a PVC plate over the voids, a third scan was carried out with HDPE, and a final scan after removing the HDPE plate. Carefulness was taken not to disturb the media, particularly when placing and removing plastic plates, however small changes of void shapes or dimensions could not be avoided due to soil particle collapse. Change of void shapes and dimensions is presented in the later session.
2.2.2. Experimental Setting-Up
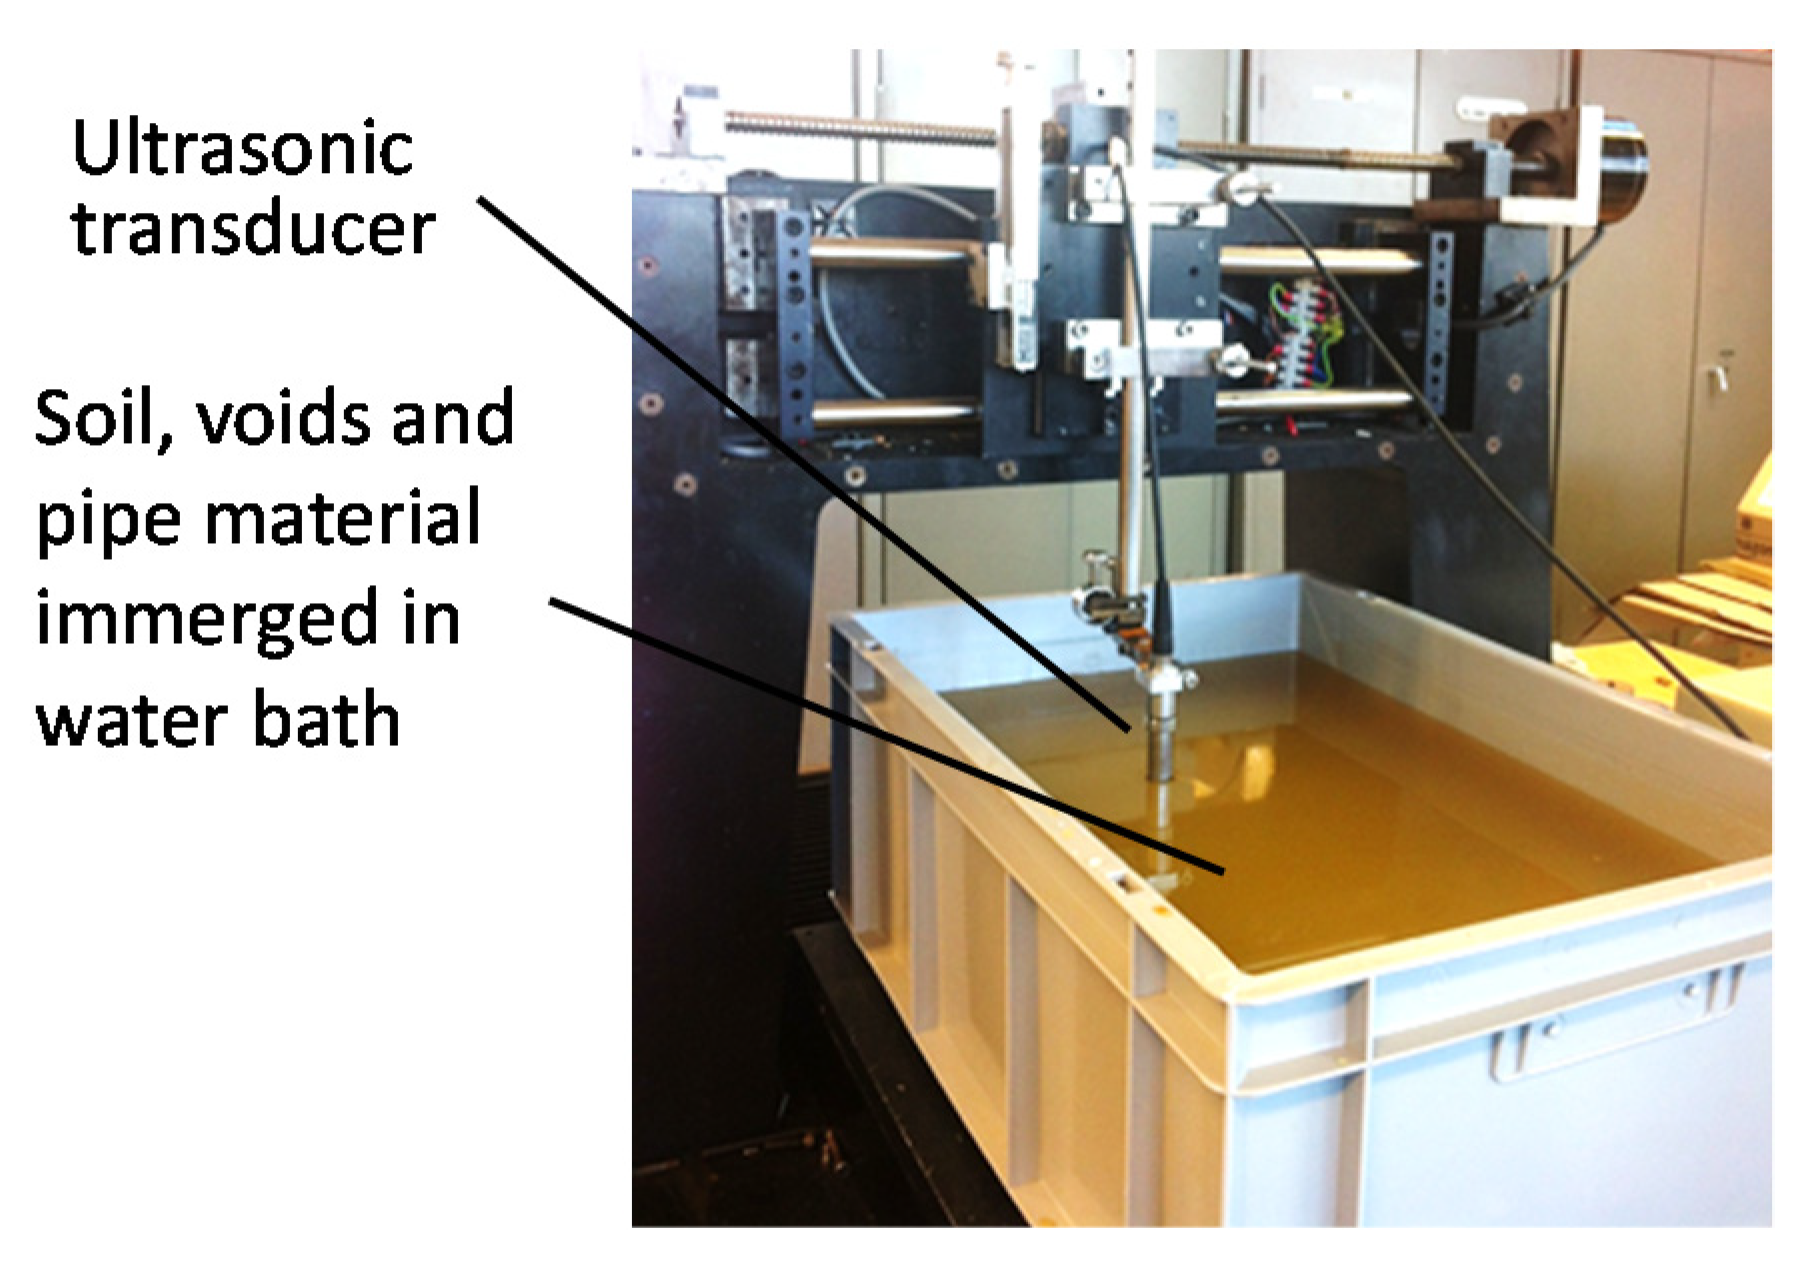
Figure 3 illustrates the ultrasonic scanning facility. The transducer was mounted on a gantry, driven by a stepper motor, while the soil box was moved orthogonally using a separate linear driver, to allow for x-y position control. The interfaces between the water, upper and lower plate surfaces, and the supporting substrate soil create acoustic discontinuities that result in a proportion of the ultrasonic energy being reflected. The particularly strong acoustic mismatch between the water and void media (sand or gravel) provides a strong ultrasonic reflection, advantageous for the identification of void presence and geometry. Scanning was performed at a speed of 2 mm/s for both the gantry table and transducer holder. Using a combination of transducer position and void depth, a 3D reconstruction of the void surfaces can be obtained.
2.2.3. Void Visualization
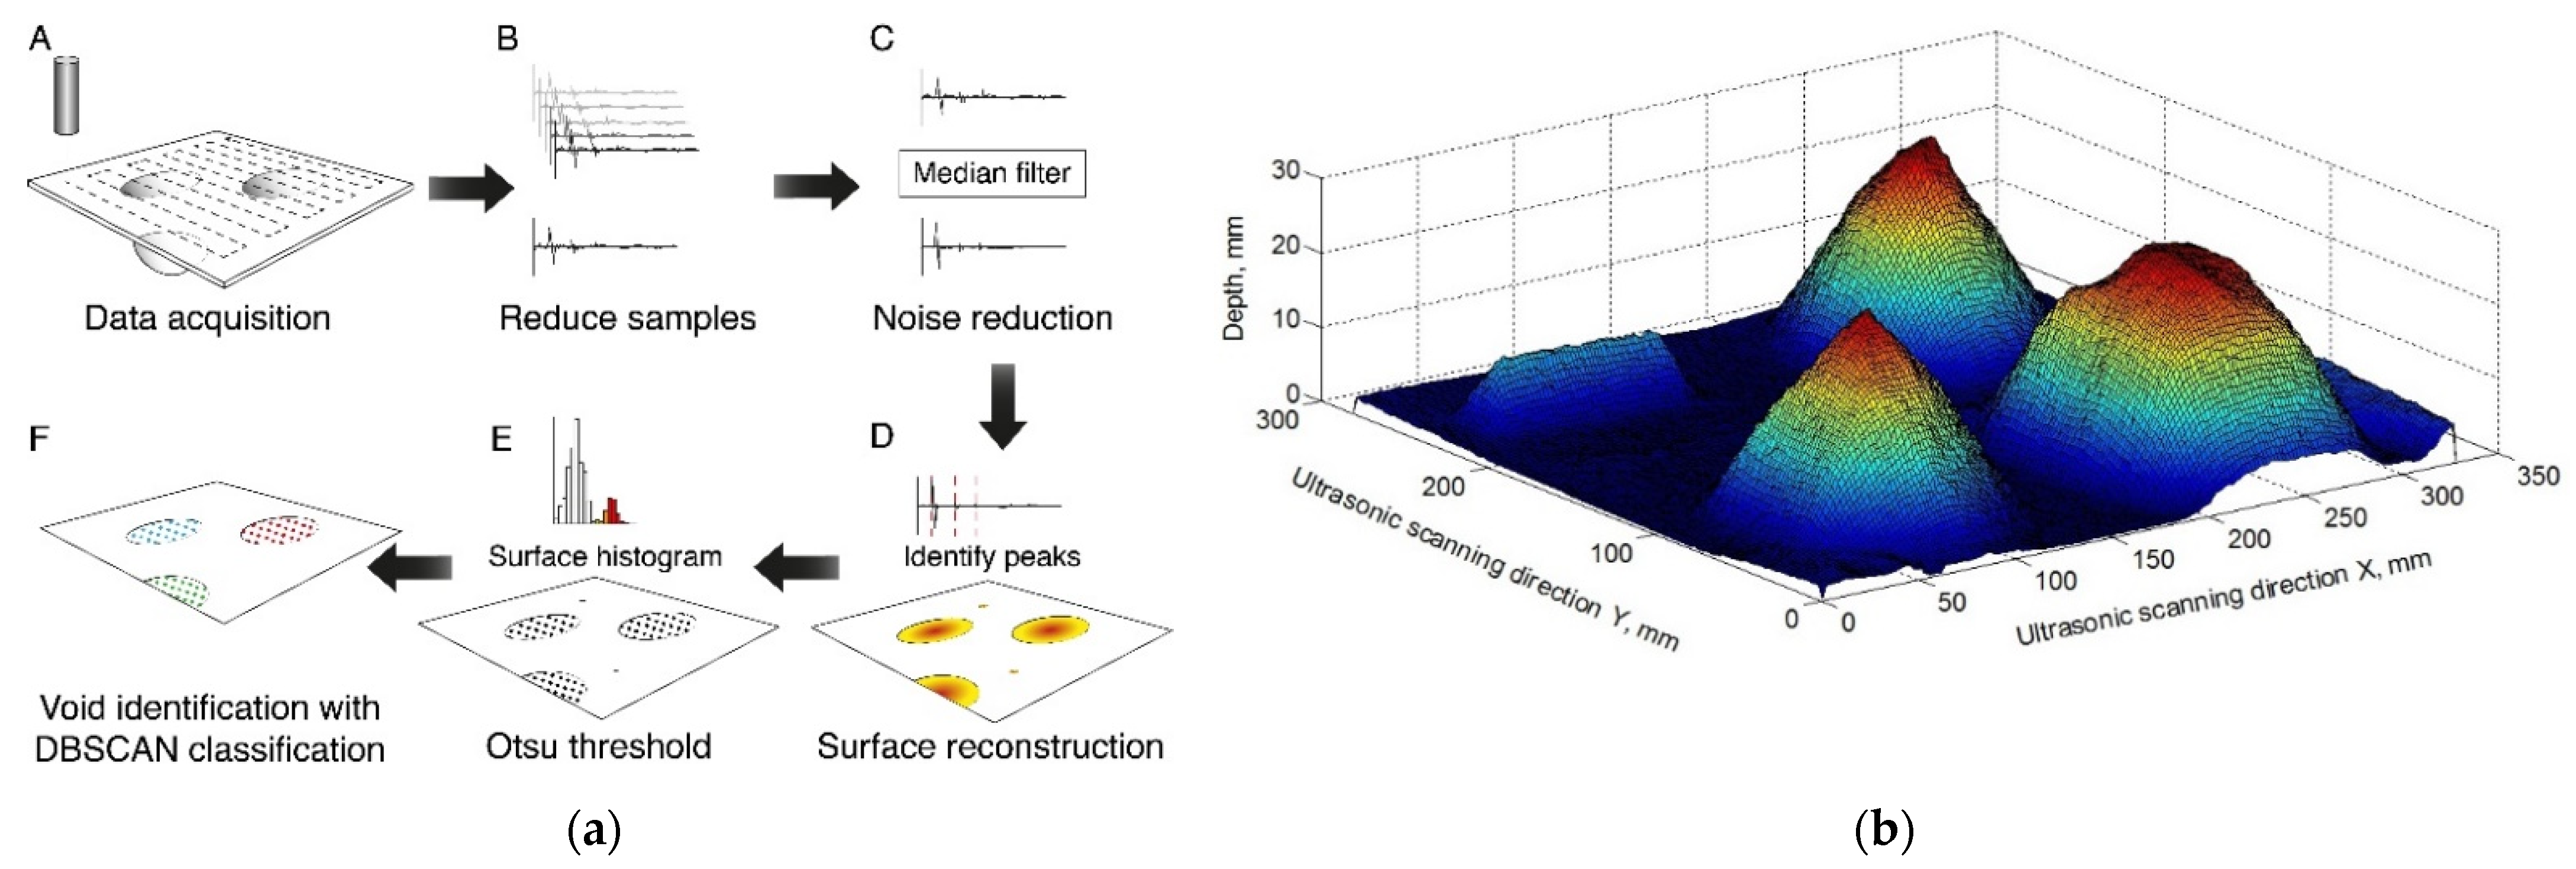
To demonstrate the capability of using the ultrasound technique to detect voids beyond plastic pipelines, an initial visual geometric illustration of voids in the soil bed was produced from the recorded ultrasonic time-series signal (Figure 1c). Noise within the time-series signals were removed by applying a median filter [20], across a five-sample window, before the times of signal peaks were identified. The depth from the lower surface of the plastic plate to the soil surface was then calculated using Equation (1), in which the acoustic velocity of water was taken as 1480 m/s. The soil surface histogram was created from the depth data and then separated into foreground (possible voids) and background (normal soil surface) by using the Otsu threshold method [21]. Density-based spatial clustering of applications with noise (DBSCAN) [22] was subsequently performed to identify void boundaries whilst rejecting small voids that were possibly caused by measurement noise. The data analysis process is illustrated in Figure 4a. Figure 4b shows an example of the 3D reconstructed surface of the four voids based on the measurement from the RD sand, using the 5 MHz transducer and with the HDPE pipe material. Compared with the void former, the void shapes for half sphere, cube and hexagonal star were found to be up-side-down bowl shaped. Sharp edges and flat bottom were difficult to be maintained due to the collapse of the fully saturated sand after the former was removed.
2.2.4. Void Shapes Change during Tests
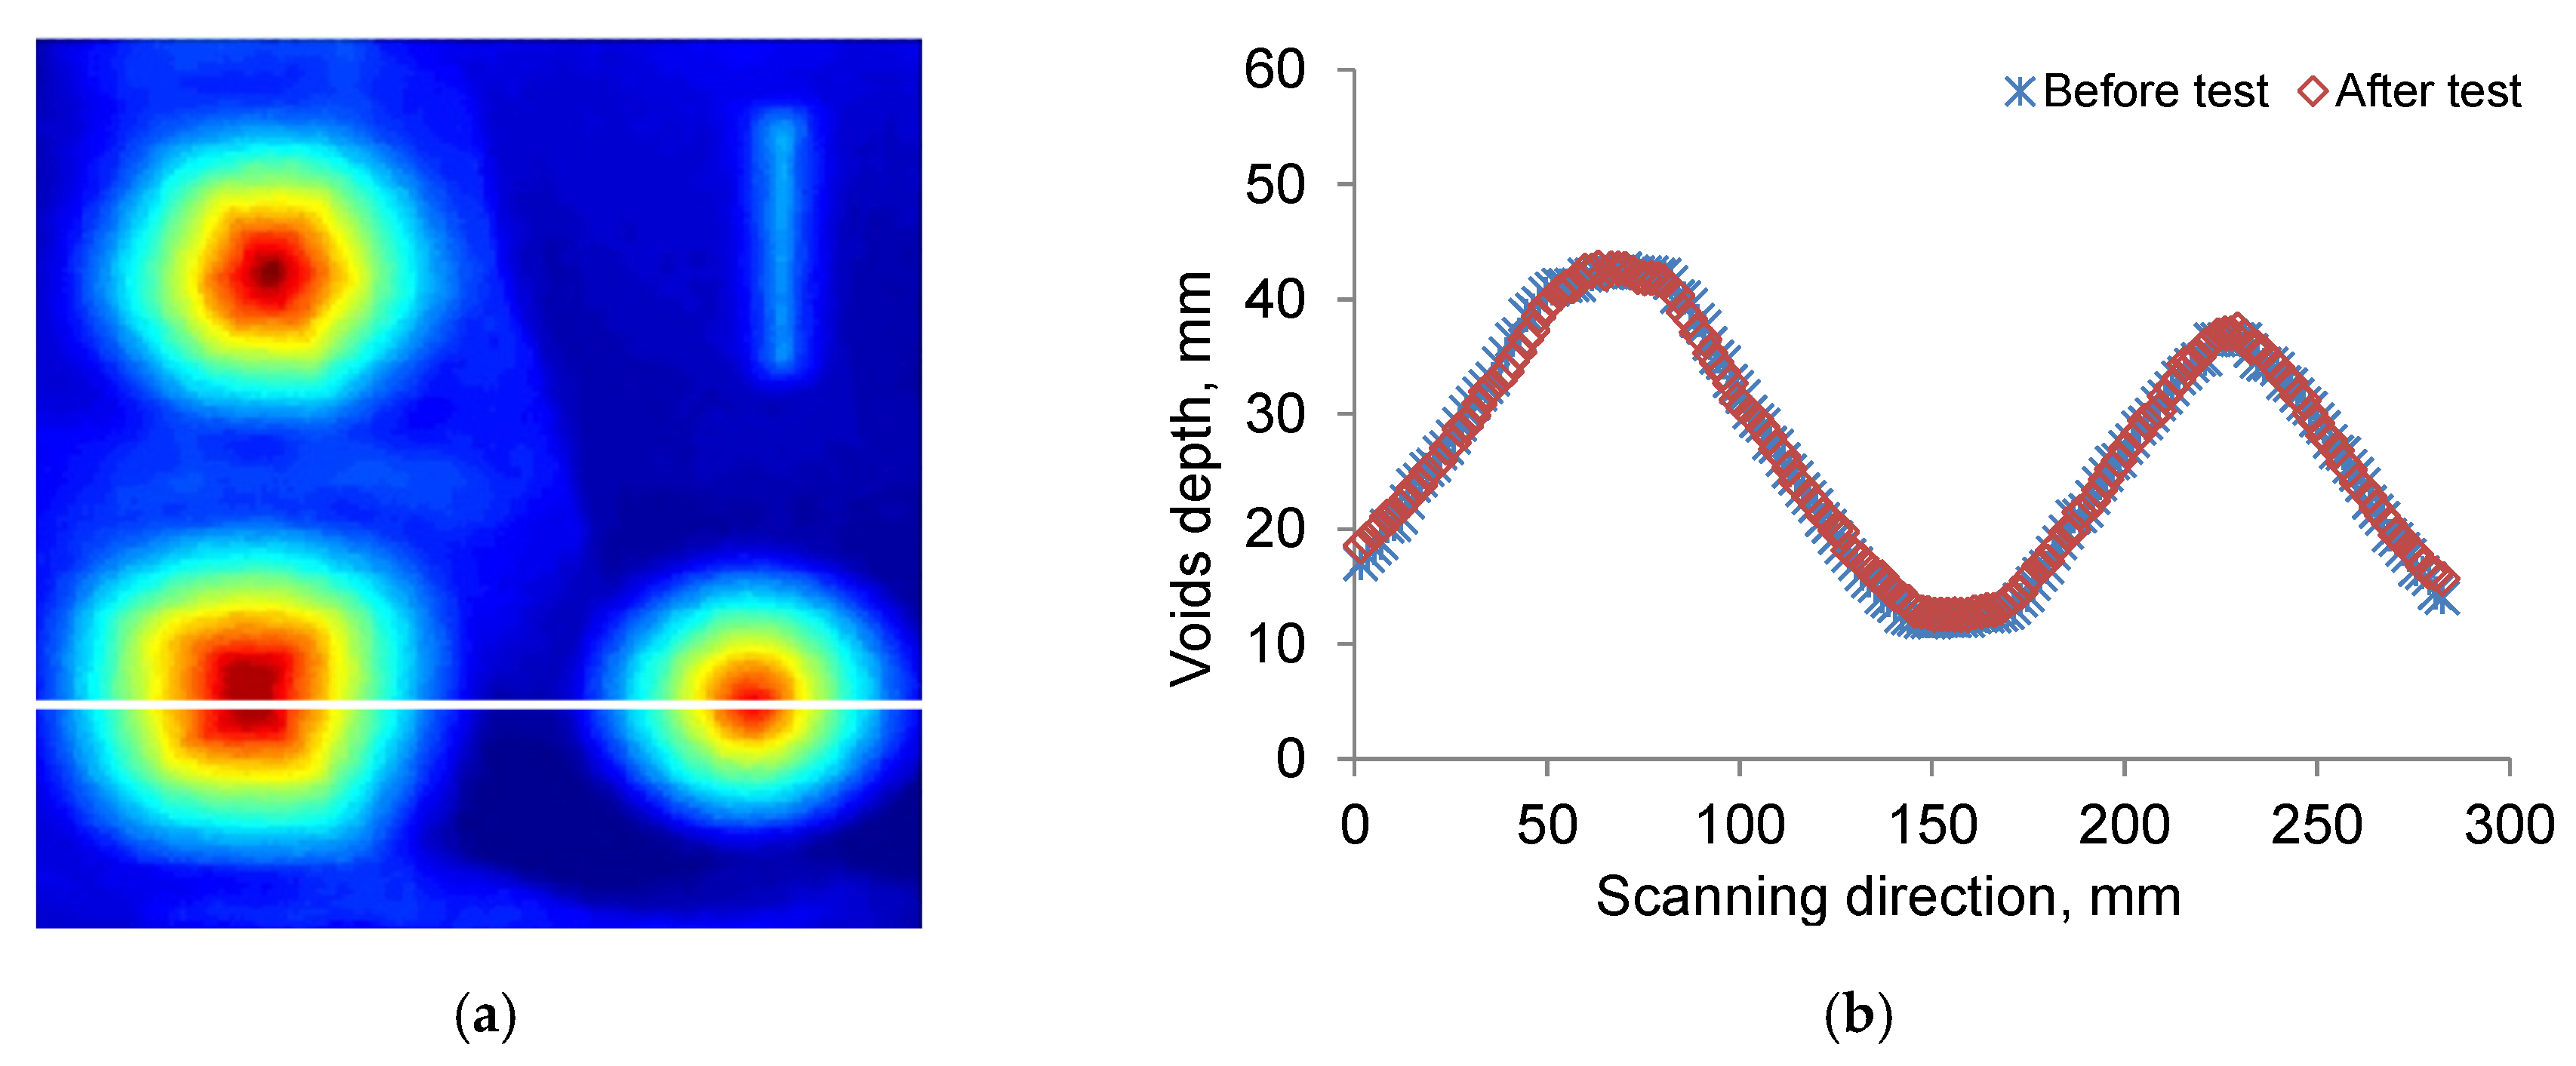
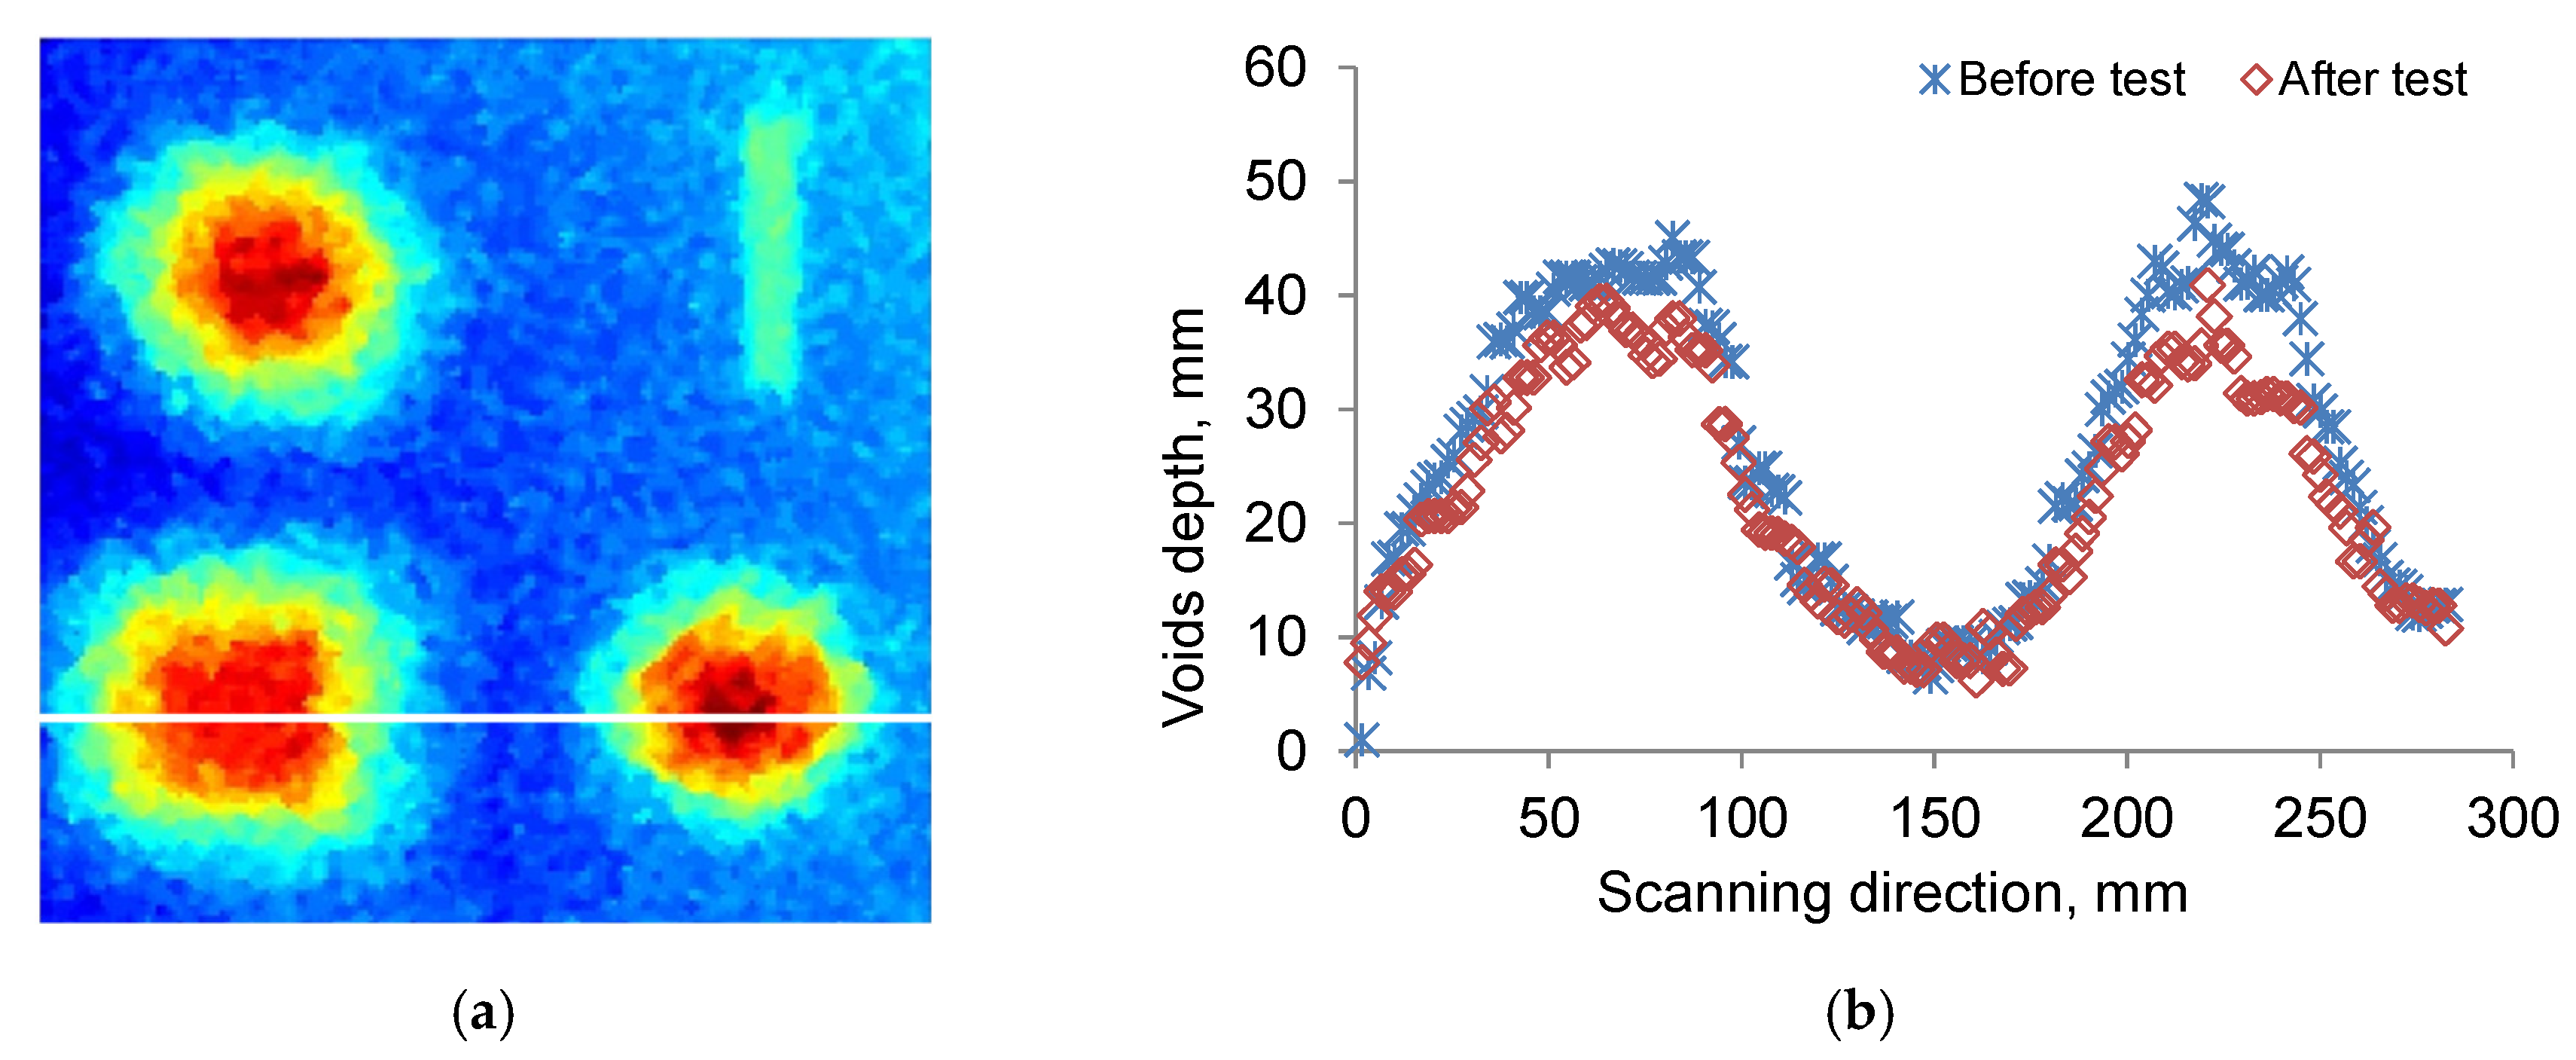
Even every effort was made to reduce the disturbance on the void, the change of the void shape can be expected. To assess this disturbance, the ultrasound detection on the void shape was conducted before and after placing the pipe material. Figure 5 and Figure 6 compare the void cross section before and after placing on the plastic plate for both sand and gravel using the 5 MHz transducer. The lines on Figure 5a and Figure 6a indicate the location of the cross sections shown on Figure 5b and Figure 6b, respectively. Due to collapse of soil particles after removing the former, the maximum depth was found to be 28 mm for the half sphere while the former radius was 40 mm. The cross-section profiles of the cube and half sphere show perfect consistency for DB sand (Figure 5b) between the before and after tests. This suggests that the sand is insensitive to the positioning and removal of the plastic plate after the voids were formed. However, the converse is true for the larger particulate soil, gravel 5–6.35 mm. The void shape for the ‘after test’ was slightly reduced compared to the newly made voids (Figure 6b). It can be concluded that the ultrasound technique was able to precisely assess the void shape and size change.
2.2.5. Void Area Calculation
As the void area that indicates the lack of support is an important factor in assessing the pipe failure mechanisms, in this study, the voids area was calculated after they were identified by the ultrasound technique. The void area for the half sphere on Figure 5 was obtained as 4993 mm2 before test and 5030 mm2 after test, giving 0.7% area difference caused by testing disturbance. For the gravel case shown in Figure 6, less than 5% of area difference was found for the same shape between before and after tests.
2.3. Soil Water Content Detection
2.3.1. Test Cell Design
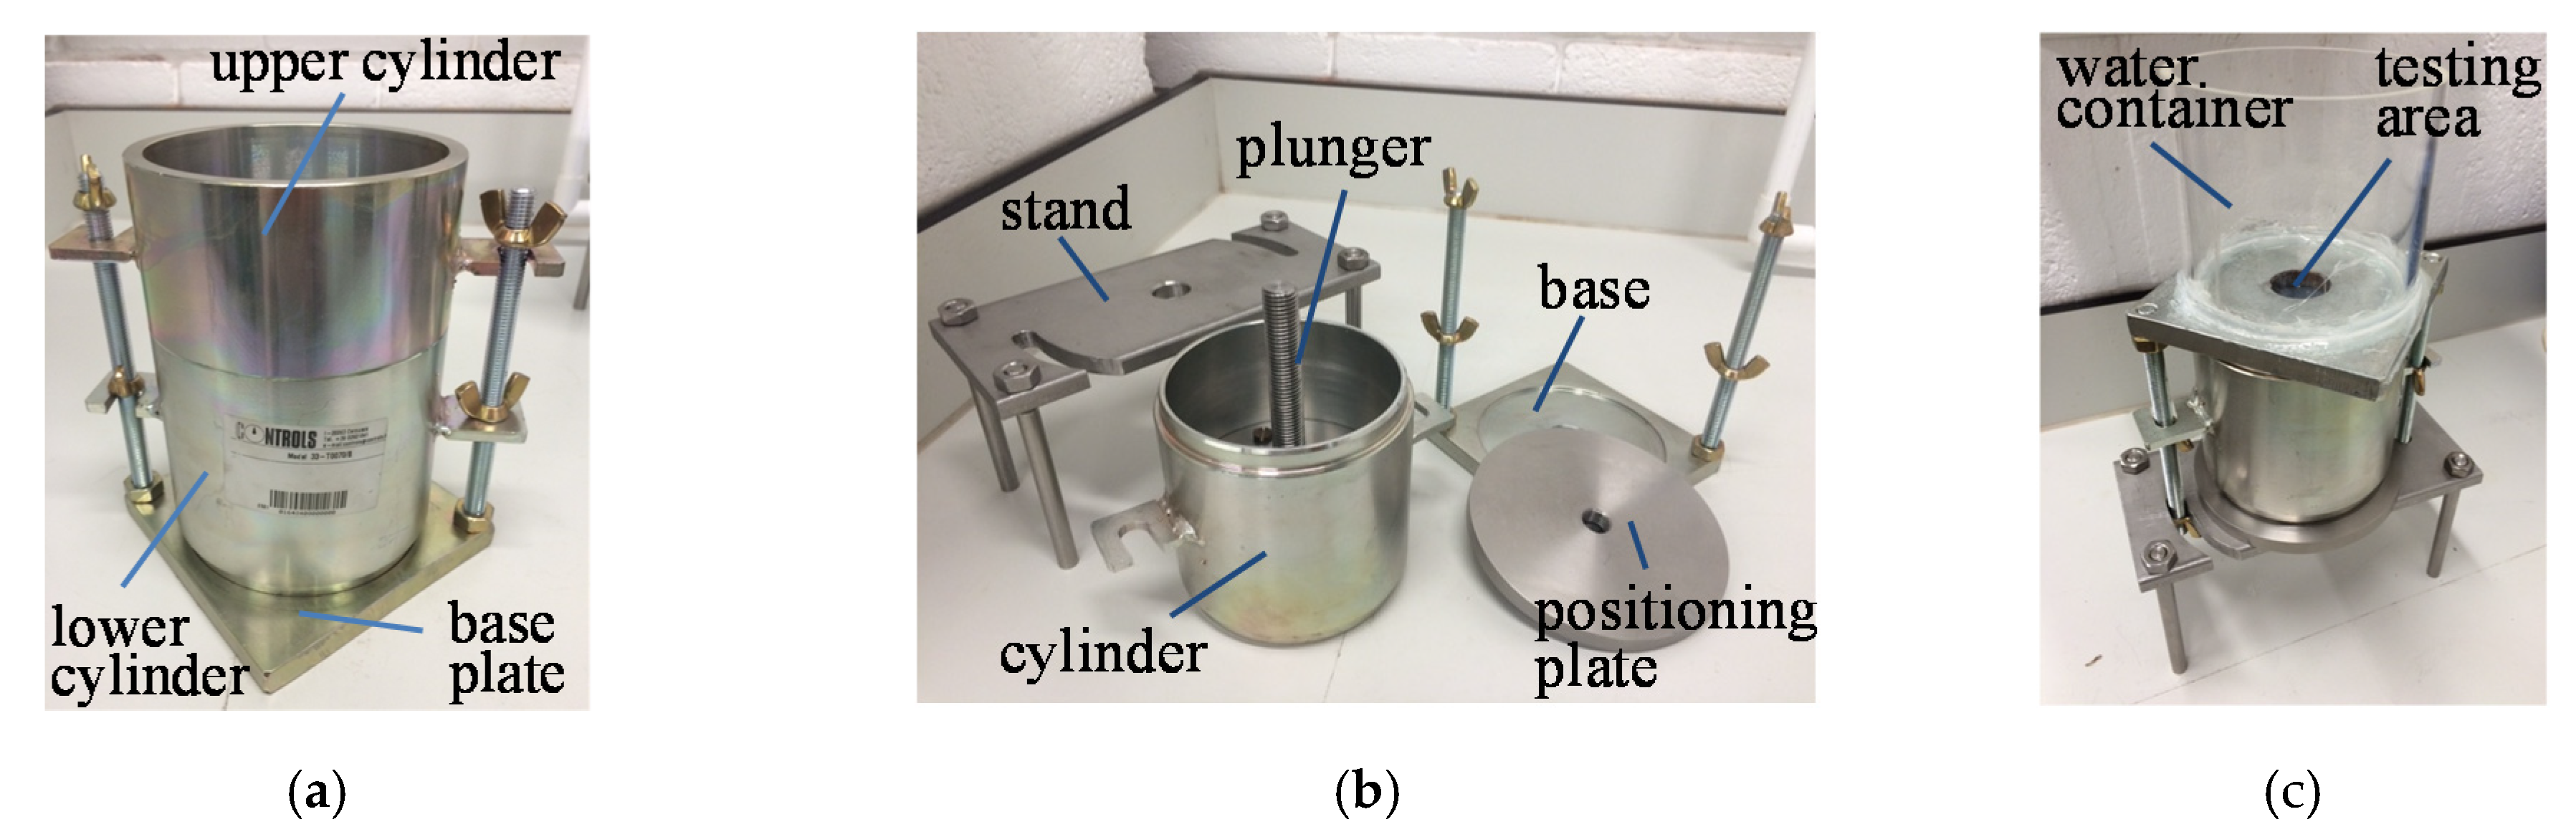
To ensure the same testing procedure was followed for all the tests, a modified compaction mold according to British Standard [18] was adopted, shown in Figure 7a. Figure 7b shows the test cell design. The lower cylinder and the base plate from a standard mold have been modified. The cylinder was placed on a circular HDPE plate before placed onto the base plate. A plunger with a screwed bar was used to compress the soil sample into the mold cavity. A positioning stainless steel plate was designed as a dead weight that was screwed onto the bar after the plunger was placed in the required position. A stand was finally assembled to lock the plunger in place through two arc slots. A center hole with a diameter of 30 mm was machined on the base plate to expose the HDPE plate for the ultrasonic testing. After assembling, the whole device was inverted, as shown in Figure 7c. As water is needed to be the couplant for ultrasound transmission, an acyclic tube was mounted on the end of the mold base sealed by silicone sealant, acting as a water container (Figure 7c).
2.3.2. Soil Sample Preparation
In this study, two common pipeline bedding materials, David Ball Fraction B sand and commercial white china clay were selected for making soil samples. To cover a wide range of water contents, soils were made with the sand and clay mass ratios of 1:1, 2:1, 4:1 and 6:1, labelled as soil 1, soil 2, soil 3 and soil 4. For each soil, nine moisture levels were achieved by adding different amounts of water. In this study, water content is indicated by the ratio between the water mass and the overall mass of soil. For example, 0, 21.1 g, 44.4 g, 70.6 g, 100 g, 133.3 g, 171.4 g, 215.4 g, and 266.7 g of water was added into soil 1 (200 g sand: 200 g clay) to make the water content to be from 0 to 40% with 5% increments.
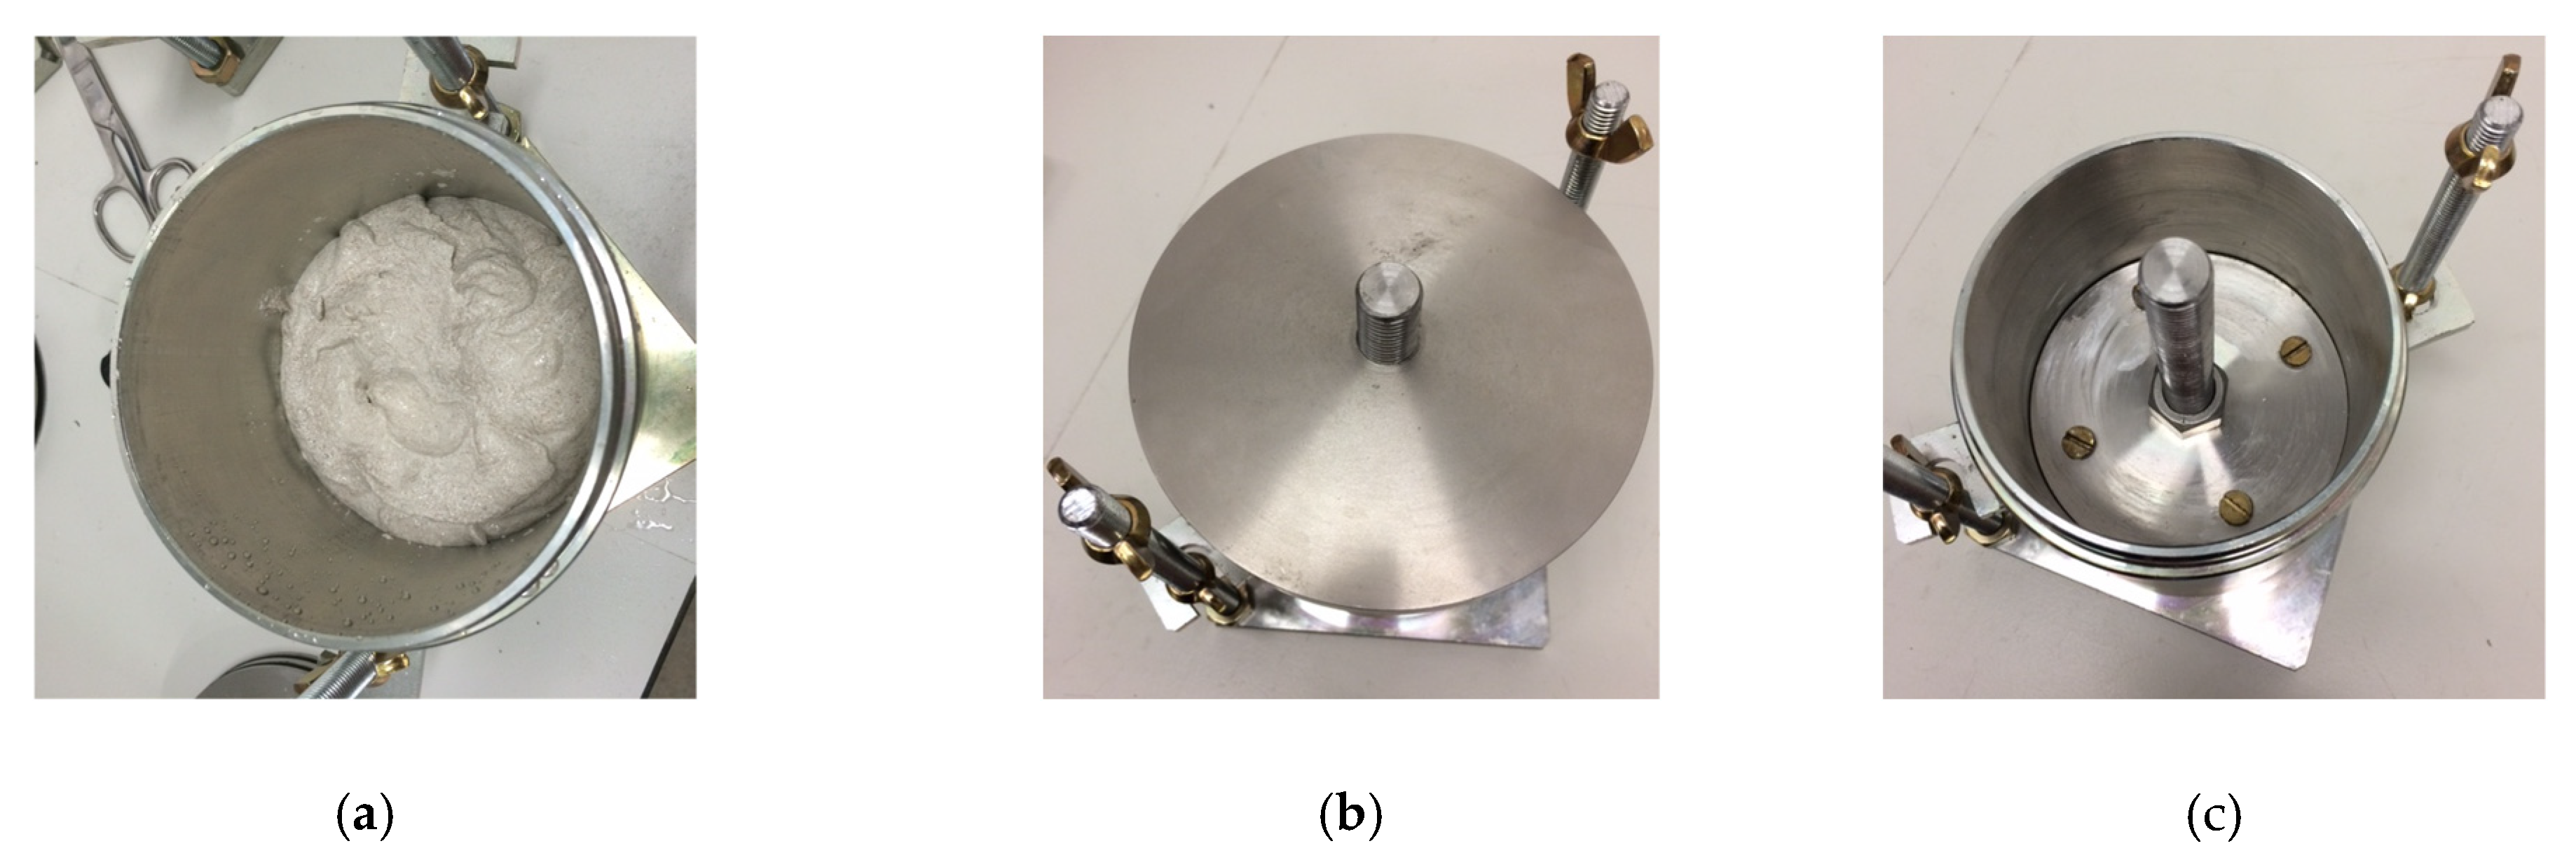
The dry sand and clay were manually mixed, following by added with required amount of tap water and stirred thoroughly. The mixture was then transferred into the test cell before locating the plunger into the cylinder to lock the soil in place, shown in Figure 8a. The metal plate was screwed on top of the plunger without contacting with the cylinder, acting as a dead weight, shown in Figure 8b. The whole device was finally left un-disturbed for 18 hours for equilibration. Four pre-machined air holes on the plunger were for releasing the air during this process, which were screw sealed to prevent the water escape after equilibrium, shown in Figure 8c. All soil samples were prepared following the same compaction procedure to ensure other un-measured parameters were not disturbed in preparation, i.e., soil pressure. The soil moisture was then measured by using the ultrasonic technique.
3. Experimental Results
3.1. Void Detection Results
3.1.1. Influence of Transducer Frequencies on Void Detection
To select the optimal ultrasonic pulse frequency, three transducers operating at 1, 5 and 10 MHz were compared. Table 3 shows detected void areas against the plastic plate for varying soil medias. The color bar in Table 3 indicates the detected void depth. All three transducers could detect the void perimeter, however, in the 1 MHz gravel case, the half cylinder void was nearly indistinguishable from the background signal. Void boundaries were identified for DB sand. However, the irregularity of the course gravel surface caused significant scattering. No third peak information (Figure 1c) could be acquired for void reconstruction in that case, resulting in the random distributed noise spots visible within the void zone.
It should be noted that the distortion of the cube for DB sand with the 10 MHz sensor, shown on the top left image, is caused by the collapse of the soil whilst making the voids. Regardless of this influence, both 5 and 10 MHz transducers show similar ability in detecting all four voids. However, for the gravel case, more continuous void zones with less noise were found using 5 MHz transducer, which provides greater confidence for recognizing the voids.
3.1.2. Influence of Soil Media and Plastic Materials
Different media have varying acoustic properties; hence it is necessary to study the effect of soil types and pipe materials on the ultrasound measurement. Table 4 compares the effect of soil media and plate material on ultrasonic void detection using the 5 MHz transducer. For the finest soil, RD sand, the shapes of the half cylinder, half sphere, hexagonal star, and cube are reproduced distinctly. Profiles of the square and the sharp end points of the star, are clearly visible. It should be noted that the distortion of the square edges was caused by soil collapse during void formation. With increasing particle size, void boundaries became noisy and indistinct. The most extreme case occurs for G8–9.5 mm, where the detected void zones have been found to be discontinuous for both HDPE and PVC. The blue dots in the void zones reflect that the ultrasound method was not able to detect the 3rd peak. It is also clear that better detection of the void was presented for the HDPE plate. This is due to the lower ultrasound attenuation in HDPE, which correspondingly results in higher transmitted energy and greater reflection from the void surface.
From Table 4, it is also found that maximum detected void depth with gravel was greater than sand, while the RD sand showed the lowest depth. The maximum void depths for the cube were found to be 27.8, 35.3, 40.2 and 37.6 mm for PVC form fine to coarse soil respectively, while for HDPE, depths of 27.3, 35, 38.7 and 39.7 mm were found. The depth of 40.2 mm which was slightly greater than that of the former was caused by the gap between two gravel particles.
Table 5 shows detected void area for the different soils, calculated from the data in Table 4. It is clearly shown that soil type influences the detected void area. Especially for the half sphere case, detected void areas showed smaller values when compared with those from ‘Before test’. Regardless of the accuracy of the area measurement, the voids with varying shapes and dimensions have been successfully detected by the ultrasonic method for all soil media.
3.2. Ultrasound Reflection against Soil Water Content
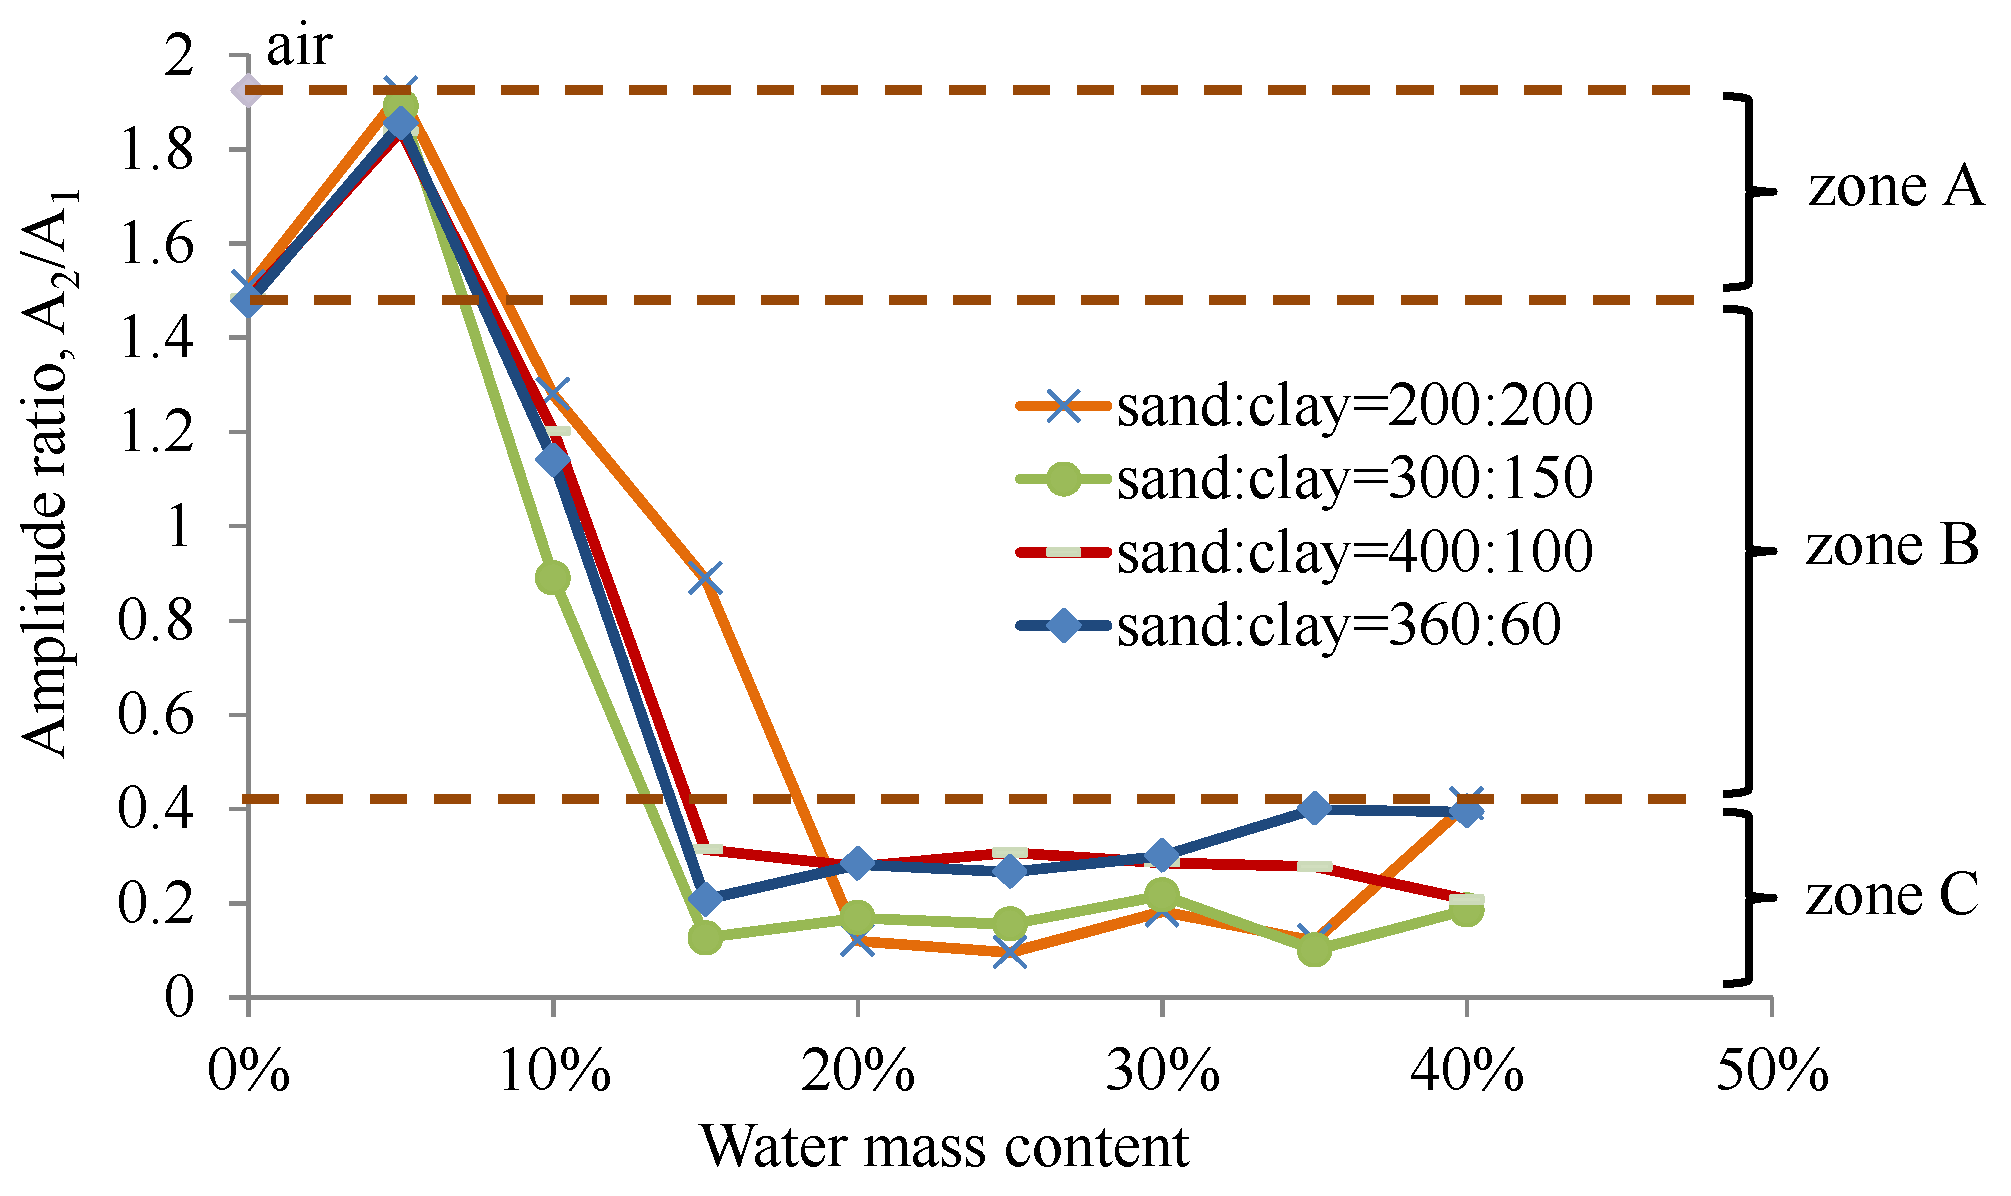
In this study, the ultrasound reflections were measured for three locations within a circle testing area (Figure 1c). The amplitude ratio, A2/A1, was then calculated and averaged for indicating the water content in the soil. Figure 9 presents how these amplitude ratios vary against water content for four soils. It is clear that A2/A1 follows a similar trend with water content for all tested soils. The ratio starts at approximately 1.5, followed by an immediate increase and then a sharp decrease before stabilizing beyond water contents above 15%. The maximum ratios were found to be close with an approximate value of 1.9 at 5% water content regardless of the soil type.
To validate the experimental results, two more tests were conducted with pure water and air beyond the pipe material. The amplitude ratios were found to be 0.41 and 1.92 for water and air, respectively. The maximum amplitude ratio for the soils was of 1.9, slightly lower than the pure air case. For all tested soils, with increasing water content, the physical status of soil changed gradually from loose dry to watery slurry. This produced the corresponding amplitude ratio that followed an initial increase, a decrease and final stabilization to 0.41. Water contents above 40% were not included in this work as the soil in this state apparently loses its stiffness to support the pipe wall.
To discuss the support condition of the pipe, three dash lines are shown, indicating amplitude ratios of 1.92 for pure air, 1.5 for dry soil and 0.41 for pure water. Therefore, three zones are obtained, zone A, zone B and zone C, representing three support states on the pipes from surrounding ground. If A2/A1 falls lower than 0.41, the physical status of soil is expected to be watery and slurry. Therefore, it is easy to conclude that the buried pipe receives no support from surrounding ground. If the amplitude ratio is found to be in the range of 0.41–1.5 (zone B), the pipe is expected to be partially supported by the ground due to lack stiffness of the soil bulk. In this case, the external load is shared by the pipe wall and the ground, resulting in shear stress accumulation in the pipe material and therefore potential pipe deformation in vertical and/or horizontal directions. In zone A, the water content in the soil cannot be directly linked to the amplitude ratio. This is due to a fluctuation that occurred at 5% water content. In other words, full support from the ground cannot be assured if A2/A1 is greater than 1.5. In this case, it may be reasonable to use other field identification tests for evaluating the ground condition.
4. Discussion
In the void detection test, it should be noted that the back-fill soil material supporting the plastic is assumed to be saturated with water. In investigating a pipe’s structural health, voids could be caused by the presence of leaks. Therefore, the soil surrounding the pipe would be likely to be saturated by the presence of the leak flow, if not by existing groundwater. Therefore, in this study, the experiment was submerged in a water bath. There may be cases where the ground outside the pipe is not fully saturated, future work should consider these cases of partially saturated external media to validate the ability of this method for detecting voids for all likely physical situations.
To obtain high reflected ultrasound energy transmission from an interface of interest, the ultrasonic transducer should be orientated normally to the plate surface, or the signal will be scattered away without returning to the transducer. In this study, the transducer was manually adjusted to perpendicular to the plastic plate. Sensor placement and installation is therefore a challenge in using the focused transducer in practical applications.
It should be noted that the soil sample in water content detection was compressed by a plunger with a dead weight after being poured into the mold cylinder. A uniform preload on the pipe–soil interface was therefore obtained for all experiments. Even though, the bonding condition between the pipe wall and the soil is different from that of the real buried pipe, this method has been proven to be capable for assessing water content of the ground immediately beyond the pipe wall.
The ultrasonic signals that travel through the pipe wall will contain information related to the condition of the pipe wall. This approach has been widely used for defect detection for metal pipes, it is suggested that this could extend to plastic pipes. Defects such as wall thinning and cracking for plastic pipes have been investigated from previous study [23].
The development and application of void and loss of support measurement techniques, such as that presented here, are essential if we are to move beyond reactive repairs and the associated costs, disruption, and service failures of our critical, ageing buried pipe infrastructure. Wide scale application and data collection will drive the development of next generation pipe asset performance models using what is already widely believe to be critical data on loss of support and void formation.
5. Conclusions
The results of the experimental studies into ground conditions are presented, which explored the existence of voids and water content of the soil external to buried plastic pipe walls. An in pipe non-destructive ultrasonic technique is proposed and successfully demonstrated to access ground conditions. Highly detailed ultrasonic reflection measurements were conducted in well controlled laboratory conditions are presented and analysis undertaken.
A former with varying geometry acrylic block was used to indent shapes in bedding media, to create regular and repeatable void shapes for laboratory experiments. Four common pipe bedding materials, two reprehensive plastic pipe materials, and three ultrasound transducer frequencies were tested. The 3D reconstruction of premade voids was achieved by extracting the ultrasonic wave time of flight across the void. The results highlight that the existence of voids in reprehensive media can be detected from within the pipe. This potentially enables the approach to be applied for non-invasive field use as way to evaluate pipeline operating conditions.
In addition, the effect of soil water content has been assessed by measuring the proportion of sound reflected from the pipe wall to soil interface. A clear relationship curve was observed for the soil sample. For a ratio range 0.4 < A2/A1 < 1.4 the buried plastic pipes were partially supported; and support was completely lost if A2/A1 < 0.4. A maximum ratio of A2/A1 = 1.92 suggested an air void beyond the pipe wall. For the values between 1.4 and 1.9, insufficient information is obtained to determine the soil support for the pipe. Further study on the stiffness of clay soil with low water content (<10%) is suggested.
The loading condition is critical in evaluating structural integrity for flexible pipes (plastic pipes); therefore, it is vital to assess surrounding ground conditions. In this work, two ultrasonic experiments have demonstrated the possibility of a non-invasive in-pipe approach for assessing the support status of buried pipes from bedding media. These approaches could provide pipeline engineers with decision-making tools to initiate repair, renewal or replacement of pipes.
Author Contributions
Conceptualization, J.Z. and R.P.C.; methodology and data curation, J.Z. and A.F.H.; writing—original draft preparation, J.Z.; writing—review and editing, S.R.A., R.S.D.-J. and A.F.H.; supervision, R.P.C., J.B.B. and R.S.D.-J.; funding acquisition, J.B.B. and R.S.D.-J. All authors have read and agreed to the published version of the manuscript.
Funding
This research was funded by the Engineering and Physical Sciences Research Council (EPSRC), grant number EP/K021699/1 and EPSRC Established Career Fellowship, grant number EP/N016483/1.
Acknowledgments
The authors also would like to acknowledge Robin Mills for his support in the experimental setting up.
Conflicts of Interest
The authors declare no conflict of interest.
References
- Kirmeyer, G.J.; Richards, W.; Smith, C.D. An Assessment of Water Distribution Systems and Associated Research Needs; The Foundation and American Water Works Association: Denver, CO, USA, 1994. [Google Scholar]
- Rajani, B.; Kleiner, Y. Non-destructive inspection techniques to determine structural distress indicators in water mains. In Proceedings of the Conference on Evaluation and Control of Water Loss in Urban Water Networks, Valencia, Spain, 21–25 June 2004; pp. 1–20. [Google Scholar]
- Sægrov, S.; Baptista, J.F.M.; Conroy, P.; Herz, R.K. Rehabilitation of water networks: Survey of research needs and on-going efforts. Urban Water 1999, 1, 15–22. [Google Scholar] [CrossRef] [Green Version]
- Skipworth, P.; Engelhardt, M.; Cashman, A.; Savic, D.; Walters, G. Whole Life Costing for Water Distribution Network Management; Thomas Telford: London, UK, 2002. [Google Scholar]
- Consumer Council for Water. Performance of the Water Companies in England and Wales 2010–11 to 2013–14. Available online: http://www.ccwater.org.uk/wp-content/uploads/2015/01/Company-performance-report.pdf (accessed on 1 August 2020).
- Colombo, A.F.; Karney, B.W. Energy and costs of leaky pipes: Toward comprehensive picture. J. Water Resour. Plan. Manag. 2002, 128, 441–450. [Google Scholar] [CrossRef] [Green Version]
- Faragher, E.; Fleming, P. Laboratory determination of soil stiffness data for buried plastic pipes. J. Transp. Res. Board 1998, 1624, 231–236. [Google Scholar] [CrossRef]
- Selig, E. Soil properties for plastic pipe installations. In Buried Plastic Pipe Technology; Buczala, G., Cassady, M., Eds.; ASTM International: West Conshohocken, PA, USA, 1990; pp. 141–158. [Google Scholar]
- Rajani, B.; Tesfamariam, S. Uncoupled axial, flexural, and circumferential pipe soil interaction analyses of partially supported jointed water mains. Can. Geotech. J. 2004, 41, 997–1010. [Google Scholar] [CrossRef]
- Tesfamariam, S.; Rajani, B.; Sadiq, R. Possibilistic approach for consideration of uncertainties to estimate structural capacity of ageing cast iron water mains. Can. J. Civ. Eng. 2006, 33, 1050–1064. [Google Scholar] [CrossRef] [Green Version]
- Ozcep, F.; Tezel, O.; Asci, M. Correlation between electrical resistivity and soil-water content: Istanbul and Golcuk. Int. J. Phys. Sci. 2009, 4, 362–365. [Google Scholar]
- Brunet, P.; Clément, R.; Bouvier, C. Monitoring soil water content and deficit using Electrical Resistivity Tomography (ERT)-A case study in the Cevennes area, France. J. Hydrol. 2010, 380, 146–153. [Google Scholar] [CrossRef]
- Hunaidi, O.; Giamou, P. Ground-penetrating radar for detection of leaks in buried plastic water distribution pipes. In Proceedings of the Seventh International Conference on Ground-Penetrating Radar, Lawrence, KS, USA, 27–30 May 1998; pp. 783–786. [Google Scholar]
- Liu, Z.; Kleiner, Y. State of the art review of inspection technologies for condition assessment of water pipes. Measurement 2013, 46, 1–15. [Google Scholar] [CrossRef] [Green Version]
- Luo, W.; Rose, J.L. Guided wave thickness measurement with EMATs. Insight 2003, 45, 735–739. [Google Scholar] [CrossRef] [Green Version]
- Siqueira, M.; Gatts, C.E.N.; Silva, R.R.; Rebello, J.M.A. The use of ultrasonic guided waves and wavelets analysis in pipe inspection. Ultrasonics 2004, 41, 785–797. [Google Scholar] [CrossRef] [PubMed]
- Zhu, J.; Collins, R.; Mills, R.; Dodd, T.; Anderson, S.; Dwyer-Joyce, R.; Boxall, J. Soil water content detection from in-pipe ultrasound measurements. In Proceedings of the WCND 2016, 19th World Conference on Non-Destructive Testing, Munich, Germany, 13–17 June 2016. [Google Scholar]
- British Standards Institution. BS 1377-9: Methods for Test for Soils for Civil Engineering Purposes, In-Situ Tests; BSI: London, UK, 1990. [Google Scholar]
- British Standards Institution. BS 1881-131: Testing Concrete. Methods for Testing Cement in a Reference Concrete; BSI: London, UK, 1998. [Google Scholar]
- Tukey, J.W. Exploratory Data Analysis; Addison-Wesley, 1977; Available online: http://www.ru.ac.bd/wp-content/uploads/sites/25/2019/03/102_05_01_Tukey-Exploratory-Data-Analysis-1977.pdf (accessed on 18 February 2021).
- Otsu, N. A threshold selection method from gray-level histograms. IEEE Trans. Syst. 1979, 9, 62–66. [Google Scholar] [CrossRef] [Green Version]
- Ester, M.; Kriegel, H.P.; Sander, J.; Xu, X. A density-based algorithm for discovering clusters in large spatial databases with noise. In Proceedings of the Second International Conference on Knowledge Discovery and Data Mining (KDD’96), Portland, OR, USA, 2–4 August 1996; pp. 226–231. [Google Scholar]
- Zhu, J.; Collins, R.; Joby, B.; Mills, R.; Dwyer-Joyce, R. Non-destructive in-situ condition assessment of plastic pipe using ultrasound. In Proceedings of the 13th International Conference on Computing and Control for the Water Industry (CCWI2015), De Montfort University, Leicester, UK, 2–4 September 2015. [Google Scholar]
Figure 1.
(a): Sketch of ultrasonic unit used in this study; (b): roundtrip-propagation and reflections of ultrasound waves from front/back surfaces of the plate and the soil surface; (c): An A-scan example of ultrasonic measurement containing three reflections from three surfaces in (b).
Figure 1.
(a): Sketch of ultrasonic unit used in this study; (b): roundtrip-propagation and reflections of ultrasound waves from front/back surfaces of the plate and the soil surface; (c): An A-scan example of ultrasonic measurement containing three reflections from three surfaces in (b).

Figure 2.
Void former with four acrylic blocks of varying geometry and dimension for artificial void formation.
Figure 2.
Void former with four acrylic blocks of varying geometry and dimension for artificial void formation.

Figure 3.
Photo of ultrasonic scanning tank with transducer immersed in water above the soil bed.

Figure 4.
3D reconstruction of void detection, (a): data analysis process; and (b): an example of 3D voids measured by 5 MHz transducer with replacement density sand.
Figure 4.
3D reconstruction of void detection, (a): data analysis process; and (b): an example of 3D voids measured by 5 MHz transducer with replacement density sand.

Figure 5.
Change of void shapes using 5 MHz transducer for DB sand, (a): top view of detected four voids; and (b): section through two voids (cube left and half sphere right).
Figure 5.
Change of void shapes using 5 MHz transducer for DB sand, (a): top view of detected four voids; and (b): section through two voids (cube left and half sphere right).

Figure 6.
Change of void shapes using 5 MHz transducer for G5–6.35 mm, (a): top view of detected four voids; and (b): section through two voids (cube left and half sphere right).
Figure 6.
Change of void shapes using 5 MHz transducer for G5–6.35 mm, (a): top view of detected four voids; and (b): section through two voids (cube left and half sphere right).

Figure 7.
Test cell design, (a) BS standard compaction test mold (1 Litre, BS 1377, inner diameter 105 mm, wall thickness 4.5 mm), (b) disassembly elements of test cell, (c) test cell after assembly.
Figure 7.
Test cell design, (a) BS standard compaction test mold (1 Litre, BS 1377, inner diameter 105 mm, wall thickness 4.5 mm), (b) disassembly elements of test cell, (c) test cell after assembly.

Figure 8.
Soil sample preparation, (a) wetted soil, (b) compressed soil in place and kept for equilibrium, (c) soil sealed for testing.
Figure 8.
Soil sample preparation, (a) wetted soil, (b) compressed soil in place and kept for equilibrium, (c) soil sealed for testing.

Figure 9.
Amplitude ratio of ultrasound reflection from the front and back interface of the pipe material for, soil 1, sand and clay mass ratio of 1:1 (200 g:200 g), soil 2, sand and clay mass ratio of 2:1 (300 g:150 g), soil 3, sand and clay mass ratio of 4:1 (400 g:100 g), and soil 4, sand and clay mass ratio of 6:1 (360 g:60 g).


Table 1.
This is a table. Tables should be placed in the main text near to the first time they are cited.
Table 1.
This is a table. Tables should be placed in the main text near to the first time they are cited.
| Replacement Density (RD) Sand [18] | David Ball Fraction C (DB) Sand [19] | Gravel 1 | Gravel 2 | |
|---|---|---|---|---|
| Particle size | 100% passing 600 μm, 100% retained 63 μm | 600–300 μm, max. 10% larger than 600 μm, max. 10% finer than 300 μm | 5–6.35 mm, non-rounded | 8–9.5 mm, non-rounded |
Table 2.
Former shapes and dimensions.
| Half Cylinder | Hexagonal Star | Half Sphere | Cube | |
|---|---|---|---|---|
| Dimensions, mm | 20 × 100 (diameter × length) | 100 (diagonal points distance) 40 (thickness) | 80 (diameter) | 80 × 80 × 40 (length × width × thickness) |
| Max. section Area, mm2 | 2000 | 4330 | 5026 | 6400 |
Table 3.
Top view of detected voids expressed by depth difference between PVC plate back surface to soil surface using 1, 5 and 10 MHz ultrasound transducers.
Table 3.
Top view of detected voids expressed by depth difference between PVC plate back surface to soil surface using 1, 5 and 10 MHz ultrasound transducers.
| Soil Material | 1 MHz | 5 MHz | 10 MHz |
|---|---|---|---|
| DB sand |  |  |  |
| Gravel 8–9.5 mm |  |  |  |
Table 4.
Top view of detected voids expressed by depth difference between pipe back surface and the soil surface using 5 MHz ultrasound transducer.
Table 4.
Top view of detected voids expressed by depth difference between pipe back surface and the soil surface using 5 MHz ultrasound transducer.
| Pipe Material | RD Sand | DB Sand | Gravel, 5–6.35 mm | Gravel, 8–9.5 mm |
|---|---|---|---|---|
| HDPE |  |  |  |  |
| PVC |  |  |  |  |
Table 5.
Void areas in mm2 for detected voids in Table 4.
Table 5.
Void areas in mm2 for detected voids in Table 4.
| RD Sand | DB Sand | Gravel, 5–6.35 mm | Gravel, 8–9.5 mm | |||||||||
|---|---|---|---|---|---|---|---|---|---|---|---|---|
| Void Shape | HDPE | PVC | Before Test | HDPE | PVC | Before Test | HDPE | PVC | Before Test | HDPE | PVC | Before Test |
| Half cylinder | 1839 | 2000 | 2147 | 1887 | 1514 | 2318 | 1805 | 1989 | 2178 | 2113 | 1520 | 2257 |
| Hexagonal star | 4143 | 4428 | 9235 | 3760 | 3616 | 6605 | 3910 | 4284 | 5123 | 3801 | 2582 | 6578 |
| Half sphere | 3702 | 3743 | 9013 | 2578 | 2630 | 4993 | 2993 | 3167 | 4291 | 3181 | 1866 | 5438 |
| Cube | 7544 | 7612 | 13,129 | 5609 | 5472 | 9454 | 6424 | 6564 | 7561 | 5749 | 4445 | 9650 |
Publisher’s Note: MDPI stays neutral with regard to jurisdictional claims in published maps and institutional affiliations. |
© 2021 by the authors. Licensee MDPI, Basel, Switzerland. This article is an open access article distributed under the terms and conditions of the Creative Commons Attribution (CC BY) license (http://creativecommons.org/licenses/by/4.0/).
Share and Cite
MDPI and ACS Style
Zhu, J.; Boxall, J.B.; Hills, A.F.; Dwyer-Joyce, R.S.; Anderson, S.R.; Collins, R.P. Assessing Ground Support of Plastic Pipes Using Ultrasound. Infrastructures 2021, 6, 30. https://doi.org/10.3390/infrastructures6020030
AMA Style
Zhu J, Boxall JB, Hills AF, Dwyer-Joyce RS, Anderson SR, Collins RP. Assessing Ground Support of Plastic Pipes Using Ultrasound. Infrastructures. 2021; 6(2):30. https://doi.org/10.3390/infrastructures6020030
Chicago/Turabian StyleZhu, Juanjuan, Joby B. Boxall, Andrew F. Hills, Rob S. Dwyer-Joyce, Sean R. Anderson, and Richard P. Collins. 2021. "Assessing Ground Support of Plastic Pipes Using Ultrasound" Infrastructures 6, no. 2: 30. https://doi.org/10.3390/infrastructures6020030