An LSTM Model for Predicting Cross-Platform Bursts of Social Media Activity


1
Department of Computer Science, University of Central Florida, Orlando, FL 32816, USA
2
Department of Statistics and Data Science, University of Central Florida, Orlando, FL 32816, USA
*
Author to whom correspondence should be addressed.
Information 2019, 10(12), 394; https://doi.org/10.3390/info10120394
Submission received: 21 November 2019
/
Revised: 5 December 2019
/
Accepted: 9 December 2019
/
Published: 14 December 2019
(This article belongs to the Special Issue Advances in Social Media Analysis)
Abstract
:Burst analysis and prediction is a fundamental problem in social network analysis, since user activities have been shown to have an intrinsically bursty nature. Bursts may also be a signal of topics that are of growing real-world interest. Since bursts can be caused by exogenous phenomena and are indicative of burgeoning popularity, leveraging cross platform social media data may be valuable for predicting bursts within a single social media platform. A Long-Short-Term-Memory (LSTM) model is proposed in order to capture the temporal dependencies and associations based upon activity information. The data used to test the model was collected from Twitter, Github, and Reddit. Our results show that the LSTM based model is able to leverage the complex cross-platform dynamics to predict bursts. In situations where information gathering from platforms of concern is not possible the learned model can provide a prediction for whether bursts on another platform can be expected.
1. Introduction
Social media platforms are among the most widely used communication channels and have become an indispensable part of our everyday life, due to the speed and reduction in cost that these services provide to its users [1]. This transformation of the communication modality can affect fundamental dynamics of social engagement such as that of weak ties in the context of online social networks [2,3]. Information spread through social media can be good for rapidly raising awareness of important issues such as environmental protection [4] but also can be misused for malicious content spreading activities [5]. Over time, this can render society vulnerable to rumors through misinformation campaigns that can polarize communities [6]. Coordinated scams such as pumping cryptocurrency on social media to inflate prices [7,8] can provide large payoffs.
The seminal work presented in [9] sets a foundation for how “bursts” of activity are a key component in human dynamics and are an ubiquitous phenomenon in data acquired from social systems. It is intriguing how “intense activity followed by longer periods of inactivity” can manifest in social coding platforms [10] from complex timelines of work interspersed with communication about version control. These changes are non-linear in that they do not follow an accumulated trend from previous time points and also manifest themselves within subcomponents of the network such as the “boundary-nodes” (community spanners) [11]. Although the non-linearity poses a direct challenge to accurately predicting their occurrences, their impact affect our societies at large. The work presented here proposes a new model in which activity traces across multiple platforms can be predicted for the platform aggregate and for specific community level associated users (hashtags, repos, and posts). The model is based upon the LSTM (Long-Short-Term-Memory [12]) model which is a sequential model for the associations of an input output response function with temporal dependencies. The goal is to predict activity trends which fall into the characterizations of “bursts” or “spikes” [13,14] due to the observed real world events that they are stimulated by [15]. The data circulated on these platforms can be broadly encapsulated by the term content; this can denote user posts, microblogs, message sharing, or links to other data sources such as repositories on GitHub. It is assumed that these productions and exchanges occur due to both exogenous and endogenous information. There are considerable challenges in tracing the changes between exogenous platform events and the endogenous signals; indeed some of the exogenous signals may be endogenous signals from another platform. If the data from one platform are known to be associated with another platform’s content sharing patterns, this can reduce the degree of exogeneity. This hypothesis is explored in this paper, and the results show that sporadic bursts of activity in a platform can be associated with the cross pollination of content sharing between platforms.
We apply our model to activity trace data from multiple platforms (described in Section 3). Although the corpus contains additional information that can be used to more accurately quantify the relationship significance of network edges, the simplification of topic participation associations is assumed. This also helps promote the search for model explorations which is less likely to infringe upon privacy constraints for ethical usage. The use of GitHub, Reddit and Twitter combines different content-sharing paradigms and use cases. A feature of the data is that there are traces of activity profiles which are related to cyber security which produce activity on all three of the networks and assist in observing the cross platform burst associations. The model (described in Section 4) is used to examine the temporal distance between subsequent cross platform activities. The results (described in Section 5) present an overview of the performance of the model in predicting bursts by utilizing trace data from external platform burst information. The implications of the results and future work are discussed in Section 6.
2. Related Work
Cross network information diffusion is of particular interest for multiple reasons. First, it is useful to improve the accuracy of the activity prediction. Also it is important to differentiate content as being endogenous, exogenous from another platform, or new non-platform derived content being inserted into the network as a burst of activity reflecting the new interest. Different network models have been used for investigating the topic of spreading processes between networks including interconnected networks [16], multisliced [17], and multilevel [18,19]. See Ref. [20] for a review of heterogeneous information network analysis. Most existing work has focused on social influence modeled as a macro-social process such as cascade. Myers et al. [21] presented a model in which information can reach a node via the links of the social network or through the influence of external sources. Krijestorac et al. [22] have analyzed cross-market spillovers in new product adoption. They developed a quasi-experimental model that estimates how introducing a piece of content onto a new platform affects its consumption in a focal platform. Christodoulou et al. [23] present a detailed analysis of social cascading exchange of YouTube videos among Twitter users. Some researchers have extended these methods to explore the underlying evolution [24] and build predictors for many applications: elections [25], box-office revenue [26], book sales prediction [27], stock market prediction from sentiment analysis [28]. Twitter data has been specifically used for prediction in several applications [13,29,30,31]. In comparison, our work focuses more on learning, predicting bursts, and leveraging characteristics from communities of developers.
Burst analysis has been applied to many diverse data sources including neural firing activity [32] and social network analysis [7,32,33]. Myers and Leskovec found that the dynamics of network structure can be characterized by a stable pattern of changes punctuated by sudden bursts [33]. Since the nature of the Facebook platform facilitates information transmission to many friends at once, thousands of rumors are constantly appearing there. Friggeri et al. [7] track the propagation of these rumors and examine the rate of bursts created by rumors via uploading and re-sharing. Information sharing cascades tend to be bursty and many approaches have focused on detecting the basic rising-and-falling pattern that characterizes the initial onset of a cascade [34,35,36,37]. Cheng et al. [38] used characteristics of a cascade’s initial burst to predict whether it will recur in the future. Ref. [39] notes that rumors exhibit bursty temporal fluctuations and that this temporal feature has a high predictive power. In our work we use a recurrent neural network to capture long term dependencies in the cross platform activity that are predictive of future bursts.
3. Data
To examine the model’s ability to encapsulate the platform association of the bursty activity based upon aggregate and topic specific engagements, a large collected corpus of activity traces is necessary. A large dataset is required since the burst activity is not produced by linear dynamics in which gradual changes can be accumulated as evidence between events. Another important consideration for this study is that limited data on the phenomenon can produce conclusions based upon sporadic associations which would not be observed to be consistent in the presence of more data [9].
This study utilizes a dataset which contains trace information from the user activities of three networks, Reddit, Twitter, and GitHub as each is a social network platform with different content sharing and storage option services. We can characterize social media datasets by their size (number of nodes and edges) and by their level of connectivity, as measured by the number of connected components and mean node degree. A connected component refers to the set of maximal nodes such that every node is connected by a path. Node degree refers to the number of connections per node. Our Twitter Common Vulnerabilities and Exposures (CVE) dataset contains 8543 nodes (users) with 14,225 edges (connections), 228 connected components and a mean node degree of 3.33 with the largest being 691. Equivalently for GitHub, there are 16,856 nodes, 207,317 edges, number of connected components 9263, mean degree of 1.45 and max degree of 24,5986. For Reddit there were 98,855 nodes, 98,855 edges, 86 connected components, and mean degree of 4.3 and max degree of 17,438. The data is collected from user activities corresponding to the following domains; Software Vulnerability, Cryptocurrency, and Cybersecurity. Each domain exhibits distinct patterns of burst production (spikes) that are indications of sudden user activity. The Software Vulnerability and Cybersecurity domains are particularly relevant for system administrators, since discussions about these topics can alert users about potential software susceptibilities. Often solutions and patches to currently affected systems can be shared in a social mechanism that offers rapid response which can therefore produce the observed bursts. The cryptocurrency domain also displays bursts but in a different nature than typical regulated financial products. There is a phenomenon, the “pump-and-dump” scheme [40], which is used to bring the value of a crypto currency up from the purchase price enjoyed by early investors and adopters so that a rapid sale allows them to profit from a recent increase. This poses a threat to financial stability and can be used for suspicious financial transfers.
The Software Vulnerability domain is referred to as Common Vulnerabilities and Exposures (CVE) in the results and is centered around publicly known information about security vulnerabilities and exposures. There are around 2600 different CVEs contained in this dataset. There may be similarities in particular CVEs in that malware does evolve from common code bases but this work treats them independently as the model does not assess domain interactions or correlations by looking at the aggregate activity. The cryptocurrency data relates to crypto coins of different popularity such as BitCoin and other less known coins by aggregating them into a single domain based upon the common theme keywords.
Community level activity for bursts is also investigated for the Github platform. This Github data contains relatively distinctive community associations especially around large projects that have corporate sponsorship or support. The community activity may not have tags which are known to define topic categories for networks like Twitter, but there are keywords and meta-data for repositories such as the programming languages employed per repository. From this aggregate (concatenation) of the topic domains a prediction can be produced for the community level activity which is a continuous number for the ratio of active communities over time.
Data Preprocessing
To prepare the CVE data sequence we used accounts for user activities associated with 20 target CVEs. To prepare the community data sequence, we used two different measurements. These measurements are designed to characterize a network at community resolution. Communities were pre-defined and organized by location and topics. Examples of topic based communities include a programming language called Scala and Android. Communities formed by topic are in the domain space of cyber-security. Community based measurements are aggregations of activity at the community level. The measurements look at the activity by users and spread of information within the community. The first measurement is the distribution of user-level burstiness within a community. Burstiness is the intermittent increase or decrease in activity, or bursts in activity as a function of time. The second measurement is the number of contributing users within the community.
4. Methodology
The methodology proposed to study the cross network burst associations is presented here. A key aspect of the methodology is a pre-processing stage in which the social network platform activity traces over time are transformed into a binary state transition (square wave) based upon the determined temporal presence of a burst. The LSTM is then used to look at the independent platform burst activity traces over time and use the data to predict the bursts in subsequent time steps. This approach is then compared to an independent probability state model in which the state transition probabilities are estimated from an empirical estimate. For community traces this becomes a continuous number representing the scale of the community impacts.
A burst (or “peak”) identification methodology which was employed as a preprocessing stage in order to transform the activity traces from a discrete count for the individual users per platform over time windows into a binary signal over the same time windows. The methodology of gradient sign change for local minima and maxima was explored initially to see if a simplistic approach was feasible. This involves looking for the gradient along the activity traces and taking the sign changes as indicators for the burst identifications. Although quick to compute and good in avoiding the problem of relative normalization, the method did not prove capable of avoiding false positives. It was susceptible to the sporadic changes in the activity traces which displayed a far greater number of gradient changes than actual bursts. This was expected and abandoned as the methodology should provide an ability to smooth over changes and ignore the minor mode state transitions for the platform level bursts rather than sporadic changes. A parabolic peak detection algorithm was also tested; however our tests show that it displays an excessively large number of components when noise is observed in the signal. A sinusoid based method for peak detection was also explored for finding the local maxima and minima in the signals with a model function: where is the peak position in time.
We used the Kleinberg burst detection algorithm [41] for analyzing the traces. This technique provides a robust organizational framework to analyze the underlying data in terms of the binary state transitions, whereby the stream is modeled as a two-state automaton. Kleinberg’s burst detection algorithm models the stream using an infinite-state automaton A which at any point in time can be in one of an underlying set of states, and emits messages at different rates depending on its state. Specifically, the automaton A has a set of states that correspond to increasingly rapid rates of emission (activity), and the onset of a burst is signaled by a state transition—from a lower state to a higher state (of activity rate). By assigning costs to state transitions, one can control the frequency of such transitions, preventing very short bursts which would be a type of overfitting, therefore making it easier to identify long bursts despite transient changes in the rate of the stream. s and g in the context of the Kleinberg algorithm represent the costs to control the burst detection based upon the onset of a burst and the length of it. After applying the burst detection algorithm, the output stream consists of a sequence of the two values showing two states, burst and baseline. A burst at time step t indicates that the corresponding piece of information can be considered to be of popular interest at t and the baseline state indicates a reduction of popularity.
In a sequence void of bursts the message arrival would be evenly spaced so that the n messages over time T could be placed on the specified time domain according to “gaps” . A consequence of a burst is that greater activity in certain parts of the time will decrease the distance between these “gaps” (separations between activity stamps). Regions with less activity would have values that are larger due to the proportionally fewer activity stamps residing in that time domain. These rates can be indexed for the different regions with and a base rate for the extent of the measurement of the deviation . A cost function is then defined for the rate transitions of region activity ratios, with a state change cost to penalize the overfitting (where ). An automaton structure is then defined for the data as gaps between activity time stamps for the states to produce the overall cost function that is optimized for: . The cost sequence is optimized via the use of dynamic programming using a procedure similar to the forward backward algorithm within the hidden Markov model. The algorithm is used upon an aggregate of all the platform topic domains but applied to each platform independently. This allows the topic and platform specific analysis of the activity to be produced. Then for each platform domain topic the burst activity traces are created and a binary time series (square wave) is produced which is then the input for the LSTM units.
The output from the Kleinberg burst detection produces independent binary signals that are the input to the LSTM. Each social media platform is represented by a separate input variable; hence in our study, there are three input variables. The temporal difference for the training is set to a 10 day separation so the training and testing had a forward lag of the 10 day period. The testing looked at predicting the bursts of each platform separately and was CVE specific. The accuracy for the topic domain burst predictions in subsequent time steps are noted and examined as the benchmark of success. Each LSTM layer has 100 hidden units, and there were 2 LSTM layers. There was a dropout layer for regularization between the LSTM layers.
Recurrent neural networks (RNNs) have become an increasing popular tool for sequence prediction, and LSTMs reside within this family of models. A strength of LSTMs for use in this context is their ability to address the vanishing gradient problem. It is of particular interest for this application since bursts do not typically follow specific temporal patterns and long delays between events makes parameter estimation a challenge. The hypothesis is tested within two cases; burst prediction with respect to CVE propagation within three social platforms, and community developer activity prediction characterized by a set of features, within three different topic domains in GitHub. The community level activity is only examined for GitHub which makes the investigation less ambiguous since there are repositories which attract a relatively large amount of attention with easily determined memberships. This is assessed through the number of commits to the code repository. Although there are cross repository overlaps, false negatives caused by temporary or missed membership are reduced.
Choosing the best architecture for the LSTM depends on several factors determined through empirical investigations. The proposed network architecture includes two stacked LSTM layers. The optimal number of layers can be different based on the use cases, however two layers have been shown to be generally enough to detect even more complex burst association features over time. Each LSTM layer has been equipped with a Dropout layer in which a random selection of outgoing edges are set to zero at each update of the training phase. Dropping some of the neurons during the training process is a regularization method which prevents overfitting [42]. A dropout layer also reduces the sensitivity to the specific weights of individual neurons by randomly excluding them from activation and weight updates when training the network. Loss and activation functions are chosen for each of the cross platform applications separately since the community level analysis in GitHub deals with continuous data, and the topic domain analysis has a binary response variable. Non-community accuracy is measured using the binary cross entropy loss function. Community level loss is measured with mean squared error (MSE), since the target value ranges according to the subset of the communities that are activated over time. The rectified linear unit (ReLU) was chosen for the hidden layers. The adam and rmsprop optimization functions were chosen for the parameter training algorithm, and the sigmoid function was selected for the case of a binary classification problem.
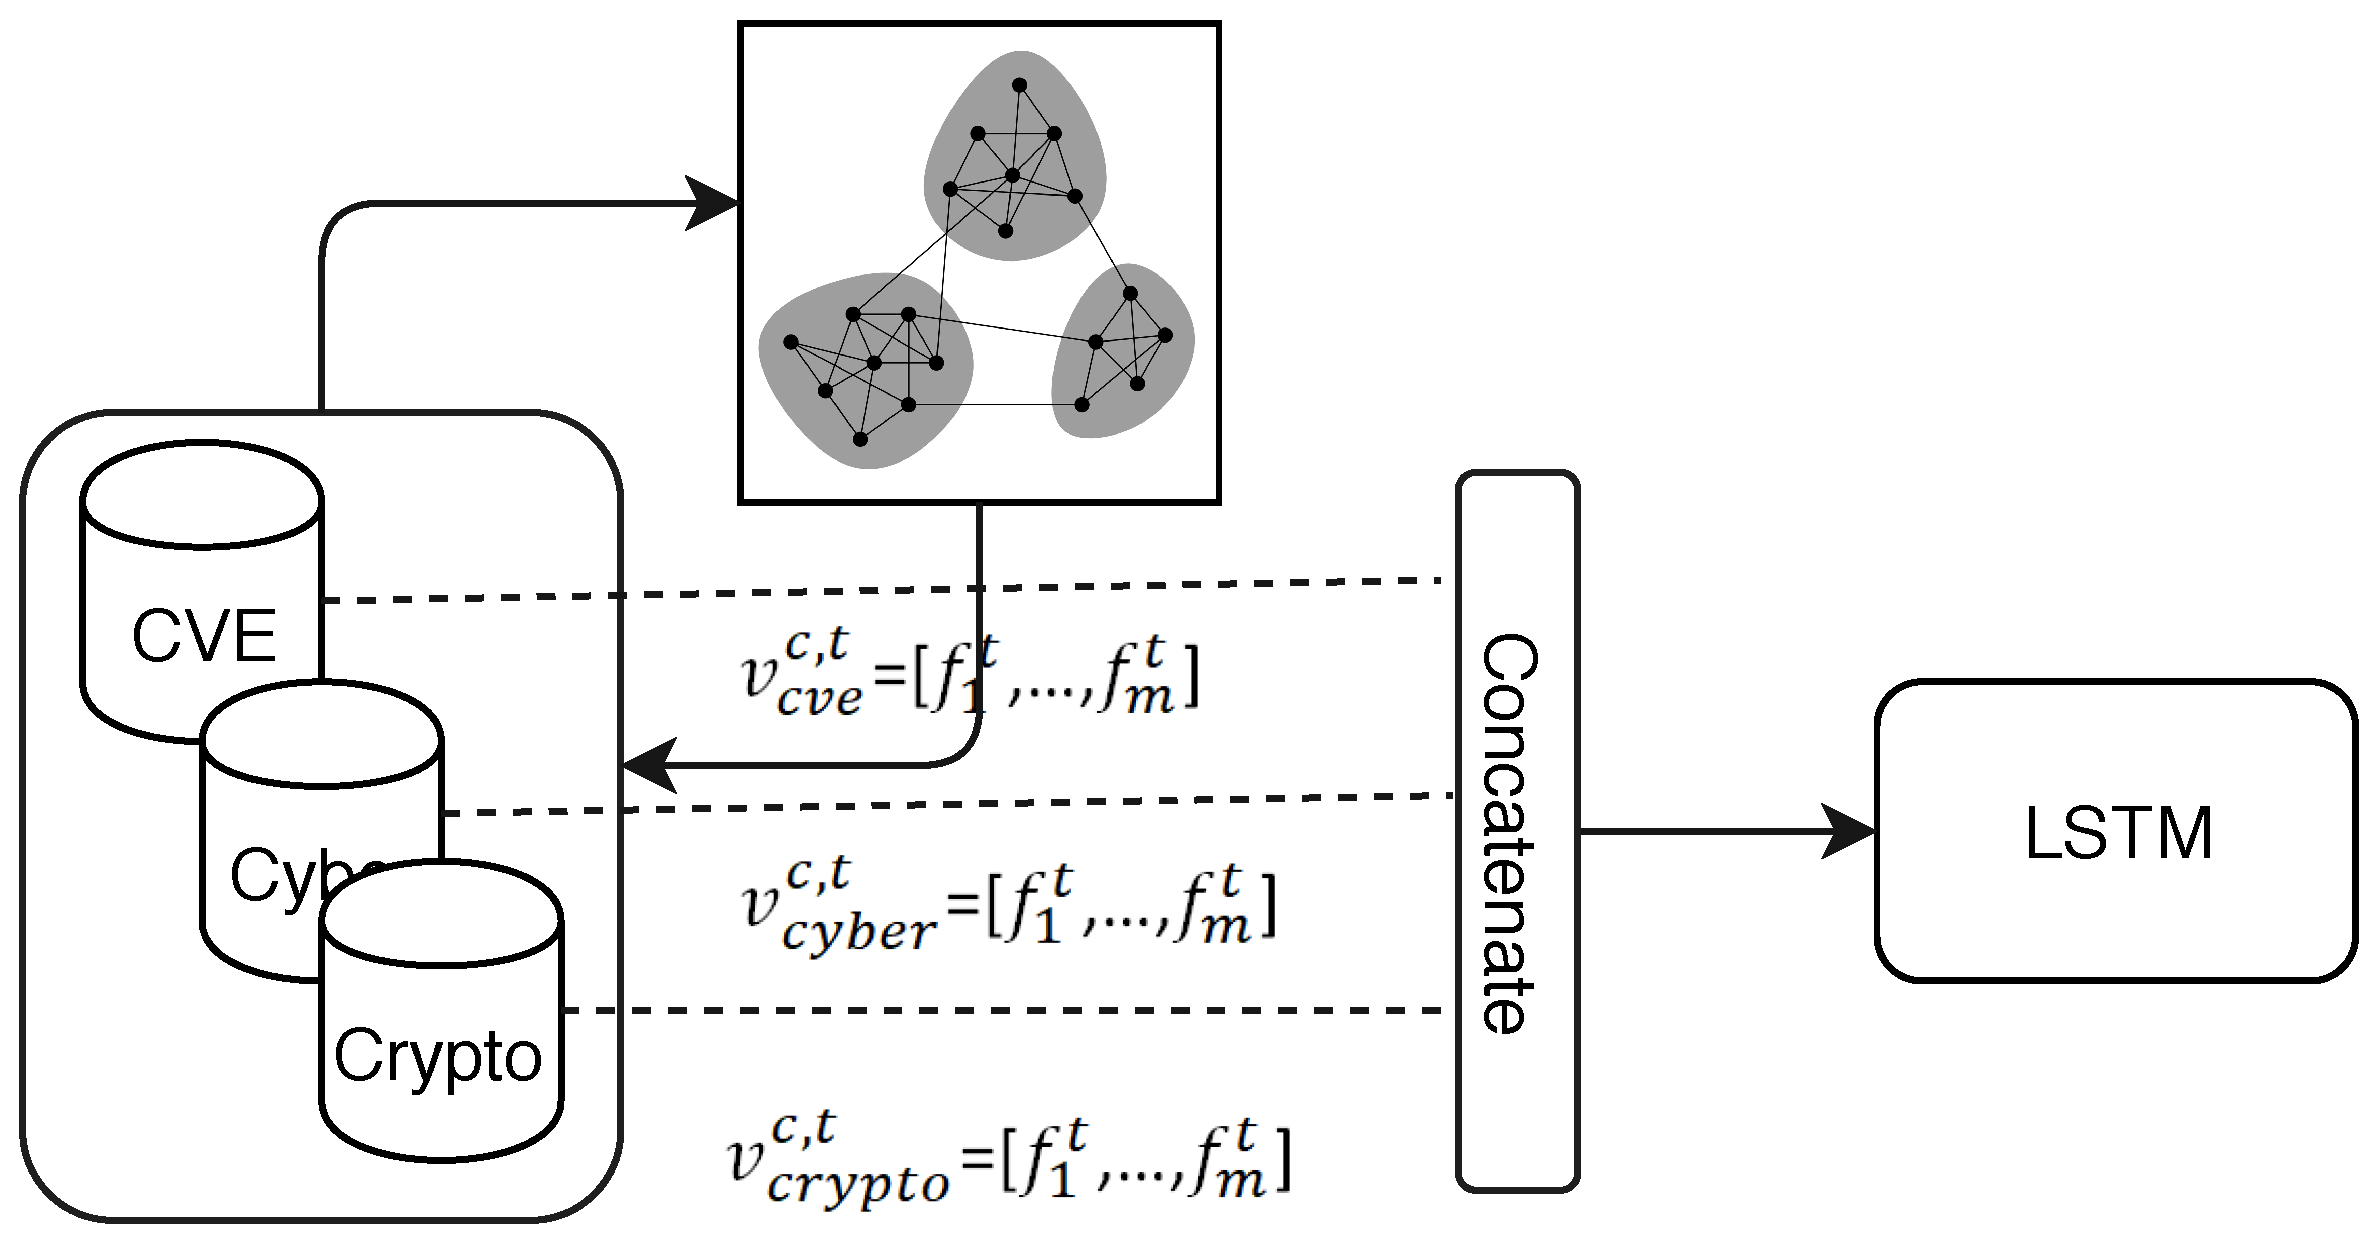
The Keras framework was used to implement the model and it offers multiple accuracy functions with which to judge the model performance. The Root Mean Square Error (RMSE) option is an easy option to interpret as well as resulting in sufficiently accurate model performance for the community level. The overview of the process for GitHub community analysis is presented in Figure 1.
The data is stored as time indexed activity counts in a database, after the collection preprocessing has completed, and the Kleinberg algorithm delivers the binary time series for each platform. These time stamped binary burst trajectories, for a specific social network platform s, are represented by where . The relationship which the research question seeks to establish is whether the subsequent future time step’s bursts can be predicted using the current and past data, and the time into the future is ten days. represents the data for the full set of platform trajectories. The model is fit with data that is a lag of 10 days from the designated “current” time point ,
where is . The represents the error for the functional mapping expected for the fit to the dataset. This relationship is explored by employing an LSTM in which the parameterized model predicts this lagged response. The LSTM uses that includes all of the platform trajectories and not a specific one. The conditional sequence trajectory of predicted states for a specific platform (based upon the same platform) is,
and h is the hidden state of the LSTM unit. The augmented a_LSTM takes into account the multiple platforms as a model for predicting the bursts of a single specified platform,
4.1. LSTM Model vs. Markov Chain
We compare the proposed LSTM against a Markov chain model. In contrast to the LSTM the Markov chain assumes a prefixed temporal independence structure which is typically first order. Although the current state could conceptually be able to define the probability for the state transitions, the issue of the vanishing gradient in temporal signals is a problem which the LSTM directly addresses in the model definition and framework.
In the burst application the target values are binary, and the benchmark model is compared against a stochastic Markov chain model between the 2 states (burst or no burst) over the timeline. The Markov state transition probabilities are calculated based on transition distributions using the empirical estimates in the training data. With the state burst and baseline, then the state transition matrix denoted by B is given by:
B describes the transition probabilities between the baseline state denoted as l and burst state denoted as h (for low and high). E.g. the low-low state represents the probability of not being in a burst state and transitioning into a burst during the next time step. These probabilities are calculated via:
where k is the burst state category and T the number of time points and the indicator function. This is for the bursts which are considered to be endogenous and is irrespective of the origin of the content initiation. For the cross network burst association, the index for the social network platform index s is taken into account:
There is no restriction on the equality of the network index and represents the endogenous signals for burst activity. The transition matrix B is then produced for each of these network pairings, so that the independent associations can be examined for specific network burst alignments.
where S is the number of social media platforms that can exert cross-platform effects. The aim of the procedure is to estimate the probability of one platform affecting any other platform’s activity. These empirical probabilities are considered to be the signals which are not exogenous to the data present in the database utilized. These probabilities will typically have smaller values than as it is not expected that each platform will produce an equal contribution towards another platform’s activity. The most typical use case is the probability entry of (probability of two bursts across different networks). The independent state transition sequence for the LSTM can be compared to this probability state transitions via the product of .
5. Results
The first application of the a_LSTM is that of burst prediction of a social network platform given the endogenous historical data for bursts and the external network bursts data. It is also compared to the predictive abilities of the LSTM which uses only endogenous data. Burst analysis and prediction is a fundamental problem in social network analysis since the patterns are typically non-linear and unpredictable. This is due to the fact that user activities have been shown to have an intrinsically bursty nature; yet bursts may also be a signal of topics that are of growing real-world interest. Social media bursts occur when a huge volume of data is exchanged during a short period of time, often due to the occurrence of an external event such as a sports game, election, or a movie release. Bursts can be indicative of both real news stories that are reaching peak public interest or fake news propagated by bad actors each which can have lasting effects on the future directions of society. Bursts of posts and tweets over platforms can be exploited by those wishing to push a disinformation campaign such as the artificial price inflation of a crypto currency. Therefore, analyzing bursts is a promising area to detect and counter such activities. We are particularly interested in the propagation of information about software vulnerabilities across multiple social media platforms. When a vulnerability is discovered, different groups of actors such as software developers and hackers start posting announcements and discussion in widely used forums over multiple channels such as Twitter, GitHub, and Reddit. Previous work on this data has shown that CVEs exhibit cross platform correlations; Schiappa et al. [43] investigated 2600 CVEs across multiple platforms including Reddit, Twitter and GitHub. They found that around 24.7% CVE cascades start from GitHub and then jump into Reddit and Twitter respectively. 45.7% start from GitHub and then jump into Twitter and Reddit respectively, 15.5% start from Twitter and go through Reddit and then GitHub. 4.1% follow Twitter, GitHub, Reddit pattern; 7.8% Twitter, Reddit and GitHub pattern and the rest follow Reddit, GitHub and Twitter platform path pattern. Since bursts can be caused by exogenous phenomena and are indicative of burgeoning popularity, we hypothesize that leveraging cross platform social media data may be valuable for predicting bursts within a single social media platform.
Table 1 provides an overview of the dataset used. There are two main social network platforms summarized by the mean, median and standard deviation for the number of actors (nodes) and events (edges) produced. Although GitHub and Twitter provide services for different use cases, there are comparable numbers for each case—a surprising finding. We attribute this to Twitter allowing for a much lower time to entry for the production and dissemination of content on its platform. Table 2 shows the results of applying the a_LSTM model to burst prediction between networks in comparison to the MCM (Markovian based model) described in Section 4.1. The preprocessing stage using the Kleinberg algorithm is conducted with different parameter values to ensure that the predictive comparison is not dependent upon a specific choice of burst allocations chosen for the preprocessing. In all cases the a_LSTM outperforms the MCM for the different Kleinberg parameterizations.
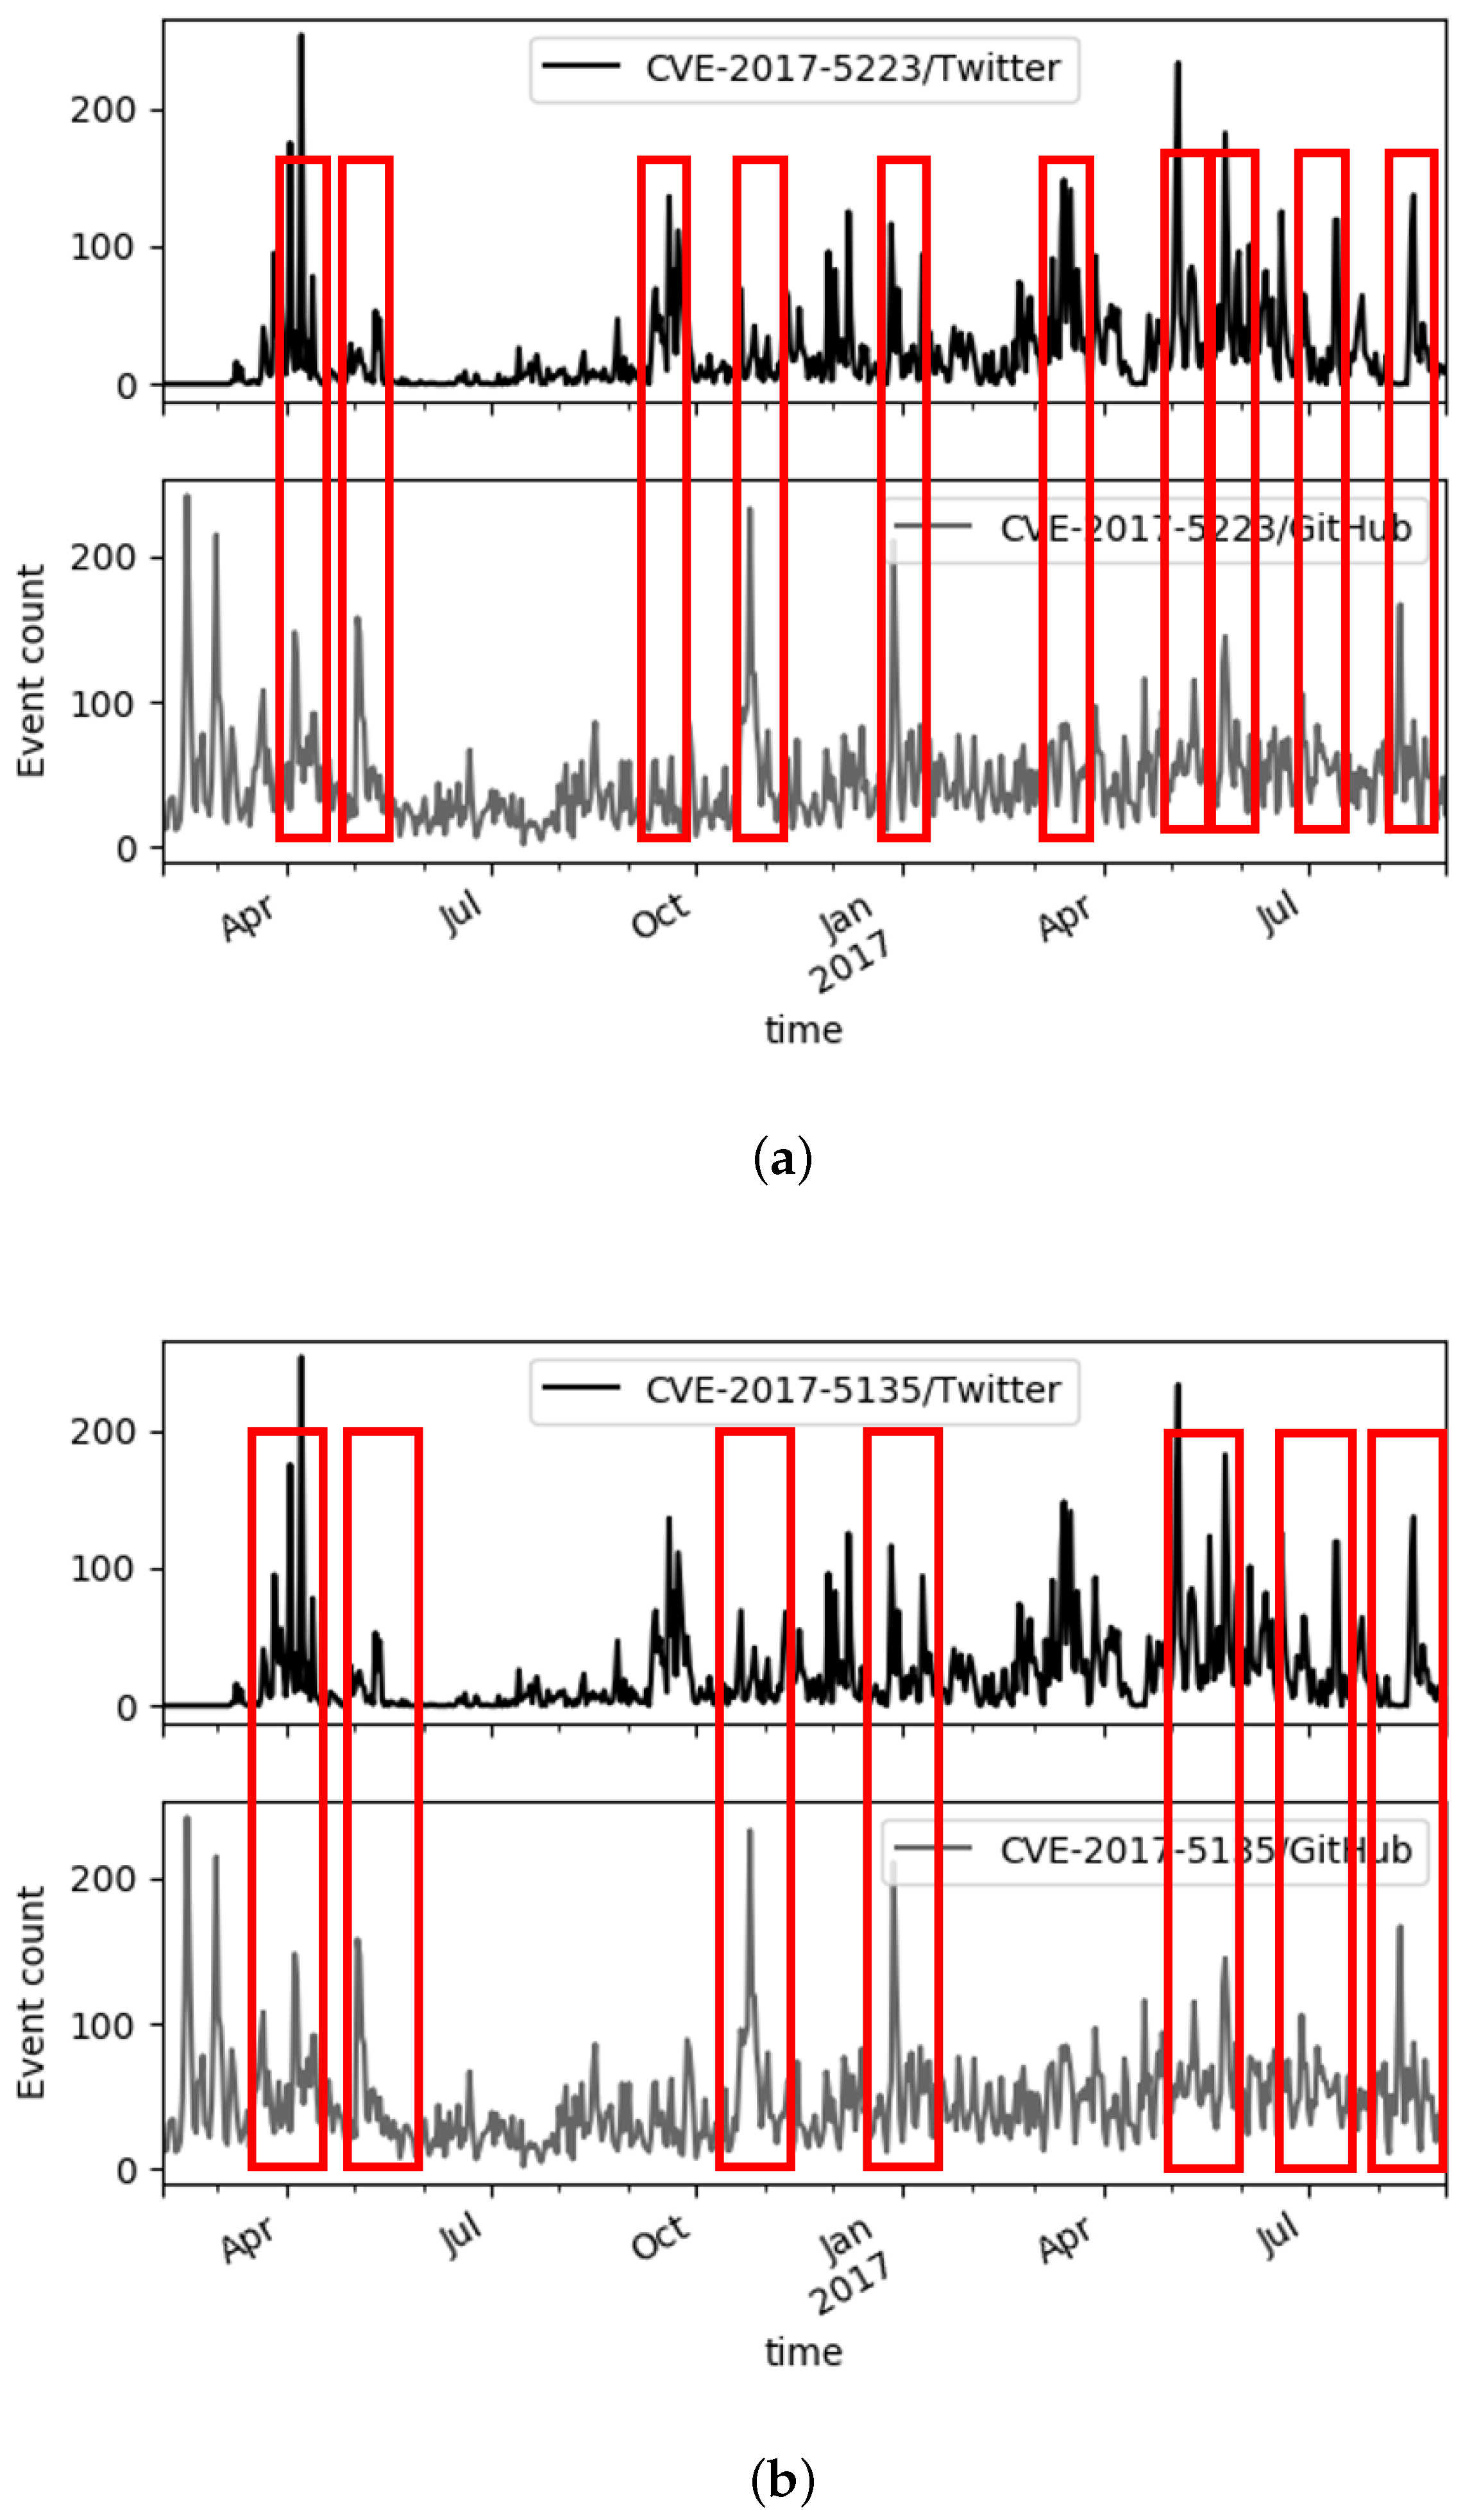
Figure 2 shows two subfigures (a) and (b) which examine different CVEs, CVE-2017-5638 and CVE-2017-5638 respectively where the top plots are for Twitter and the bottom plots for GitHub. The activity is measured on the y-axis as the event count for each dataset and in the red rectangle outlines are the places where the Kleinberg algorithm detects the presence of a burst in at least one of the pairs of the time series for the predefined window widths. It can be seen how the algorithm does not produce sporadic placements of the burst detection and that the different platforms are not redundant as not all bursts correspond to a cross network burst. The region for the month of July 2017 shows a lack of bursts of activity on both platforms. Our hypothesis is that there is substantial alignment of the bursts; however if there is more activity and bursts do not align it is due to a temporal shift manifesting itself as a “lag” in the burst emergence. This further supports the motivation for the use of the a_LSTM.
Table 3 displays the results for the comparison of the a_LSTM and the LSTM which are each trained with 2 different parameter optimization schemes and 2 different activation functions. The target data used here is for the GitHub platform only, since the platform features make community topic identifications more distinct. It can be seen that the a_LSTM outperforms the LSTM on each combination of the optimization scheme and activation function listed. This shows not only the value in the a_LSTM but also that GitHub community activities are not isolated events but responsive to the activity which is being discussed in Reddit and Twitter as well.
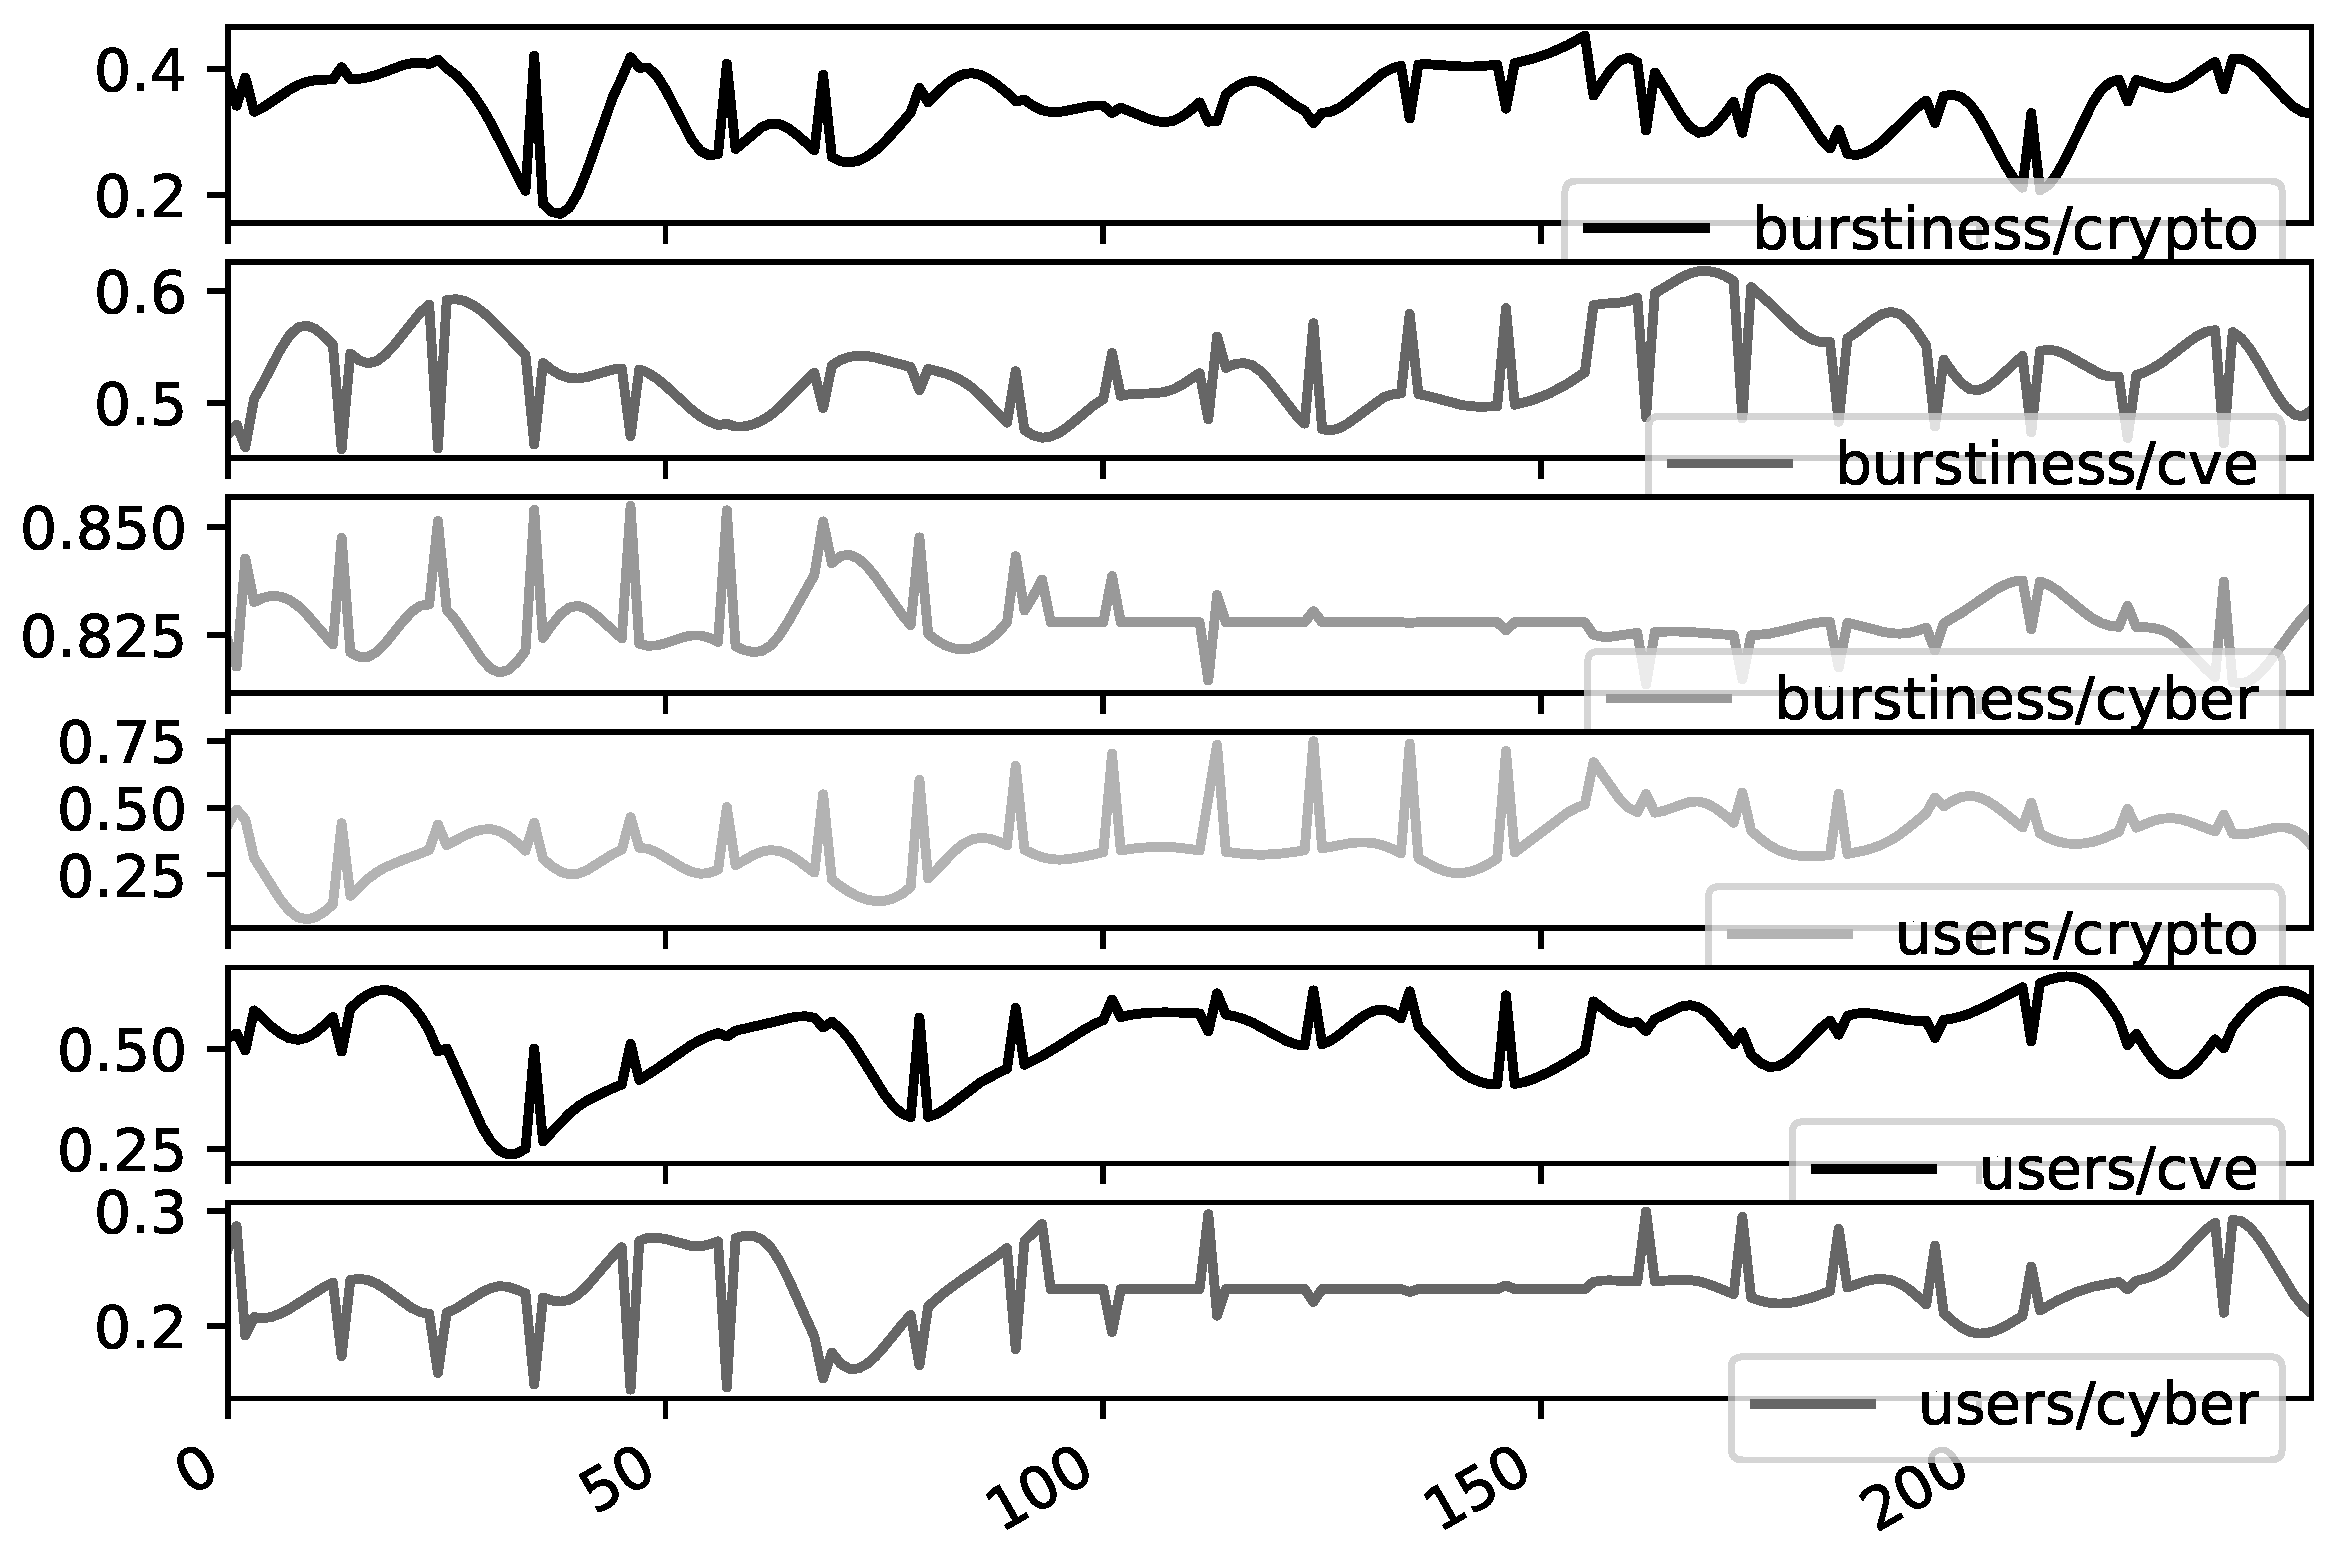
Figure 3 shows the temporal patterns of various community activity domain topics in Github. The set of subplots shows different domain topics for which the content is affiliated; cyber security, crypto, or CVEs. There is a differentiation between the “burstiness” of the activity which aggregates the total amount of contributions toward the platform activity and the users trace which is for the number of users active over time separated windows. The vertical axis on each plot represents the degree to which the number of communities (connected components) in that topic domain can be considered active for that time frame. The a_LSTM model applied to this dataset incorporates the complete set of trajectories rather than predicting based upon a single trajectory and provides an improvement regardless of whether there is cross platform pattern association that can be inferred from visual inspection. This study included 20 communities on GitHub within these domains. This activity is based upon inter-community interactions according to activity burstiness and the number of users who contribute to the community.
It can be seen that the bursts do not have a regular pattern in one platform or between the different platforms which is obvious and consistent over time. These networks as a whole are not completely governed by endogenous signals and at some time point are affected by exogenous phenomena which promote content creation on the social networks studied. Given that the time frame where relevant information for burst prediction cannot be inferred prior to the analysis, models requiring time lag parameterizations are challenging. The MCM model shows less optimal predictive power for this reason in comparison to the LSTM based models which use information from time dependencies of variable size. We believe that this is the reason that the single platform LSTM model outperforms the MCM. The proposed model, a_LSTM, augments the endogenous data with cross platform information that helps the model to more accurately detect bursts and community level activation.
6. Conclusions
Online social networks display bursts of activity as supported by previous research on human dynamics. This phenomenon manifests itself as “spikes” in the time series of activity traces that are aggregations of the count of time stamped events. These activity bursts are indicators that the participating users have an increased interest in the content being shared. This content can be related to civil unrest, financial disruptions and other newsworthy events. Our work concerns itself primarily with CVEs that incorporate cyber security, crypto currencies, and an aggregate of those topics. Predicting bursts related to cybersecurity activity may enable system administrators to anticipate and counter system level threats. A general algorithm for predicting social media bursts is a stepping stone towards understanding how human societies transmit information. Previous research (e.g., [38]) has established how challenging the prediction is due to the lack of repetitive pattern. Here the LSTM is employed to model the burst prediction pattern. This work proposes the a_LSTM which considers data from multiple social networks in order to improve prediction performance. The dataset used to test this model is composed of events coming from Twitter, Reddit, and GitHub. The investigation also considers the related question of community topic domain activity where the connected components on a topic are counted as active or not over time providing a non-negative real number time series. This data is collected for GitHub before applying the LSTM and a_LSTM models. In both cases the a_LSTM shows better predictive accuracy. We conclude that the information across social networks can provide valuable information in predicting the bursts within a single network. This is a new finding that has not been discussed in related work, due to the relative shortage of cross-platform datasets.
Predictions of bursts can be improved upon using the proposed a_LSTM. Results are shown using data from three major social networks that have a global coverage. One avenue for future work would be to explore other topics, such as news or entertainment, and other social media platforms, such as YouTube and Instagram, to see if their behavior exhibits similar dynamics. The cross network association may not be exhibited across different forms of content or social media platforms, if the content sharing remains within the networks of the content origin. In this case the proposed a_LSTM model may not perform well. Future investigations could also explore how the data can be clustered into topic groups to see if they exhibit repetitive bursts similar to “shock” trains. In our future work, we are exploring the use of LSTM event volume prediction for improving the performance of our agent-based simulation of social media platforms.
Author Contributions
Conceptualization, N.H.B. and G.S.; methodology, N.H.B.; software, N.H.B.; validation, N.H.B., G.S. and A.V.M.; formal analysis, N.H.B., G.S. and A.V.M.; investigation, N.H.B.; resources, G.S.; writing—original draft preparation, N.H.B.; writing—review and editing, N.H.B., A.V.M., and G.S.; supervision, G.S. and A.V.M.
Funding
This work was partially supported by grant FA8650-18-C-7823 from the Defense Advanced Research Projects Agency (DARPA). The views and opinions contained in this article are the authors and should not be construed as official or as reflecting the views of the University of Central Florida, DARPA, or the U.S. Department of Defense.
Conflicts of Interest
The authors declare no conflict of interest.
References
- Yang, J.; Counts, S. Predicting the speed, scale, and range of information diffusion in twitter. In Proceedings of the AAAI Conference on Weblogs and Social Media, Washington, DC, USA, 23–26 May 2010. [Google Scholar]
- Friedkin, N. A test of structural features of Granovetter’s strength of weak ties theory. Soc. Netw. 1980, 2, 411–422. [Google Scholar] [CrossRef]
- Zhao, J.; Wu, J.; Xu, K. Weak ties: Subtle role of information diffusion in online social networks. Phys. Rev. E 2010, 82, 016105. [Google Scholar] [CrossRef] [PubMed] [Green Version]
- Mooney, P.; Winstanley, A.C.; Corcoran, P. Evaluating Twitter for use in environmental awareness campaigns. In Winstanley, Adam (Hg.): Proceedings of the China-Ireland Information and Communications Technologies Conference (CIICT 2009), Maynooth, Ireland, 19–21 August 2009; National University of Ireland: Galway, Ireland, 2009; pp. 83–86. [Google Scholar]
- Del Vicario, M.; Bessi, A.; Zollo, F.; Petroni, F.; Scala, A.; Caldarelli, G.; Stanley, H.E.; Quattrociocchi, W. The spreading of misinformation online. Proc. Natl. Acad. Sci. USA 2016, 113, 554–559. [Google Scholar] [CrossRef] [PubMed] [Green Version]
- Taylor, C.; Mantzaris, A.; Garibay, I. Exploring How Homophily and Accessibility Can Facilitate Polarization in Social Networks. Information 2018, 9, 325. [Google Scholar] [CrossRef] [Green Version]
- Friggeri, A.; Adamic, L.; Eckles, D.; Cheng, J. Rumor cascades. In Proceedings of the International AAAI Conference on Weblogs and Social Media, Ann Arbor, MI, USA, 1–4 June 2014. [Google Scholar]
- Starbird, K.; Palen, L. (How) Will the Revolution be Retweeted?: Information Diffusion and the 2011 Egyptian Uprising. In Proceedings of the ACM Conference on Computer Supported Cooperative Work, Seattle, WA, USA, 11–15 February 2012; pp. 7–16. [Google Scholar]
- Barabasi, A.L. The origin of bursts and heavy tails in human dynamics. Nature 2005, 435, 207. [Google Scholar] [CrossRef] [PubMed] [Green Version]
- Vasilescu, B.; Filkov, V.; Serebrenik, A. Stack Overflow and GitHub: Associations between Software Development and Crowdsourced Knowledge. In Proceedings of the IEEE International Conference on Social Computing, Beijing, China, 20–23 August 2013; pp. 188–195. [Google Scholar]
- Mantzaris, A.V. Uncovering nodes that spread information between communities in social networks. EPJ Data Sci. 2014, 3, 26. [Google Scholar] [CrossRef] [Green Version]
- Hochreiter, S.; Schmidhuber, J. Long short-term memory. Neural Comput. 1997, 9, 1735–1780. [Google Scholar] [CrossRef] [PubMed]
- Wang, S.; Yan, Z.; Hu, X.; Philip, S.Y.; Li, Z. Burst time prediction in cascades. In Proceedings of the AAAI Conference on Artificial Intelligence, Austin, TX, USA, 25–30 January 2015. [Google Scholar]
- Higham, D.; Mantzaris, A.V.; Grindrod, P.; Otley, A.; Laflin, P. Anticipating activity in social media spikes. In Proceedings of the International AAAI Conference on Web and Social Media, Oxford, UK, 26–29 May 2015. [Google Scholar]
- Alsaedi, N.; Burnap, P.; Rana, O. Automatic summarization of real world events using twitter. In Proceedings of the Tenth International AAAI Conference on Web and Social Media, Cologne, Germany, 17–20 May 2016. [Google Scholar]
- Wang, H.; Li, Q.; D’Agostino, G.; Havlin, S.; Stanley, H.E.; Van Mieghem, P. Effect of the interconnected network structure on the epidemic threshold. Phys. Rev. E 2013, 88, 022801. [Google Scholar] [CrossRef] [PubMed] [Green Version]
- Mucha, P.J.; Porter, M.A. Communities in multislice voting networks. Chaos 2010, 20, 041108. [Google Scholar] [CrossRef] [PubMed] [Green Version]
- Wasserman, S.; Faust, K. Social Network Analysis: Methods and Applications; Cambridge University Press: Cambridge, UK, 1994; Volume 8. [Google Scholar]
- Salehi, M.; Sharma, R.; Marzolla, M.; Magnani, M.; Siyari, P.; Montesi, D. Spreading processes in multilayer networks. IEEE Trans. Netw. Sci. Eng. 2015, 2, 65–83. [Google Scholar] [CrossRef] [Green Version]
- Shi, C.; Li, Y.; Zhang, J.; Sun, Y.; Philip, S.Y. A survey of heterogeneous information network analysis. IEEE Trans. Knowl. Data Eng. 2017, 29, 17–37. [Google Scholar] [CrossRef]
- Myers, S.A.; Zhu, C.; Leskovec, J. Information diffusion and external influence in networks. In Proceedings of the ACM SIGKDD International Conference on Knowledge Discovery and Data Mining, Beijing, China, 12–16 August 2012; pp. 33–41. [Google Scholar]
- Krijestorac, H.; Garg, R.; Mahajan, V.; Ter Hofstede, F. Cross-Platform Spillover Effects in Consumption of Viral Content: A Quasi-Experimental Analysis Using Synthetic Controls. SSRN 2017. [Google Scholar] [CrossRef]
- Christodoulou, G.; Georgiou, C.; Pallis, G. The role of Twitter in Youtube videos diffusion. In Proceedings of the International Conference on Web Information Systems Engineering, Paphos, Cyprus, 28–30 November 2012; pp. 426–439. [Google Scholar]
- Wang, J.; Jiang, C.; Guan, S.; Xu, L.; Ren, Y. Big Data Driven Similarity Based U-Model for Online Social Networks. In Proceedings of the IEEE Global Communications Conference, Singapore, 4–8 December 2017; pp. 1–6. [Google Scholar]
- Tumasjan, A.; Sprenger, T.O.; Sandner, P.G.; Welpe, I.M. Predicting Elections with Twitter: What 140 characters Reveal About Political Sentiment. In Proceedings of the Fourth International AAAI Conference on Weblogs and Social Media, Washington, DC, USA, 23–26 May 2010. [Google Scholar]
- Asur, S.; Huberman, B.A. Predicting the future with social media. In Proceedings of the IEEE/WIC/ACM International Conference on Web Intelligence and Intelligent Agent Technology, IEEE Computer Society, Toronto, ON, Canada, 31 August–3 September 2010; pp. 492–499. [Google Scholar]
- Gruhl, D.; Guha, R.; Kumar, R.; Novak, J.; Tomkins, A. The predictive power of online chatter. In Proceedings of the ACM SIGKDD International Conference on Knowledge Discovery in Data Mining, Chicago, IL, USA, 21–24 August 2005; pp. 78–87. [Google Scholar]
- Bollen, J.; Mao, H.; Zeng, X. Twitter mood predicts the stock market. J. Comput. Sci. 2011, 2, 1–8. [Google Scholar] [CrossRef] [Green Version]
- Kupavskii, A.; Ostroumova, L.; Umnov, A.; Usachev, S.; Serdyukov, P.; Gusev, G.; Kustarev, A. Prediction of retweet cascade size over time. In Proceedings of the ACM International Conference on Information and Knowledge Management, Maui, HI, USA, 29 October–2 November 2012; pp. 2335–2338. [Google Scholar]
- Pourebrahim, N.; Sultana, S.; Thill, J.C.; Mohanty, S. Enhancing Trip Distribution Prediction with Twitter Data: Comparison of Neural Network and Gravity Models. In Proceedings of the ACM SIGSPATIAL International Workshop on AI for Geographic Knowledge Discovery, Seattle, WA, USA, 6 November 2018; pp. 5–8. [Google Scholar]
- Hakim, M.A.N.; Khodra, M.L. Predicting information cascade on Twitter using support vector regression. In Proceedings of the IEEE International Conference on Data and Software Engineering (ICODSE), Bandung, Indonesia, 26–27 November 2014; pp. 1–6. [Google Scholar]
- Cheng-yu, T.L.; Poo, M.m.; Dan, Y. Burst spiking of a single cortical neuron modifies global brain state. Science 2009, 324, 643–646. [Google Scholar]
- Myers, S.A.; Leskovec, J. The bursty dynamics of the Twitter information network. In Proceedings of the International Conference on World Wide Web, Seoul, Korea, 7–11 April 2014; pp. 913–924. [Google Scholar]
- Ahmed, M.; Spagna, S.; Huici, F.; Niccolini, S. A peek into the future: Predicting the evolution of popularity in user generated content. In Proceedings of the ACM International Conference on Web Search and Data Mining, Rome, Italy, 4–8 February 2013; pp. 607–616. [Google Scholar]
- Bauckhage, C.; Kersting, K.; Hadiji, F. Mathematical models of fads explain the temporal dynamics of internet memes. In Proceedings of the International AAAI Conference on Weblogs and Social Media, Cambridge, MA, USA, 8–11 July 2013. [Google Scholar]
- Matsubara, Y.; Sakurai, Y.; Prakash, B.A.; Li, L.; Faloutsos, C. Rise and fall patterns of information diffusion: Model and implications. In Proceedings of the ACM SIGKDD International Conference on Knowledge Discovery and Data Mining, Beijing, China, 12–16 August 2012; pp. 6–14. [Google Scholar]
- Yang, J.; Leskovec, J. Modeling information diffusion in implicit networks. In Proceedings of the IEEE International Conference on Data Mining, Sydney, Australia, 13 December 2010; pp. 599–608. [Google Scholar]
- Cheng, J.; Adamic, L.A.; Kleinberg, J.M.; Leskovec, J. Do cascades recur? In Proceedings of the International Conference on World Wide Web, Montreal, QC, Canada, 11–15 April 2016; pp. 671–681. [Google Scholar]
- Kwon, S.; Cha, M.; Jung, K.; Chen, W.; Wang, Y. Prominent features of rumor propagation in online social media. In Proceedings of the IEEE International Conference on Data Mining, Dallas, TX, USA, 7–10 December 2013; pp. 1103–1108. [Google Scholar]
- Xu, J.; Livshits, B. The anatomy of a cryptocurrency pump-and-dump scheme. In Proceedings of the USENIX Security Symposium, Santa Clara, CA, USA, 14–16 August 2019; pp. 1609–1625. [Google Scholar]
- Kleinberg, J. Bursty and hierarchical structure in streams. Data Min. Knowl. Discov. 2003, 7, 373–397. [Google Scholar] [CrossRef]
- Srivastava, N.; Hinton, G.; Krizhevsky, A.; Sutskever, I.; Salakhutdinov, R. Dropout: A Simple Way to Prevent Neural Networks from Overfitting. J. Mach. Learn. Res. 2014, 15, 1929–1958. [Google Scholar]
- Schiappa, M.; Chantry, G.; Garibay, I. Cyber Security in a Complex Community: A Social Media Analysis on Common Vulnerabilities and Exposures. In Proceedings of the 6th Int Conference on Social Network Analysis, Management and Security (SNAMS 2019), Granada, Spain, 22–25 October 2019. [Google Scholar]
Figure 1.
The methodological architecture for the investigation of the community responses in Github.
Figure 1.
The methodological architecture for the investigation of the community responses in Github.

Figure 2.
Figures display the comparison of the event bursts for the activity streams of Twitter and GitHub for two different CVEs. The aligned time series show where both platforms exhibit bursts and where the preset time window exhibits no common burst activity.
Figure 2.
Figures display the comparison of the event bursts for the activity streams of Twitter and GitHub for two different CVEs. The aligned time series show where both platforms exhibit bursts and where the preset time window exhibits no common burst activity.

Figure 3.
Temporal pattern of community burstiness and number of contributing users for the community surrounding Android within the Crypto, Cyber and CVE topics (in Github).
Figure 3.
Temporal pattern of community burstiness and number of contributing users for the community surrounding Android within the Crypto, Cyber and CVE topics (in Github).


Table 1.
Overview of the data used by the models in the top 20 Common Vulnerabilities and Exposures (CVEs) in Github, Twitter and Reddit for the number of events created by the number of actors mentioned for them.
Table 1.
Overview of the data used by the models in the top 20 Common Vulnerabilities and Exposures (CVEs) in Github, Twitter and Reddit for the number of events created by the number of actors mentioned for them.
| GitHub | ||||||
|---|---|---|---|---|---|---|
| Actors | Events | Actors | Events | Actors | Events | |
| Mean | 223.7 | 487.52 | 199.05 | 261.55 | 14.5 | 19 |
| Median | 162.5 | 339 | 195 | 270 | 11 | 14.5 |
| Std | 224.36 | 507.24 | 134.58 | 187.79 | 9.7 | 12.15 |
Table 2.
Model error (RMSE) over 20 CVEs streams on GitHub (s and g represents the hyper parameters used in Kleinberg algorithm for burst detection). The results show that the a_LSTM outperforms the MCM model irrespective of the burst detection parameterizations.
Table 2.
Model error (RMSE) over 20 CVEs streams on GitHub (s and g represents the hyper parameters used in Kleinberg algorithm for burst detection). The results show that the a_LSTM outperforms the MCM model irrespective of the burst detection parameterizations.
| () | (2, 0.50) | (2, 0.75) | (3, 0.50) | (3, 0.75) | ||||
|---|---|---|---|---|---|---|---|---|
| Model | Mean | Std | Mean | Std | Mean | Std | Mean | Std |
| a_LSTM | 0.09 | 0.20 | 0.11 | 0.22 | 0.08 | 0.20 | 0.09 | 0.21 |
| MCM | 0.36 | 0.25 | 0.29 | 0.18 | 0.37 | 0.21 | 0.39 | 0.28 |
Table 3.
Community burstiness prediction results (applied to GitHub) where the a_LSTM (augmented multiple platform LSTM) outperforms the LSTM that uses only activity data from a single network to predict bursts of activity. The decrease in the RMSE error indicates that the augmented LSTM is a preferable choice.
| Model | Optimizer | Activation Function | |||
|---|---|---|---|---|---|
| Linear | Softmax | ||||
| Mean | Std | Mean | Std | ||
| a_LSTM | adam | 0.010 | 0.018 | 0.015 | 0.032 |
| rmsprop | 0.021 | 0.41 | 0.010 | 0.016 | |
| LSTM | adam | 0.022 | 0.28 | 0.025 | 0.041 |
| rmsprop | 0.030 | 0.41 | 0.20 | 0.021 | |
© 2019 by the authors. Licensee MDPI, Basel, Switzerland. This article is an open access article distributed under the terms and conditions of the Creative Commons Attribution (CC BY) license (http://creativecommons.org/licenses/by/4.0/).
Share and Cite
MDPI and ACS Style
Hajiakhoond Bidoki, N.; Mantzaris, A.V.; Sukthankar, G. An LSTM Model for Predicting Cross-Platform Bursts of Social Media Activity. Information 2019, 10, 394. https://doi.org/10.3390/info10120394
AMA Style
Hajiakhoond Bidoki N, Mantzaris AV, Sukthankar G. An LSTM Model for Predicting Cross-Platform Bursts of Social Media Activity. Information. 2019; 10(12):394. https://doi.org/10.3390/info10120394
Chicago/Turabian StyleHajiakhoond Bidoki, Neda, Alexander V. Mantzaris, and Gita Sukthankar. 2019. "An LSTM Model for Predicting Cross-Platform Bursts of Social Media Activity" Information 10, no. 12: 394. https://doi.org/10.3390/info10120394
Note that from the first issue of 2016, this journal uses article numbers instead of page numbers. See further details here.