
Assessing the Feasibility of a Multimodal Approach to Pain Evaluation in Early Stages after Spinal Cord Injury
 , ,
, ,
Abstract
:1. Introduction
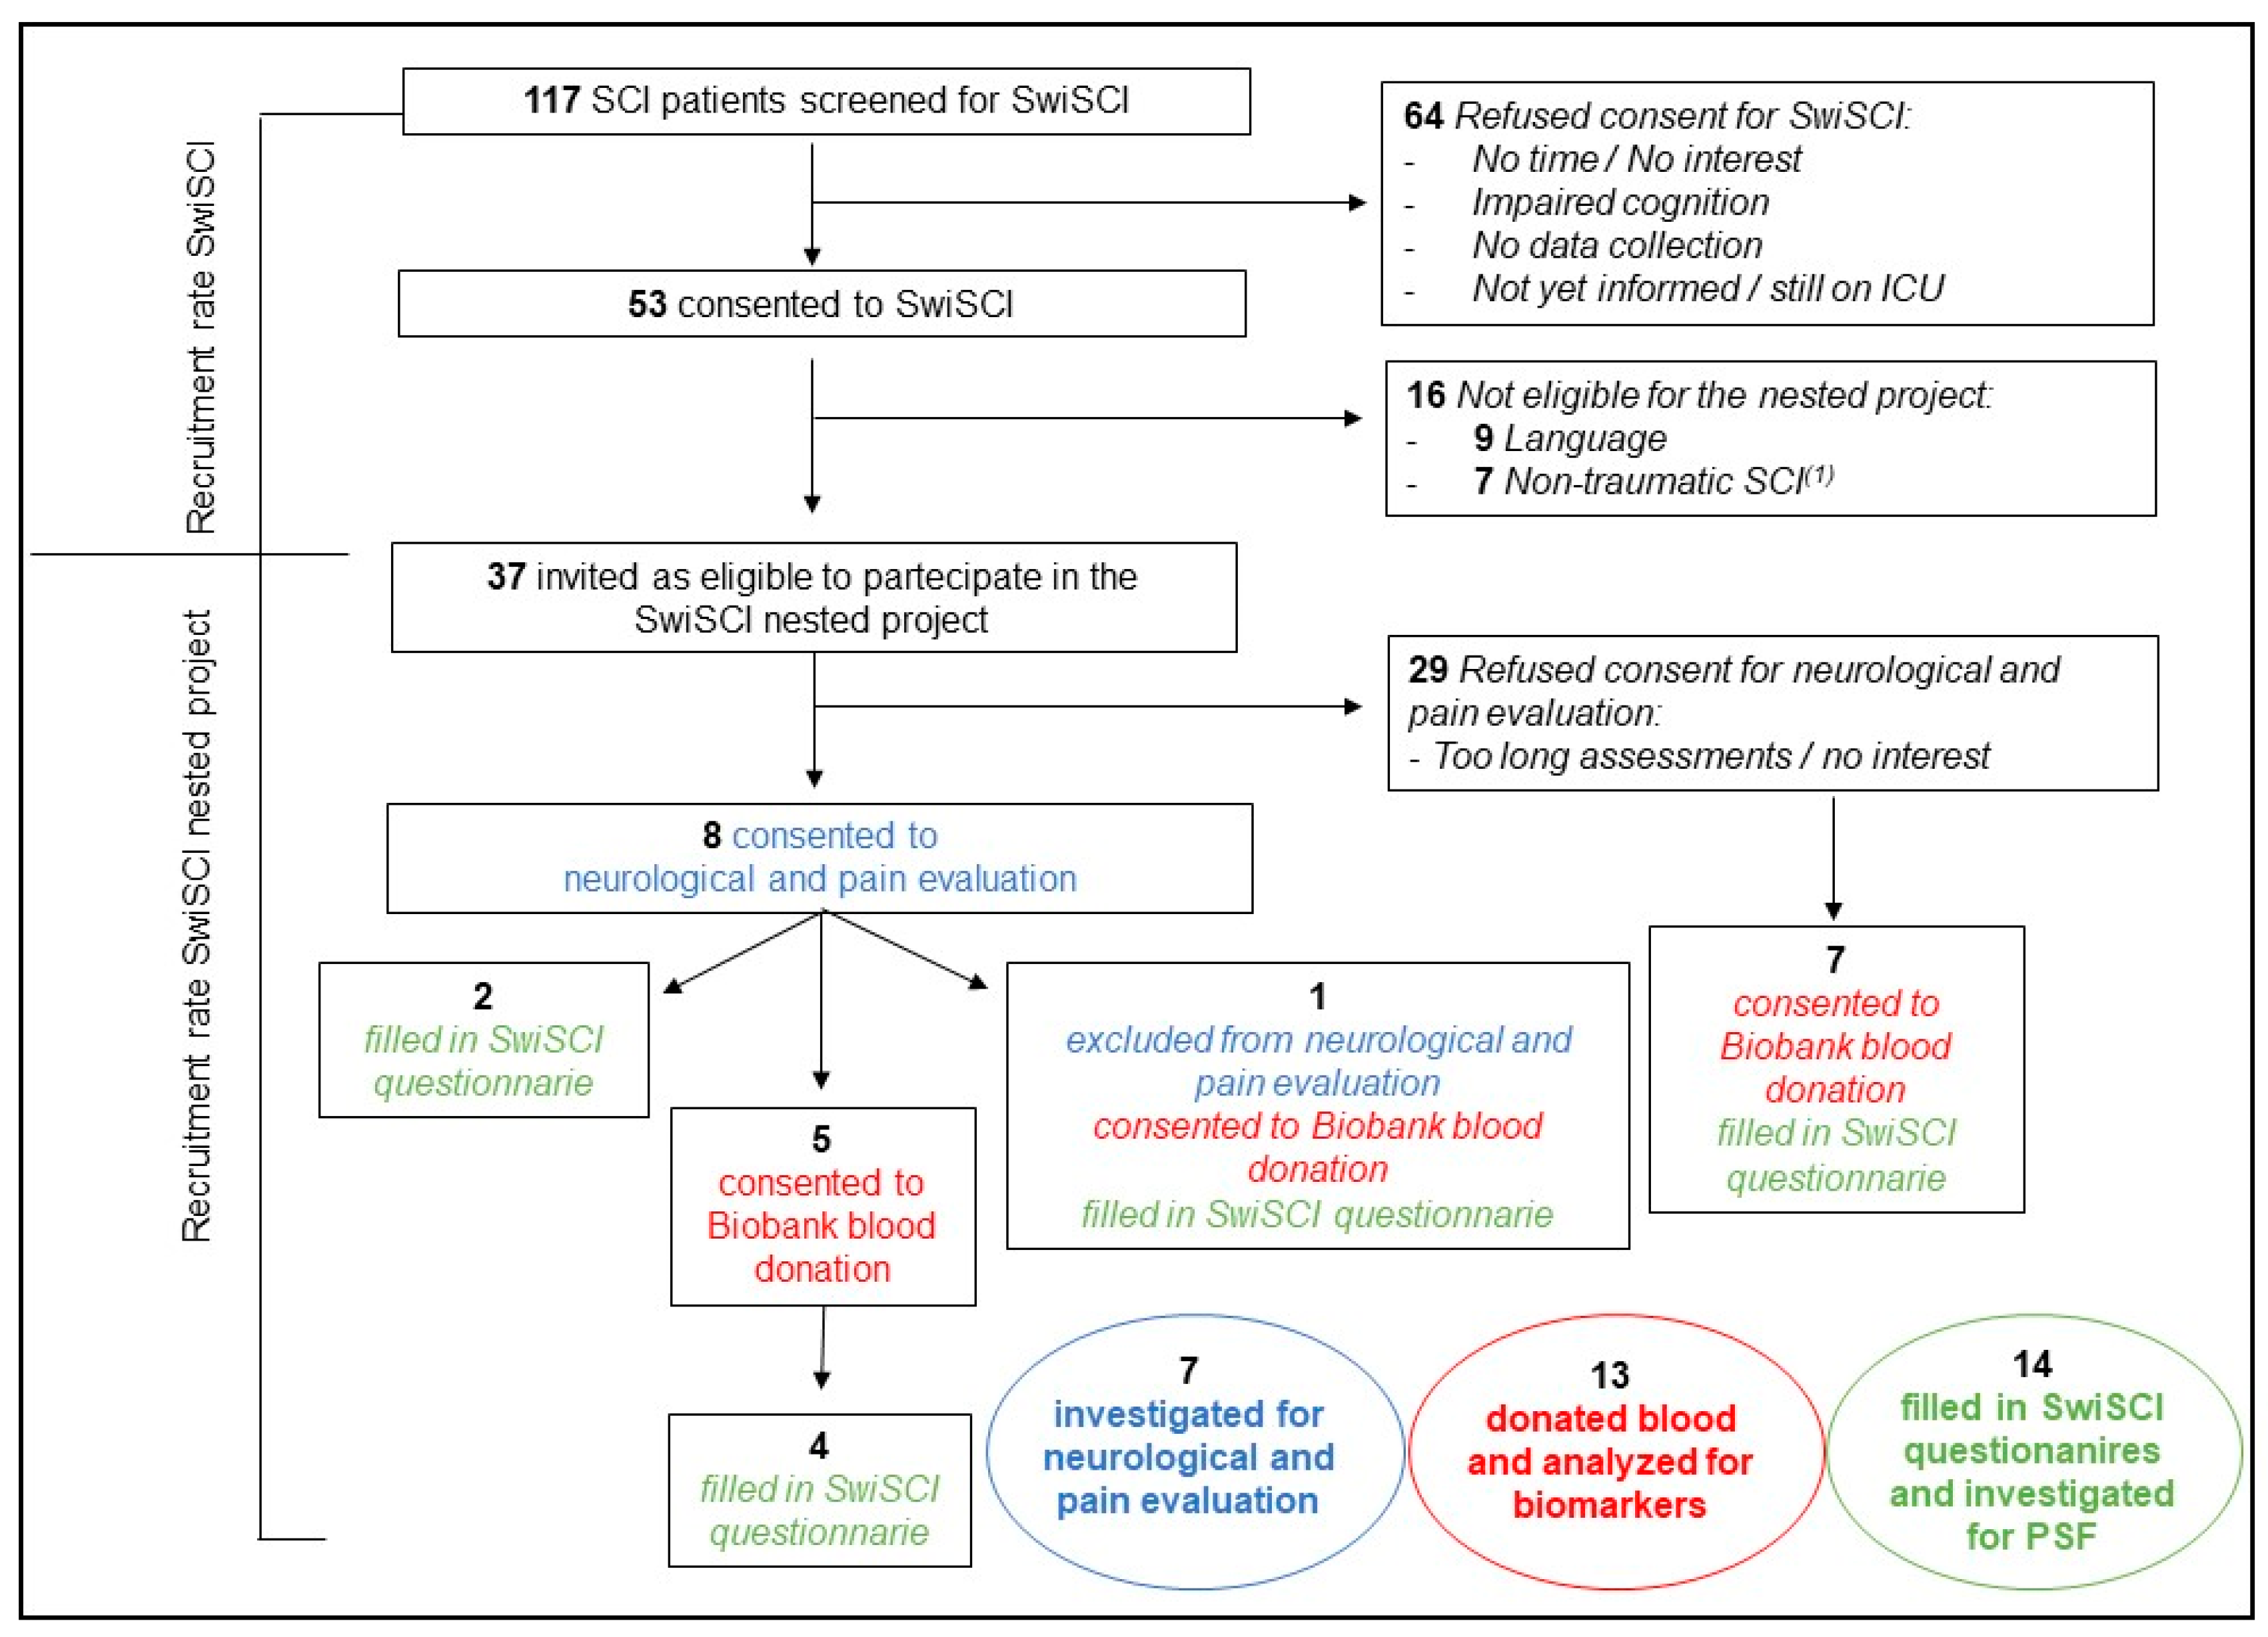
Study Population
2. Results
2.1. Neurological and Pain-Related Assessments
2.2. Psychosocial Factors
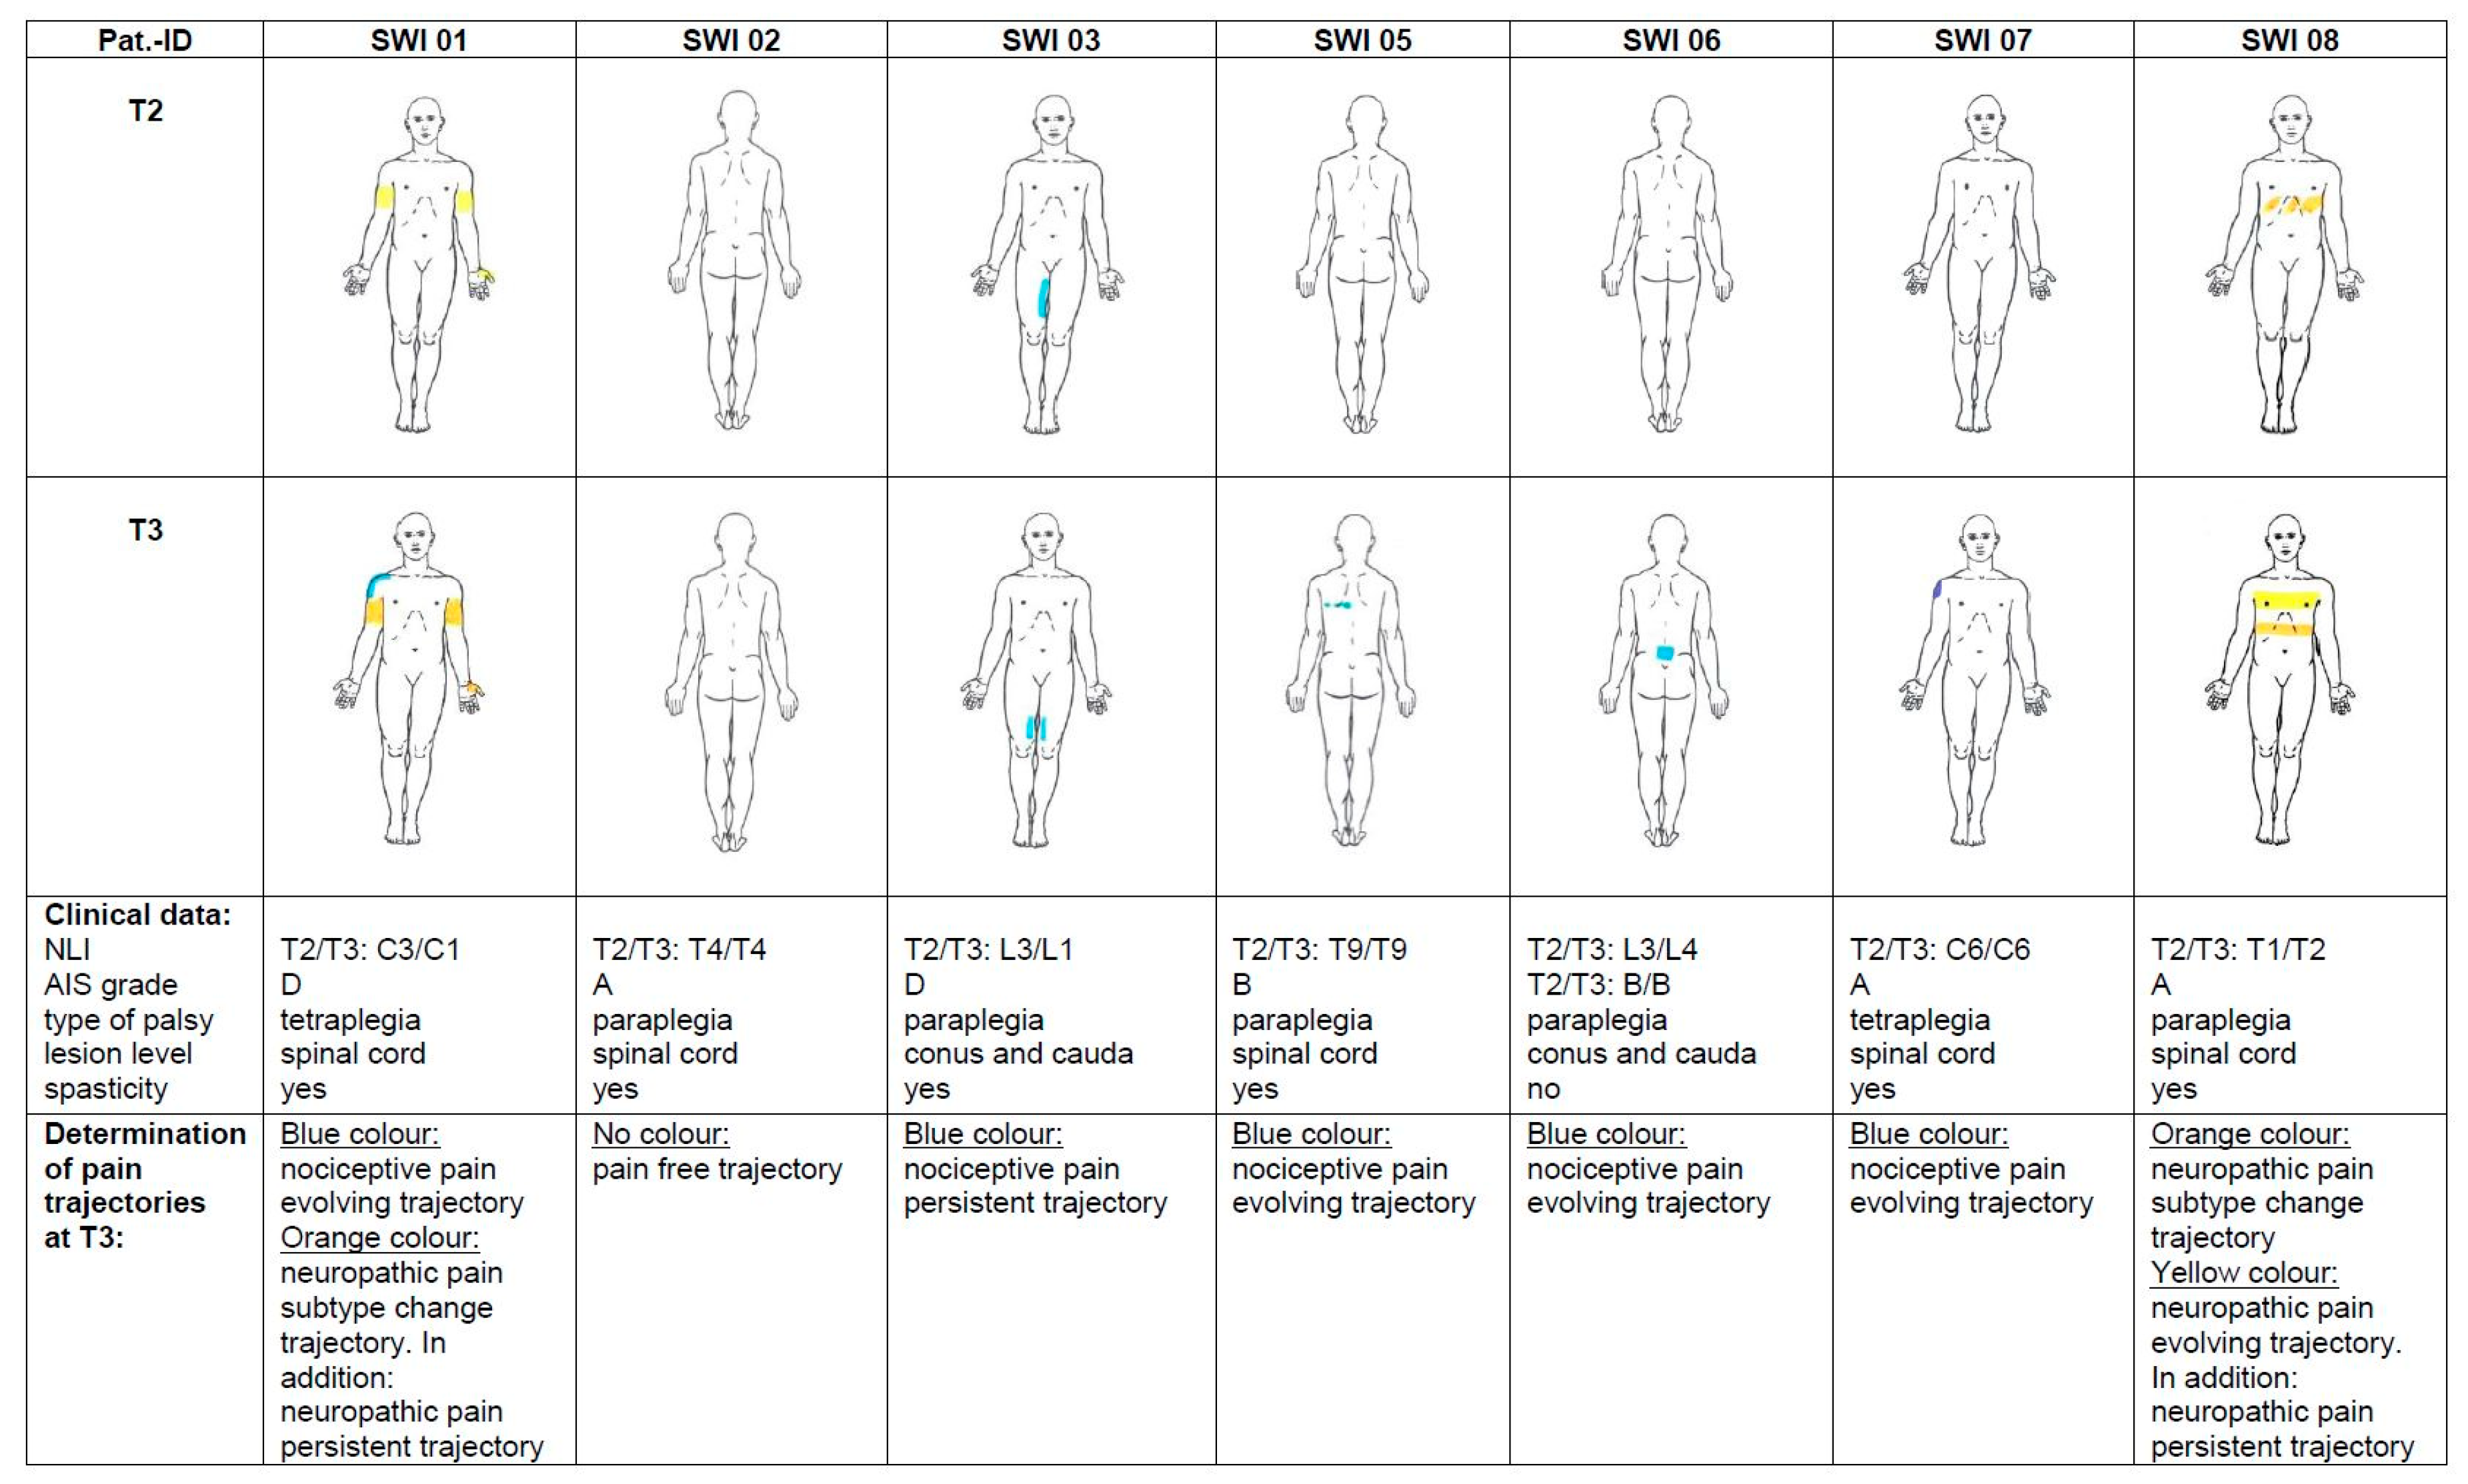
2.3. Pain Trajectories
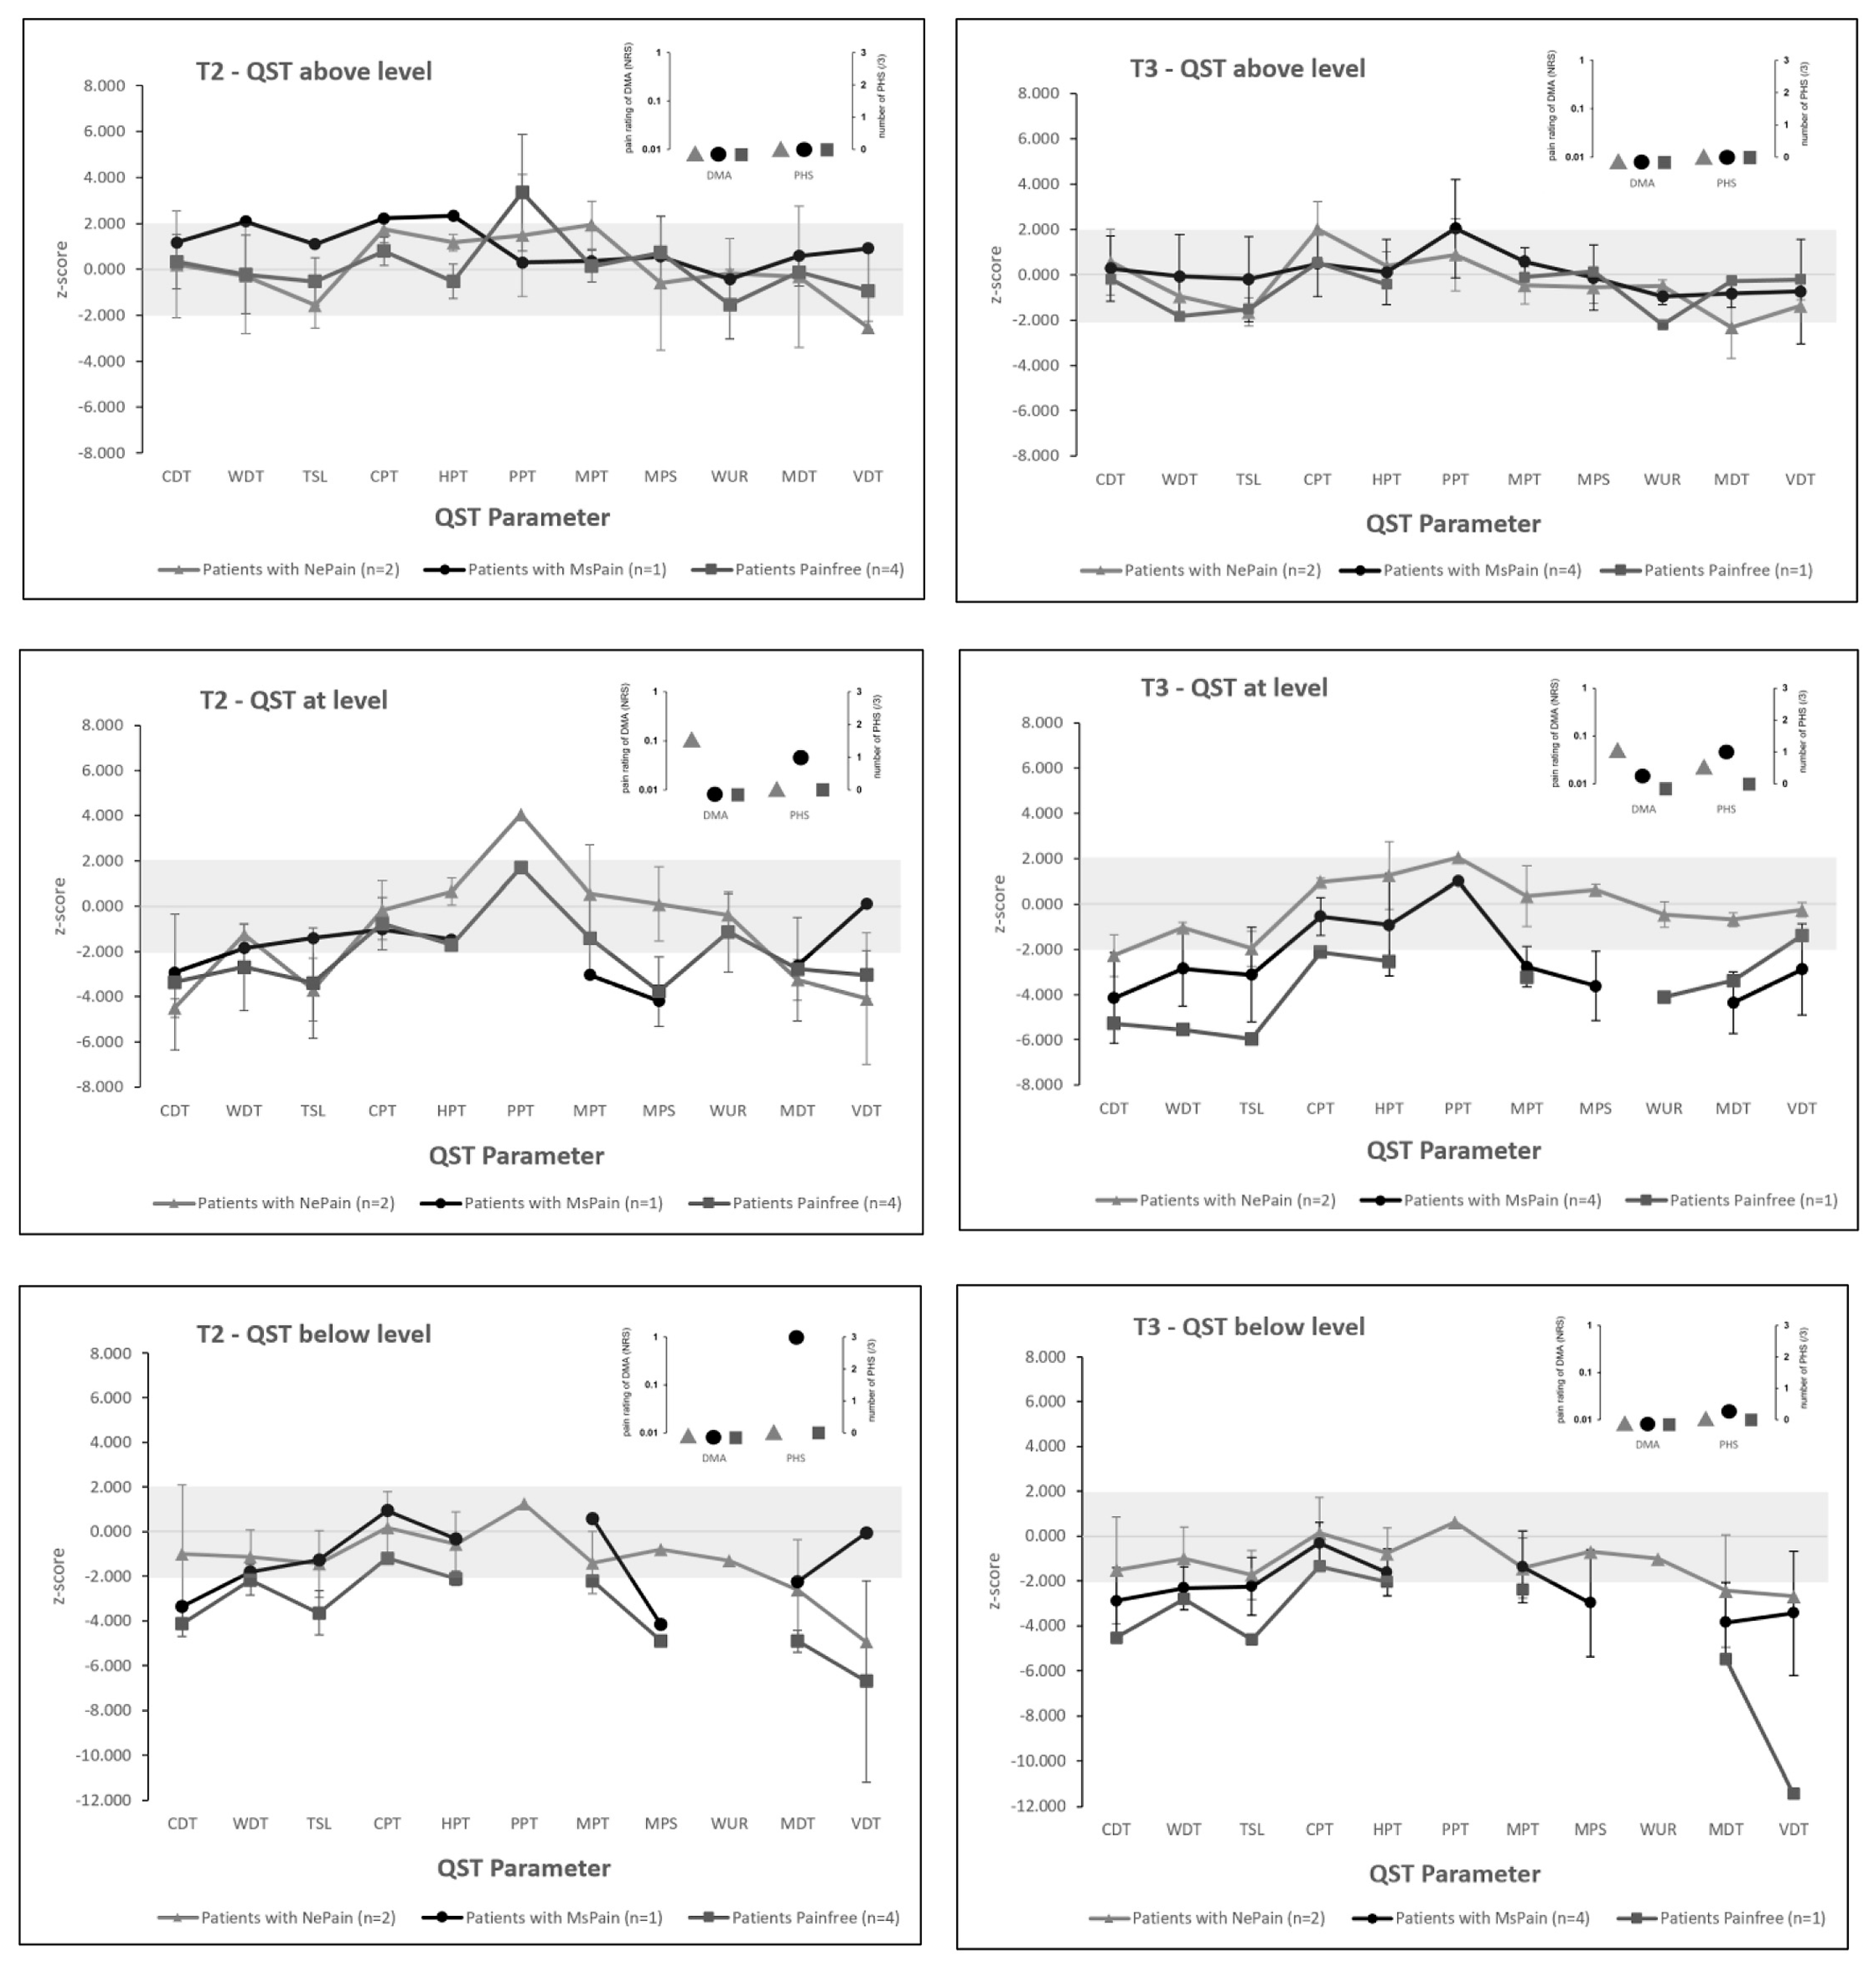
2.4. Quantitative Sensory Testing
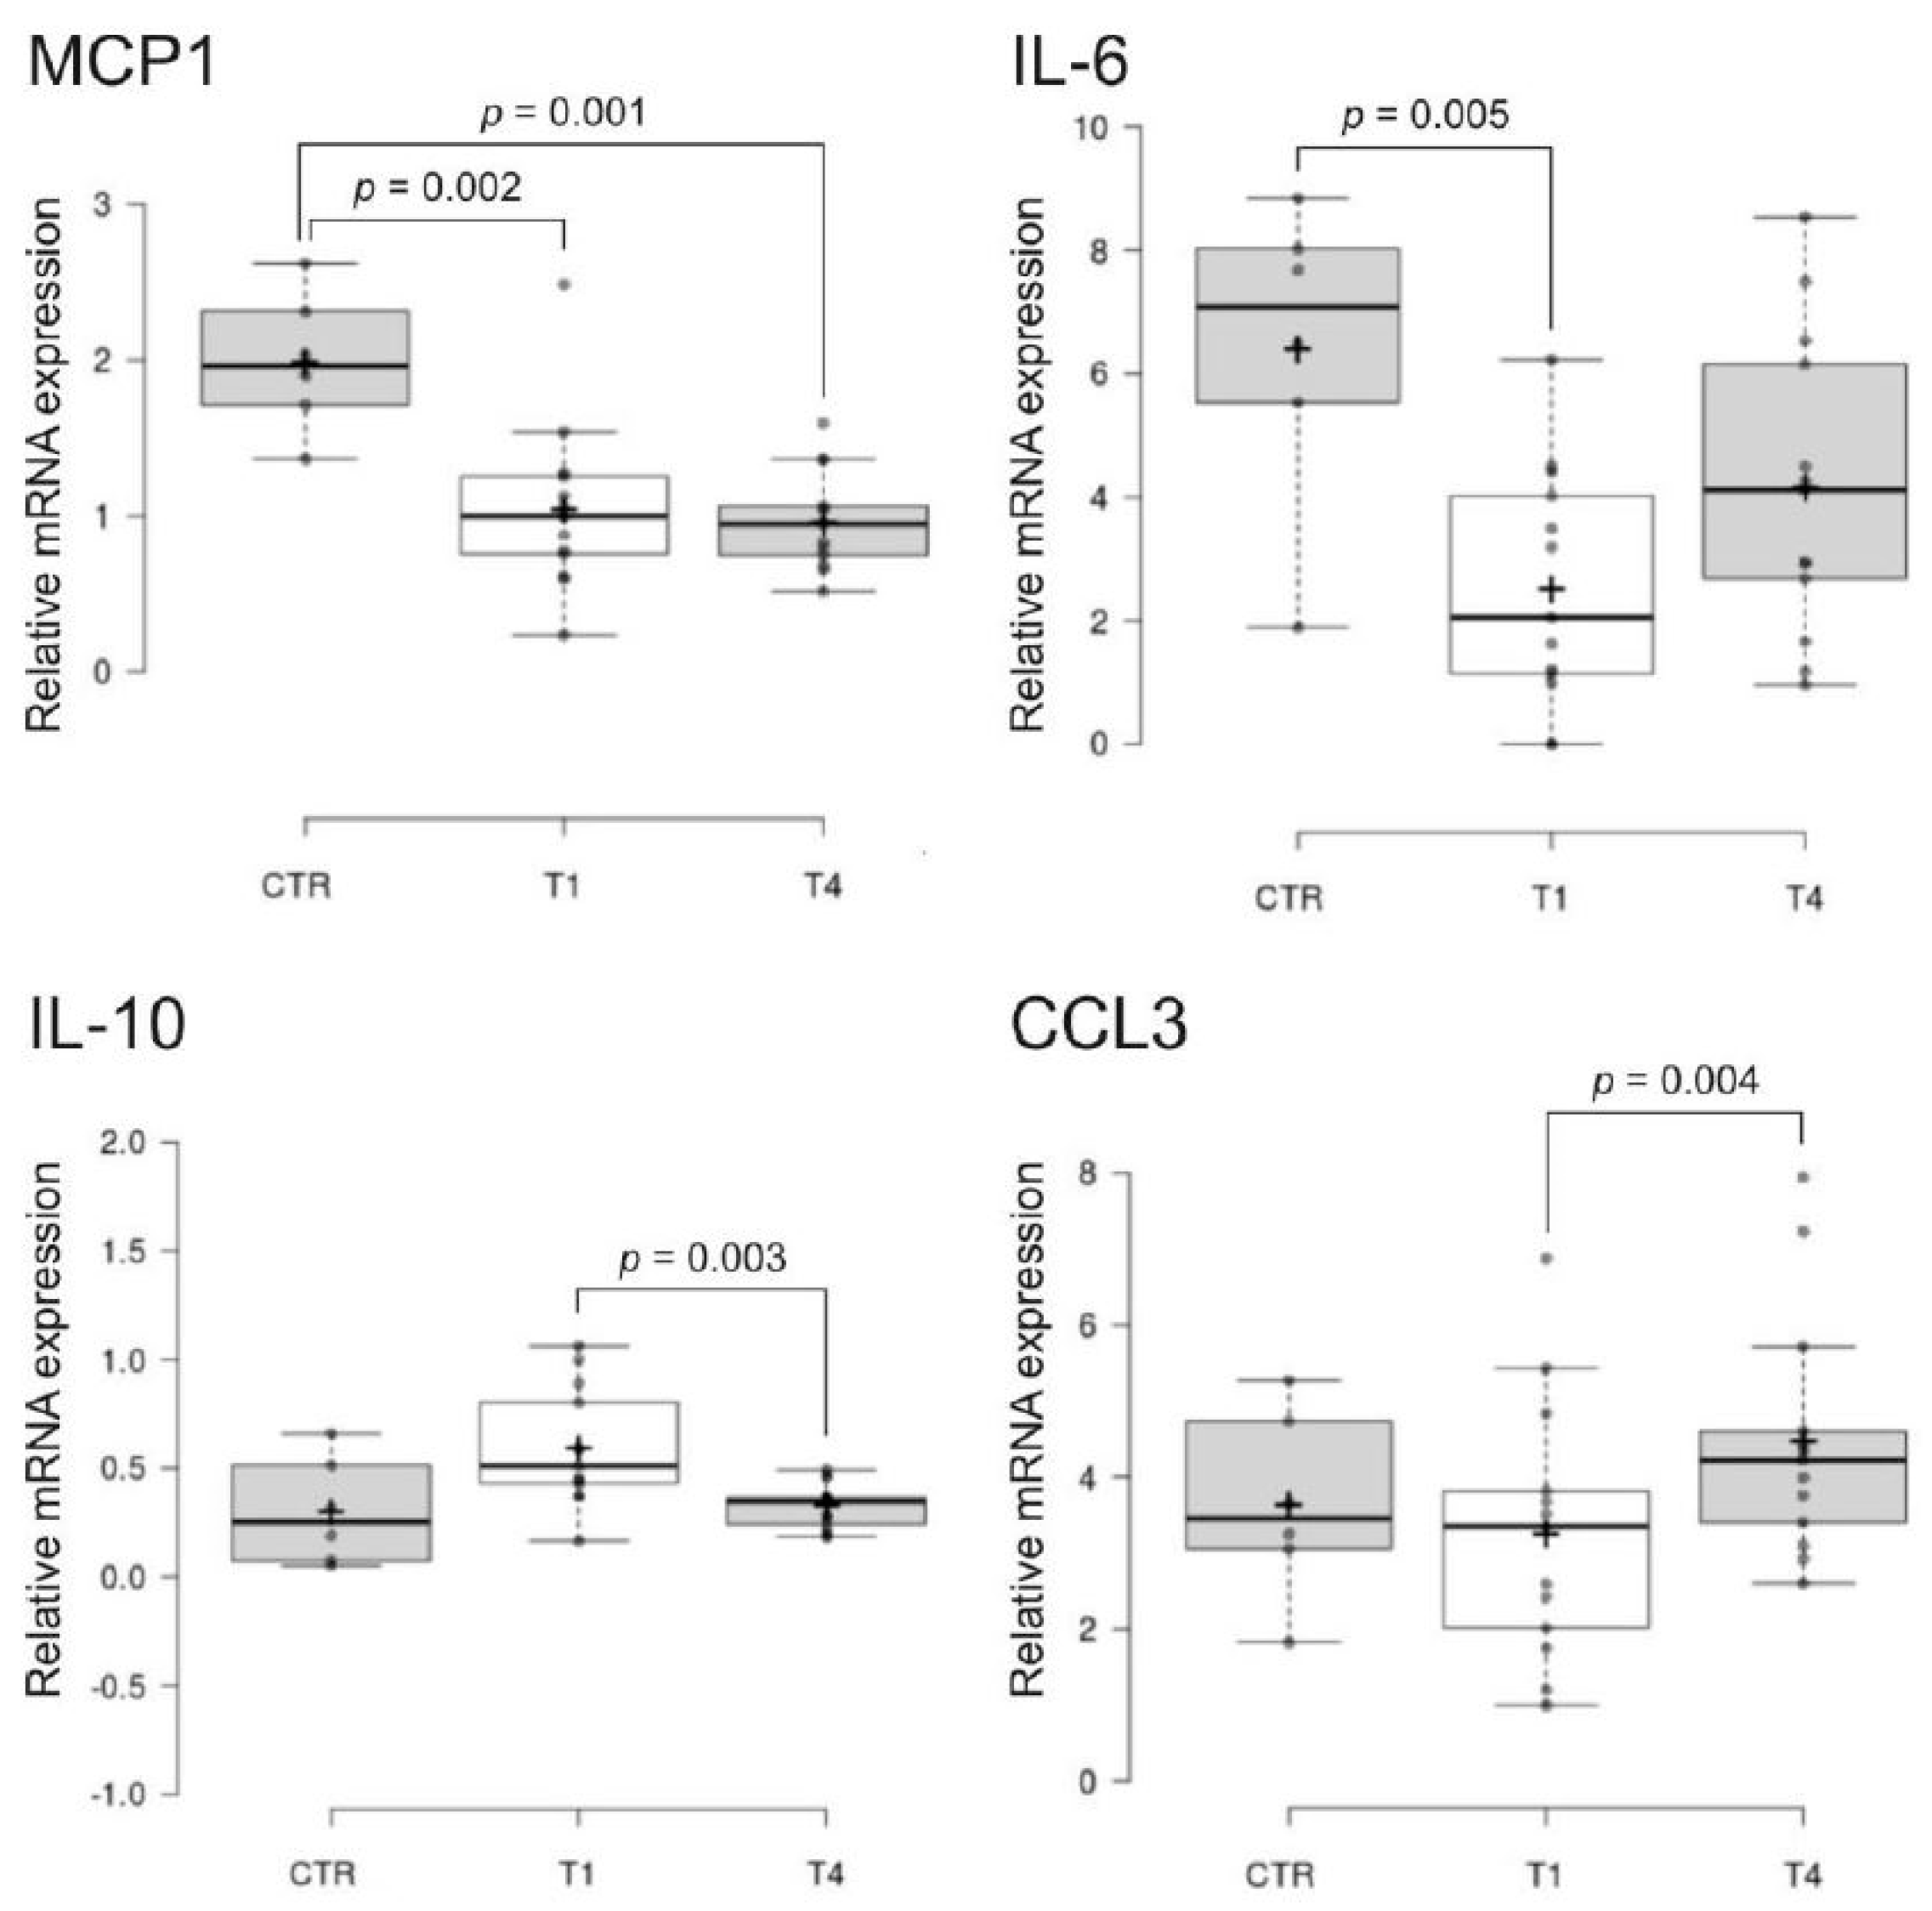
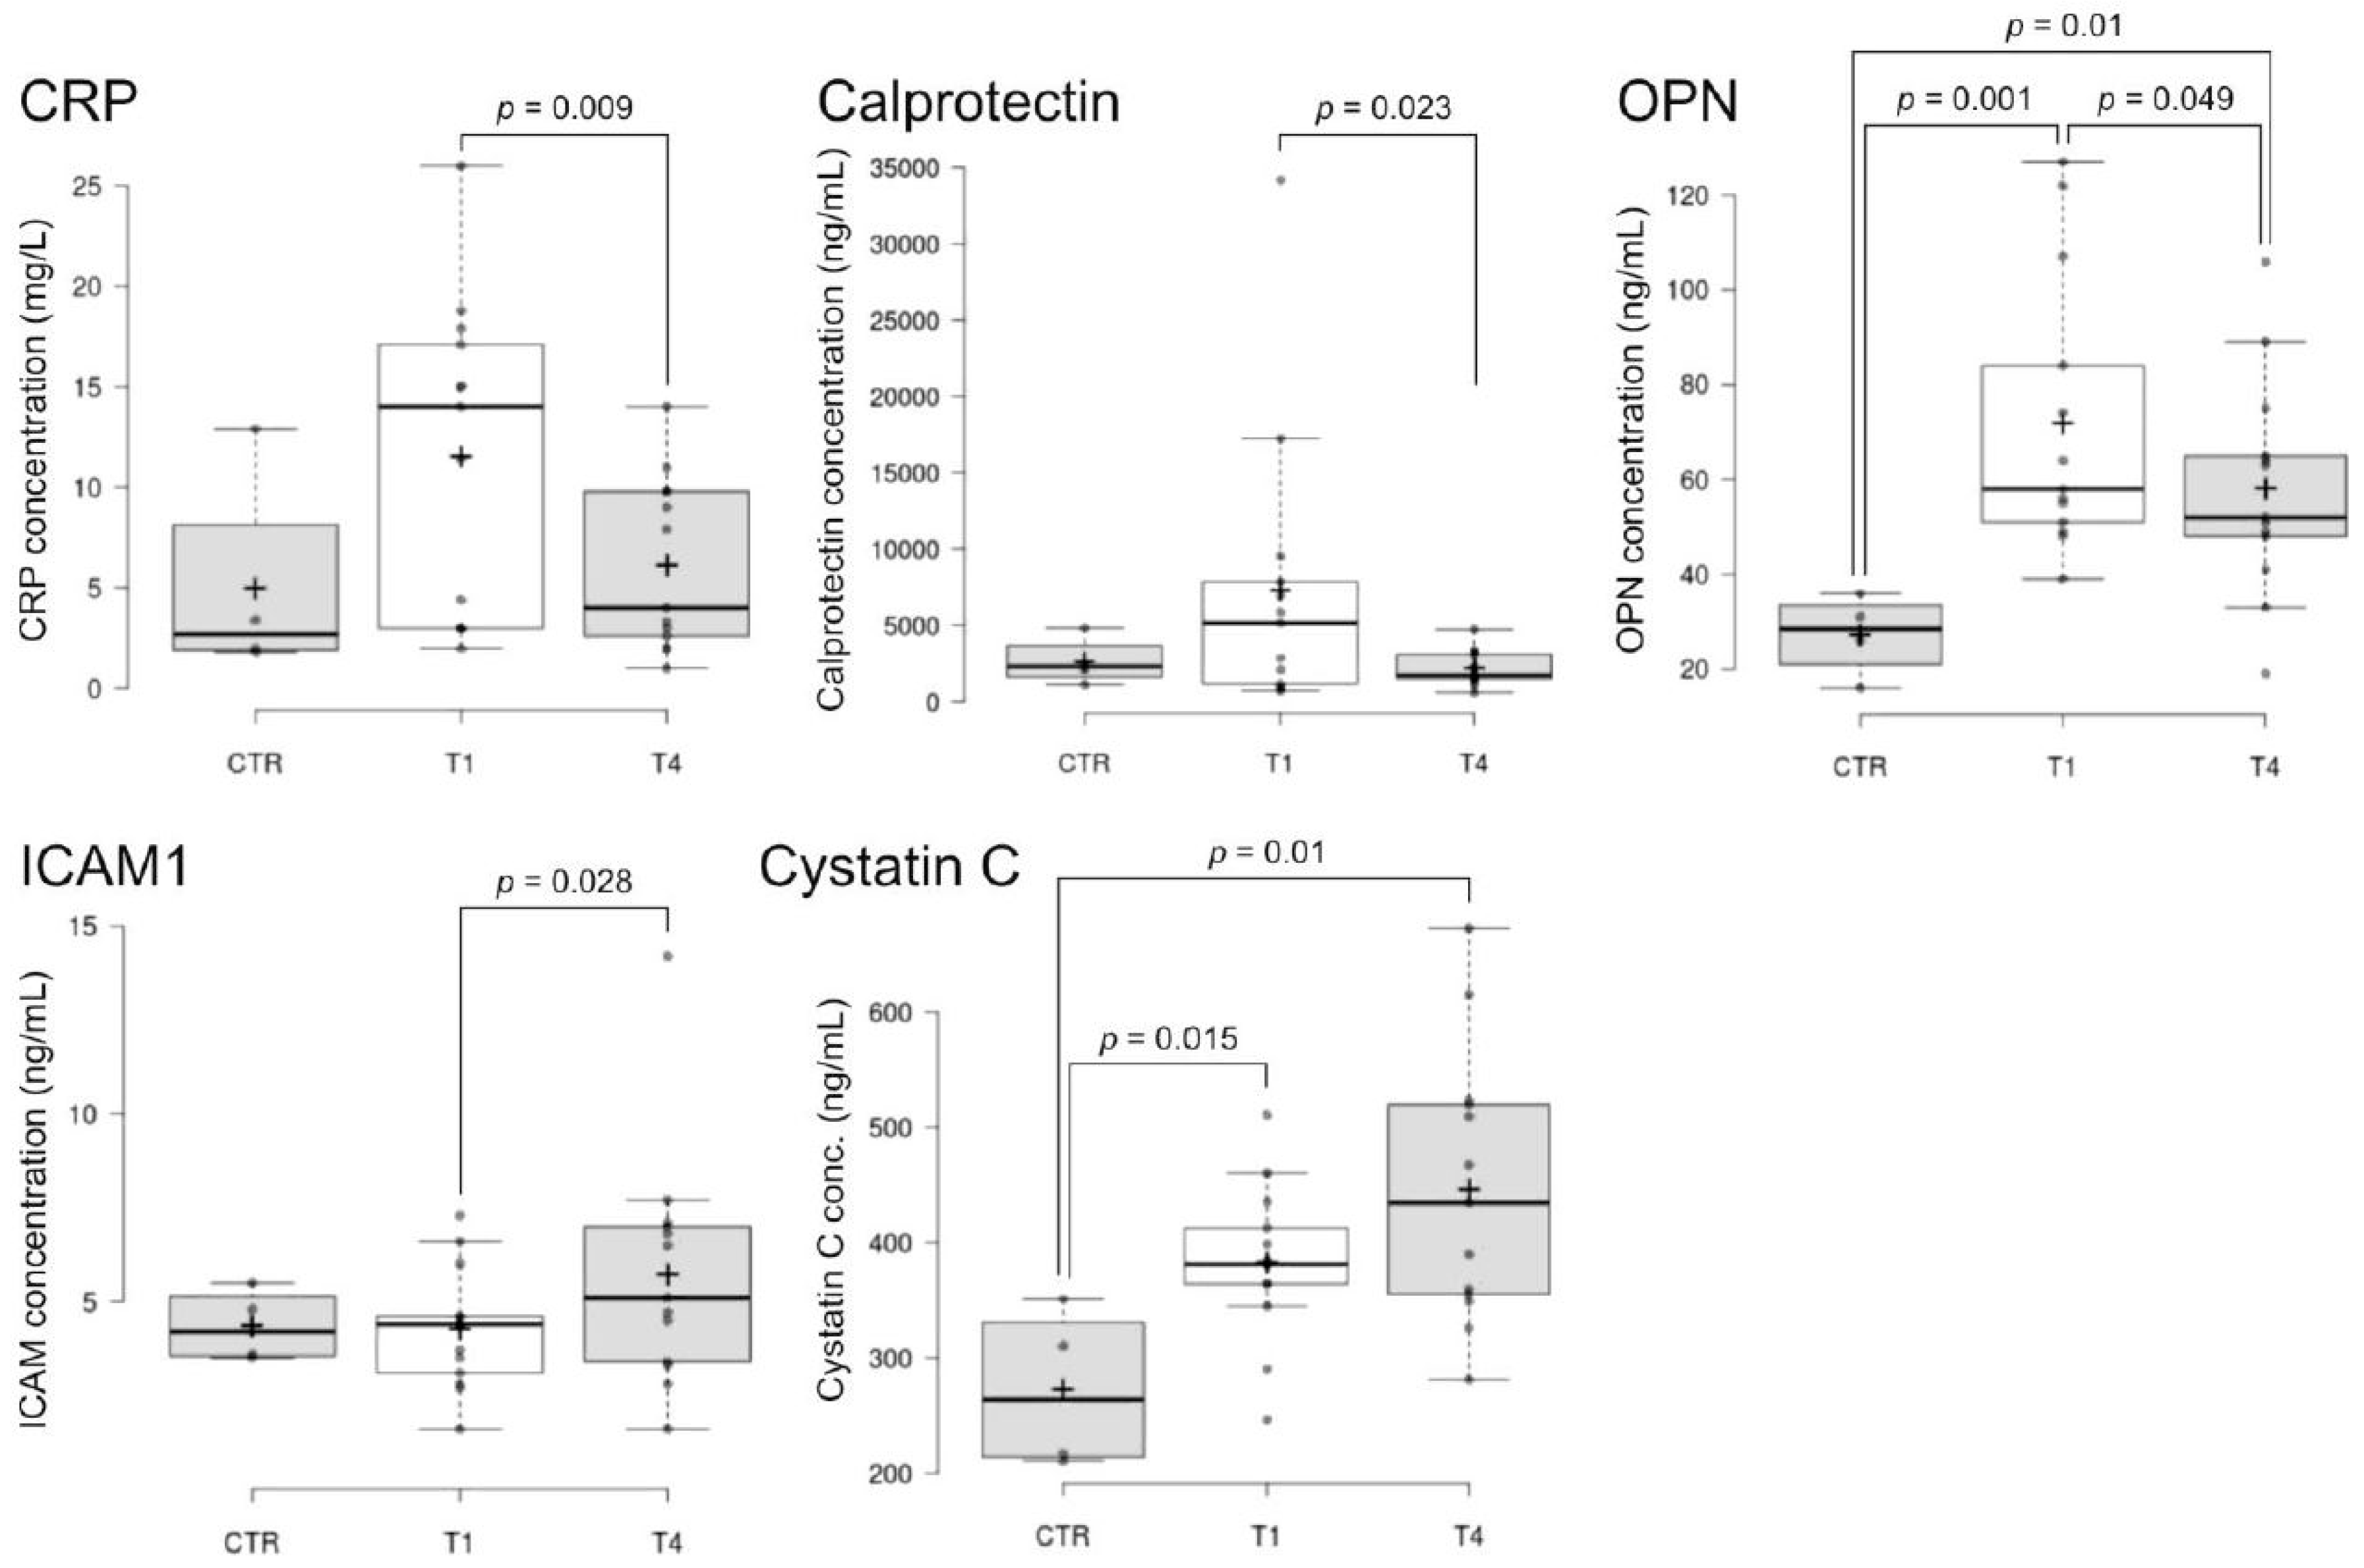
2.5. Blood Biomarkers
2.6. Feasibility Overview and Feedback
3. Discussion
4. Materials and Methods
4.1. Study Design
4.2. Patient Recruitment
4.3. Neurological and Pain-Related Assessments
4.4. Psychosocial Factors
4.5. Quantitative Sensory Testing
4.6. Blood Biomarkers
4.7. Feasibility Feedback
4.8. Statistics
Supplementary Materials
Author Contributions
Funding
Institutional Review Board Statement
Informed Consent Statement
Data Availability Statement
Acknowledgments
Conflicts of Interest
References
- Rubinelli, S.; Glässel, A.; Brach, M. From the person’s perspective: Perceived problems in functioning among individuals with spinal cord injury in Switzerland. J. Rehabil. Med. 2016, 48, 235–243. [Google Scholar] [CrossRef] [PubMed] [Green Version]
- Müller, R.; Brinkhof, M.W.; Arnet, U.; Hinrichs, T.; Landmann, G.; Jordan, X.; Béchir, M. Prevalence and associated factors of pain in the Swiss spinal cord injury population. Spinal Cord 2017, 55, 346–354. [Google Scholar] [CrossRef] [PubMed]
- Siddall, P.J.; McClelland, J.M.; Rutkowski, S.B.; Cousins, M.J. A longitudinal study of the prevalence and characteristics of pain in the first 5 years following spinal cord injury. Pain 2003, 103, 249–257. [Google Scholar] [CrossRef] [PubMed]
- Finnerup, N.B.; Norrbrink, C.; Trok, K.; Piehl, F.; Johannesen, I.L.; Sørensen, J.C.; Jensen, T.S.; Werhagen, L. Phenotypes and predictors of pain following traumatic spinal cord injury: A prospective study. J. Pain Off. J. Am. Pain Soc. 2014, 15, 40–48. [Google Scholar] [CrossRef] [PubMed]
- Finnerup, N.B.; Attal, N.; Haroutounian, S.; McNicol, E.; Baron, R.; Dworkin, R.H.; Gilron, I.; Haanpää, M.; Hansson, P.; Jensen, T.S.; et al. Pharmacotherapy for neuropathic pain in adults: A systematic review and meta-analysis. Lancet Neurol. 2015, 14, 162–173. [Google Scholar] [CrossRef] [PubMed] [Green Version]
- Warner, F.M.; Cragg, J.J.; Jutzeler, C.R.; Finnerup, N.B.; Werhagen, L.; Weidner, N.; Maier, D.; Kalke, Y.B.; Curt, A.; Kramer, J.L.K. Progression of Neuropathic Pain after Acute Spinal Cord Injury: A Meta-Analysis and Framework for Clinical Trials. J. Neurotrauma 2019, 36, 1461–1468. [Google Scholar] [CrossRef]
- Müller, R.; Landmann, G.; Béchir, M.; Hinrichs, T.; Arnet, U.; Jordan, X.; Brinkhof, M.W.G. Chronic pain, depression and quality of life in individuals with spinal cord injury: Mediating role of participation. J. Rehabil. Med. 2017, 49, 489–496. [Google Scholar] [CrossRef] [Green Version]
- Braunwalder, C.; Muller, R.; Glisic, M.; Fekete, C. Are positive psychology interventions efficacious in chronic pain treatment? A systematic review and meta-analysis of randomized controlled trials. Pain Med. 2022, 23, 122–136. [Google Scholar] [CrossRef]
- Muller, R.; Segerer, W.; Ronca, E.; Gemperli, A.; Stirnimann, D.; Scheel-Sailer, A.; Jensen, M.P. Inducing positive emotions to reduce chronic pain: A randomized controlled trial of positive psychology exercises. Disabil. Rehabil. 2020, 44, 2691–2704. [Google Scholar] [CrossRef]
- Braunwalder, C.; Müller, R.; Kunz, S.; Tough, H.; Landmann, G.; Fekete, C. Psychosocial resources and chronic pain in individuals with spinal cord injury: Evidence from the second Swiss national community survey. Spinal Cord 2021, 59, 410–418. [Google Scholar] [CrossRef]
- Braunwalder, C.; Ehrmann, C.; Hodel, J.; Müller, R.; von Matt, D.; Fekete, C. Pain trajectories during initial rehabilitation after spinal cord injury: Do psychosocial resources and mental health predict trajectories? Arch. Phys. Med. Rehabil. 2022, 103, P1294–P1302. [Google Scholar] [CrossRef] [PubMed]
- Backonja, M.M.; Attal, N.; Baron, R.; Bouhassira, D.; Drangholt, M.; Dyck, P.J.; Edwards, R.R.; Freeman, R.; Gracely, R.; Haanpaa, M.H.; et al. Value of quantitative sensory testing in neurological and pain disorders: NeuPSIG consensus. Pain 2013, 154, 1807–1819. [Google Scholar] [CrossRef] [PubMed]
- Zeilig, G.; Enosh, S.; Rubin-Asher, D.; Lehr, B.; Defrin, R. The nature and course of sensory changes following spinal cord injury: Predictive properties and implications on the mechanism of central pain. Brain 2012, 135, 418–430. [Google Scholar] [CrossRef] [PubMed] [Green Version]
- Rolke, R.; Baron, R.; Maier, C.; Tölle, T.R.; Treede, R.D.; Beyer, A.; Binder, A.; Birbaumer, N.; Birklein, F.; Bötefür, I.C.; et al. Quantitative sensory testing in the German Research Network on Neuropathic Pain (DFNS): Standardized protocol and reference values. Pain 2006, 123, 231–243. [Google Scholar] [CrossRef]
- Landmann, G.; Berger, M.F.; Stockinger, L.; Opsommer, E. Usefulness of laser-evoked potentials and quantitative sensory testing in the diagnosis of neuropathic spinal cord injury pain: A multiple case study. Spinal Cord 2017, 55, 575–582. [Google Scholar] [CrossRef] [PubMed] [Green Version]
- Opsommer, E.; Korogod, N.; Stockinger, L.; Landmann, G. Multimodal sensory evaluation of neuropathic spinal cord injury pain: An experimental study. Spinal Cord 2021, 59, 842–854. [Google Scholar] [CrossRef] [PubMed]
- Capossela, S.; Pavlicek, D.; Bertolo, A.; Landmann, G.; Stoyanov, J.V. Unexpectedly decreased plasma cytokines in patients with chronic back pain. J. Pain Res. 2018, 11, 1191–1198. [Google Scholar] [CrossRef] [Green Version]
- Post, M.W.; Brinkhof, M.W.; von Elm, E.; Boldt, C.; Brach, M.; Fekete, C.; Eriks-Hoogland, I.; Curt, A.; Stucki, G.; MSc for the SwiSCI study group. Design of the Swiss Spinal Cord Injury Cohort Study. Am. J. Phys. Med. Rehabil. 2011, 90, S5–S16. [Google Scholar] [CrossRef]
- Bryce, T.N.; Biering-Sørensen, F.; Finnerup, N.B.; Cardenas, D.D.; Defrin, R.; Lundeberg, T.; Norrbrink, C.; Richards, J.S.; Siddall, P.; Stripling, T.; et al. International spinal cord injury pain classification: Part I. Background and description. Spinal Cord 2012, 50, 413–417. [Google Scholar] [CrossRef]
- Pfau, D.B.; Krumova, E.K.; Treede, R.D.; Baron, R.; Toelle, T.; Birklein, F.; Eich, W.; Geber, C.; Gerhardt, A.; Weiss, T.; et al. Quantitative sensory testing in the German Research Network on Neuropathic Pain (DFNS): Reference data for the trunk and application in patients with chronic postherpetic neuralgia. Pain 2014, 155, 1002–1015. [Google Scholar] [CrossRef]
- Vogel, C.; Rukwied, R.; Stockinger, L.; Schley, M.; Schmelz, M.; Schleinzer, W.; Konrad, C. Functional Characterization of At-Level Hypersensitivity in Patients With Spinal Cord Injury. J. Pain Off. J. Am. Pain Soc. 2017, 18, 66–78. [Google Scholar] [CrossRef] [PubMed]
- Wasner, G.; Lee, B.B.; Engel, S.; McLachlan, E. Residual spinothalamic tract pathways predict development of central pain after spinal cord injury. Brain 2008, 131, 2387–2400. [Google Scholar] [CrossRef] [PubMed]
- Finnerup, N.B.; Sørensen, L.; Biering-Sørensen, F.; Johannesen, I.L.; Jensen, T.S. Segmental hypersensitivity and spinothalamic function in spinal cord injury pain. Exp. Neurol. 2007, 207, 139–149. [Google Scholar] [CrossRef] [PubMed]
- Ernst, M.; Ljutow, A.; Stockinger, L.; Stoyanov, J.; Landmann, G. Variability in clinical and neurophysiological evaluation of pain development following acute spinal cord injury: A case report. Spinal Cord Ser. Cases 2021, 7, 72. [Google Scholar] [CrossRef]
- Eriks-Hoogland, I.E.; Hoekstra, T.; de Groot, S.; Stucki, G.; Post, M.W.; van der Woude, L.H. Trajectories of musculoskeletal shoulder pain after spinal cord injury: Identification and predictors. J. Spinal Cord Med. 2014, 37, 288–298. [Google Scholar] [CrossRef] [PubMed] [Green Version]
- Fekete, C.; Gurtner, B.; Kunz, S.; Gemperli, A.; Gmunder, H.P.; Hund-Georgiadis, M.; Jordan, X.; Schubert, M.; Stoyanov, J.; Stucki, G. Inception cohort of the Swiss Spinal Cord Injury Cohort Study (SwiSCI): Design, participant characteristics, response rates and non-response. J. Rehabil. Med. 2021, 53, jrm00159. [Google Scholar] [CrossRef]
- Eijkelkamp, N.; Steen-Louws, C.; Hartgring, S.A.; Willemen, H.L.; Prado, J.; Lafeber, F.P.; Heijnen, C.J.; Hack, C.E.; van Roon, J.A.; Kavelaars, A. IL4-10 Fusion Protein Is a Novel Drug to Treat Persistent Inflammatory Pain. J. Neurosci. 2016, 36, 7353–7363. [Google Scholar] [CrossRef] [Green Version]
- Zhang, G.; Yang, P. Bioinformatics Genes and Pathway Analysis for Chronic Neuropathic Pain after Spinal Cord Injury. Biomed. Res. Int. 2017, 2017, 6423021. [Google Scholar] [CrossRef] [Green Version]
- Koch, A.; Zacharowski, K.; Boehm, O.; Stevens, M.; Lipfert, P.; von Giesen, H.J.; Wolf, A.; Freynhagen, R. Nitric oxide and pro-inflammatory cytokines correlate with pain intensity in chronic pain patients. Inflamm. Res. 2007, 56, 32–37. [Google Scholar] [CrossRef]
- Goldstein, R.L.; Walia, P.; Teylan, M.; Lazzari, A.A.; Tun, C.G.; Hart, J.E.; Garshick, E. Clinical factors associated with C-reactive protein in chronic spinal cord injury. Spinal Cord 2017, 55, 1088–1095. [Google Scholar] [CrossRef] [Green Version]
- Azramezani Kopi, T.; Shahrokh, S.; Mirzaei, S.; Asadzadeh Aghdaei, H.; Amini Kadijani, A. The role of serum calprotectin as a novel biomarker in inflammatory bowel diseases: A review study. Gastroenterol. Hepatol. Bed Bench 2019, 12, 183–189. [Google Scholar] [PubMed]
- Zhang, J.; Ding, R.; Xian, Q.; Wang, Z.; Liu, Z.; Yang, J.; Chen, J. Serum cystatin C is increased in acute spinal cord injury: A multicentre retrospective study. Spinal Cord 2020, 58, 341–347. [Google Scholar] [CrossRef] [PubMed]
- Hashimoto, M.; Koda, M.; Ino, H.; Murakami, M.; Yamazaki, M.; Moriya, H. Upregulation of osteopontin expression in rat spinal cord microglia after traumatic injury. J. Neurotrauma 2003, 20, 287–296. [Google Scholar] [CrossRef] [PubMed] [Green Version]
- Segal, J.L.; Gonzales, E.; Yousefi, S.; Jamshidipour, L.; Brunnemann, S.R. Circulating levels of IL-2R, ICAM-1, and IL-6 in spinal cord injuries. Arch. Phys. Med. Rehabil. 1997, 78, 44–47. [Google Scholar] [CrossRef] [PubMed]
- Franz, S.; Schuld, C.; Wilder-Smith, E.P.; Heutehaus, L.; Lang, S.; Gantz, S.; Schuh-Hofer, S.; Treede, R.D.; Bryce, T.N.; Wang, H.; et al. Spinal Cord Injury Pain Instrument and painDETECT questionnaire: Convergent construct validity in individuals with Spinal Cord Injury. Eur. J. Pain. 2017, 21, 1642–1656. [Google Scholar] [CrossRef]
- Bryce, T.N.; Richards, J.S.; Bombardier, C.H.; Dijkers, M.P.; Fann, J.R.; Brooks, L.; Chiodo, A.; Tate, D.G.; Forchheimer, M. Screening for neuropathic pain after spinal cord injury with the spinal cord injury pain instrument (SCIPI): A preliminary validation study. Spinal Cord 2014, 52, 407–412. [Google Scholar] [CrossRef]
- Kirshblum, S.C.; Burns, S.P.; Biering-Sorensen, F.; Donovan, W.; Graves, D.E.; Jha, A.; Johansen, M.; Jones, L.; Krassioukov, A.; Mulcahey, M.J.; et al. International standards for neurological classification of spinal cord injury (revised 2011). J. Spinal Cord Med. 2011, 34, 535–546. [Google Scholar] [CrossRef] [Green Version]
- Widerström-Noga, E.; Biering-Sørensen, F.; Bryce, T.N.; Cardenas, D.D.; Finnerup, N.B.; Jensen, M.P.; Richards, J.S.; Siddall, P.J. The International Spinal Cord Injury Pain Basic Data Set (version 2.0). Spinal Cord 2014, 52, 282–286. [Google Scholar] [CrossRef] [Green Version]
- Roth, A.J.; Kornblith, A.B.; Batel-Copel, L.; Peabody, E.; Scher, H.I.; Holland, J.C. Rapid screening for psychologic distress in men with prostate carcinoma: A pilot study. Cancer 1998, 82, 1904–1908. [Google Scholar] [CrossRef]
- Zigmond, A.S.; Snaith, R.P. The hospital anxiety and depression scale. Acta Psychiatr. Scand. 1983, 67, 361–370. [Google Scholar] [CrossRef] [Green Version]
- Sakakibara, B.M.; Miller, W.C.; Orenczuk, S.G.; Wolfe, D.L. A systematic review of depression and anxiety measures used with individuals with spinal cord injury. Spinal Cord 2009, 47, 841–851. [Google Scholar] [CrossRef] [PubMed] [Green Version]
- Charlifue, S.; Post, M.W.; Biering-Sorensen, F.; Catz, A.; Dijkers, M.; Geyh, S.; Horsewell, J.; Noonan, V.; Noreau, L.; Tate, D.; et al. International Spinal Cord Injury Quality of Life Basic Data Set. Spinal Cord 2012, 50, 672–675. [Google Scholar] [CrossRef] [PubMed] [Green Version]


| Questionnaire | T1 | T2 | T3 | T4 | |
|---|---|---|---|---|---|
| Pain interference questionnaire (0–10) | N = 2 | N = 3 | N = 5 | ||
| Daily activities | 3.5 ± 0.5 (2.8–4.2) | 4.0 ± 1.6 (2.2–5.8) | 2.4 ± 2.6 (0.1–4.7) | =T3 2 | |
| Mood | 1.0 ± 1.0 (0–2.4) | 3.0 ± 3.6 (0–7) | 2.8 ± 2.4 (0.7–4.9) | =T3 2 | |
| Sleep | 0.0 ± 0.0 (0–0) | 3.0 ± 1.6 (1.2–4.8) | 1.4 ± 1.5 (0.1–2.7) | =T3 2 | |
| SCIPI (0–7) | |||||
| Neuropathic pain sites | 3.0 ± 0.0 (3–3) N = 1 | 4.0 ± 0.0 (4.0–4.0) N = 3 | 4.5 ± 0.5 (1.2–3.8) N = 2 1 | =T3 2 | |
| Nociceptive pain sites | 0.3 ± 0.5 (0–0.9) N = 3 | 2.0 ± 0.0 (2.0–2.0) N = 1 | 2.5 ± 1.6 (3.8–5.2) N = 6 | =T3 2 | |
| Distress thermometer (0–10) | N = 10 | N = 12 | N = 2 | N = 12 | |
| 6.3 ± 2.7 (4.6–8.0) | 6.2 ± 2.1 (5.0–7.4) | 5.0 ± 2.8 (1.1–8.9) | 4.8 ± 2.8 (3.3–6.4) | ||
| HADS (0–21) | N = 13 | NA | N = 2 | N = 12 | |
| Depression | 6.5 ± 4.2 (4.2–8.8) | NA | 5.0 ± 1.4 (3.0–7.0) | 6.0 ± 3.5 (4.0–8.0) | |
| Anxiety | 5.8 ± 2.2 (4.6–7.0) | NA | 5.0 ± 2.8 (1.1–8.9) | 6.8 ± 3.2 (5.0–8.7) | |
| International SCI QoL Basic Data Set (0–10) | N = 13 | N = 11 | N = 2 | N = 12 | |
| Satisfaction with | General quality of life | 6.1 ± 3.1 (4.4–7.7) | 6.0 ± 2.8 (4.4–7.6) | 6.5 ± 3.5 (1.6–11.4) | 6.3 ± 1.9 (5.3–7.4) |
| Satisfaction with | Physical health | 5.6 ± 3.1 (3.9–7.3) | 5.6 ± 2.8 (4.0–7.3) | 4.5 ± 3.5 (0–9.4) | 5.0 ± 2.1 (3.8–6.2) |
| Satisfaction with | Psychological health | 6.2 ± 2.8 (4.7–7.8) | 5.0 ± 2.9 (3.3–6.7) | 5.5 ± 2.1 (2.6–8.4) | 6.2 ± 2.4 (4.8–7.5) |
Disclaimer/Publisher’s Note: The statements, opinions and data contained in all publications are solely those of the individual author(s) and contributor(s) and not of MDPI and/or the editor(s). MDPI and/or the editor(s) disclaim responsibility for any injury to people or property resulting from any ideas, methods, instructions or products referred to in the content. |
© 2023 by the authors. Licensee MDPI, Basel, Switzerland. This article is an open access article distributed under the terms and conditions of the Creative Commons Attribution (CC BY) license (https://creativecommons.org/licenses/by/4.0/).
Share and Cite
Capossela, S.; Landmann, G.; Ernst, M.; Stockinger, L.; Stoyanov, J. Assessing the Feasibility of a Multimodal Approach to Pain Evaluation in Early Stages after Spinal Cord Injury. Int. J. Mol. Sci. 2023, 24, 11122. https://doi.org/10.3390/ijms241311122
Capossela S, Landmann G, Ernst M, Stockinger L, Stoyanov J. Assessing the Feasibility of a Multimodal Approach to Pain Evaluation in Early Stages after Spinal Cord Injury. International Journal of Molecular Sciences. 2023; 24(13):11122. https://doi.org/10.3390/ijms241311122
Chicago/Turabian StyleCapossela, Simona, Gunther Landmann, Mario Ernst, Lenka Stockinger, and Jivko Stoyanov. 2023. "Assessing the Feasibility of a Multimodal Approach to Pain Evaluation in Early Stages after Spinal Cord Injury" International Journal of Molecular Sciences 24, no. 13: 11122. https://doi.org/10.3390/ijms241311122