
New Dinuclear Macrocyclic Copper(II) Complexes as Potentially Fluorescent and Magnetic Materials

 , , , , , and
Abstract
:1. Introduction
2. Results and Discussion
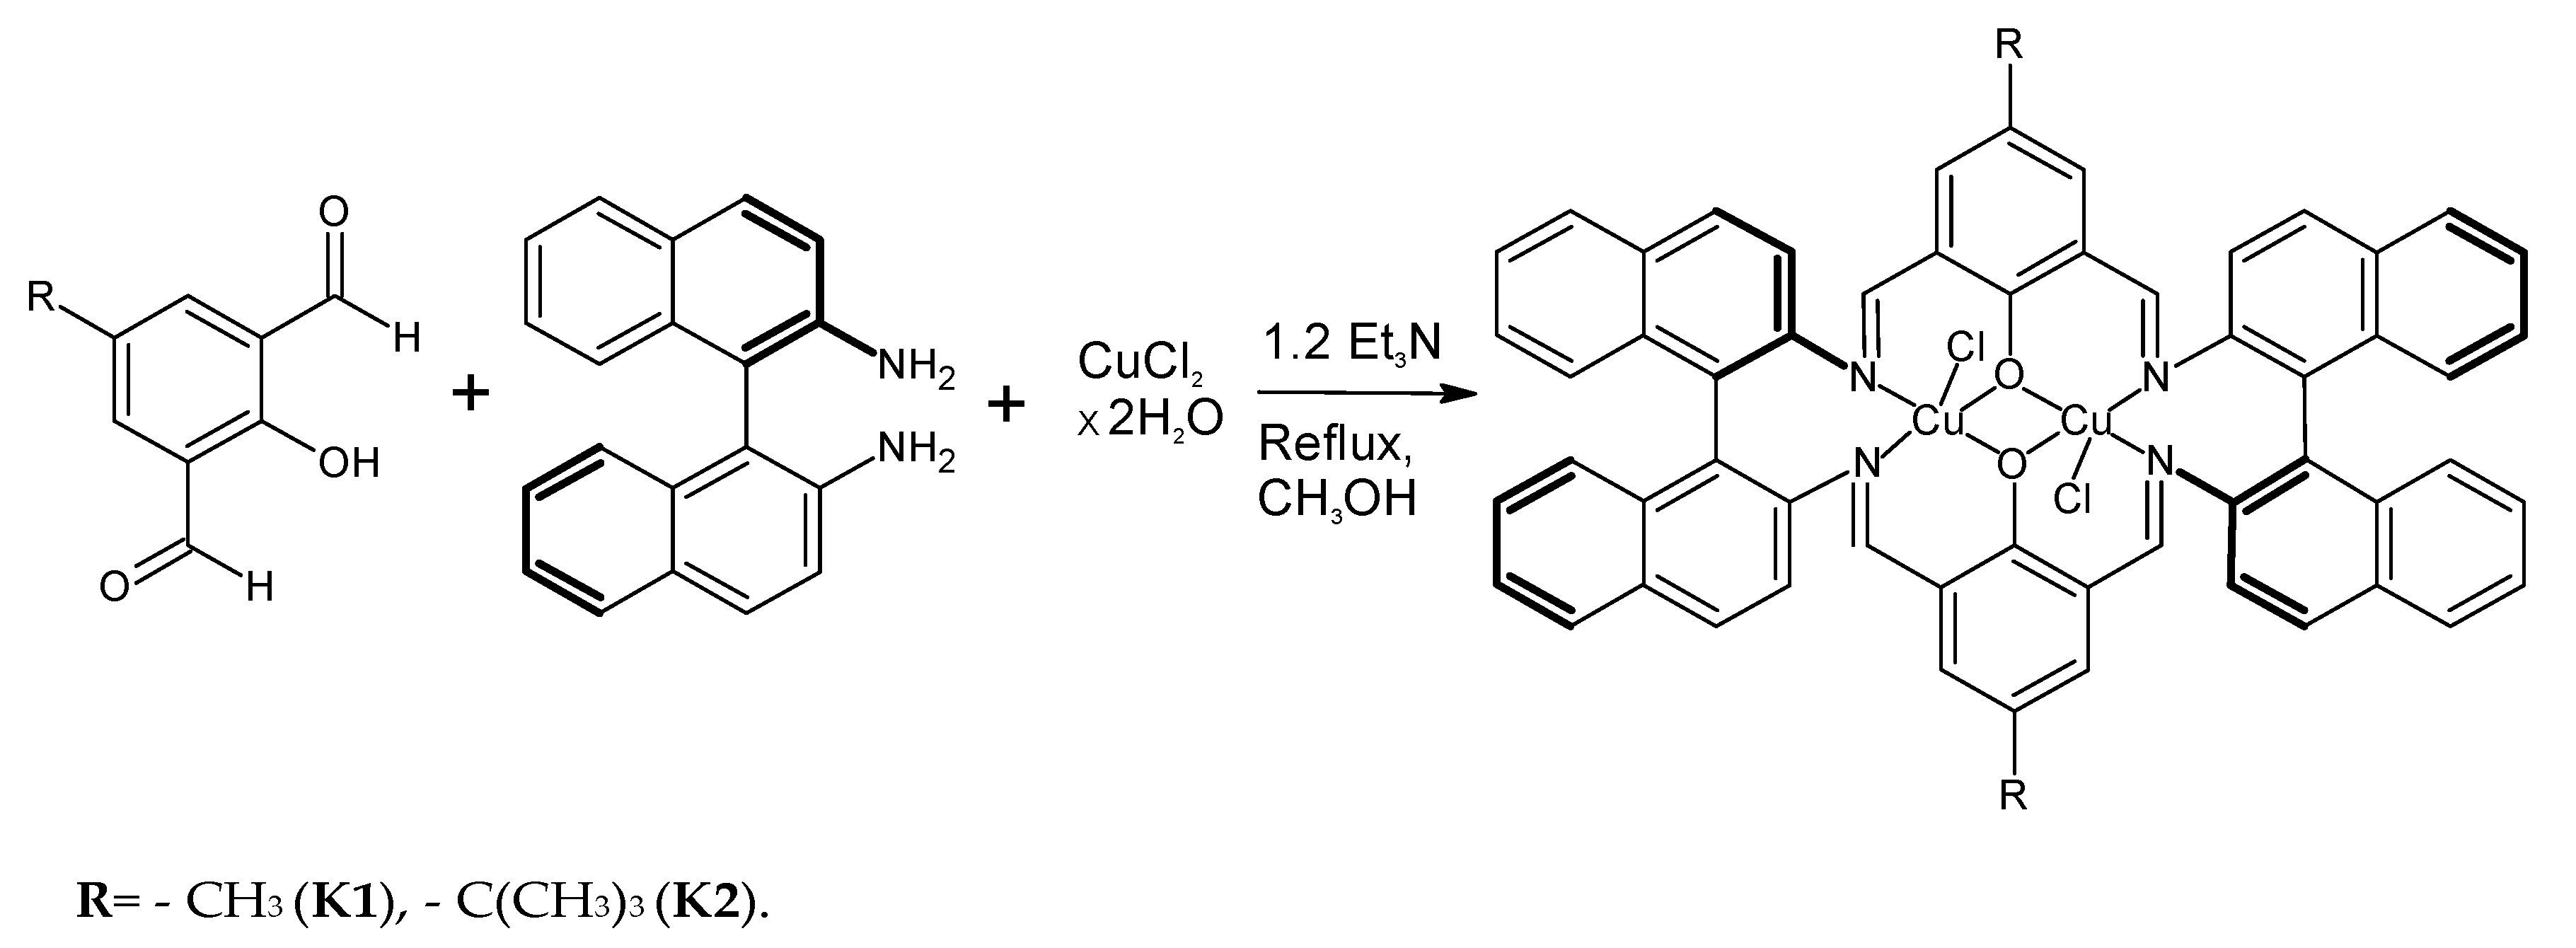
2.1. Dinuclear Copper(II) Complexes: Synthesis and Characterization
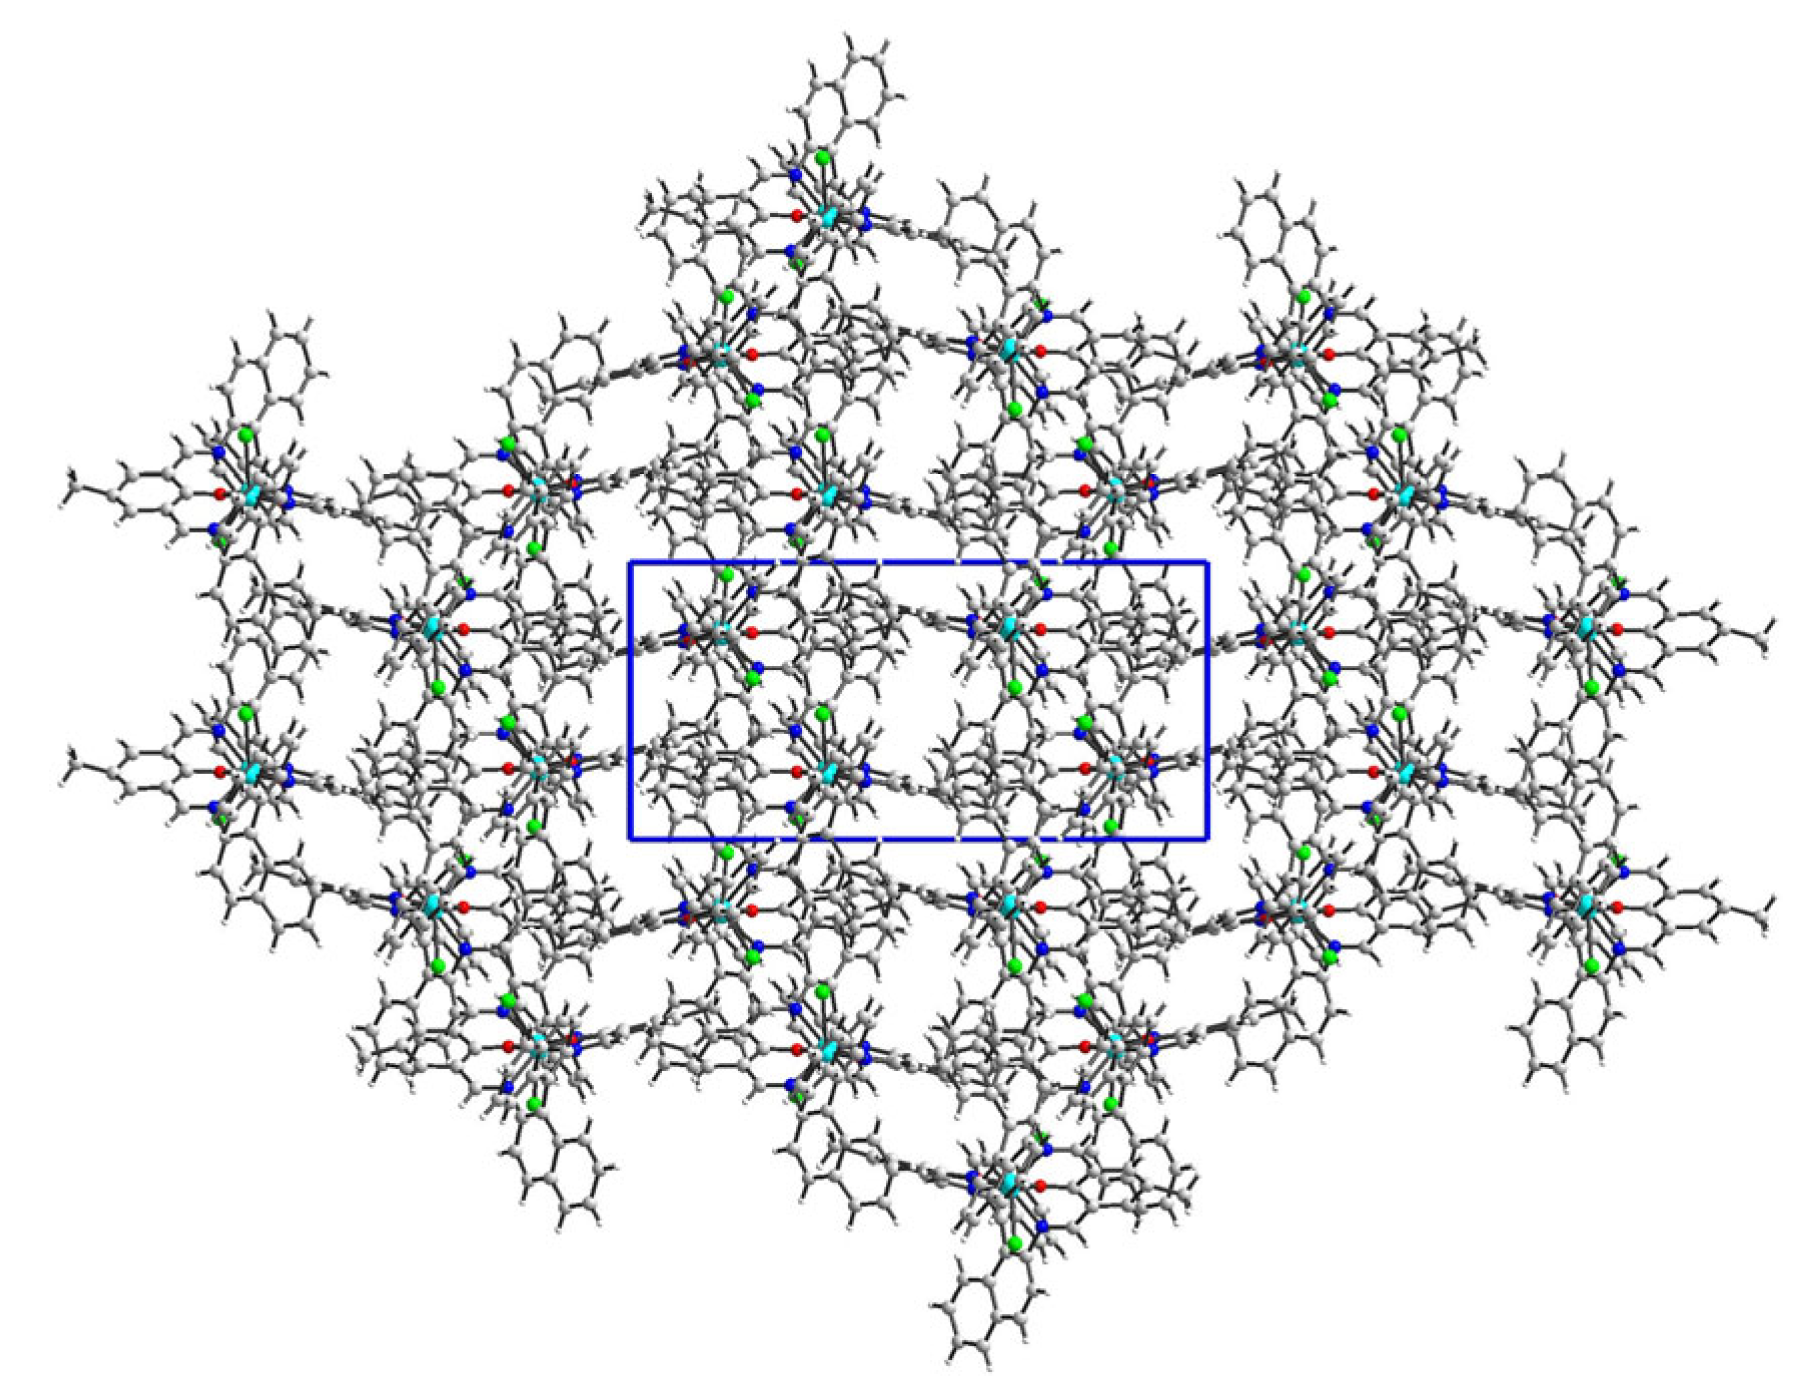
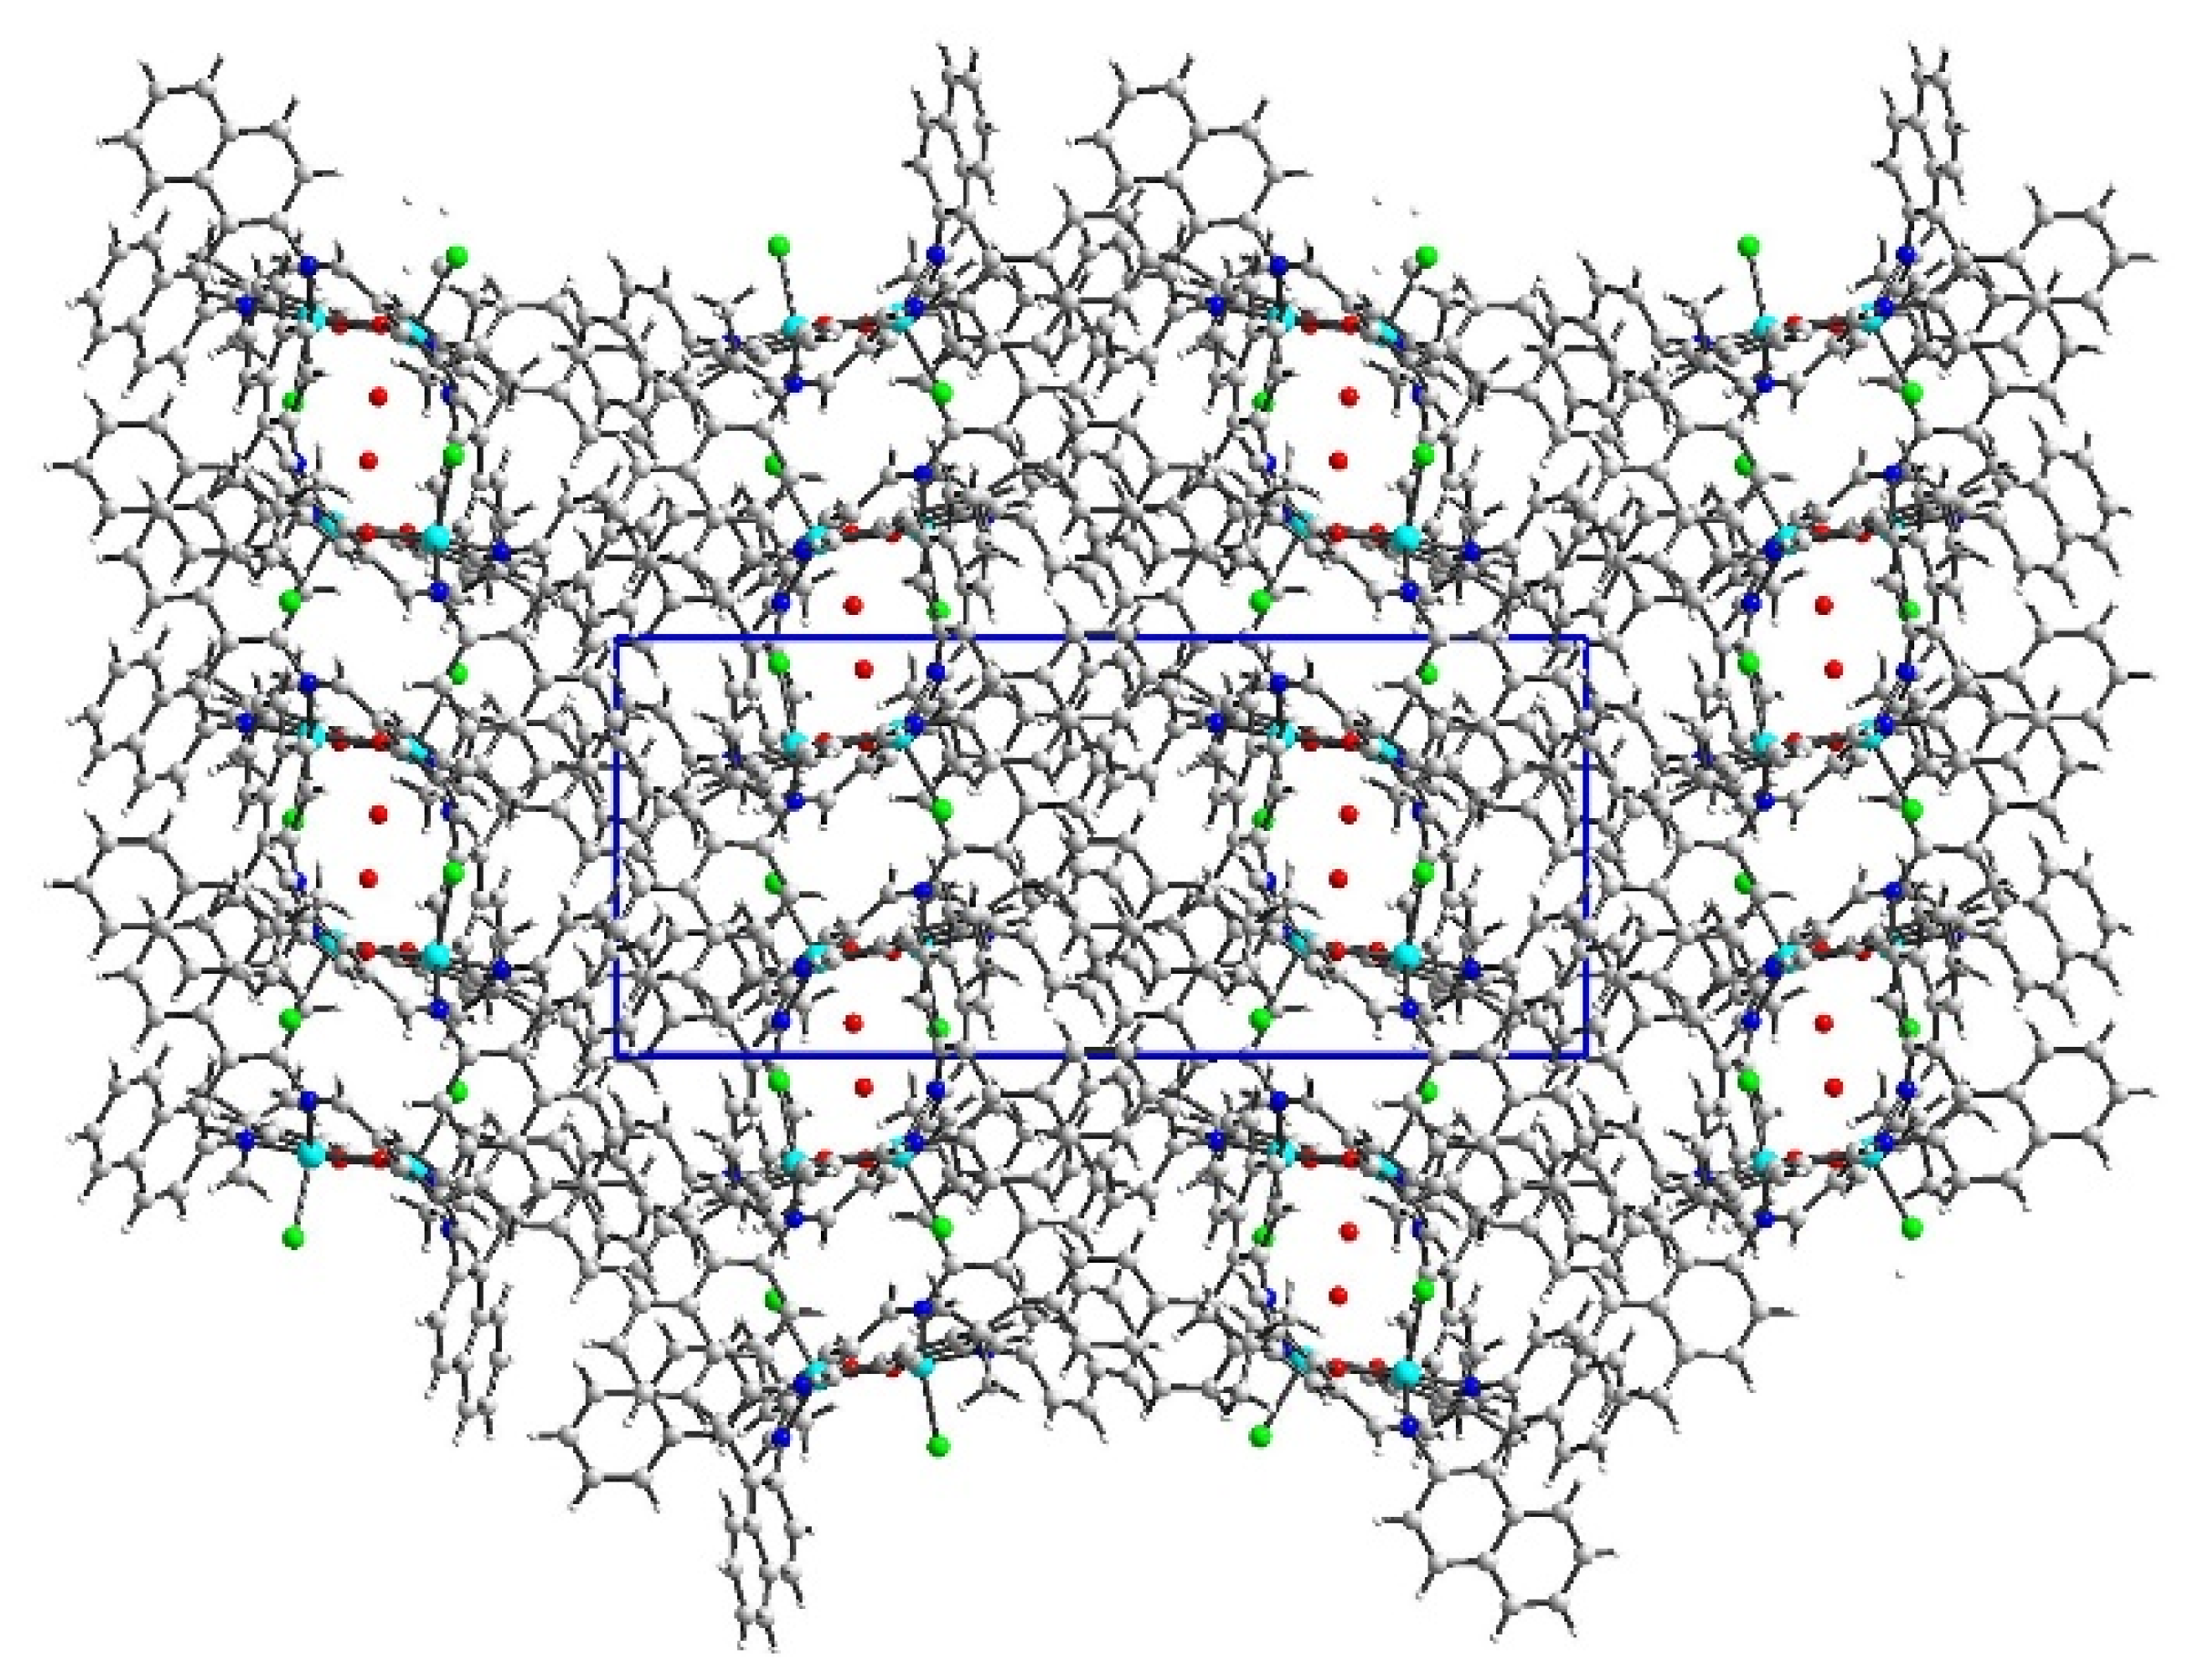
2.2. Crystal Structure Description
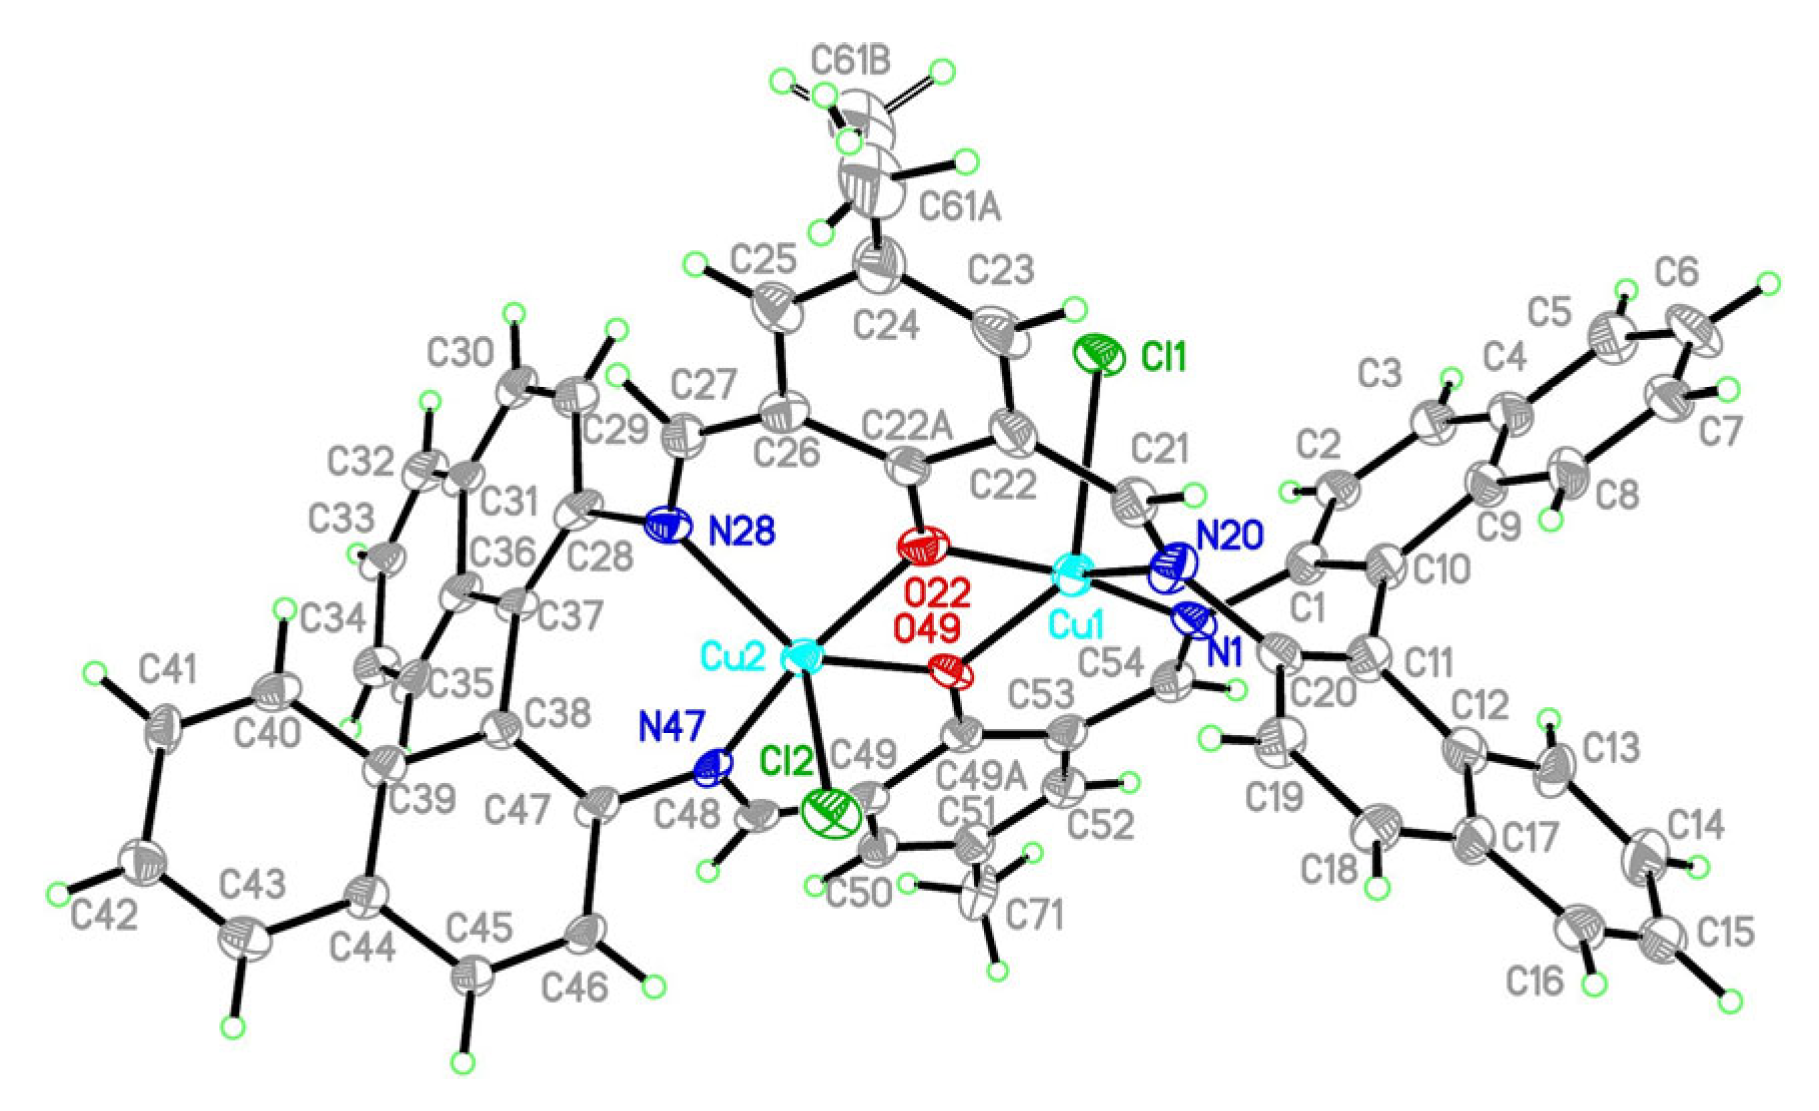
2.2.1. Crystal Structure Description of [Cu2Cl2(L’)] K1
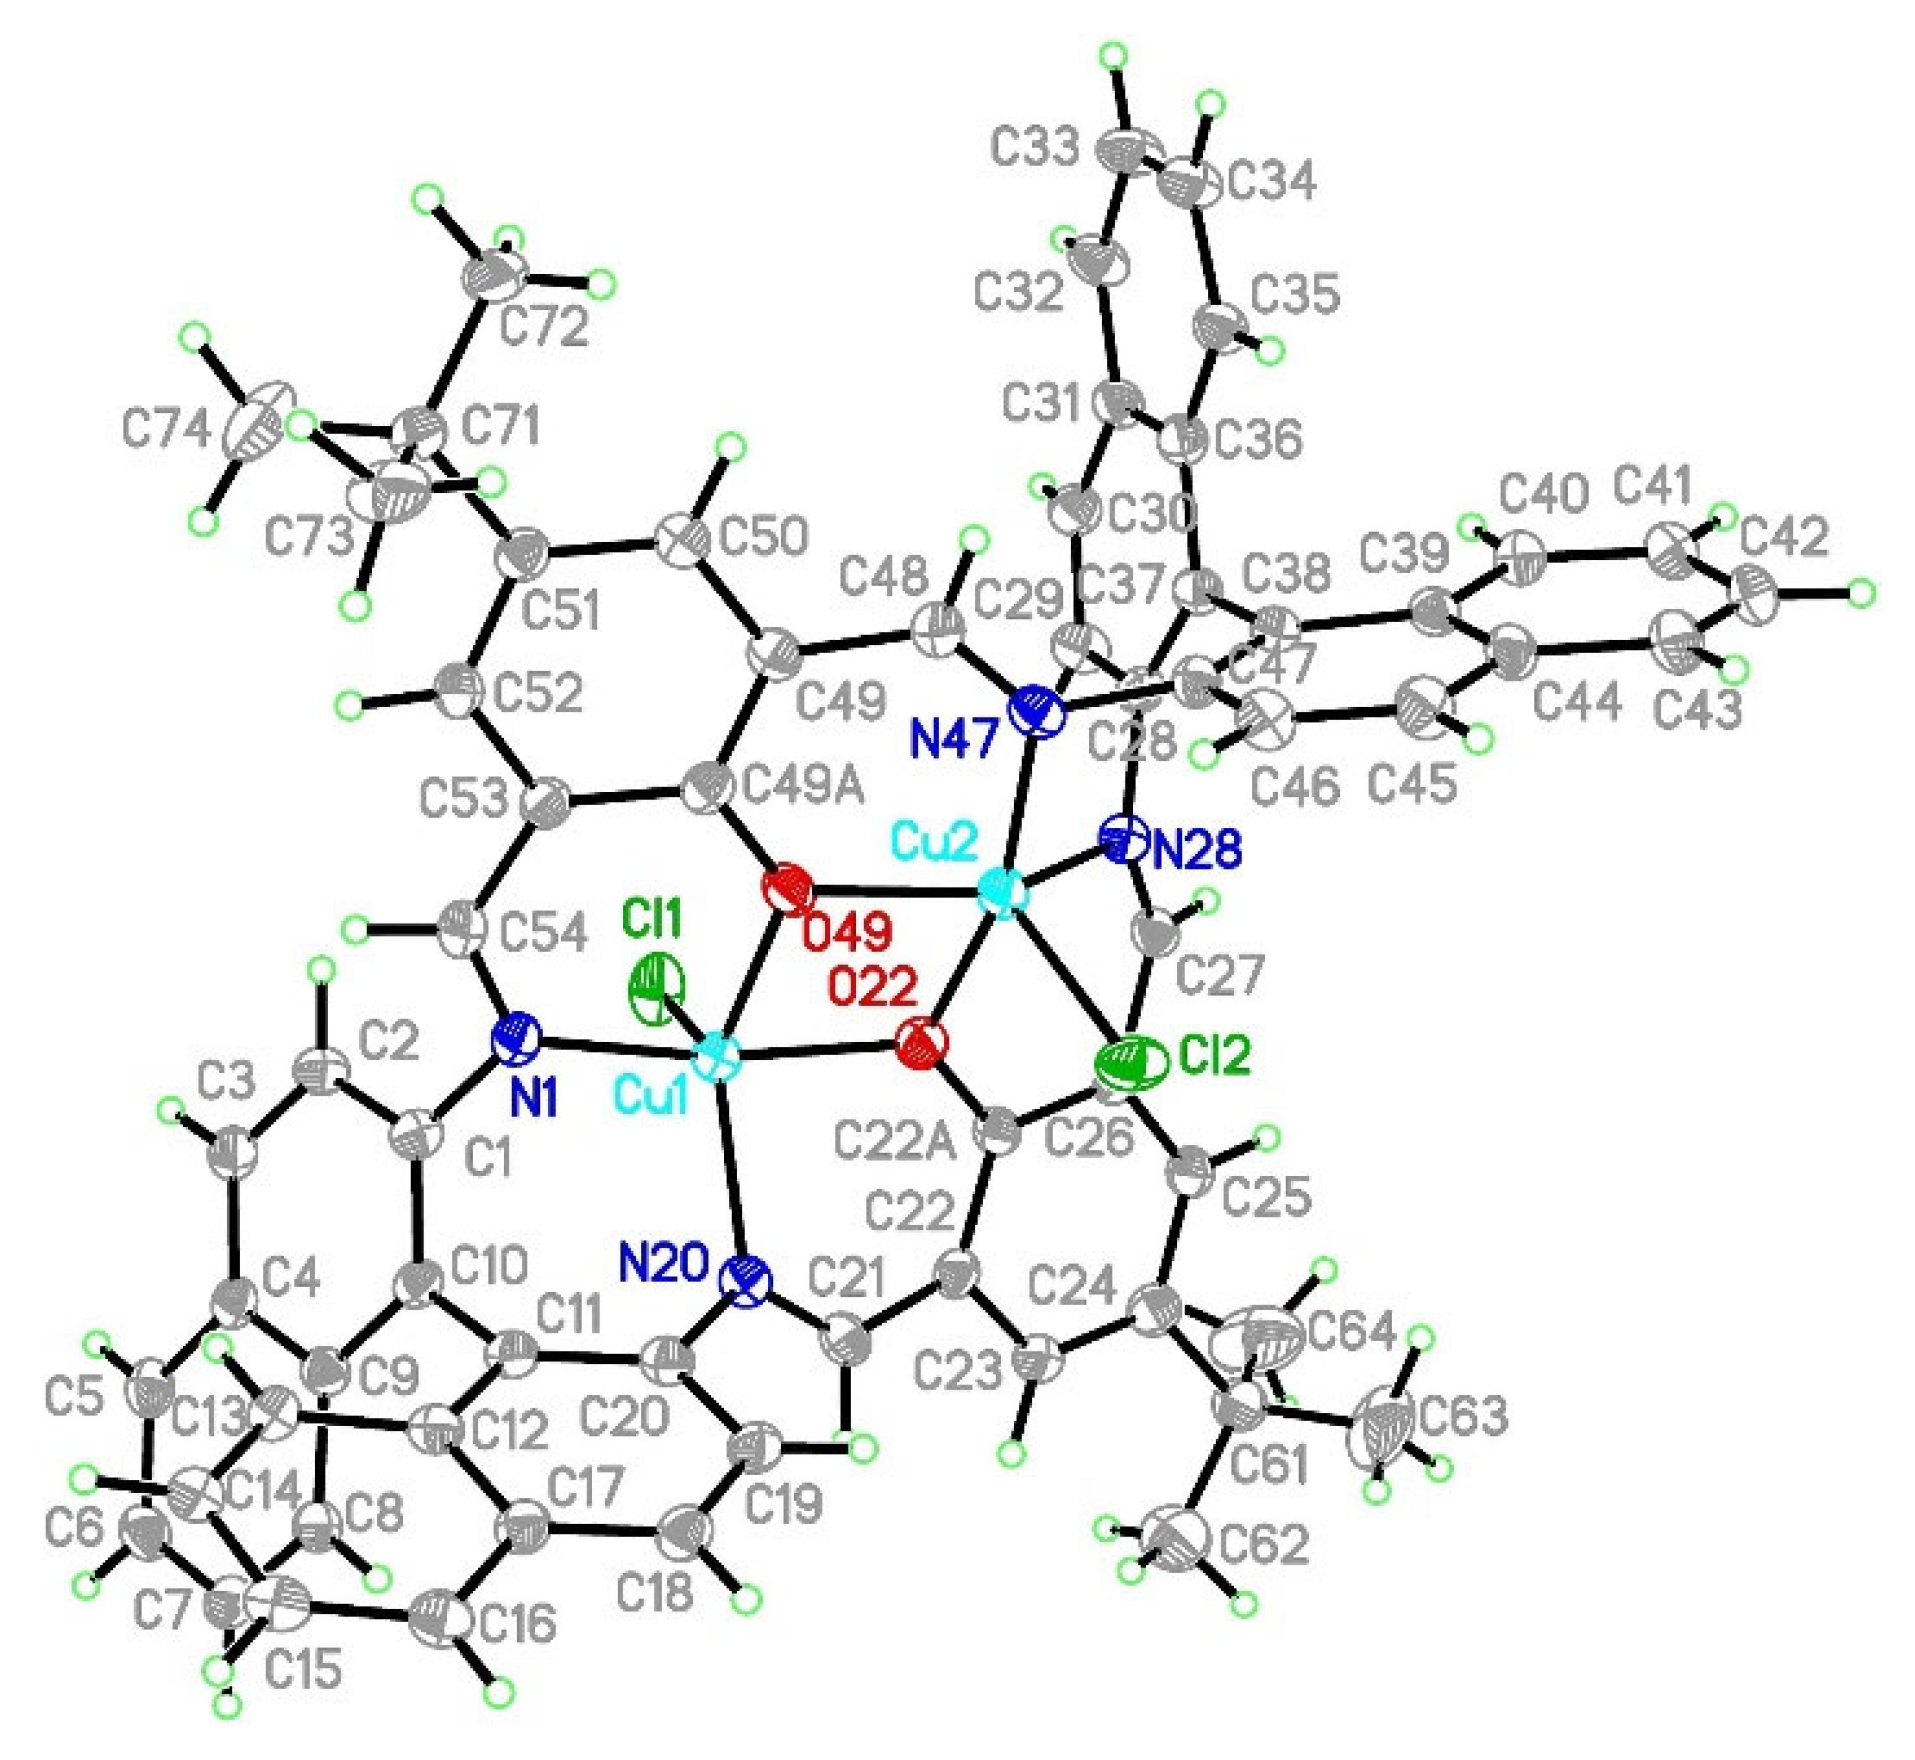
2.2.2. Crystal Structure Description of [Cu2Cl2(L)]·H2O K2
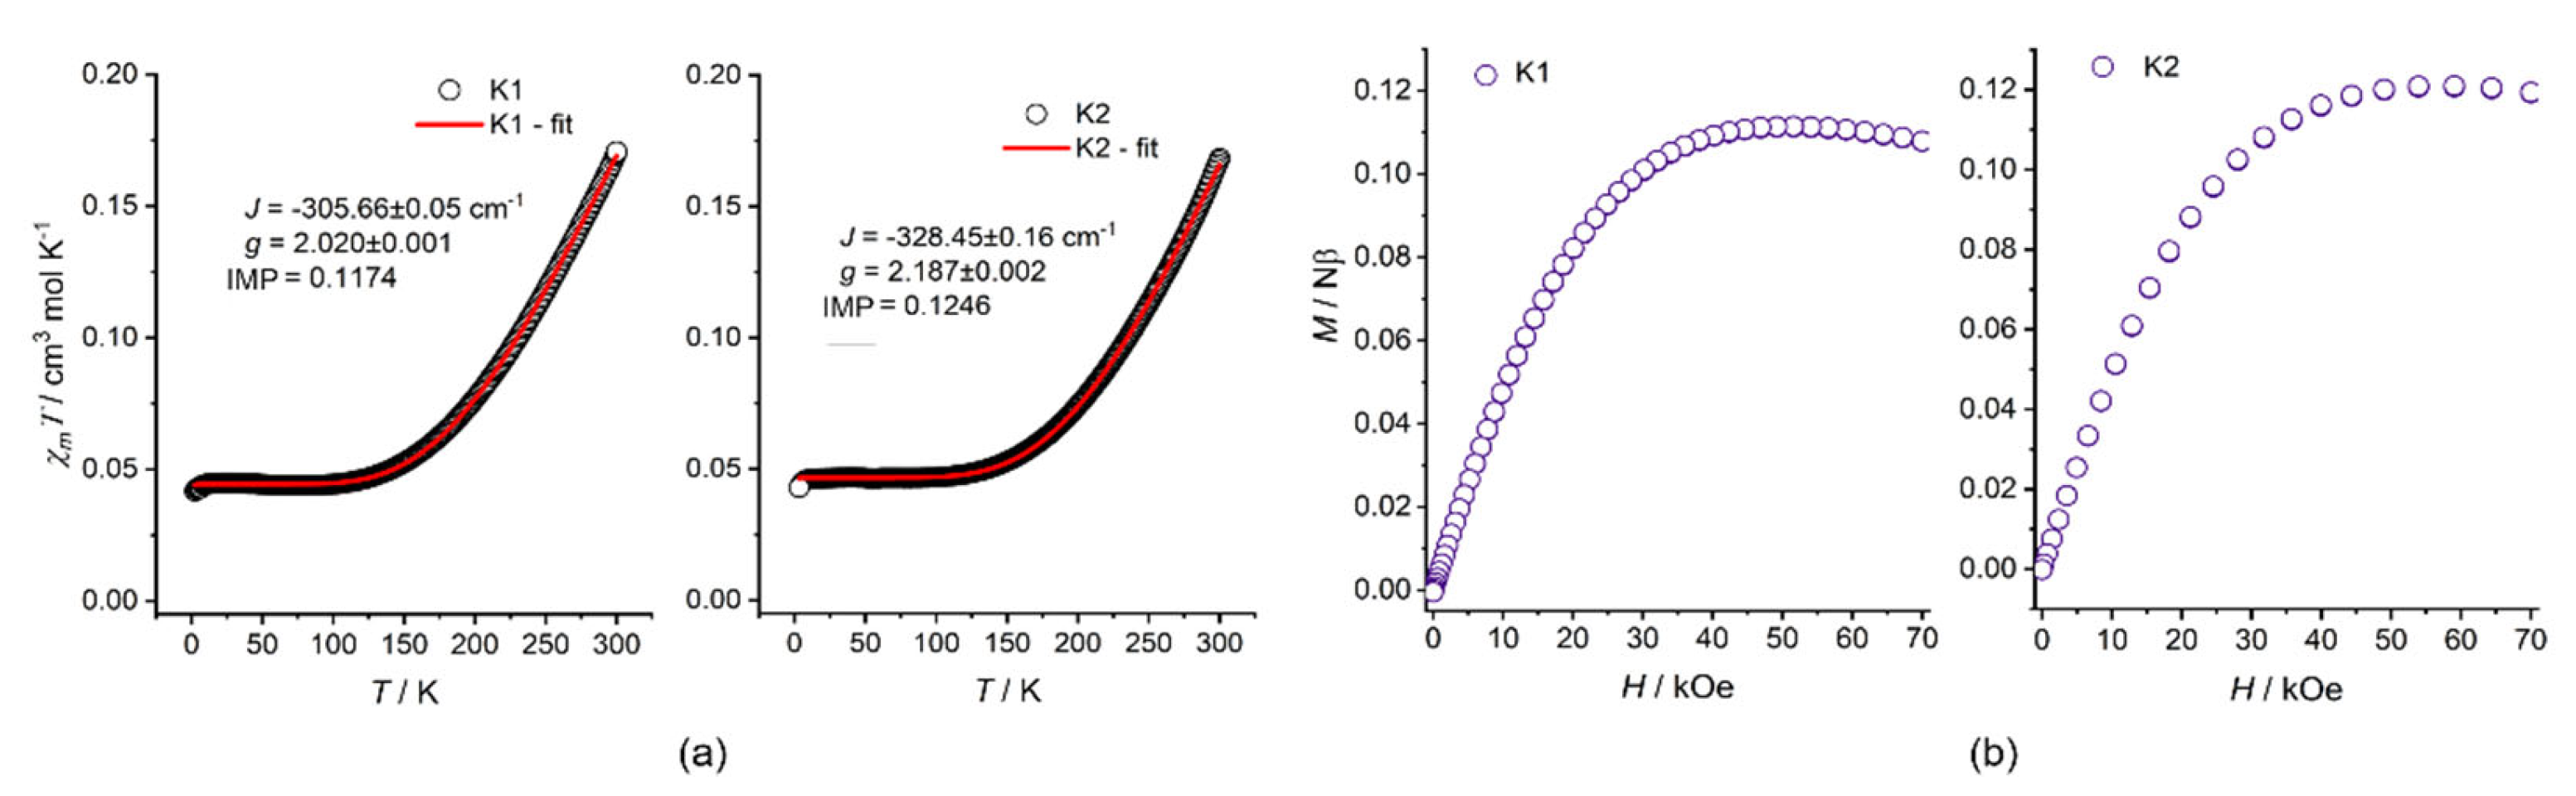
2.3. DC Magnetic Measurements, BS DFT Computations, and EPR Spectra
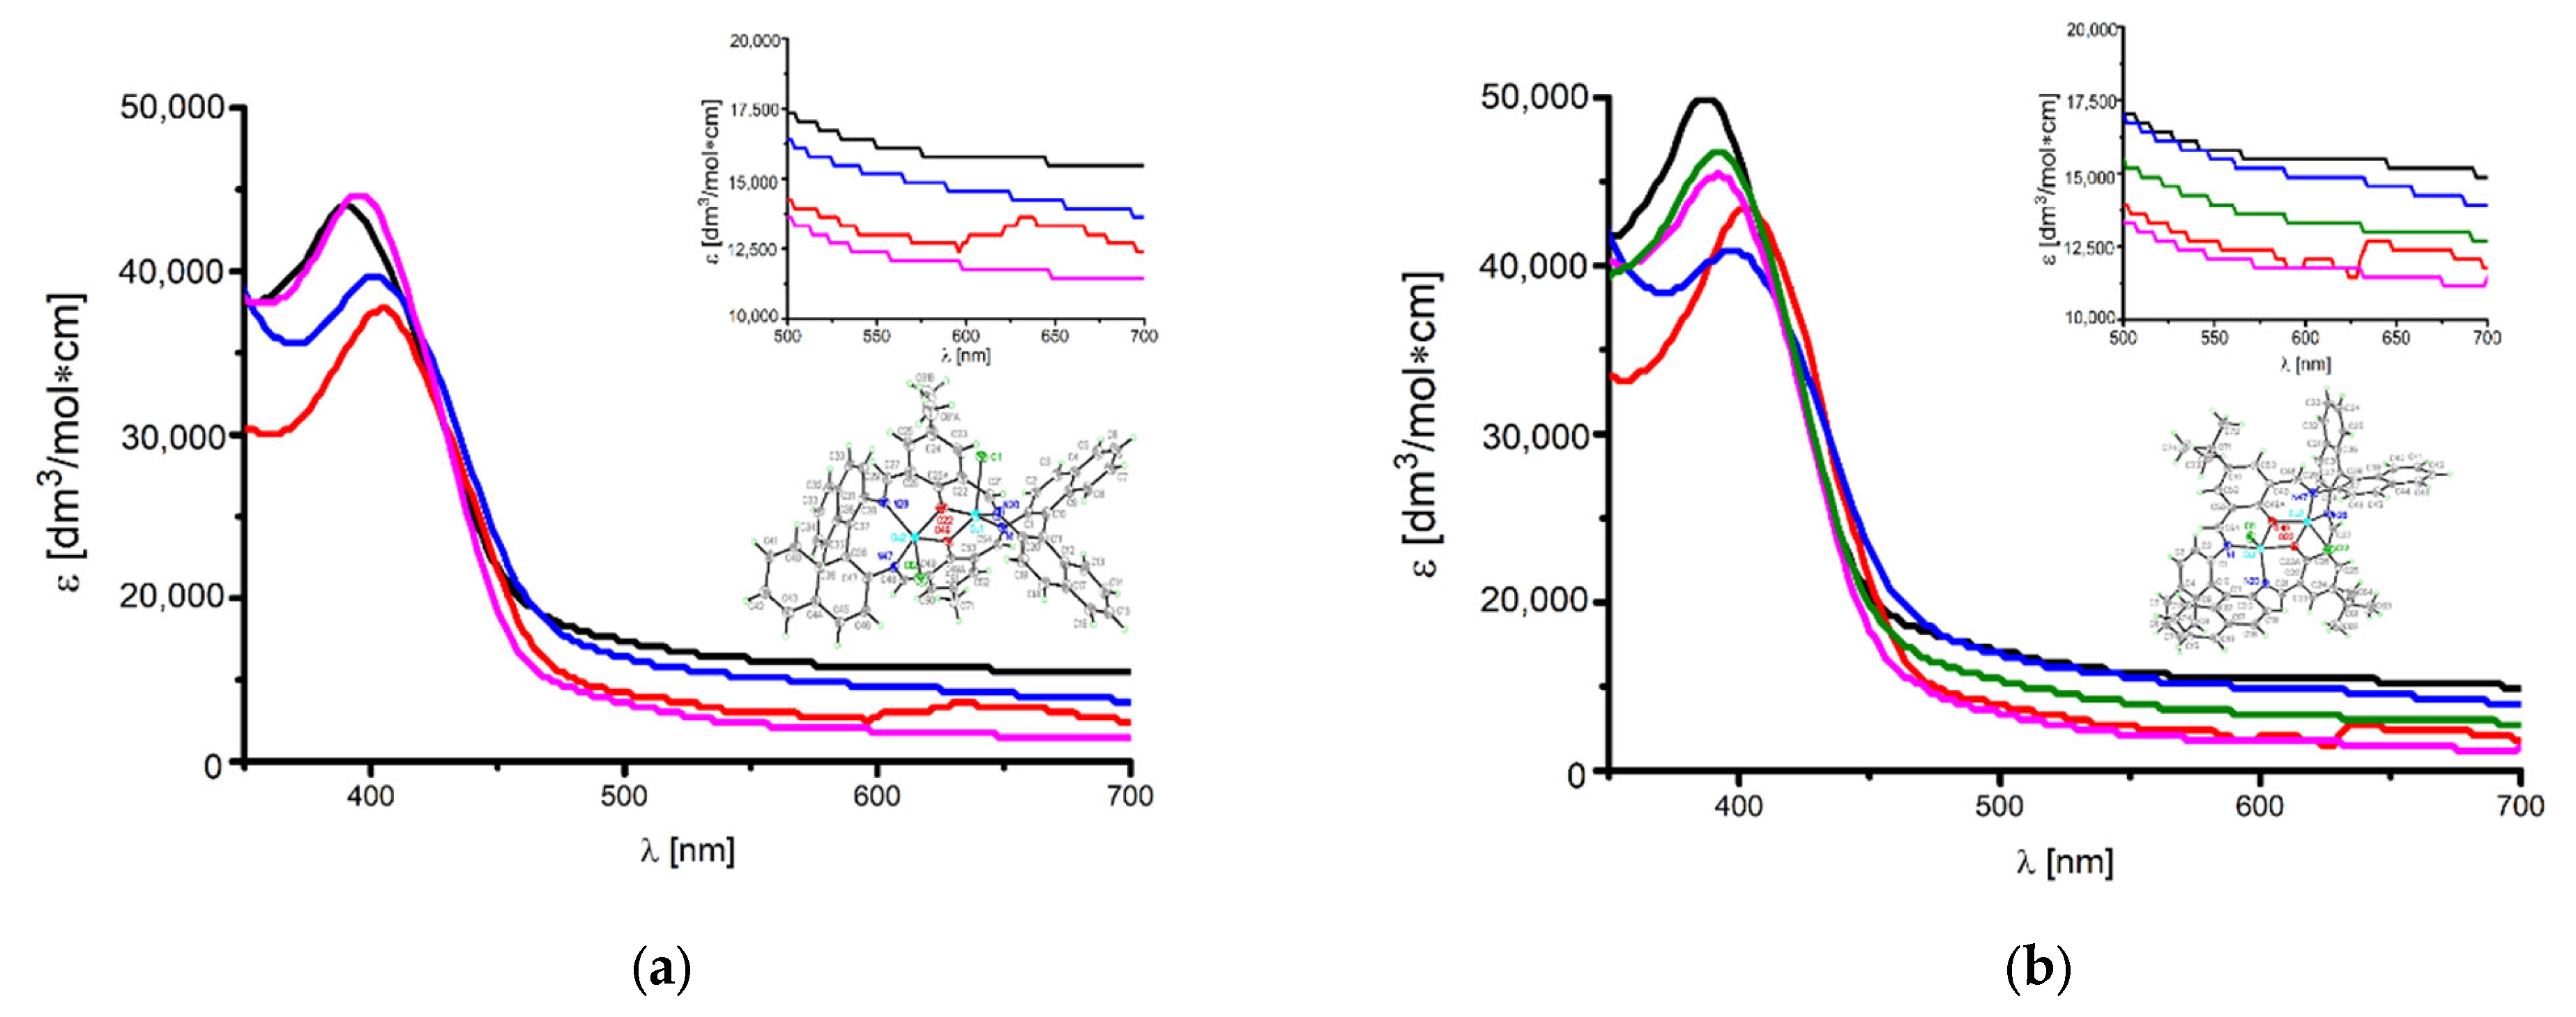
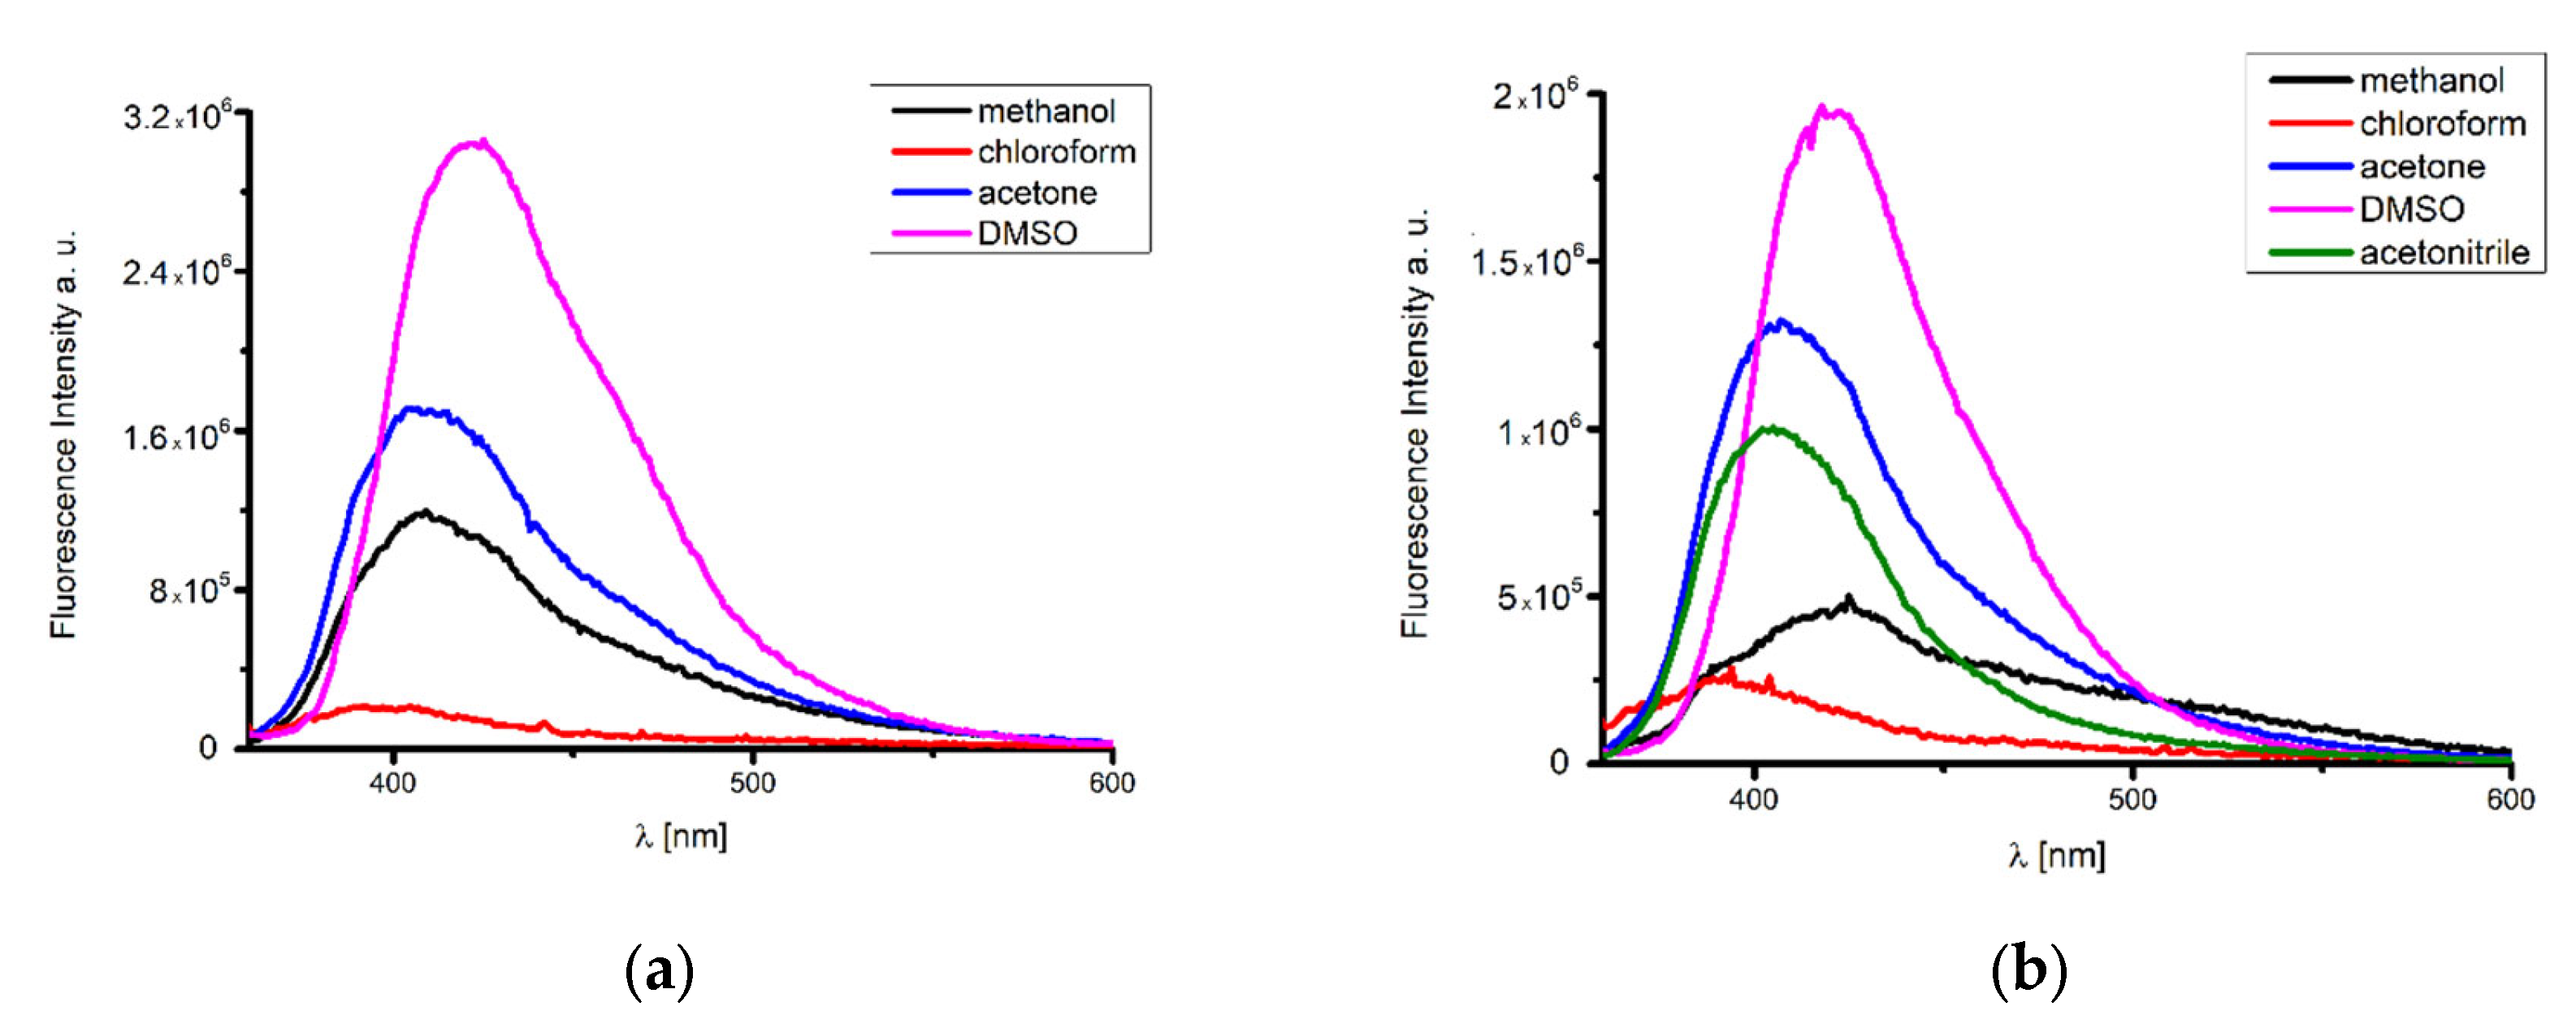
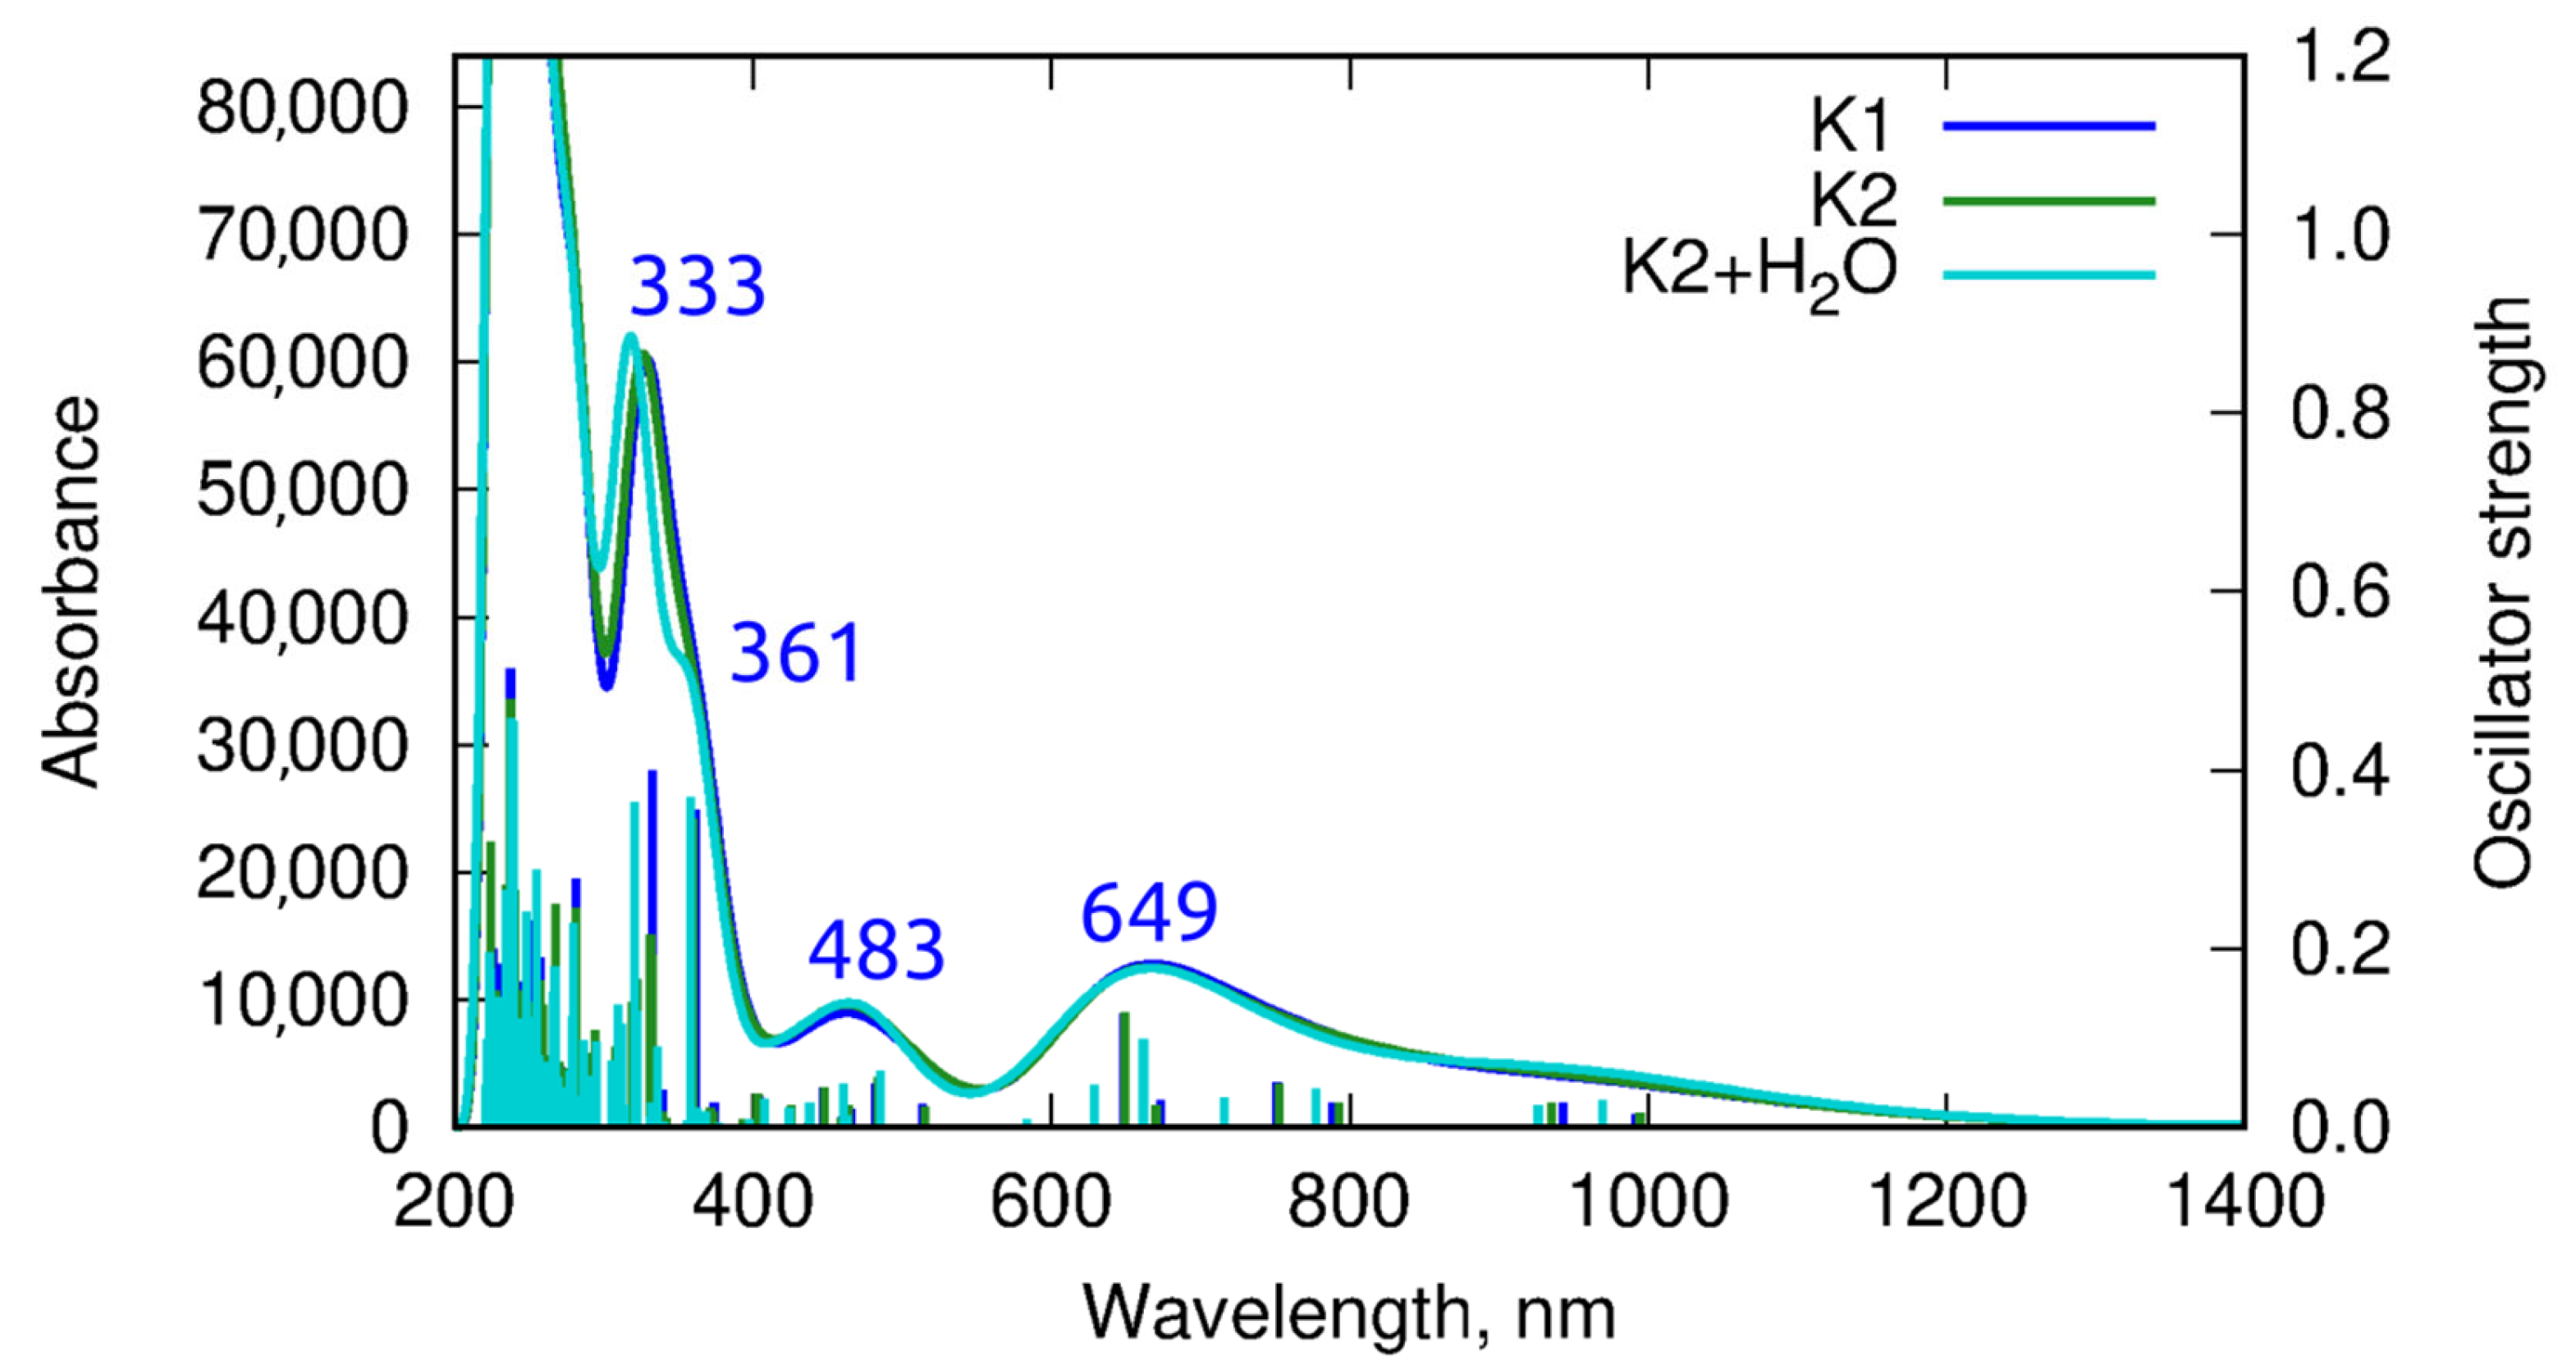
2.4. UV–VIS and Fluorescence Spectroscopy
Emission Studies
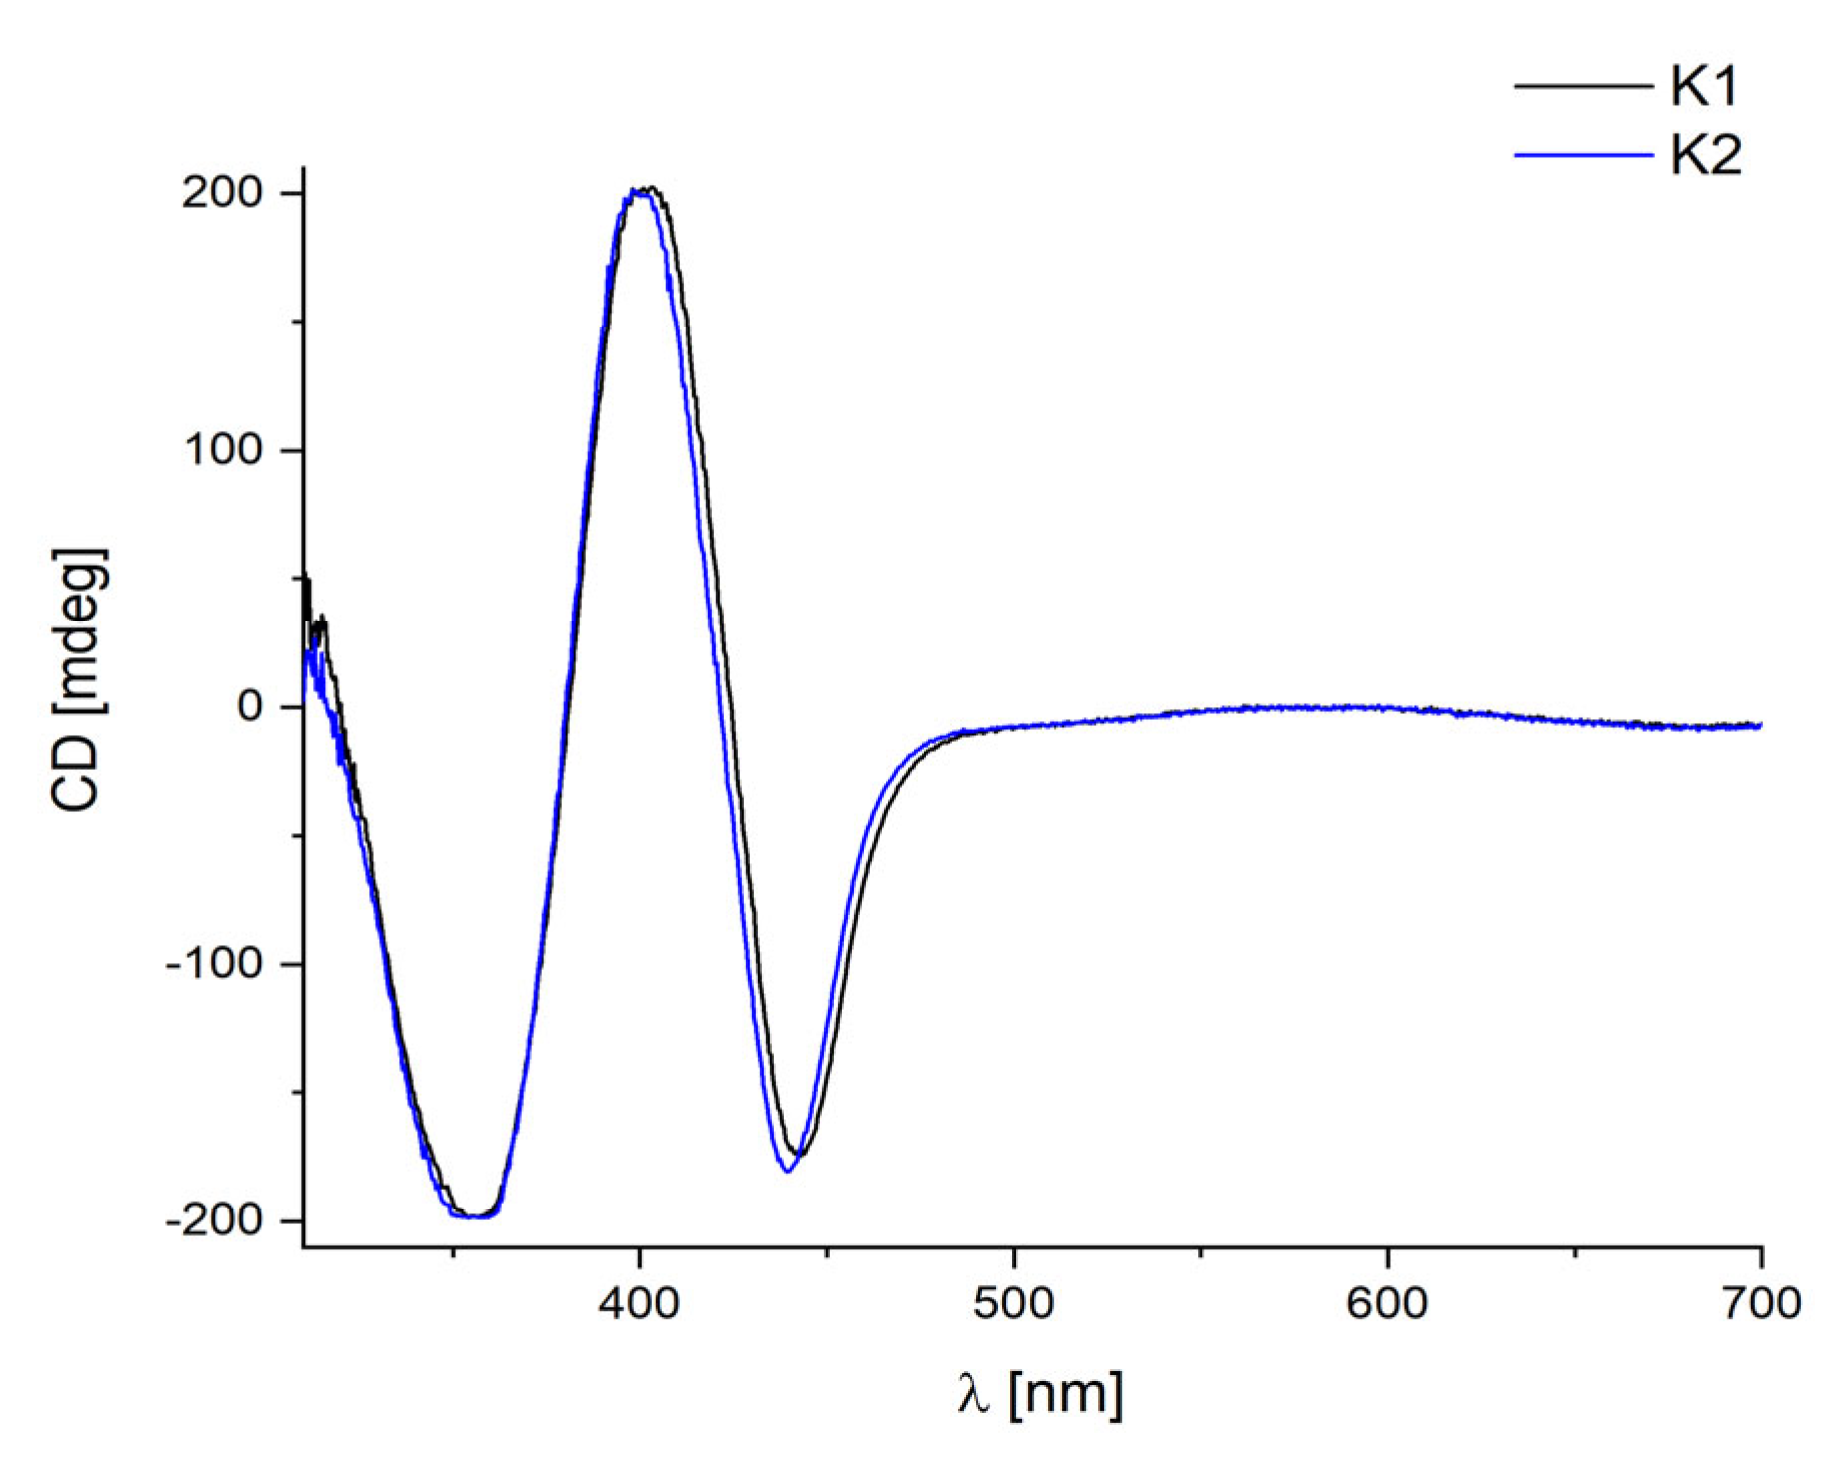
2.5. Circular Dichroism
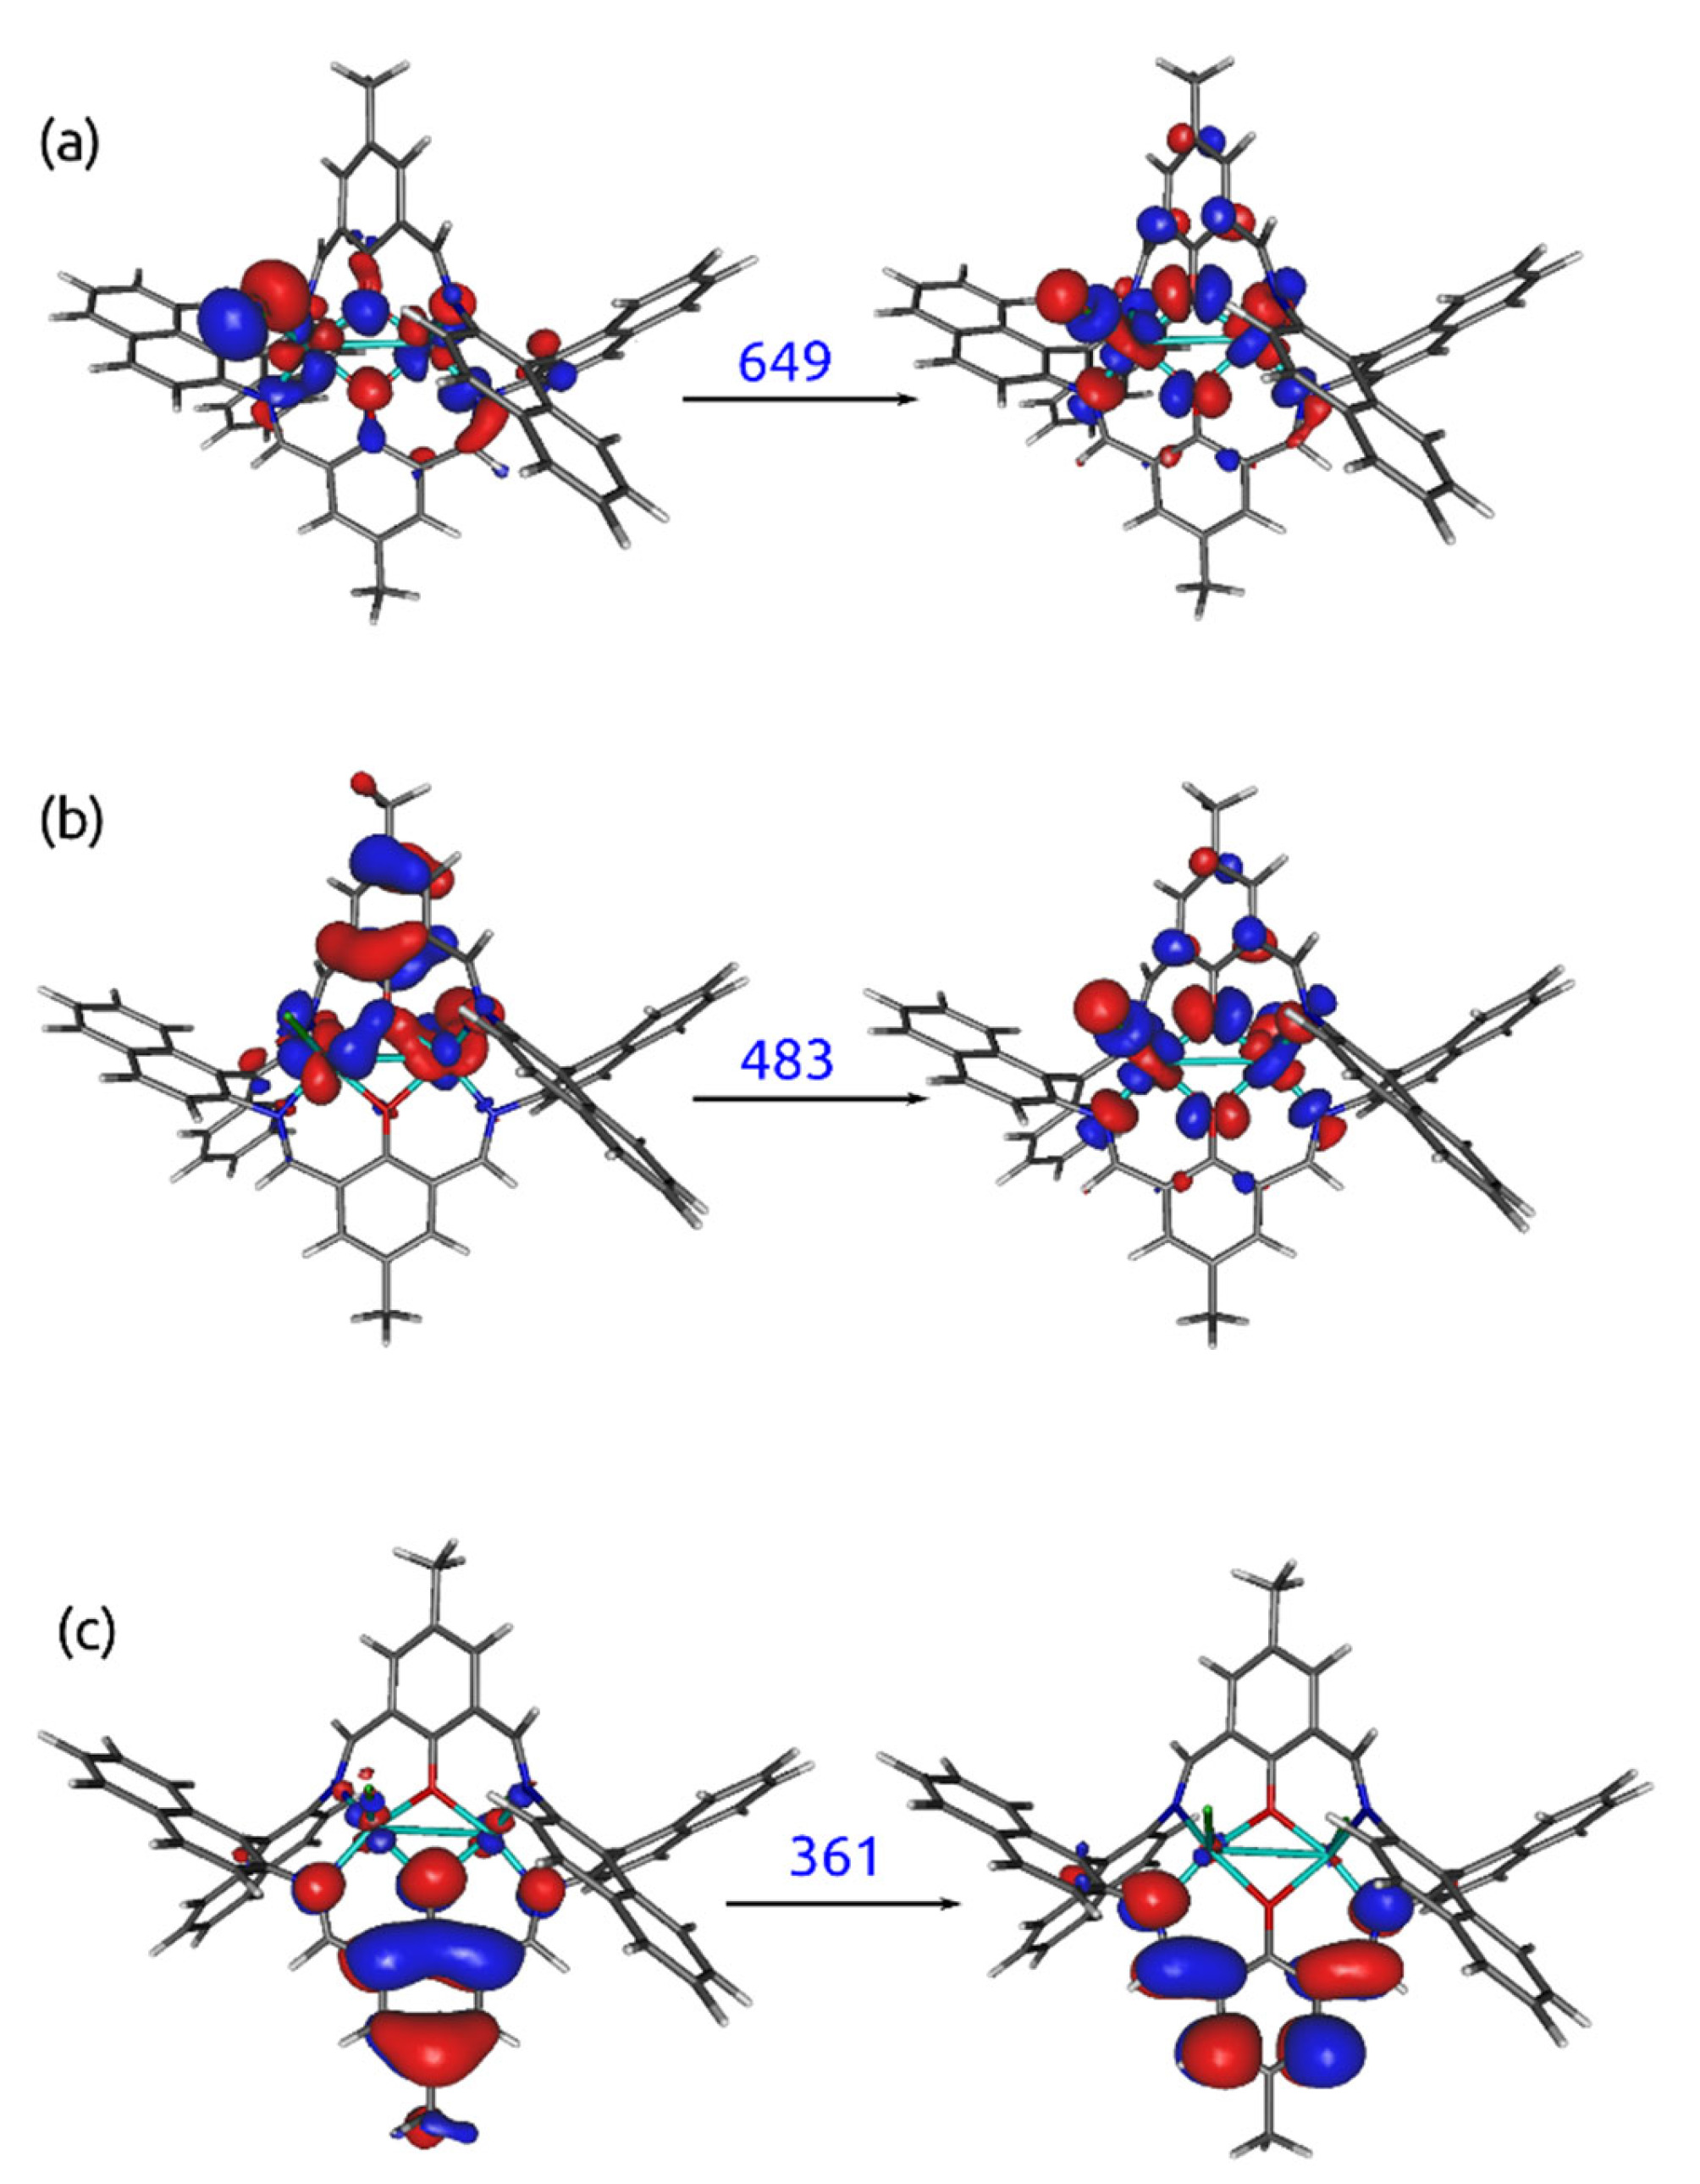
2.6. Theoretical Calculations
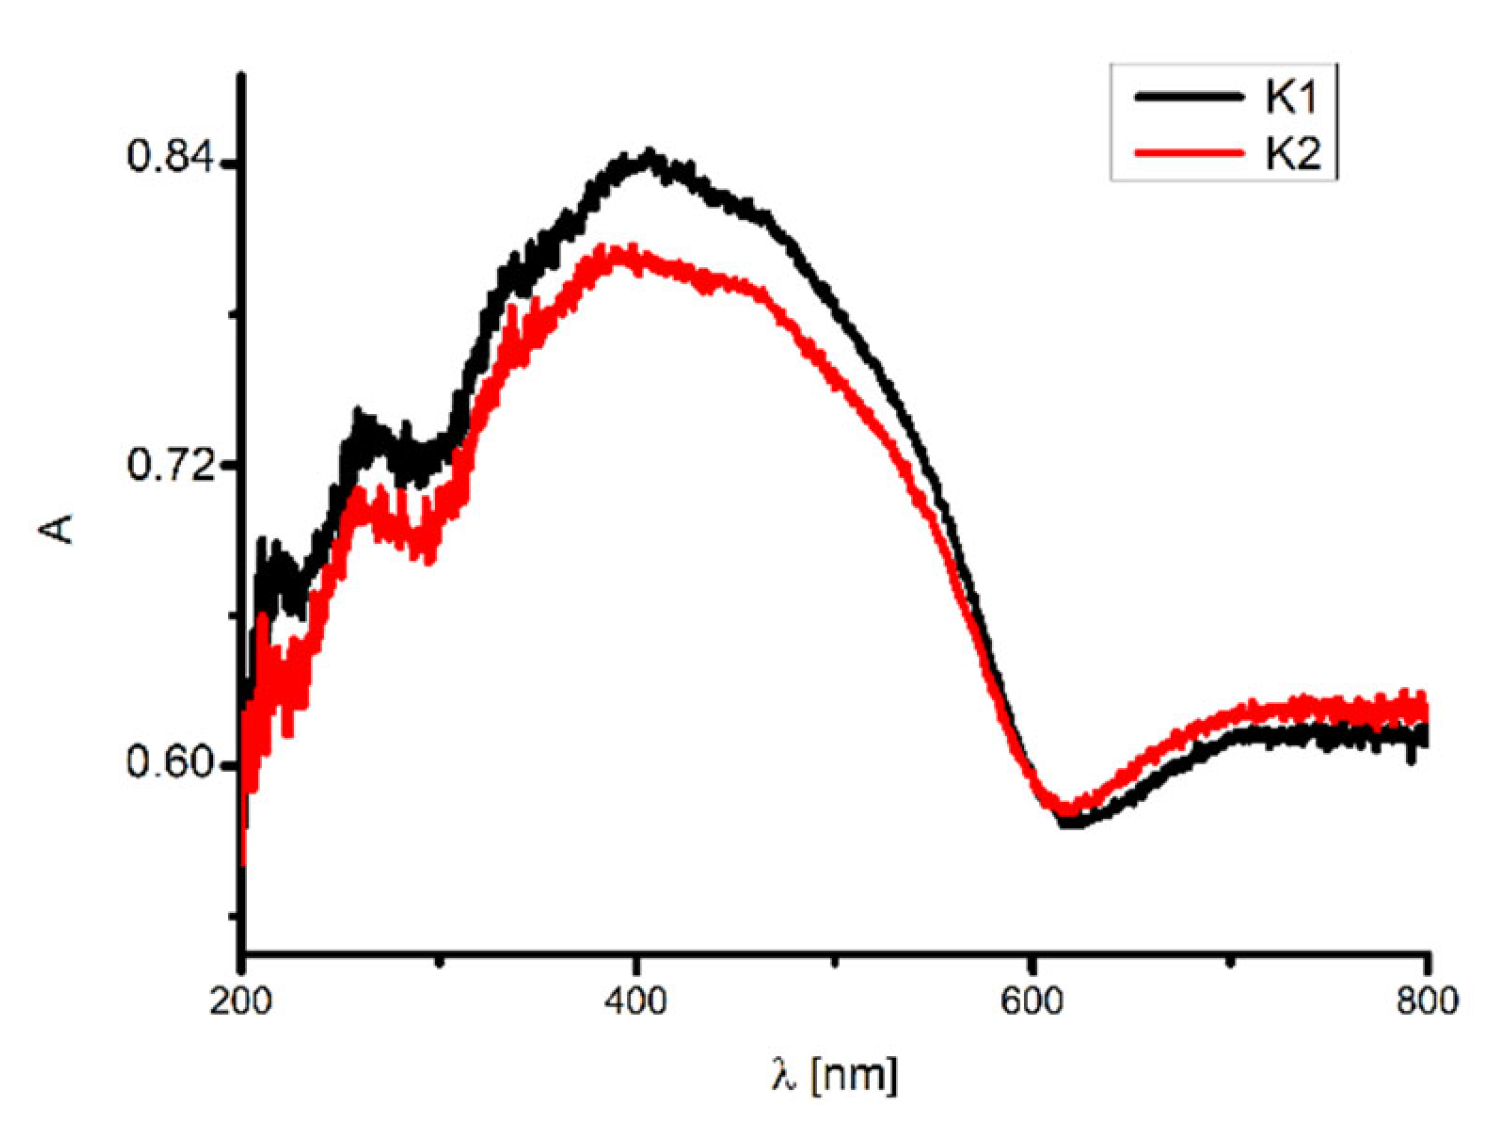
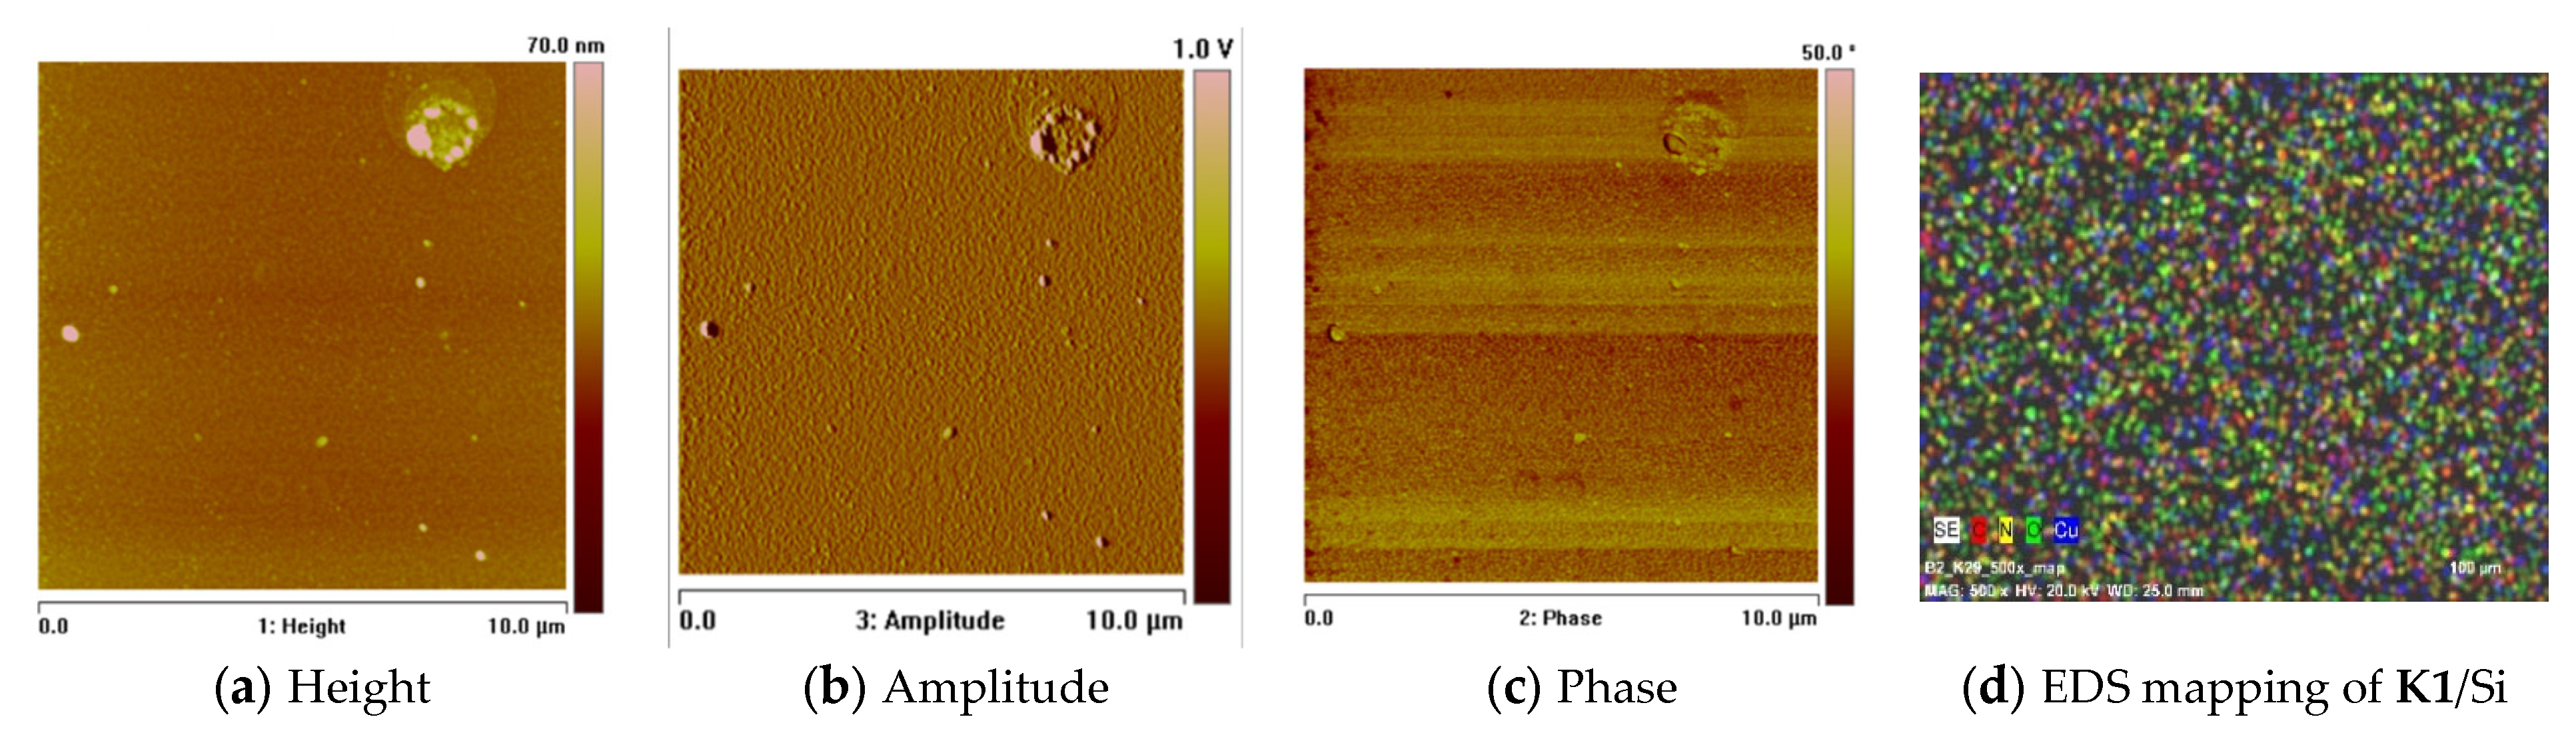
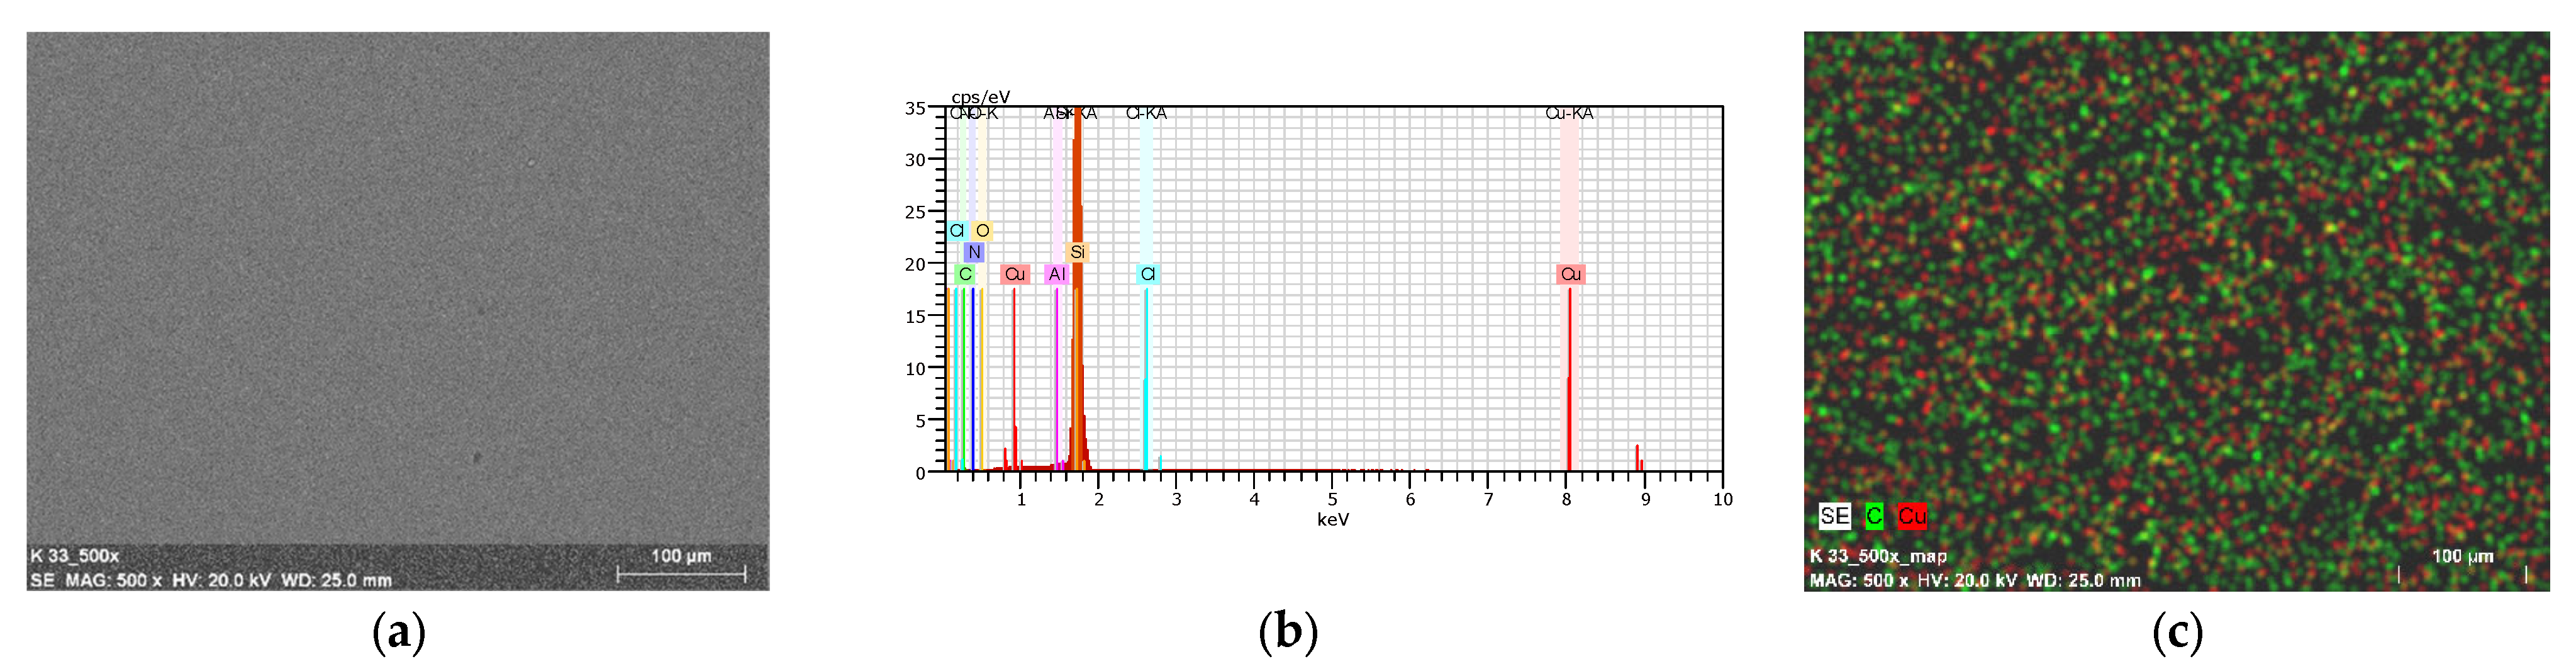
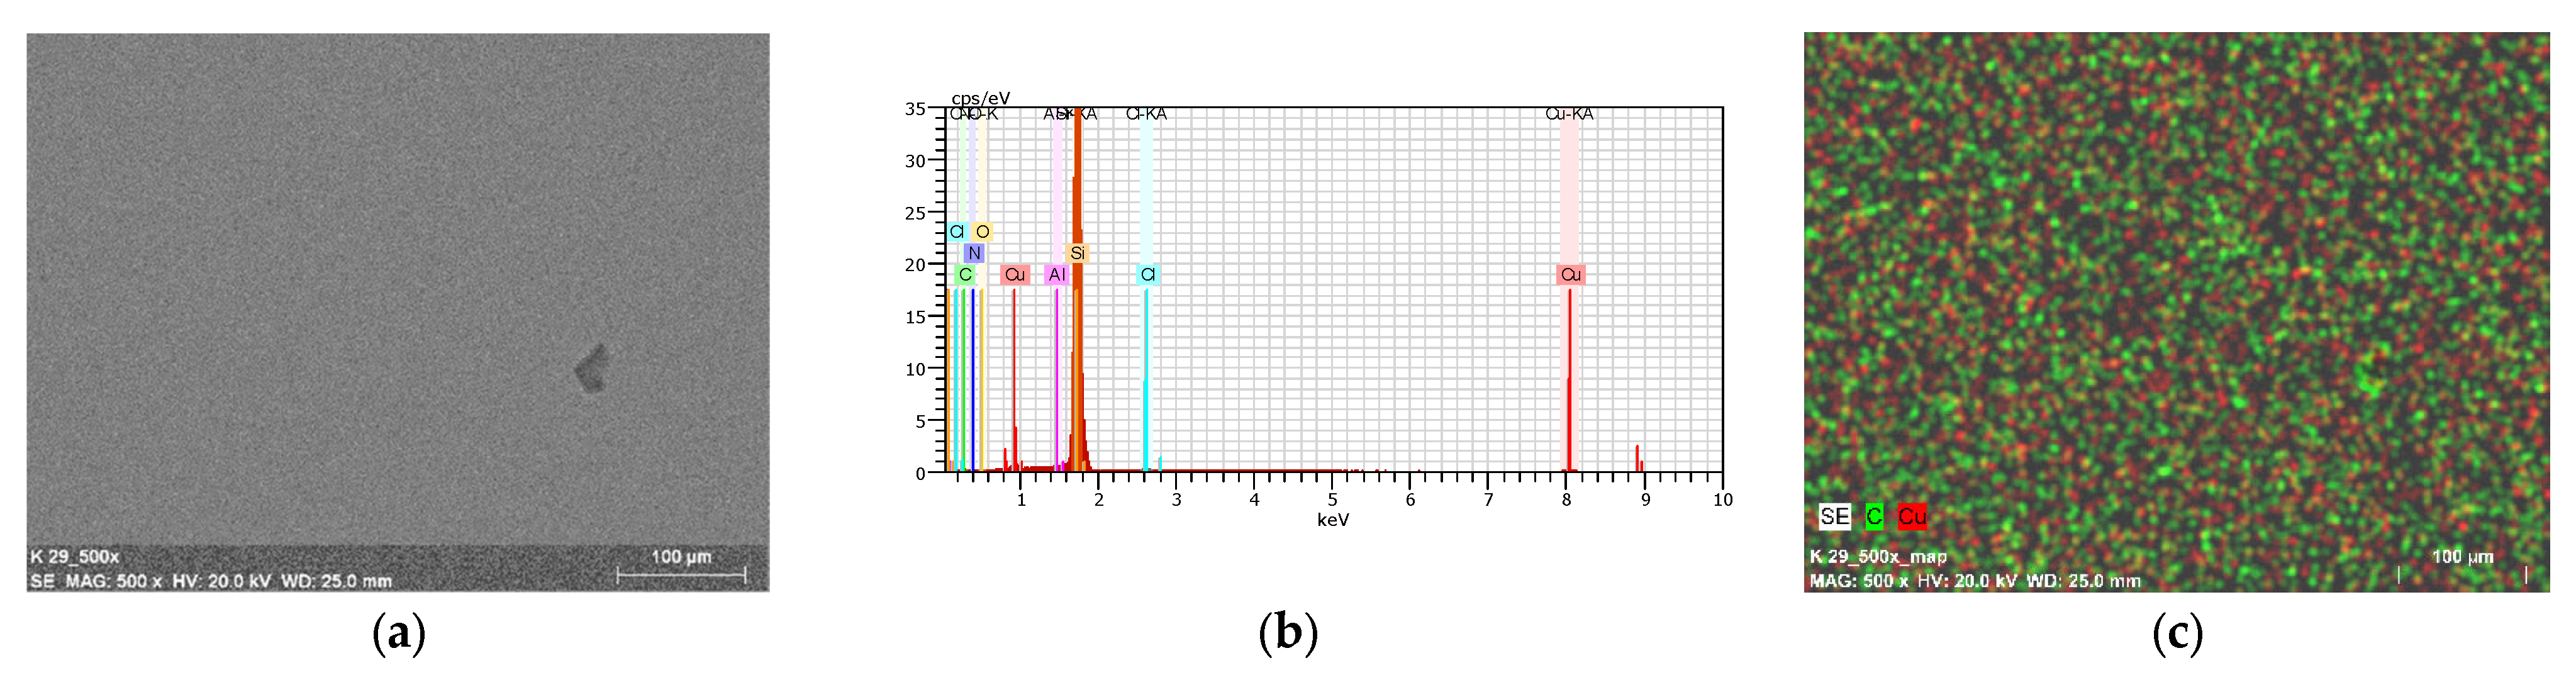
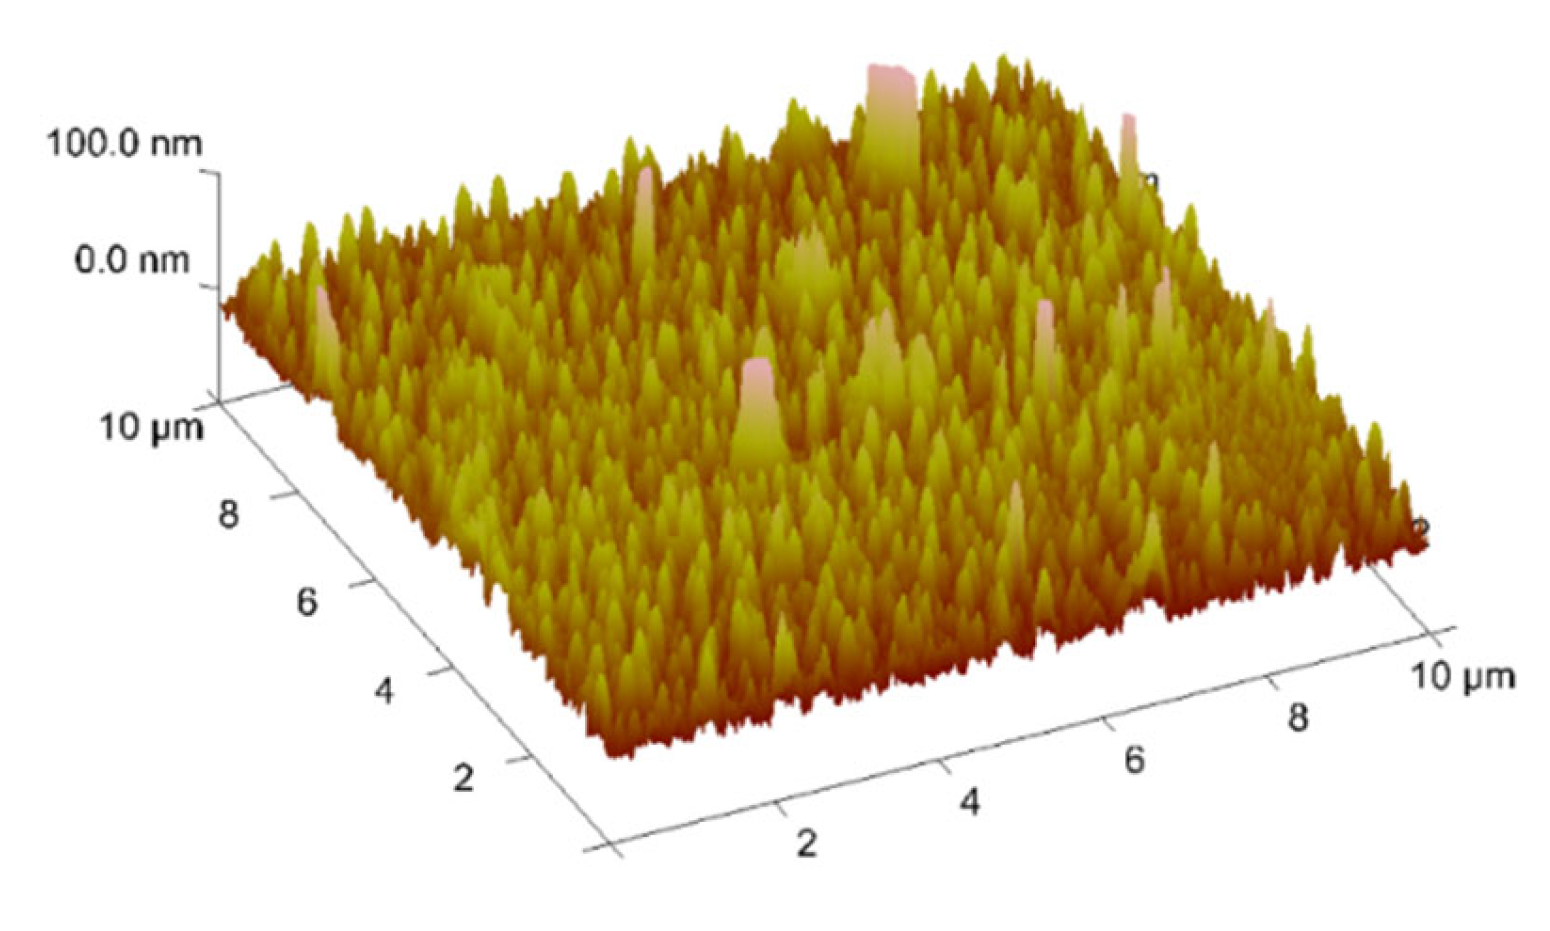
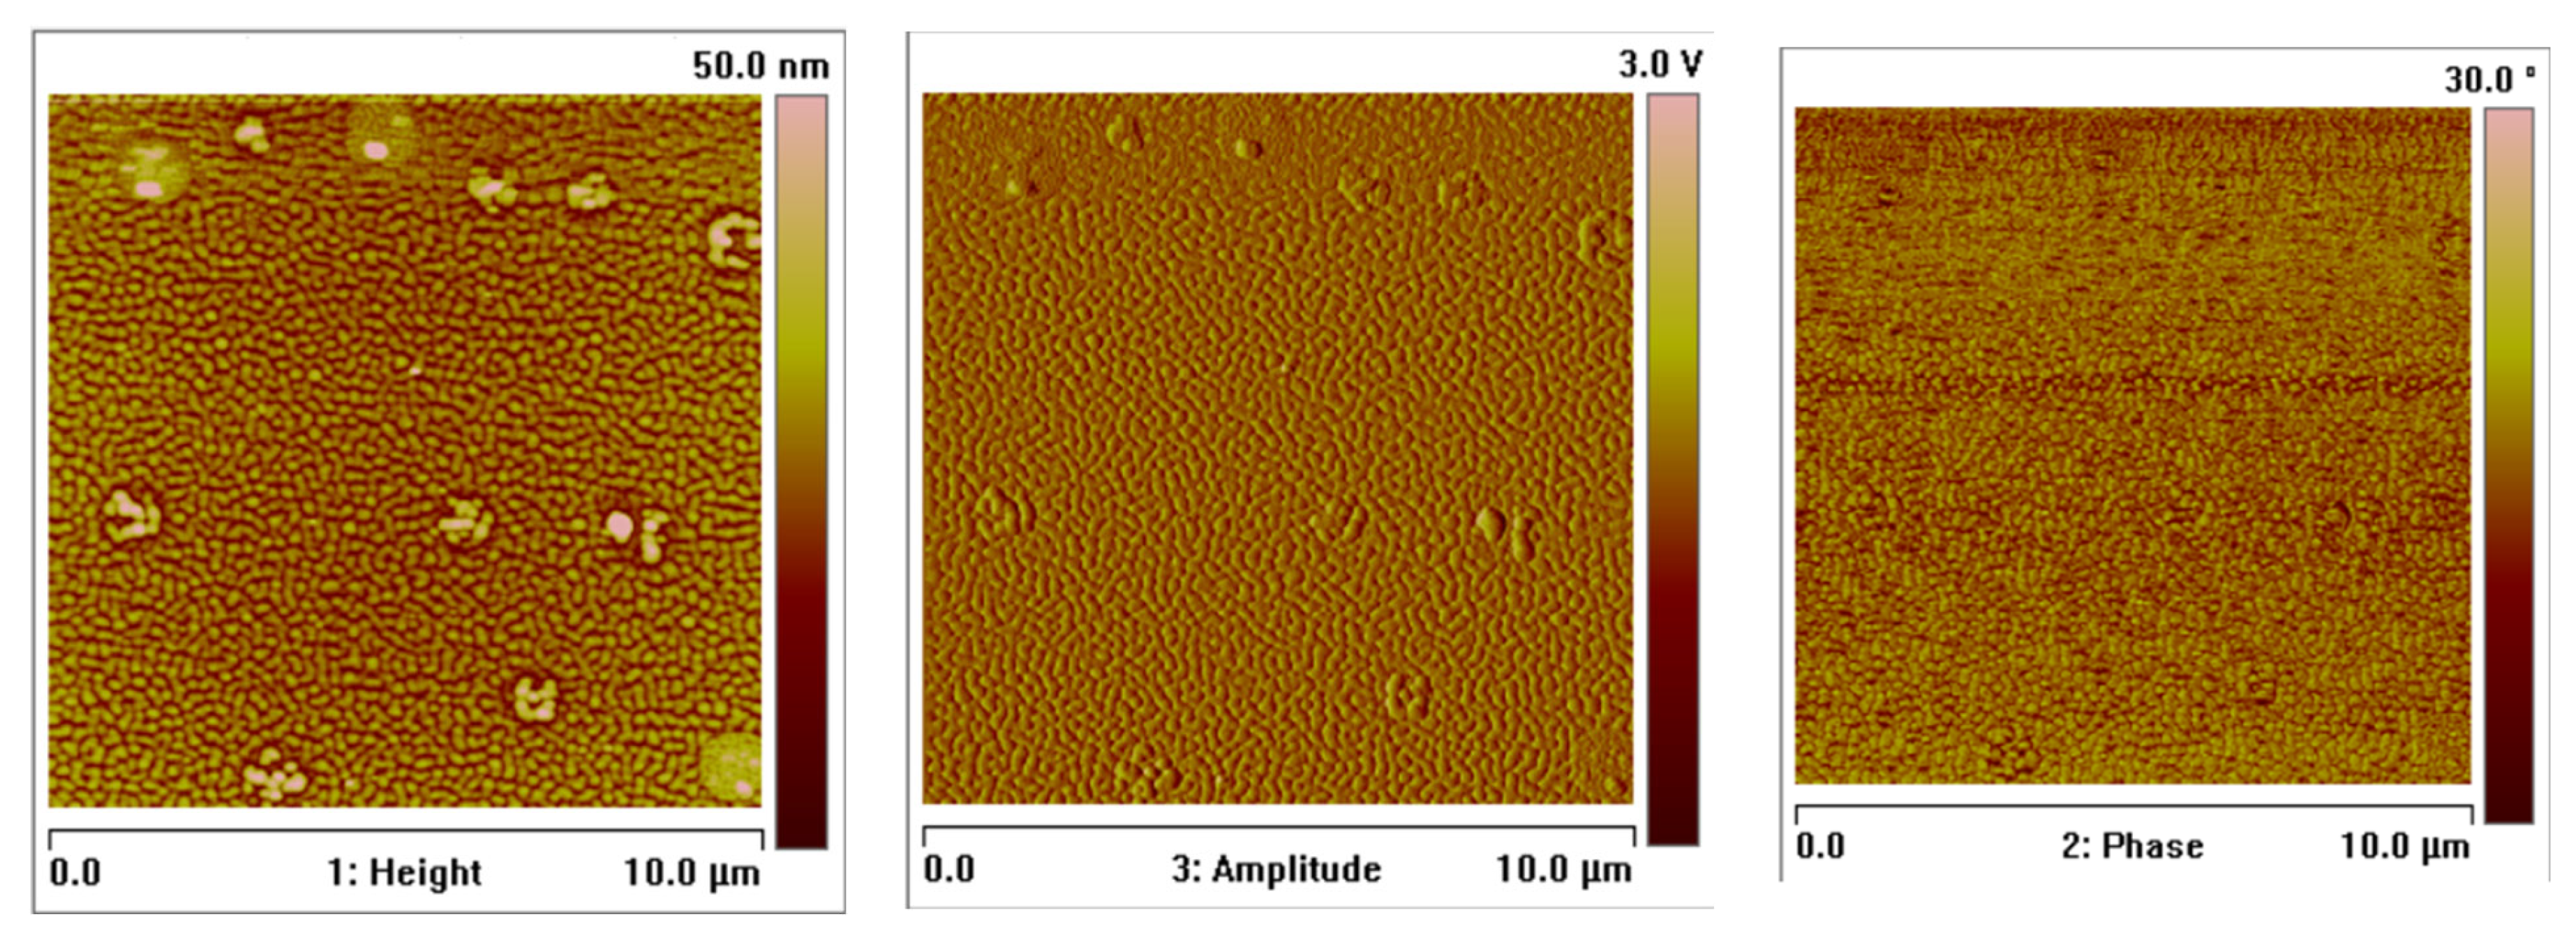
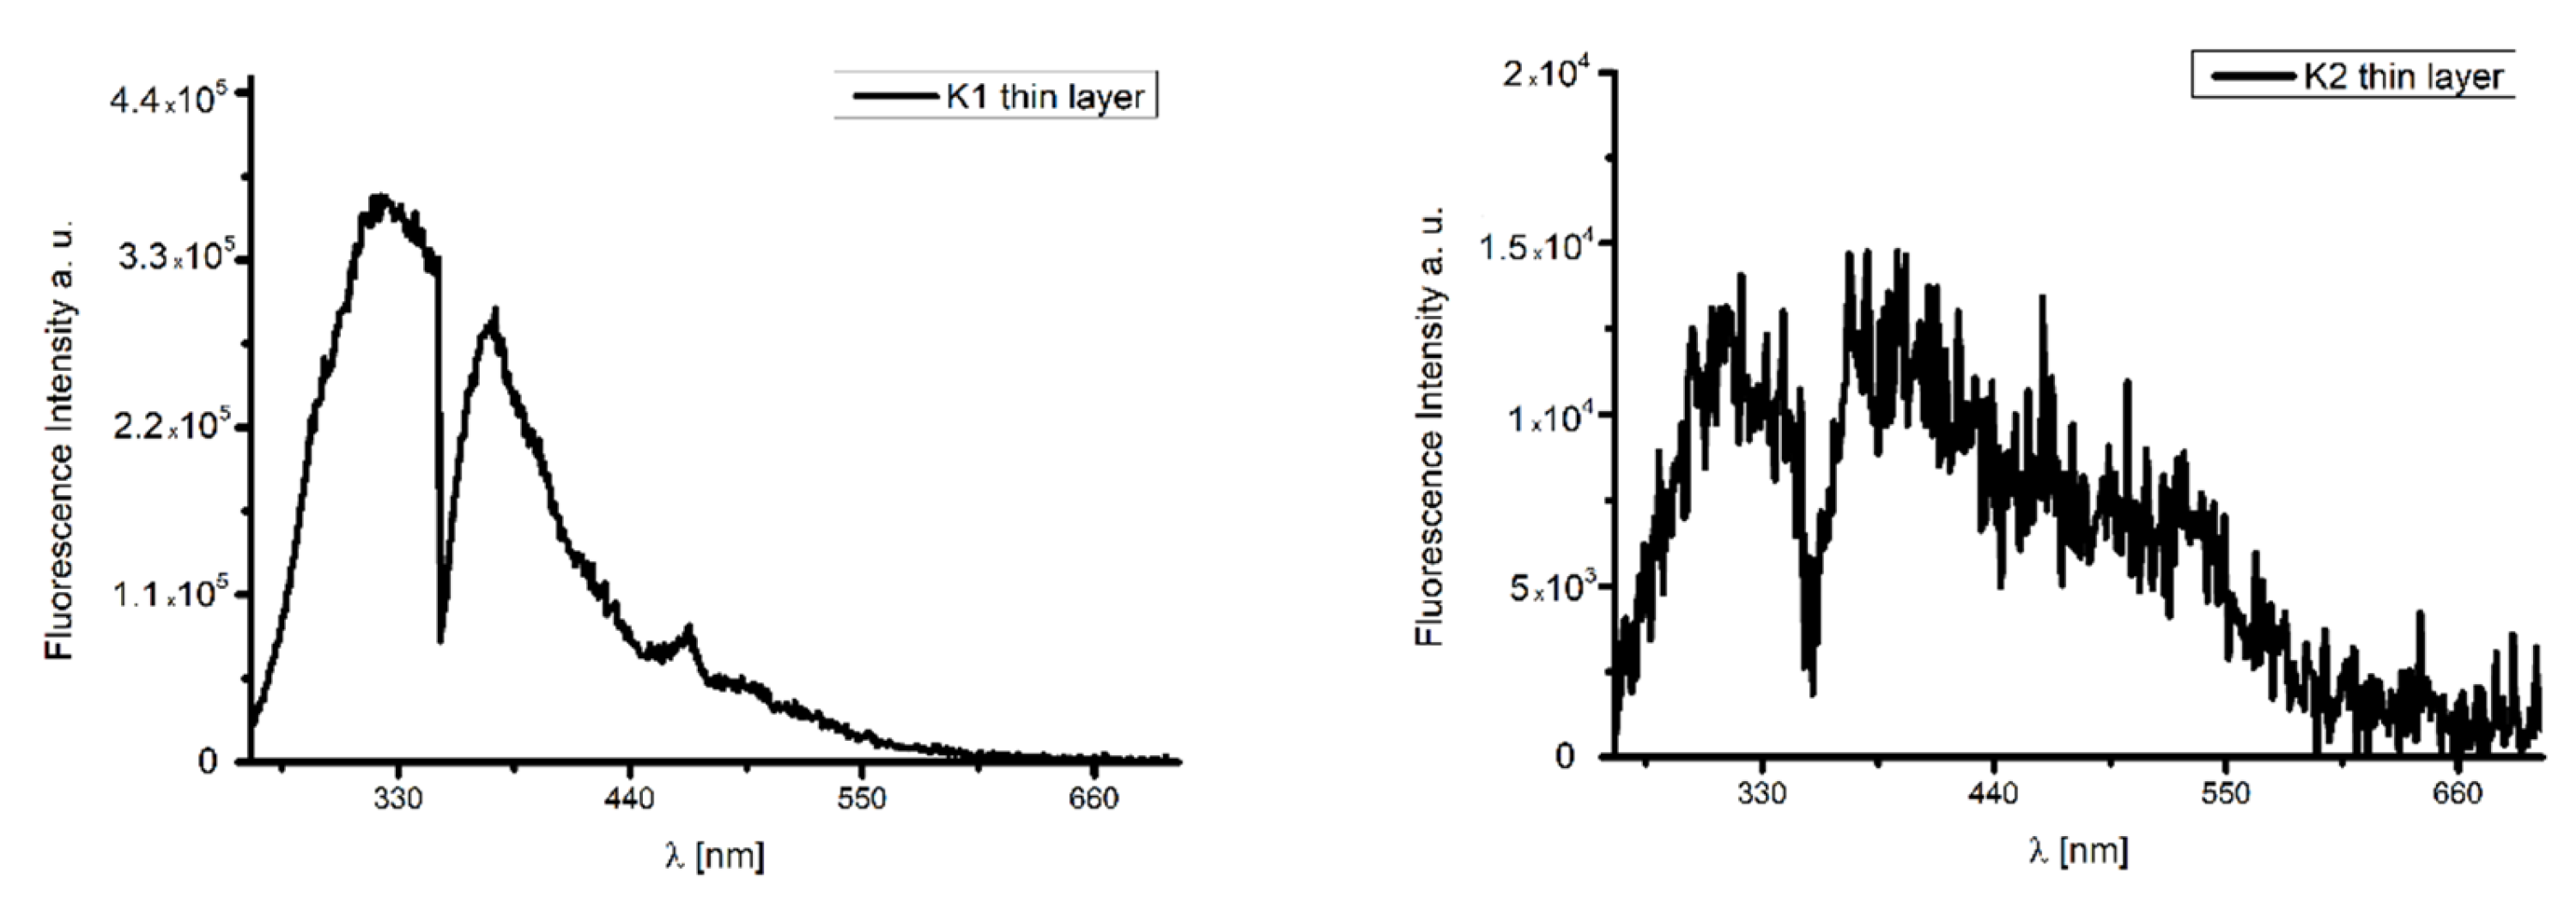
2.7. Thin Materials of Copper(II) Complexes
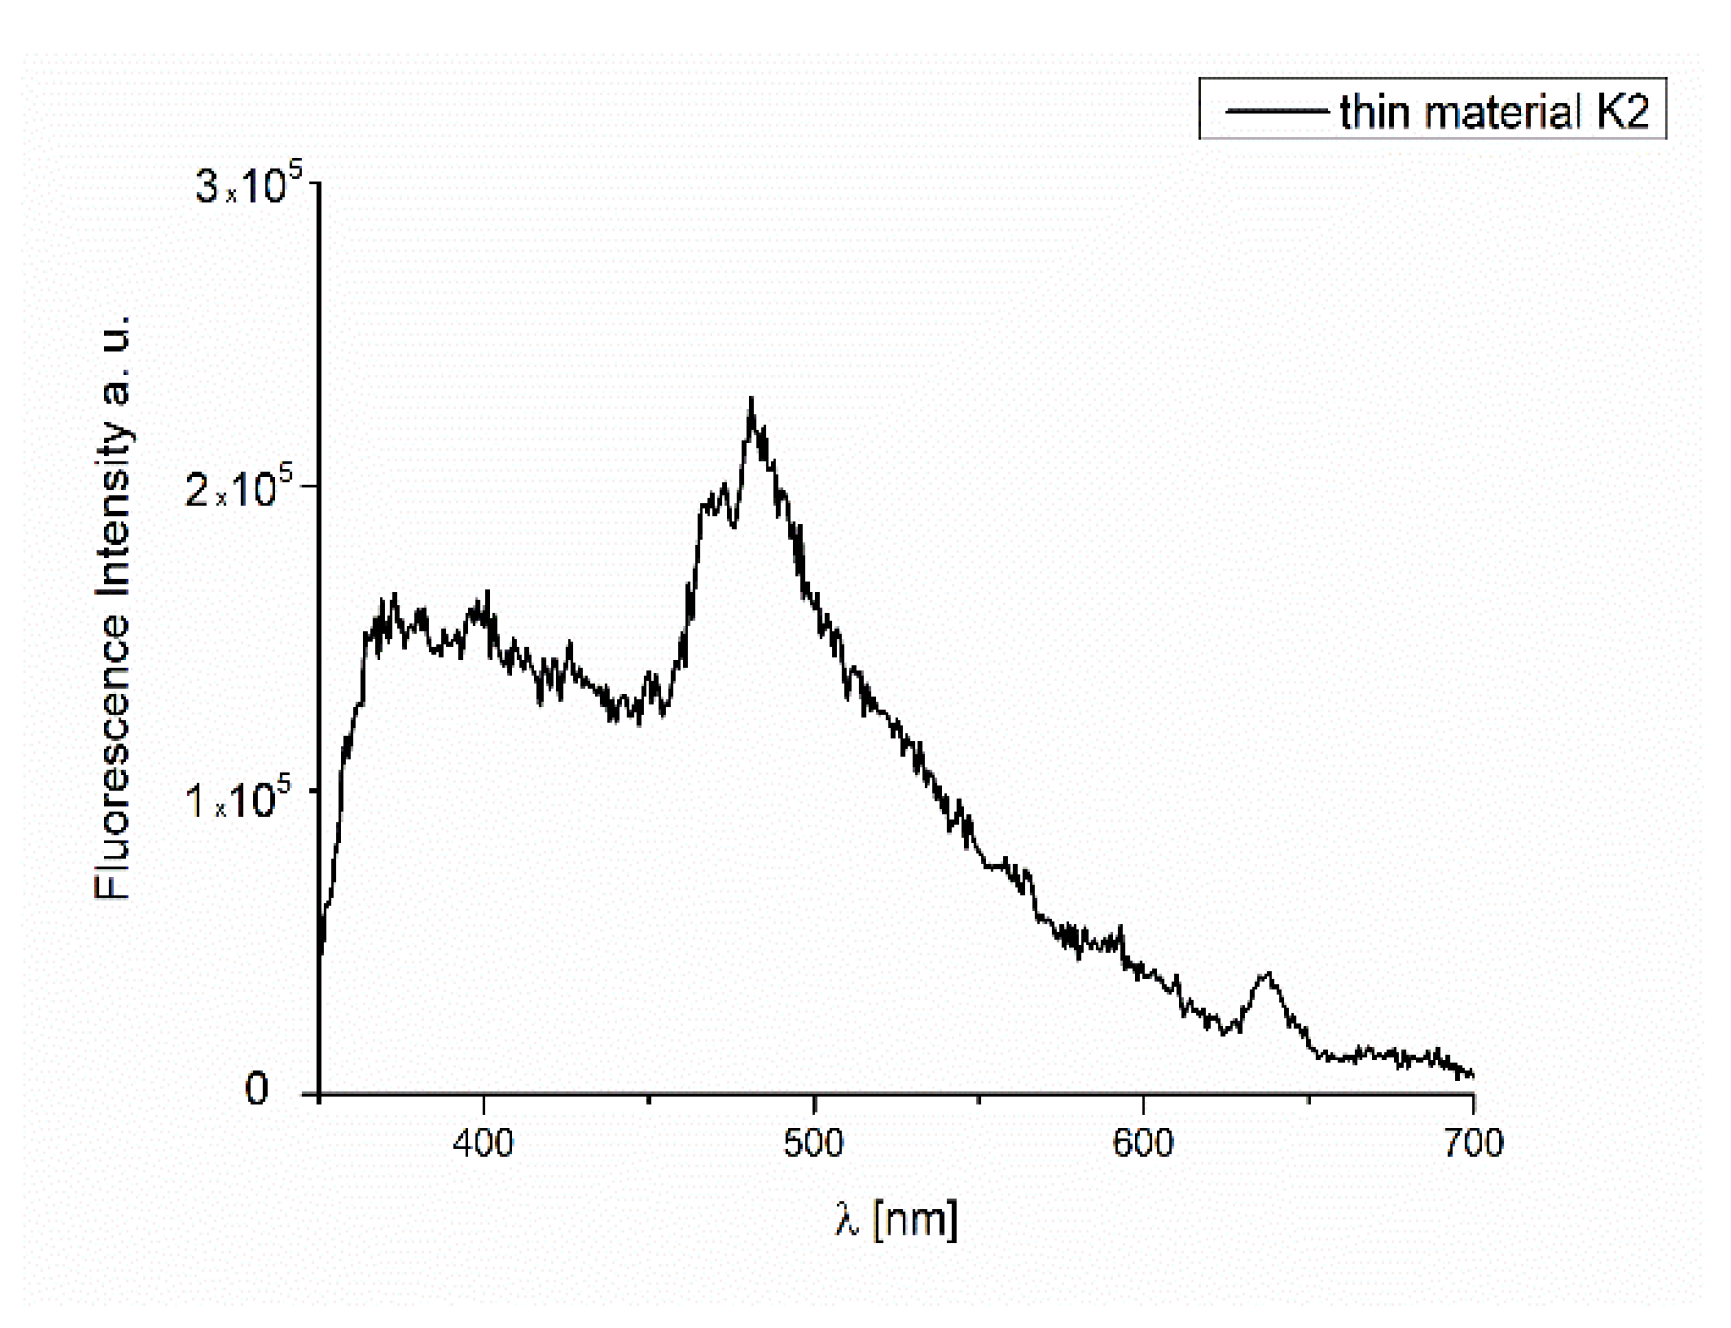
Fluorescence Properties of the Materials
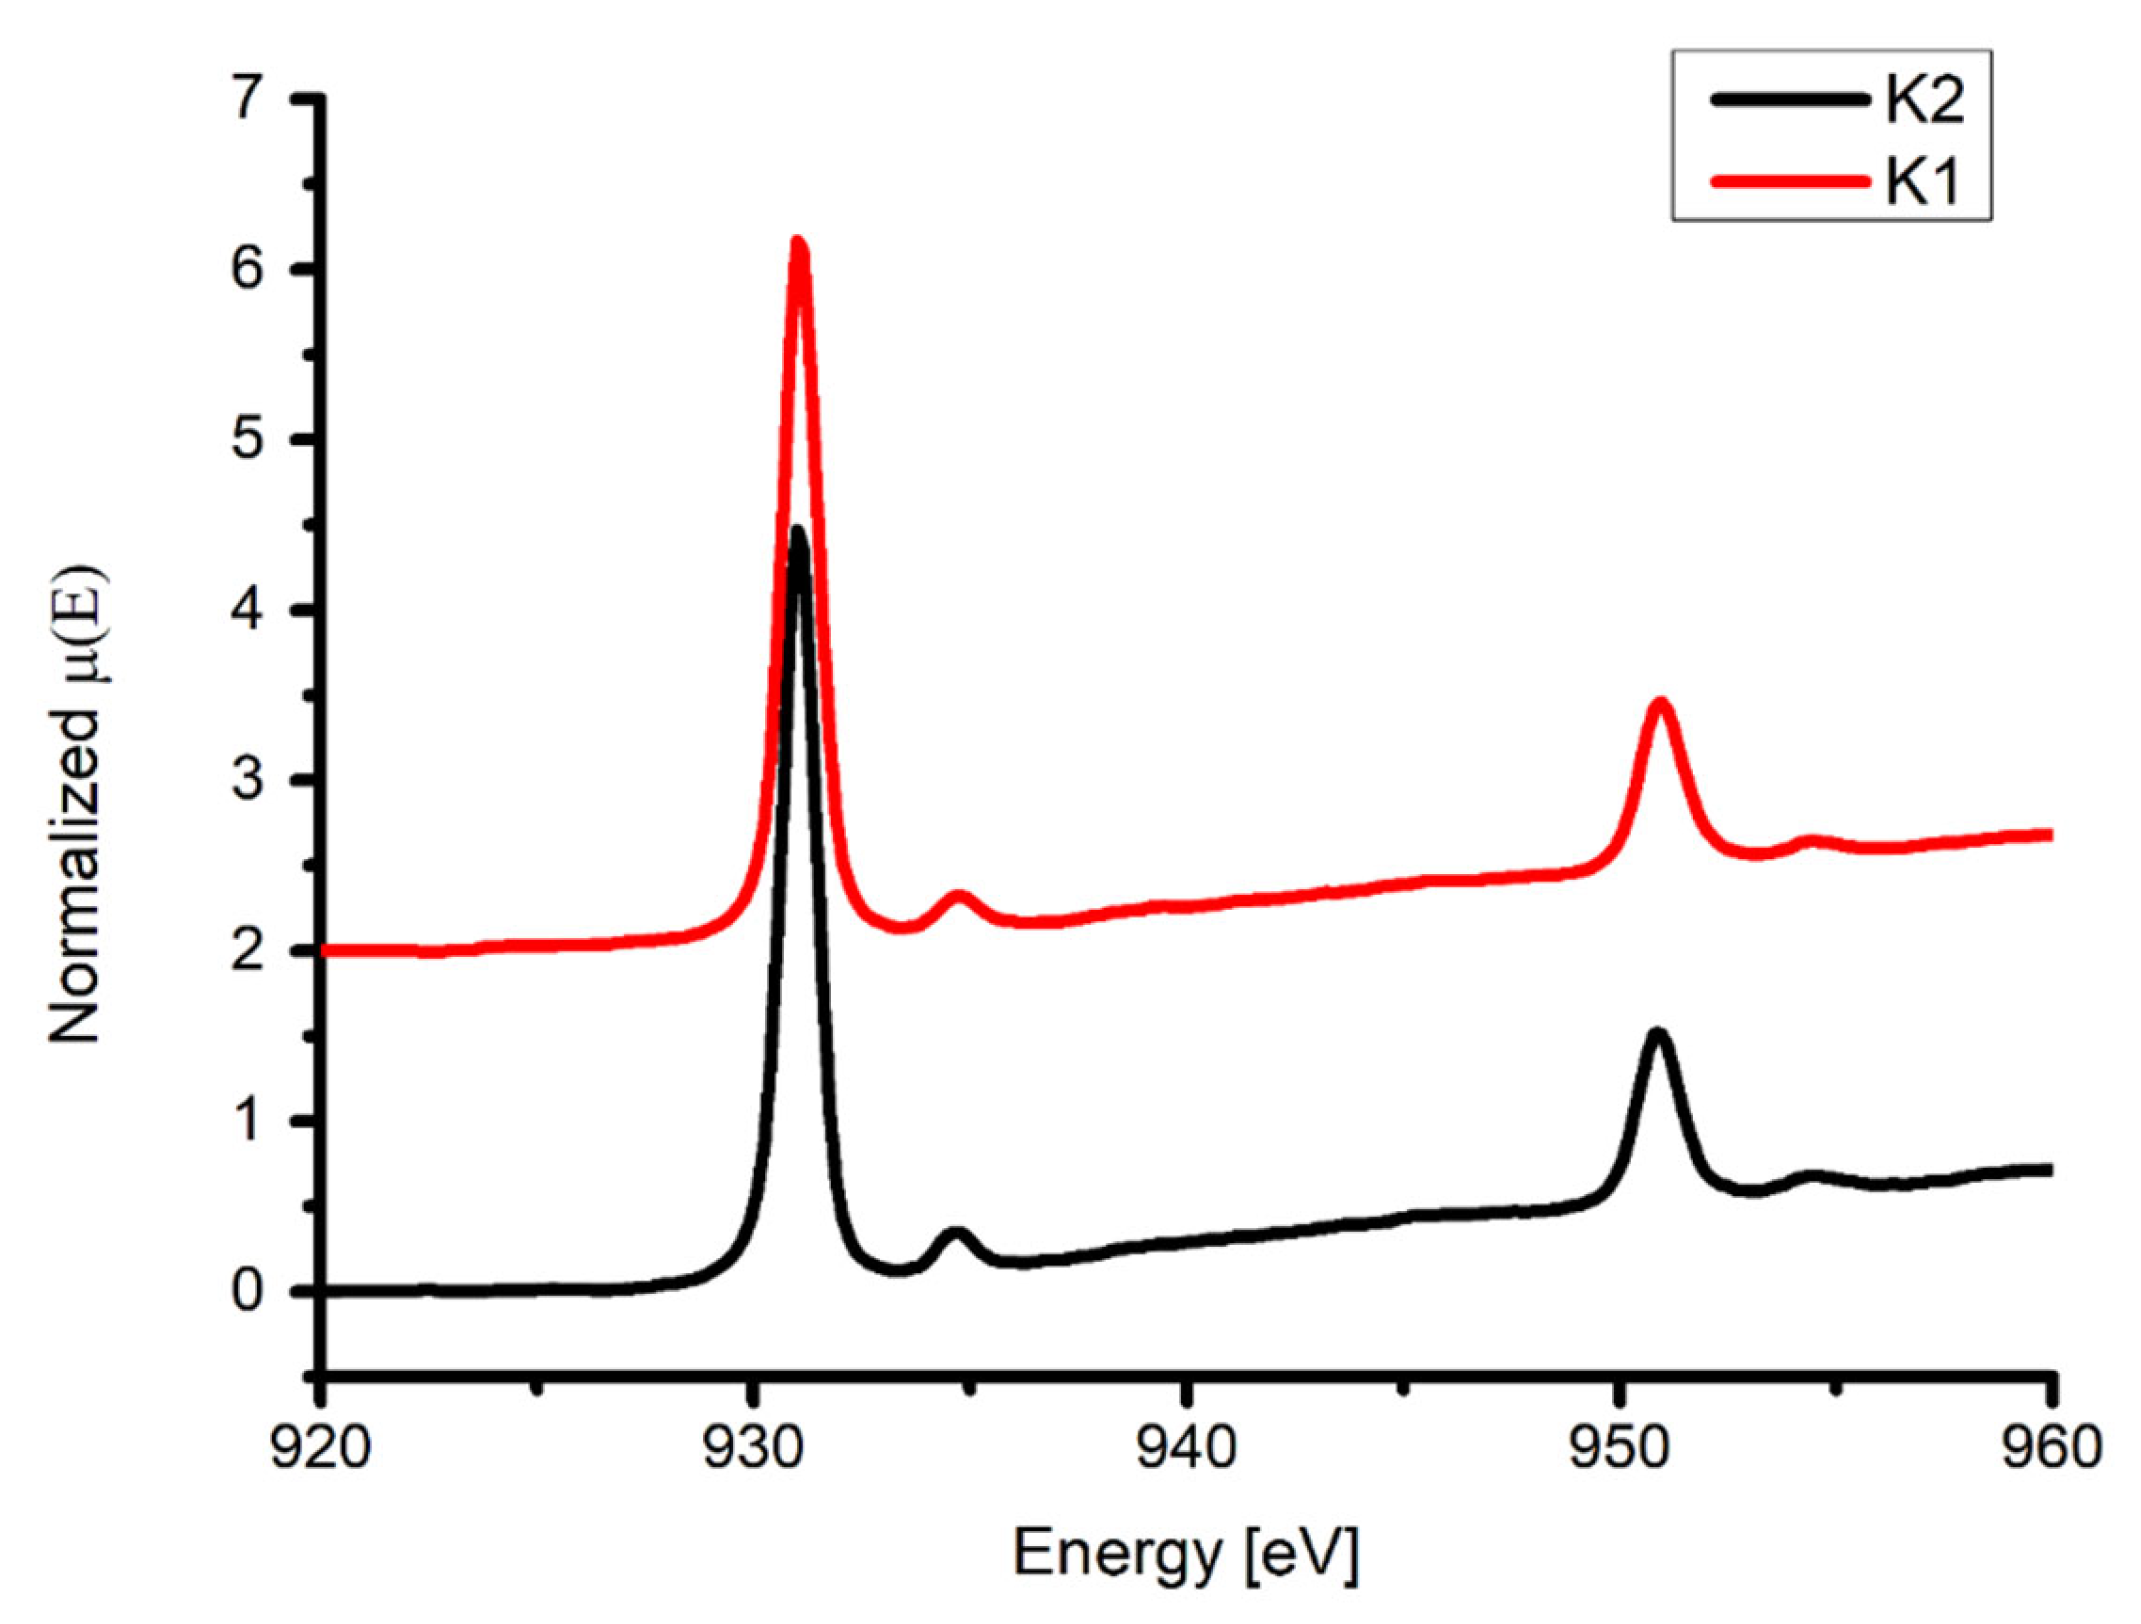
2.8. XAS Analysis
3. Materials and Methods
3.1. Methods and Instrumentation
3.1.1. Spin Coating
3.1.2. Thermal Vapor Deposition
3.2. Crystal Structure Determination
3.3. SQUID Measurements
3.4. EPR Measurements
3.5. Theoretical Calculations
3.6. XAS
4. Experimental
Synthesis of Complexes
- K1
- K2
5. Conclusions
Supplementary Materials
Author Contributions
Funding
Institutional Review Board Statement
Informed Consent Statement
Data Availability Statement
Acknowledgments
Conflicts of Interest
References
- Liu, X.; Hamon, J.R. Recent developments in penta-, hexa- and heptadentate Schiff base ligands and their metal complexes. Coord. Chem. Rev. 2019, 389, 94–118. [Google Scholar] [CrossRef]
- Gregoliński, J.; Ślepokura, K.; Kłak, J.; Witwicki, M. Multinuclear Ni(II) and Cu(II) complexes of a meso 6 + 6 macrocyclic amine derived from trans-1,2-diaminocyclopentane and 2,6-diformylpyridine. Dalton Trans. 2022, 51, 9735. [Google Scholar] [CrossRef] [PubMed]
- Vigato, P.; Tamburini, S.; Bertolo, L. The development of compartmental macrocyclic Schiff bases and related polyamine derivatives. Coord. Chem. Rev. 2007, 251, 1311–1492. [Google Scholar] [CrossRef]
- Chang, F.-F.; Zhang, K.; Huang, W. Schiff-base macrocyclic Zn(II) complexes based upon flexible pendant-armed extended dialdehydes. Dalton Trans. 2018, 48, 363–369. [Google Scholar] [CrossRef] [PubMed]
- Löffler, M.; Gregoliñski, J.; Korabik, M.; Lis, T.; Lisowski, J. Multinuclear Ni(II), Cu(II) and Zn(II) complexes of chiral macrocyclic nonaazamine. Dalton Trans. 2016, 45, 15586–15594. [Google Scholar] [CrossRef] [PubMed]
- Das, M.; Mukherjee, S.; Koley, B.; Choudhuri, I.; Bhattacharyya, N.; Roy, P.; Samanta, B.C.; Baraif, M.; Maity, T. Developing novel zinc(II) and copper(II) Schiff base complexes: Combined experimental and theoretical investigation on their DNA/protein binding efficacy and anticancer activity. New J. Chem. 2020, 44, 18347–18361. [Google Scholar] [CrossRef]
- Zhang, J.; Xu, L.; Wong, W.-Y. Energy materials based on metal Schiff base complexes. Coord. Chem. Rev. 2018, 355, 180–198. [Google Scholar] [CrossRef]
- Janczak, J.; Prochowicz, D.; Lewiński, J.; Fairen-Jimenez, D.; Bereta, T.; Lisowski, J. Trinuclear cage-like ZnII macrocyclic complexes: Enantiomeric recognition and gas adsorption properties. Eur. J. Chem. 2016, 22, 598–609. [Google Scholar] [CrossRef]
- Zhang, X.; Yin, J.; Yoon, J. Recent Advances in Development of Chiral Fluorescent and Colorimetric Sensors. Chem. Rev. 2014, 114, 4918–4959. [Google Scholar] [CrossRef]
- Li, Z.-B.; Lin, J.; Sabat, M.; Hyacinth, M.; Pu, L. Enantioselective Fluorescent Recognition of Chiral Acids by Cyclohexane-1,2-diamine-Based Bisbinaphthyl Molecules. J. Org. Chem. 2007, 72, 4905–4916. [Google Scholar] [CrossRef] [Green Version]
- Liu, X.; Manzur, C.; Novoa, N.; Celedón, S.; Carrillo, D.; Hamon, J.R. Multidentate unsymmetrically-substituted Schiff bases and their metal complexes: Synthesis, functional materials properties, and applications to catalysis. Coord. Chem. Rev. 2018, 357, 144–172. [Google Scholar] [CrossRef]
- Padnya, P.; Shibaeva, K.; Arsenyev, M.; Baryshnikova, S.; Terenteva, O.; Shiabiev, I.; Khannanov, A.; Boldyrev, A.; Gerasimov, A.; Grishaev, D.; et al. Catechol-Containing Schiff Bases on Thiacalixarene: Synthesis, Copper (II) Recognition, and Formation of Organic-Inorganic Copper-Based Materials. Molecules 2021, 26, 2334. [Google Scholar] [CrossRef]
- Che, C.-M.; Huang, J.-S. Metal complexes of chiral binaphthyl Schiff-base ligands and their application in stereoselective organic transformations. Coord. Chem. Rev. 2003, 242, 97–113. [Google Scholar] [CrossRef]
- Shockravi, A.; Javadi, A.; Abouzari-Lotf, E. Binaphthyl-based macromolecules: A review. RSC Adv. 2013, 3, 6717–6746. [Google Scholar] [CrossRef]
- Hajari, S.; Keypour, H.; Rezaei, M.T.; Farida, S.H.M.; Gable, R.W. New 15-membered macrocyclic Schiff base ligand; synthesis some Cd(II), Mn(II) and Zn(II) complexes, crystal structure, cytotoxicity, antibacterial and antioxidant activity. J. Mol. Struct. 2022, 1251, 132049. [Google Scholar] [CrossRef]
- El-Gammal, O.A.; Mohamed, F.S.; Rezk, G.N.; El-Bindary, A.A. Synthesis, characterization, catalytic, DNA binding and antibacterial activities of Co(II), Ni(II) and Cu(II) complexes with new Schiff base ligand. J. Mol. Liq. 2021, 1230, 129908. [Google Scholar] [CrossRef]
- Lee, E.; Lee, S.Y.; Lindoy, L.F.; Lee, S.S. Metallacycles derived from metal complexes of exo-coordinated macrocyclic ligands. Coord. Chem. Rev. 2013, 257, 3125–3138. [Google Scholar] [CrossRef]
- Tokunaga, H.; Kazama, K.; Tsuboi, M.; Miyasaka, M. A novel Schiff base macrocycle based on 1,10 -binaphthyl for fluorescence recognition. Luminescence 2021, 36, 1561–1568. [Google Scholar] [CrossRef]
- Korupoju, S.R.; Mangayarkarasi, N.; Ameerunisha, S.; Valente, E.J.; Zacharias, P.S. Formation of dinuclear macrocyclic and mononuclear acyclic complexes of a new trinucleating hexaaza triphenolic Schiffbase macrocycle: Structure and NLO properties. J. Chem. Soc. Dalton Trans. 2000, 16, 2845–2852. [Google Scholar] [CrossRef]
- Telfer, S.G.; Sato, T.; Harada, T.; Kuroda, R.; Lefebvre, J.; Leznoff, D.B. Mono- and Dinuclear Complexes of Chiral Tri- and Tetradentate Schiff-Base Ligands Derived from 1,1’-Binaphthyl-2,2’-diamine. Inorg. Chem. 2004, 43, 6168–6176. [Google Scholar] [CrossRef]
- Telfer, S.G.; Kuroda, R. 1,1′-Binaphthyl-2,2′-diol and 2,2′-diamino-1,1′-binaphthyl: Versatile frameworks for chiral ligands in coordination and metallosupramolecular chemistry. Coord. Chem. Rev. 2003, 242, 33–46. [Google Scholar] [CrossRef]
- Chinnaraja, E.; Arunachalam, R.; Suresh, E.; Sen, S.K.; Natarajan, R.; Subramanian, P.S. Binuclear Double-Stranded Helicates and Their Catalytic Applications in Desymmetrization of Mesodiols. Inorg. Chem. 2019, 58, 4465–4479. [Google Scholar] [CrossRef]
- Chinnaraja, E.; Arunachalam, R.; Samanta, K.; Natarajan, R.; Subramaniana, P.S. Enantioselective Michael Addition Reaction Catalysed by Enantiopure Binuclear Nickel(II) Close-Ended Helicates. Adv. Synth. Catal. 2020, 362, 1144–1155. [Google Scholar] [CrossRef]
- Chinnaraja, E.; Arunachalam, R.; Pillai, R.S.; Peuronen, A.; Rissanen, K.; Subramanian, P.S. One-pot synthesis of [2+2]-helicate-like macrocycle and 2+4-μ4-oxo tetranuclear open frame complexes: Chiroptical properties and asymmetric oxidative coupling of 2-naphthols. Appl. Organomet. Chem. 2020, 34, e5666. [Google Scholar] [CrossRef]
- Castellano, M.; Ruiz-García, R.; Cano, J.; Ferrando-Soria, J.; Pardo, E.; Fortea-Pérez, F.R.; Stiriba, S.-E.; Julve, M.; Lloret, F. Dicopper(II) Metallacyclophanes as Multifunctional Magnetic Devices: A Joint Experimental and Computational Study. Acc. Chem. Res. 2015, 48, 510–520. [Google Scholar] [CrossRef] [PubMed]
- Ferrando-Soria, J.; Vallejo, J.; Castellano, M.; Martínez-Lillo, J.; Pardo, E.; Cano, J.; Castro, I.; Lloret, F.; Ruiz-García, R.; Julve, M. Molecular magnetism, quo vadis? A historical perspective from a coordination chemist viewpoint. Coord. Chem. Rev. 2017, 339, 17–103. [Google Scholar] [CrossRef]
- Žilić, D.; Rakvin, B.; Milić, D.; Pajić, D.; Đilović, I.; Camettid, M.; Džolić, Z. Crystal structures and magnetic properties of a set of dihalo-bridged oxalamidato copper(II) dimers. Dalton Trans. 2014, 43, 11877–11887. [Google Scholar] [CrossRef] [PubMed]
- Brown, S.J.; Tao, X.; Wark, T.A.; Stephan, D.W.; Mascharak, P.K. Synthetic analog approach to metallobleomycins. 4. New halobridged dimeric and polymeric (infinite zigzag chain) complexes of copper(II) with peptide ligands related to bleomycins. Inorg. Chem. 1988, 27, 1581–1587. [Google Scholar] [CrossRef]
- Sena, N.; Butcher, J.R.; Jasinski, J.P.; Gupta, S.K. A novel single-pot synthesis of dinuclear and mononuclear copper(II) complexes with sterically demanding Schiff bases: Structural, spectral, magnetic, electrochemical, DNA binding and theoretical investigation. J. Mol. Struct. 2021, 1231, 129955. [Google Scholar] [CrossRef]
- Chattopadhyay, T.; Banu, K.S.; Banerjee, A.; Ribas, J.; Majee, A.; Nethaji, M.; Das, D. A novel single pot synthesis of binuclear copper(II) complexes of macrocyclic and macrocyclic compartmental ligands: Structures and magnetic properties. J. Mol. Struct. 2007, 833, 13–22. [Google Scholar] [CrossRef]
- Thompson, K.; Mandal, S.K.; Tandon, S.S.; Bridson, J.N.; Park, M.K. Magnetostructural Correlations in Bis(µ2-phenoxide)-Bridged Macrocyclic Dinuclear Copper(II) Complexes. Influence of Electron-Withdrawing Substituents on Exchange Coupling Laurence. Inorg. Chem. 1996, 35, 3117–3125. [Google Scholar] [CrossRef]
- Addison, A.W.; Rao, T.N.; Reedijk, J.; van Rijn, J.; Verschoor, G.C. Synthesis, structure, and spectroscopic properties of copper(II) compounds containing nitrogen–sulphur donor ligands; the crystal and molecular structure of aqua[1,7-bis(N-methylbenzimidazol-2′-yl)-2,6-dithiaheptane]copper(II) perchlorate. J. Chem. Soc. Dalton Trans. 1984, 7, 1349. [Google Scholar] [CrossRef]
- Llunel, M.; Casanova, D.; Cirera, J.; Bofill, J.M.; Alemany, P.; Alvarez, S.; Pinsky, M.; Avnir, D. SHAPE, Version 2.1; Program for the Calculations of Continuous Shape Measures of Polygonal and Polyhedral Molecular Fragments; University of Barcelona: Barcelona, Spain, 2013. [Google Scholar]
- Dolomanov, O.V.; Bourhis, L.J.; Gildea, R.J.; Howard, J.A.K.; Puschmann, H. OLEX2: A complete structure solution, refinement and analysis program. J. Appl. Cryst. 2009, 42, 339–341. [Google Scholar] [CrossRef]
- Chilton, N.F.; Anderson, R.P.; Turner, L.D.; Soncini, A.; Murray, K.S.J. PHI: A powerful new program for the analysis of anisotropic monomeric and exchange-coupled polynuclear d- and f-block complexes. Comput. Chem. 2013, 34, 1164–1175. [Google Scholar] [CrossRef]
- Kahn, O. Molecular Magnetism; VCH: New York, NY, USA, 1993; Chapter 8; p. 160. [Google Scholar]
- Ruiz, E.; Cano, J.; Alvarez, S.; Alemany, P. Broken symmetry approach to calculation of exchange coupling constants for homobinuclear and heterobinuclear transition metal complexes. J. Comput Chem. 1999, 20, 1391–1400. [Google Scholar] [CrossRef]
- Maślewski, P.; Wyrzykowski, D.; Witwicki, M.; Dołęga, A. Histaminol and Its Complexes with Copper(II)—Studies in Solid State and Solution. Eur. J. Inorg. Chem. 2018, 2018, 1399–1408. [Google Scholar] [CrossRef]
- Mielcarek, A.; Bieńko, A.; Saramak, P.; Jezierska, J.; Dołęga, A. A Cu/Zn heterometallic complex with solvent-binding cavity, catalytic activity for the oxidation of 1-phenylethanol and unusual magnetic properties. Dalton Trans. 2019, 48, 17780. [Google Scholar] [CrossRef]
- Peisach, J.; Blumberg, W.E. Structural implications derived from the analysis of electron paramagnetic resonance spectra of natural and artificial copper proteins. Arch. Biochem. Biophys. 1974, 165, 691. [Google Scholar] [CrossRef]
- Barwiolek, M.; Kaczmarek-Kędziera, A.; Muziol, T.M.; Jankowska, D.; Jezierska, J.; Bieńko, A. Dinuclear Copper(II) Complexes with Schiff Bases Derived from 2-Hydroxy-5-Methylisophthalaldehyde and Histamine or 2-(2-Aminoethyl)pyridine and Their Application as Magnetic and Fluorescent Materials in Thin Film Deposition. Int. J. Mol. Sci. 2020, 21, 4587. [Google Scholar] [CrossRef]
- Buvailo, H.I.; Makhankova, V.G.; Kokozay, V.N.; Babaryk, A.A.; Omelchenko, I.V.; Shishkina, S.V.; Bienko, D.C.; Jezierska, J.; Bienko, A. Hybrid Cu-Containing Compounds Based on Lacunary Strandberg Anions: Synthesis under Mild Conditions, Crystal Structure, and Magnetic Properties. Inorg. Chem. 2022, 61, 5701–5714. [Google Scholar] [CrossRef]
- Buvaylo, E.A.; Kokozay, V.N.; Makhankova, V.G.; Melnyk, A.K.; Korabik, M.; Witwicki, M.; Skelton, B.W.; Vassilyeva, O.Y. Synthesis, Characterization, and Magnetic Properties of a Series of Copper(II) Chloride Complexes of Pyridyliminebenzoic Acids. Eur. J. Inorg. Chem. 2018, 2018, 1603–1619. [Google Scholar] [CrossRef]
- Reichardt, C. Solvents and Solvent Effects in Organic Chemistry; Wiley: Hoboken, NJ, USA, 2003; ISBN 3-527-30618-8. [Google Scholar]
- Fuenteabla, P.; Seron, L.; Sachez, C.; Manzur, J.; Paredes-Garcia, V.; Pizzaro, N.; Cepeda, M.; Venegaz-Yazigi, D.; Spodine, E. Macrocyclic ZnII and CuII complexes as guests of the hybrid composites based on the layered MnPS3 phase. Comparison of spectroscopic properties. J. Coord. Chem. 2014, 67, 23–24, 3894–3908. [Google Scholar] [CrossRef]
- Brudenell, S.J.; Spiccia, L.; Tiekink, E.R.T. Binuclear Copper(II) Complexes of Bis(pentadentate) Ligands Derived from Alkyl-Bridged Bis(1,4,7-triazacyclonane) Macrocycles. Inorg. Chem. 1996, 35, 1974–1979. [Google Scholar] [CrossRef]
- Chinnaraja, E.; Arunachalam, R.; Subramanian, P.S. Enantio- and Diastereoselective Synthesis of b-Nitroalcohol via Henry Reaction Catalyzed by Cu(II), Ni(II), Zn(II) Complexes of Chiral BINIM Ligands. Chem. Select 2016, 1, 5331–5338. [Google Scholar] [CrossRef]
- Grzybowski, J.J.; Merrell, P.H.; Urbach, F.L. Dicopper(II) Complexes with Binucleating Ligands Derived from 2-Hydroxy-5-methylisophthaldehyde and 2-(2-aminoethyl)pyridine. Inorg. Chem. 1978, 17, 3078–3082. [Google Scholar] [CrossRef]
- Roznyatovsky, V.V.; Borisova, N.E.; Reshetova, M.D.; Ustynyuk, Y.A.; Aleksandrov, G.G.; Eremenko, I.; Moiseev, I.I. Dinuclear and polynuclear transition metal complexes with macrocyclic ligands. 6. New dinuclear copper(II) complexes with macrocyclic Schiff bases derived from 4-tert-butyl-2,6-diformylphenol. Russ. Chem. Bull. 2004, 53, 1208–1217. [Google Scholar] [CrossRef]
- Qing, S.; Qiao-Lin, W.; Guang-Hua, L.; Xiao-Ming, L.; Ying, M. Bis-salicylaldiminato zinc complexes: Syntheses, characterization and luminescent properties. Polyhedron 2007, 26, 5053–5060. [Google Scholar] [CrossRef]
- Fan, J.; Autschbach, J.; Ziegler, T. Electronic Structure and Circular Dichroism of Tris(bipyridyl) Metal Complexes within Density Functional Theory. Inorg. Chem. 2010, 49, 1355. [Google Scholar] [CrossRef]
- Enamullah, M.; Uddin, A.K.M.R.; Pescitelli, G.; Berardozzi, R.; Makhloufi, G.; Vasylyeva, V.; Chamayou, A.-C.; Janiak, C. Induced chirality-at-metal and diastereoselectivity at Δ/Λ-configured distorted square-planar copper complexes by enantiopure Schiff base ligands: Combined circular dichroism, DFT and X-ray structural studies. Dalton Trans. 2014, 43, 3313. [Google Scholar] [CrossRef]
- Ahmed, N.; Tripathi, S.; Sarkar, A.; Ansari, K.U.; Das, C.; Prajesh, N.; Horike, S.; Boomishankar, R.; Shanmugam, M. Chiral tetranuclear copper(II) complexes: Synthesis, optical and magnetic properties. New J. Chem. 2020, 44, 16845. [Google Scholar] [CrossRef]
- Barwiolek, M.; Jankowska, D.; Kaczmarek-Kędziera, A.; Wojtulewski, S.; Skowroński, L.; Rerek, T.; Popielarski, P.; Muziol, T.M. Experimental and Theoretical Studies of the Optical Properties of the Schiff Bases and Their Materials Obtained from o-Phenylenediamine. Molecules 2022, 27, 7396. [Google Scholar] [CrossRef] [PubMed]
- Basumallick, L.; George, S.D.; Randall, D.W.; Hedman, B.; Hodgson, K.O.; Fujisawa, K.; Solomon, E.I. Spectroscopic comparison of the five-coordinate [Cu(SMeIm)(HB(3,5-iPr2pz)3)] with the four-coordinate [Cu(SCPh3)(HB(3,5-iPr2pz)3)]: Effect of coordination number increase on a blue copper type site. Inorg. Chim. Acta 2002, 33, 357–365. [Google Scholar] [CrossRef]
- Muzioł, T.M.; Tereba, N.; Podgajny, R.; Kedziera, D.; Wrzeszcz, G. Solvent-assisted structural conversion involving bimetallic complexes based on the Tris(Oxalato)Ferrate(III) unit with the green blue red crystal color sequence. Dalton Trans. 2019, 48, 11536–11546. [Google Scholar] [CrossRef] [PubMed]
- Muzioł, T.M.; Tereba, N.; Podgajny, R.; Pełka, R.; Czernia, D.; Wiśniewski, M.; Koter, S.; Wrzeszcz, G. Sorption and Magnetic Properties of Oxalato-Based Trimetallic Open Framework Stabilized by Charge-Assisted Hydrogen Bonds. Int. J. Mol. Sci. 2022, 23, 1556. [Google Scholar] [CrossRef] [PubMed]
- Baker, M.L.; Mara, M.W.; Yan, J.J.; Hodgson, K.O.; Hedman, B.; Solomon, E.I. K- and L-edge X-ray Absorption Spectroscopy (XAS) and Resonant Inelastic X-ray Scattering (RIXS) Determination of Differential Orbital Covalency (DOC) of Transition Metal Sites. Coord. Chem. Rev. 2017, 345, 182–208. [Google Scholar] [CrossRef]
- Chainani, A.; Sicot, M.; Fagot-Revurat, Y.; Vasseur, G.; Granet, J.; Kierren, B.; Moreau, L.; Oura, M.; Yamamoto, A.; Tokura, Y.; et al. Evidence for Weakly Correlated Oxygen Holes in the Highest-Tc Cuprate Superconductor HgBa2Ca2Cu3O8+δ. Phys. Rev. Lett. 2017, 119, 57001. [Google Scholar] [CrossRef]
- Pearce, C.I.; Pattrick, R.A.D.; Vaughan, D.J.; Henderson, C.M.B.; van der Laan, G. Copper oxidation state in chalcopyrite: Mixed Cu d9 and d10 characteristics. Geochim. Cosmochim. Acta 2006, 70, 4635–4642. [Google Scholar] [CrossRef]
- Wang, H.; Friedrich, S.; Li, L.; Mao, Z.; Ge, P.; Balasubramanian, M.; Patil, D.S. L-edge sum rule analysis on 3d transition metal sites: From d10 to d0 and towards application to extremely dilute metallo-enzymes. Phys. Chem. Chem. Phys. 2018, 20, 8166. [Google Scholar] [CrossRef]
- Pattrick, R.A.D.; Coker, V.S.; Pearce, C.I. The oxidation state of copper and cobalt in carrollite, CuCo2S4. Can. Mineral. 2008, 46, 1317–1322. [Google Scholar] [CrossRef]
- Sarangi, R.; Aboelella, N.; Fujisawa, K.; Tolman, W.B.; Hedman, B.; Hodgson, K.O.; Solomon, E. X-ray Absorption Edge Spectroscopy and Computational Studies on LCuO2 Species: Superoxide−CuII versus Peroxide−CuIII Bonding. J. Am. Chem. Soc. 2006, 128, 8286–8296. [Google Scholar] [CrossRef] [Green Version]
- George, S.D.; Metz, M.; Szilagyi, R.K.; Wang, H.; Cramer, S.P.; Lu, Y.; Tolman, W.B.; Hedman, B.; Hodgson, K.O.; Solomon, E.I. A Quantitative Description of the Ground-State Wave Function of CuA by X-ray Absorption Spectroscopy: Comparison to Plastocyanin and Relevance to Electron Transfer. J. Am. Chem. Soc. 2001, 123, 5757–5767. [Google Scholar] [CrossRef] [PubMed]
- Oxford Diffraction Ltd. CrysAlis RED and CrysAlis CCD; Oxford Diffraction Ltd.: Abingdon, UK, 2000. [Google Scholar]
- Kabsch, W. XDS. Acta Cryst. 2010, D66, 125–132. [Google Scholar] [CrossRef]
- Krug, M.; Weiss, M.S.; Heinemann, U.; Mueller, U. XDSAPP: A graphical user interface for the convenient processing of diffraction data using XDS. J. Appl. Crystallogr. 2012, 45, 568–572. [Google Scholar] [CrossRef]
- Walker, N.; Stuart, D. An empirical method for correcting diffractometer data for absorption effects. Acta. Cryst. 1983, A39, 158–166. [Google Scholar] [CrossRef]
- Sheldrick, G.M. A short history of SHELX. Acta Crystallogr. Sect. A 2008, 64, 112–122. [Google Scholar] [CrossRef]
- Brandenburg, K. DIAMOND, release 2.1e; Crystal Impact GbR: Bonn, Germany, 2001. [Google Scholar]
- Farrugia, L.J.J. ORTEP-3 for Windows—A version of ORTEP-III with a Graphical User Interface (GUI). Appl. Crystallogr. 1997, 30, 565. [Google Scholar] [CrossRef]
- Bain, G.A.; Berry, J.F. Diamagnetic corrections and Pascal’s constants. J. Chem. Educ. 2008, 85, 532. [Google Scholar] [CrossRef]
- Stoll, S.; Schweiger, A. EasySpin, a Comprehensive Software Package for Spectral Simulation and Analysis in EPR. J. Magn. Reson. 2006, 178, 42–55. [Google Scholar] [CrossRef]
- Stoll, S. CW-EPR Spectral Simulations: Solid State. Methods Enzymol. 2015, 563, 121–142. [Google Scholar] [CrossRef]
- Frisch, M.J.; Trucks, G.W.; Schlegel, H.B.; Scuseria, G.E.; Robb, M.A.; Cheeseman, J.R.; Scalmani, G.; Barone, V.; Petersson, G.A.; Nakatsuji, H.; et al. Gaussian 16, revision B.01; Gaussian, Inc.: Wallingford, CT, USA, 2016. [Google Scholar]
- David, G.; Wennmohs, F.; Neese, F.; Ferre, N. Chemical Tuning of Magnetic Exchange Couplings Using Broken-Symmetry Density Functional Theory. Inorg. Chem. 2018, 57, 12769–12776. [Google Scholar] [CrossRef]
- Bencini, A.; Gatteschi, D.X. Alpha.-SW calculations of the electronic structure and magnetic properties of weakly coupled transition-metal clusters. The [Cu2Cl6]2-dimers. J. Am. Chem. Soc. 1980, 108, 5763. [Google Scholar] [CrossRef] [PubMed]
- Neese, F.; Wennmohs, F.; Becker, U.; Riplinger, C. The ORCA quantum chemistry program package. J. Chem. Phys. 2020, 152, 224108. [Google Scholar] [CrossRef]
- Ravel, B.; Newville, M. ATHENA, ARTEMIS, HEPHAESTUS: Data analysis for x-ray absorption spectroscopy using IFEFFIT. J. Synchrotron Radiat. 2005, 12, 537–541. [Google Scholar] [CrossRef] [PubMed]
- Mueller, U.; Förster, R.; Hellmig, M.; Huschmann, F.U.; Kastner, A.; Malecki, P.; Pühringer, S.; Röwer, M.; Sparta, K.; Steffien, M.; et al. The macromolecular crystallography beamlines at BESSY II of the helmholtz-zentrum Berlin: Current status and perspectives. Eur. Phys. J. Plus 2015, 130, 141–150. [Google Scholar] [CrossRef]


| (K1) | |||
|---|---|---|---|
| Cu(1)-N(1) | 1.917(11) | Cu(2)-O(49) | 2.053(8) |
| Cu(1)-O(22) | 1.944(8) | Cu(2)-N(28) | 2.069(9) |
| Cu(1)-O(49) | 1.974(6) | Cu(2)-Cl(2) | 2.363(2) |
| Cu(1)-N(20) | 2.034(10) | ||
| Cu(1)-Cl(1) | 2.495(3) | ||
| Cu(2)-O(22) | 1.923(7) | ||
| Cu(2)-N(47) | 1.954(9) | ||
| Valence angles (°) | |||
| N(1)-Cu(1)-O(22) | 168.5(3) | O(49)-Cu(1)-Cl(1) | 121.48(18) |
| N(1)-Cu(1)-O(49) | 92.4(3) | N(20)-Cu(1)-Cl(1) | 95.0(3) |
| O(22)-Cu(1)-O(49) | 76.2(3) | O(22)-Cu(2)-N(47) | 165.5(3) |
| N(1)-Cu(1)-N(20) | 101.8(4) | O(22)-Cu(2)-O(49) | 74.8(3) |
| O(22)-Cu(1)-N(20) | 87.5(4) | N(47)-Cu(2)-O(49) | 91.0(3) |
| O(49)-Cu(1)-N(20) | 140.3(3) | O(22)-Cu(2)-N(28) | 89.3(3) |
| N(1)-Cu(1)-Cl(1) | 92.7(2) | N(47)-Cu(2)-N(28) | 98.8(3) |
| O(22)-Cu(1)-Cl(1) | 93.2(2) | O(49)-Cu(2)-N(28) | 134.7(3) |
| K2 | |||
|---|---|---|---|
| Cu(1)-O(22) | 1.920(5) | Cu(2)-O(49) | 1.989(5) |
| Cu(1)-N(1) | 1.953(6) | Cu(2)-N(28) | 2.061(6) |
| Cu(1)-O(49) | 2.047(5) | Cu(2)-Cl(2) | 2.370(3) |
| Cu(1)-N(20) | 2.078(5) | ||
| Cu(1)-Cl(1) | 2.302(3) | ||
| Cu(2)-O(22) | 1.900(5) | ||
| Cu(2)-N(47) | 1.954(7) | ||
| Valence angles (°) | |||
| O(22)-Cu(1)-N(1) | 165.2(2) | O(49)-Cu(1)-Cl(1) | 115.4(2) |
| O(22)-Cu(1)-O(49) | 75.1(2) | N(20)-Cu(1)-Cl(1) | 113.60(19) |
| N(1)-Cu(1)-O(49) | 90.4(2) | O(22)-Cu(2)-N(47) | 165.0(3) |
| O(22)-Cu(1)-N(20) | 87.7(2) | O(22)-Cu(2)-O(49) | 77.0(2) |
| N(1)-Cu(1)-N(20) | 99.3(2) | N(47)-Cu(2)-O(49) | 89.5(3) |
| O(49)-Cu(1)-N(20) | 128.7(3) | O(22)-Cu(2)-N(28) | 87.4(2) |
| O(22)-Cu(1)-Cl(1) | 93.74(19) | N(47)-Cu(2)-N(28) | 98.5(3) |
| N(1)-Cu(1)-Cl(1) | 95.4(2) | O(49)-Cu(2)-N(28) | 137.4(3) |
| Compound | K1 | K2 |
|---|---|---|
| JCu-Cu/cm−1 | −305.66 ± 0.05 | −328.45 ± 0.16 |
| J(SUP) a | −337.0 | −346.5 |
| gCu,avg | 2.020 ± 0.001 | 2.187 ± 0.002 |
| IMP b/% | 11.74 | 12.46 |
| Residual c | 6.35 ± 10−4 | 3.79 ± 10−4 |
| Compound | Energy of Maximum L3-Edge (eV) (L3-Edge Intensity) | Energy of Maximum L2-Edge (eV) (L2-Edge Intensity) |
|---|---|---|
| K1 | 931.0 (4.17) 934.8 (0.33) | 951.0 (1.46) 954.5 (0.65) |
| K2 | 931.0 (4.47) 934.7 (0.35) | 950.9 (1.51) 954.5 (0.68) |
| Identification Code | K1 | K2 |
|---|---|---|
| Empirical formula | C58 H38 Cl2 Cu2 N4 O2 | C64 H52 Cl2 Cu2 N4 O3 |
| Formula weight | 1020.90 | 1123.07 |
| Temperature (K) | 100(2) | 100(2) |
| Wavelength (Å) | 1.54184 | 0.7999 |
| Crystal system, space group | Orthorhombic, P21212 | Orthorhombic, P212121 |
| Unit cell dimensions (Å) and (°) | a = 10.6153(3) α = 90 b = 22.3313(15) β = 90 c = 22.9053(11) γ = 90 | a = 10.922(2) α = 90 b = 19.448(4) β = 90 c = 26.041(5) γ = 90 |
| Volume (Å3) | 5429.8(5) | 5531.4(19) |
| Z, Calculated density (Mg⋅m–3) | 4, 1.249 | 4, 1.349 |
| Absorption coefficient (mm–1) | 2.207 | 1.262 |
| F(000) | 2088 | 2302 |
| Crystal size (mm3) | 0.150 × 0.050 × 0.030 | 0.170 × 0.070 × 0.070 |
| Theta range for data collection (°) | 2.764 to 68.243 | 1.471 to 28.430 |
| Limiting indices | −10 ≤ h ≤ 12 −26 ≤ k ≤ 26 −27 ≤ l ≤ 27 | −12 ≤ h ≤ 12 −23 ≤ k ≤ 23 −30 ≤ l ≤ 30 |
| Reflections collected/unique | 36173/9932 (R(int) = 0.0997) | 61117/9714 (R(int) = 0.0538) |
| Completeness to theta = 29.732° (%) | 99.8 | 99.5 |
| Max. and min. transmission | 1.000 and 0.672 | 0.8864 and 0.2903 |
| Refinement method | Full-matrix least-squares on F2 | Full-matrix least-squares on F2 |
| Data/restraints/parameters | 9932/13/617 | 9714/18/679 |
| Goodness-of-fit on F2 | 0.979 | 1.068 |
| Final R indices (I > 2sigma(I)) | R1 = 0.0795, wR2 = 0.1930 | R1 = 0.0581, wR2 = 0.1449 |
| R indices (all data) | R1 = 0.1161, wR2 = 0.2166 | R1 = 0.0664, wR2 = 0.1501 |
| Largest diff. peak and hole (eÅ–3) | 1.420 and −0.434 | 0.602 and −0.481 |
Disclaimer/Publisher’s Note: The statements, opinions and data contained in all publications are solely those of the individual author(s) and contributor(s) and not of MDPI and/or the editor(s). MDPI and/or the editor(s) disclaim responsibility for any injury to people or property resulting from any ideas, methods, instructions or products referred to in the content. |
© 2023 by the authors. Licensee MDPI, Basel, Switzerland. This article is an open access article distributed under the terms and conditions of the Creative Commons Attribution (CC BY) license (https://creativecommons.org/licenses/by/4.0/).
Share and Cite
Barwiolek, M.; Jankowska, D.; Kaczmarek-Kędziera, A.; Lakomska, I.; Kobylarczyk, J.; Podgajny, R.; Popielarski, P.; Masternak, J.; Witwicki, M.; Muzioł, T.M. New Dinuclear Macrocyclic Copper(II) Complexes as Potentially Fluorescent and Magnetic Materials. Int. J. Mol. Sci. 2023, 24, 3017. https://doi.org/10.3390/ijms24033017
Barwiolek M, Jankowska D, Kaczmarek-Kędziera A, Lakomska I, Kobylarczyk J, Podgajny R, Popielarski P, Masternak J, Witwicki M, Muzioł TM. New Dinuclear Macrocyclic Copper(II) Complexes as Potentially Fluorescent and Magnetic Materials. International Journal of Molecular Sciences. 2023; 24(3):3017. https://doi.org/10.3390/ijms24033017
Chicago/Turabian StyleBarwiolek, Magdalena, Dominika Jankowska, Anna Kaczmarek-Kędziera, Iwona Lakomska, Jedrzej Kobylarczyk, Robert Podgajny, Paweł Popielarski, Joanna Masternak, Maciej Witwicki, and Tadeusz M. Muzioł. 2023. "New Dinuclear Macrocyclic Copper(II) Complexes as Potentially Fluorescent and Magnetic Materials" International Journal of Molecular Sciences 24, no. 3: 3017. https://doi.org/10.3390/ijms24033017