
A Dual Role for FADD in Human Precursor T-Cell Neoplasms
 , , , , and
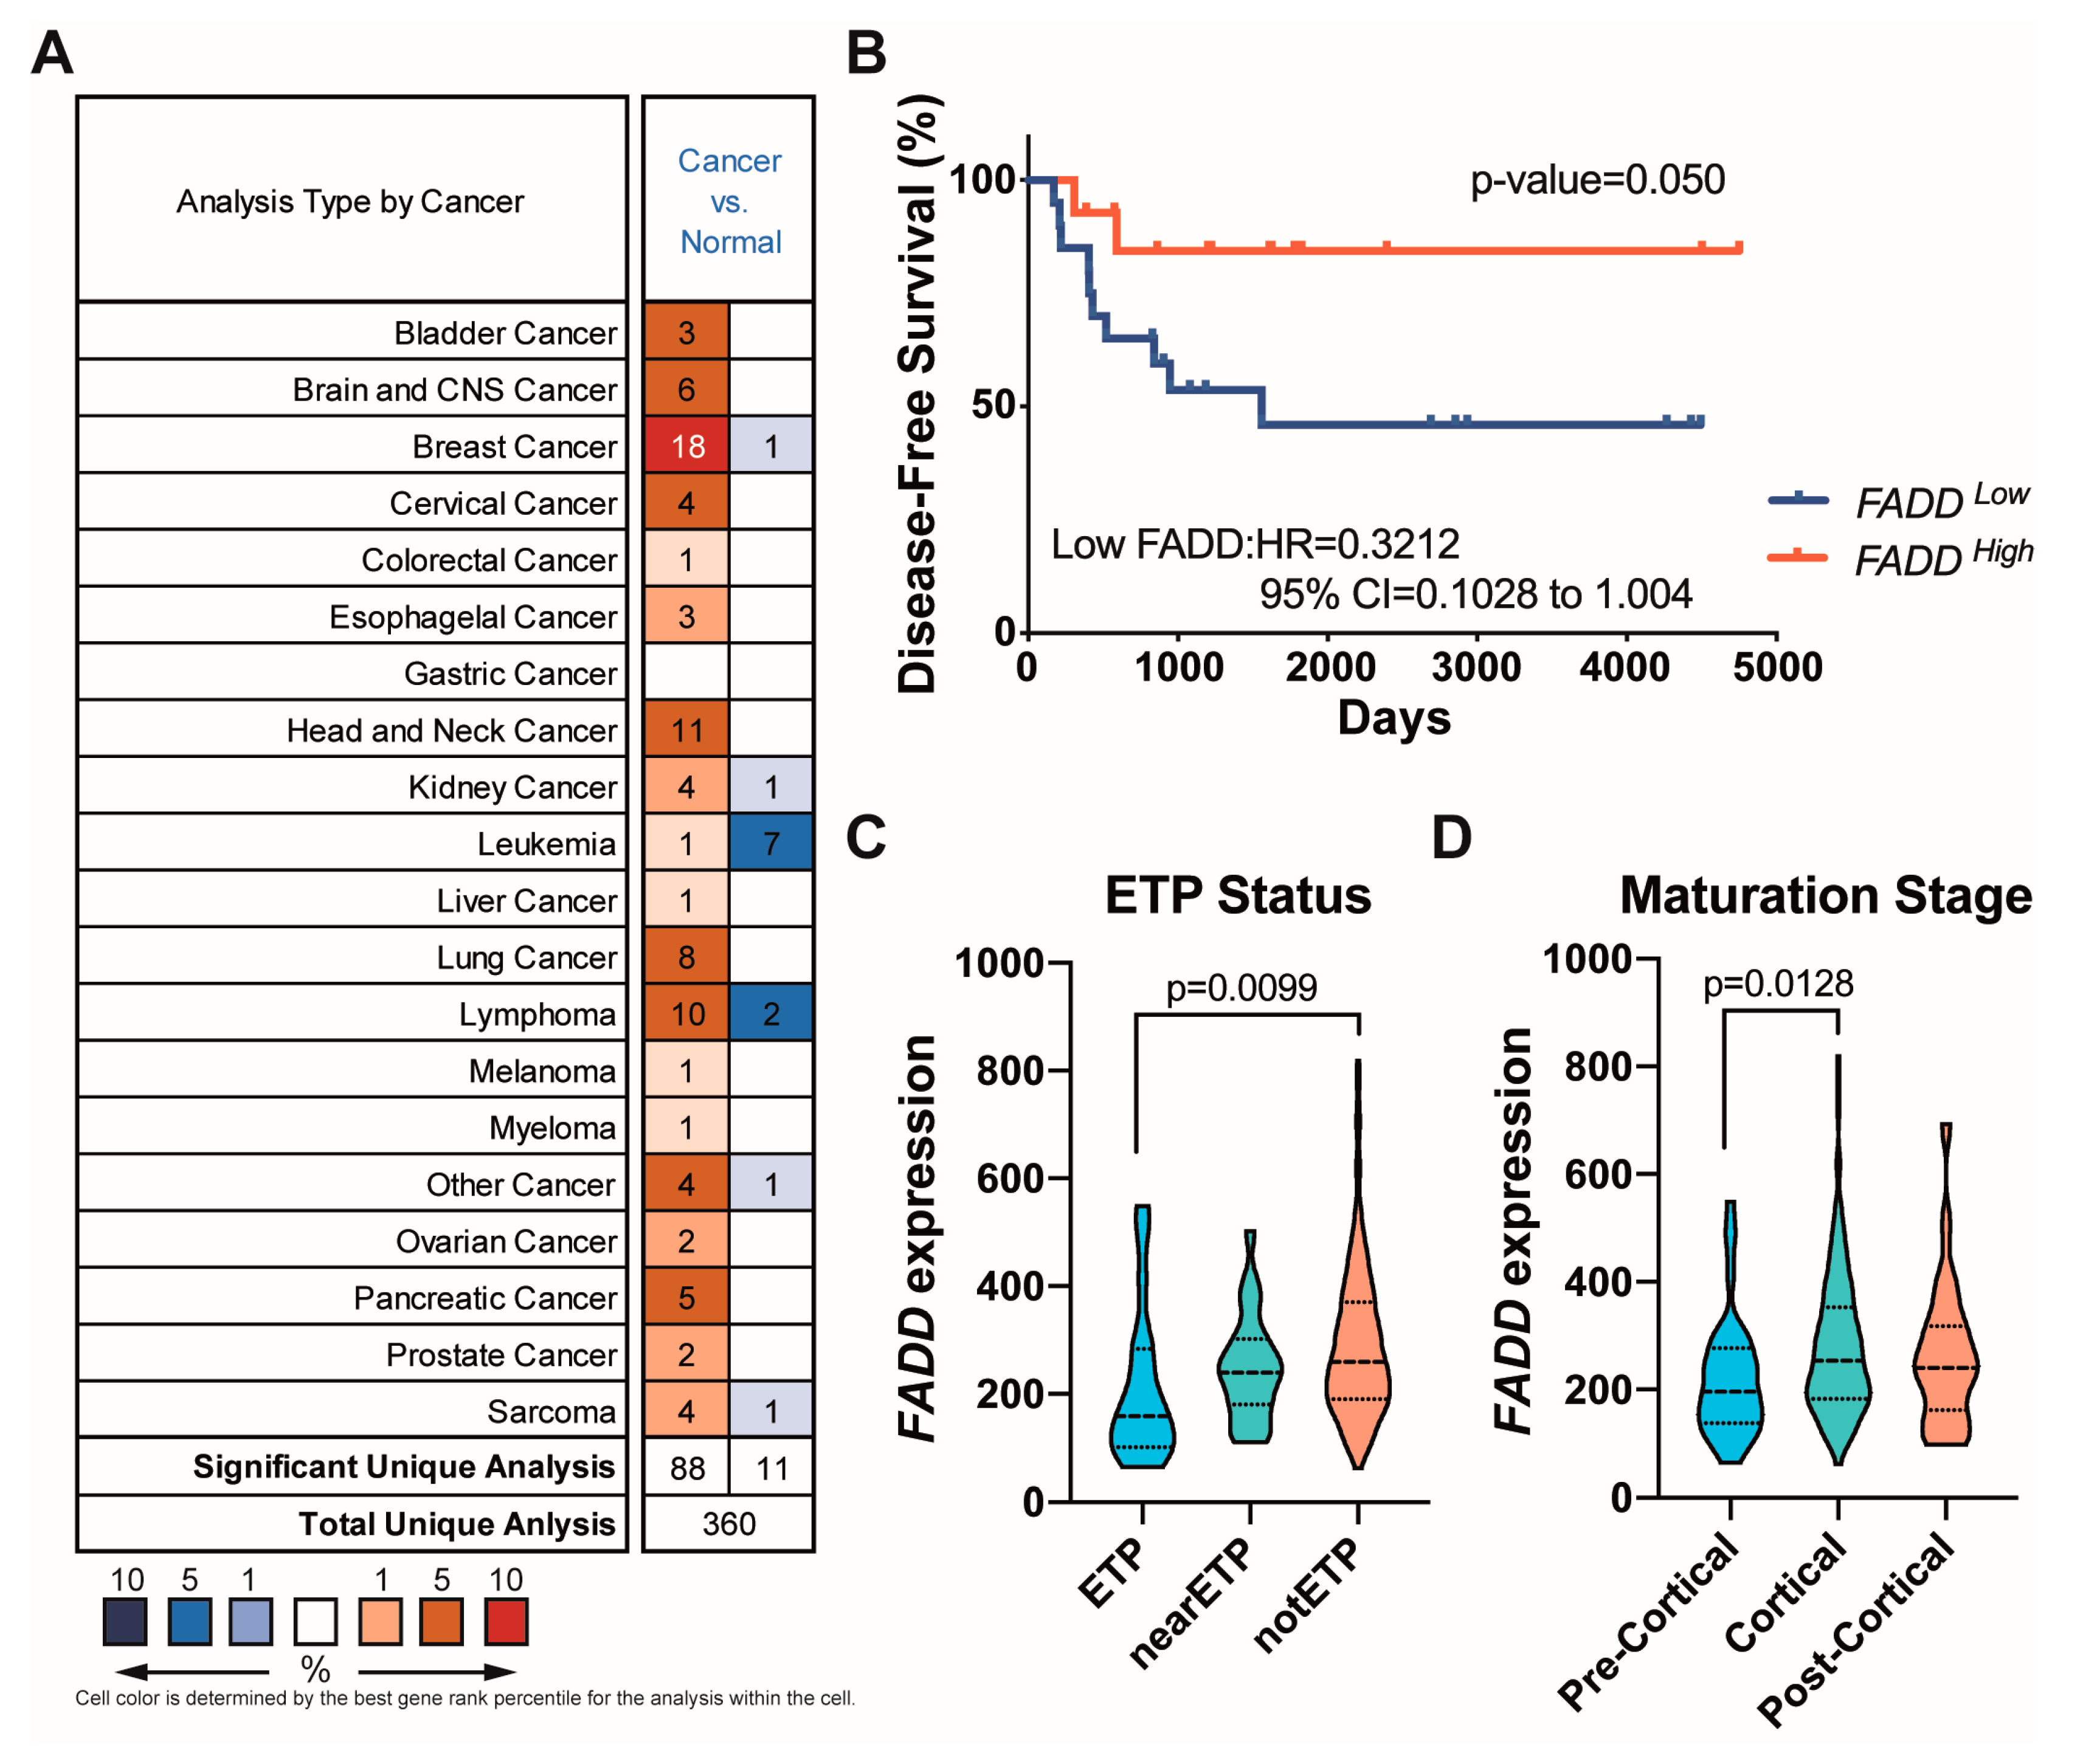
Abstract
:1. Introduction
2. Results
2.1. Reduced FADD Levels Associate with Poor Prognosis in Precursor T-Cell Neoplasms
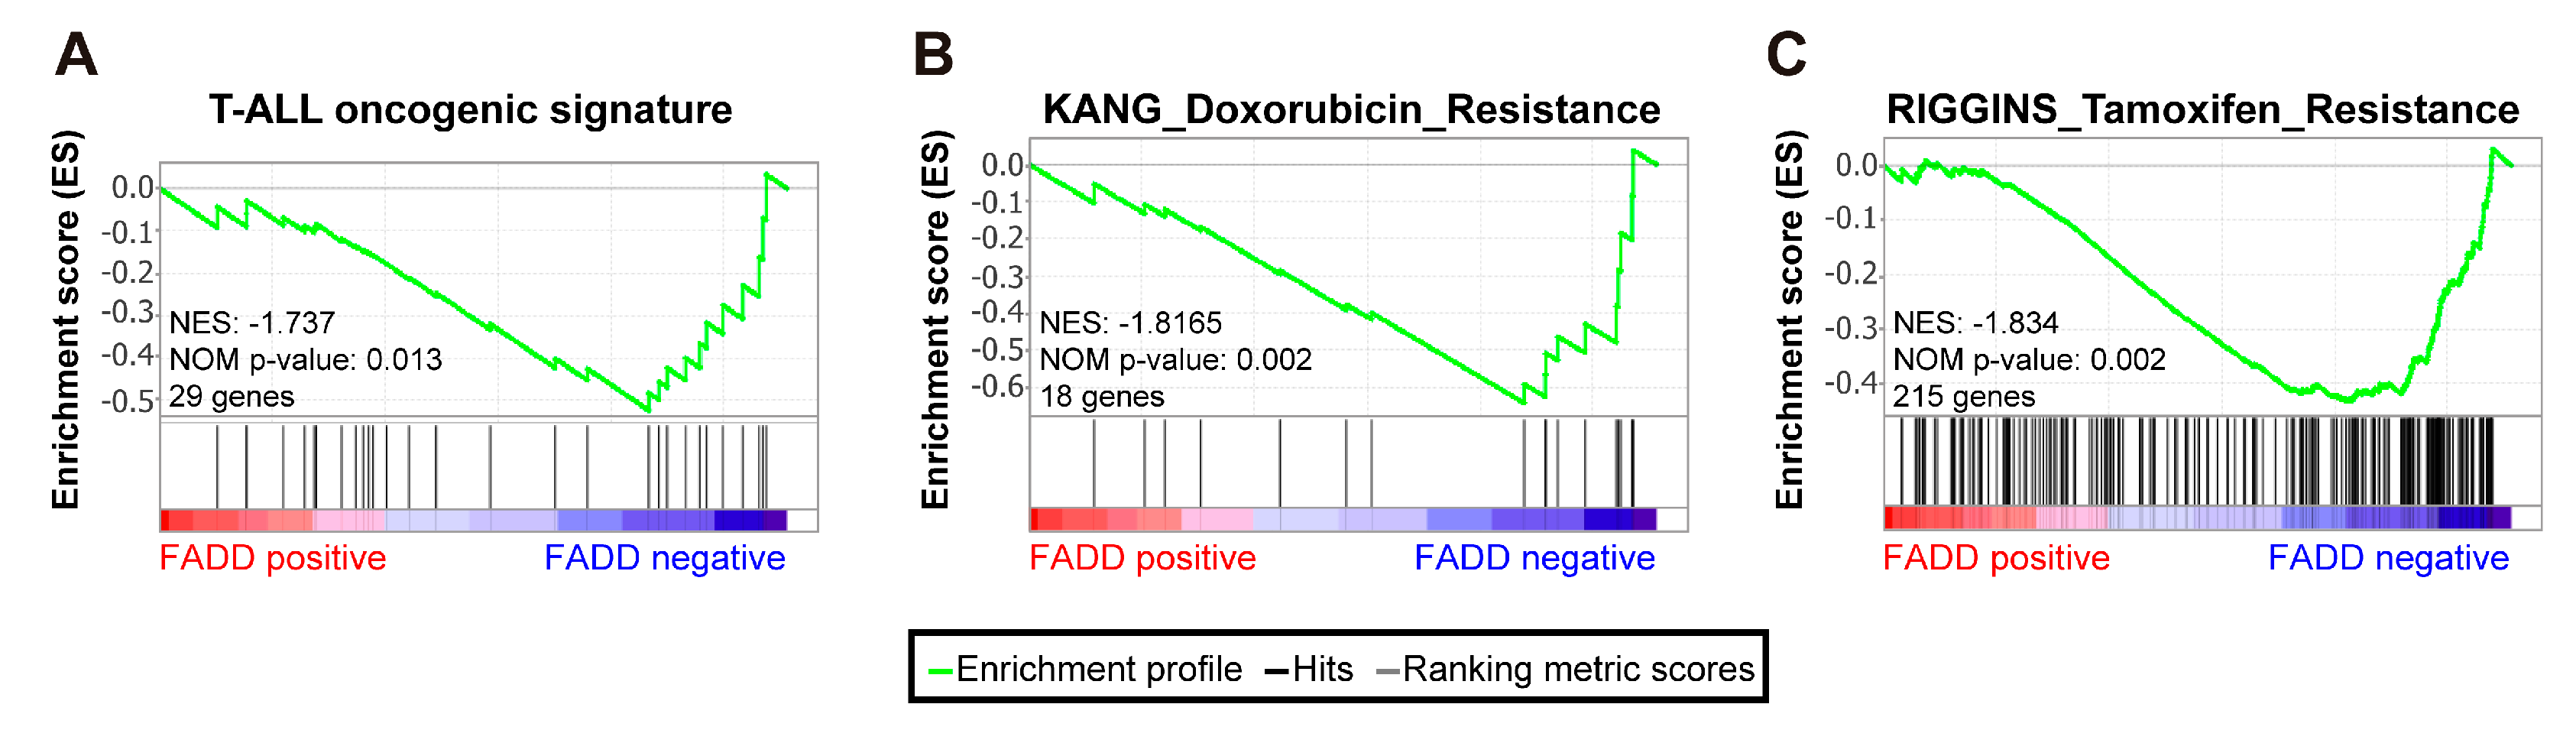
2.2. Patients with Precursor T-Cell Neoplasms Exhibiting Reduced FADD Levels Showed a Significant Association with Oncogenic Signatures
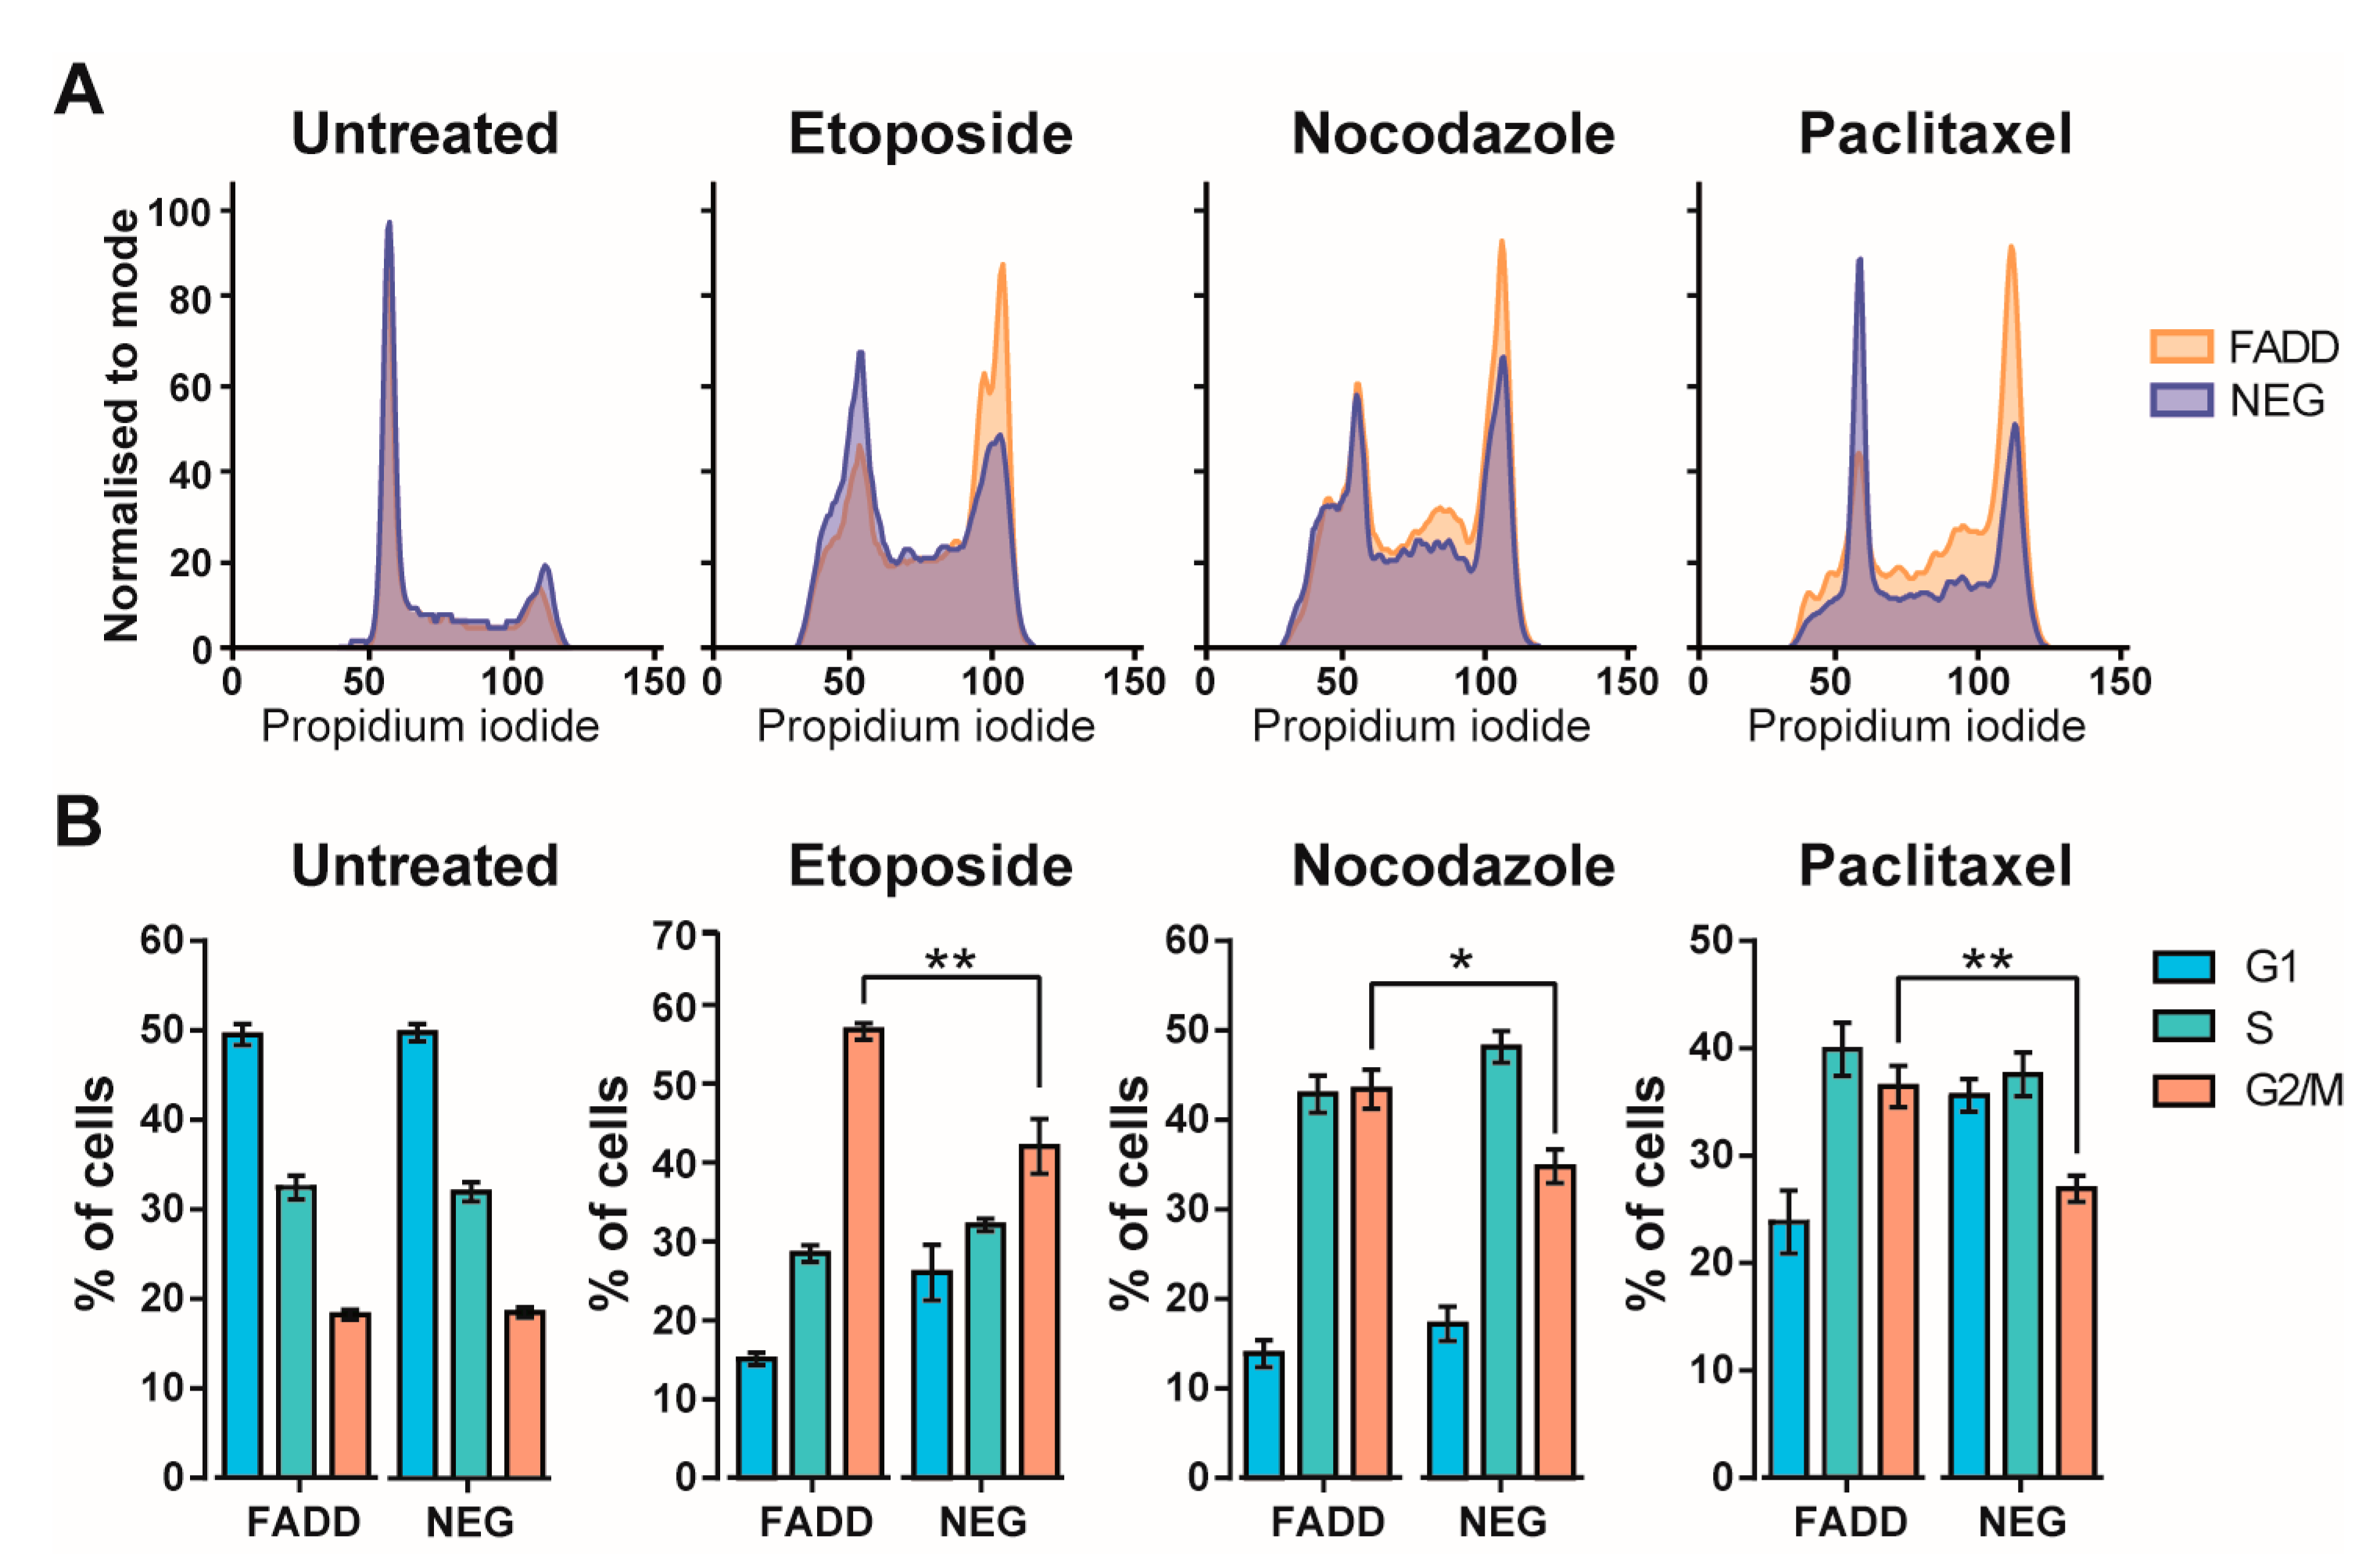
2.3. Precursor T-Cell Tumor Cells Lacking FADD Showed Reduced Sensitivity to Chemotherapeutic Agents
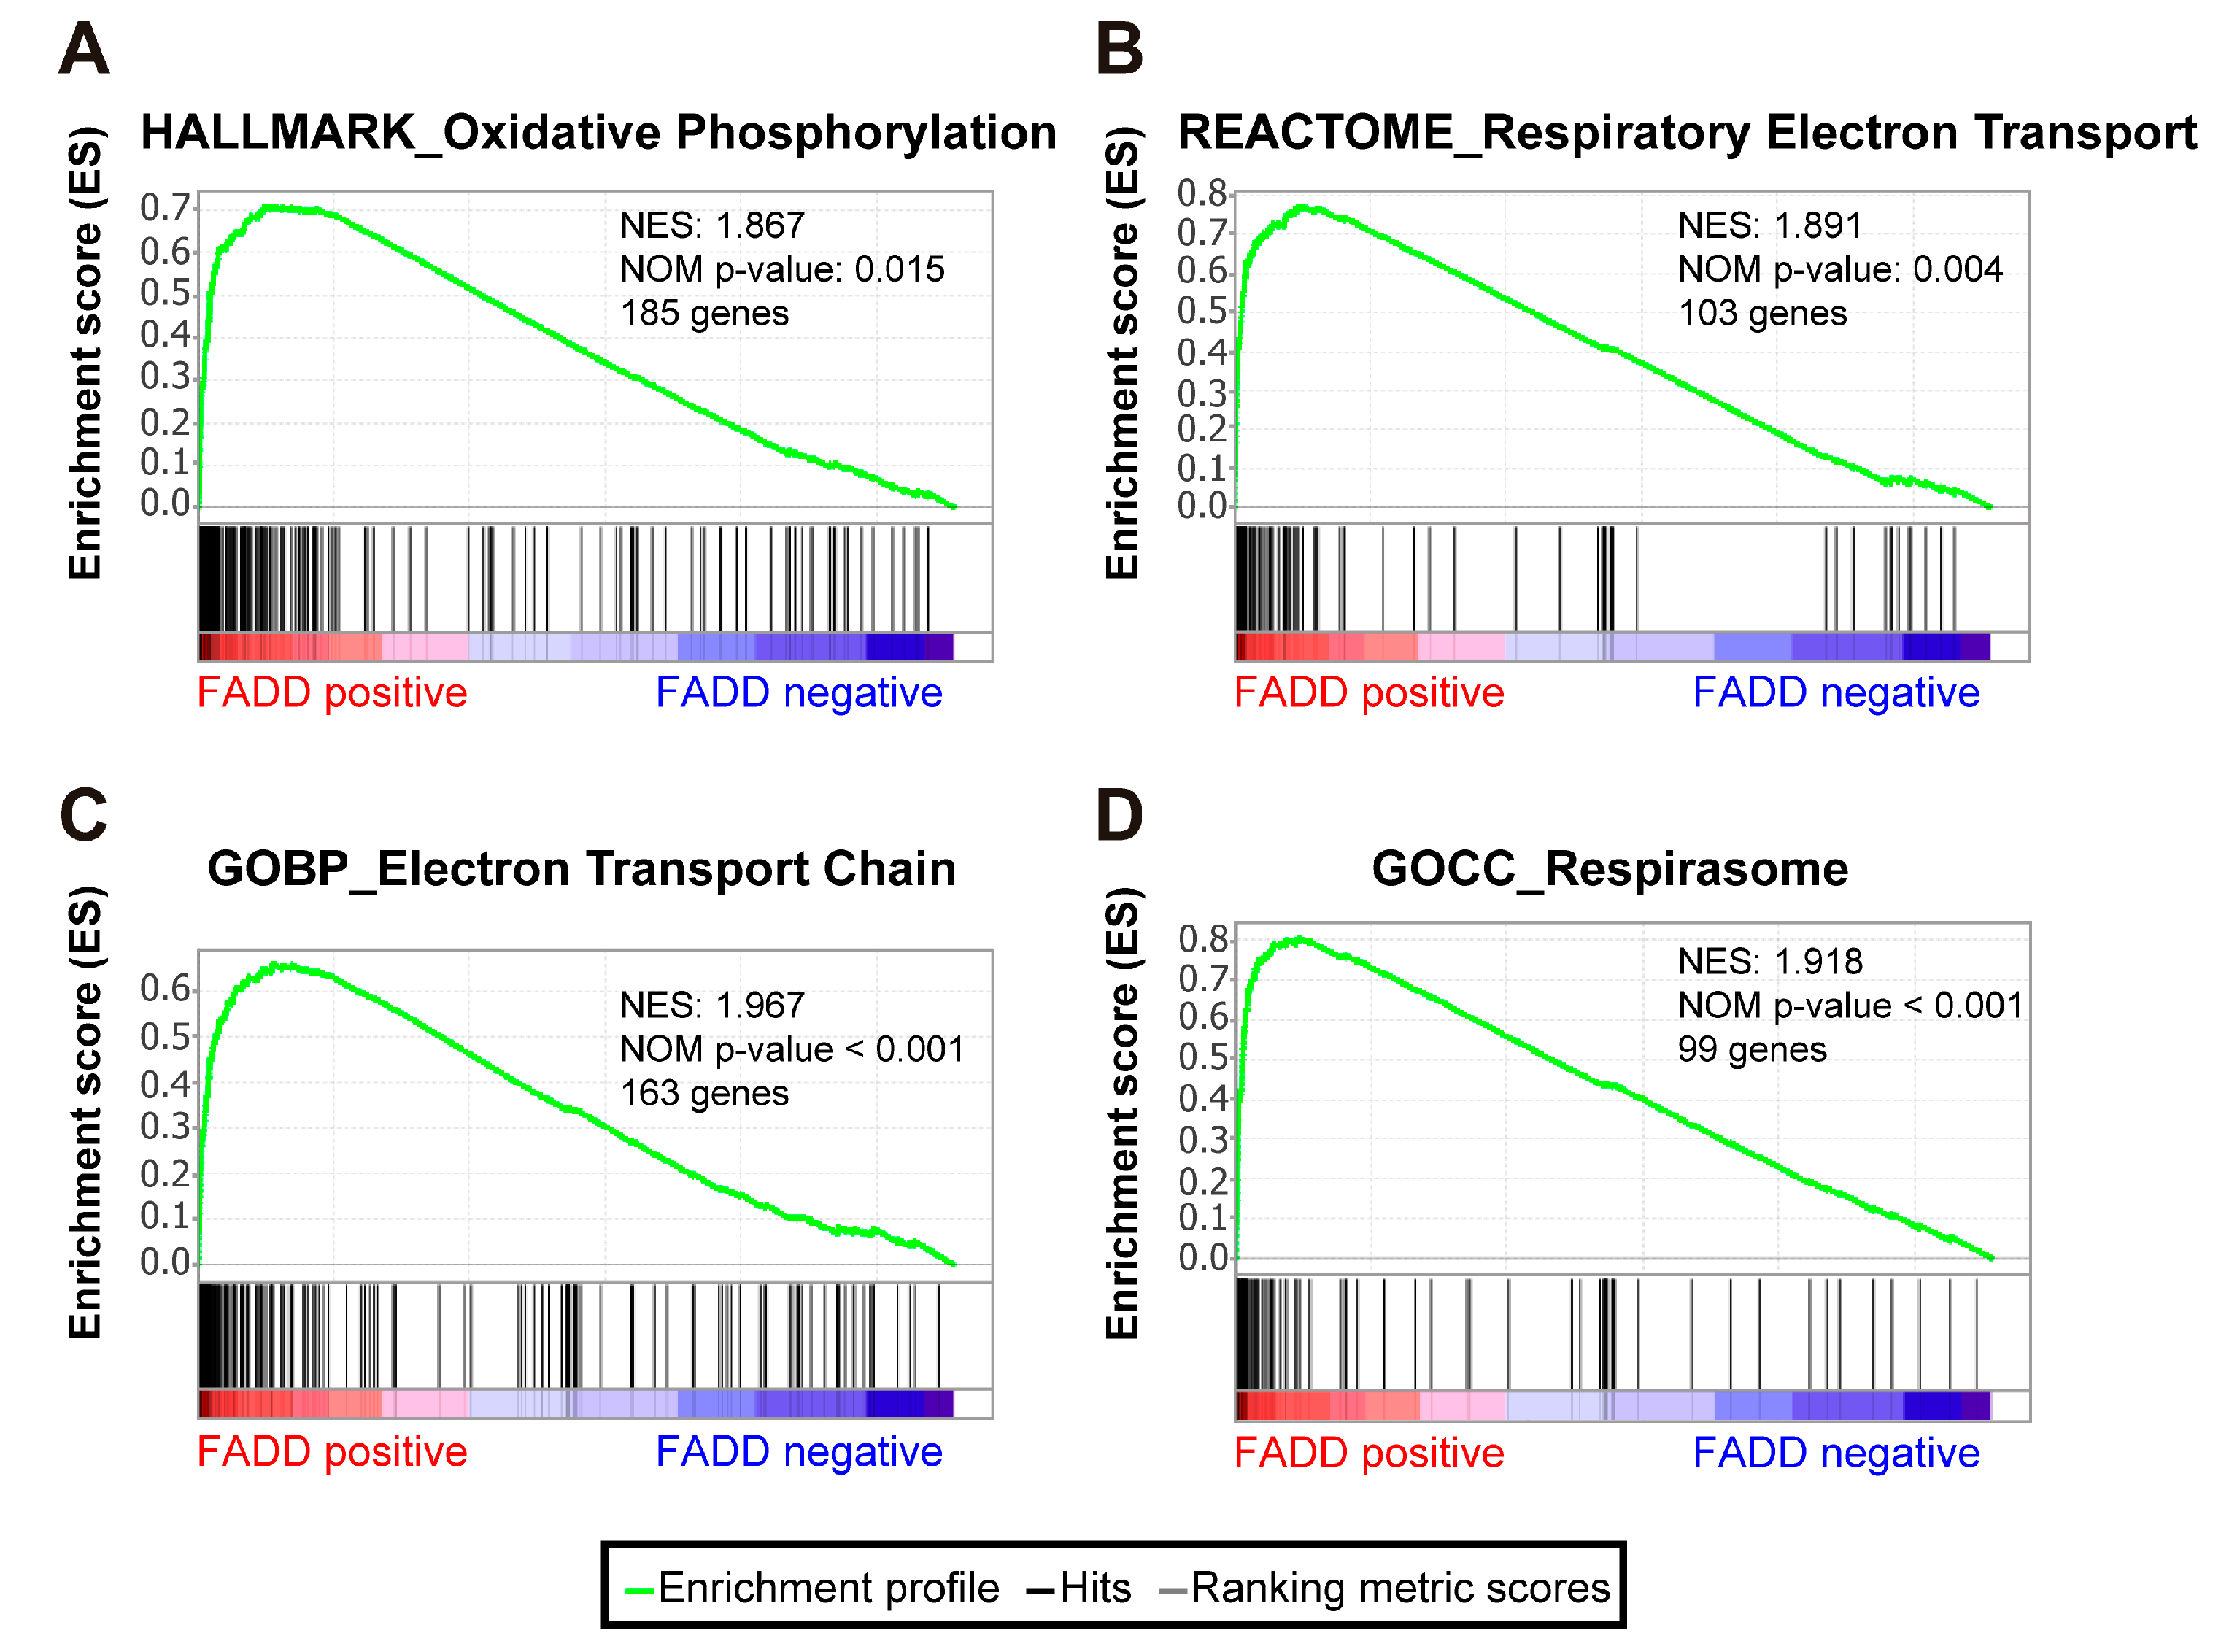
2.4. Energy Metabolism Signatures Are Significantly Enriched in Patients Not Exhibiting FADD Reduction
2.5. Interactome Analysis Using DIA-MS Confirms FADD Participation in Energy Metabolism Processes
3. Discussion
4. Materials and Methods
4.1. In Silico Analysis of Published Microarray Datasets
4.2. RNA Sequencing and Clinical Data Analysis
4.3. Gene Set Enrichment Analysis (GSEA)
4.4. Cell Culture
4.5. Cell Cycle Analysis
4.6. Preparation of Cellular Extracts and Immunoprecipitation of Endogenous FADD
4.7. Western Blot
4.8. Sample Preparation for LC-MS/MS
4.9. Data-Independent Acquisition Mass Spectrometry (DIA-MS)
4.10. MS Data Analysis
4.11. Data Availability
4.12. Statistical Analysis
Supplementary Materials
Author Contributions
Funding
Institutional Review Board Statement
Informed Consent Statement
Data Availability Statement
Acknowledgments
Conflicts of Interest
References
- Cortelazzo, S.; Ferreri, A.; Hoelzer, D.; Ponzoni, M. Lymphoblastic lymphoma. Crit. Rev. Oncol. Hematol. 2017, 113, 304–317. [Google Scholar] [CrossRef] [PubMed]
- Marin-Rubio, J.L.; de Arriba, M.C.; Cobos-Fernandez, M.A.; Gonzalez-Sanchez, L.; Ors, I.; Sastre, I.; Fernandez-Piqueras, J.; Villa-Morales, M. Deregulated FADD expression and phosphorylation in T-cell lymphoblastic lymphoma. Oncotarget 2016, 7, 61485–61499. [Google Scholar] [CrossRef] [PubMed] [Green Version]
- Patel, S.; Murphy, D.; Haralambieva, E.; Abdulla, Z.A.; Wong, K.K.; Chen, H.; Gould, E.; Roncador, G.; Hatton, C.S.; Anderson, A.P.; et al. Increased Expression of Phosphorylated FADD in Anaplastic Large Cell and Other T-Cell Lymphomas. Biomark. Insights 2014, 9, 77–84. [Google Scholar] [CrossRef] [Green Version]
- Villa-Morales, M.; Cobos, M.A.; Gonzalez-Gugel, E.; Alvarez-Iglesias, V.; Martinez, B.; Piris, M.A.; Carracedo, A.; Benitez, J.; Fernandez-Piqueras, J. FAS system deregulation in T-cell lymphoblastic lymphoma. Cell Death Dis. 2014, 5, e1110. [Google Scholar] [CrossRef] [PubMed] [Green Version]
- Cimino, Y.; Costes, A.; Damotte, D.; Validire, P.; Mistou, S.; Cagnard, N.; Alifano, M.; Regnard, J.F.; Chiocchia, G.; Sautes-Fridman, C.; et al. FADD protein release mirrors the development and aggressiveness of human non-small cell lung cancer. Br. J. Cancer 2012, 106, 1989–1996. [Google Scholar] [CrossRef] [Green Version]
- Tourneur, L.; Mistou, S.; Michiels, F.M.; Devauchelle, V.; Renia, L.; Feunteun, J.; Chiocchia, G. Loss of FADD protein expression results in a biased Fas-signaling pathway and correlates with the development of tumoral status in thyroid follicular cells. Oncogene 2003, 22, 2795–2804. [Google Scholar] [CrossRef] [Green Version]
- Tourneur, L.; Delluc, S.; Levy, V.; Valensi, F.; Radford-Weiss, I.; Legrand, O.; Vargaftig, J.; Boix, C.; Macintyre, E.A.; Varet, B.; et al. Absence or low expression of fas-associated protein with death domain in acute myeloid leukemia cells predicts resistance to chemotherapy and poor outcome. Cancer Res. 2004, 64, 8101–8108. [Google Scholar] [CrossRef] [Green Version]
- Bhojani, M.S.; Chen, G.; Ross, B.D.; Beer, D.G.; Rehemtulla, A. Nuclear localized phosphorylated FADD induces cell proliferation and is associated with aggressive lung cancer. Cell Cycle 2005, 4, 1478–1481. [Google Scholar]
- Chen, G.; Bhojani, M.S.; Heaford, A.C.; Chang, D.C.; Laxman, B.; Thomas, D.G.; Griffin, L.B.; Yu, J.; Coppola, J.M.; Giordano, T.J.; et al. Phosphorylated FADD induces NF-kappaB, perturbs cell cycle, and is associated with poor outcome in lung adenocarcinomas. Proc. Natl. Acad. Sci. USA 2005, 102, 12507–12512. [Google Scholar] [CrossRef] [Green Version]
- He, L.; Ren, Y.; Zheng, Q.; Wang, L.; Lai, Y.; Guan, S.; Zhang, X.; Zhang, R.; Wang, J.; Chen, D.; et al. Fas-associated protein with death domain (FADD) regulates autophagy through promoting the expression of Ras homolog enriched in brain (Rheb) in human breast adenocarcinoma cells. Oncotarget 2016, 7, 24572–24584. [Google Scholar] [CrossRef] [Green Version]
- Pattje, W.J.; Melchers, L.J.; Slagter-Menkema, L.; Mastik, M.F.; Schrijvers, M.L.; Gibcus, J.H.; Kluin, P.M.; Hoegen-Chouvalova, O.; van der Laan, B.F.; Roodenburg, J.L.; et al. FADD expression is associated with regional and distant metastasis in squamous cell carcinoma of the head and neck. Histopathology 2013, 63, 263–270. [Google Scholar] [CrossRef] [PubMed]
- Chen, X.; Wei, S.; Ji, Y.; Guo, X.; Yang, F. Quantitative proteomics using SILAC: Principles, applications, and developments. Proteomics 2015, 15, 3175–3192. [Google Scholar] [CrossRef] [PubMed]
- Dobreva, I.; Fielding, A.; Foster, L.J.; Dedhar, S. Mapping the integrin-linked kinase interactome using SILAC. J. Proteome Res. 2008, 7, 1740–1749. [Google Scholar] [CrossRef]
- Wang, M.; You, J.; Bemis, K.G.; Tegeler, T.J.; Brown, D.P. Label-free mass spectrometry-based protein quantification technologies in proteomic analysis. Brief Funct. Genom. Proteomic 2008, 7, 329–339. [Google Scholar] [CrossRef] [PubMed] [Green Version]
- Cheung, C.H.Y.; Juan, H.F. Quantitative proteomics in lung cancer. J. Biomed. Sci. 2017, 24, 37. [Google Scholar] [CrossRef] [Green Version]
- Mann, M. Functional and quantitative proteomics using SILAC. Nat. Rev. Mol. Cell Biol. 2006, 7, 952–958. [Google Scholar] [CrossRef]
- Merl, J.; Ueffing, M.; Hauck, S.M.; von Toerne, C. Direct comparison of MS-based label-free and SILAC quantitative proteome profiling strategies in primary retinal Muller cells. Proteomics 2012, 12, 1902–1911. [Google Scholar] [CrossRef] [PubMed]
- Bowman, B.M.; Sebolt, K.A.; Hoff, B.A.; Boes, J.L.; Daniels, D.L.; Heist, K.A.; Galban, C.J.; Patel, R.M.; Zhang, J.; Beer, D.G.; et al. Phosphorylation of FADD by the kinase CK1alpha promotes KRASG12D-induced lung cancer. Sci. Signal. 2015, 8, ra9. [Google Scholar] [CrossRef] [Green Version]
- Gomez-Angelats, M.; Cidlowski, J.A. Protein kinase C regulates FADD recruitment and death-inducing signaling complex formation in Fas/CD95-induced apoptosis. J. Biol. Chem. 2001, 276, 44944–44952. [Google Scholar] [CrossRef] [PubMed] [Green Version]
- Henry, C.M.; Martin, S.J. Caspase-8 Acts in a Non-enzymatic Role as a Scaffold for Assembly of a Pro-inflammatory “FADDosome” Complex upon TRAIL Stimulation. Mol. Cell. 2017, 65, 715–729.e715. [Google Scholar] [CrossRef] [Green Version]
- Jang, M.S.; Lee, S.J.; Kang, N.S.; Kim, E. Cooperative phosphorylation of FADD by Aur-A and Plk1 in response to taxol triggers both apoptotic and necrotic cell death. Cancer Res. 2011, 71, 7207–7215. [Google Scholar] [CrossRef] [PubMed]
- Kischkel, F.C.; Hellbardt, S.; Behrmann, I.; Germer, M.; Pawlita, M.; Krammer, P.H.; Peter, M.E. Cytotoxicity-dependent APO-1 (Fas/CD95)-associated proteins form a death-inducing signaling complex (DISC) with the receptor. EMBO J. 1995, 14, 5579–5588. [Google Scholar] [CrossRef] [PubMed]
- Muzio, M.; Chinnaiyan, A.M.; Kischkel, F.C.; O’Rourke, K.; Shevchenko, A.; Ni, J.; Scaffidi, C.; Bretz, J.D.; Zhang, M.; Gentz, R.; et al. FLICE, a novel FADD-homologous ICE/CED-3-like protease, is recruited to the CD95 (Fas/APO-1) death-inducing signaling complex. Cell 1996, 85, 817–827. [Google Scholar] [CrossRef] [PubMed] [Green Version]
- Screaton, R.A.; Kiessling, S.; Sansom, O.J.; Millar, C.B.; Maddison, K.; Bird, A.; Clarke, A.R.; Frisch, S.M. Fas-associated death domain protein interacts with methyl-CpG binding domain protein 4: A potential link between genome surveillance and apoptosis. Proc. Natl. Acad. Sci. USA 2003, 100, 5211–5216. [Google Scholar] [CrossRef] [PubMed] [Green Version]
- Zhuang, H.; Gan, Z.; Jiang, W.; Zhang, X.; Hua, Z.C. Functional specific roles of FADD: Comparative proteomic analyses from knockout cell lines. Mol. Biosyst. 2013, 9, 2063–2078. [Google Scholar] [CrossRef]
- Liu, Y.; Easton, J.; Shao, Y.; Maciaszek, J.; Wang, Z.; Wilkinson, M.R.; McCastlain, K.; Edmonson, M.; Pounds, S.B.; Shi, L.; et al. The genomic landscape of pediatric and young adult T-lineage acute lymphoblastic leukemia. Nat. Genet. 2017, 49, 1211–1218. [Google Scholar] [CrossRef] [Green Version]
- Coustan-Smith, E.; Mullighan, C.G.; Onciu, M.; Behm, F.G.; Raimondi, S.C.; Pei, D.; Cheng, C.; Su, X.; Rubnitz, J.E.; Basso, G.; et al. Early T-cell precursor leukaemia: A subtype of very high-risk acute lymphoblastic leukaemia. Lancet Oncol. 2009, 10, 147–156. [Google Scholar] [CrossRef] [Green Version]
- Fattizzo, B.; Rosa, J.; Giannotta, J.A.; Baldini, L.; Fracchiolla, N.S. The Physiopathology of T-Cell Acute Lymphoblastic Leukemia: Focus on Molecular Aspects. Front. Oncol. 2020, 10, 273. [Google Scholar] [CrossRef] [Green Version]
- Ferrando, A.A.; Neuberg, D.S.; Staunton, J.; Loh, M.L.; Huard, C.; Raimondi, S.C.; Behm, F.G.; Pui, C.H.; Downing, J.R.; Gilliland, D.G.; et al. Gene expression signatures define novel oncogenic pathways in T cell acute lymphoblastic leukemia. Cancer Cell 2002, 1, 75–87. [Google Scholar] [CrossRef] [Green Version]
- Belver, L.; Ferrando, A. The genetics and mechanisms of T cell acute lymphoblastic leukaemia. Nat. Rev. Cancer 2016, 16, 494–507. [Google Scholar] [CrossRef]
- Igney, F.H.; Krammer, P.H. Death and anti-death: Tumour resistance to apoptosis. Nat. Rev. Cancer 2002, 2, 277–288. [Google Scholar] [CrossRef] [PubMed]
- Alaggio, R.; Amador, C.; Anagnostopoulos, I.; Attygalle, A.D.; Araujo, I.B.O.; Berti, E.; Bhagat, G.; Borges, A.M.; Boyer, D.; Calaminici, M.; et al. The 5th edition of the World Health Organization Classification of Haematolymphoid Tumours: Lymphoid Neoplasms. Leukemia 2022, 36, 1720–1748. [Google Scholar] [CrossRef] [PubMed]
- Genesca, E.; Morgades, M.; Montesinos, P.; Barba, P.; Gil, C.; Guardia, R.; Moreno, M.J.; Martinez-Carballeira, D.; Garcia-Cadenas, I.; Vives, S.; et al. Unique clinico-biological, genetic and prognostic features of adult early T-cell precursor acute lymphoblastic leukemia. Haematologica 2020, 105, e294–e297. [Google Scholar] [CrossRef] [PubMed]
- Marin-Rubio, J.L.; Perez-Gomez, E.; Fernandez-Piqueras, J.; Villa-Morales, M. S194-P-FADD as a marker of aggressiveness and poor prognosis in human T-cell lymphoblastic lymphoma. Carcinogenesis 2019, 40, 1260–1268. [Google Scholar] [CrossRef]
- Schattenberg, J.M.; Schuchmann, M.; Galle, P.R. Cell death and hepatocarcinogenesis: Dysregulation of apoptosis signaling pathways. J. Gastroenterol. Hepatol. 2011, 26 (Suppl. S1), 213–219. [Google Scholar] [CrossRef]
- Tourneur, L.; Chiocchia, G. FADD: A regulator of life and death. Trends Immunol. 2010, 31, 260–269. [Google Scholar] [CrossRef]
- Indran, I.R.; Tufo, G.; Pervaiz, S.; Brenner, C. Recent advances in apoptosis, mitochondria and drug resistance in cancer cells. Biochim. Biophys. Acta 2011, 1807, 735–745. [Google Scholar] [CrossRef] [Green Version]
- Mrkvova, Z.; Portesova, M.; Slaninova, I. Loss of FADD and Caspases Affects the Response of T-Cell Leukemia Jurkat Cells to Anti-Cancer Drugs. Int. J. Mol. Sci. 2021, 22, 2702. [Google Scholar] [CrossRef]
- Otto, T.; Sicinski, P. Cell cycle proteins as promising targets in cancer therapy. Nat. Rev. Cancer 2017, 17, 93–115. [Google Scholar] [CrossRef] [Green Version]
- Chowdhury, A.; Chowdhury, S.; Tsai, M.Y. A novel Aurora kinase A inhibitor MK-8745 predicts TPX2 as a therapeutic biomarker in non-Hodgkin lymphoma cell lines. Leuk. Lymphoma 2012, 53, 462–471. [Google Scholar] [CrossRef]
- Dawson, M.A.; Prinjha, R.K.; Dittmann, A.; Giotopoulos, G.; Bantscheff, M.; Chan, W.I.; Robson, S.C.; Chung, C.W.; Hopf, C.; Savitski, M.M.; et al. Inhibition of BET recruitment to chromatin as an effective treatment for MLL-fusion leukaemia. Nature 2011, 478, 529–533. [Google Scholar] [CrossRef]
- Miralaei, N.; Majd, A.; Ghaedi, K.; Peymani, M.; Safaei, M. Integrated pan-cancer of AURKA expression and drug sensitivity analysis reveals increased expression of AURKA is responsible for drug resistance. Cancer Med. 2021, 10, 6428–6441. [Google Scholar] [CrossRef] [PubMed]
- Shah, M.Y.; Martinez-Garcia, E.; Phillip, J.M.; Chambliss, A.B.; Popovic, R.; Ezponda, T.; Small, E.C.; Will, C.; Phillip, M.P.; Neri, P.; et al. MMSET/WHSC1 enhances DNA damage repair leading to an increase in resistance to chemotherapeutic agents. Oncogene 2016, 35, 5905–5915. [Google Scholar] [CrossRef] [PubMed]
- Hanahan, D. Hallmarks of Cancer: New Dimensions. Cancer Discov. 2022, 12, 31–46. [Google Scholar] [CrossRef]
- Choi, S.G.; Kim, H.; Jeong, E.I.; Lee, H.J.; Park, S.; Lee, S.Y.; Lee, H.J.; Lee, S.W.; Chung, C.H.; Jung, Y.K. SUMO-Modified FADD Recruits Cytosolic Drp1 and Caspase-10 to Mitochondria for Regulated Necrosis. Mol. Cell. Biol. 2017, 37, e00254-16. [Google Scholar] [CrossRef] [PubMed] [Green Version]
- Feltham, R.; Jamal, K.; Tenev, T.; Liccardi, G.; Jaco, I.; Domingues, C.M.; Morris, O.; John, S.W.; Annibaldi, A.; Widya, M.; et al. Mind Bomb Regulates Cell Death during TNF Signaling by Suppressing RIPK1’s Cytotoxic Potential. Cell Rep. 2018, 23, 470–484. [Google Scholar] [CrossRef] [PubMed] [Green Version]
- Goto, E.; Tokunaga, F. Decreased linear ubiquitination of NEMO and FADD on apoptosis with caspase-mediated cleavage of HOIP. Biochem. Biophys. Res. Commun. 2017, 485, 152–159. [Google Scholar] [CrossRef]
- Ranjan, K.; Pathak, C. FADD regulates NF-kappaB activation and promotes ubiquitination of cFLIPL to induce apoptosis. Sci. Rep. 2016, 6, 22787. [Google Scholar] [CrossRef]
- Liu, Y.; Cui, H.; Huang, X.; Zhu, B.; Guan, S.; Cheng, W.; Lai, Y.; Zhang, X.; Hua, Z.C. MiR-7a is an important mediator in Fas-associated protein with death domain (FADD)-regulated expression of focal adhesion kinase (FAK). Oncotarget 2016, 7, 51393–51407. [Google Scholar] [CrossRef] [Green Version]
- Zhuang, H.; Wang, X.; Zha, D.; Gan, Z.; Cai, F.; Du, P.; Yang, Y.; Yang, B.; Zhang, X.; Yao, C.; et al. FADD is a key regulator of lipid metabolism. EMBO Mol. Med. 2016, 8, 895–918. [Google Scholar] [CrossRef]
- Gomez-Angelats, M.; Cidlowski, J.A. Molecular evidence for the nuclear localization of FADD. Cell Death Differ. 2003, 10, 791–797. [Google Scholar] [CrossRef]
- Perez, D.; White, E. E1B 19K inhibits Fas-mediated apoptosis through FADD-dependent sequestration of FLICE. J. Cell Biol. 1998, 141, 1255–1266. [Google Scholar] [CrossRef] [Green Version]
- Siegel, R.M.; Martin, D.A.; Zheng, L.; Ng, S.Y.; Bertin, J.; Cohen, J.; Lenardo, M.J. Death-effector filaments: Novel cytoplasmic structures that recruit caspases and trigger apoptosis. J. Cell Biol. 1998, 141, 1243–1253. [Google Scholar] [CrossRef] [Green Version]
- Tang, D.; Lahti, J.M.; Grenet, J.; Kidd, V.J. Cycloheximide-induced T-cell death is mediated by a Fas-associated death domain-dependent mechanism. J. Biol. Chem. 1999, 274, 7245–7252. [Google Scholar] [CrossRef] [Green Version]
- Latysheva, N.S.; Oates, M.E.; Maddox, L.; Flock, T.; Gough, J.; Buljan, M.; Weatheritt, R.J.; Babu, M.M. Molecular Principles of Gene Fusion Mediated Rewiring of Protein Interaction Networks in Cancer. Mol. Cell 2016, 63, 579–592. [Google Scholar] [CrossRef] [Green Version]
- Jang, M.S.; Lee, S.J.; Kim, C.J.; Lee, C.W.; Kim, E. Phosphorylation by polo-like kinase 1 induces the tumor-suppressing activity of FADD. Oncogene 2011, 30, 471–481. [Google Scholar] [CrossRef] [Green Version]
- Krasny, L.; Huang, P.H. Data-independent acquisition mass spectrometry (DIA-MS) for proteomic applications in oncology. Mol. Omics 2021, 17, 29–42. [Google Scholar] [CrossRef]
- Bauer, M.; Ahrne, E.; Baron, A.P.; Glatter, T.; Fava, L.L.; Santamaria, A.; Nigg, E.A.; Schmidt, A. Assessment of current mass spectrometric workflows for the quantification of low abundant proteins and phosphorylation sites. Data Brief 2015, 5, 297–304. [Google Scholar] [CrossRef] [Green Version]
- Marin de Mas, I.; Aguilar, E.; Zodda, E.; Balcells, C.; Marin, S.; Dallmann, G.; Thomson, T.M.; Papp, B.; Cascante, M. Model-driven discovery of long-chain fatty acid metabolic reprogramming in heterogeneous prostate cancer cells. PLoS Comput. Biol. 2018, 14, e1005914. [Google Scholar] [CrossRef] [Green Version]
- Papa, S.; Choy, P.M.; Bubici, C. The ERK and JNK pathways in the regulation of metabolic reprogramming. Oncogene 2019, 38, 2223–2240. [Google Scholar] [CrossRef] [Green Version]
- Bullinger, L.; Dohner, K.; Bair, E.; Frohling, S.; Schlenk, R.F.; Tibshirani, R.; Dohner, H.; Pollack, J.R. Use of gene-expression profiling to identify prognostic subclasses in adult acute myeloid leukemia. N. Engl. J. Med. 2004, 350, 1605–1616. [Google Scholar] [CrossRef]
- Mootha, V.K.; Lindgren, C.M.; Eriksson, K.F.; Subramanian, A.; Sihag, S.; Lehar, J.; Puigserver, P.; Carlsson, E.; Ridderstrale, M.; Laurila, E.; et al. PGC-1alpha-responsive genes involved in oxidative phosphorylation are coordinately downregulated in human diabetes. Nat. Genet. 2003, 34, 267–273. [Google Scholar] [CrossRef]
- Subramanian, A.; Tamayo, P.; Mootha, V.K.; Mukherjee, S.; Ebert, B.L.; Gillette, M.A.; Paulovich, A.; Pomeroy, S.L.; Golub, T.R.; Lander, E.S.; et al. Gene set enrichment analysis: A knowledge-based approach for interpreting genome-wide expression profiles. Proc. Natl. Acad. Sci. USA 2005, 102, 15545–15550. [Google Scholar] [CrossRef] [Green Version]
- Ritchie, M.E.; Phipson, B.; Wu, D.; Hu, Y.; Law, C.W.; Shi, W.; Smyth, G.K. limma powers differential expression analyses for RNA-sequencing and microarray studies. Nucleic Acids Res. 2015, 43, e47. [Google Scholar] [CrossRef]
- Raudvere, U.; Kolberg, L.; Kuzmin, I.; Arak, T.; Adler, P.; Peterson, H.; Vilo, J. g: Profiler: A web server for functional enrichment analysis and conversions of gene lists (2019 update). Nucleic Acids Res. 2019, 47, W191–W198. [Google Scholar] [CrossRef] [Green Version]
- Szklarczyk, D.; Morris, J.H.; Cook, H.; Kuhn, M.; Wyder, S.; Simonovic, M.; Santos, A.; Doncheva, N.T.; Roth, A.; Bork, P.; et al. The STRING database in 2017: Quality-controlled protein-protein association networks, made broadly accessible. Nucleic Acids Res. 2017, 45, D362–D368. [Google Scholar] [CrossRef]
- Vizcaino, J.A.; Cote, R.G.; Csordas, A.; Dianes, J.A.; Fabregat, A.; Foster, J.M.; Griss, J.; Alpi, E.; Birim, M.; Contell, J.; et al. The PRoteomics IDEntifications (PRIDE) database and associated tools: Status in 2013. Nucleic Acids Res. 2013, 41, D1063–D1069. [Google Scholar] [CrossRef]


Publisher’s Note: MDPI stays neutral with regard to jurisdictional claims in published maps and institutional affiliations. |
© 2022 by the authors. Licensee MDPI, Basel, Switzerland. This article is an open access article distributed under the terms and conditions of the Creative Commons Attribution (CC BY) license (https://creativecommons.org/licenses/by/4.0/).
Share and Cite
Marín-Rubio, J.L.; Vela-Martín, L.; Gudgeon, J.; Pérez-Gómez, E.; Sidgwick, F.R.; Trost, M.; Cunningham, D.L.; Santos, J.; Fernández-Piqueras, J.; Villa-Morales, M. A Dual Role for FADD in Human Precursor T-Cell Neoplasms. Int. J. Mol. Sci. 2022, 23, 15157. https://doi.org/10.3390/ijms232315157
Marín-Rubio JL, Vela-Martín L, Gudgeon J, Pérez-Gómez E, Sidgwick FR, Trost M, Cunningham DL, Santos J, Fernández-Piqueras J, Villa-Morales M. A Dual Role for FADD in Human Precursor T-Cell Neoplasms. International Journal of Molecular Sciences. 2022; 23(23):15157. https://doi.org/10.3390/ijms232315157
Chicago/Turabian StyleMarín-Rubio, José Luis, Laura Vela-Martín, Jack Gudgeon, Eduardo Pérez-Gómez, Frances R. Sidgwick, Matthias Trost, Debbie L. Cunningham, Javier Santos, José Fernández-Piqueras, and María Villa-Morales. 2022. "A Dual Role for FADD in Human Precursor T-Cell Neoplasms" International Journal of Molecular Sciences 23, no. 23: 15157. https://doi.org/10.3390/ijms232315157