Article

Disclosing the Biocide Activity of α-Ag2−2xCuxWO4 (0 ≤ x ≤ 0.16) Solid Solutions

by
Paula Fabiana dos Santos Pereira
1,2,
Camila Cristina De Foggi
3,
Amanda Fernandes Gouveia
2,4,
Ivo Mateus Pinatti
5,
Luís Antônio Cabral
6,
Eva Guillamon
2,
Iván Sorribes
2,
Miguel A. San-Miguel
4,
Carlos Eduardo Vergani
7,
Alexandre Zirpoli Simões
8,
Edison Z. da Silva
6,
Laécio Santos Cavalcante
9,
Rosa Llusar
2,
Elson Longo
1 and
Juan Andrés
2,*
1
CDMF, LIEC, Department of Chemistry, Federal University of São Carlos (UFSCar), P.O. Box 676, São Carlos 13565-905, SP, Brazil
2
Department of Physical and Analytical Chemistry, University Jaume I (UJI), 12071 Castelló, Spain
3
Department of Conservative Dentistry, Faculty of Dental Sciences, Federal University of Rio Grande do Sul, Rio Grande do Sul 90035-004, RS, Brazil
4
Institute of Chemistry, State University of Campinas (Unicamp), Campinas 13083-859, SP, Brazil
5
Department of Chemistry, Federal University of Maranhao, Avenida dos Portugueses, 1966, São Luís 65080-805, MA, Brazil
6
Institute of Physics, “Gleb Wataghin” (IFGW), State University of Campinas, Campinas 13083-859, SP, Brazil
7
Departamento de Materiais Odontológicos e Prótese, Faculdade de Odontologia de Araraquara, São Paulo State University (UNESP), P.O. Box 1680, Araraquara 14801-903, SP, Brazil
8
Faculty of Engineering of Guaratinguetá, São Paulo State University (UNESP), Guaratinguetá 12516-410, SP, Brazil
9
PPGQ-GERATEC, Universidade Estadual do Piauí, Rua: João Cabral, N. 2231, P.O. Box 381, Teresina 64002-150, PI, Brazil
*
Author to whom correspondence should be addressed.
Int. J. Mol. Sci. 2022, 23(18), 10589; https://doi.org/10.3390/ijms231810589
Submission received: 11 August 2022 / Revised: 31 August 2022 / Accepted: 6 September 2022 / Published: 13 September 2022
(This article belongs to the Collection Feature Papers in Materials Science)

Abstract

:
In this work, α-Ag2−2xCuxWO4 (0 ≤ x ≤ 0.16) solid solutions with enhanced antibacterial (against methicillin-resistant Staphylococcus aureus) and antifungal (against Candida albicans) activities are reported. A plethora of techniques (X-ray diffraction with Rietveld refinements, inductively coupled plasma atomic emission spectrometry, micro-Raman spectroscopy, attenuated total reflectance–Fourier transform infrared spectroscopy, field emission scanning electron microscopy, ultraviolet–visible spectroscopy, photoluminescence emissions, and X-ray photoelectron spectroscopy) were employed to characterize the as-synthetized samples and determine the local coordination geometry of Cu2+ cations at the orthorhombic lattice. To find a correlation between morphology and biocide activity, the experimental results were sustained by first-principles calculations at the density functional theory level to decipher the cluster coordinations and electronic properties of the exposed surfaces. Based on the analysis of the under-coordinated Ag and Cu clusters at the (010) and (101) exposed surfaces, we propose a mechanism to explain the biocide activity of these solid solutions.

Graphical Abstract

1. Introduction

Transition metal tungstates belong to an important family of inorganic functional materials with potential applications in various fields [1] and have been widely studied [2,3,4] due to their unique structures and photoluminescence emissions at room temperature [5]. Among them, alpha silver tungstate (α-Ag2WO4) has received special attention from the scientific community because of its interesting properties, including photoluminescence emission [5,6,7,8,9,10], antimicrobial activity [11,12,13,14,15,16,17,18], and photocatalytic properties [11,13,19,20,21,22,23,24,25]. As a result, α-Ag2WO4 has found exciting applications in cationic dye removal [16], catalytic systems for the oxidation of cyclohexene to adipic acid [22], electrocatalysis [26,27,28,29], the chemical fixation of CO2 gas [30], and as a lubricant [31] and gas sensor [32,33].
The formation of solid solutions, i.e., multicomponent materials by the mixture of two or more crystalline solids, is a widely used strategy to fine-tune colligative properties, crystal structures, band gap values, and optical properties, and has many positive impacts on material functionalities [34], in addition to representing opportunities to understand structure–property relationships [35]. Solid solutions involving the addition of copper (Cu2+) in different materials have been reported in the literature; for instance, in TiO2 and Ag3PO4 to enhance photocatalytic activity [36,37], as well as magnetic, electrical, and optical properties in ZnO and MoO3 [38,39], and to enhance the optical and magnetic properties of Ca0.9Cu0.01WO4 [40], Zn1xCuxWO4 [41], Mn1xCuxWO4 [42], Fe62xCo10Y8CuxB20 [43], and DyCo5xCux [44]. Asokan et al. [45] pointed out that substituting Co2+, Ni2+, and Cu2+ cations into YMnO3 increased its electric conductivity and magnetism. Din et al. [46] studied the composition of La0.7Pr0.3Fe11.4xCuxSi1.6 and verified that a small amount of Cu substitution is capable of tuning performance for application in magnetic refrigerators without loss of hysteresis. Mary et al. [47] investigated the structure and superconducting properties of Cu in NdBa2Cu3xMxO7+δ (M = Fe, Co) and NdBa2Cu3xMxO7−δ (M = Ni, Zn) systems, and found that the phase transition and superconducting properties depend on the type and concentration of Cu2+ cations.
α-Ag2WO4 is a p-type semiconductor that displays unique structural and electronic flexibility that allows the substitution of Ag and/or W by different metal cations. In recent years, our research group has been engaged in research to investigate the doping process at the α-Ag2WO4 [48,49,50,51,52]. In particular, we have investigated α-Ag2−2xZnxWO4 (0 ≤ x ≤ 0.25) [49] and α-Ag2−2xNixWO4 (0 ≤ x ≤ 0.08) [48] solid solutions. Very recently, Nobre et al. investigated structure, morphology, optical properties, and photocatalytic performance in the degradation of RhB under blue-light-emitting-device irradiation of Ag1.98Cu0.02WO4 [53]. Ayappan et al. investigated the photocatalytic removal of methylene blue and tetracycline hydrochloride antibiotics using α-Ag2–2xCuxWO4 (0 ≤ x ≤ 0.12) solid solutions [54]. However, there has been no investigation of a copper-doped α-Ag2WO4 semiconductor as a biocide material reported in the literature until now.
Motivated by the experimental and theoretical works showing the enhanced photocatalytic activity and to investigate the structure, morphology, and biocide activity related to the substitution of α-Ag2WO4 microcrystals by Cu2+ cations, we report in this study the solid solution synthesis of α-Ag2xCuxWO4 (0 ≤ x ≤ 0.16) by the co-precipitation (CP) method. These microcrystals were structurally characterized by X-ray diffraction (XRD) with Rietveld refinements, inductively coupled plasma atomic emission spectrometry (ICP-AES), micro-Raman spectroscopy (MR), attenuated total reflectance–Fourier transform infrared spectroscopy (ATR-FTIR), field emission scanning electron microscopy (FE-SEM), ultraviolet–visible spectroscopy (UV–vis), and photoluminescence (PL) emissions. X-ray photoelectron spectroscopy (XPS) was employed to determine the local coordination of Cu2+ cations. To fully unlock the potential of these materials, a deeper understanding of their electronic structures is required. In the present work, the experimental results are sustained by first-principles calculations at the density functional theory (DFT) level to decipher the geometry, electronic properties, and magnetism corresponding to the (010) and (101) surfaces of α-Ag2−2xCuxWO4 (0 ≤ x ≤ 0.16) microcrystals. The performances of the as-synthesized α-Ag2−2xCuxWO4 (0 ≤ x ≤ 0.16) solid solutions as antibacterial and antifungal agents against methicillin-resistant Staphylococcus aureus (MRSA) and Candida albicans (C. albicans), respectively, were investigated in detail.
From the analysis of the results presented here, we can rationalize how the morphology was modified through the incorporation of Cu2+ cations, which were associated with changes in the electronic structures of the exposed surfaces. Furthermore, a relationship between morphology and biocide activity was established to explain cell death.

2. Results and Discussion

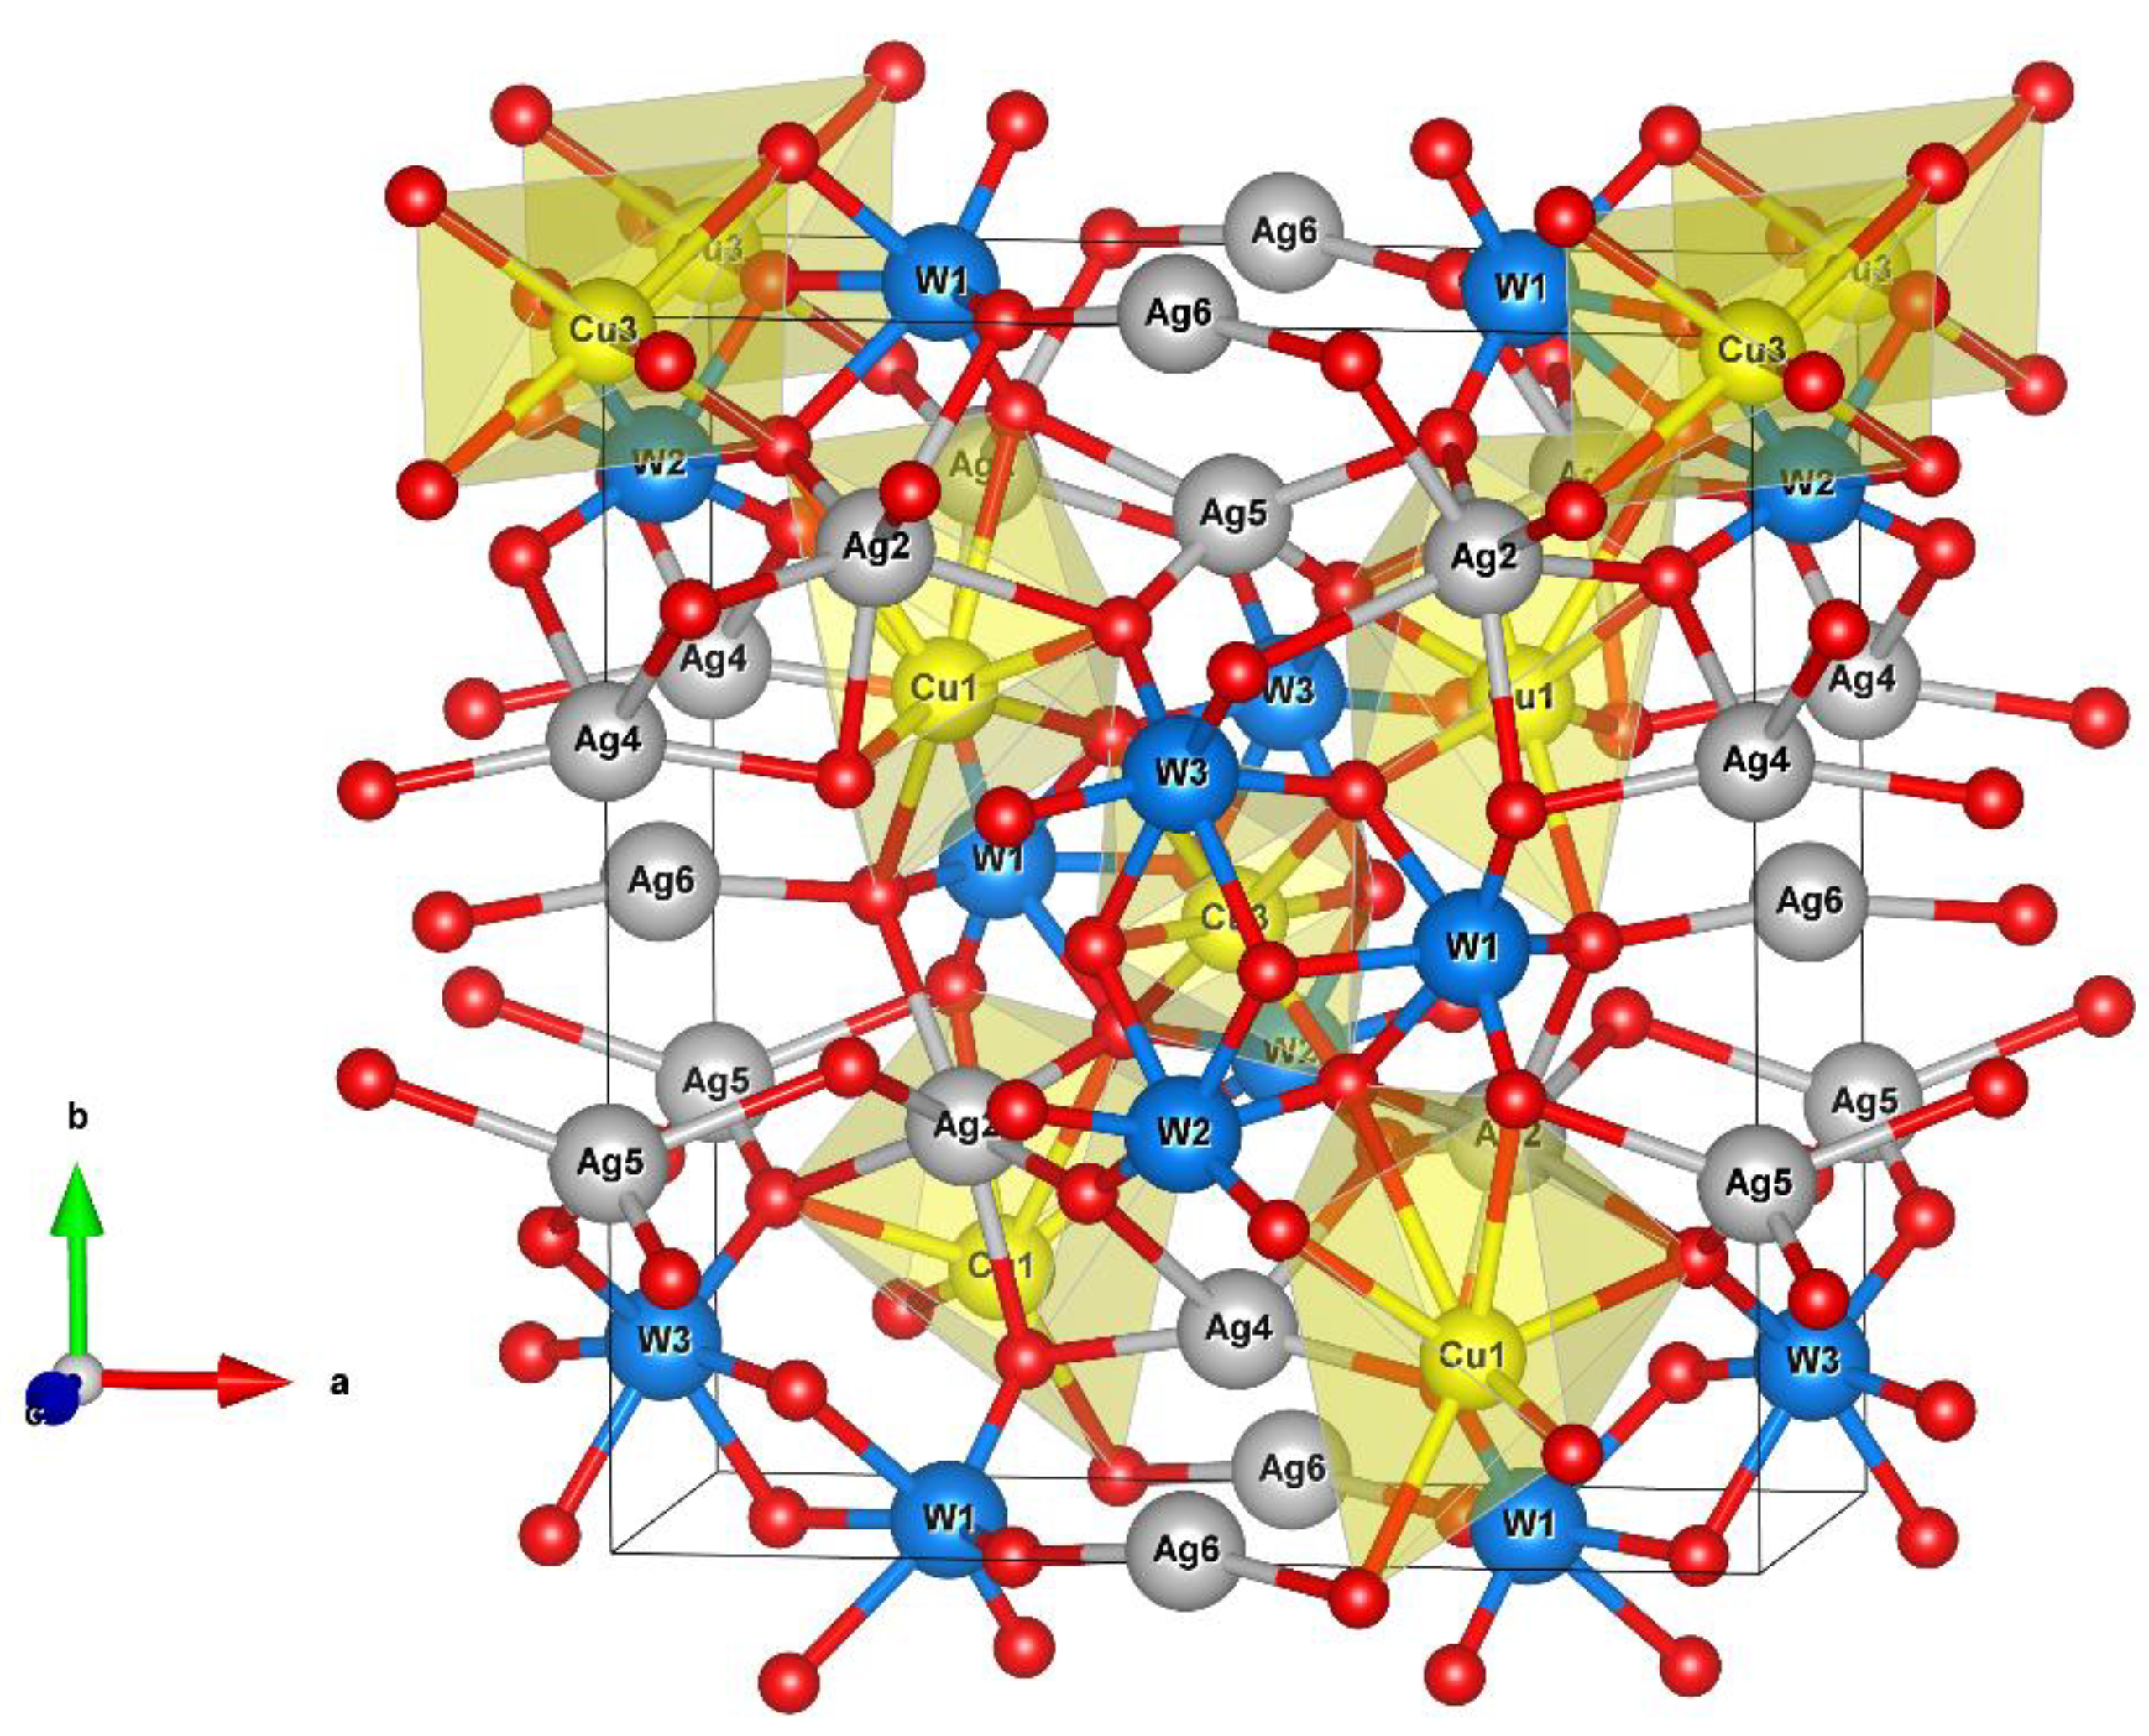
2.1. Structural Analysis of the Cu Atom in the α-Ag2WO4 Structure

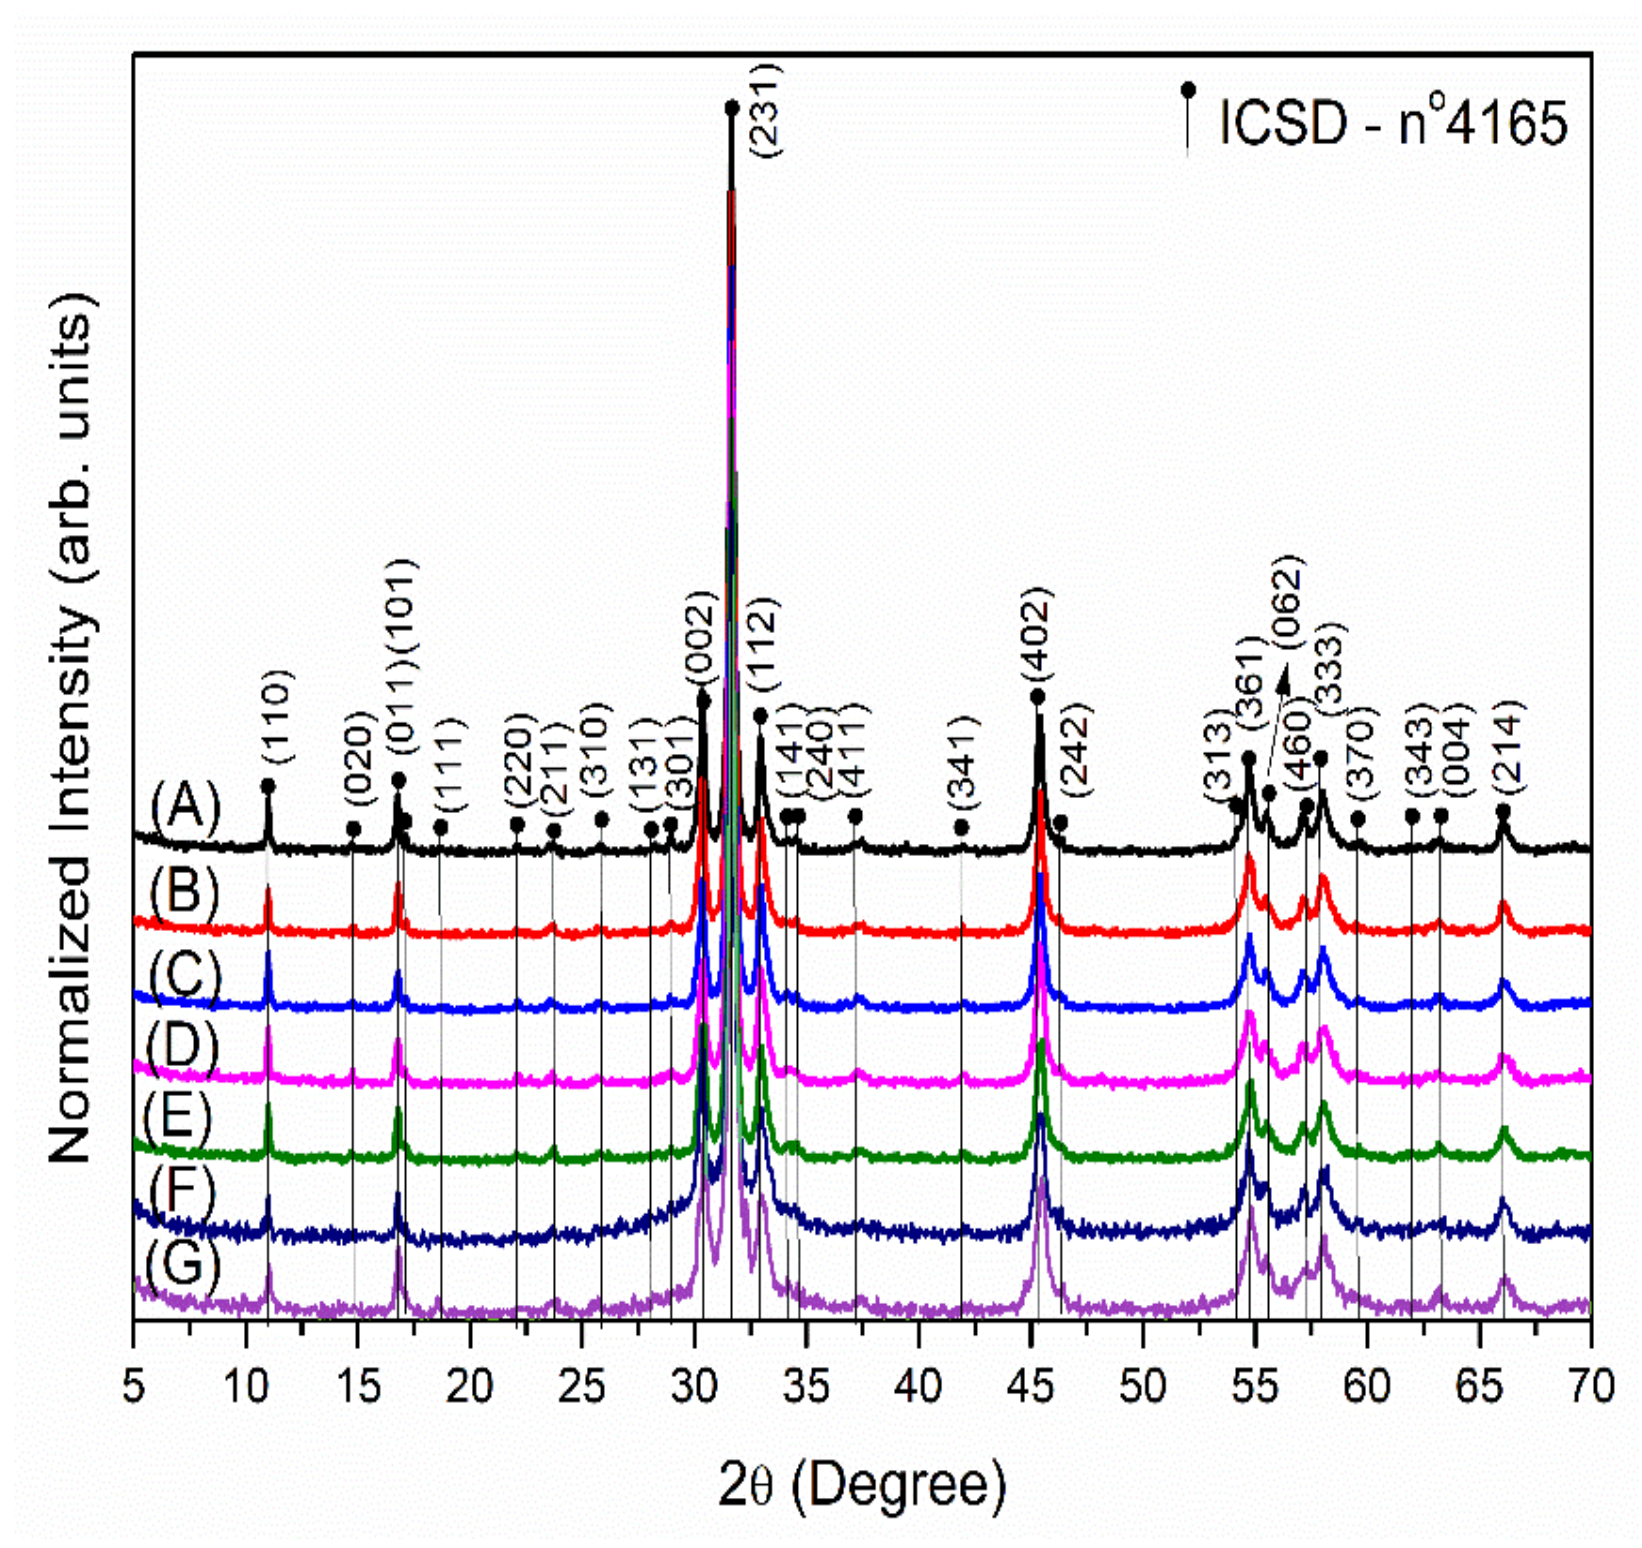
2.1.1. XRD and Rietveld Rietveld Refinement

The XRD patterns of the α-Ag2−2xCuxWO4 (0 ≤ x ≤ 0.16) solid solutions are displayed in Figure 1. In Figure 1A–G, from 2θ = 30.3 to 33.1, a slight shift to higher 2θ values can be observed. This behavior confirmed the successful substitution of the Ag+ by the Cu2+ cations at the A-site of the orthorhombic α-Ag2WO4 structure. The results show that all peaks matched those of α-Ag2WO4 crystals with an orthorhombic structure and the (Pn2n) space group (Inorganic Crystal Structure Database (ICSD), no. 4165). The strong peak associated with the (231) plane suggested that the α-Ag2−2xCuxWO4 (0 ≤ x ≤ 0.16) solid solutions display high crystallinity. The incorporation of Cu cations did not change the lattice structure, and only a structural distortion was observed; the intensity of the peaks decreased as the amount of Cu cations in the crystalline lattice was increased. From a structural point of view, the differences in the ionic radii between the Ag and Cu cations, 1.15 Å and 0.73 Å, respectively, led to the formation of defects (in the bulk and at the surfaces and interfaces), which decreased the long-range structural ordering.
The orthorhombic α-Ag2WO4 structure is composed of W atoms coordinated to six oxygen atoms to form a distorted octahedral [WO6] cluster. The Ag atoms present different local coordinations, namely, Ag1 and Ag2 (coordination seven), Ag3 (coordination six), Ag4 and Ag5 (coordination four), and Ag6 (coordination two), in which all Ag atoms are located in the centers of distorted clusters, i.e., [AgOy] (y = 2, 4, 6, and 7) [6,55]. The optimized lattice parameters from the DFT calculations for the α-Ag2WO4 structure were a = 10.78 Å, b = 12.60 Å, and c = 5.72 Å. These values showed good agreement with the experimental values of a = 10.880 Å, b = 12.027 Å, and c = 5.901 Å, the deviations being 0.92%, 4.52%, and 3.05%, respectively.
Rietveld refinement was performed to obtain the lattice parameters, unit cell volumes, and atomic positions of the α-Ag2−2xCuxWO4 (0 ≤ x ≤ 0.16) solid solutions by means of the general structure analysis system software [56] (see Figure S1). The experimental data from the Rietveld refinement are shown in Table S1. An analysis of the results showed a good fit for the values of χ2 and R (RBragg, Rwp, and Rp). The Rietveld results were consistent with the ICSD N° 4165 pattern, corresponding to an orthorhombic structure, which thus confirmed the XRD results and the absence of additional phases in the α-Ag2−2xCuxWO4 (0 ≤ x ≤ 0.16) solid solutions. Based on the Rietveld refinement, there were small differences between the unit cell parameters of the samples, which were associated with slight structural distortions. This behavior was due to the process of substitution of Ag by Cu, which triggered a rearrangement in the geometry of the [AgOy] by [CuOy] clusters and led to the formation of structural defects in the α-Ag2−2xCuxWO4 solid solutions. Tables S2–S5 list the values of the atomic coordinates (x, y, z) for Ag, W, O, and Cu atoms obtained by Rietveld refinements. Distortions can be noted in the atomic coordinates (x, y, z) of all atoms. These structural changes are more prominent in the O positions, since they are the lighter atoms and form a 3D framework, which is connected to other cations within the crystalline lattice. On the basis of the Rietveld refinement (see Figure S1 and Tables S2–S5), it was possible to estimate which sites were occupied by Cu2+ cations in the α-Ag2WO4 structure. At lower concentrations, it was not possible to determine the Cu distribution correctly due to the limits of detection and quantification of typical laboratory X-ray diffractometers, which can be 5−10% [57]. Therefore, the Cu site was identified for samples with x = 0.08 and 0.16, and, according to these results, for the sample with x = 0.08, the substitution of Ag+ by Cu2+ cations took place in distorted deltahedral [AgO7] clusters. In contrast, at x = 0.16, the substitution took place in both distorted deltahedral [AgO7] and octahedral [AgO6] clusters. For each substitution of an Ag+ by a Cu2+ cation, an Ag vacancy (VAg) was created in the system, which increased the structural and electronic disorder of the samples. Figure 2 depicts a 3D model of the orthorhombic α-AgWO4 structure, in which the clusters where the substitution process takes place are displayed.

2.1.2. Theoretical Models

From the Rietveld refinement, several possibilities for the process of substituting the Cu cations in the different positions of the α-Ag2WO4 unit cell were computationally investigated, and the preferential atomic sites are shown in Figure S2. The processes of substituting Ag by Cu at different sites bring about structural and electronic changes in the crystalline lattice and, consequently, also in its morphological features and optical properties.

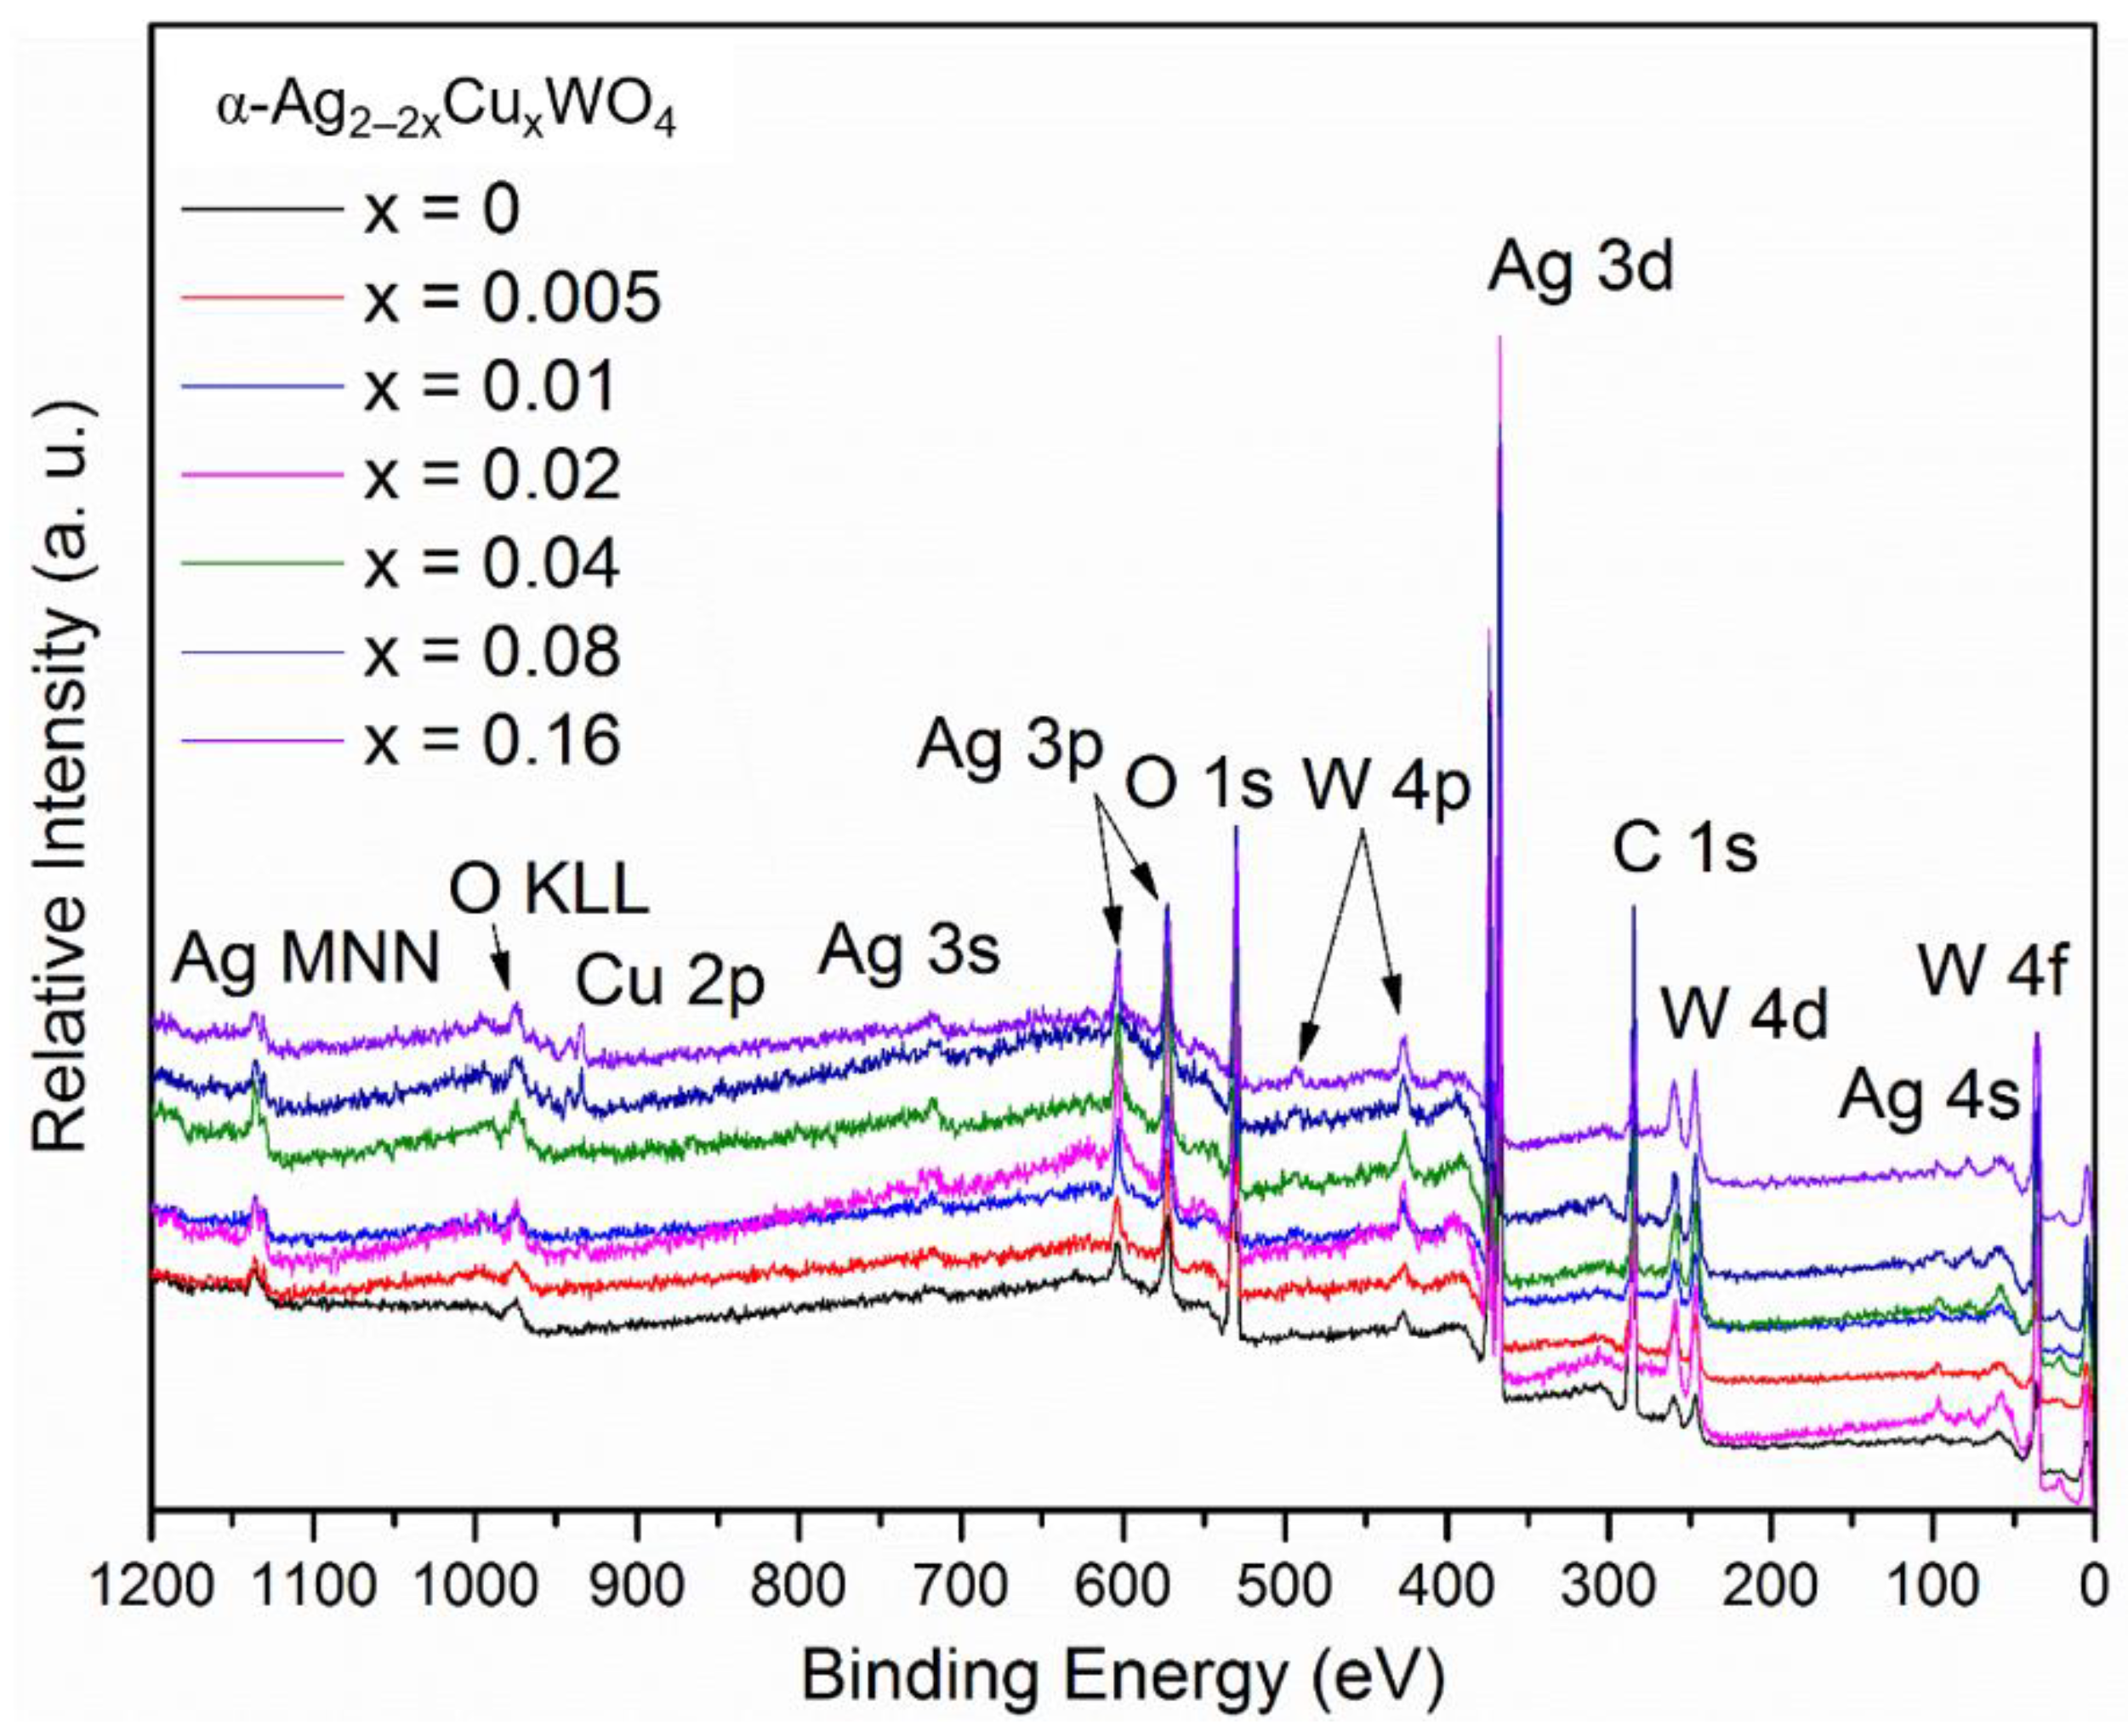
2.1.3. XPS Spectroscopy

XPS spectroscopy was employed to identify the chemical composition, binding energy, and oxidation state of the components present on the surfaces of the materials. The binding energies were obtained by calibrating the spectra using the C-1s peak at 284.50 eV. Figure 3 shows the XPS survey spectrum of the α-Ag2−2xCuxWO4 (0 ≤ x ≤ 0.16) solid solutions. Ag-3d, W-4f, O-1s, and Cu-2p peaks were identified for all the samples, and no impurities were detected. The C-1s contamination peak can be ascribed to adventitious hydrocarbons from the internal vacuum chamber of the XPS instrument.
Table S6 lists the XPS peak ratios between C, Ag, W, O, and Cu in At% for typical XPS survey spectra of the α-Ag2−2xCuxWO4 (0 ≤ x ≤ 0.16) solid solutions. The small deviations are due to the degree of insertion of the Cu2+ cations into the bulk and surface. In addition, a high-resolution spectrum for each element was obtained to further analyze the surface. The high-resolution Ag-3d XPS spectrum in the range of 364–380 eV presented two peaks (see Figure S3a–g). Moreover, this XPS spectrum was deconvoluted into two components located at 367.4 and 373.4 eV (Δ = 6 eV), corresponding to Ag-3d5/2 and Ag-3d3/2, thus indicating the presence of Ag+ cations. The additional deconvoluted components at 368.2 and 374.2 eV (Δ = 6 eV) were due to the presence of Ag0, which can be related to the Ag nanoparticles coated on the surfaces of the materials.
The high-resolution W-4f XPS spectra in the range from 32 to 40 eV presented two XPS peaks, as shown in Figure S3h–n. The two components located at 34.8 and 37.0 eV (Δ = 2.2 eV) were attributed to W-4f7/2 and W 4f5/2, which confirmed the W6+ oxidation state. The two components at 34.2 (W-4f7/2) and 36.0 eV (W-4f5/2) (Δ = 2.2 eV) can be ascribed to W5+, and the single component at 40 eV can be assigned to W-5p3/2. The high-resolution O 1s spectra in the range from 526 to 537 eV are presented in Figure S3o–u. The O-1s peaks tended to be broad, with multiple overlapping components, and it was not possible to uniquely fit these components. In general, the peaks located at 529.6, 531.2, and 532.8 eV corresponded to the Ag–O and W–O bonds and the presence of the OH group of the H2O molecule, respectively. The broad overlapping peak in the region of ~530 eV was associated with the oxygen in the crystal lattice of the α-Ag2−2xCuxWO4 solid solutions.
The high-resolution Cu-2p XPS spectra in the range of 926–965 eV is shown in Figure S4a–f. The two component peaks at 934 and 954 eV (Δ = 20 eV) were assigned to Cu-2p3/2 and Cu-2p1/2, respectively. Chemical state differentiation using only XPS spectra can be difficult, but the two Cu2+ satellite peaks located at 942 and 962 eV (Δ = 20 eV) could be considered signatures of the 2+ oxidation state of the Cu element in the samples. The satellite peaks were associated with a lack of symmetry in the d9 electronic configuration related to the Jahn–Teller effect.
Moreover, the Cu-2p3/2 peak in the Cu (II) was shifted and much broader compared to that in the Cu (I). Since copper was found to exist in the Cu2+ state, it is reasonable to assume that these Cu2+ cations would modify the lattice with concomitant structural distortions along the bonds of the O−W−O−Cu, O−Cu−O frameworks.

2.1.4. ICP-AES Spectroscopy

ICP-AES analysis was used not only to quantify the Cu cations but also to verify the purity of the compounds. The corresponding data are presented in Table 1.
An analysis of the ICP-AES results showed that the theoretical and calculated concentrations (expressed in ppm) were very similar, with only small deviations being detected. Therefore, we can conclude that practically all the added Cu cations were incorporated into the α-Ag2WO4 lattice and that no impurities were observed, in agreement with the XPS spectroscopy analysis.

2.1.5. MR-Raman and ATR-FTIR Spectroscopy

MR-Raman and ATR–FTIR spectroscopies provide information on the degree of structural order/disorder effects at short range. The experimental and theoretical values of the Raman-active modes are presented in Figure S5.
As shown in Figure S5A, there are 19 vibrational Raman-active modes. According to Lin et al. [25], the Raman-active modes in the range from 500 to 1000 cm−1 are associated with vibrations in the distorted octahedral [WO6] clusters, and those between 100 and 500 cm−1 can be assigned to the external vibrational modes of the [AgOy] (y = 2, 4, 6, and 7) clusters [25]. The most intense mode at 879.6 cm−1 originates from the symmetric stretching vibration of the W–O bonds in the distorted octahedral [WO6] clusters [25,58]. Sreedevi et al. [59] reported that the other Raman modes at wavenumbers between that of the most intense mode and 500 cm−1 are related to bending modes of the O–W–O moiety as well as inter-chain deformations and lattice modes.
The Raman-active modes associated with an orthorhombic structure confirmed that all the α-Ag2−2xCuxWO4 (0 ≤ x ≤ 0.16) solid solutions exhibited short-range structural order. However, as revealed by the FWHM, the Raman peak position, and the Raman peak intensity of the α-Ag2−2xCuxWO4 (0 ≤ x ≤ 0.16) solid solutions, the peaks exhibited broader vibrational modes with the increase in Cu (see Table S7). The line widths of the most intense mode at 879.6 cm−1 (A1g) Raman-active modes were obtained through deconvolution of the Lorentzian curves.
The line width was observed to show a dependence on the Cu concentration. The α-Ag2−2xCuxWO4 (x = 0.00, 0.01, and 0.08) solid solutions showed Raman peak widening at 879.4 cm−1, and the intensity of this Raman mode decreased with increasing Cu content, which was associated with the process of substituting Ag by Cu (see Figure S5A and Table S7). These substitutions changed the values of the bond lengths in the [AgOy] clusters (y = 2, 4, 6, and 7), and the distorted octahedral [WO6] clusters. This behavior was confirmed by means of the vibrational Raman-active modes between 100 and 500 cm−1, which were associated with the external vibrational modes of the [AgOy] clusters (y = 2, 4, 6, and 7). The intensities and shifts of these vibrational Raman-active modes varied with Cu content.
Thus, we concluded that the inclusion of Cu cations in the α-Ag2WO4 lattice modifies the vibrational modes associated with the stretching, bending, and torsion movements along the framework by the [AgOy]–[WO6]–[CuOy] clusters. The experimental and theoretical values for the Raman-active modes were in good agreement (see Figure S5B). However, small shifts between the Raman modes and the two active modes (A1g) of α-Ag2WO4 were not observed in this work, in contrast to the results reported by Turkovic et al. [60]. These small variations might have occurred due to the effect of phonon confinement, the different synthesis method employed, crystal size, or a doping effect [10,59].
Figure S5C shows the experimental ATR-FTIR spectra of the α-Ag2−2xCuxWO4 (0 ≤ x ≤ 0.16) solid solutions. ATR-FTIR data were obtained in the range from 400 to 1000 cm−1, in which only the characteristic peaks corresponding to the distorted tetrahedral [WO4]2− moiety were present. The ATR-FTIR spectra in Figure S5C exhibit intense peaks between 865 and 730 cm−1, at 567 cm−1, and at 400–450 cm−1, which were due to the W–O bonds related to asymmetric stretching vibration modes of the [WO4]2− group (see the inset in Figure S5C) [5,10,25]. The vibrational IR-active modes at 681 and 670 cm−1 were attributed to the bending modes of the W–O–W moiety, and the band at 631 cm−1 was related to the asymmetric stretching of the bridging oxygen atoms in the W2O2 moiety [48,49]. Moreover, some IR-active modes below 400 cm−1 related to active vibrational internal and external modes assigned to the symmetric bending and torsional motion of the distorted [WO4]2− group, respectively, as well as to the motion of Cu metal were not observed due to the limit of detection of the equipment.

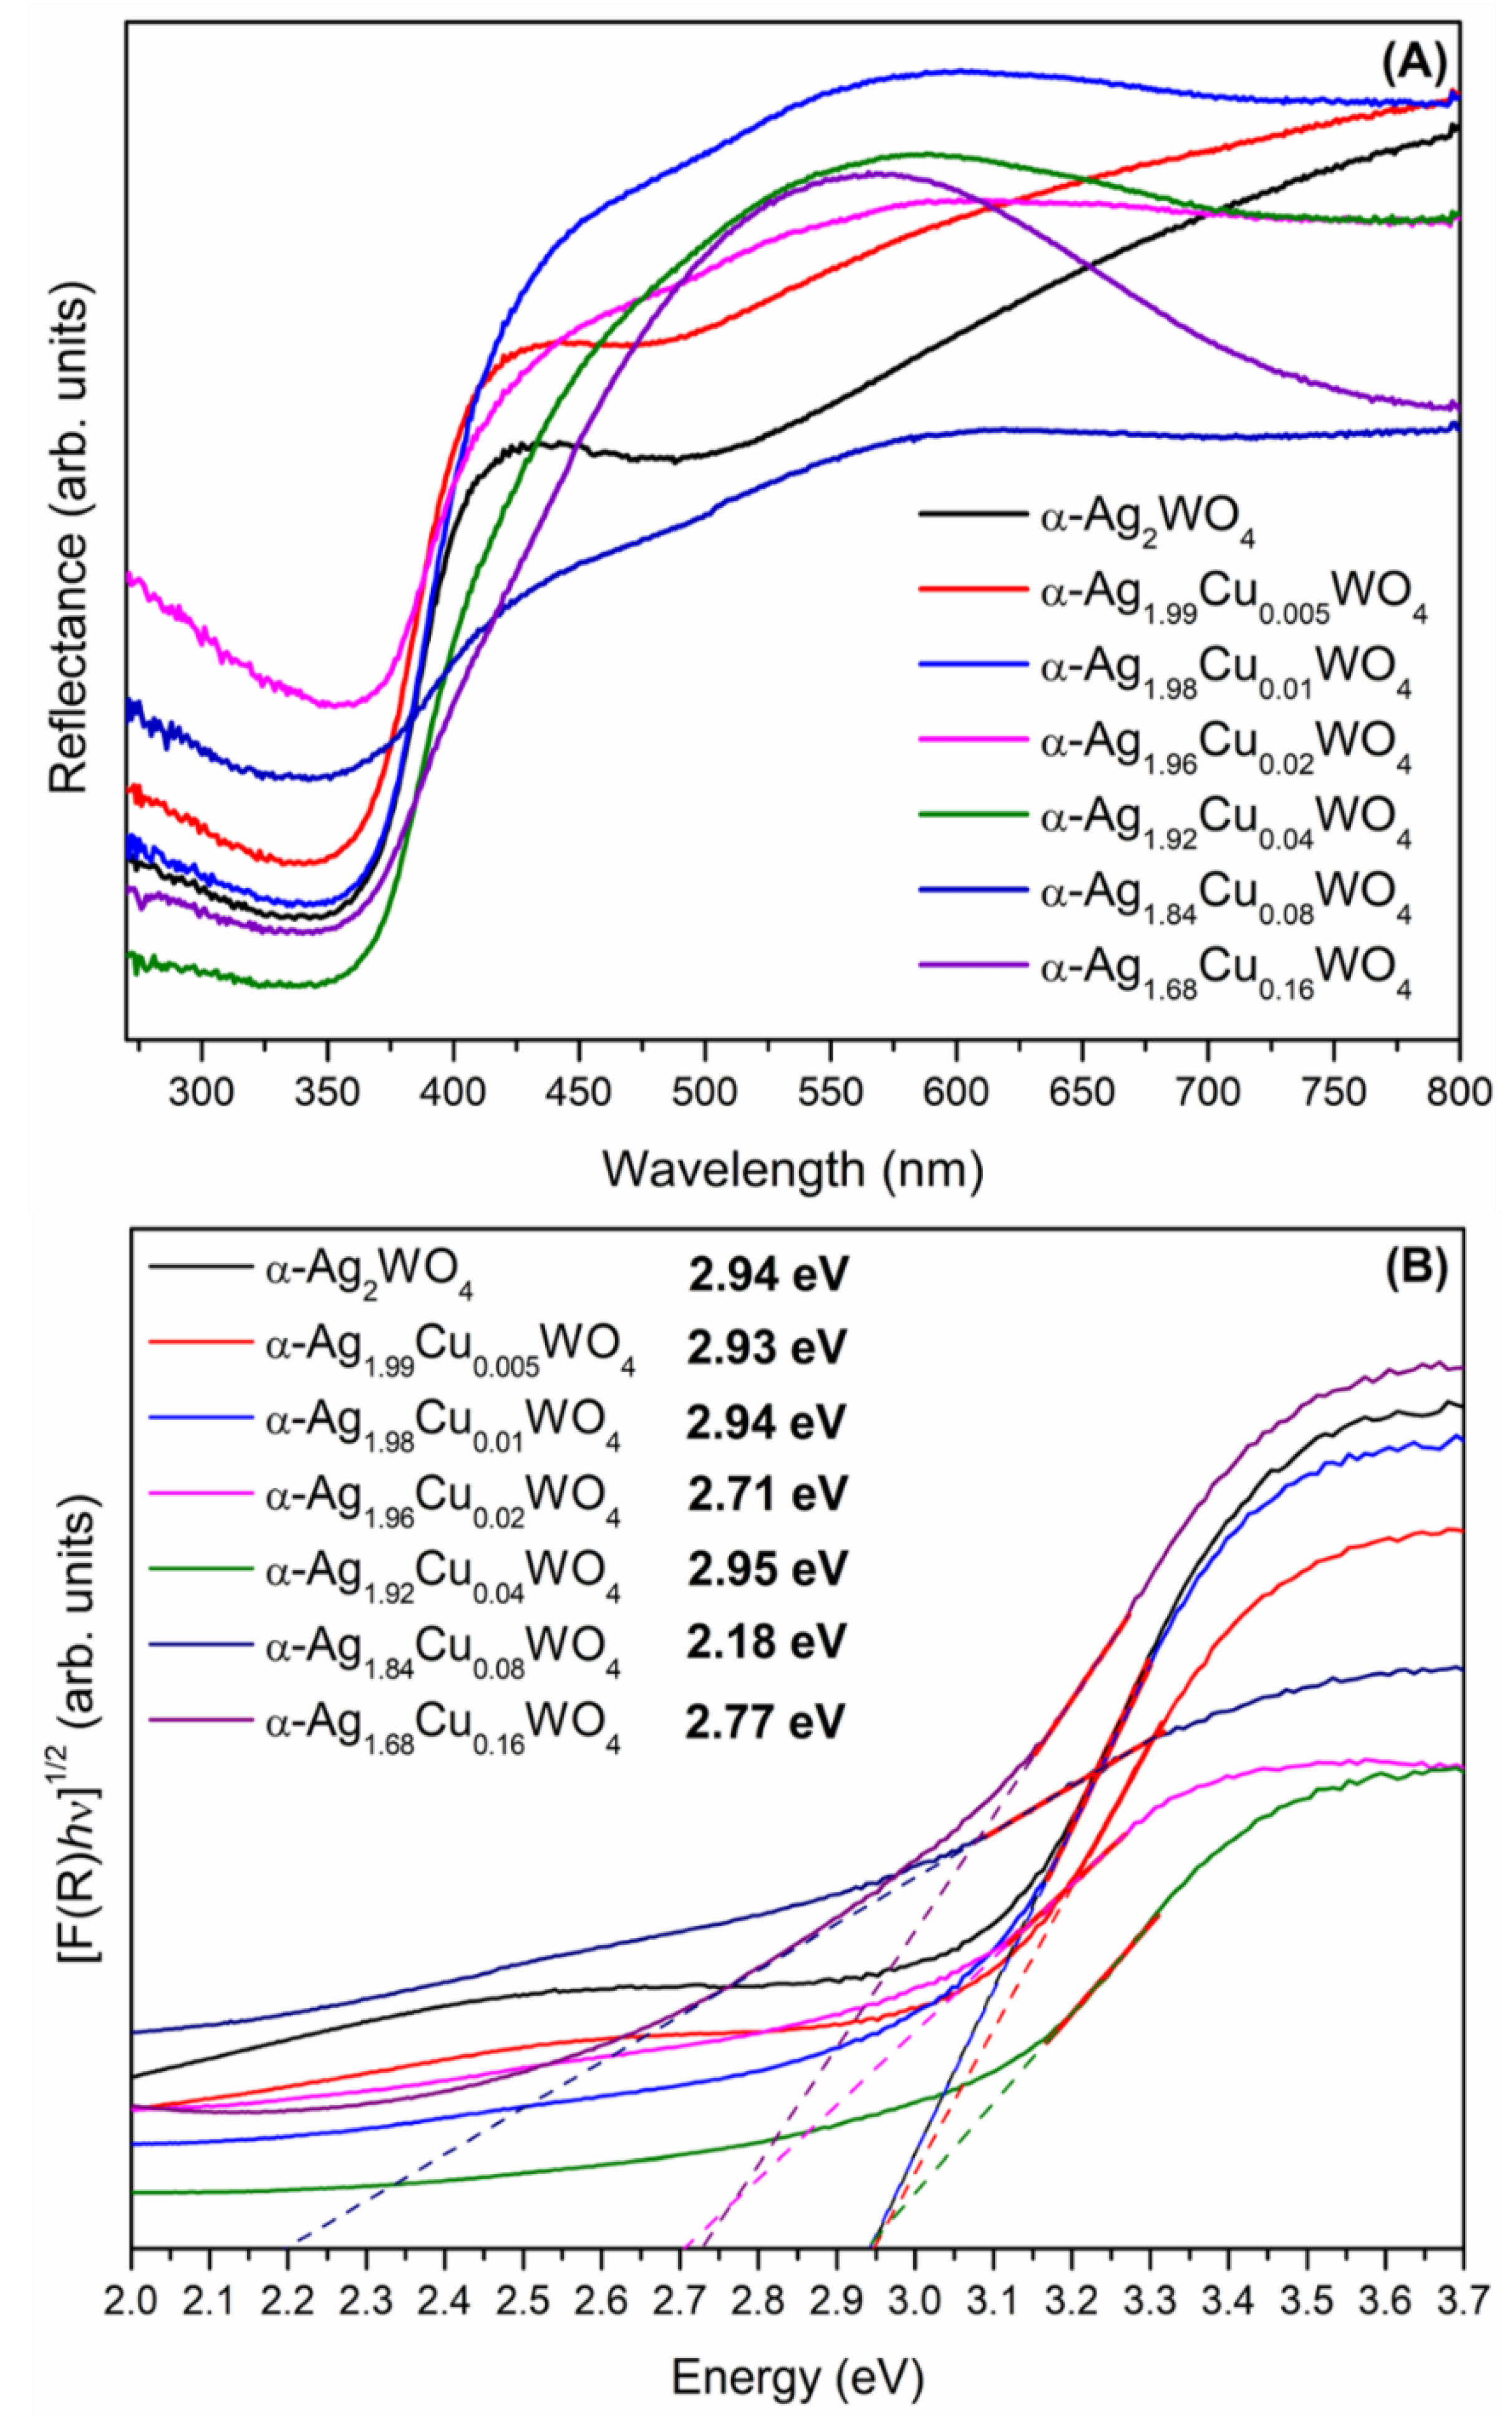
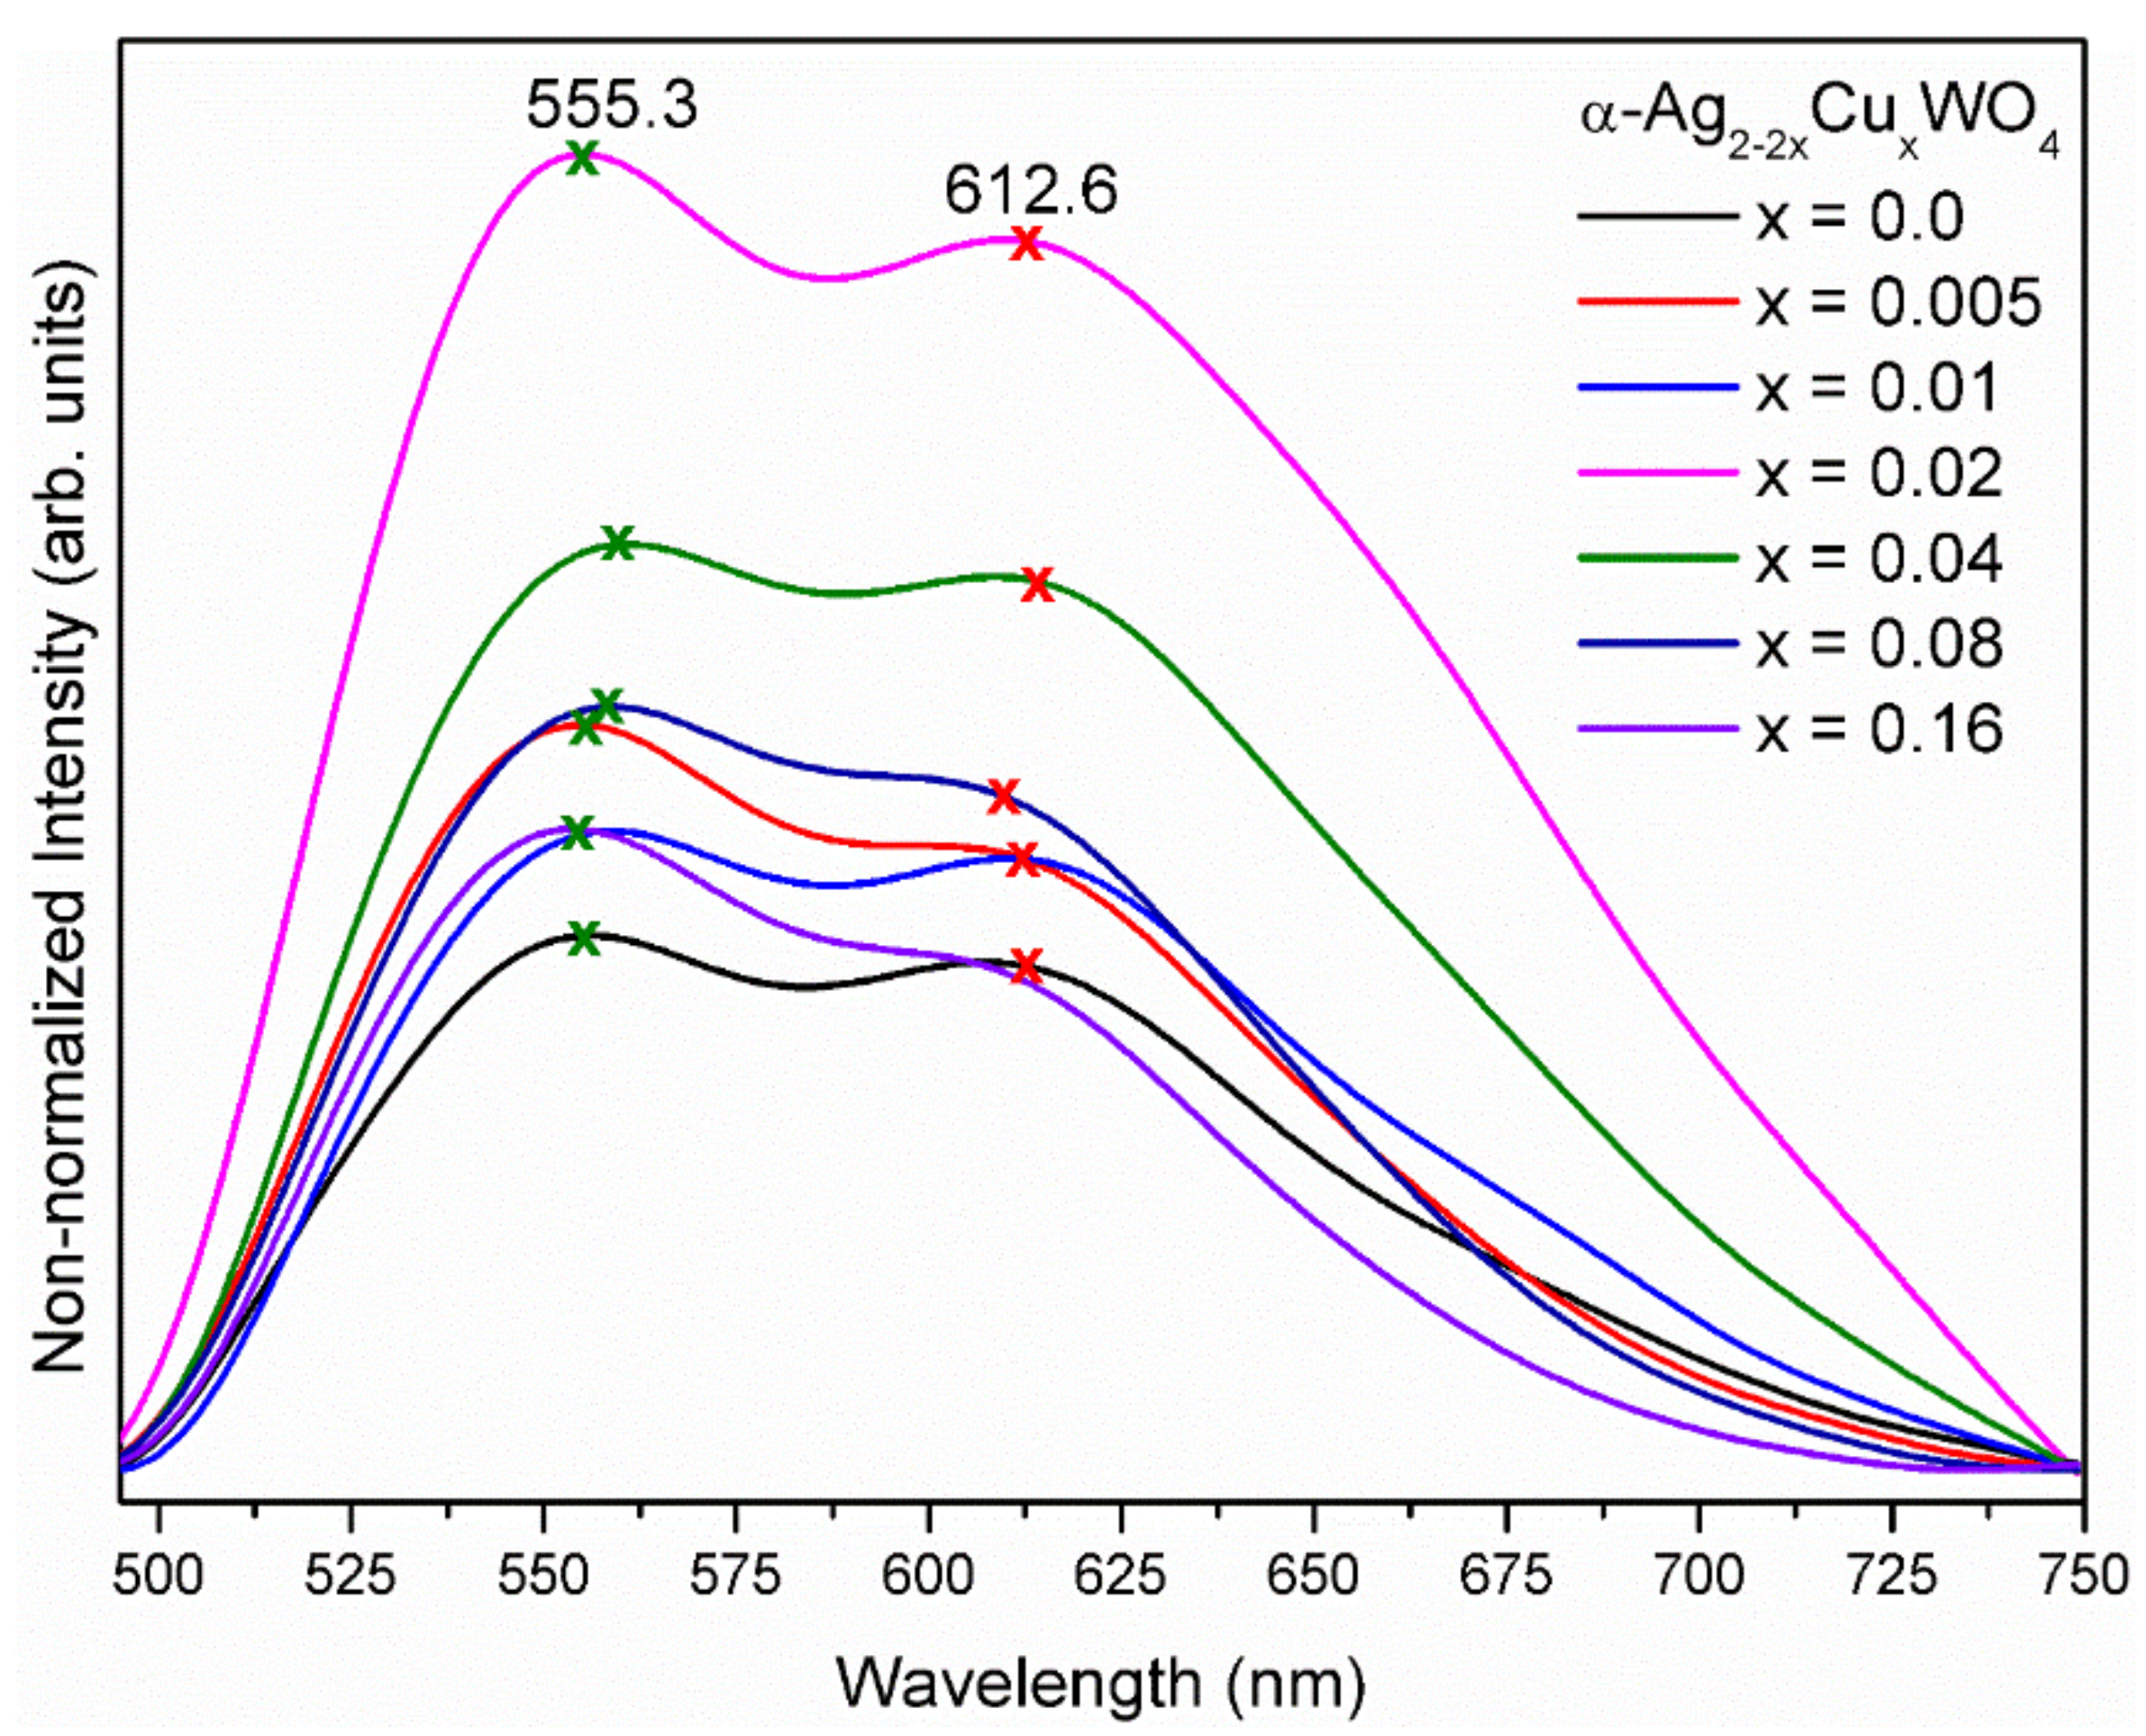
2.1.6. UV–Vis Spectroscopy and PL Emission

The modifications in the electronic structures of α-Ag2−2xCuxWO4 (0 ≤ x ≤ 0.16) solid solutions in the medium-range mainly affect the optical properties of materials and can be studied through UV–vis spectroscopy and PL emissions. Therefore, UV–vis absorption can be used to evaluate the formation of intermediate energy levels between the valence band (VB) and the conduction band (CB) caused by defects and/or distortions in the lattice, and, consequently, to determine the band gap energy (Egap) of the semiconductors. PL measurements provide important information about the structural defect densities in the lattice and can be used to corroborate the UV–vis spectra reported previously in the literature [6,25,61].
Figure 4A displays the UV–vis diffuse reflectance and optical Egap value spectra of α-Ag2−2xCuxWO4 (0 ≤ x ≤ 0.16) solid solutions. All samples presented a broad absorption band from 350 to 425 nm. This broad absorption band suggested that the emission process takes place via a multi-level process in the distorted octahedral [WO6] clusters [5]. A blue–green shift was observed due to the presence of Cu cations in the α-Ag2WO4 crystal lattice. According to Sreedevi et al. [5], this exponential optical absorption edge and band gap energy are controlled by the degree of structural disorder in the lattice. Thus, in the α-Ag2−2xCuxWO4 (x = 0.005 to 0.02) solid solutions, a small blue–green shift in the absorption peak with respect to the pure α-Ag2WO4 solid solutions was noted, while for the α-Ag2−2xCuxWO4 (x = 0.04 to 0.16) solid solutions, a small red shift was observed. This behavior can be attributed to the fact that the insertion of small quantities of Cu cations into the α-Ag2WO4 crystal lattice results in low structural order in the long- and short-range, while for samples doped above x = 0.04, greater structural disorder and distortions occur, in agreement with the XRD and Raman data. Therefore, the optical Egap values for α-Ag2−2xCuxWO4 (0 ≤ x ≤ 0.16) solid solutions were obtained in accordance with our previous work [49]. Figure 4B shows the optical Egap values, which were obtained by extrapolation of the linear part of the curve according to the Kubelka–Munk [62] equations. Assuming that the α-Ag2−2xCuxWO4 (0 ≤ x ≤ 0.16) solid solutions underwent indirect allowed electronic transitions, the Egap values for the samples were calculated using n = 2. The experimental Egap values displayed an important decrease, as was observed for all of the α-Ag2−2xMxWO4 (M = Cu, Ni, and Zn) systems [48,49], thus demonstrating that the M-cations in the α-Ag2WO4 crystal lattice promote distortions in the short, medium, and long ranges, and consequently generated defects in the lattice that influenced the optical properties of the material. Moreover, the substitution process involving Cu cations inside the α-Ag2WO4 crystal lattice influenced its Egap values more strongly than the incorporation of Ni and Zn cations [48,49].
Moreover, this behavior was probably due to the electric and magnetic properties of Cu, as well as Jahn–Teller distortion. This substitution of Ag by Cu ions was accompanied by a reduction in the Egap energy due to the formation of intermediate energy levels in the forbidden band, with a concomitant increase in the structural disorder. This effect resulted in a symmetry-breaking process due to the changes in bond lengths and bond angles throughout the framework composed of the [AgOy]–[WO6]–[CuOy] clusters, which, in turn, created intermediate levels in the band gap [5,10,25,50]. The calculated band gap value for pristine α-Ag2WO4 crystals was 2.92 eV, while the experimental band gap obtained was 2.94 eV (0.7% deviation), showing excellent agreement between the theoretical calculations and experimental measurements.
Figure 5 shows the PL emissions of the α-Ag2−2xCuxWO4 (0 ≤ x ≤ 0.16) solid solutions under 405 nm excitation in the emission range from 490 to 750 nm. Broad band profiles were observed with maximum emissions in the green range and orange–red region, at around 555.3 and 612.6 nm, respectively.
The PL emission broad bands are typical of a multilevel emission process and occurred due to the presence of intermediate energy levels inside the forbidden band region as a result of the distortion of [AgOy]–[WO6]–[CuOy] clusters and defects at medium range [25,49,59] within the α-Ag2−2xCuxWO4 solid solution lattice.
However, in the α-Ag2−2xCuxWO4 (0.005 ≤ x ≤ 0.16) solid solutions, a green shift was observed, and an increase in the emission intensity was also observed for the samples of α-Ag2−2xCuxWO4 (0.005 ≤ x ≤ 0.02) solid solutions. Above this concentration, the PL emission intensity decreased. The introduction of Cu cations into the α-Ag2WO4 lattice caused different degrees of distortion in different [WO6] clusters in response to the changes in the bond lengths and bond angles along the chain formed by the [AgOy]–[WO6]–[CuOy] clusters. Consequently, the defect density and non-radiative electron–hole recombination rates increased, as was reflected directly in the reduction in the PL intensity.
The effect of the substitution of Ag by Cu cations inside the α-Ag2WO4 lattice on the PL properties was studied and confirmed by the deconvolution of the PL spectrum using the Voigt area function. Figure S6 presents the deconvolution of the PL spectra and the areas of the respective curves of the α-Ag2−2xCuxWO4 (0 ≤ x ≤ 0.16) solid solutions. In these PL spectra, three components at 545 nm (green), 597 nm (yellow), and 653 nm (red) were observed, covering the entire visible electromagnetic spectrum. The samples with increased numbers of Cu ions in the α-Ag2WO4 lattice showed different behavior; the yellow–orange components were clearly the largest in these samples, while in the α-Ag1.96Cu0.02WO4 sample, the red component was the greatest. Therefore, PL emission can be related to several factors, such as intrinsic defects caused by the order or disorder of the system [63], extrinsic defects associated with oxygen vacancies [10], and changes in the morphology (i.e., different shapes and sizes) of the particles, among others. Several authors have proposed that the emissions at 555.3 and 612.6 nm occur due to the charge transfer from distorted W O 6 d x to undistorted W O 6 o x clusters [25,59].
The structural and electronic order/disorder can be associated with the formation of acceptor and donor levels between the CB and VB that may have been introduced by the presence of oxygen vacancies V o z in the lattice. Using the Kröger–Vink notation [64], the oxygen vacancy can be formed in three different charge states ( V o z = V o x , V o , and V o ) ; in terms of constituent clusters, there are W O x · V o z , A g O x · V o z , and C u O x · V o z . These oxygen vacancies generate deep- and shallow-level defect states in the forbidden band region with concomitant shifts in the location and intensity of the PL emission. An analysis of Figure S6 suggested the appearance of a synergistic effect between the intrinsic and extrinsic defects in the α-Ag2−2xCuxWO4 (0 ≤ x ≤ 0.16) solid solutions promoted by the substitution of Ag by Cu cations, with the concomitant appearance of different PL emissions. However, we believe that the deep-level defect states associated with the formation of oxygen vacancies, i.e., A g O x · V o z and C u O x · V o z clusters, are more prominent in an α-Ag2−2xCuxWO4 (0 ≤ x ≤ 0.16) lattice, favoring the yellow–orange emission and a decrease in the intensity of the PL emission.

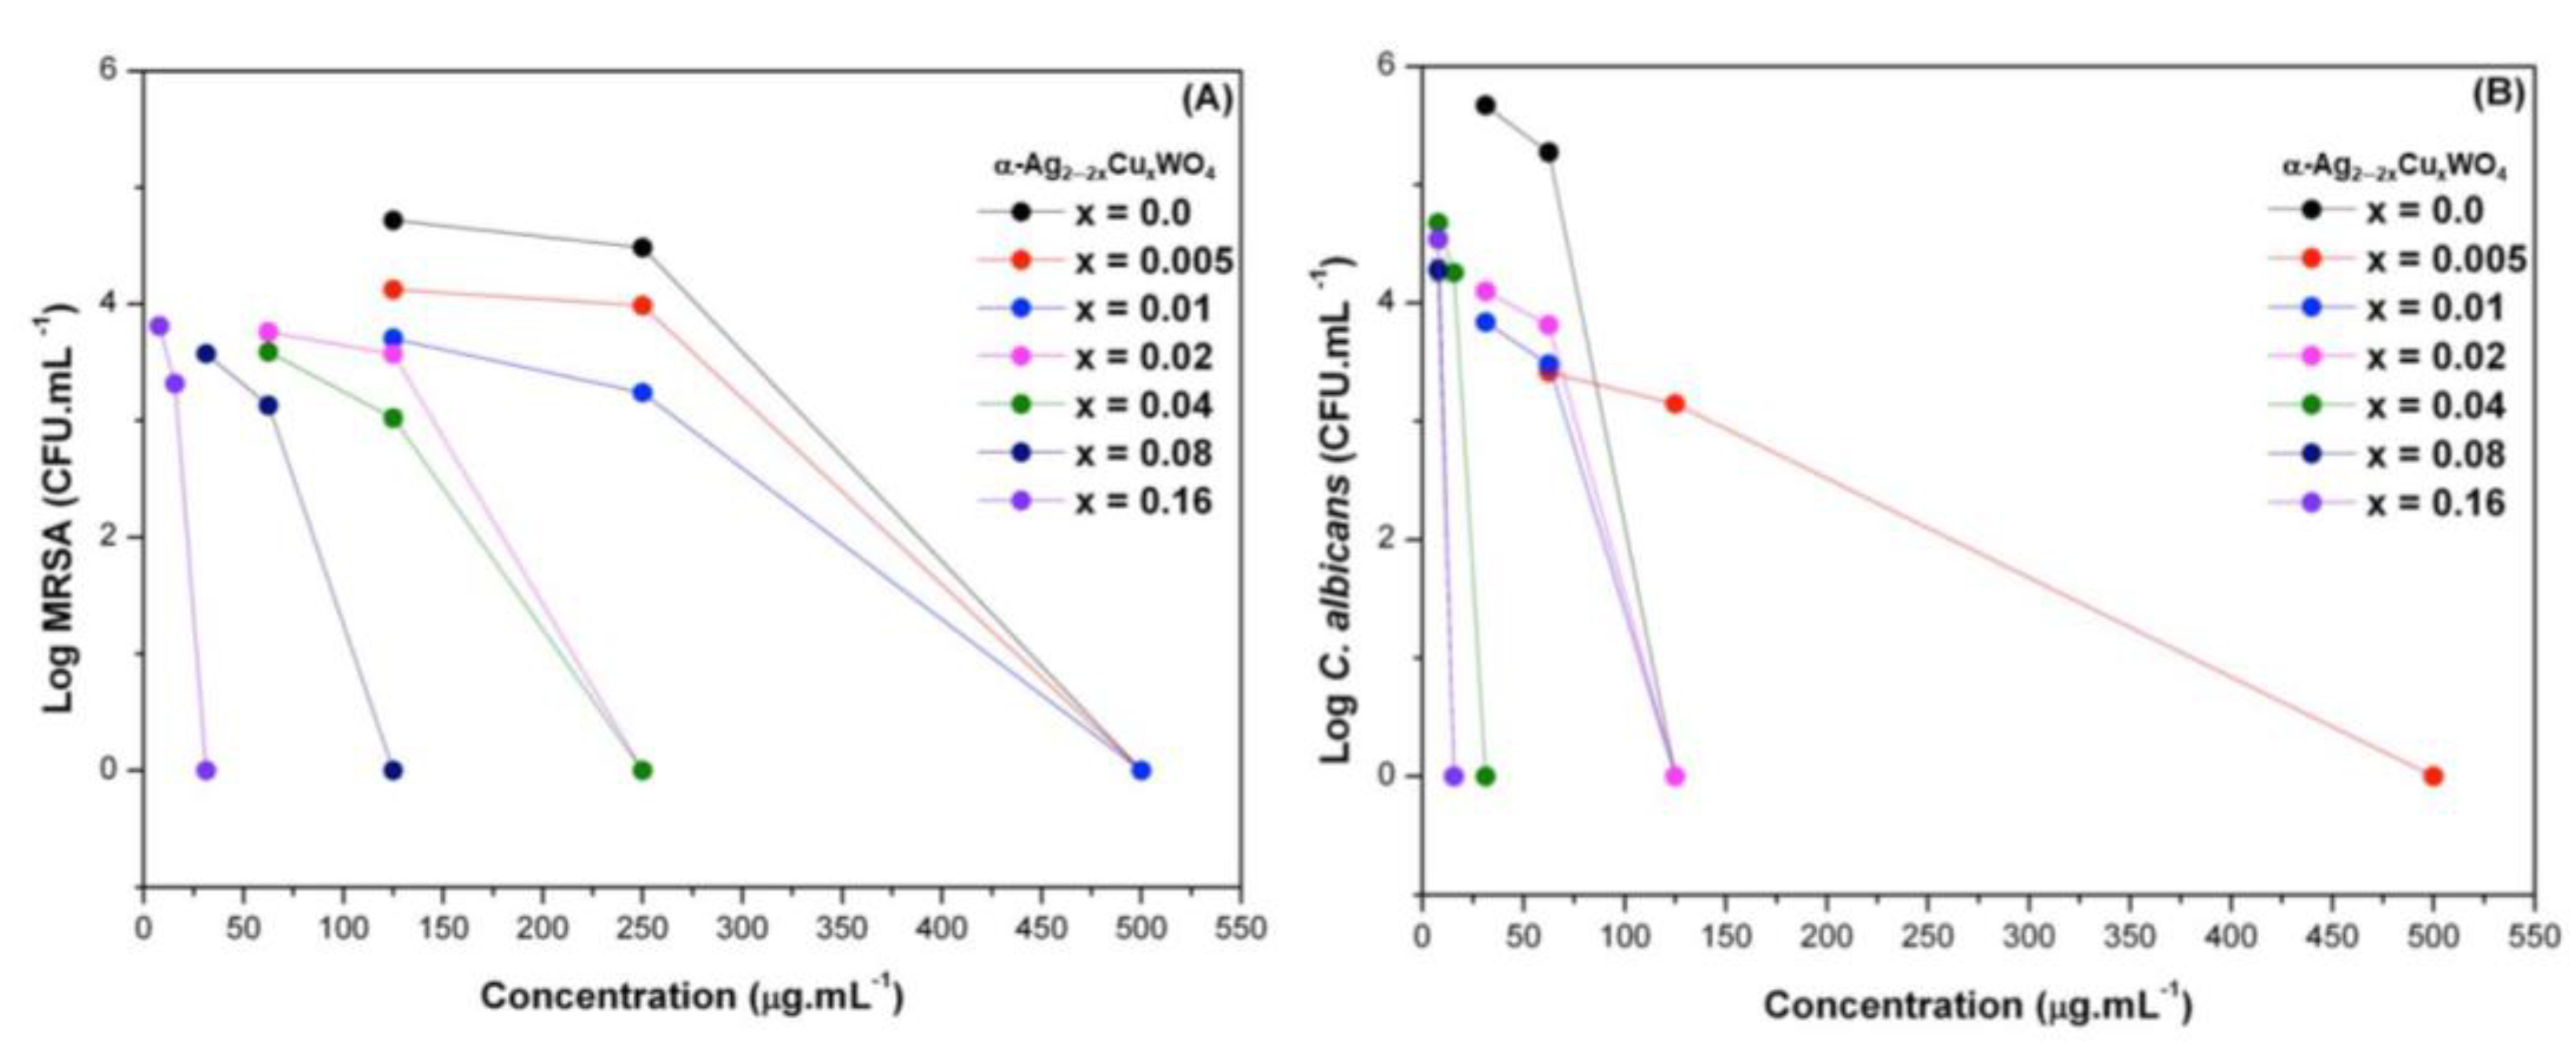
2.2. Antibacterial and Antifungal Activities

In this study, we report, for the first time, the antibacterial and antifungal activity of the Cu-substituted α-Ag2WO4 against two strains of microorganisms: a Gram-positive bacterium and a fungus. Figure 6 shows the corresponding results for the α-Ag2−2xCuxWO4 (0 ≤ x ≤ 0.16) solid solutions. All samples were effective agents against MRSA and C. albicans. As the concentrations of Cu2+ cations increased in these materials, the minimum bactericidal and fungicidal concentrations, i.e., the MBCs and MFCs, respectively, decreased.
The pure α-Ag2WO4 material showed inhibition of MRSA and C. albicans at concentrations of 500 and 125 μg/mL, respectively, while the α-Ag1.68Cu0.16WO4 showed inhibition at concentrations of 31.25 and 15.62 μg/mL for MRSA and C. albicans, respectively. Then, the solid solutions presented enhanced antimicrobial activity that could be related to the capacity of the material to penetrate the membranes of the microorganisms, as well as its ability to change the microenvironment by releasing reactive oxygen species (ROS), which induce DNA and bacterial membrane damage [65,66,67,68,69].

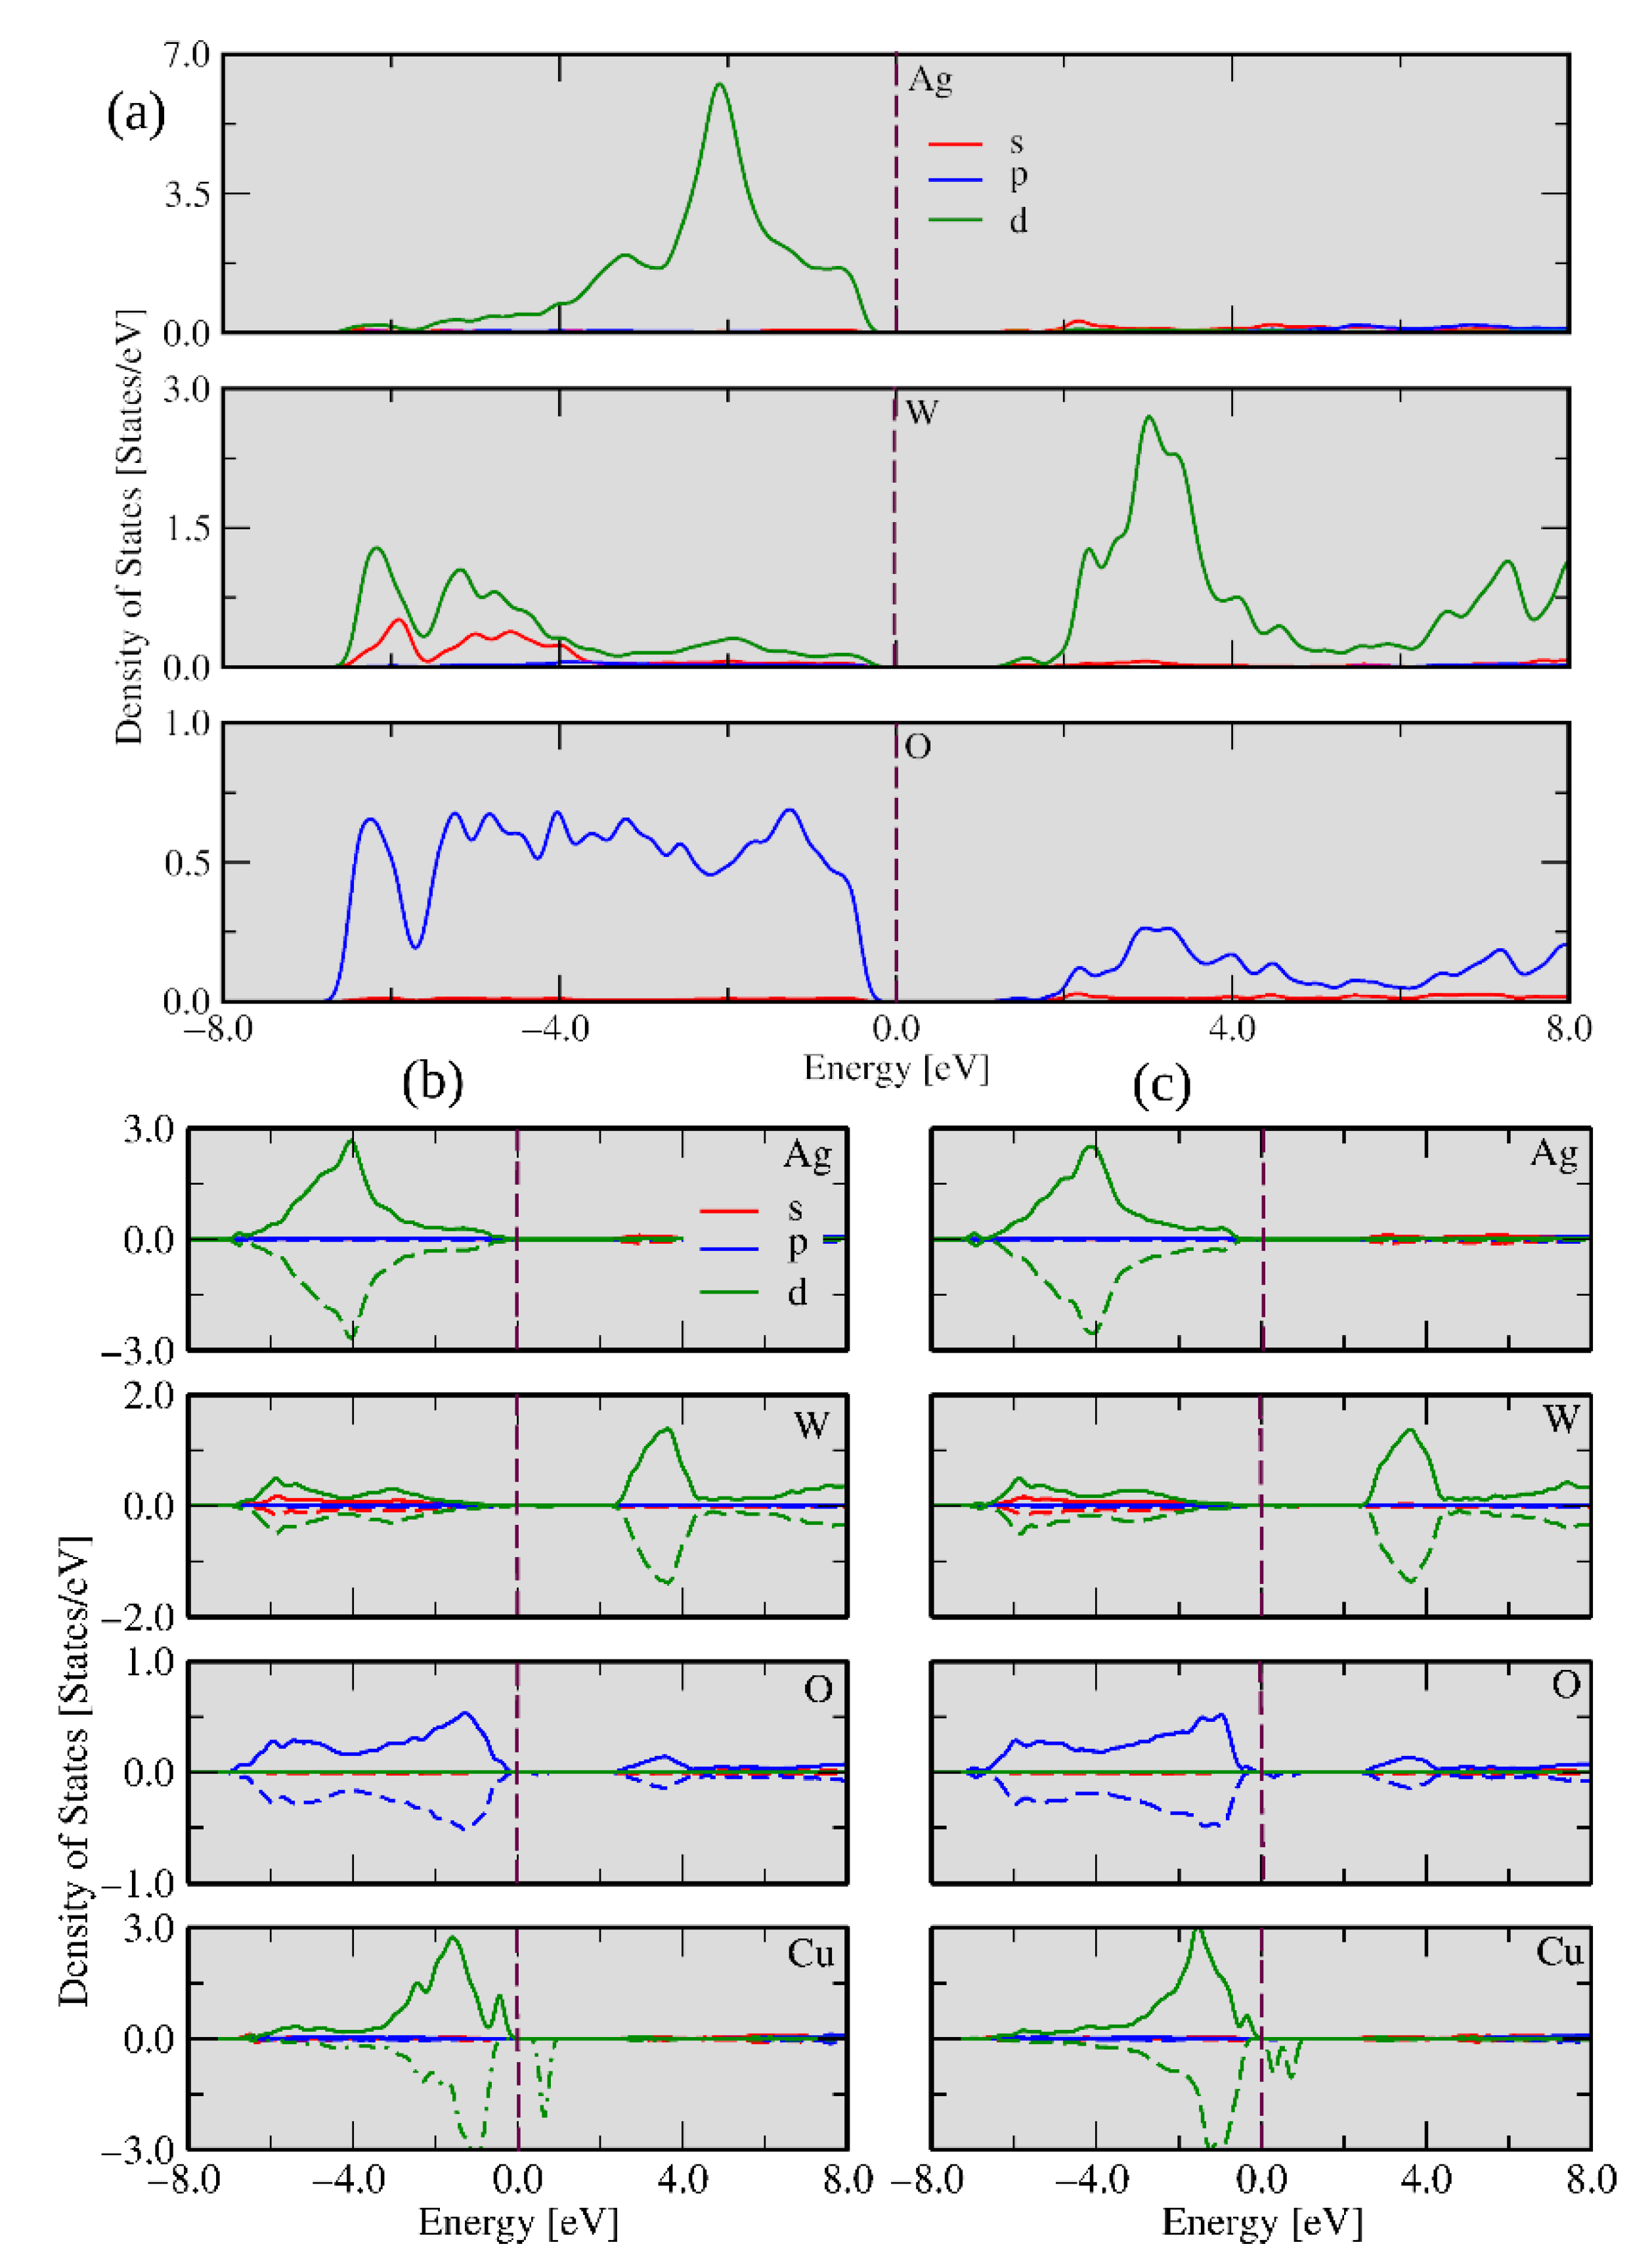
2.3. DFT Calculations

To obtain a deeper insight into the electronic properties of α-Ag2−2xCuxWO4, two theoretical models were constructed: one with the Cu2+ cation substitution at the Ag1 site to represent the α-Ag1.72Cu0.14WO4 solid solution, while the substitution at the Ag1 and Ag3 sites rendered the α-Ag1.34Cu0.33WO4 solid solution, in agreement with the results obtained by the Rietveld refinements (see Figure S2). From the theoretical results, the substitution of the Cu2+ cation at the Ag1 site was energetically preferred to the substitution at the Ag3 site. The densities of states (DOSs) for these models are shown in Figure 7.
Figure 7a depicts the α-Ag2WO4 DOS per atom for the pristine system, while the bottom panel shows the DOSs for the Cu-doped case. In Figure 7b,c, the DOSs of α-Ag1.72Cu0.14WO4 and α-Ag1.34Cu0.33WO4 are displayed, respectively. The results indicate that the main contributions near the Fermi energy for α-Ag2WO4 were composed of the d-Ag, d-W, and p-O orbitals, and for the doped models (α-Ag1.72Cu0.14WO4 and α-Ag1.34Cu0.33WO4) there was also the presence of the d-Cu orbitals. The valence band maxima (VBMs) for α-Ag2WO4, Ag1.72Cu0.14WO4, and α-Ag1.34Cu0.33WO4 were formed by p-O, d-Ag, and d-Cu states, while s-W, d-Cu, and d-Cu levels define the conduction band minima (CBMs). The defects associated with the Ag vacancies and the presence of Cu2+ cations introduced unoccupied down states near the Fermi energy.

2.4. Morphology and Surface Composition: What Really Is Important?

Figure 8A–G display the FE-SEM images. It is known that the α-Ag2WO4 phase exhibits a long prisms or needles with bases similar to a hexagon [9,70]. This morphology was observed for the α-Ag2WO4 and α-Ag2−2xCuxWO4 (x = 0.005, 0.01, and 0.02) microcrystals, which have different sizes, as illustrated in Figure 8A–D. In the α-Ag2−2xCuxWO4 (x = 0.02) microcrystals, rods with curved surfaces and quasi-square shapes were also detected (see Figure 8D).
Figure 8E–G show FE-SEM images of the α-Ag2−2xCuxWO4 (x = 0.04, 0.08, and 0.16) microcrystals. These microcrystals displayed a nanoplate-like morphology and a decrease in particle size which was related to the compound α-Ag1.92Cu0.04WO4.
The FE-SEM images reveal the corresponding surfaces that compose these experimental morphologies. When comparing these crystal shapes with the set of morphologies present in the map of morphologies published by us [71], it was possible to affirm that the long prisms or needles with bases similar to a hexagon is composed of the (010), (001), and (101) surfaces. In contrast, the quasi-square shape is formed only of the (010) and (101) surfaces. This observation supplied the crucial information that the amount of Cu2+ cations in the α-Ag2−2xCuxWO4 (x = 0.04, 0.08, and 0.16) samples increases the stability of the (101) surface for the (001) surface, resulting in the change in its morphology, which can be associated with an increase in the stability of the (101) surface with respect to the (001) surface. Therefore, these solid solutions present (101) and (001) surfaces.
From the values for surface energy (Esurf) calculated [71] by means of the Wulff construction [72], we were able to obtain a morphological evolution as a function of Cu2+ content, as illustrated in Figure 9. This strategy has been applied successfully in different semiconductors [73,74,75,76]. Analyzing these results and comparing them with the data obtained on the bactericidal properties, we can conclude that: (a) Cu2+ modulates the morphology of the solid solution; and that (b) as the contribution of the (001) surface at the morphology increases, the biocide activity also increases.
As noted previously, the solid solution with a higher amount of Cu2+ cations (α-Ag1.68Cu0.16WO4) presented better inhibition of C. albicans and MRSA, and these microcrystals exhibit the quasi-square shape that is formed by (010) and (101) surfaces. In what follows, we describe how we computationally examined the effects of Cu doping on the geometry and electronic structure of the exposed (010) and (101) surfaces in this morphology. Figure 10 displays the undercoordinated Ag and Cu clusters present in the (010) and (101) surfaces for both theoretical models (α-Ag1.84Cu0.08WO4 and α-Ag1.68Cu0.16WO4).
In the α-Ag1.84Cu0.08WO4 model, the Cu substitution occurs only in the Ag clusters at the top of each surface, while in the α-Ag1.68Cu0.16WO4 model, the substitution takes place also in the Ag cluster located inside the surface structure.

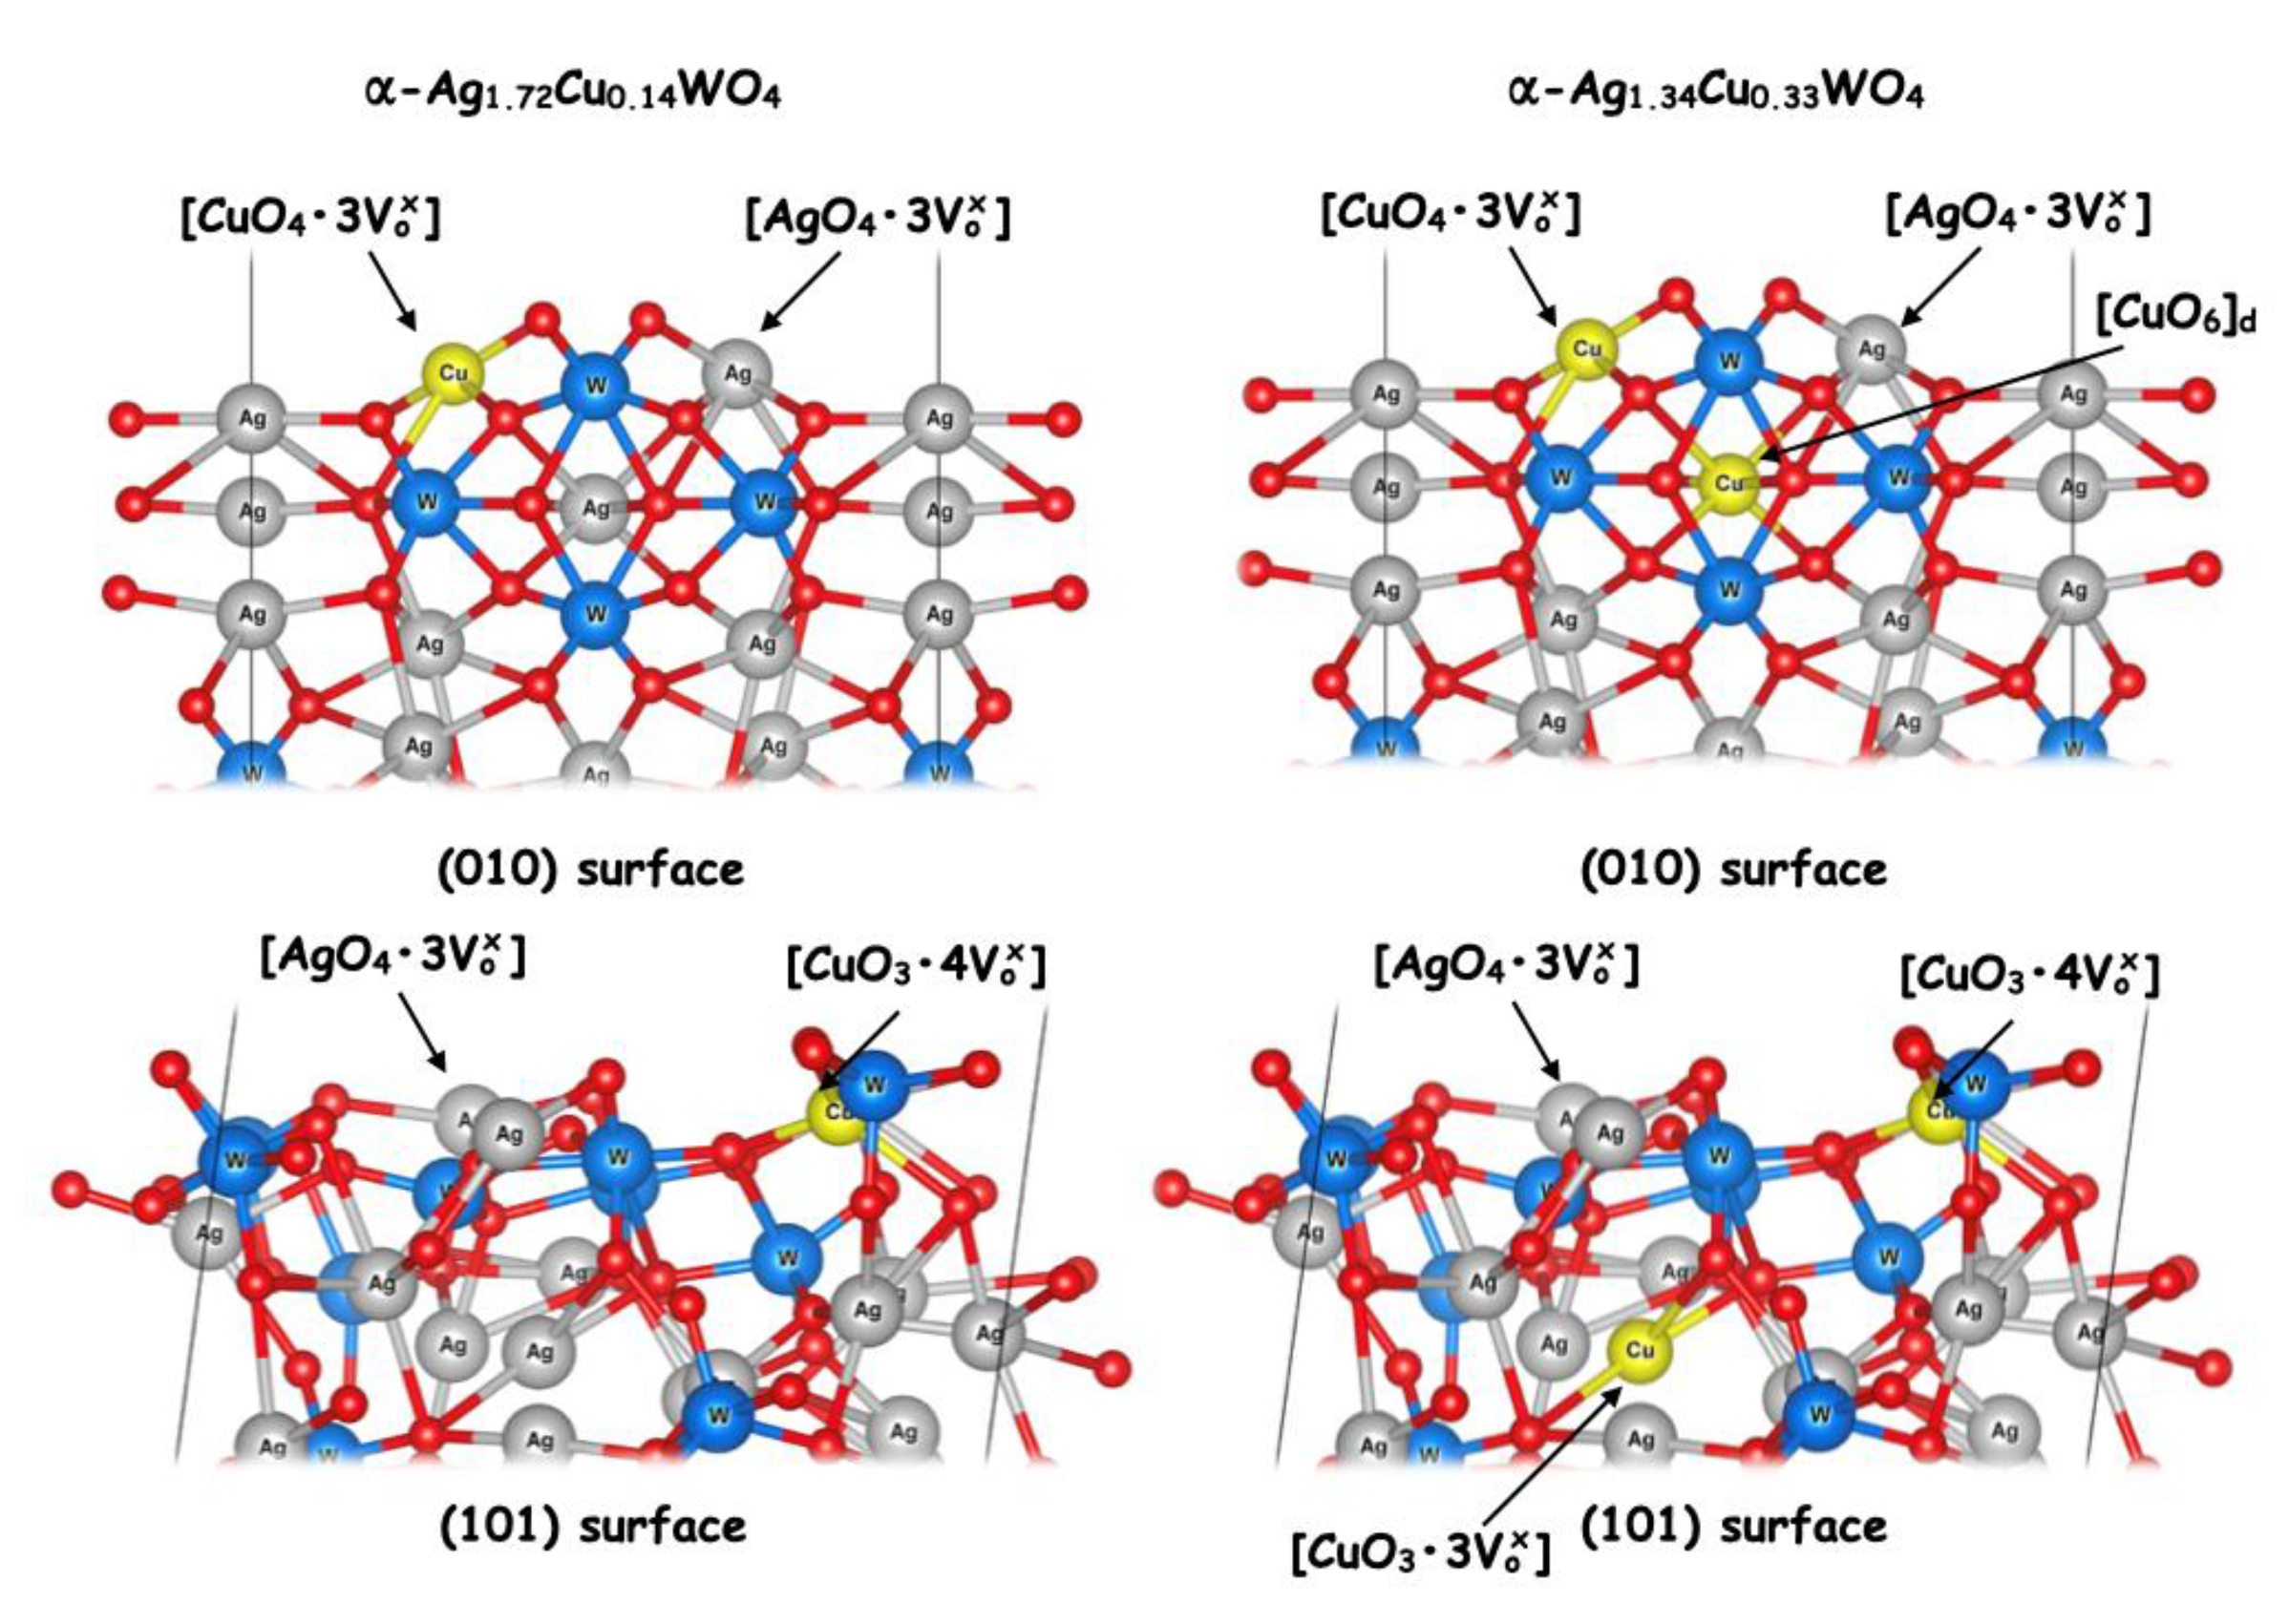
2.4.1. Kröger–Vink Notation for the Exposed Surfaces

An analysis of Figure 10 revealed that the (010) and (101) surfaces present undercoordinated [AgO7] and [AgO6] clusters on the top of the surface where the Cu substitution takes place, with simultaneous formation of the corresponding undercoordinated Cu clusters and oxygen vacancies. These vacancies can be described using the Kröger–Vink notation [64]. In this representation, the vacancy corresponds to V a b , where b is the effective charge and a is the occupied crystalline site. Therefore, the atomic clusters with undercoordinated atoms presented in the last layer of the surface can be described as having neutral oxygen vacancies ( V o x ), where the super index x means “neutral” in the Kröger–Vink notation.
For the α-Ag1.84Cu0.08WO4 model, undercoordinated AgO 4 · 3 V o and CuO 4 · 3 V o clusters as well as a WO 6 cluster were observed on top of the (010) surface, while undercoordinated AgO 4 · 3 V o and CuO 3 · 4 V o clusters could be found in the (101) surface. In the α-Ag1.68Cu0.16WO4 model, Cu atoms were also present in the Ag6 site. The cluster CuO 6 was present in the (010) surface, while an undercoordinated CuO 3 · 3 V o cluster was observed in the (101) surface.

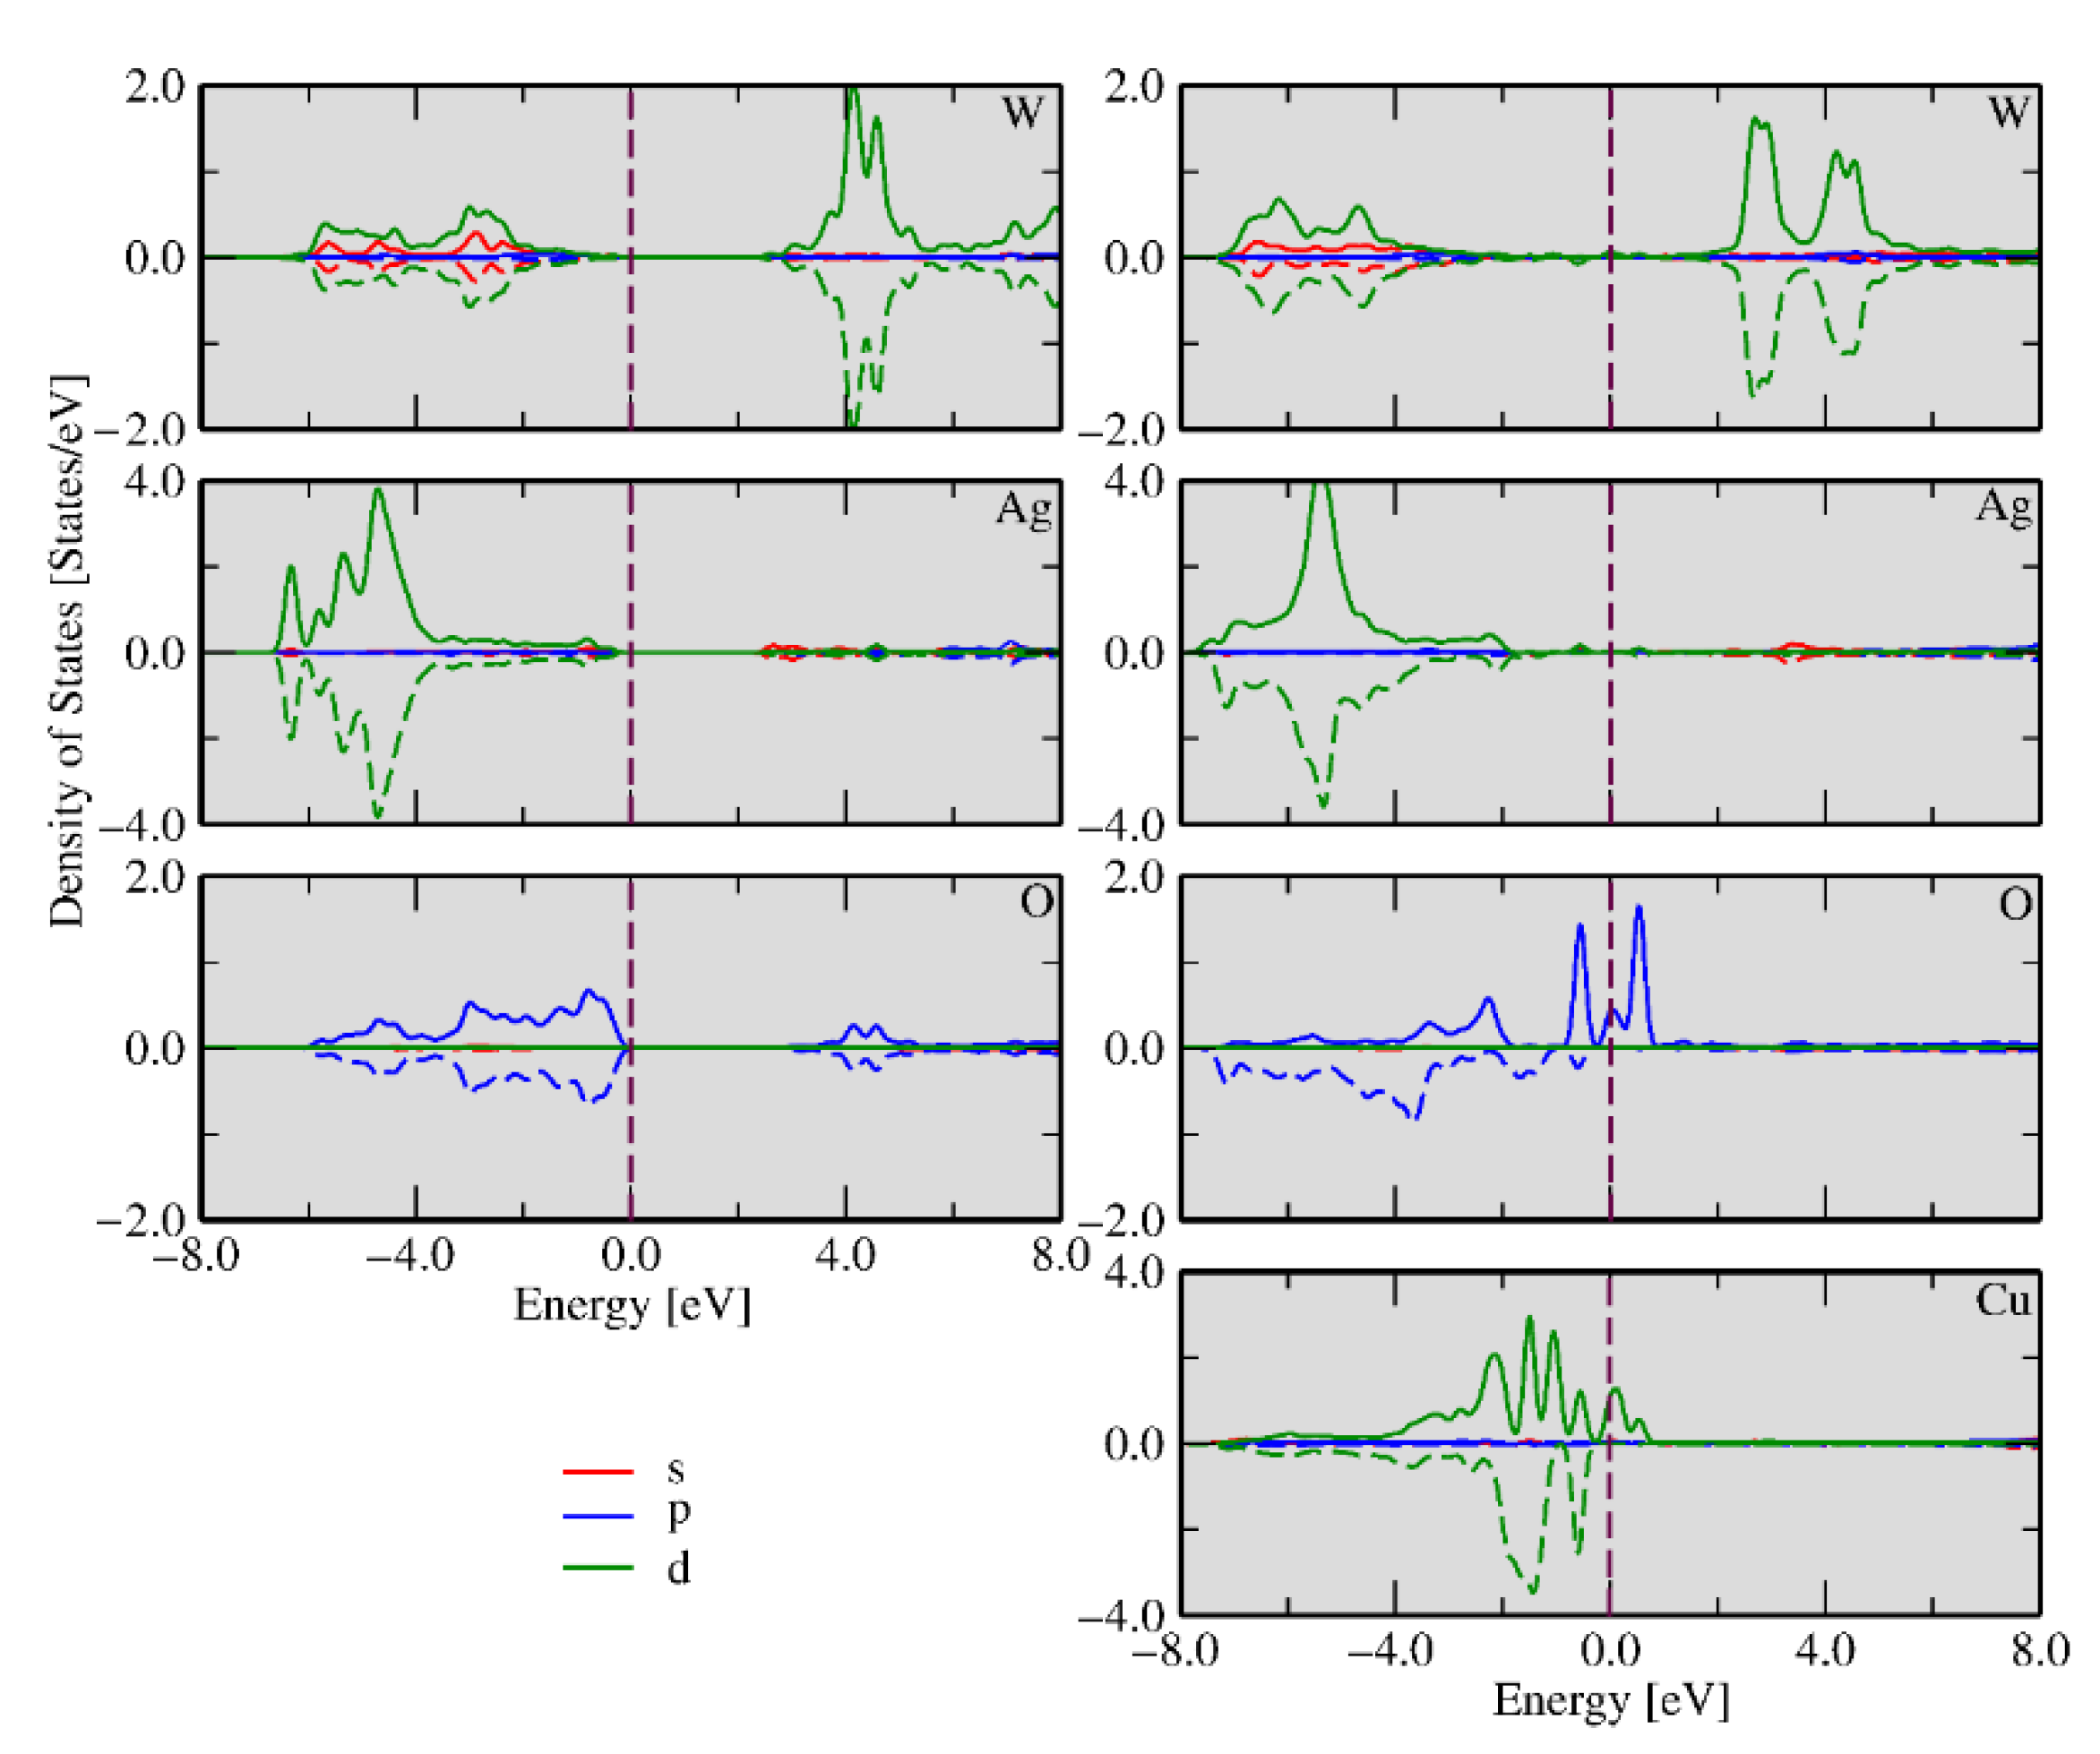
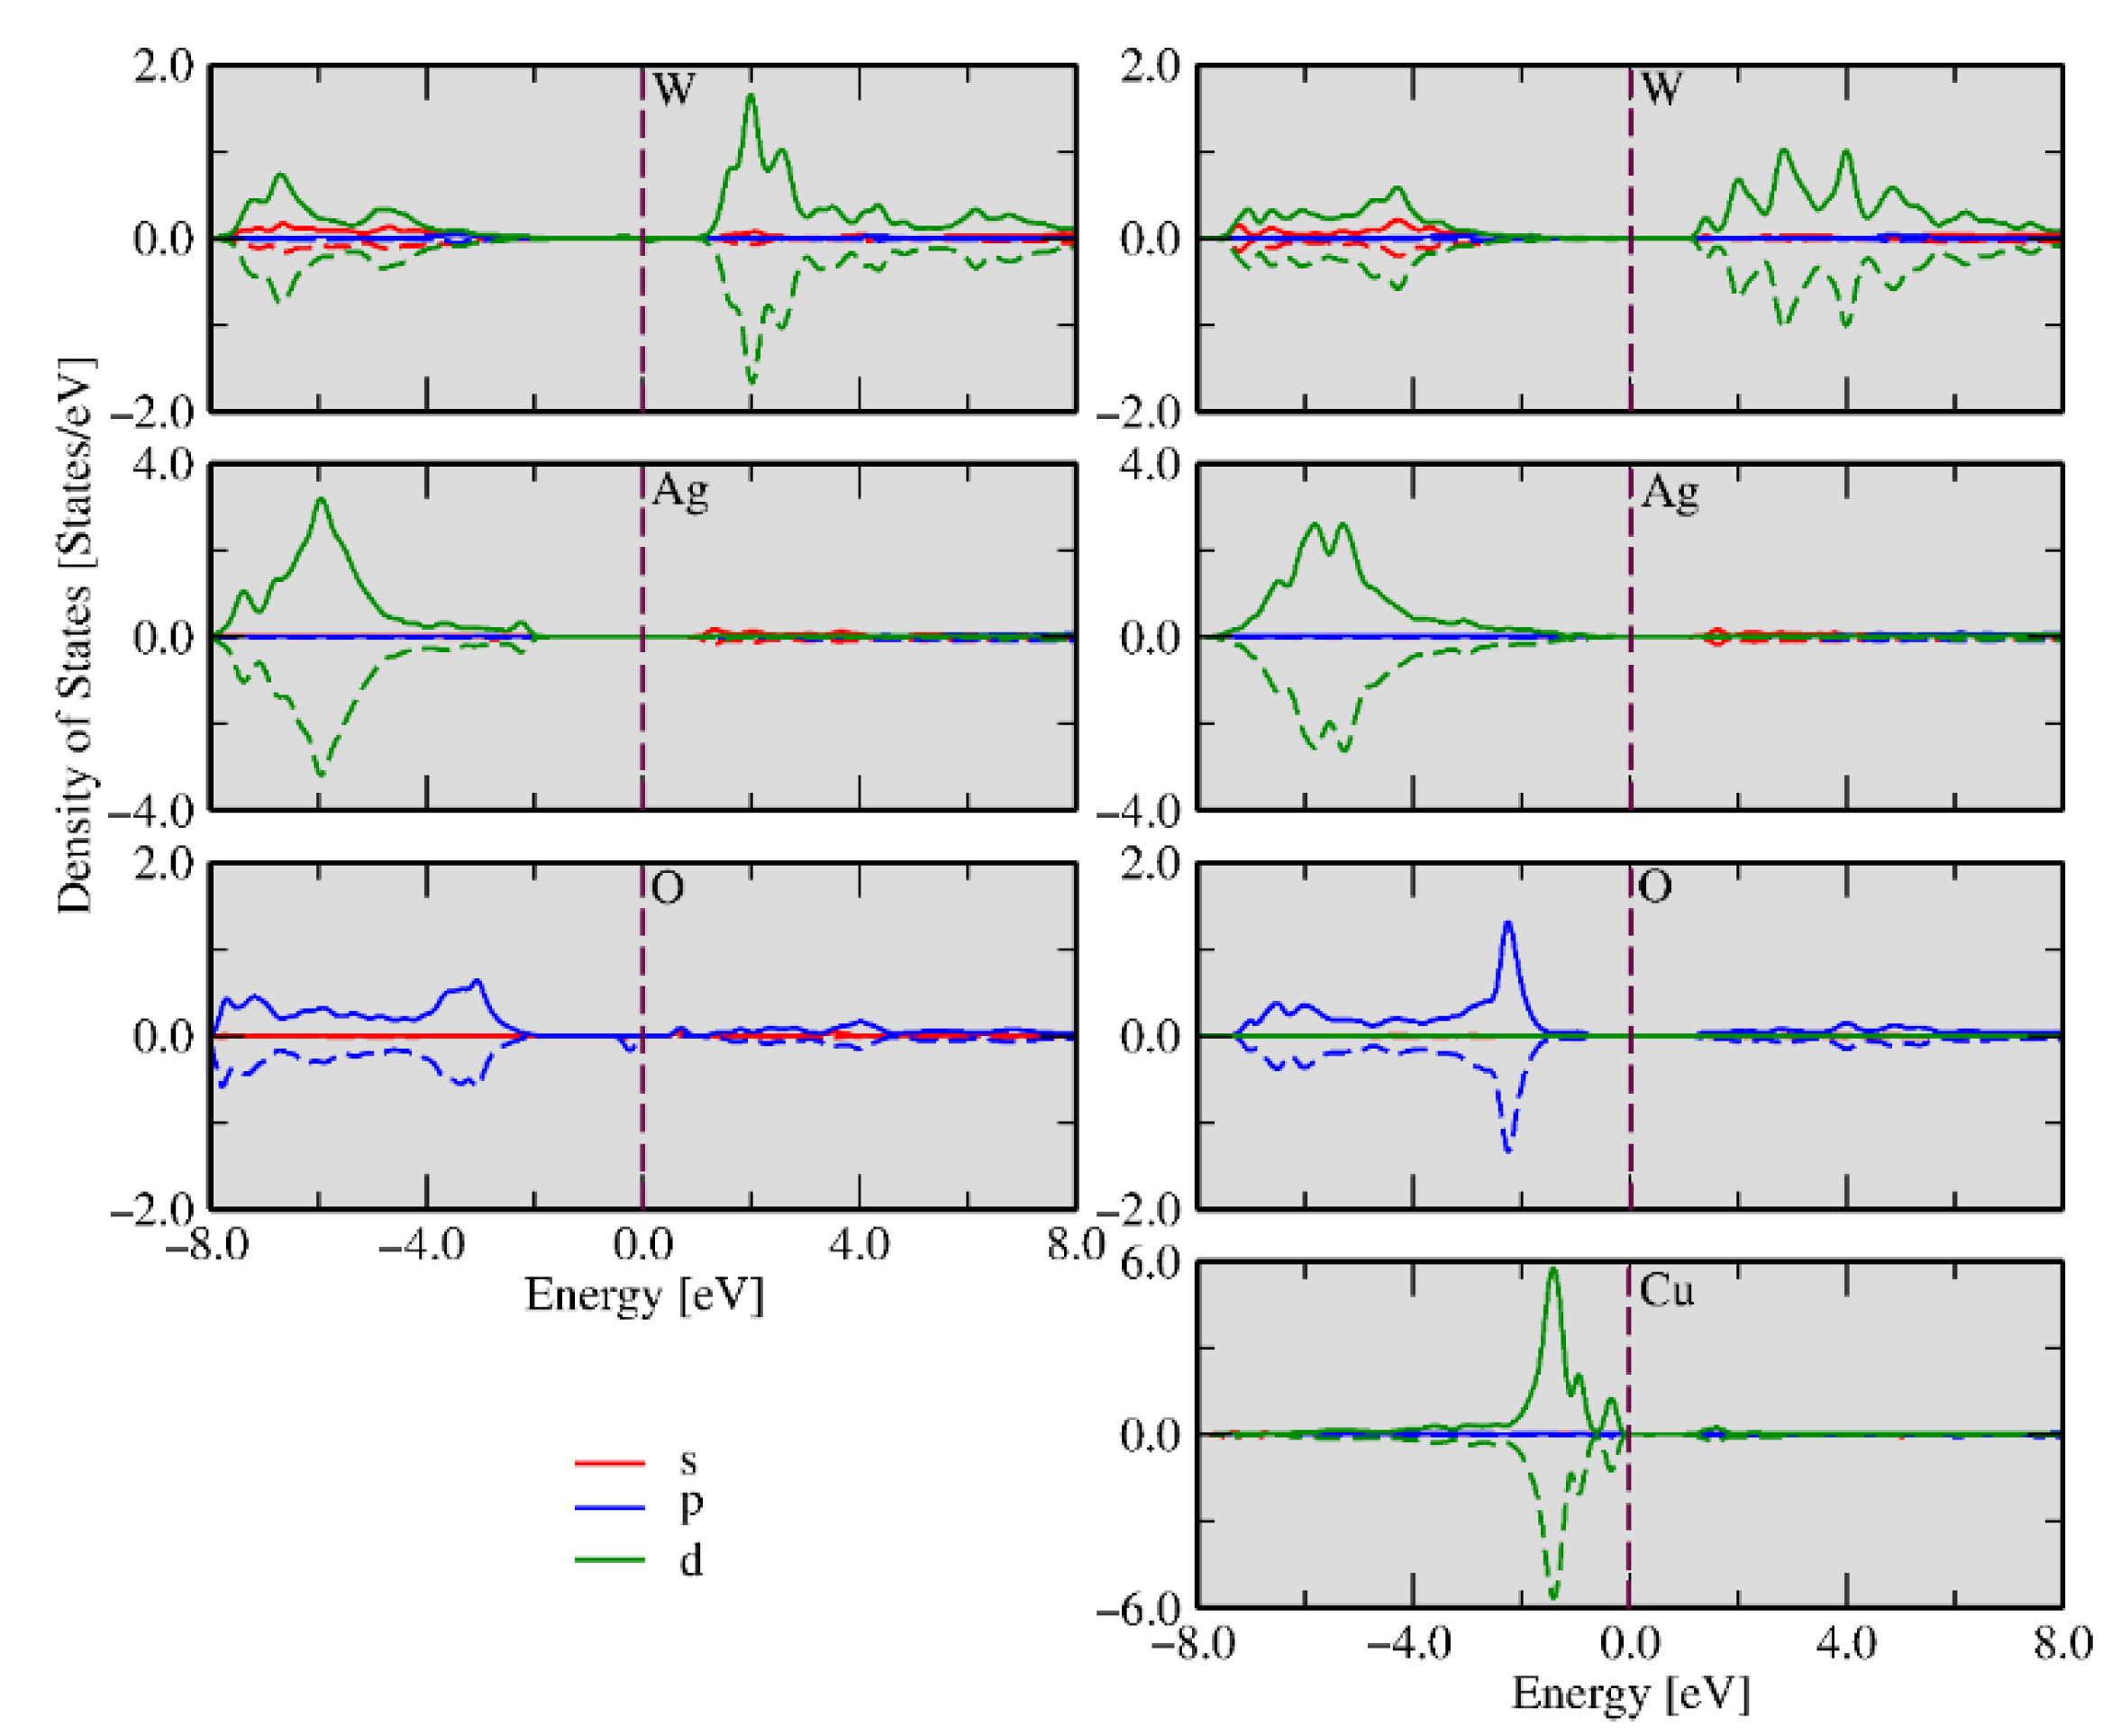
2.4.2. Electronic and Magnetic Structure of the (010) and (101) Surfaces

An analysis of the previous results shows that oxygen vacancies are common defects in the clusters at the exposed surfaces. The different type of clusters on each surface may have different properties and functions depending on the number and nature of defects. Precise control of electron density at these sites enables surface chemistry regulation. These clusters can be taken as active sites where the biocide activity occurs and determine whether the material will present high or low activity. The different types of clusters on each surface may have different properties and functions depending on the number and nature of defects. The density of states (DOS) was calculated for undoped and Cu-doped Ag1.72Cu0.14WO4 systems in the (010) and (101) surfaces, as shown in Figure 11 and Figure 12, respectively. These calculations are an effective method for studying the changes in electronic properties before and after Cu doping. It can be seen from the left panel of Figure 11 that the d-W, s-Ag, and p-O orbital states are the major contributions in the conduction band, while the d-W, d-Ag, and p-O orbital states are the significant contributions in the valence band, which can be inferred from the highest electron density concentrated in the 4d-Ag orbital.
The calculated band gap for the undoped (010) surface was 2.91 eV. After Cu doping, there is a decrease in the band gap due to the appearance of new levels created by the defects in the forbidden region, which facilitate the electron excitation to these new energy levels (traps). On the other hand, these electrons can move to the surface clusters, facilitating interaction with the environment. An analysis of the right part of Figure 11 showed that the main contributions in the conduction band were the p-O, s-Ag, and d-Cu orbitals, and the shape of its peak can be attributed to the orbital hybridization between d-Cu-p-O and d-Ag-p-O. Additionally, the occupied d-W spin-up and spin-down states near the Fermi energy were observed, while d-Ag spin-up states in the valence band were noted. The stronger hybridization between the p-O and d-Cu orbitals produced localized states in the spin-up and spin-down channels, representing a local magnetic moment. We could also observe that the spin charge density was distributed over the entire geometry; however, the more substantial contribution was located at the Cu, O, and Ag atoms of the surface.
The DOS of the (101) surface is displayed in Figure 12, and different aspects could be observed after the Cu doping process. The undoped (in the left) and doped (in the right) systems showed similar densities of states in comparison with the undoped (010) surface. However, occupied spin-down states and spin-up states for p-O near the Fermi energy were observed for the undoped case, displaying 1.86 eV of band gap energy. When the impurity was introduced in the (101) geometry, Cu-polarized states appeared near the Fermi energy but doped and undoped (101) surfaces did not present magnetism. In both the (010) and (101) surfaces, the undoped cases presented CBM composed of the d-W and p-O states, while d-Cu and d-W were the CBM states for doped surfaces, respectively. These results can explain why α-Ag1.72Cu0.14WO4 presented the most considerable biocide activity. Following the evolution of morphology as a function of Cu content (Figure 9), there is a direct correlation between the presence of (010) surface and biocide activity.

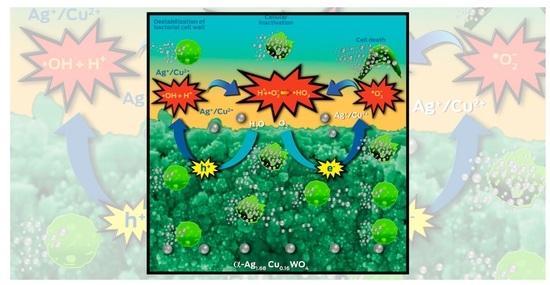
2.5. A Proposed Mechanism for the Biocide Activity

ROS are formed as byproducts of the reduction of molecular oxygen (O2). They mostly consist of radicals (species with one or more unpaired electrons), such as the superoxide anions (•O2) and hydroxyls (•OH) that are generated at the surfaces of metal oxides via different surface-related processes [77], even in the dark [78]. A semiconductor releases an e from the conduction band and interacts with O2 from the environment, generating •O2. Simultaneously, an e moves from the valence band to the conduction band. The decrease in the electron density of the valence band induces the interaction with the H2O in the environment. This interaction results from breaking the O−H bond of H2O, forming a hydroxyl radical (•OH) and a proton (H+) which interacts with •O2 to form •O2H. These ROS are capable of killing microorganisms by oxidizing and breaking down their cell walls and membranes, and these redox processes take place on the exposed surfaces of the semiconductor [79].
In our case, the undercoordinated Ag and Cu clusters at the top of the (010) and (101) surfaces of the α-Ag1.68Cu0.16WO4 structure (see Figure 10) are the sources of high and low electron density, respectively. They, then, are responsible for the formation of •OH and •O2H, which potentially damage membranes and cell walls, leading to cell death. Based on the analysis of these clusters, a mechanism of action is proposed involving the formation of ROS from H2O and O2 associated with the biocide activity of α-Ag2−2xCuxWO4 (0 ≤ x ≤ 0.16) solid solutions.
WO 6 + O 2 O 2
AgO 4 · 3 V o + H 2 O H + + OH
CuO 4 · 3 V o + H 2 O H + + OH
CuO 3 · 4 V o + H 2 O H + + OH
H + + O 2 O 2 H
These results show a relationship between the morphology of α-Ag2−2xCuxWO4 microcrystals and the enhanced biocide activity of α-Ag1.68Cu0.16WO4. The structural and electronic defects increase at the surface; then, the active sites at the exposed surfaces can churn out a plethora of ROS to provoke oxidative stress. The incorporation of Cu on α-Ag2WO4 contributes to the improvement of antibacterial and antifungal activity in several ways: (i) by reducing the band gap; (ii) by altering the CB position of α-Ag2WO4; and (iii) by improving the conductivity of α-Ag2WO4 and enhancing the mobility of charge carriers.

3. Methods and Materials

3.1. Synthesis of α-Ag2−2xCuxWO4 Solid Solutions

α-Ag2−2xCuxWO4 (x = 0.00, 0.005, 0.01, 0.02, 0.04, 0.08, and 0.16) solid solutions were prepared by the CP method in accordance with our previous work [49]. Quantities of 2 × 10⁻³ moles of silver nitrate (AgNO3; 99.8% purity, Sigma-Aldrich, St. Louis, MI, USA) were dissolved in 50 mL of deionized water at 80 °C under magnetic stirring, and then copper nitrate hydrate (Cu(NO3)2·xH2O; 99.99% purity, Sigma-Aldrich) was added in the molar ratios listed above. This solution was added to 50 mL of 1 × 10⁻³ mol of tungstate sodium dihydrate (Na2WO4·2H2O; 99.5% purity, Sigma-Aldrich) previously dissolved at the same temperature, and the mixture was subjected to constant magnetic stirring for 30 min. The α-Ag2−2xCuxWO4 powders thus obtained were washed several times with deionized water and dried in an oven at 70 °C.

3.2. Characterizations of α-Ag2−2xCuxWO4 Solid Solutions

α-Ag2−2xCuxWO4 (0 ≤ x ≤ 0.16) solid solutions were structurally characterized by XRD patterns using a D4 Endeavor, Bruker-AXS with Cu-Kα radiation (λ = 1.5406 Å) in the 2θ range from 10° to 70° in the normal routine, while in the Rietveld routine, a D/Max-2000PC diffractometer Rigaku (Japan) with Cu-Kα radiation (λ = 1.5406 Å) was used in the 2θ range from 10° to 110° with a scanning velocity of 1°/min. XPS was performed using a ScientaOmicron ESCA+ spectrometer with a high-performance hemispheric analyzer (EA 125) with monochromatic Al Kα (hν = 1486.6 eV) radiation as the excitation source. The operating pressure in the ultrahigh vacuum chamber during analysis was 2 × 10⁻⁹ mbar. Energy steps of 50 and 20 eV were used for the survey and high-resolution spectra, respectively. The ICP-AES analyses were performed using an Agilent® 7500 CX (Santa Clara, CA) with He as the collision gas in the octopolar reaction system to remove all interferences present in the matrix. MR spectroscopy was conducted using a model NRS-3100 (Jasco, Tokyo, Japan) spectrometer with optic microscopy and a refrigerated CCD device detector (−65 °C) operating at λ = 613 nm in the range from 50 to 1000 cm−1. ATR-FTIR spectroscopy was recorded in the range from 400 to 1000 cm−1 in an FTIR-6200 (Jasco®) model spectrophotometer in transmittance mode. The shapes and sizes of the α-Ag2−2xCuxWO4 microcrystals were observed with an FE-SEM Inspect F50 (FEI Company, Hillsboro, OR, USA) operated at 10 kV. The optical properties of the α-Ag2−2xCuxWO4 solid solutions were measured using UV–vis diffuse reflectance spectroscopy and PL measurements at room temperature. UV–vis spectra were obtained using a spectrophotometer (Varian, Palo Alto, CA, USA, model Cary 5G) in diffuse-reflectance mode. PL measurements at room temperature were performed using a Monospec 27 monochromator (Thermal Jarrell Ash, Waltham, MA, USA) coupled to an R446 photomultiplier (Hamamatsu Photonics, Shizuoka, Japan). A krypton-ion laser (Coherent Innova 90K; λ = 350.7 nm) was used as the excitation source, and its maximum output power was maintained at 500 mW.

3.3. Antibacterial and Antifungal Activity Measurements

The antibacterial and antifungal activities of the α-Ag22xCuxWO4 (0 ≤ x ≤ 0.16) solid solutions were analyzed against two reference strains from the American Type Culture Collection (ATCC): C. albicans (ATCC 90028) and MRSA (ATCC 33591). For this purpose, both microorganisms were kept frozen at −80 °C until the time of the experiments. Measurement of the minimal inhibitory concentrations (MICs) and minimal fungicidal/bactericidal concentrations (MFCs/MBCs) for planktonic cells, according to the Clinical and Laboratory Standards Institute broth microdilution method (documents M27-A3 (2008) and M7-A7 (2006)) for yeast and bacteria, respectively [80,81], were performed. The C. albicans was thawed and coated on plates containing Sabouraud Dextrose Agar (SDA, HiMedia, Mumbai) culture medium supplemented with chloramphenicol (0.05 g/L) and incubated for 24 h at 37 °C. Then, five colonies were transferred and grown using yeast nitrogen base (YNB) medium supplemented with 100 mM glucose and incubated at 37 °C for 16 h. Subsequently, the cultures were diluted in fresh YNB (1:10 dilution) and incubated at 37 °C until the mid-log growth phase was reached. For MRSA, the cells were thawed and incubated on Mueller–Hinton agar plates for 24 h at 37 °C. Five colonies were then transferred and grown using Mueller–Hinton broth and incubated at 37 °C for 8 h. After this, the cells were diluted in fresh Mueller–Hinton broth (1:10 dilution) and incubated at 37 °C until the mid-log growth phase was reached. The microorganisms were spectrophotometrically standardized to a final concentration of 107 colony-forming units per milliliter (CFU/mL). The MICs were the lowest concentrations of each of the α-Ag22xCuxWO4 (0 ≤ x ≤ 0.16) solid solutions that could achieve complete inhibition of growth (no visible growth by visual inspection), and the MFCs/MBCs were defined as the lowest concentrations of each of the α-Ag22xCuxWO4 (0 ≤ x ≤ 0.16) solid solutions that resulted in no microbial growth on the plates [12,18,80,81,82]. The MICs and MFCs/MBCs were determined by incubating the microorganisms for 24 h at 37 °C on 96-well microtiter plates exposed to serial dilutions of each of the α-Ag22xCuxWO4 (0 ≤ x ≤ 0.16) solid solutions, from 1000 to 0.061 μg/mL, in specific culture media. The MFCs/MBCs were determined by inoculating 25 μL aliquots taken from 10-fold serial dilutions (10−1 to 10−8) of each well on plates containing SDA for C. albicans and Mueller−Hinton agar for MRSA. The plates were incubated at 37 °C for 24 h, and then CFU/mL values were determined. Positive controls were inoculated with the microbial suspension but no α-Ag22xCuxWO4 (0 ≤ x ≤ 0.16) solid solutions, while the negative controls consisted of uninoculated culture medium.

3.4. Theoretical Approach and Computational Details

DFT calculations were performed [83,84] by employing the semi-local Perdew–Burke–Ernzerhof [85] exchange and correlation energy functional within the spin-polarized generalized gradient approximation (GGA) formulation, as implemented in the Viena ab initio simulation package (VASP) [86,87] version 5.4.4 (VASP Software GmgH, Vienna, Austria). The Kohn–Sham equations were solved using the projector augmented wave (PAW) method [88,89], employing the following projectors: Ag (4d10, 5s1), W (5p6, 5d4, 6s2), O (2s2, 2p4), and Cu (3d10, 4s1), where the valence states are shown in parentheses. The equilibrium volume of α-Ag2WO4 crystals was obtained by minimizing the stress tensor using a plane wave cutoff of 834 eV, while for the atomic force optimizations, a plane wave cutoff of 469 eV was used. For the Brillouin zone integration, we employed a 1 × 1 × 2 k-mesh for stress tensor and atomic force optimizations, while a mesh of twice the size was used for the electronic properties. In all calculations, a Gaussian smearing of 0.01 eV was used, and the atoms could relax until all forces were smaller than 0.01 eV/Å on every atom. To improve the description of the electronic structure, we adopted the GGA + U method proposed by Dudarev et al. [90], in which Hubbard U corrections of 5.10 eV and 4.6 eV were used for the d-Ag and p-O states, respectively. The relative stability of the models was calculated by comparing the total energies of the Cu2+ doped in the α-Ag2WO4 structures after the optimization calculation. The electronic and structural properties were analyzed for three different theoretical models: a pure α-Ag2WO4 system and two solid solutions models: α-Ag1.72Cu0.14WO4 and α-Ag1.34Cu0.33WO4, in which one Ag+ cation was replaced by one Cu2+ cation and, in turn, one Ag vacancy was also created to preserve stoichiometry. In the α-Ag1.72Cu0.14WO4 model, the Cu2+ cation replaced the Ag+ cation at the Ag1 site, forming a distorted deltahedral [CuO7] cluster. In the α-Ag1.34Cu0.33WO4 model, two Cu2+ cations were located at the Ag1 and Ag3 sites, forming distorted deltahedral [CuO7] and octahedral [CuO6] clusters, respectively.

4. Conclusions

Solid solutions involving pure α-Ag2WO4 and α-Ag2−2xCuxWO4 compounds present versatile properties resulting from the disorder inherent in their crystal structure, but the fate of biocide activity remains poorly understood. To fully unlock the potential of these materials, in this work we have presented a joint experimental and theoretical study on the structure and electronic properties of α-Ag2−2xCuxWO4 (0 ≤ x ≤ 0.16) solid solutions, thereby enabling a more accurate and direct comparison between theory and experiment to find a correlation between morphology and biocide (antibacterial, against MRSA, and antifungal, against C. albicans) activity.
The main conclusions can be summarized as follows: (i) α-Ag2−2xCuxWO4 (0 ≤ x ≤ 0.16) solid solutions were synthesized by a low-cost, environmentally friendly chemical co-precipitation method; (ii) their structures (short-, medium-, and long-range) and electronic properties were obtained; (iii) FE-SEM images showed that the morphologies of the samples with low concentrations of Cu atoms were composed of the (010), (001), and (101) surfaces and that the morphologies were hexagonal and rod-like; (iv) an increase in the Cu content provoked a change in the morphology to a nanoplate-like morphology formed only of (010) and (101) surfaces; (v) the increase in Cu in the α-Ag2WO4 structures enhanced the antibacterial and antifungal activities of α-Ag2−2xCuxWO4 (0 ≤ x ≤ 0.16) solid solutions against MRSA and C. albicans, respectively; (vi) the α-Ag2−2xCuxWO4 semiconductor enabled the binding of bacteria and fungi on the exposed surfaces, which resulted in membrane damage due to the presence of ROS, and finally cell death; (vii) the experiments and simulations presented allowed us to propose a plausible mechanism induced by Cu surfaces to explain the biocide activity, based on the presence of undercoordinated Cu clusters in the (010) and (101) surfaces as the active catalytic sites responsible for the formation of ROS; (viii) these results demonstrate that surface-structural engineering of semiconductors via the formation of solid solutions is an effective strategy to enhance biocide efficiencies; and (ix) this work provides new insights into the relationships between the structural, electronic, and magnetic properties of the exposed surfaces at the morphological level, and suggests that electronic and spin selectivity can be used to design other materials as biocide agents.

Supplementary Materials

The supporting information can be downloaded at: https://www.mdpi.com/article/10.3390/ijms231810589/s1.

Author Contributions

Conceptualization, P.F.d.S.P., C.C.D.F., and A.F.G.; methodology, P.F.d.S.P., C.C.D.F., A.F.G., and L.A.C.; software, A.F.G., I.M.P., and L.A.C.; validation, P.F.d.S.P., C.C.D.F., and A.F.G.; formal analysis, P.F.d.S.P., C.C.D.F., A.F.G., I.M.P., and L.A.C.; investigation, P.F.d.S.P., C.C.D.F., A.F.G., I.M.P., L.A.C., and I.S.; resources, M.A.S.-M., C.E.V., A.Z.S., E.Z.d.S., L.S.C., R.L., E.L., and J.A.; data curation, P.F.d.S.P., C.C.D.F., A.F.G., and L.A.C.; writing—original draft preparation, P.F.d.S.P., C.C.D.F., A.F.G., I.M.P., L.A.C., I.S., C.E.V., A.Z.S., and E.Z.d.S.; writing—review and editing, P.F.d.S.P., C.C.D.F., A.F.G., E.G., M.A.S.-M., L.S.C., R.L., E.L., and J.A.; visualization, P.F.d.S.P., C.C.D.F., A.F.G., and L.A.C.; supervision, E.G., M.A.S.-M., C.E.V., A.Z.S., E.Z.d.S., L.S.C., R.L., E.L., and J.A.; project administration, P.F.d.S.P., E.L., and J.A.; funding acquisition, P.F.d.S.P., M.A.S.-M., C.E.V., A.Z.S., E.Z.d.S., L.S.C., R.L., E.L., and J.A. All authors have read and agreed to the published version of the manuscript.

Funding

This research was funded by the Fundação de Amparo à Pesquisa do Estado de São Paulo (grant numbers FAPESP 2013/07296-2, 2014/14171-4, 2016/23891-6, 2017/13008-0, 2018/20729-9, 2019/03722-3), Conselho Nacional de Desenvolvimento Científico e Tecnológico (CNPq). J.A., R. Ll., E.G., and I.S. acknowledge Universitat Jaume I for projects UJI-B2016-25, UJI-B2017-44, UJI-B2019-30, and UJI-A2019-16, and the Ministerio de Ciencia, Innovación y Universidades (Spain) project PGC2018-094417-B-I00 for supporting this research financially. A.F.G acknowledges the Universitat Jaume I for a postdoctoral contract (POSDOC/2019/30) and FAPESP (2019/01732-1).

Institutional Review Board Statement

Not applicable.

Informed Consent Statement

Not applicable.

Acknowledgments

This study used the computational resources of the “Centro Nacional de Processamento de Alto Desempenho em São Paulo” (CENAPAD-SP), “Centro de Computação John David Rogers” (CCJDR-UNICAMP), and the CENAPAD-RJ (SDumont). I.S. thanks Spanish MINECO for a postdoctoral ‘‘Juan de la Cierva-Incorporación’ fellowship. The authors also thank the Servei d’Informàtica and the Servei de Instrumentació Científica, Universitat Jaume I, for generous allocation of computer time and for providing us with diffraction, spectroscopic, and microscopic techniques, respectively. The important help of Enio Longo in the improvement of the final versions of the figures is also recognized.

Conflicts of Interest

The authors declare no conflict of interest.

References

  1. Jovanovic, D.J.; Validzic, I.L.; Mitric, M.; Nedeljkovic, J.M. Synthesis and structural characterization of nano-sized copper tungstate particles. Acta Chim. Slov. 2012, 59, 70. [Google Scholar] [PubMed]
  2. Catlow, C.R.A.; Bromley, S.T.; Hamad, S.; Mora-Fonz, M.; Sokol, A.A.; Woodley, S.M. Modelling nano-clusters and nucleation. Phys. Chem. Chem. Phys. 2010, 12, 786. [Google Scholar] [CrossRef]
  3. Jacomaci, N.; Junior, E.S.; Oliveira, F.M.B.d.; Longo, E.; Zaghete, M.A. Dielectric behavior of α-Ag2WO4 and its huge dielectric loss tangent. Mater. Res. 2019, 22, 1. [Google Scholar] [CrossRef]
  4. Tang, J.W.; Ye, J.H. Correlation of crystal structures and electronic structures and photocatalytic properties of the W-containing oxides. J. Mater. Chem. 2005, 15, 4246. [Google Scholar] [CrossRef]
  5. Sreedevi, A.; Priyanka, K.P.; Babitha, K.K.; Sabu, N.A.; Anu, T.S.; Varghese, T. Chemical synthesis, structural characterization and optical properties of nanophase α-Ag2WO4. Indian J. Phys. 2015, 89, 889. [Google Scholar] [CrossRef]
  6. Cavalcante, L.S.; Almeida, M.A.; Avansi, W., Jr.; Tranquilin, R.L.; Longo, E.; Batista, N.C.; Mastelaro, V.R.; Li, M.S. Cluster coordination and photoluminescence properties of α-Ag2WO4 microcrystals. Inorg. Chem. 2012, 51, 10675. [Google Scholar] [CrossRef]
  7. Ramezani, M.; Pourmortazavi, S.M.; Sadeghpur, M.; Yazdani, A.; Kohsari, I. Silver tungstate nanostructures: Electrochemical synthesis and its statistical optimization. J. Mater. Sci. Mater. Electron. 2015, 26, 3861. [Google Scholar] [CrossRef]
  8. de Santana, Y.V.B.; Gomes, J.E.C.; Matos, L.; Cruvinel, G.H.; Perrin, A.; Perrin, C.; Andres, J.; Varela, J.A.; Longo, E. Silver molybdate and silver tungstate nanocomposites with enhanced photoluminescence. Nanomater. Nanotechnol. 2014, 4, 22. [Google Scholar] [CrossRef]
  9. Pinatti, I.M.; Nogueira, I.C.; Pereira, W.S.; Pereira, P.F.S.; Gonçalves, R.F.; Varela, J.A.; Longoc, E.; Rosa, I.L.V. Structural and photoluminescence properties of Eu3+ doped α-Ag2WO4 synthesized by the green coprecipitation methodology. Dalton Trans. 2015, 44, 17673. [Google Scholar] [CrossRef]
  10. Longo, E.; Volanti, D.P.; Longo, V.M.; Gracia, L.; Nogueira, I.C.; Almeida, M.A.P.; Pinheiro, A.N.; Ferrer, M.M.; Cavalcante, L.S.; Andres, J. Toward an understanding of the growth of Ag filaments on α-Ag2WO4 and their photoluminescent properties: A combined experimental and theoretical study. J. Phys. Chem. C 2014, 118, 1229. [Google Scholar] [CrossRef]
  11. Roca, R.A.; Sczancoski, J.C.; Nogueira, I.C.; Fabbro, M.T.; Alves, H.C.; Gracia, L.; Santos, L.P.S.; de Souza, C.P.; Andres, J.; Luz, G.E., Jr.; et al. Facet-dependent photocatalytic and antibacterial properties of α-Ag2WO4 crystals: Combining experimental data and theoretical insights. Catal. Sci. Techn. 2015, 5, 4091. [Google Scholar] [CrossRef]
  12. de Foggi, C.C.; de Oliveira, R.C.; Fabbro, M.T.; Vergani, C.E.; Andres, J.; Longo, E.; Machado, A.L. Tuning the morphological, optical, and antimicrobial properties of α-Ag2WO4 microcrystals using different solvents. Cryst. Growth Des. 2017, 17, 6239. [Google Scholar] [CrossRef]
  13. Nobre, F.X.; Bastos, I.S.; Fontenelle, R.O.S.; Júnior, E.A.A.; Takeno, M.L.; Manzato, L.; Matos, J.M.E.; Orlandi, P.P.; Mendes, J.F.S.; Brito, W.R.; et al. Antimicrobial properties of α-Ag2WO4 rod-like microcrystals synthesized by sonochemistry and sonochemistry followed by hydrothermal conventional method. Ultrasound 2019, 58, 104620. [Google Scholar] [CrossRef] [PubMed]
  14. Chávez, N.L.H.; Avila, E.D.; Barbuglia, P.A.; de Oliveira, R.C.; de Foggi, C.C.; Longo, E.; Vergani, C.E. Promising effects of silver tungstate microcrystals on fibroblast human cells and three dimensional collagen matrix models a novel non-cytotoxic material to fight oral disease. J. Coll. Surf. B 2018, 170, 505. [Google Scholar] [CrossRef]
  15. Pellissari, C.V.G.; Vergani, C.E.; Longo, E.; Pavarina, A.C.; Sanitá, P.V.; Siqueira, W.L.; Jorge, J.H. In vitro toxic effect of biomaterials coated with silver tungstate or silver molybdate microcrystals. J. Nanomater. 2020, 2020, 2971827. [Google Scholar] [CrossRef]
  16. Dutta, D.P.; Singh, A.; Ballal, A.; Tyagi, A.K. High adsorption capacity for cationic dye removal and antibacterial properties of sonochemically synthesized Ag2WO4 nanorods. Eur. J. Inorg. Chem. 2014, 33, 5724. [Google Scholar] [CrossRef]
  17. Santos, C.J.; Filho, F.M.; Campos, F.L.; Ferreira, C.d.A.; de Barros, A.L.B.; Soares, D.C.F. Ag2WO4 nanoparticles radiolabeled with technetium-99m: A potential new tool for tumor identification and uptake. J. Radioanal. Nucl. Chem. 2020, 323, 51. [Google Scholar] [CrossRef]
  18. Foggi, C.C.; Fabbro, M.T.; Santos, L.P.S.; de Santana, Y.V.B.; Vergani, C.E.; Machado, A.L.; Cordoncillo, E.; Andres, J.; Longo, E. Synthesis and evaluation of α-Ag2WO4 as novel antifungal agent. Chem. Phys. Lett. 2017, 674, 125. [Google Scholar] [CrossRef]
  19. Zhang, X.-Y.; Wang, J.-D.; Liu, J.-K.; Yang, X.-H.; Lu, Y. Construction of silver tungstate multilevel sphere clusters by controlling the energy distribution on the crystal surface. CrystEngComm 2015, 17, 1129. [Google Scholar] [CrossRef]
  20. Chen, H.; Xu, Y. Photoactivity and stability of Ag2WO4 for organic degradation in aqueous suspensions. Appl. Surf. Sci. 2014, 319, 319. [Google Scholar] [CrossRef]
  21. Zhang, R.; Cui, H.; Yang, X.; Liu, H.; Tang, H.; Li, Y. Facile hydrothermal synthesis and photocatalytic activity of rod-like nanosized silver tungstate. Micro Nano Lett. 2012, 7, 1285. [Google Scholar] [CrossRef]
  22. Vafaeezadeh, M.; Hashemi, M.M. One pot oxidative cleavage of cyclohexene to adipic acid using silver tungstate nano-rods in a Bronsted acidic ionic liquid. Rsc. Adv. 2015, 5, 31298. [Google Scholar] [CrossRef]
  23. Wang, B.-Y.; Zhang, G.-Y.; Cui, G.-W.; Xu, Y.-Y.; Liu, Y.; Xing, C.-Y. Controllable fabrication of α-Ag2WO4 nanorod-clusters with superior simulated sunlight photocatalytic performance. Inorg. Chem. Front. 2019, 6, 209. [Google Scholar]
  24. Neto, N.F.A.; Oliveira, P.M.; Bomio, M.R.D.; Motta, F.V. Effect of temperature on the morphology and optical properties of Ag2WO4 obtained by the co-precipitation method: Photocatalytic activity. Ceram. Int. 2019, 45, 15205. [Google Scholar] [CrossRef]
  25. Lin, Z.; Li, J.; Zheng, Z.; Yan, J.; Liu, P.; Wang, C.; Yang, G. Electronic Reconstruction of α-Ag2WO4 Nanorods for Visible-Light Photocatalysis. Acs. Nano. 2015, 9, 7256. [Google Scholar] [CrossRef] [PubMed]
  26. Krtil, P.; Nishimura, S.; Yoshimura, M. Electrochemical formation of ternary oxide films-an EQCM approach to galvanostatic deposition of alkali earth metal tungstates and molybdates. Electrochim. Acta. 1999, 44, 3911. [Google Scholar] [CrossRef]
  27. Macedo, N.G.; Gouveia, A.F.; Roca, R.A.; Assis, M.; Gracia, L.; Andrés, J.; Leite, E.R.; Longo, E. Surfactant-mediated morphology and photocatalytic activity of α-Ag2WO4 Material. J. Phys. Chem. C 2018, 122, 8667. [Google Scholar] [CrossRef]
  28. Abinaya, M.; Ramachandran, R.; Chenb, S.-M.; Muthuraj, V. Ultrasonic assisted fabrication of silver tungstate encrusted polypyrrole nanocomposite for effective photocatalytic and electrocatalytic applications. J. Ult. Sonoch. 2020, 64, 104913. [Google Scholar]
  29. Nubla, K.; Sandhyarani, N. Ag nanoparticles anchored Ag2WO4 nanorods: An efficient methanol tolerant and durable Pt free electro-catalyst toward oxygen reduction reaction. J. Elect. Acta 2020, 340, 135942. [Google Scholar] [CrossRef]
  30. Song, Q.-W.; Yu, B.; Li, X.-D.; Ma, R.; Diao, Z.-F.; Li, R.-G.; Li, W.; He, L.-N. Efficient chemical fixation of CO2 promoted by a bifunctional Ag2WO4/Ph3P system. Green Chem. 2014, 16, 1633. [Google Scholar] [CrossRef]
  31. Stone, D.; Liu, J.; Singh, D.P.; Muratore, C.; Voevodin, A.A.; Mishra, S.; Rebholz, C.; Ge, Q.; Aouadi, S.M. Layered atomic structures of double oxides for low shear strength at high temperatures. Scr. Mater. 2010, 62, 735. [Google Scholar] [CrossRef]
  32. da Silva, L.F.; Catto, A.C.; Avansi, W., Jr.; Cavalcante, L.S.; Andres, J.; Aguir, K.; Mastelaro, V.R.; Longo, E. A novel ozone gas sensor based on one-dimensional (1D) α-Ag2WO4 nanostructures. Nanoscale 2014, 6, 4058. [Google Scholar] [CrossRef] [PubMed]
  33. Sreedevi, A.; Priyanka, K.P.; Vattappalam, S.C.; Varghese, T. Silver tungstate nanoparticles for the detection of ethanol, ammonia and acetone gases. J. Electron. Mater. 2018, 47, 6328. [Google Scholar] [CrossRef]
  34. Lusi, M. Engineering crystal properties through solid solutions. Cryst. Growth Des. 2018, 18, 3704. [Google Scholar] [CrossRef]
  35. Andres, J.; Gracia, L.; Gonzalez-Navarrete, P.; Longo, V.M.; Avansi, W., Jr.; Volanti, D.P.; Ferrer, M.M.; Lemos, P.S.; La Porta, F.A.; Hernandes, A.C.; et al. Structural and electronic analysis of the atomic scale nucleation of Ag on α-Ag2WO4 induced by electron irradiation. Sci. Rep. 2014, 4, 5391. [Google Scholar] [CrossRef]
  36. Yoong, L.S.; Chong, F.K.; Dutta, B.K. Development of copper-doped TiO2 photocatalyst for hydrogen production under visible light. Energy 2009, 34, 1652. [Google Scholar] [CrossRef]
  37. Pereira, W.d.S.; Sczancoski, J.C.; Calderon, Y.N.C.; Mastelaro, V.R.; Botelho, G.; Machado, T.R.; Leite, E.R.; Longo, E. Influence of Cu substitution on the structural ordering, photocatalytic activity and photoluminescence emission of Ag3-2xCuxPO4 powders. Appl. Sur. Sci. 2018, 440, 61. [Google Scholar] [CrossRef]
  38. Liu, H.; Cheng, X.; Liu, H.; Yang, J.; Liu, Y.; Liu, X.; Gao, M.; Wei, M.; Zhang, X.; Jiang, Y. Structural, optical and magnetic properties of Cu and V co-doped ZnO nanoparticles. Phys. E Low-Dimens. Syst. Nanostruct. 2013, 47, 1–5. [Google Scholar] [CrossRef]
  39. Ijeh, R.O.; Nwanya, A.C.; Nkele, A.C.; Madiba, I.G.; Bashir, A.K.H.; Ekwealor, A.B.C.; Osuji, R.U.; Maaza, M.; Ezema, F. Optical, electrical and magnetic properties of copper doped electrodeposited MoO3 thin films. Ceram. Int. 2020, 46, 10820. [Google Scholar] [CrossRef]
  40. Nobre, F.X.; Nogueira, I.C.; Souza, G.d.S.; Matos, J.M.E.d.; Couceiro, P.R.d.C.; Brito, W.R.; de la Cruz, J.P.; Leyet Ruiz, Y. Structural and Optical Properties of Ca0.9Cu0.01WO4 Solid Solution Synthesized by Sonochemistry Method at Room Temperature. Inorg. Chem. 2020, 59, 6039. [Google Scholar] [CrossRef]
  41. Yourey, J.E.; Kurtz, J.B.; Bartlett, B.M. Structure, optical properties, and magnetism of the full Zn1-xCuxWO4 (0 ≤ x ≤ 1) composition range. Inorg. Chem. 2012, 51, 10394. [Google Scholar] [CrossRef] [PubMed]
  42. Patureau, P.; Josse, M.; Dessapt, R.; Mevellec, J.Y.; Porcher, F.; Maglione, M.; Deniard, P.; Payen, C. Incorporation of Jahn-Teller Cu2+ Ions into Magnetoelectric Multiferroic MnWO4: Structural, Magnetic, and Dielectric Permittivity Properties of Mn1-xCuxWO4 (x ≤ 0.25). Inorg. Chem. 2015, 54, 10623. [Google Scholar] [CrossRef] [PubMed]
  43. Gruszka, K.; Nabialek, M.; Szota, M. Influence of Cu Substitution on the Structure and Magnetic Properties of Partially Crystallized Fe62-xCo10Y8MexB20 Alloys. Rev. Chim. 2017, 68, 408. [Google Scholar] [CrossRef]
  44. Banerjee, D.; Bahadur, D.; Suresh, K.G.; Nigam, A.K. Effect of Cu substitution on the structural and magnetic properties of. Phys. B Condens. Matter 2006, 378, 1091. [Google Scholar] [CrossRef]
  45. Asokan, K.; Chen, Y.S.; Pao, C.W.; Tsai, H.M.; Lee, C.W.O.; Lin, C.H.; Hsueh, H.C.; Ling, D.C.; Pong, W.F.; Chiou, J.W.; et al. Effect of Co, Ni, and Cu substitution on the electronic structure of hexagonal YMnO3 studied by x-ray absorption spectroscopy. Appl. Phys. Lett. 2009, 95, 131901. [Google Scholar] [CrossRef]
  46. Din, M.F.M.; Wang, J.L.; Zeng, R.; Shamba, P.; Debnath, J.C.; Dou, S.X. Effects of Cu substitution on structural and magnetic properties of La0.7Pr0.3Fe11.4Si1.6 compounds. Intermetallics 2013, 36, 1–7. [Google Scholar] [CrossRef]
  47. Mary, T.A.; Kumar, N.R.S.; Varadaraju, U.V. Influence of Cu-site substitution on the structure and superconducting properties of the NdBa2Cu3-xMxO7+δ (M = Fe,Co) and NdBa2Cu3-xMxO7-δ (M = Ni,Zn) system. Phys. Rev. B 1993, 48, 16727. [Google Scholar] [CrossRef]
  48. Pereira, W.d.S.; Ferrer, M.M.; Botelho, G.; Gracia, L.; Nogueira, I.C.; Pinatti, I.M.; Rosa, I.L.V.; La Porta, F.A.; Andres, J.; Longo, E. Effects of chemical substitution on the structural and optical properties of α-Ag2−2xNixWO4 (0 ≤ x ≤ 0.08) solid solutions. Phys. Chem. Chem. Phys. 2016, 18, 21966. [Google Scholar] [CrossRef]
  49. Pereira, P.F.S.; Santos, C.C.; Gouveia, A.F.; Ferrer, M.M.; Pinatti, I.M.; Botelho, G.; Sambrano, J.R.; Rosa, I.L.V.; Andres, J.; Longo, E. α-Ag2-2xZnxWO4 (0 ≤ x ≤ 0.25) solid solutions: Structure, morphology, and optical properties. Inorg. Chem. 2017, 56, 7360. [Google Scholar] [CrossRef]
  50. Silva, M.D.P.; Goncalves, R.F.; Nogueira, I.C.; Longo, V.M.; Mondoni, L.; Moron, M.G.; Santana, Y.V.; Longo, E. Microwave-assisted hydrothermal synthesis of Ag2(W1-xMox)O4 heterostructures: Nucleation of Ag, morphology, and photoluminescence properties. Spectrochim. Acta Part A 2016, 153, 428. [Google Scholar] [CrossRef]
  51. Penha, M.D.; Gouveia, A.F.; Teixeira, M.M.; de Oliveira, R.C.; Assis, M.; Sambrano, J.R.; Yokaichya, F.; Santos, C.C.; Gonçalves, R.F.; Li, M.S.; et al. Structure, optical properties, and photocatalytic activity of alpha-Ag2W0.75Mo0.25O4. Mater. Res. Bull. 2020, 132, 111011. [Google Scholar] [CrossRef]
  52. Pinatti, I.M.; Pereira, P.F.S.; de Assis, M.; Longo, E.; Rosa, I.L.V. Rare earth doped silver tungstate for photoluminescent applications. J. Alloys Compd. 2019, 771, 433. [Google Scholar] [CrossRef]
  53. Nascimento, M.V.B.d.; Nobre, F.X.; de Araújo, E.N.D.; de Araújo, C.I.L.; Couceiro, P.R.C.; Manzato, L. Ag2–xCuxWO4 Solid Solution: Structure, Morphology, Optical Properties, and Photocatalytic Performance in the Degradation of RhB under Blue Light-Emitting Device Irradiation. J. Phys. Chem. C 2021, 125, 11875. [Google Scholar] [CrossRef]
  54. Ayappan, C.; Palanivel, B.; Jayaraman, V.; Mani, A. Copper ions induced α-Ag2–2xCuxWO4 (0 ≤ x ≤ 0.12) solid solutions with favorable sunlight photocatalytic removal of toxic pollutants. J. Alloy. Compd. 2021, 871, 159530. [Google Scholar] [CrossRef]
  55. Longo, E.; Cavalcante, L.S.; Volanti, D.P.; Gouveia, A.F.; Longo, V.M.; Varela, J.A.; Orlandi, M.O.; Andres, J. Direct in situ observation of the electron-driven synthesis of Ag filaments on alpha-Ag2WO4 crystals. Sci. Rep. 2013, 3, 1676. [Google Scholar] [CrossRef]
  56. Larson, A.C.; von Dreele, R.B. General Structure Analysis System (GSAS), Los Alamos National Laboratory Report LAUR 86-748; The Regents of the University of California: California, CA, USA, 2004. [Google Scholar]
  57. Holder, C.F.; Schaak, R.E. Tutorial on Powder X-ray Diffraction for Characterizing Nanoscale Materials. ACS Nano. 2019, 13, 7359. [Google Scholar] [CrossRef]
  58. Xu, D.; Cheng, B.; Zhang, J.; Wang, W.; Yu, J.; Ho, W. Photocatalytic activity of Ag2MO4 (M = Cr, Mo, W) photocatalysts. J. Mater. Chem. A 2015, 3, 20153. [Google Scholar] [CrossRef]
  59. Sreedevi, A.; Priyanka, K.P.; Babitha, K.K.; Ganesh, S.; Varghese, T. Influence of electron beam irradiation on structural and optical properties of α-Ag2WO4 nanoparticles. Micron 2016, 88, 1–6. [Google Scholar]
  60. Turkovi, A.; Fox, D.L.; Scott, J.F.; Geller, S.; Ruse, G.F. High Temperature Raman Spectroscopy of Silver Tetratungstate, Ag8W4016. Mater. Res. Bull. 1977, 12, 189. [Google Scholar] [CrossRef]
  61. Pereira, P.F.S.; Nogueira, I.C.; Longo, E.; Nassar, E.J.; Rosa, I.L.V.; Cavalcante, L.S. Rietveld refinement and optical properties of SrWO4:Eu3+ powders prepared by the non-hydrolytic sol-gel method. J. Rare Earth. 2015, 33, 113. [Google Scholar] [CrossRef]
  62. Kubelka, P.; Munk, F. Ein Beitrag Zur Optik Der Farbanstriche. Z. Fur. Tech. Phys. 1931, 12, 593. [Google Scholar]
  63. Longo, V.M.; Orhan, E.; Cavalcante, L.S.; Porto, S.L.; Espinosa, J.W.M.; Varela, J.A.; Longo, E. Understanding the origin of photoluminescence in disordered Ca0.60Sr0.40WO4: An experimental and first-principles study. Chem. Phys. 2007, 334, 180. [Google Scholar] [CrossRef]
  64. Kröger, F.A.; Vink, H.J. Relations between the Concentrations of Imperfections in Crystalline Solids. Solid State Phys. 1956, 3, 307. [Google Scholar]
  65. Heinlaan, M.; Ivask, A.; Blinova, I.; Dubourguier, H.C.; Kahru, A. Toxicity of nanosized and bulk ZnO, CuO and TiO2 to bacteria Vibrio fischeri and crustaceans Daphnia magna and Thamnocephalus platyurus. Chemosphere 2008, 71, 1308. [Google Scholar] [CrossRef]
  66. Baek, Y.W.; An, Y.J. Microbial toxicity of metal oxide nanoparticles (CuO, NiO, ZnO, and Sb2O3) to Escherichia coli, Bacillus subtilis, and Streptococcus aureus. Sci. Total Environ. 2011, 409, 1603. [Google Scholar] [CrossRef]
  67. Santo, C.E.; Taudte, N.; Nies, D.H.; Grass, G. Contribution of copper ion resistance to survival of Escherichia coli on metallic copper surfaces. Appl. Environ. Microbiol. 2008, 74, 977. [Google Scholar] [CrossRef]
  68. Pramanik, A.; Laha, D.; Bhattacharya, D.; Pramanik, P.; Karmakar, P. A novel study of antibacterial activity of copper iodide nanoparticle mediated by DNA and membrane damage. Colloids Surf. B Biointerfaces 2012, 96, 50. [Google Scholar] [CrossRef]
  69. Wang, Q.P.; Guo, X.X.; Wu, W.H.; Liu, S.X. Preparation of Fine Ag2WO4 Antibacterial Powders and Its Application in the Sanitary Ceramics. Adv. Mater. Res. 2011, 284–286, 1321. [Google Scholar]
  70. Mondego, M.; de Oliveira, R.C.; Penha, M.; Li, M.S.; Longo, E. Blue and red light photoluminescence emission at room temperature from CaTiO3 decorated with α-Ag2WO4. Ceram. Int. 2017, 43, 5759. [Google Scholar] [CrossRef]
  71. Andrés, J.; Gracia, L.; Gouveia, A.F.; Ferrer, M.M.; Longo, E. Effects of surface stability on the morphological transformation of metals and metal oxides as investigated by first-principles calculations. Nanotechnology 2015, 26, 405703. [Google Scholar] [CrossRef]
  72. Wulff, G., XXV. Zur Frage der Geschwindigkeit des Wachsthums und der Auflösung der Krystallflächen. Z. Kristallogr. 1901, 34, 449. [Google Scholar] [CrossRef]
  73. Gouveia, A.F.; Gracia, L.; Longo, E.; San-Miguel, M.A.; Andrés, J. Modulating the properties of multifunctional semiconductors by means of morphology: Theory meets experiments. Comput. Mater. Sci. 2021, 188, 110217. [Google Scholar] [CrossRef]
  74. Ferrer, M.M.; Gouveia, A.F.; Gracia, L.; Longo, E.; Andres, J. A 3D platform for the morphology modulation of materials: First principles calculations on the thermodynamic stability and surface structure of metal oxides: Co3O4, α-Fe2O3, and In2O3. Modell. Simul. Mater. Sci. Eng. 2016, 24, 025007. [Google Scholar] [CrossRef]
  75. Oliveira, M.C.; Andrés, J.; Gracia, L.; de Oliveira, M.S.M.P.; Mercury, J.M.R.; Longo, E.; Nogueira, I.C. Geometry, electronic structure, morphology, and photoluminescence emissions of BaW1-xMoxO4 (x = 0, 0.25, 0.50, 0.75, and 1) solid solutions: Theory and experiment in concert. Appl. Surf. Sci. 2019, 463, 907. [Google Scholar] [CrossRef]
  76. Gouveia, A.F.; Ferrer, M.M.; Sambrano, J.R.; Andres, J.; Longo, E. Modeling the atomic-scale structure, stability, and morphological transformations in the tetragonal phase of LaVO4. Chem. Phys. Lett. 2016, 660, 87. [Google Scholar] [CrossRef]
  77. Nosaka, Y.; Nosaka, A.Y. Generation and Detection of Reactive Oxygen Species in Photocatalysis. Chem. Rev. 2017, 117, 11302. [Google Scholar] [CrossRef] [PubMed]
  78. Prasanna, V.L.; Vijayaraghavan, R. Insight into the Mechanism of Antibacterial Activity of ZnO: Surface Defects Mediated Reactive Oxygen Species Even in the Dark. Langmuir 2015, 31, 9155. [Google Scholar] [CrossRef] [PubMed]
  79. Kessler, A.; Hedberg, J.; Blomberg, E.; Odnevall, I. Reactive Oxygen Species Formed by Metal and Metal Oxide Nanoparticles in Physiological Media—A Review of Reactions of Importance to Nanotoxicity and Proposal for Categorization. Nanomaterials 2022, 12, 1922. [Google Scholar] [CrossRef]
  80. Wayne, P.; Clinical and Laboratory Standards Institute. Reference Method for Broth Dilution Antifungal Susceptibility Testing of Yeasts; CLSI Document M27-A3; Clinical and Laboratory Standards Institute: Wayne, OA, USA, 2008; Volume 28, p. 6. [Google Scholar]
  81. Clinical and Laboratory Standards Institute. Methods for Dilution Antimicrobial Susceptibility Tests for Bacteria That Grow Aerobically CLSI Document M7-A7; Clinical and Laboratory Standards Institute: Wayne, PA, USA, 2006; p. 7. [Google Scholar]
  82. Wady, A.F.; Machado, A.L.; Foggi, C.C.; Zamperini, C.A.; Zucolotto, V.; Moffa, E.B.; Vergani, C.E. Effect of a Silver Nanoparticles Solution on Staphylococcus aureus and Candida spp. J. Nanomater. 2014, 2014, 128. [Google Scholar] [CrossRef]
  83. Hohenberg, P.; Kohn, W. Inhomogeneous Electron Gas. Phys. Rev. 1964, 136, B864. [Google Scholar] [CrossRef]
  84. Kohn, W.; Sham, L.J. Self-Consistent Equations Including Exchange and Correlation Effects. Phys. Rev. 1965, 140, A1133. [Google Scholar] [CrossRef]
  85. Perdew, J.P.; Burke, K.; Ernzerhof, M. Generalized Gradient Approximation Made Simple. Phy. Rev. Lett. 1996, 77, 3865. [Google Scholar] [CrossRef] [PubMed]
  86. Kresse, G.; Hafner, J. Ab initiomolecular dynamics for open-shell transition metals. Phys. Rev. B 1993, 48, 13115. [Google Scholar] [CrossRef] [PubMed]
  87. Kresse, G.; Furthmuller, J. Efficiency of ab-initio total energy calculations for metals and semiconductors using a plane-wave basis set. Comput. Mater. Sci. 1996, 6, 15. [Google Scholar] [CrossRef]
  88. Blöchl, P.E. Projector augmented-wave method. Phys. Rev. B 1994, 50, 17953. [Google Scholar] [CrossRef]
  89. Kresse, G.; Joubert, D. From ultrasoft pseudopotentials to the projector augmented-wave method. Phys. Rev. B 1999, 59, 1758. [Google Scholar] [CrossRef]
  90. Dudarev, S.L.; Botton, G.A.; Savrasov, S.Y.; Humphreys, C.J.; Sutton, A.P. Electron-energy-loss spectra and the structural stability of nickel oxide: An LSDA+U study. Phys. Rev. B 1998, 57, 1505. [Google Scholar] [CrossRef]
Figure 1. XRD patterns of the α-Ag2−2xCuxWO4 solid solutions with x = (A) 0.00, (B) 0.005, (C) 0.01, (D) 0.02, (E) 0.04, (F) 0.08, and (G) 0.16.
Ijms 23 10589 g001
Figure 2. Three-dimensional representation of the orthorhombic α-Ag2WO4 structure highlighting the [CuO7] and [CuO6] clusters where the Cu atom substitutions can take place at the Ag sites in the α-Ag2−2xCuxWO4 (0 ≤ x ≤ 0.16) structure.
Ijms 23 10589 g002
Figure 3. XPS survey spectra of α-Ag2−2xCuxWO4 (0 ≤ x ≤ 0.16) solid solutions.
Ijms 23 10589 g003
Figure 4. (A) UV–vis diffuse reflectance spectra and (B) Egap values of the α-Ag2−2xCuxWO4 (0 ≤ x ≤ 0.16) solid solutions.
Ijms 23 10589 g004
Figure 5. PL emissions of the α-Ag2−2xCuxWO4 (0 ≤ x ≤ 0.16) solid solutions, excited at 405 nm with a krypton ion laser.
Ijms 23 10589 g005
Figure 6. Antibacterial and antifungal activities against (A) MRSA and (B) C. albicans of the α-Ag2−2xCuxWO4 (0 ≤ x ≤ 0.16) solid solutions.
Ijms 23 10589 g006
Figure 7. Calculated densities of states for the (a) undoped α-Ag2WO4, (b) α-Ag1.72Cu0.14WO4, and (c) α-Ag1.34Cu0.33WO4 models.
Ijms 23 10589 g007
Figure 8. FE-SEM images of α-Ag2−2xCuxWO4 microcrystals: (A) x = 0.00, (B) x = 0.005, (C) x = 0.01, (D) x = 0.02, (E) x = 0.04, (F) x = 0.08, and (G) x = 0.16.
Ijms 23 10589 g008
Figure 9. Morphology evolution as a function of the Cu2+ content along the α-Ag2−2xCuxWO4 solid solution.
Ijms 23 10589 g009
Figure 10. Views of the (010) and (101) surfaces and the Ag1 and Ag6 sites where the substitution process of Ag+ by Cu2+ cations take place.
Ijms 23 10589 g010
Figure 11. Density of states calculations decomposed in s (red), p (blue), and d (green) states for the (010) surface without (left) and with (right) Cu impurities.
Ijms 23 10589 g011
Figure 12. Density functional theory investigation s (red), p (blue), and d (green) states calculated for the (101) surface without (left panel) and with (right panel) Cu impurities.
Ijms 23 10589 g012
Table 1. ICP-AES data for the α-Ag2−2xCuxWO4 (0.005 ≤ x ≤ 0.16) solid solutions.
α-Ag2−xCuxWO4Theoretical (ppm)Experimental (ppm)
x = 0.0050.3000.354
x = 0.010.6340.687
x = 0.021.1181.379
x = 0.042.1142.778
x = 0.084.5645.631
x = 0.169.86011.574
Publisher’s Note: MDPI stays neutral with regard to jurisdictional claims in published maps and institutional affiliations.

