
Depolarizing Effects in Hydrogen Bond Energy in 310-Helices Revealed by Quantum Chemical Analysis


1
School of Regional Innovation and Social Design Engineering, Faculty of Engineering, Kitami Institute of Technology, Kitami 090-8507, Japan
2
Department of Biomedical Information Sciences, Graduate School of Information Sciences, Hiroshima City University, Hiroshima 731-3194, Japan
3
Laboratory for Computational Molecular Design, RIKEN Center for Biosystems Dynamics Research, 6-2-3, Furuedai, Suita 565-0874, Japan
4
Institute for Protein Research, Osaka University, Suita 565-0871, Japan
*
Authors to whom correspondence should be addressed.
Int. J. Mol. Sci. 2022, 23(16), 9032; https://doi.org/10.3390/ijms23169032
Submission received: 30 July 2022
/
Revised: 10 August 2022
/
Accepted: 11 August 2022
/
Published: 12 August 2022
(This article belongs to the Special Issue Computational Approaches for the Investigation of Complex Molecular Mechanisms)
Abstract
:Hydrogen-bond (H-bond) energies in 310-helices of short alanine peptides were systematically examined by precise DFT calculations with the negative fragmentation approach (NFA), a modified method based on the molecular tailoring approach. The contribution of each H-bond was evaluated in detail from the 310-helical conformation of total energies (whole helical model, WH3-10 model), and the results were compared with the property of H-bond in α-helix from our previous study. The H-bond energies of the WH3-10 model exhibited tendencies different from those exhibited by the α-helix in that they depended on the helical position of the relevant H-bond pair. H-bond pairs adjacent to the terminal H-bond pairs were observed to be strongly destabilized. The analysis of electronic structures indicated that structural characteristics cause the destabilization of the H-bond in 310-helices. We also found that the longer the helix length, the more stable the H-bond in the terminal pairs of the WH3-10 model, suggesting the action of H-bond cooperativity.
1. Introduction
Proteins are macromolecules essential for sustaining life and are also known to perform diverse biochemical functions in nature, such as molecular recognition, chemical catalysis, molecular switching, and the structural maintenance of cells [1,2,3,4]. They typically comprise 20 different amino acids linked by peptide bonds. In aqueous solutions, the polypeptide chains in proteins fold according to their amino acid sequencing and form a three-dimensional structure. The remarkable functional versatility of proteins results from the chemical diversity of the side chains of the constituent amino acids, flexibility of the polypeptide chains, and excellent variety of structures rendered possible by the wide range of amino acid sequences.
Approximately 90% of the amino acid residues in protein structures are found in locally ordered secondary structures, such as an α-helix or a β-sheet [5]. These secondary structures assemble and fold to form three-dimensional structures, also known as tertiary structures. In other words, secondary structures are the building blocks of protein structures.
The helix is the most commonly observed secondary structure and can be classified into different helical conformations [3,4]. Of these, the α-helix is predominant and is found in 80% of the helical structures [6]. The α-helix comprises a remarkably rigid arrangement of polypeptide chains and is a common secondary structural element in fibrous and globular proteins. It is arranged such that the peptide C=O group of the i-th residue along the helix faces the peptide N–H group of the (i + 4)-th residue, which results in the formation of a hydrogen bond with an N-to-O distance of ~2.8 Å. The second most common helical structure is the 310-helix, which is present in 20% of the helical structures [6]. This helix comprises three amino acid residues per helical turn, and a hydrogen bond is formed between the i-th and (i + 3)-th residues, resulting in a tighter packing of the backbone compared with the α-helix. This packing also forces the hydrogen bond to move outward from the helical axis.
The hydrogen bond (H-bond) is one of the most important noncovalent interactions for chemical and biological phenomena [7,8,9]. It also plays an essential role in secondary structure formation. Therefore, an accurate and quantitative evaluation of H-bonds is necessary to understand the principles of tertiary structure formation in proteins. It is well known that individual force fields used in classical molecular dynamics (MD) simulations exhibit the specific tendency of generating an α-helix or a β-strand [10,11,12]. Yoda et al. used MD simulations with explicit water molecules to compare the secondary structural properties of commonly used force fields [13,14]. They found that MD simulations using AMBER ff94 [15] and ff99 [16] were in remarkable agreement with experimental data for α-helical polypeptides but not for β-hairpin polypeptides. This preference of force fields on the secondary structure formation is typically not a problem in the MD simulations of rigid globular protein structures. However, it has become a critical issue in understanding functionally critical conformational changes [17,18,19,20] in the folding simulations of flexible disordered regions [17,18] and long loops between secondary structures [19,20]. Numerous attempts have been made to overcome this problem, such as increasing the torsional energies, rearrangements [21,22,23,24], and developing polarized charge models [25,26]. Regardless, the reasons behind the use of these methods remain unclear, and elucidation requires understanding the energy of hydrogen bonding in the secondary structure.
Several computational chemists have studied hydrogen bonding interactions in secondary structures at various levels of theoretical depth. Wieczorek and Dannenberg investigated H-bond cooperativity and the energetics of α-helices and suggested that various factors contribute to their stability [27,28]. Morozov et al. evaluated the origin of cooperativity in forming α-helices [29]. Zhao and Wu studied the role of cooperativity in the formation of α-helices by performing theoretical calculations on α-helix models constructed using a simple repeating unit method [30]. Parthasarathi et al. studied H-bond interactions in an α-helix model using the atom-in-molecules method [31]. Ismer et al. investigated the temperature dependence of the stability of α-, π-, and 310-helices comparing with a fully extended structure using density functional theory and harmonic approximation [32].
In our previous study [33], we calculated the conformational energies of secondary structures formed by alanine oligopeptides using several quantum mechanical (QM) methods; these included the Hartree–Fock (HF) method, second-order Møller–Plesset perturbation theory (MP2), density functional theory (DFT), and molecular mechanics (MM) calculations with classical force-field AMBER ff99SB. The results showed that classical force fields can be used to approximate the energies of parallel and antiparallel β-sheets, which are provided by the QM method. However, the energies of the α-helical structures by the MM method were found to be significantly different from those given by the QM method. This difference might be attributable to the electrostatic energy associated with hydrogen bonding [33]. The molecular tailoring approach (MTA) [34] was slightly modified [35], which is described in detail in Methods and Materials section. This method is denoted here as the negative fragmentation approach (NFA). We used the NFA in combination with DFT and MM calculations to resolve the individual interaction energies associated with each hydrogen bond formed in typical α-helices of different peptide lengths [35]. We concluded that the H-bond energies of the α-helix are generally higher than those of separated H-bonds because of the depolarized electronic structures around the carbonyl oxygen and the participation of amide hydrogen in the H-bond. Such depolarizations redistribute the electron density and are caused by local short-ranged electrostatic interactions with neighboring species in the α-helical structure [35].
In the present study, we systematically investigated the H-bond energies and associated electron density changes in 310-helices using QM calculations and compared them with those observed for α-helices in our previous study [35]. The contribution of each H-bond was evaluated from the total conformational energy (whole-helical and WH3-10 models). To understand the characteristics of the H-bond energy in 310-helices, we additionally evaluated the H-bond energies using the following simplified models: minimal hydrogen bond (MH3-10) models, wherein only H-bond donors and acceptors were present with capping methyl groups, and the single tern (ST3-10) model, which includes a single helical turn. The characteristic interactions essential for 310-helices are quantitatively discussed.
2. Results
2.1. Structures of H-Bonds of the Optimized Whole-Helical Models of 310-Helices
We constructed three models of the 310-helices: WH3-10, which is oligoalanine peptides capped with the acetyl (Ace) and N-methyl amide groups (Nme), referred to as Ace-(Ala)n-Nme (n = 2 to 7) and the simplified models: single turn model (ST3-10) and minimal H-bond model (MH3-10). We denote WH3-10 model of Ace-(Ala)n-Nme by WH3-10-n and represent the s-th H-bond in WH3-10-n counting from the N-terminus by n-s. For comparison, we used the previously reported whole-helical structure models (WHa) and simplified models (STa and MHa) of the α-helices. The details of these models are described in Methods and Materials.
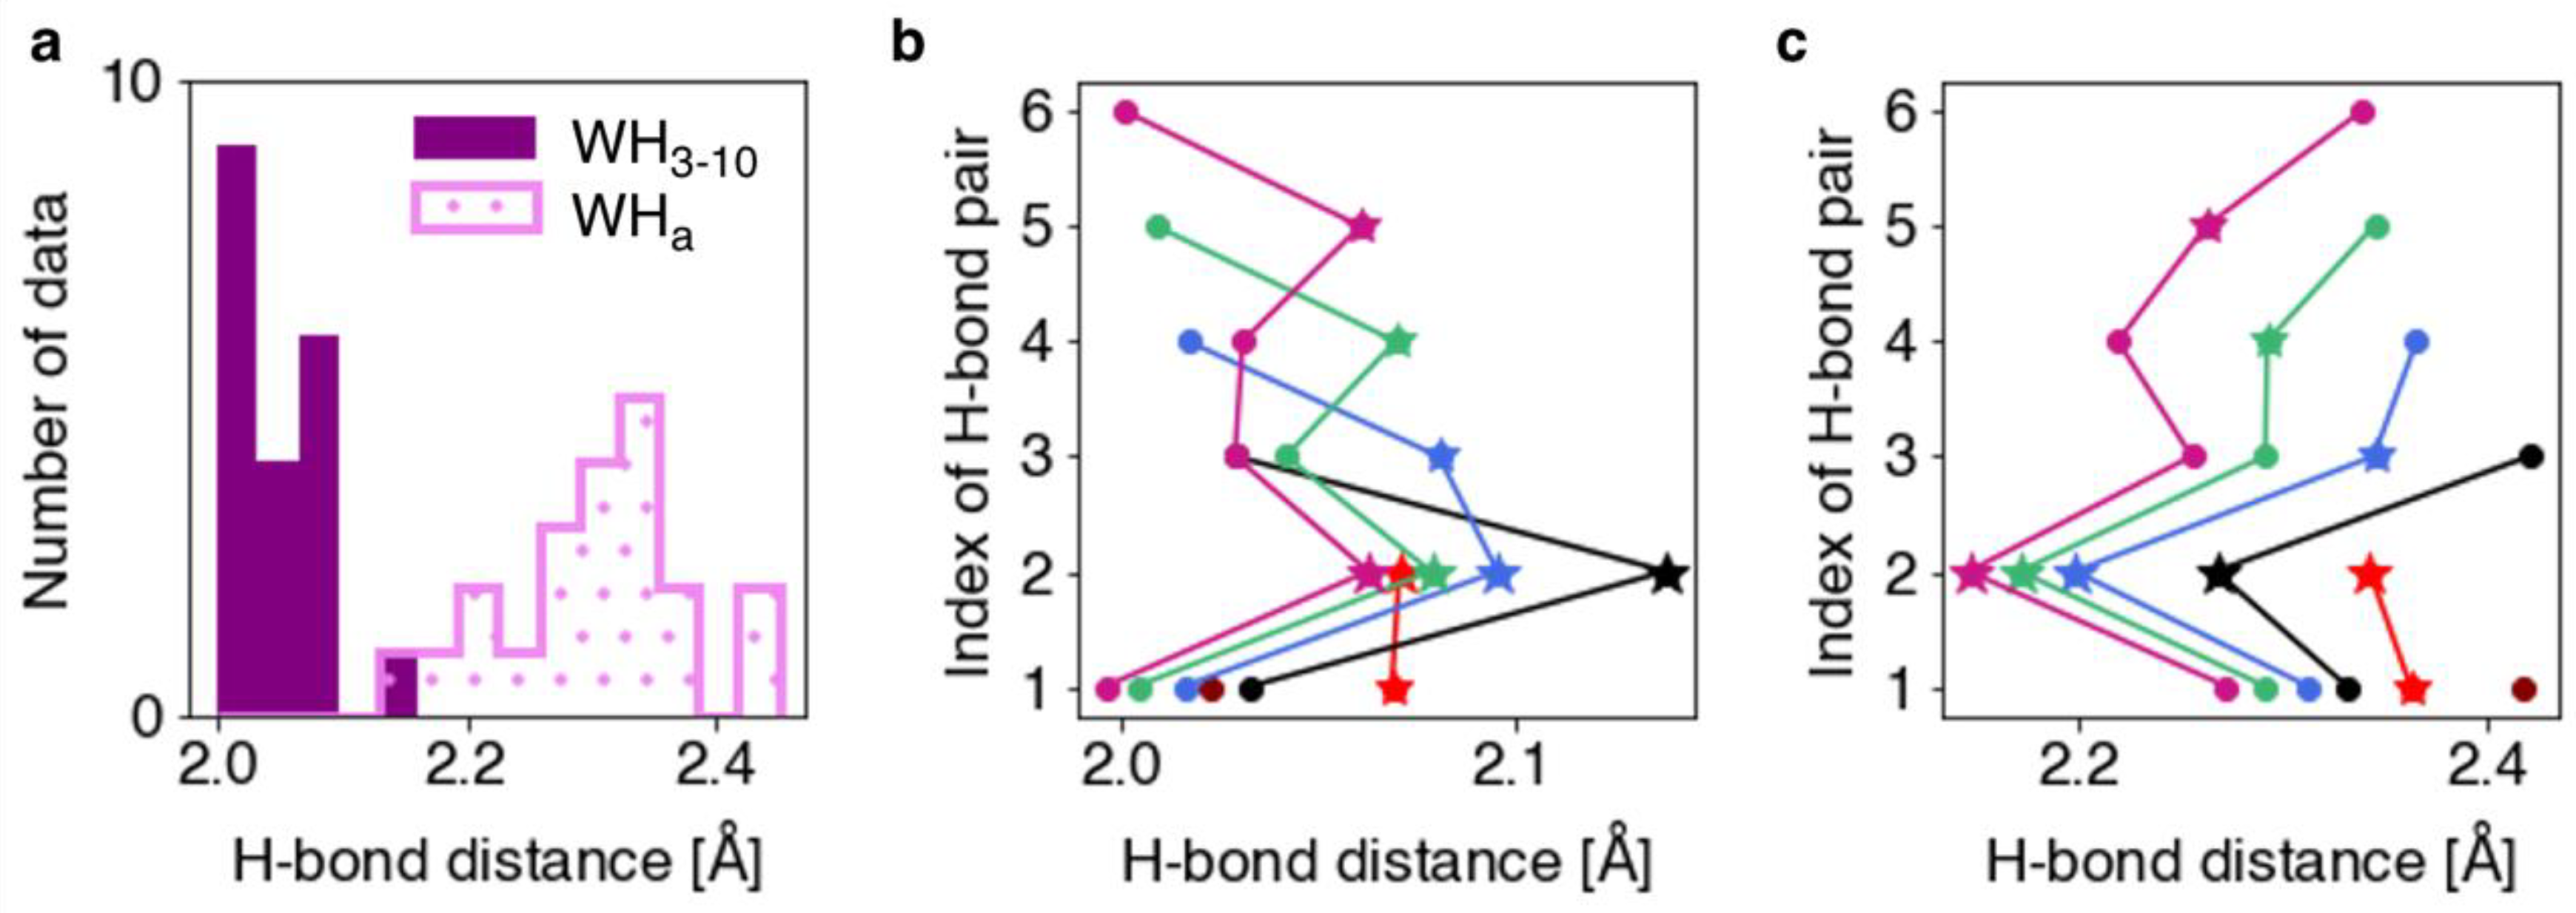
The H-bond distances and torsion angles were analyzed for the optimized WH3-10 models. The H-bond distance was defined as the distance between the oxygen atom in the backbone C=O group and the hydrogen atom in the backbone N–H group, which form an H-bond. A histogram of the H-bond distances and a plot of the H-bond distances for each pair in the WH3-10 and the corresponding α-helix models (WHa) are shown in Figure 1. The mean values and standard deviations of the H-bond distances for the WH3-10 and WHa models were found to be 2.05 ± 0.04 and 2.30 ± 0.07 Å, respectively. The WH3-10 models generally exhibited shorter H-bonds than those exhibited by the WHa models. A characteristic feature of WH3-10 is that the H-bond distances tend to be greater in the H-bond pairs adjacent to the terminal ones (Figure 1b and Table 1). The 4–2 H-bond pair in WH3-10, sandwiched between the N- and C-terminal H-bond pairs as indicated in the figure of Methods and Materials, showed the longest H-bond distance.
The H-bond torsion angle was evaluated as the angle between the vectors of the C=O and N–H atoms on the backbone. This corresponds to the dihedral angle of the C, O, N, and H atoms comprising the H-bond. As shown in Figure 2b, the N-terminal H-bonding pairs in the WHa model exhibited significantly different torsion angles than those exhibited by the other H-bonding pairs. In the WH3-10 models, the H-bond torsion angles of individual H-bond pairs varied with the length of the helix and their position in it (Figure 2a). In addition, the H-bond torsion angles of the WH3-10 models are narrowly distributed, indicating that the molecular backbone of the WH3-10 models imposes stronger structural constraints than those of the WHa models. These constraints can possibly lead to considerably shorter H-bond distances in the WH3-10 models than in the WHa models, as shown in Figure 1a.
2.2. Comparison of H-Bond Energy in Helical Model Systems
To investigate the effects of the helical backbone atoms linking the H-bond acceptor and donor on the H-bond energies, we compared the H-bond energies for the WH3-10, ST3-10, and MH3-10 models of the 310-helices as well as those for the α-helices from our previous study, namely WHa, STa, and MHa [35]. In the MH3-10 and MHa models, the two peptide groups of hydrogen donors and acceptors were separated without linking the helical backbone atoms. The H-bond energies were calculated with the NFA (Details are shown in Section 4.2). In Figure 3a, the H-bond energies of the WH3-10 (black) and ST3-10 (red) models are plotted versus those of the MH3-10 models for the 310-helices. Those of the WHa, STa, and MHa models for α-helices [35] are also shown in Figure 3b.
In the α-helices, the STa model reproduced the H-bond energies of the WHa model (Figure 3b), indicating that the adjacent residue destabilized the H-bond with respect to the MHa model [35]. In the 310-helices, the ST3-10 models also destabilized the H-bond with respect to the MH3-10 models, similar to the α-helices, but failed to provide the equivalent H-bond energies. In particular, the H-bond pairs adjacent to the N- or C-terminus were strongly destabilized in energy (underlined in Table S1). This indicates that the helical backbone atoms participating in the H-bond are partly involved in the destabilization of the H-bond but that other factors also lead to unstable H-bond energies. We also found a tendency that the longer the helix length, the more stable the H-bond energy of the N- and C-terminal pairs in the WH3-10 model (shown in Table S1). However, there is an exception: The H-bond energies of the N- and C-terminal pairs in WH3-10-3 were observed to be higher than those of WH3-10-2. They are close to those of the H-bond pairs adjacent to the terminal H-bond pair in the other systems. This would be because the N- and C-termini are adjacent to each other in WH3-10-3. For example, the N-terminal H-bond pair of WH3-10-3, 3-1, is adjacent to the C-terminal H-bond pair 3-2, and vice versa.
Considering the H-bond energies of the ST3-10 model, only the H-bond pairs next to the N- or C-terminal were destabilized by the adjacent residue, as shown in Figure 3a. The pair sandwiched between the N- and C-termini were also the most affected (4-2 of WH3-10-4), which causes a difference in the linear regression coefficient between the WH3-10 and ST3-10 models, as shown in Figure 3a.
To further examine the effect of neighboring residues on the H-bond energy of the 310-helices, we constructed additional models as follows: STEC, in which the ST3-10 model, Ace-(Ala)2-Nme, was extended to the C-terminal (Ace-(Ala)2-Ala-Nme); STEN, in which the ST3-10 model was extended to the N-terminal (Ace-Ala-(Ala)2-Nme); STECN, in which the ST3-10 model was extended to both N- and C-termini (Ace-Ala-(Ala)2-Ala-Nme); and STE2N, in which the ST3-10 model was extended by two residues to the N-terminal (Ace-Ala-Ala-(Ala)2-Nme). All peptide structures were generated based on the WH3-10 model, and their H-bond energies were computed by using the NFA.
As expected, in the STECN model, both the N- and C-terminal H-bond pairs were adjacent to the target H-bond, thereby making the H-bond energy unstable (Figure 4). The STEC and STEN models were more stable than the STECN models. The STE2N model showed nearly the same results as the ST3-10 model and higher energy values than those of the terminal pairs in the WH3-10 model, as shown in the crosses in Figure 4.
2.3. Electronic Structures around the H-Bond Donors and Acceptors
In addition to the H-bond energies, NFA can approximately represent the change of electronic structures upon H-bond formation by Equation (6) in Section 4.2. To examine the difference in the H-bond energy between the ST3-10 and MH3-10 models and between the WH3-10 and ST3-10 models in the context of their electronic structures, the differences in the change in electron density were computed using Equations (1) and (2), respectively:
Figure 5 shows for the first to third H-bond pairs of WH3-10-4 (4-1, 4-2, and 4-3), in addition to both and for the same pairs. indicates larger depolarization in the ST3-10 model compared with the MH3-10 model, as shown in Figure 5d–f.
As illustrated in Figure 5a–c, we found that the electron density increases in the vicinity of the oxygen atom of the C=O group and that it decreases in the vicinity of the hydrogen atom of the N–H group, thus demonstrating the formation of the H-bond. The of 4-2 appears to be slightly smaller than that of 4-1, indicating a larger depolarization of 4-2 than that of 4-1. This larger depolarization results in a weaker H-bond at 4-2, as illustrated in Figure 5a–c. A remarkable difference was observed between 4-2 and 4-1 and between 4-2 and 4-3: the of 4-1 and that of 4-3 was considerably smaller than that of 4-2, implying that an effect other than the helical backbone atoms between the acceptor and donor of H-bond pair was at play in the 4-2 pair (Figure 5g,i). Namely, the backbone atoms locating at the N- and C-terminal sides could provide the depolarization effect. This could be the reason behind the difference in the H-bond energy between the WH3-10 and ST3-10 in the H-bond pairs adjacent to the terminal pairs.
2.4. Dependence of Helix Length on H-Bond Energies
We investigated the dependence of helix length on the mean value of the H-bond energies in the WH3-10 and WHa models. The mean H-bond energies of these models were plotted as functions of the minimum length of the corresponding helices, as shown in Figure 6. In WHa models, the energy of the H-bond gradually stabilized with an increase in the length of the helix, demonstrating the well-known “H-bond cooperativity” phenomenon [27,28,29,30], where long-range interaction could make more stable helices. The mechanism behind the cooperativity in helix formation can be deconstructed into two parts, namely, electrostatic interactions between residues and nonadditive many-body effects caused by the redistribution of electron density with increasing helix length [29]. In the WH3-10 model series, the H-bond of ST3-10 was destabilized in the first increment of the minimum length of the helix, while subsequent increments gradually stabilized it. This is because the first increase in helix makes the H-bond adjacent to the terminal H-bond pair, leading to considerable destabilization of the H-bond, as discussed above. Subsequent elongation of the helix results in the stabilization of the terminal H-bond through H-bond cooperativity [28,30].
3. Discussion
We systematically investigated the H-bond energies of various 310-helices and found them to exhibit tendencies different from those exhibited by α-helices. Here, we discuss the following three issues: (i) why the H-bond energies in the ST3-10 model are destabilized compared with those in the MH3-10 model, (ii) why the H-bond pairs adjacent to the terminal pair are largely destabilized compared with other H-bond pairs, and (iii) why the terminal H-bond pairs are stabilized, particularly for long 310-helices.
For the issue (i), as mentioned in Section 2.3, the C=O and N–H groups participating in the H-bond were depolarized in the ST3-10 model in comparison to the MH3-10 model. This depolarization could be caused by the helical backbone atoms linking the H-bond pair (residue 2 of Figure 7). In α-helices, the adjacent C=O group is involved in depolarization [35]. However, in the 310-helices, the C=O group of the H-bond pair is closer to the adjacent N–H group (~2.8 Å) than to another adjacent C=O group (~3.4 Å). Therefore, the destabilization of the H-bond is attributed to the depolarization caused by the N–H group.
For the issue (ii), when ST3-10 was extended to the N-terminus by a single residue (STEN), an additional H-bond was formed between the C=O group of residue −1 and the N–H group of residue 2. This H-bond formation causes polarization of the N–H group of residue 2, leading to further depolarization of the C=O group of residue −1. Thus, the H-bond could be destabilized. When STEN is further extended to the N-terminal (STE2N), an additional H-bond is formed between the N=H group of residue 1 and C=O group of residue –2 (back side of the helix in the right panel of Figure 7). This H-bond formation induces polarization of the N–H group of residue 1, causing polarization of the adjacent C=O group of residue 0. This effect could cancel the depolarization effect by the N–H group of residue 2 on the C=O group of residue 0, thereby strengthening the H-bond. At the C-terminal, the similar depolarization effect could destabilize the H-bond.
For the issue (iii), H-bond cooperativity stabilizes the terminal H-bond pair indicated in Section 2.4, as well as the α-helices [27,28,29,30].
For understanding the electronic structures in the more quantitative manner, Hirshfeld population analysis [36,37,38] was performed for WH3-10, ST3-10, and MH3-10 models of 4-1, 4-2, and 4-3, respectively. We calculated the local dipole moments of the C=O and N–H groups of the backbone H-bond acceptor and donor, respectively, as follows [35]:
Here, qiC and qiO are the Hirshfeld atomic charges of the C and O atoms in the C=O group of the i-th residue, and qiH and qiN are those of the N–H group of the i-th residue, respectively. is the position vector of the corresponding atom X of the i-th residue.
The L2 norm of each dipole moment, and , are used for the following discussion. The resulted and are shown in Table 2A,B. In the former, the H-bond pairs were formed, and in the latter, the H-bonds were not formed between the C=O group of the i-th residue and the N–H group of the (i + 3)-th residue.
As clearly shown in Table 2A,B, all Ratio (ST3-10/MH3-10) and Ratio (WH3-10/MH3-10) were less than 1. Namely, and of ST3-10 models and those of WH3-10 models were always smaller than the corresponding dipole moments of MH3-10 models, in which no neighboring carbonyl (C=O) or amide (N–H) groups exist. The amplitude of the depolarization effects relating to the above issue (i) was about 3% to 5% on average from Table 2A,B, independently of whether the H-bonds are formed or not.
Relating to the issue (ii), we found of WH3-10 model of 4-2 was 2% to 3% smaller than those of 4-1 and 4-3, as indicated in Table 2A,B. In contrast, of the WH3-10 model of 4-2 had similar values to those of 4-1 and 4-3. These phenomena correlate well with the differences of electron densities shown in Figure 5.
The H-bond energies for the WH3-10 and WHa models were compared using QM (EHB in Equation (5) in Section 4.2) and MM (EHB_MM in Equation (7) in Section 4.2) calculations. Figure 8a exhibits the H-bond energies calculated with QM plotted versus those with MM for individual pairs of the WH3-10 and WHa models. In the WHa models, the H-bond energies obtained via QM calculations were shown to be strongly correlated to those obtained via MM, with a correlation coefficient of 0.89. However, the MM calculations overestimated the magnitude of the H-bond energies by ~1 kcal/mol (the mean energy values obtained via QM and MM were −3.21 ± 0.39 and −4.24 ± 0.45 kcal/mol, respectively). Our previous study, wherein the energies were obtained via QM calculation, showed that the destabilization of the H-bond energies in the WHa model was attributed to the depolarization of the H-bond donors and acceptors caused by adjacent residues [35].
In contrast, the H-bond energies for the WH3-10 models obtained via QM calculation seem to be closer to those obtained with MM and were more stable than those of the WHa models (the mean energy values obtained via QM and MM for the WH3-10 model were −4.96 ± 0.39 and −4.95 ± 0.24 kcal/mol, respectively). Unlike the WHa models, the correlation between the QM and MM calculations was weak: the correlation coefficient was evaluated to be 0.54, as shown in Figure 8a.
In Figure 8b, the H-bond energies calculated with QM are plotted versus those with MM for individual pairs of the MH3-10 models and MHa models. Although the H-bond energies obtained via QM and MM for the MHa models almost coincided [35], the H-bond energies obtained by QM were significantly more stable than those obtained via MM for the MH3-10 models. However, unlike the WH3-10 models, the correlation between the H-bond energies obtained via QM and MM for the MH3-10 models was acceptable, and the correlation coefficient was 0.88. The reason why the H-bond energies obtained using MM largely deviate from those obtained via QM may be the poor quality of the atomic partial charges in Equation (7) in Section 4.2. Here, we used the AMBER ff99SB force-field parameters [16] for the atomic partial charges, which were originally determined by multiple-conformation models fitting to the local conformations of a single amino acid for both the α-helical and extended structures [39]. Thus, the parameters may well reproduce H-bond energies for the α-helical conformations MHa but not for the 310-helices MH3-10.
In the current study, it is revealed that the H-bond energy of 310-helix largely depends on its local conformation yielding the depolarization and on the long-ranged cooperativity effect. Those QM effects have not been included in the MM computations or for the H-bond energy of the α-helix [35]. In order to improve the MM force fields at least by including the short-ranged interactions, there could be two approaches: (i) by modifying the atomic partial charges, which are not constant values but depend on the local atomic conformation, and (ii) by creating new backbone dihedral parameters, which depends on not only a single amino acid residue but also on the parameter set including the neighboring residues, as suggested by our previous paper [35]. Those approaches may provide us more reliable MM parameters, although they would be difficult to attain.
4. Methods and Materials
4.1. Whole-Helical Structure (WH3-10), Single-Turn (ST3-10), and Minimal H-Bond (MH3-10) Models
Whole-helical structure models of the 310-helices (WH3-10) were constructed using oligoalanine peptides capped with the acetyl (Ace) and N-methyl amide groups (Nme), referred to as Ace-(Ala)n-Nme. We used dipeptide-to-heptapeptide alanines (n = 2 to 7) for the WH3-10 model, which consists of Ace-(Ala)n-Nme, is denoted by WH3-10-n. The backbone dihedral angles (φ, ψ) for each residue were set to φ = −49° and ψ = −26°. For comparison, we used the previously reported whole-helical structure models of the α-helices (WHa-n), composed of the alanine oligopeptide Ace-(Ala)n-Nme (n = 3 to 8), with φ = −57° and ψ = −47° [3]. These structures were optimized in the gas phase by the energy minimization of the electronic state while keeping the backbone dihedral angles fixed at the aforementioned values.
One-to-six H-bonds were present between the C=O and N–H groups in the backbone of the optimized WH3-10 models, as H-bonds were formed between an i-th and (i + 3)-th peptide pair for WH3-10 and between an i-th and (i + 4)-th peptide pair for WHa. The s-th H-bond in Ace-(Ala)n-Nme, counting from the N-terminus, is represented by n-s (Figure 9a shows WH3-10-4 as an example). The H-bond energies were individually calculated using DFT, as described below.
To analyze the origin of the H-bond interaction energy in 310-helices, we designed two simplified models. One is an ST3-10 model, composed of two successive alanine residues capped by Ace and Nme groups at the N- and C-termini, respectively (second column in Figure 9b). The other is an MH3-10 model, which comprises two separated N-methyl acetamide molecules and mimics a single H-bond between the C=O and N–H groups in the backbone (third column in Figure 9b). The atomic positions of these two models were the same as those of the corresponding WH3-10 models, except for the N- and C-terminal capping groups. The computation of the individual H-bond energies for these models was conducted in the same manner as that for each backbone H-bond in the WH3-10 models, as described below. The H-bond energies of the three models were then compared.
4.2. Calculation of H-Bond Energies Using the Negative Fragmentation Approach
The extraction of the H-bond energy from the total energy of a large molecule wherein the donor and acceptor atoms are linked through several covalent bonds, such as in α- and 310-helices, is not straightforward. In this study, we systematically computed the backbone H-bond energies in the WH3-10 models in the same manner as that computing the H-bond energies in the WHa models as reported previously [35], where we modified the MTA developed by Deshmukh et al. [34]. In the NFA, the H-bond energy, , in Ace-(Ala)n-Nme can be calculated using the following equation:
where , , , and are the energies of the entire system, the system lacking the acceptor group, the system without the donor group, and the system lacking both acceptor and donor groups, respectively; detailed descriptions are available in our previous study [35]. In the original MTA, the energy of the entire system was estimated using the energies of all fragments [34]. In the NFA, we used the total energy of the entire system and showed that the difference between the results was negligible [35].
The change in the electron density upon H-bond formation, , was evaluated as follows:
For comparison, we also computed the H-bond interaction energies via MM using the AMBER ff99SB force-field parameters [16], , for the corresponding H-bonds, as follows:
where I and J are the four atoms constituting the peptide group, namely, C, O, N, and H, of an acceptor and a donor involved in the H-bond, respectively. Bij and Cij are the Lennard–Jones coefficients, rij is the distance between the i-th and j-th atoms, and qi is the partial atomic charge of the i-th atom. The MM energy was calculated for the WH3-10 and MH3-10 models.
Calculations for all models were performed using the Gaussian09 program package [40]. The B97D exchange–correlation functional was used with 6–31 + G(d) basis sets. This method is capable of correctly describing van der Waals interactions and is comparable with the MP2 method in the calculation of the H-bond interaction energies of the Ace-(Ala)n-Nme system in the gas phase [33]. Changes in electron density were computed using cube files provided in the Gaussian09 program packages [40], and molecules that exhibited such changes were depicted by using UCSF Chimera [41]. The other molecular structures were drawn by using the VMD software [42].
5. Conclusions
In this study, the H-bond energies and associated changes in the electron density of the atoms forming H-bond of the 310-helices were systematically analyzed using the NFA method with high-quality DFT and MM computations and were compared with those of the α-helices. We prepared optimized structures of Ace-(Ala)n-Nme, where n ranged from 2 to 7 for the whole-helical structure models (WH3-10). To quantitatively investigate the origin of the H-bond energy in each helical model, we also constructed single-turn models (ST3-10), which comprised two successive alanine residues capped by Ace and Nme groups at the N- and C-termini, respectively, and minimum H-bond models (MH3-10), which comprised only pairs of Ace-Nme forming a single H-bond. The structures of the ST3-10 and MH3-10 models were based on the WH3-10 model. The individual H-bond energies were then computed using the NFA.
The distribution of the H-bond distance of the WH3-10 models was narrow, and these models exhibited lower values than those exhibited by the α-helical models (WHa). The shorter H-bond distance observed in the WH3-10 model was due to restrictions imposed by the tight helical structure. The H-bond energy of the WH3-10 model exhibited a tendency different from those exhibited by the ST3-10 and MH3-10 models; it depended on the location of the H-bond pair in the 310-helices. Furthermore, the H-bonds in this model tended to be destabilized in the H-bond pairs adjacent to the terminal pairs and were stabilized at the terminal H-bond pairs. An analysis of changes in the electron density between the WH3-10 and ST3-10 models and between the ST3-10 and MH3-10 models suggested that the destabilization of the H-bond in the ST3-10 model was attributed to the depolarization caused by the adjacent N–H group. It also suggested that the H-bond formation at this group causes polarization, leading to further depolarization of the C=O group participating in the H-bond pair and larger destabilization of the H-bond adjacent to the terminal H-bond pair. Except for the first increment, the elongation of the helix of the WH3-10 model resulted in the stabilization of the terminal H-bond through H-bond cooperativity.
Supplementary Materials
The supporting information can be downloaded from https://www.mdpi.com/article/10.3390/ijms23169032/s1.
Author Contributions
Conceptualization: Y.T. and H.N.; methodology: Y.T. and H.X.K.; software: H.X.K.; validation: H.X.K. and Y.T.; formal analysis: H.X.K. and Y.T.; investigation: H.X.K. and Y.T.; resources: Y.T. and H.X.K.; data curation: H.X.K. and Y.T.; writing—original draft preparation: H.X.K., Y.T. and H.N.; writing—review and editing: H.X.K., Y.T. and H.N.; visualization: H.X.K. and Y.T.; supervision: Y.T. and H.N.; project administration: Y.T.; funding acquisition: Y.T. All authors have read and agreed to the published version of the manuscript.
Funding
This work was funded by JSPS Grant-in-Aid for Scientific Research (C), 19K06589 and 22K06164, by MEXT Grant-in-Aid for Scientific Research on Transformative Research Areas (A) “Hyper-Ordered Structures Science”, 20H05883, by JSPS Grants-in-Aid for Exploratory Research (23657103). The APC was funded by a JSPS Grant-in-Aid for Scientific Research (C), 22K06164.
Institutional Review Board Statement
Not applicable.
Informed Consent Statement
Not applicable.
Data Availability Statement
Not applicable.
Acknowledgments
The computations were performed at the Research Center for Computational Science, Okazaki, Japan (22-IMS-C007) and the RIKEN Advanced Center for Computing and Communication (ACCC). This study was performed in part under the Cooperative Research Program of the Institute for Protein Research, Osaka University, CR-18-02, CR-19-02, CR-20-02, CR-21-02, and CR-22-02.
Conflicts of Interest
The authors declare no conflict of interest.
References
- Jeffrey, G.A. An Introduction to Hydrogen Bonding; Oxford University Press: Oxford, UK, 1997. [Google Scholar]
- Branden, C.I.; Tooze, J. Introduction to Protein Structure; Garland Science: New York, NY, USA, 1999. [Google Scholar]
- Petsko, G.A.; Ringe, D. Protein Structure and Function; New Sciene Press: London, UK, 2004. [Google Scholar]
- Liljas, A.; Liljas, L.; Piskur, J.; Lindblom, G.; Nissen, P. Textbook of Structural Biology; World Scientific Publishing: Singapore, 2009. [Google Scholar]
- Creighton, T.E. Proteins: Structures and Molecular Properties; W. H. Freeman and Company: New York, NY, USA, 1993. [Google Scholar]
- Barlow, D.J.; Thornton, J.M. Helix geometry in proteins. J. Mol. Biol. 1988, 201, 601–619. [Google Scholar] [CrossRef]
- Tantardini, C. When does a hydrogen bond become a van der Waals interaction? A topological answer. J. Comput. Chem. 2019, 40, 937–943. [Google Scholar] [CrossRef]
- Tantardini, C.; Michalchuk, A.A.L.; Samtsevich, A.; Rota, C.; Kvashnin, A.G. The Volumetric Source Function: Looking Inside van der Waals Interactions. Sci. Rep. 2020, 10, 7816. [Google Scholar] [CrossRef]
- Saleh, G.; Gatti, C.; Lo Presti, L.; Contreras-García, J. Revealing Non-covalent Interactions in Molecular Crystals through Their Experimental Electron Densities. Chem.-A Eur. J. 2012, 18, 15523–15536. [Google Scholar] [CrossRef]
- Best, R.B.; Buchete, N.-V.; Hummer, G. Are Current Molecular Dynamics Force Fields too Helical? Biophys. J. 2008, 95, L07–L09. [Google Scholar] [CrossRef]
- Best, R.B.; Hummer, G. Optimized Molecular Dynamics Force Fields Applied to the Helix−Coil Transition of Polypeptides. J. Phys. Chem. B 2009, 113, 9004–9015. [Google Scholar] [CrossRef]
- Piana, S.; Lindorff-Larsen, K.; Shaw, D.E. How Robust Are Protein Folding Simulations with Respect to Force Field Parameterization? Biophys. J. 2011, 100, L47–L49. [Google Scholar] [CrossRef]
- Yoda, T.; Sugita, Y.; Okamoto, Y. Comparisons of force fields for proteins by generalized-ensemble simulations. Chem. Phys. Lett. 2004, 386, 460–467. [Google Scholar] [CrossRef]
- Yoda, T.; Sugita, Y.; Okamoto, Y. Secondary-structure preferences of force fields for proteins evaluated by generalized-ensemble simulations. Chem. Phys. 2004, 307, 269–283. [Google Scholar] [CrossRef]
- Cornell, W.D.; Cieplak, P.; Bayly, C.I.; Gould, I.R.; Merz, K.M.; Ferguson, D.M.; Spellmeyer, D.C.; Fox, T.; Caldwell, J.W.; Kollman, P.A. A Second Generation Force Field for the Simulation of Proteins, Nucleic Acids, and Organic Molecules. J. Am. Chem. Soc. 1995, 117, 5179–5197. [Google Scholar] [CrossRef]
- Wang, J.; Cieplak, P.; Kollman, P.A. How well does a restrained electrostatic potential (RESP) model perform in calculating conformational energies of organic and biological molecules? J. Comput. Chem. 2000, 21, 1049–1074. [Google Scholar] [CrossRef]
- Higo, J.; Nishimura, Y.; Nakamura, H. A Free-Energy Landscape for Coupled Folding and Binding of an Intrinsically Disordered Protein in Explicit Solvent from Detailed All-Atom Computations. J. Am. Chem. Soc. 2011, 133, 10448–10458. [Google Scholar] [CrossRef]
- Chebaro, Y.; Ballard, A.J.; Chakraborty, D.; Wales, D.J. Intrinsically Disordered Energy Landscapes. Sci. Rep. 2015, 5, 10386. [Google Scholar] [CrossRef]
- Shirai, H.; Ikeda, K.; Yamashita, K.; Tsuchiya, Y.; Sarmiento, J.; Liang, S.; Morokata, T.; Mizuguchi, K.; Higo, J.; Standley, D.M.; et al. High-resolution modeling of antibody structures by a combination of bioinformatics, expert knowledge, and molecular simulations. Proteins Struct. Funct. Bioinform. 2014, 82, 1624–1635. [Google Scholar] [CrossRef]
- Nishigami, H.; Kamiya, N.; Nakamura, H. Revisiting antibody modeling assessment for CDR-H3 loop. Protein Eng. Des. Sel. 2016, 29, 477–484. [Google Scholar] [CrossRef]
- Buck, M.; Bouguet-Bonnet, S.; Pastor, R.W.; MacKerell, A.D. Importance of the CMAP Correction to the CHARMM22 Protein Force Field: Dynamics of Hen Lysozyme. Biophys. J. 2006, 90, L36–L38. [Google Scholar] [CrossRef]
- Kamiya, N.; Watanabe, Y.S.; Ono, S.; Higo, J. AMBER-based hybrid force field for conformational sampling of polypeptides. Chem. Phys. Lett. 2005, 401, 312–317. [Google Scholar] [CrossRef]
- Fujitani, H.; Matsuura, A.; Sakai, S.; Sato, H.; Tanida, Y. High-Level ab Initio Calculations To Improve Protein Backbone Dihedral Parameters. J. Chem. Theory Comput. 2009, 5, 1155–1165. [Google Scholar] [CrossRef]
- Robustelli, P.; Piana, S.; Shaw, D.E. Developing a molecular dynamics force field for both folded and disordered protein states. Proc. Natl. Acad. Sci. USA 2018, 115, E4758–E4766. [Google Scholar] [CrossRef] [PubMed]
- Patel, S.; Brooks, C.L. CHARMM fluctuating charge force field for proteins: I parameterization and application to bulk organic liquid simulations. J. Comput. Chem. 2004, 25, 1–16. [Google Scholar] [CrossRef] [PubMed]
- Lopes, P.E.M.; Roux, B.; MacKerell, A.D. Molecular modeling and dynamics studies with explicit inclusion of electronic polarizability: Theory and applications. Theor. Chem. Acc. 2009, 124, 11–28. [Google Scholar] [CrossRef]
- Wieczorek, R.; Dannenberg, J.J. H-Bonding Cooperativity and Energetics of α-Helix Formation of Five 17-Amino Acid Peptides. J. Am. Chem. Soc. 2003, 125, 8124–8129. [Google Scholar] [CrossRef] [PubMed]
- Wieczorek, R.; Dannenberg, J.J. Hydrogen-Bond Cooperativity, Vibrational Coupling, and Dependence of Helix Stability on Changes in Amino Acid Sequence in Small 3 10-Helical Peptides. A Density Functional Theory Study. J. Am. Chem. Soc. 2003, 125, 14065–14071. [Google Scholar] [CrossRef] [PubMed]
- Morozov, A.V.; Tsemekhman, K.; Baker, D. Electron Density Redistribution Accounts for Half the Cooperativity of α Helix Formation. J. Phys. Chem. B 2006, 110, 4503–4505. [Google Scholar] [CrossRef]
- Wu, Y.-D.; Zhao, Y.-L. A Theoretical Study on the Origin of Cooperativity in the Formation of 3 10-and α-Helices. J. Am. Chem. Soc. 2001, 123, 5313–5319. [Google Scholar] [CrossRef]
- Parthasarathi, R.; Raman, S.S.; Subramanian, V.; Ramasami, T. Bader’s Electron Density Analysis of Hydrogen Bonding in Secondary Structural Elements of Protein. J. Phys. Chem. A 2007, 111, 7141–7148. [Google Scholar] [CrossRef]
- Ismer, L.; Ireta, J.; Neugebauer, J. First-Principles Free-Energy Analysis of Helix Stability: The Origin of the Low Entropy in π Helices. J. Phys. Chem. B 2008, 112, 4109–4112. [Google Scholar] [CrossRef] [PubMed]
- Takano, Y.; Kusaka, A.; Nakamura, H. Density functional study of molecular interactions in secondary structures of proteins. Biophys. Phys. 2016, 13, 27–35. [Google Scholar] [CrossRef]
- Deshmukh, M.M.; Gadre, S.R. Estimation of N−H···O=C Intramolecular Hydrogen Bond Energy in Polypeptides. J. Phys. Chem. A 2009, 113, 7927–7932. [Google Scholar] [CrossRef]
- Kondo, H.X.; Kusaka, A.; Kitakawa, C.K.; Onari, J.; Yamanaka, S.; Nakamura, H.; Takano, Y. Hydrogen bond donors and acceptors are generally depolarized in α-helices as revealed by a molecular tailoring approach. J. Comput. Chem. 2019, 40, 2043–2052. [Google Scholar] [CrossRef]
- Hirshfeld, F.L. Bonded-atom fragments for describing molecular charge densities. Theor. Chim. Acta 1977, 44, 129–138. [Google Scholar] [CrossRef]
- Ritchie, J.P. Electron density distribution analysis for nitromethane, nitromethide, and nitramide. J. Am. Chem. Soc. 1985, 107, 1829–1837. [Google Scholar] [CrossRef]
- Ritchie, J.P.; Bachrach, S.M. Some methods and applications of electron density distribution analysis. J. Comput. Chem. 1987, 8, 499–509. [Google Scholar] [CrossRef]
- Cieplak, P.; Cornell, W.D.; Bayly, C.; Kollman, P.A. Application of the multimolecule and multiconformational RESP methodology to biopolymers: Charge derivation for DNA, RNA, and proteins. J. Comput. Chem. 1995, 16, 1357–1377. [Google Scholar] [CrossRef]
- Frisch, M.J.; Trucks, G.W.; Schlegel, H.B.; Scuseria, G.E.; Robb, M.A.; Cheeseman, J.R.; Scalmani, G.; Barone, V.; Mennucci, B.; Petersson, G.A.; et al. Gaussian 09, Revision C.01; Gaussian Inc.: Wallingford, CT, USA, 2009. [Google Scholar] [CrossRef]
- Pettersen, E.F.; Goddard, T.D.; Huang, C.C.; Couch, G.S.; Greenblatt, D.M.; Meng, E.C.; Ferrin, T.E. UCSF Chimera? A visualization system for exploratory research and analysis. J. Comput. Chem. 2004, 25, 1605–1612. [Google Scholar] [CrossRef]
- Humphrey, W.; Dalke, A.; Schulten, K. VMD: Visual molecular dynamics. J. Mol. Graph. 1996, 14, 33–38. [Google Scholar] [CrossRef]
Figure 1.
(a) Histograms of the H-bond distances in the WH3-10 and WHa models. Plots of the H-bond distances in the (b) WH3-10 and (c) WHa models of each length. The H-bond distances of Ace-(Ala)n-Nme, which forms one-to-six H-bonds, are shown in maroon, red, black, blue, green, and violet–red, respectively. The stars and circles indicate the H-bond pairs adjacent to the terminal pair and the other pairs, respectively.

Figure 2.
H-bond torsion angles of the (a) WH3-10 and (b) WHa models. H-bond torsion angles of Ace-(Ala)n-Nme, which forms one-to-six H-bonds, are shown in maroon, red, black, blue, green, and violet–red, respectively. The torsion angles of the H-bond adjacent to the terminal H-bond pair and the other pairs are indicated by stars and circles, respectively.

Figure 3.
Correlations of the H-bond energies of the (a) WH (black) and ST (red) models versus those of the MH model in the 310-helices and (b) those in the α-helices [35]. The dashed line shows a guide where the longitudinal axis values have identical H-bond energies. The cross and star marks represent the H-bond pairs of the terminal and those adjacent to the terminal, respectively. The solid lines show regression lines for the H-bond energies of the WH (black) and ST (red) models versus those of the MH model.

Figure 4.
H-bond energies of the extended ST, WH3-10, and ST3-10 models versus those of the MH model. The cross and star marks of WH3-10 represent the H-bond pair of the terminal and that adjacent to the terminal, respectively. The solid lines show regression lines for the H-bond energies of the extended ST, WH3-10, and ST3-10 models versus those of the MH model.

Figure 5.
Electron density changes upon H-bond formation,, for (a) 4-1, (b) 4-2, and (c) 4-3 in WH3-10-4. The yellow surfaces represent the contour surfaces at −0.001 au, and the magenta ones are those at 0.001 au. The atoms in the whole WH3-10 model are shown by green wire and those in the MH3-10 models are shown using the stick model with CPK colors. The difference in the change in electron density between the ST3-10 and MH3-10 models, , for (d) 4-1, (e) 4-2, and (f) 4-3 in WH3-10-4. The difference in the change in electron density between the WH3-10 and ST3-10 models, , for (g) 4-1, (h) 4-2, and (i) 4-3 in WH3-10-4. The dark-green surfaces represent the contour surfaces at –0.00015 au, and the orange ones are those at 0.00015 au.

Figure 6.
Mean H-bond energies plotted against (a) increments of the minimum length of the helix and (b) inverse of the square of the helix length in each helical model: n = 2 and 3 for the WH3-10 and WHAH models, respectively.
Figure 6.
Mean H-bond energies plotted against (a) increments of the minimum length of the helix and (b) inverse of the square of the helix length in each helical model: n = 2 and 3 for the WH3-10 and WHAH models, respectively.

Figure 7.
Schematic of the interactions between the H-bond acceptor and neighboring groups. The atoms of the model peptides (ST3-10, STEN, and STE2N models of 7-3 in WH3-10 as an example) are shown using the stick model. Hydrogen atoms, except for those in the N–H group, are not shown. The numbers in the figure represent the residue number. Black and white arrows indicate depolarization and polarization effect of the N–H group in the red dotted box on the C=O group in the H-bond, respectively.

Figure 8.
Correlations between the H-bond energies of the (a) WH models and the (b) MH models, calculated by the QM and MM methods for the 310-helices (purple) and α-helices (violet). The dashed line shows a guide where the H-bond energies of the longitudinal axis values and the MM calculations are identical. The cross and star marks represent the H-bond pair of the terminal and that adjacent to the terminal, respectively. The solid line shows a regression line for each model.

Figure 9.
(a) Structure of the 310-helix composed of Ace-(Ala)4-Nme (WH3-10-4) with the notation of each H-bond in the structure. (b) Structures of the whole-helical (WH3-10), single-turn (ST3-10), and minimal H-bond (MH3-10) models of WH3-10-4, as examples. Carbon, oxygen, nitrogen, and hydrogen atoms are colored in cyan, red, blue, and white, respectively.


Table 1.
Mean values and standard deviations of the H-bond distances, rOH, of the WH3-10 and WHa models.
Table 1.
Mean values and standard deviations of the H-bond distances, rOH, of the WH3-10 and WHa models.
| WH3-10 † | WHa | |
|---|---|---|
| Terminal | 2.02 ± 0.02 | 2.35 ± 0.04 |
| Pairs adjacent to the terminal ‡ | 2.08 ± 0.03 | 2.26 ± 0.07 |
| Others (inner) | 2.03 ± 0.01 | 2.26 ± 0.03 |
| All | 2.05 ± 0.04 | 2.30 ± 0.07 |
† H-bond distance is shown in angstroms. ‡ The N-terminal H-bond pair in WH3-10-3, 3-1, is adjacent to the C-terminal pair, 3-2, and vice versa, and so they are included here.
Table 2.
Dipole moments of C=O and N–H groups of the backbone H-bond acceptor and donor in in the WH3-10-4, ST3-10-4, and MH3-10-4 models (Debye).
Table 2.
Dipole moments of C=O and N–H groups of the backbone H-bond acceptor and donor in in the WH3-10-4, ST3-10-4, and MH3-10-4 models (Debye).
| (A) WH3-10, ST3-10 and MH3-10 models where H-Bond pairs exist | |||||
| 4-1 | 4-2 | 4-3 | Average | ||
| † | WH3-10 model | 1.3523 | 1.3268 | 1.3509 | 1.3433 |
| ST3-10 model | 1.3641 | 1.3877 | 1.3805 | 1.3774 | |
| MH3-10 model | 1.3938 | 1.4236 | 1.4139 | 1.4104 | |
| Ratio (ST3-10/MH3-10) | 0.9787 | 0.9748 | 0.9764 | 0.9766 | |
| Ratio (WH3-10/MH3-10) | 0.9703 | 0.9321 | 0.9554 | 0.9525 | |
| ‡ | WH3-10 model | 0.5232 | 0.5386 | 0.5328 | 0.5315 |
| ST3-10 model | 0.5211 | 0.5283 | 0.5293 | 0.5263 | |
| MH3-10 model | 0.5371 | 0.5459 | 0.5476 | 0.5436 | |
| Ratio (ST3-10/MH3-10) | 0.9702 | 0.9678 | 0.9666 | 0.9682 | |
| Ratio (WH3-10/MH3-10) | 0.9741 | 0.9866 | 0.9730 | 0.9779 | |
| (B) WH3-10, ST3-10 and MH3-10 models in the absence of donor or acceptor | |||||
| † in the absence of donor (-N–H) | WH3-10 model | 1.3847 | 1.3471 | 1.3883 | 1.3734 |
| ST3-10 model | 1.4026 | 1.4150 | 1.4202 | 1.4126 | |
| MH3-10 model | 1.4411 | 1.4594 | 1.4625 | 1.4543 | |
| Ratio (ST3-10/MH3-10) | 0.9733 | 0.9696 | 0.9711 | 0.9713 | |
| Ratio (WH3-10/MH3-10) | 0.9609 | 0.9231 | 0.9493 | 0.9443 | |
| ‡ in the absence of acceptor (-C=O) | WH3-10 model | 0.5825 | 0.5873 | 0.6011 | 0.5903 |
| ST3-10 model | 0.5865 | 0.5890 | 0.6003 | 0.5919 | |
| MH3-10 model | 0.6194 | 0.6205 | 0.6328 | 0.6242 | |
| Ratio (ST3-10/MH3-10) | 0.9469 | 0.9493 | 0.9487 | 0.9483 | |
| Ratio (WH3-10/MH3-10) | 0.9405 | 0.9465 | 0.9500 | 0.9457 | |
† L2 norm of dipole moment of the C=O group of i-th residue (Debye). ‡ L2 norm of dipole moment of the N–H group of (i + 3)-th residue (Debye).
Publisher’s Note: MDPI stays neutral with regard to jurisdictional claims in published maps and institutional affiliations. |
© 2022 by the authors. Licensee MDPI, Basel, Switzerland. This article is an open access article distributed under the terms and conditions of the Creative Commons Attribution (CC BY) license (https://creativecommons.org/licenses/by/4.0/).
Share and Cite
MDPI and ACS Style
Kondo, H.X.; Nakamura, H.; Takano, Y. Depolarizing Effects in Hydrogen Bond Energy in 310-Helices Revealed by Quantum Chemical Analysis. Int. J. Mol. Sci. 2022, 23, 9032. https://doi.org/10.3390/ijms23169032
AMA Style
Kondo HX, Nakamura H, Takano Y. Depolarizing Effects in Hydrogen Bond Energy in 310-Helices Revealed by Quantum Chemical Analysis. International Journal of Molecular Sciences. 2022; 23(16):9032. https://doi.org/10.3390/ijms23169032
Chicago/Turabian StyleKondo, Hiroko X., Haruki Nakamura, and Yu Takano. 2022. "Depolarizing Effects in Hydrogen Bond Energy in 310-Helices Revealed by Quantum Chemical Analysis" International Journal of Molecular Sciences 23, no. 16: 9032. https://doi.org/10.3390/ijms23169032
Note that from the first issue of 2016, this journal uses article numbers instead of page numbers. See further details here.