
Fecal Microbiota Transplant in a Pre-Clinical Model of Type 2 Diabetes Mellitus, Obesity and Diabetic Kidney Disease

 , and
, and 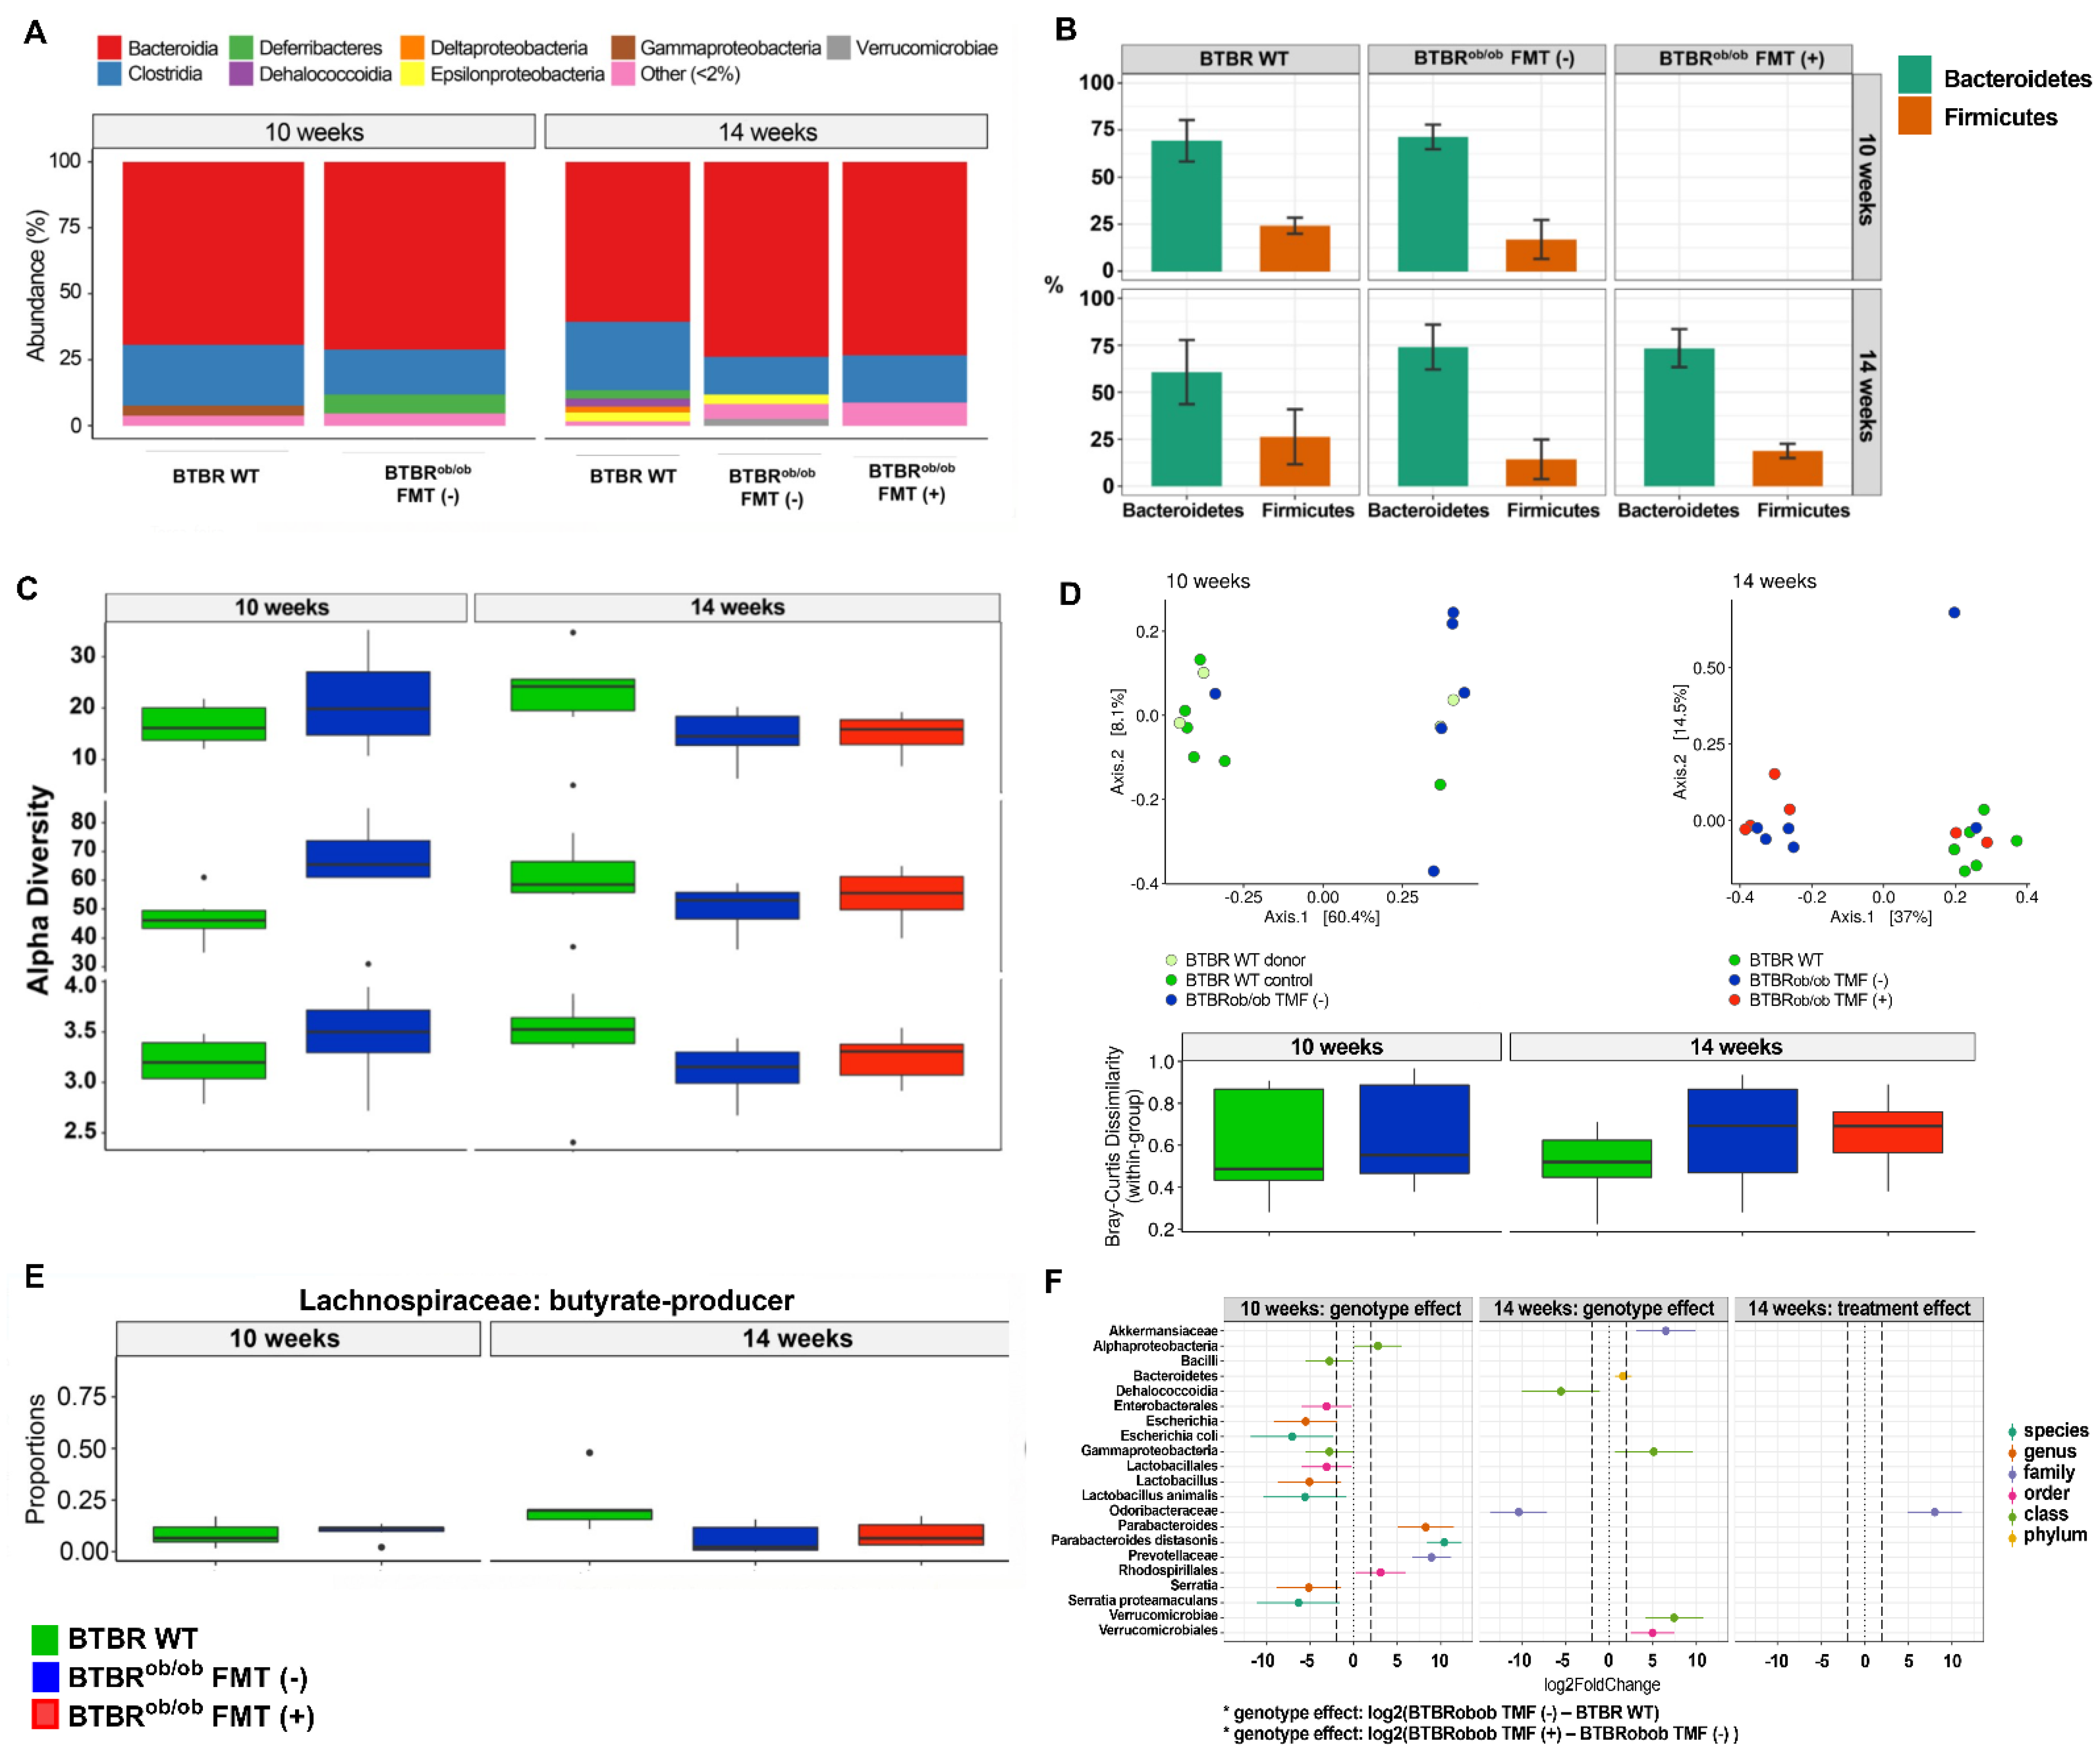
Abstract
:1. Introduction
2. Results
2.1. 16S rRNA Sequencing Analysis
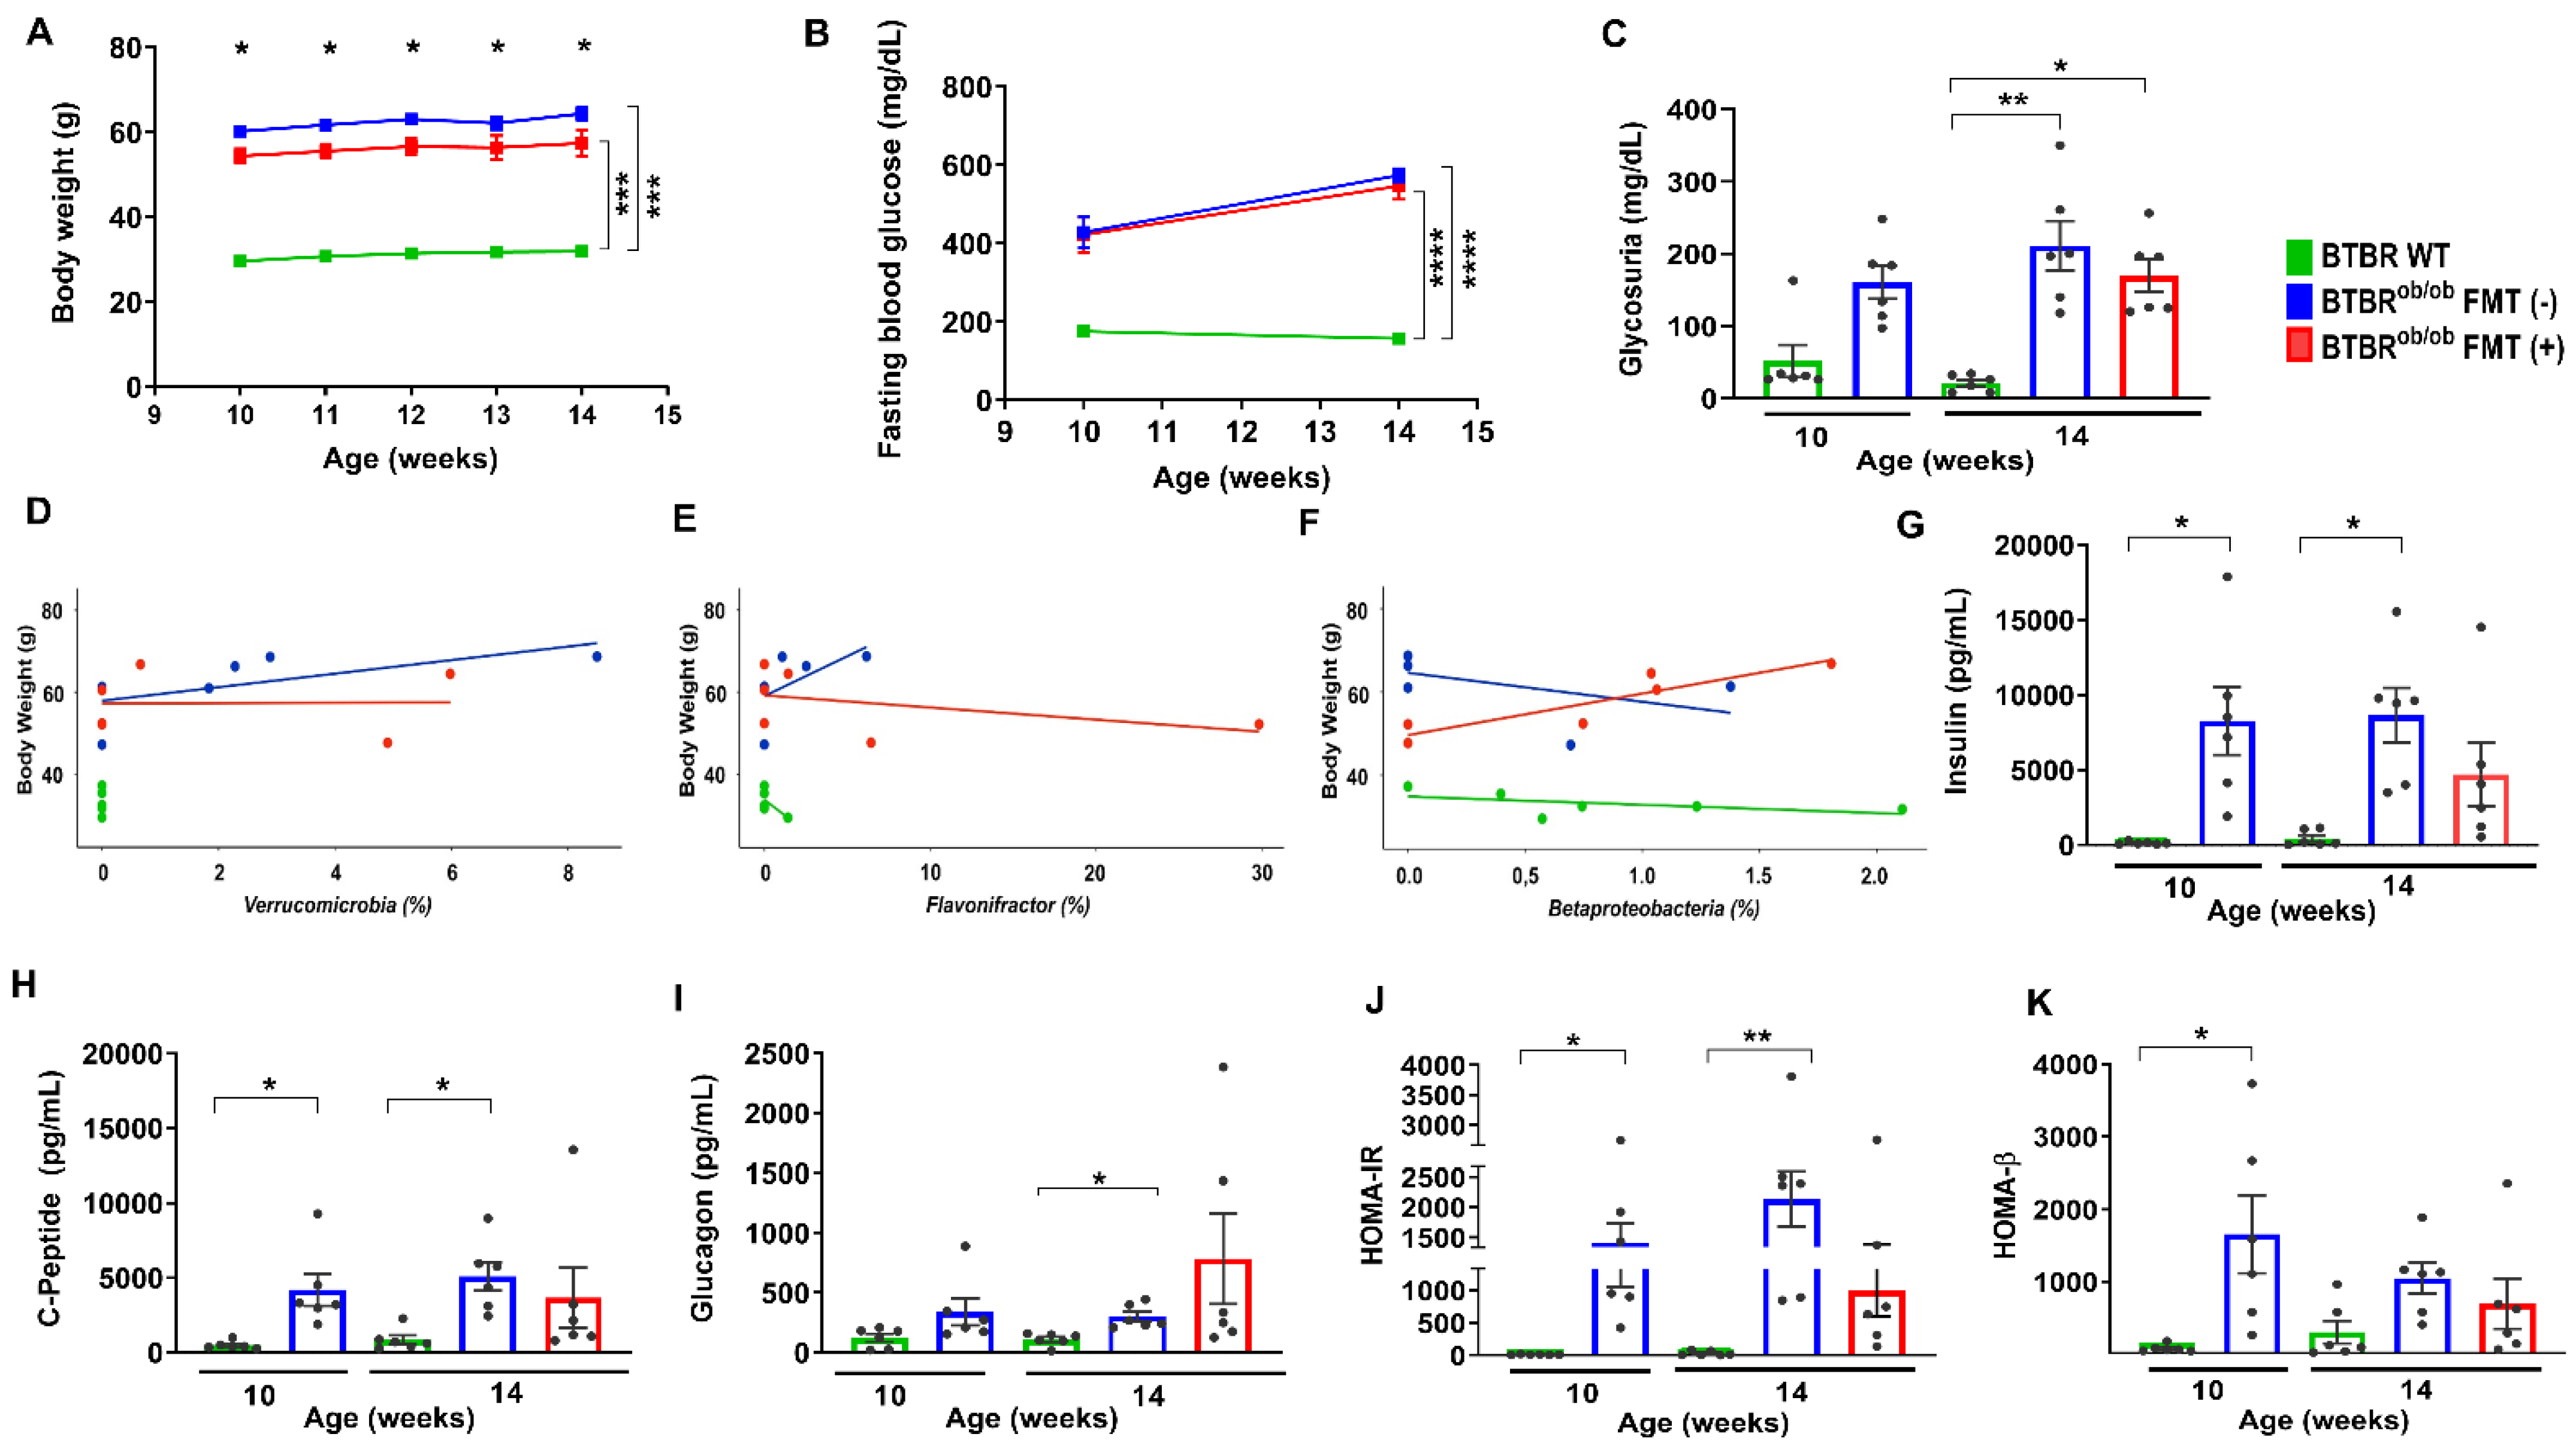
2.2. Functional and Metabolic Parameters in BTBR WT, BTBRob/ob FMT (-), and BTBRob/ob FMT (+) Mice
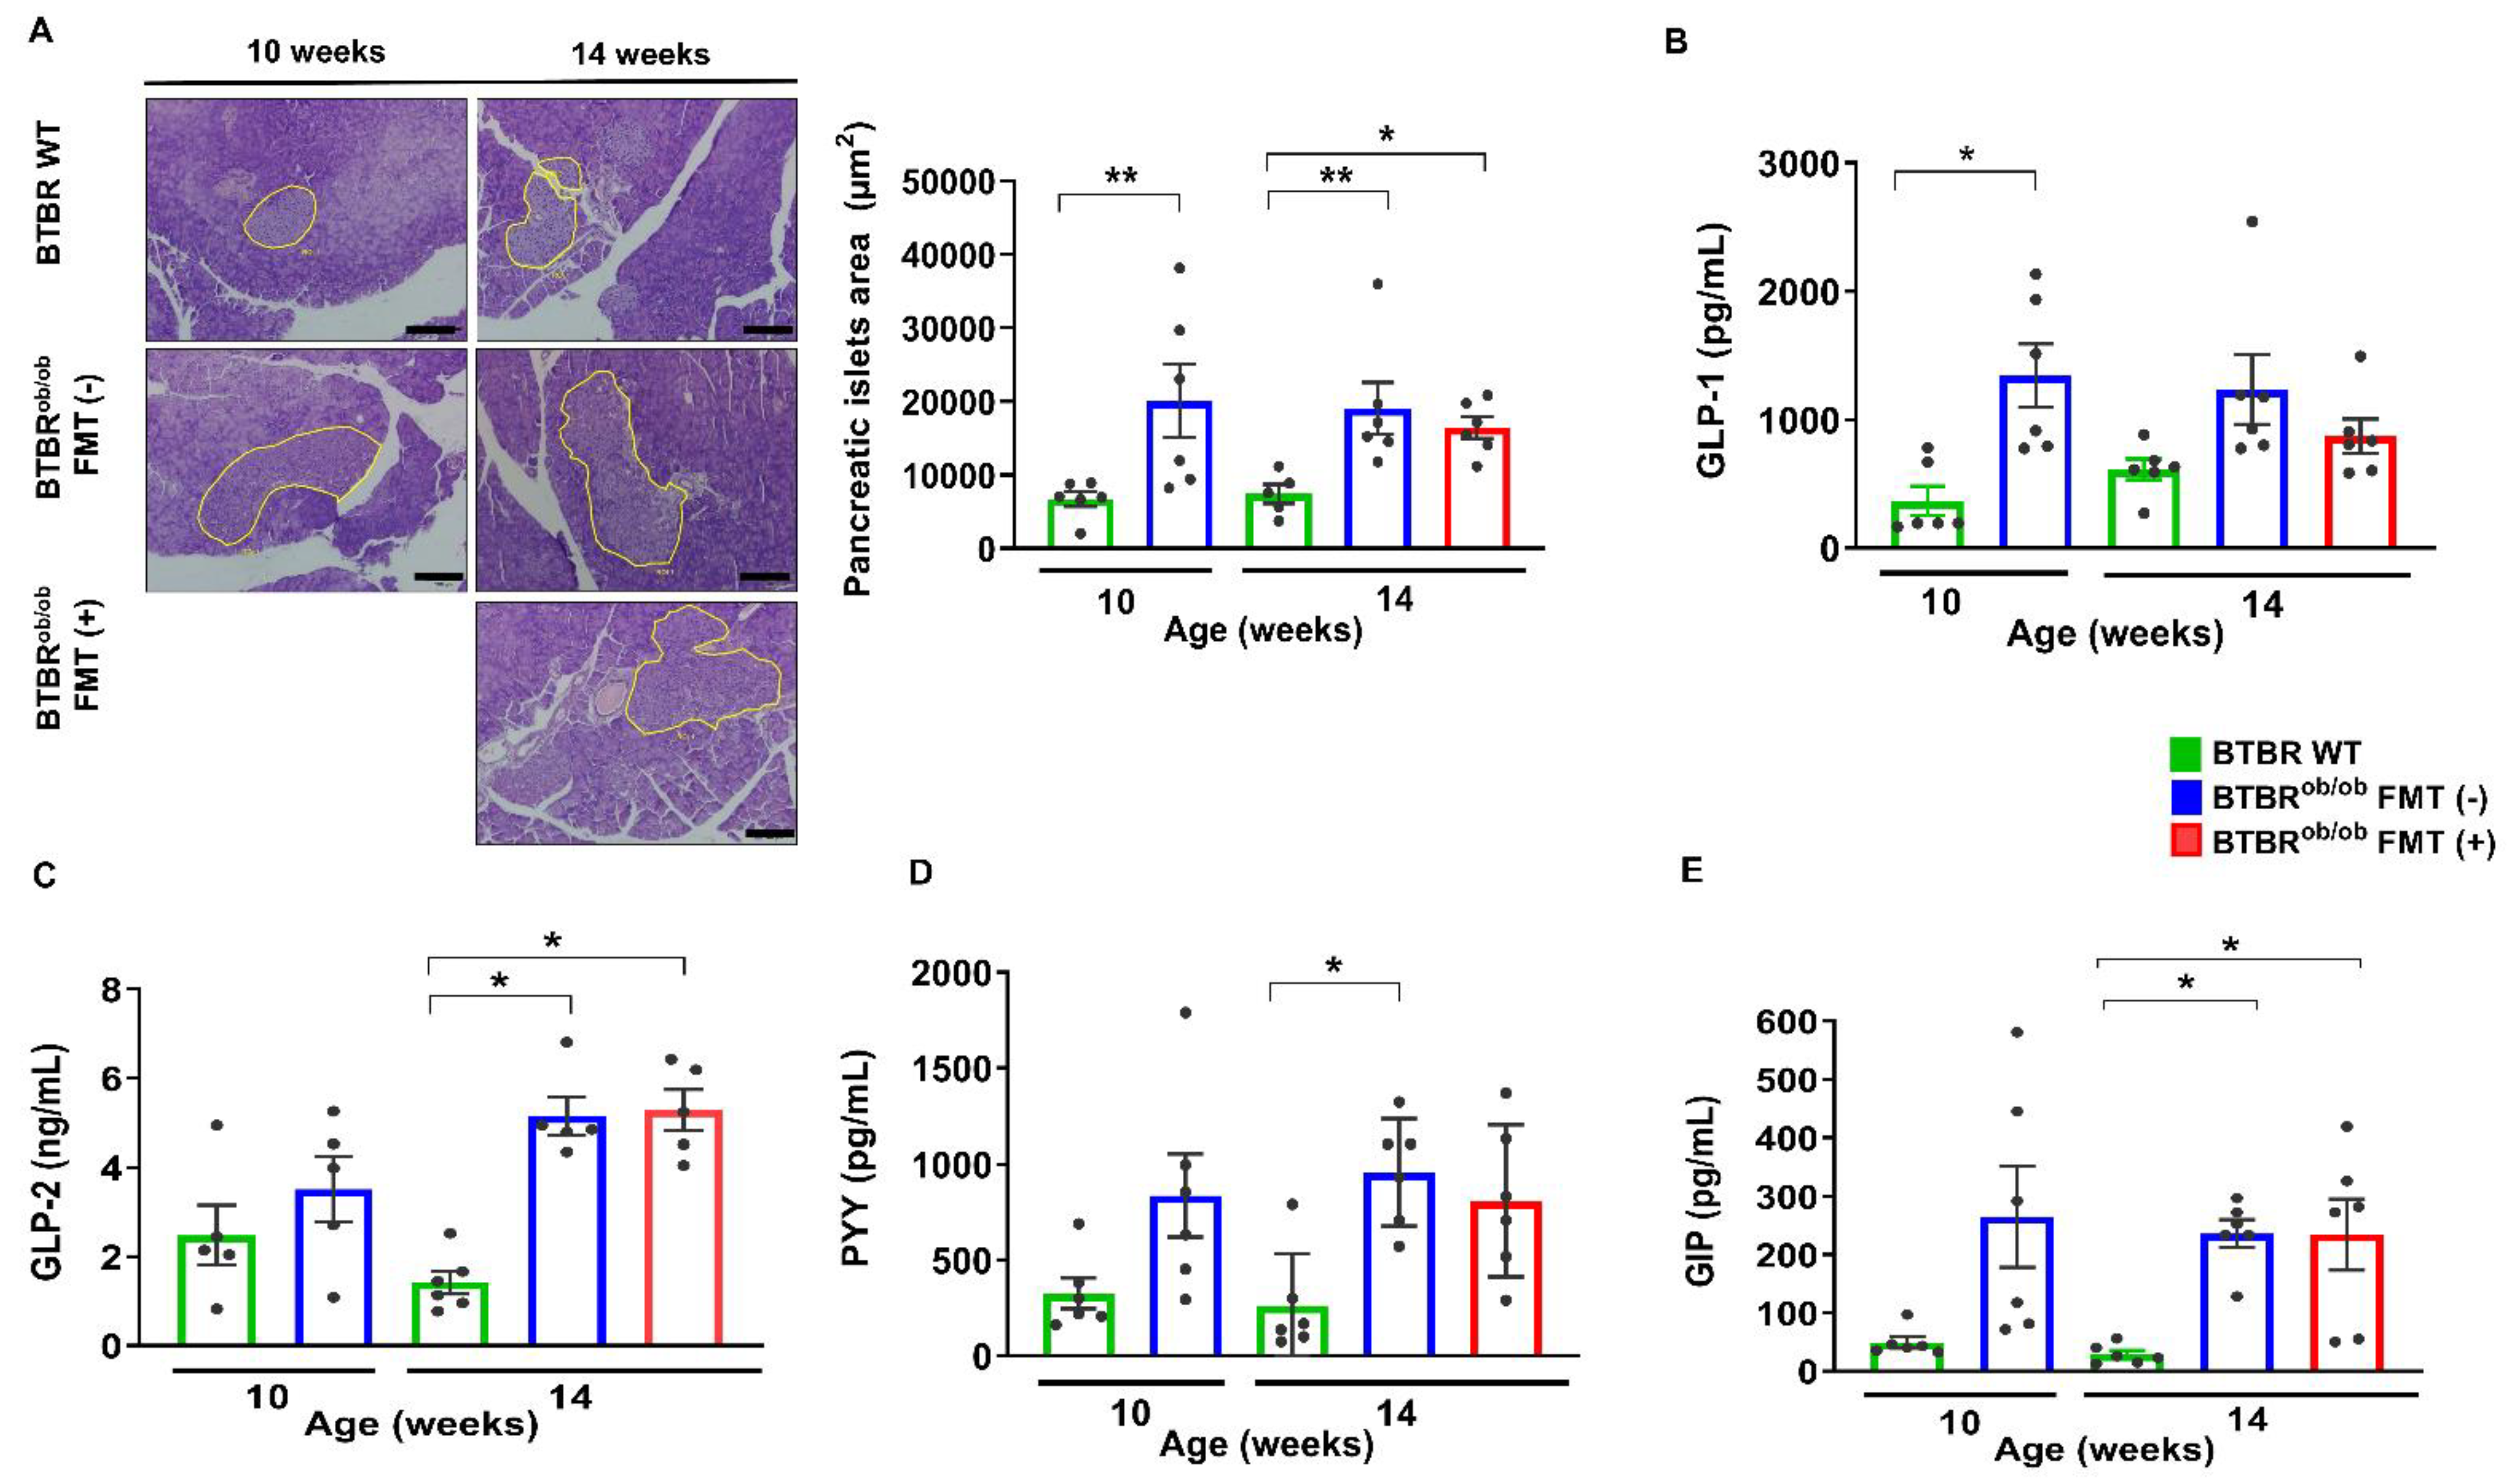
2.3. Pancreas Histological and Metabolic Parameters and Plasma Enteroendocrine Hormones Evaluation
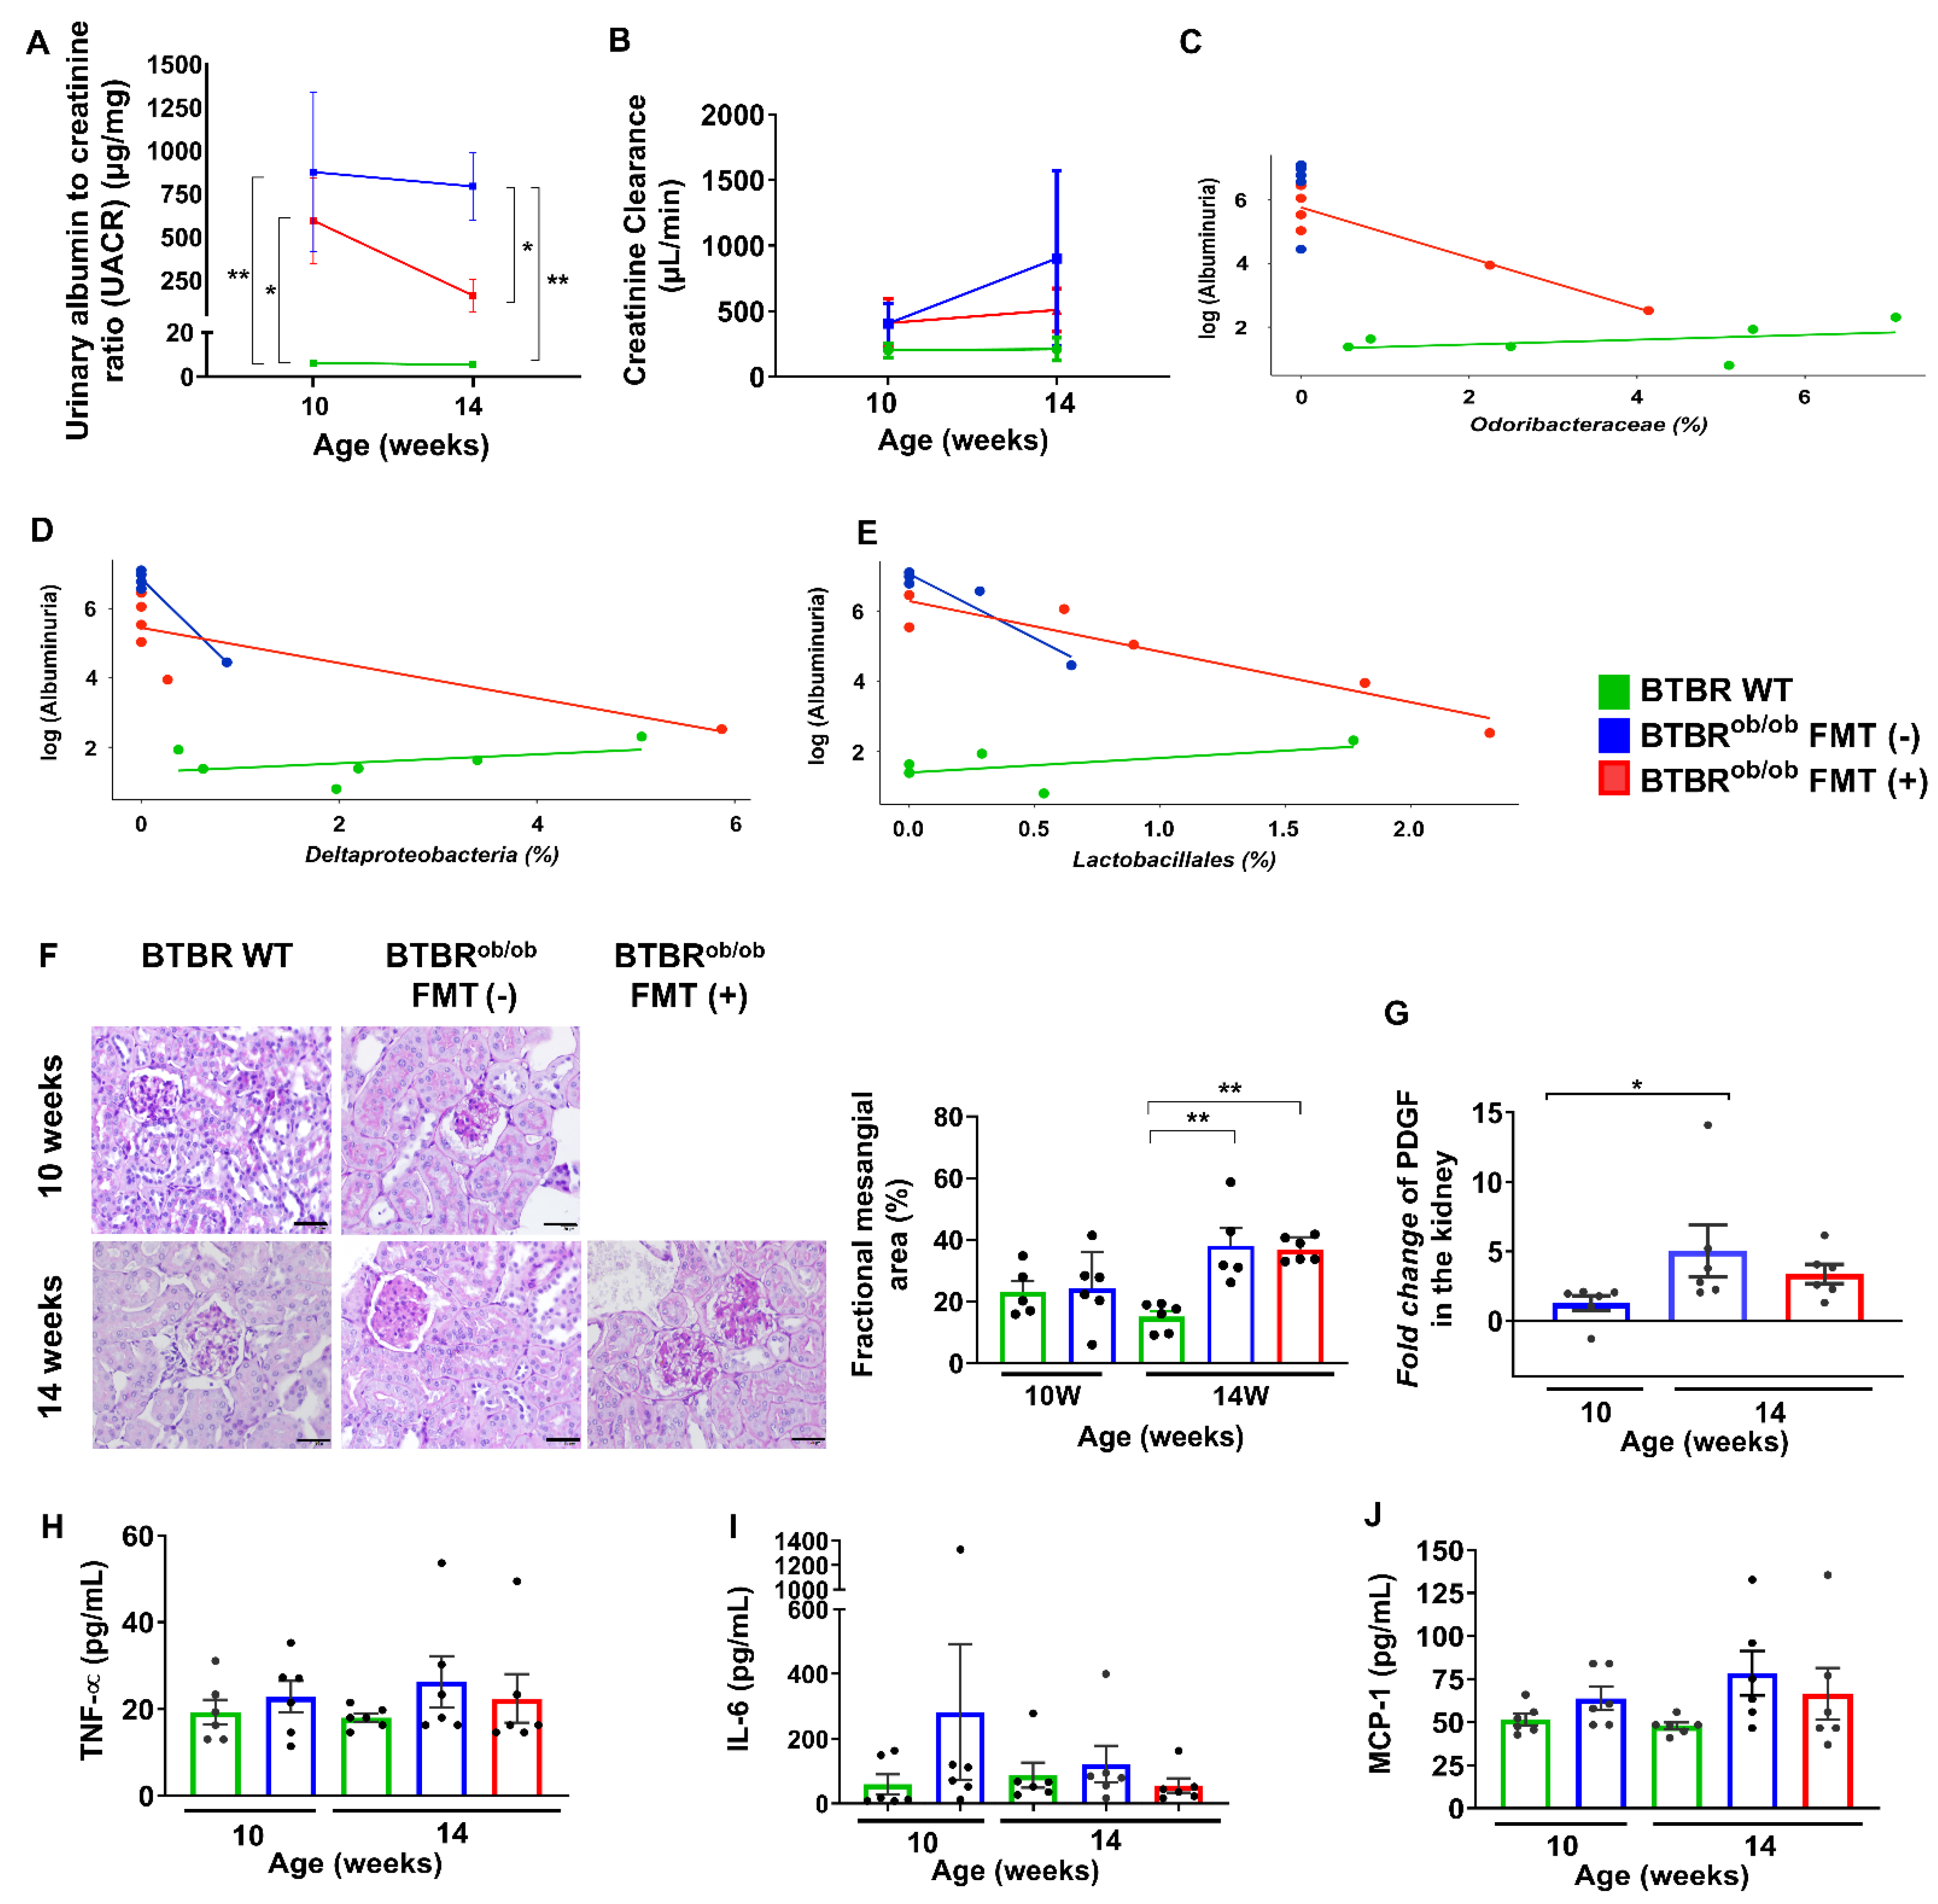
2.4. Renal Functional and Histological Parameters and Systemic Inflammation
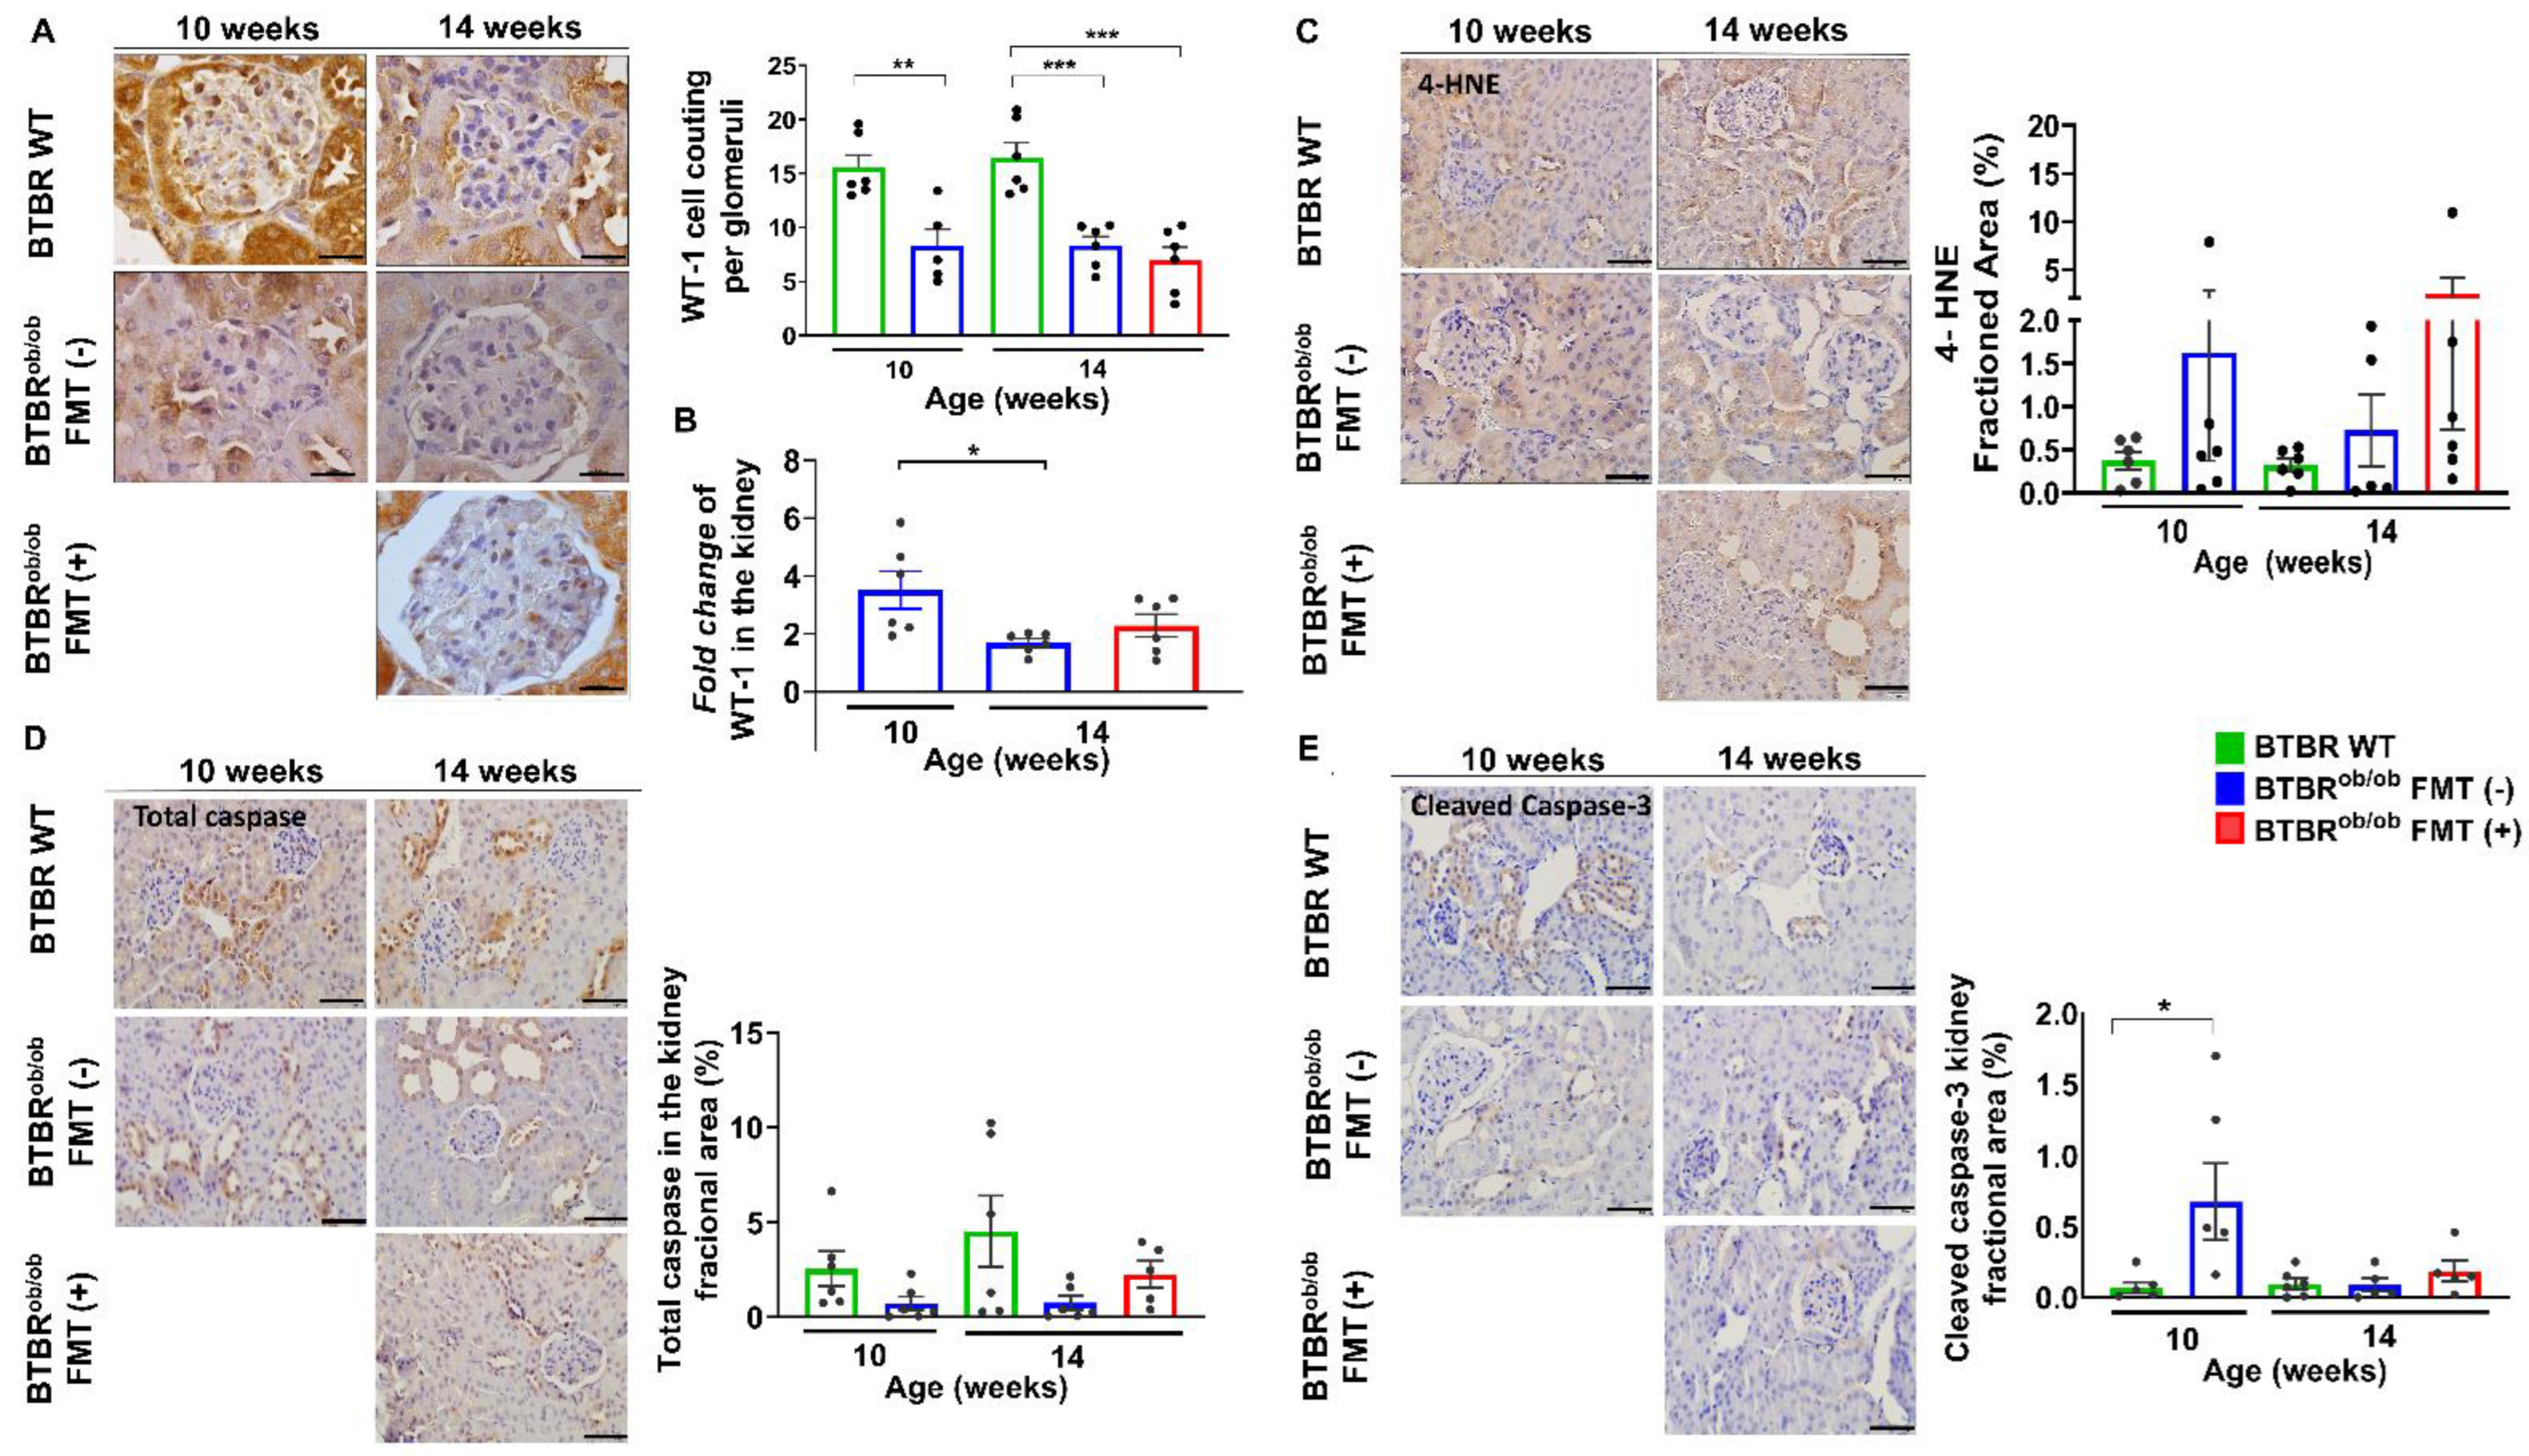
2.5. Evaluation of the Number of Podocytes, Cell Death, and Renal Oxidative Stress in Renal Tissue
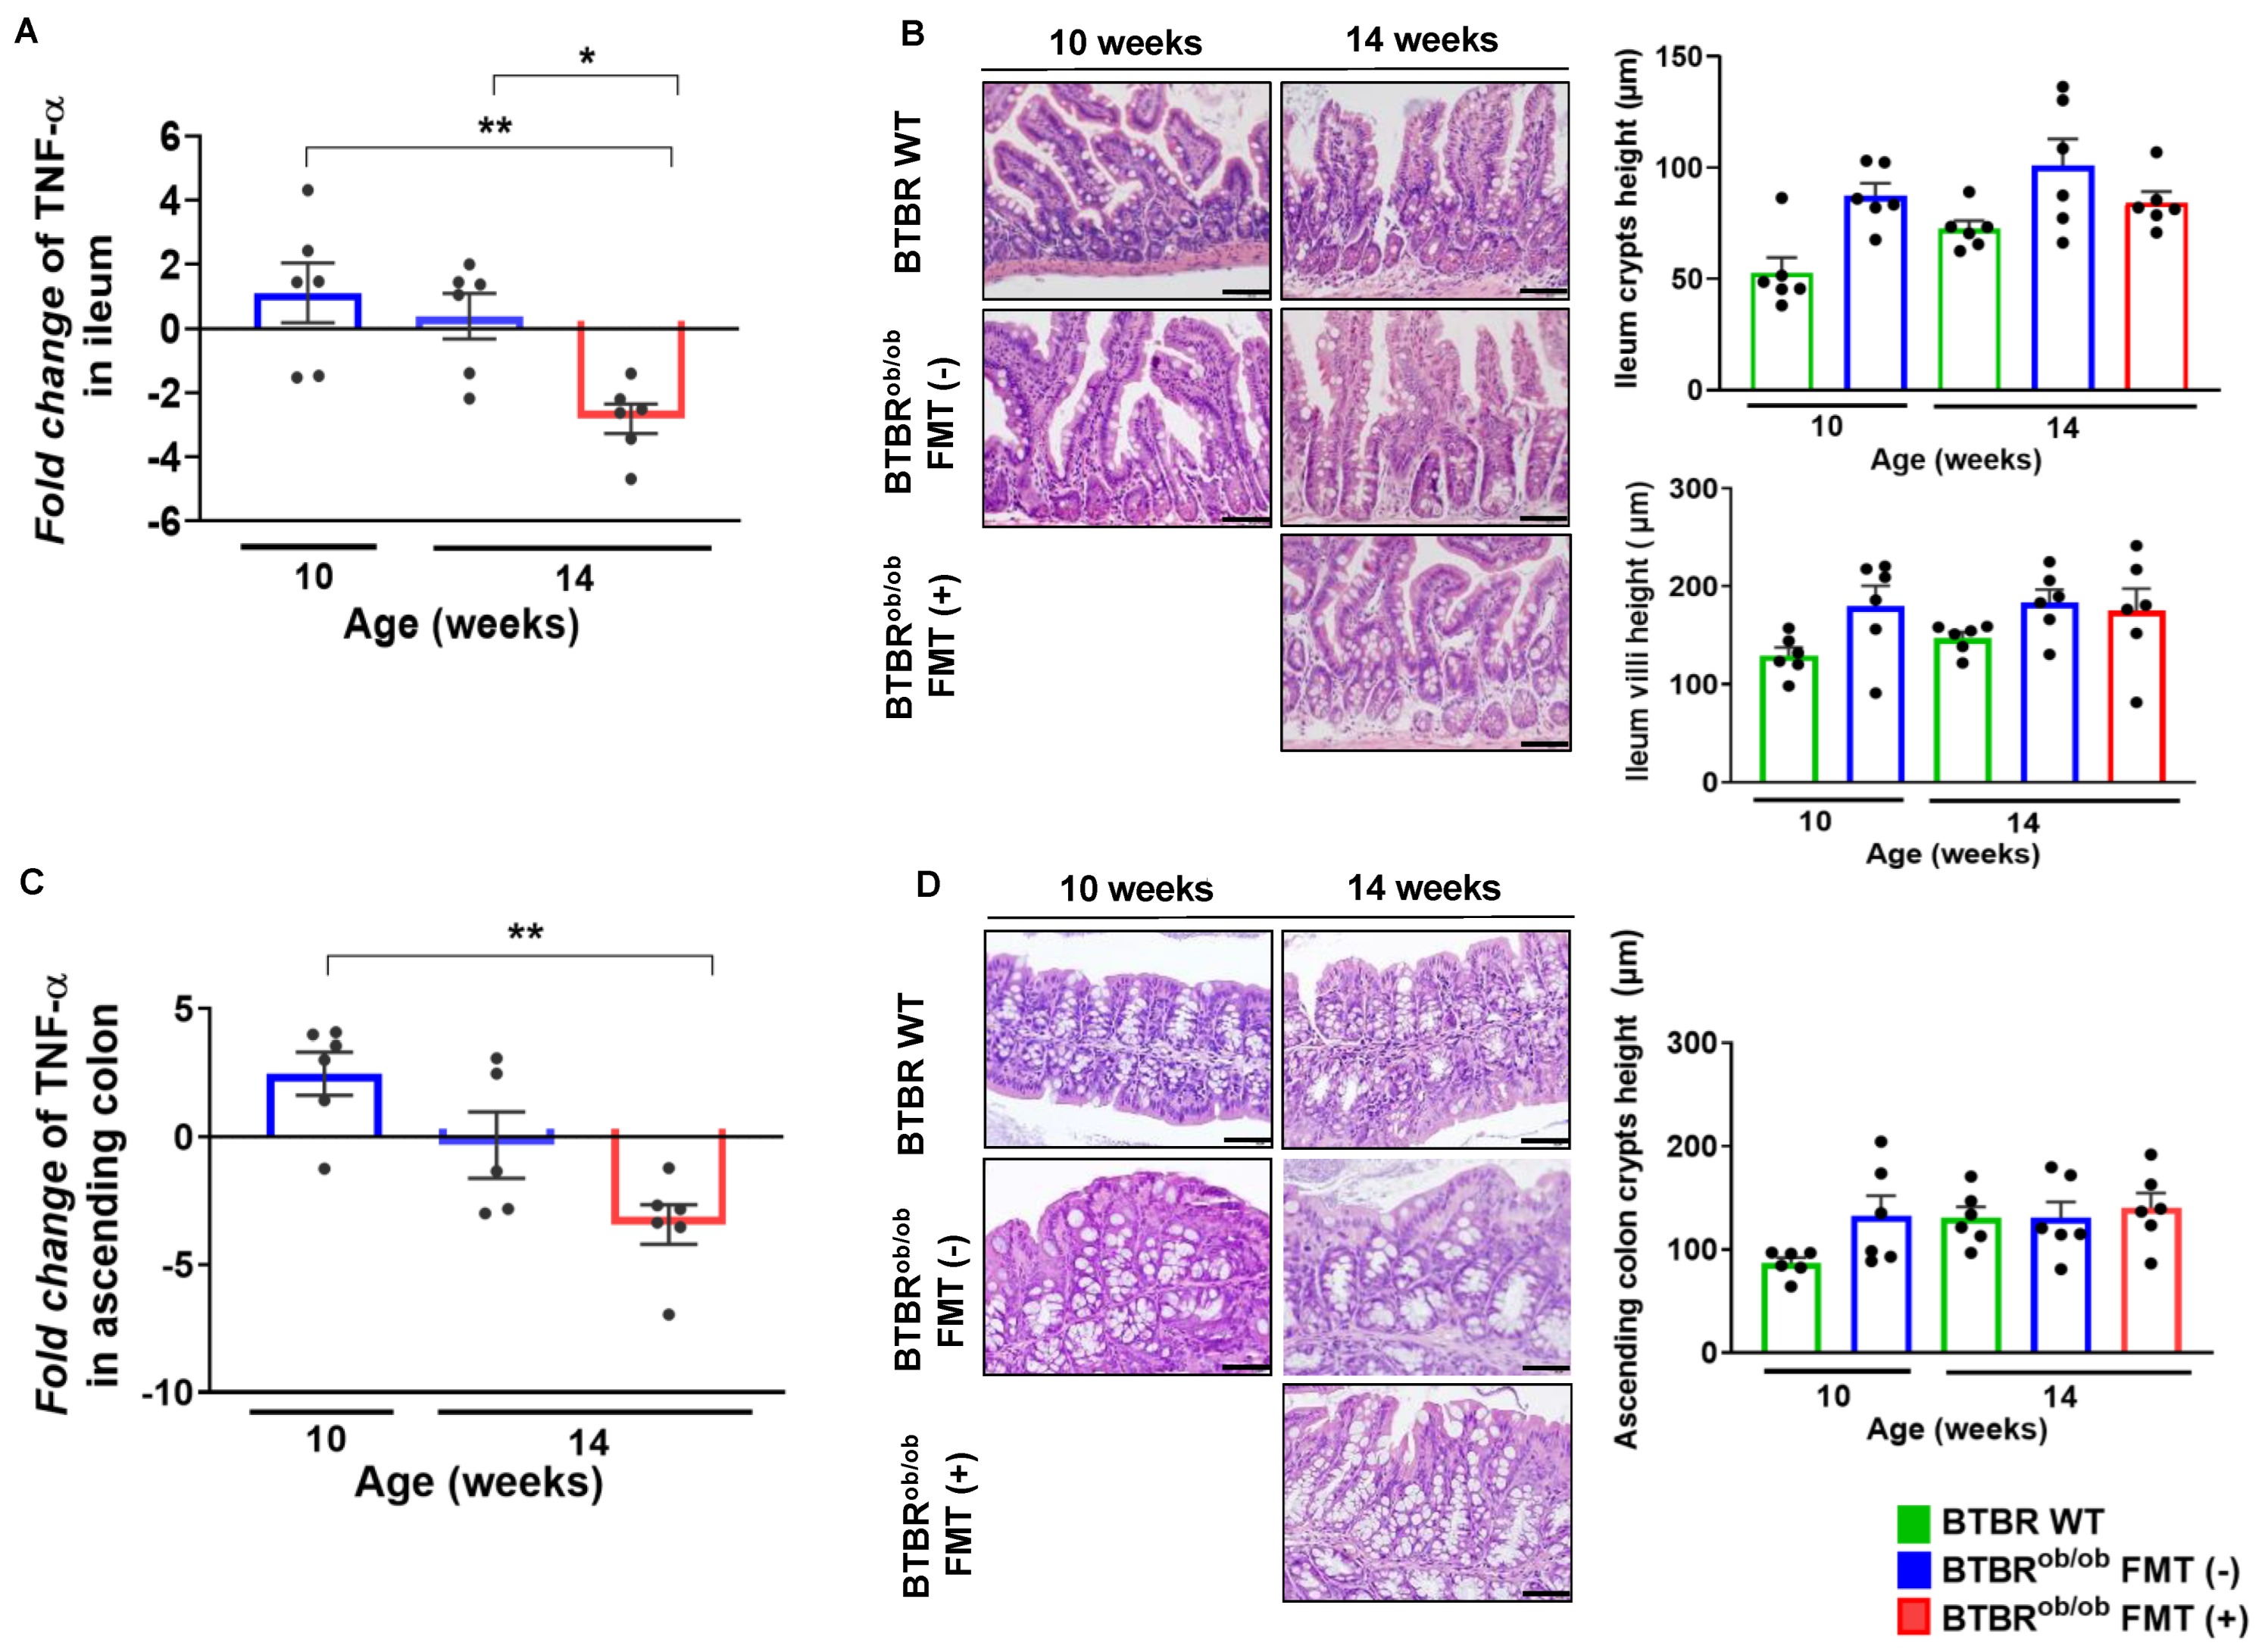
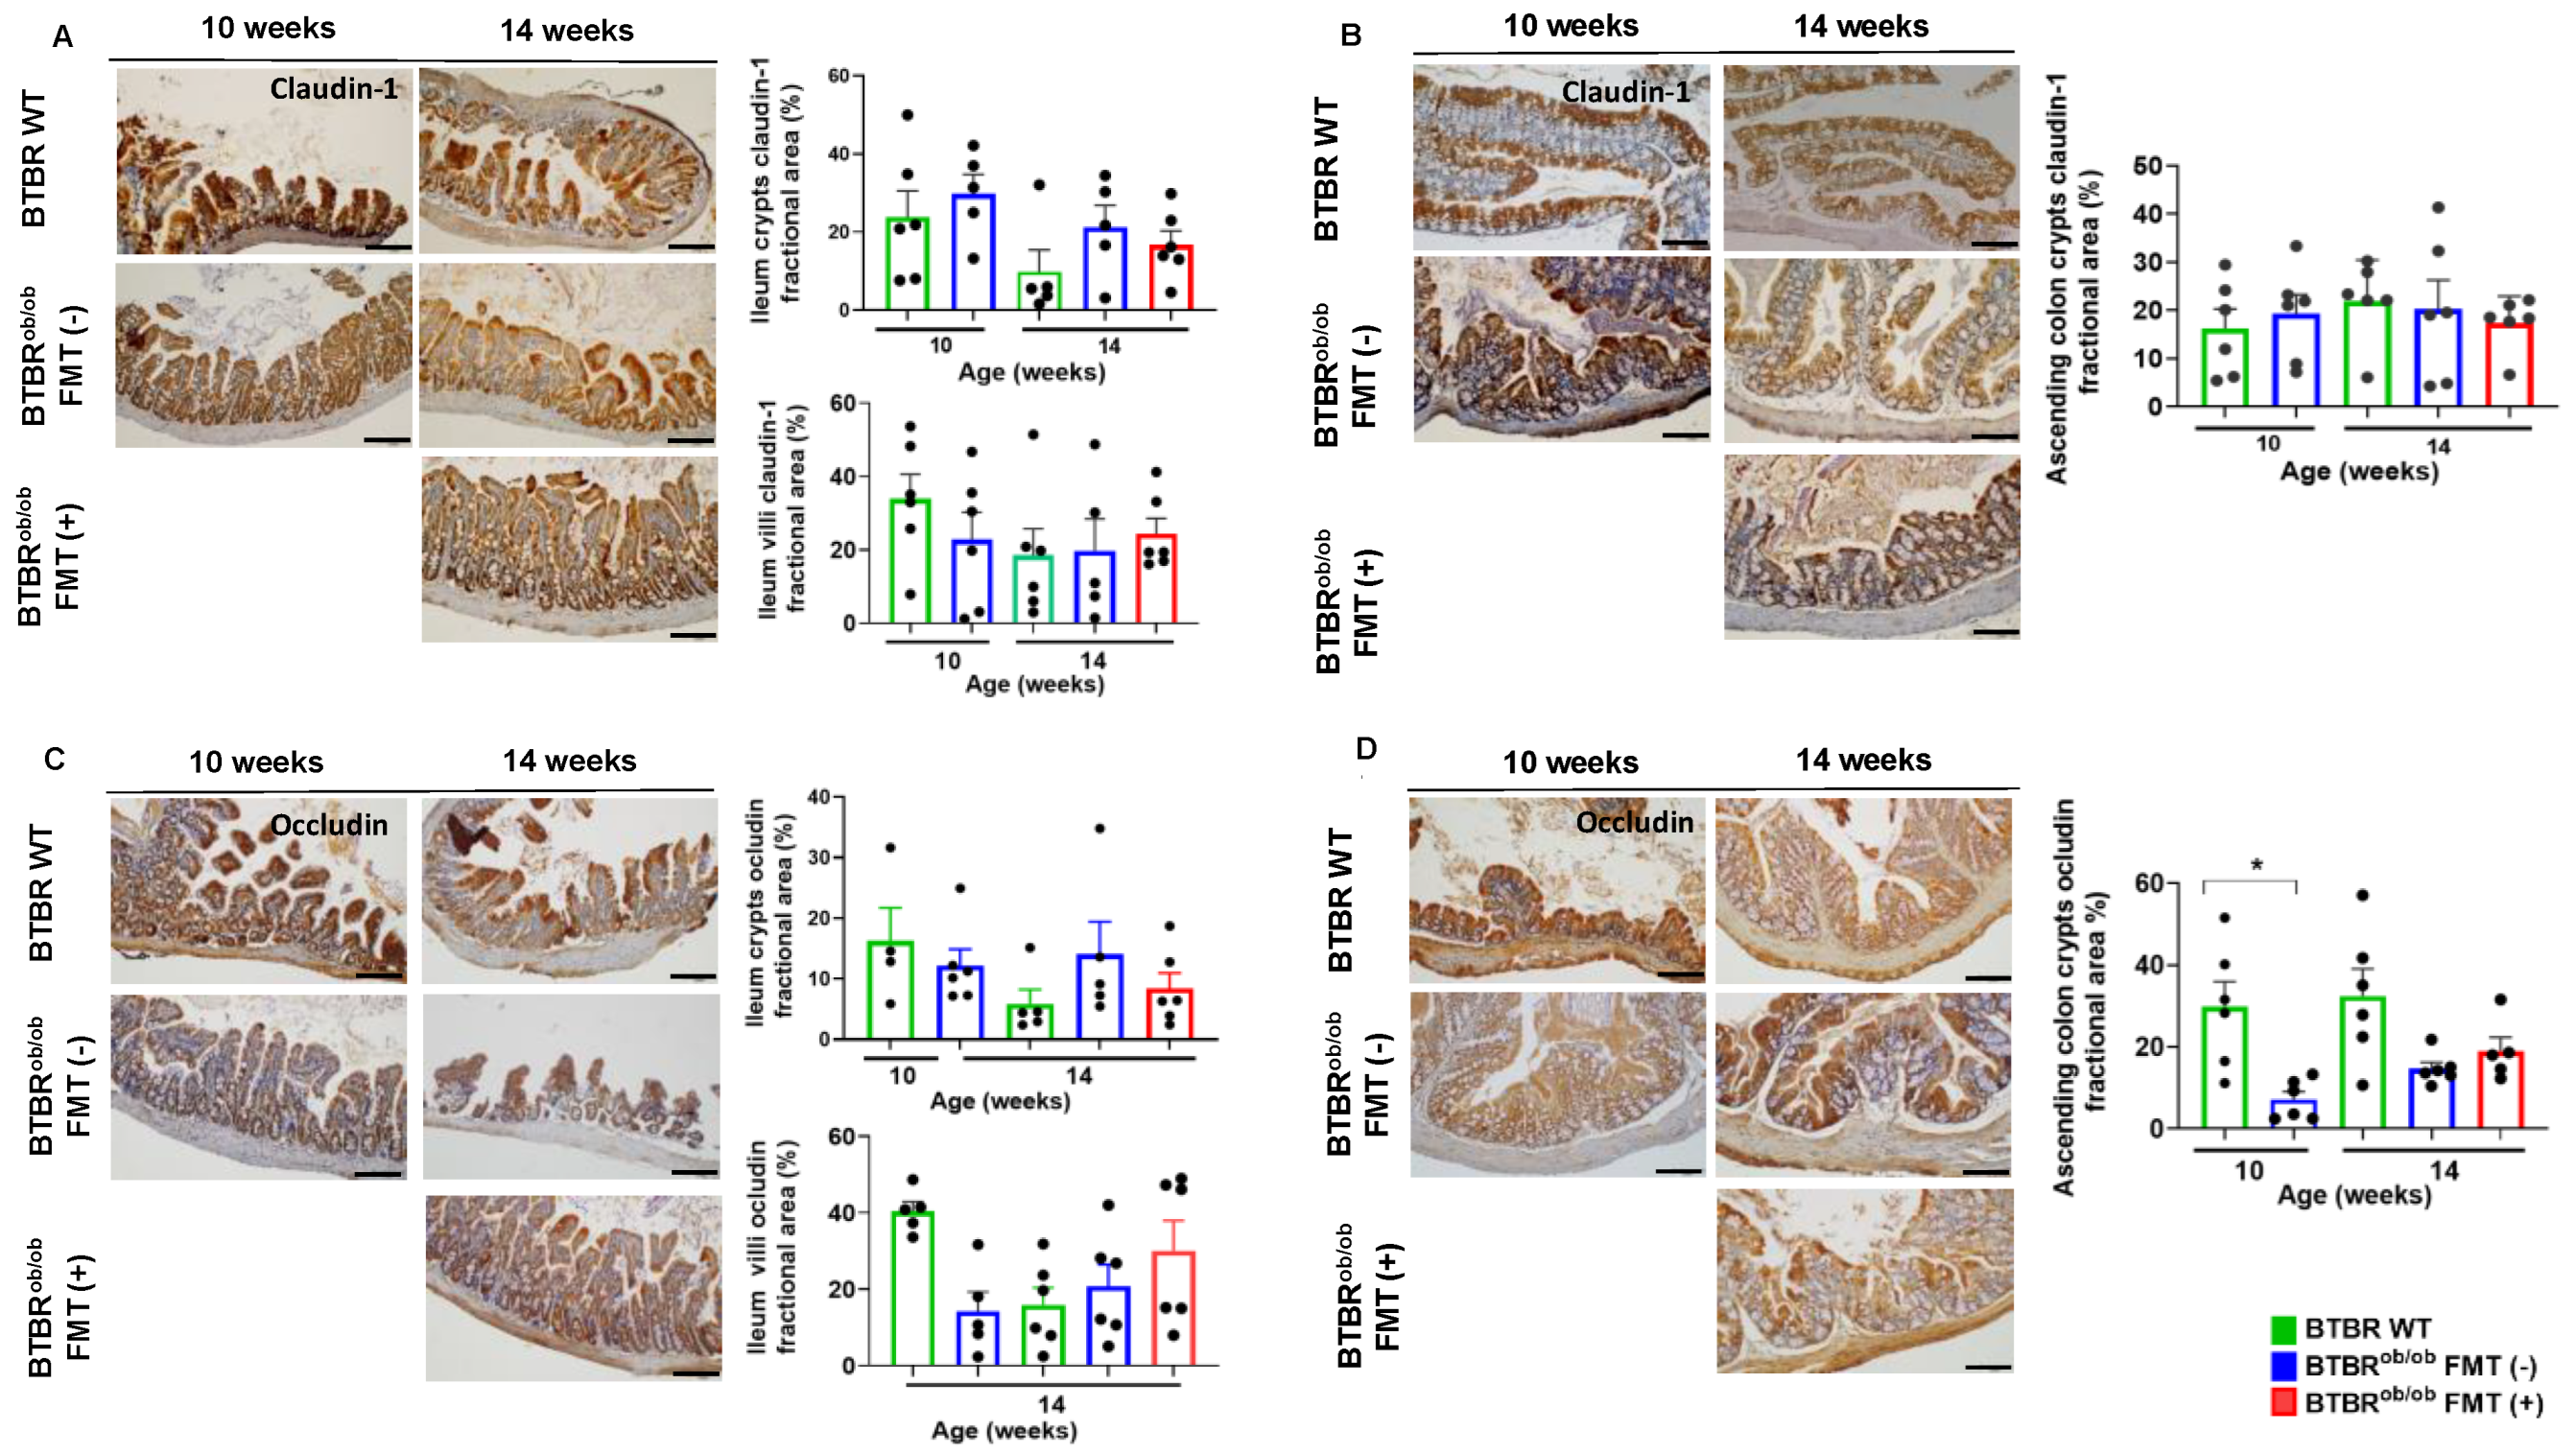
2.6. TNF-α Gene Expression and Morphological Parameters in the Ileum and Ascending Colon
3. Discussion
4. Research Design and Methods
4.1. Fecal Microbiota Transplant (FMT)
4.2. Functional Assessment
4.3. Microbial Analysis of the Intestinal Contents of Mice
4.4. Evaluation of Metabolic Parameters and Inflammatory Markers
4.5. Mesangial Expansion
4.6. Morphological Analysis
4.7. Immunohistochemistry (IHC) Analyses
4.8. RNA Extraction and cDNA Synthesis
4.9. Real-Time qPCR Assays
4.10. Preparation of Sequencing Libraries for Microbial Analysis of Intestinal Content of Mice
4.11. Statistical Analysis
Supplementary Materials
Author Contributions
Funding
Institutional Review Board Statement
Informed Consent Statement
Data Availability Statement
Acknowledgments
Conflicts of Interest
References
- Thomas, M.C.; Brownlee, M.; Susztak, K.; Sharma, K.; Jandeleit-Dahm, K.A.; Zoungas, S.; Rossing, P.; Groop, P.H.; Cooper, M.E. Diabetic kidney disease. Nat. Rev. Dis. Primers 2015, 1, 15018. [Google Scholar] [CrossRef]
- Anders, H.-J.; Huber, T.B.; Isermann, B.; Schiffer, M. CKD in diabetes: Diabetic kidney disease versus nondiabetic kidney disease. Nat. Rev. Nephrol. 2018, 14, 361–377. [Google Scholar] [CrossRef]
- Alicic, R.Z.; Rooney, M.T.; Tuttle, K.R. Diabetic Kidney Disease: Challenges, Progress, and Possibilities. Clin. J. Am. Soc. Nephrol. 2017, 12, 2032–2045. [Google Scholar] [CrossRef]
- Fan, Y.; Pedersen, O. Gut microbiota in human metabolic health and disease. Nat. Rev. Microbiol. 2021, 19, 55–71. [Google Scholar] [CrossRef]
- Backhed, F.; Ding, H.; Wang, T.; Hooper, L.V.; Koh, G.Y.; Nagy, A.; Semenkovich, C.F.; Gordon, J.I. The gut microbiota as an environmental factor that regulates fat storage. Proc. Natl. Acad. Sci. USA 2004, 101, 15718–15723. [Google Scholar] [CrossRef] [Green Version]
- Karlsson, F.H.; Tremaroli, V.; Nookaew, I.; Bergstrom, G.; Behre, C.J.; Fagerberg, B.; Nielsen, J.; Backhed, F. Gut metagenome in European women with normal, impaired and diabetic glucose control. Nature 2013, 498, 99–103. [Google Scholar] [CrossRef]
- Qin, J.; Li, Y.; Cai, Z.; Li, S.; Zhu, J.; Zhang, F.; Liang, S.; Zhang, W.; Guan, Y.; Shen, D.; et al. A metagenome-wide association study of gut microbiota in type 2 diabetes. Nature 2012, 490, 55–60. [Google Scholar] [CrossRef]
- Turnbaugh, P.J.; Ley, R.E.; Mahowald, M.A.; Magrini, V.; Mardis, E.R.; Gordon, J.I. An obesity-associated gut microbiome with increased capacity for energy harvest. Nature 2006, 444, 1027–1031. [Google Scholar] [CrossRef]
- Cani, P.D.; Osto, M.; Geurts, L.; Everard, A. Involvement of gut microbiota in the development of low-grade inflammation and type 2 diabetes associated with obesity. Gut Microbes 2012, 3, 279–288. [Google Scholar] [CrossRef] [Green Version]
- Cani, P.D.; Amar, J.; Iglesias, M.A.; Poggi, M.; Knauf, C.; Bastelica, D.; Neyrinck, A.M.; Fava, F.; Tuohy, K.M.; Chabo, C.; et al. Metabolic endotoxemia initiates obesity and insulin resistance. Diabetes 2007, 56, 1761–1772. [Google Scholar] [CrossRef] [Green Version]
- Larsen, N.; Vogensen, F.K.; van den Berg, F.W.; Nielsen, D.S.; Andreasen, A.S.; Pedersen, B.K.; Al-Soud, W.A.; Sorensen, S.J.; Hansen, L.H.; Jakobsen, M. Gut microbiota in human adults with type 2 diabetes differs from non-diabetic adults. PLoS ONE 2010, 5, e9085. [Google Scholar] [CrossRef]
- Wolters, M.; Ahrens, J.; Romaní-Pérez, M.; Watkins, C.; Sanz, Y.; Benítez-Páez, A.; Stanton, C.; Günther, K. Dietary fat, the gut microbiota, and metabolic health—A systematic review conducted within the MyNewGut project. Clin. Nutr. 2019, 38, 2504–2520. [Google Scholar] [CrossRef] [Green Version]
- Everard, A.; Lazarevic, V.; Derrien, M.; Girard, M.; Muccioli, G.G.; Neyrinck, A.M.; Possemiers, S.; van Holle, A.; Francois, P.; de Vos, W.M.; et al. Responses of gut microbiota and glucose and lipid metabolism to prebiotics in genetic obese and diet-induced leptin-resistant mice. Diabetes 2011, 60, 2775–2786. [Google Scholar] [CrossRef] [Green Version]
- Jia, L.; Li, D.; Feng, N.; Shamoon, M.; Sun, Z.; Ding, L.; Zhang, H.; Chen, W.; Sun, J.; Chen, Y.Q. Anti-diabetic Effects of Clostridium butyricum CGMCC0313.1 through Promoting the Growth of Gut Butyrate-producing Bacteria in Type 2 Diabetic Mice. Sci. Rep. 2017, 7, 7046. [Google Scholar] [CrossRef]
- Beserra, B.T.; Fernandes, R.; do Rosario, V.A.; Mocellin, M.C.; Kuntz, M.G.; Trindade, E.B. A systematic review and meta-analysis of the prebiotics and synbiotics effects on glycaemia, insulin concentrations and lipid parameters in adult patients with overweight or obesity. Clin. Nutr. 2015, 34, 845–858. [Google Scholar] [CrossRef]
- Wang, H.; Lu, Y.; Yan, Y.; Tian, S.; Zheng, D.; Leng, D.; Wang, C.; Jiao, J.; Wang, Z.; Bai, Y. Promising Treatment for Type 2 Diabetes: Fecal Microbiota Transplantation Reverses Insulin Resistance and Impaired Islets. Front. Cell Infect. Microbiol. 2019, 9, 455. [Google Scholar] [CrossRef] [Green Version]
- Vrieze, A.; van Nood, E.; Holleman, F.; Salojarvi, J.; Kootte, R.S.; Bartelsman, J.F.; Dallinga-Thie, G.M.; Ackermans, M.T.; Serlie, M.J.; Oozeer, R.; et al. Transfer of intestinal microbiota from lean donors increases insulin sensitivity in individuals with metabolic syndrome. Gastroenterology 2012, 143, 913–916.e7. [Google Scholar] [CrossRef]
- Napolitano, M.; Covasa, M. Microbiota Transplant in the Treatment of Obesity and Diabetes: Current and Future Perspectives. Front. Microbiol. 2020, 11, 590370. [Google Scholar] [CrossRef]
- Hudkins, K.L.; Pichaiwong, W.; Wietecha, T.; Kowalewska, J.; Banas, M.C.; Spencer, M.W.; Muhlfeld, A.; Koelling, M.; Pippin, J.W.; Shankland, S.J.; et al. BTBR Ob/Ob mutant mice model progressive diabetic nephropathy. J. Am. Soc. Nephrol. 2010, 21, 1533–1542. [Google Scholar] [CrossRef] [Green Version]
- Fournel, A.; Marlin, A.; Abot, A.; Pasquio, C.; Cirillo, C.; Cani, P.D.; Knauf, C. Glucosensing in the gastrointestinal tract: Impact on glucose metabolism. Am. J. Physiol. Gastrointest. Liver Physiol. 2016, 310, G645–G658. [Google Scholar] [CrossRef] [Green Version]
- Cani, P.D.; Possemiers, S.; Van de Wiele, T.; Guiot, Y.; Everard, A.; Rottier, O.; Geurts, L.; Naslain, D.; Neyrinck, A.; Lambert, D.M.; et al. Changes in gut microbiota control inflammation in obese mice through a mechanism involving GLP-2-driven improvement of gut permeability. Gut 2009, 58, 1091–1103. [Google Scholar] [CrossRef] [Green Version]
- Camilleri, M. Gastrointestinal hormones and regulation of gastric emptying. Curr. Opin. Endocrinol. Diabetes Obes. 2019, 26, 3–10. [Google Scholar] [CrossRef]
- Ellekilde, M.; Krych, L.; Hansen, C.H.; Hufeldt, M.R.; Dahl, K.; Hansen, L.H.; Sorensen, S.J.; Vogensen, F.K.; Nielsen, D.S.; Hansen, A.K. Characterization of the gut microbiota in leptin deficient obese mice—Correlation to inflammatory and diabetic parameters. Res. Vet. Sci. 2014, 96, 241–250. [Google Scholar] [CrossRef]
- Ellekilde, M.; Selfjord, E.; Larsen, C.S.; Jakesevic, M.; Rune, I.; Tranberg, B.; Vogensen, F.K.; Nielsen, D.S.; Bahl, M.I.; Licht, T.R.; et al. Transfer of gut microbiota from lean and obese mice to antibiotic-treated mice. Sci. Rep. 2014, 4, 5922. [Google Scholar] [CrossRef] [Green Version]
- O’Brien, P.D.; Hur, J.; Hayes, J.M.; Backus, C.; Sakowski, S.A.; Feldman, E.L. BTBR ob/ob mice as a novel diabetic neuropathy model: Neurological characterization and gene expression analyses. Neurobiol. Dis. 2015, 73, 348–355. [Google Scholar] [CrossRef] [Green Version]
- Sávio-Silva, C.; Soinski-Sousa, P.E.; Simplício-Filho, A.; Bastos, R.M.C.; Beyerstedt, S.; Rangel, É.B. Therapeutic Potential of Mesenchymal Stem Cells in a Pre-Clinical Model of Diabetic Kidney Disease and Obesity. Int. J. Mol. Sci. 2021, 22, 1546. [Google Scholar] [CrossRef]
- Procaccini, C.; Jirillo, E.; Matarese, G. Leptin as an immunomodulator. Mol. Aspects Med. 2012, 33, 35–45. [Google Scholar] [CrossRef]
- Yang, M.; Liu, Y.; Xie, H.; Wen, Z.; Zhang, Y.; Wu, C.; Huang, L.; Wu, J.; Xie, C.; Wang, T.; et al. Gut Microbiota Composition and Structure of the Ob/Ob and Db/Db Mice. Int. J. Endocrinol. 2019, 2019, 1394097. [Google Scholar] [CrossRef] [Green Version]
- Beltowski, J. Leptin and atherosclerosis. Atherosclerosis 2006, 189, 47–60. [Google Scholar] [CrossRef]
- Pérez-Pérez, A.; Sánchez-Jiménez, F.; Vilariño-García, T.; Sánchez-Margalet, V. Role of Leptin in Inflammation and Vice Versa. Int. J. Mol. Sci. 2020, 21, 5887. [Google Scholar] [CrossRef]
- Anini, Y.; Brubaker, P.L. Role of leptin in the regulation of glucagon-like peptide-1 secretion. Diabetes 2003, 52, 252–259. [Google Scholar] [CrossRef] [Green Version]
- Yu, F.; Han, W.; Zhan, G.; Li, S.; Jiang, X.; Wang, L.; Xiang, S.; Zhu, B.; Yang, L.; Luo, A.; et al. Abnormal gut microbiota composition contributes to the development of type 2 diabetes mellitus in db/db mice. Aging 2019, 11, 10454–10467. [Google Scholar] [CrossRef]
- Ley, R.E.; Backhed, F.; Turnbaugh, P.; Lozupone, C.A.; Knight, R.D.; Gordon, J.I. Obesity alters gut microbial ecology. Proc. Natl. Acad. Sci. USA 2005, 102, 11070–11075. [Google Scholar] [CrossRef] [Green Version]
- Koliada, A.; Syzenko, G.; Moseiko, V.; Budovska, L.; Puchkov, K.; Perederiy, V.; Gavalko, Y.; Dorofeyev, A.; Romanenko, M.; Tkach, S.; et al. Association between body mass index and Firmicutes/Bacteroidetes ratio in an adult Ukrainian population. BMC Microbiol. 2017, 17, 120. [Google Scholar] [CrossRef] [Green Version]
- Serena, C.; Ceperuelo-Mallafré, V.; Keiran, N.; Queipo-Ortuño, M.I.; Bernal, R.; Gomez-Huelgas, R.; Urpi-Sarda, M.; Sabater, M.; Pérez-Brocal, V.; Andrés-Lacueva, C.; et al. Elevated circulating levels of succinate in human obesity are linked to specific gut microbiota. ISME J. 2018, 12, 1642–1657. [Google Scholar] [CrossRef] [Green Version]
- Magne, F.; Gotteland, M.; Gauthier, L.; Zazueta, A.; Pesoa, S.; Navarrete, P.; Balamurugan, R. The Firmicutes/Bacteroidetes Ratio: A Relevant Marker of Gut Dysbiosis in Obese Patients? Nutrients 2020, 12, 1474. [Google Scholar] [CrossRef]
- Schwiertz, A.; Taras, D.; Schafer, K.; Beijer, S.; Bos, N.A.; Donus, C.; Hardt, P.D. Microbiota and SCFA in lean and overweight healthy subjects. Obesity 2010, 18, 190–195. [Google Scholar] [CrossRef]
- Kashani, A.; Brejnrod, A.D.; Jin, C.; Kern, T.; Madsen, A.N.; Holm, L.A.; Gerber, G.K.; Holm, J.C.; Hansen, T.; Holst, B.; et al. Impaired glucose metabolism and altered gut microbiome despite calorie restriction of ob/ob mice. Anim. Microbiome 2019, 1, 11. [Google Scholar] [CrossRef] [Green Version]
- Grazioli, S.; Pugin, J. Mitochondrial Damage-Associated Molecular Patterns: From Inflammatory Signaling to Human Diseases. Front. Immunol. 2018, 9, 832. [Google Scholar] [CrossRef]
- Sadagopan, N.; Li, W.; Roberds, S.L.; Major, T.; Preston, G.M.; Yu, Y.; Tones, M.A. Circulating succinate is elevated in rodent models of hypertension and metabolic disease. Am. J. Hypertens. 2007, 20, 1209–1215. [Google Scholar]
- Chen, X.; Devaraj, S. Gut Microbiome in Obesity, Metabolic Syndrome, and Diabetes. Curr. Diabetes Rep. 2018, 18, 129. [Google Scholar] [CrossRef]
- Vallianou, N.G.; Stratigou, T.; Tsagarakis, S. Metformin and gut microbiota: Their interactions and their impact on diabetes. Hormones 2019, 18, 141–144. [Google Scholar] [CrossRef]
- Zhang, Q.; Hu, N. Effects of Metformin on the Gut Microbiota in Obesity and Type 2 Diabetes Mellitus. Diabetes Metab. Syndr. Obes. 2020, 13, 5003–5014. [Google Scholar] [CrossRef]
- Lee, D.M.; Battson, M.L.; Jarrell, D.K.; Hou, S.; Ecton, K.E.; Weir, T.L.; Gentile, C.L. SGLT2 inhibition via dapagliflozin improves generalized vascular dysfunction and alters the gut microbiota in type 2 diabetic mice. Cardiovasc. Diabetol. 2018, 17, 62. [Google Scholar] [CrossRef] [Green Version]
- Herat, L.Y.; Ward, N.C.; Magno, A.L.; Rakoczy, E.P.; Kiuchi, M.G.; Schlaich, M.P.; Matthews, V.B. Sodium glucose co-transporter 2 inhibition reduces succinate levels in diabetic mice. World. J. Gastroenterol. 2020, 26, 3225–3235. [Google Scholar] [CrossRef]
- Madsen, M.S.A.; Holm, J.B.; Pallejà, A.; Wismann, P.; Fabricius, K.; Rigbolt, K.; Mikkelsen, M.; Sommer, M.; Jelsing, J.; Nielsen, H.B.; et al. Metabolic and gut microbiome changes following GLP-1 or dual GLP-1/GLP-2 receptor agonist treatment in diet-induced obese mice. Sci. Rep. 2019, 9, 15582. [Google Scholar] [CrossRef]
- Zhao, L.; Chen, Y.; Xia, F.; Abudukerimu, B.; Zhang, W.; Guo, Y.; Wang, N.; Lu, Y. A Glucagon-Like Peptide-1 Receptor Agonist Lowers Weight by Modulating the Structure of Gut Microbiota. Front. Endocrinol. 2018, 9, 233. [Google Scholar] [CrossRef] [Green Version]
- Zhao, C.; Hu, Y.; Chen, H.; Li, B.; Cao, L.; Xia, J.; Yin, Y. An in vitro evaluation of the effects of different statins on the structure and function of human gut bacterial community. PLoS ONE 2020, 15, e0230200. [Google Scholar] [CrossRef]
- Kim, J.; Lee, H.; An, J.; Song, Y.; Lee, C.K.; Kim, K.; Kong, H. Alterations in Gut Microbiota by Statin Therapy and Possible Intermediate Effects on Hyperglycemia and Hyperlipidemia. Front. Microbiol. 2019, 10, 1947. [Google Scholar] [CrossRef] [Green Version]
- Lindström, P. The physiology of obese-hyperglycemic mice [ob/ob mice]. Sci. World J. 2007, 7, 666–685. [Google Scholar] [CrossRef] [Green Version]
- Araújo, T.; Oliveira, A.; Carvalho, B.; Guadagnini, D.; Protzek, A.; Carvalheira, J.; Boschero, A.; Saad, M. Hepatocyte Growth Factor Plays a Key Role in Insulin Resistance-Associated Compensatory Mechanisms. Endocrinology 2012, 153, 5760–5769. [Google Scholar] [CrossRef] [PubMed]
- Holst, J.J.; Rosenkilde, M.M. GIP as a Therapeutic Target in Diabetes and Obesity: Insight From Incretin Co-agonists. J. Clin. Endocrinol. Metab. 2020, 105, e2710–e2716. [Google Scholar] [CrossRef] [PubMed]
- Shimazu-Kuwahara, S.; Harada, N.; Yamane, S.; Joo, E.; Sankoda, A.; Kieffer, T.J.; Inagaki, N. Attenuated secretion of glucose-dependent insulinotropic polypeptide (GIP) does not alleviate hyperphagic obesity and insulin resistance in ob/ob mice. Mol. Metab. 2017, 6, 288–294. [Google Scholar] [CrossRef] [PubMed]
- Cohen, A.J.; McCarthy, D.M.; Stoff, J.S. Direct hemodynamic effect of insulin in the isolated perfused kidney. Am. J. Physiol. 1989, 257 Pt 2, F580–F585. [Google Scholar] [CrossRef]
- Tucker, B.J.; Anderson, C.M.; Thies, R.S.; Collins, R.C.; Blantz, R.C. Glomerular hemodynamic alterations during acute hyperinsulinemia in normal and diabetic rats. Kidney Int. 1992, 42, 1160–1168. [Google Scholar] [CrossRef] [Green Version]
- Kim, M.-H.; Yun, K.E.; Kim, J.; Park, E.; Chang, Y.; Ryu, S.; Kim, H.-L.; Kim, H.-N. Gut microbiota and metabolic health among overweight and obese individuals. Sci. Rep. 2020, 10, 19417. [Google Scholar] [CrossRef]
- Van Diepen, J.A.; Robben, J.H.; Hooiveld, G.J.; Carmone, C.; Alsady, M.; Boutens, L.; Bekkenkamp-Grovenstein, M.; Hijmans, A.; Engelke, U.F.H.; Wevers, R.A.; et al. SUCNR1-mediated chemotaxis of macrophages aggravates obesity-induced inflammation and diabetes. Diabetologia 2017, 60, 1304–1313. [Google Scholar] [CrossRef] [Green Version]
- Loubinoux, J.; Bronowicki, J.-P.; Pereira, I.A.C.; Mougenel, J.-L.; Le Faou, A.E. Sulfate-reducing bacteria in human feces and their association with inflammatory bowel diseases. FEMS Microbiol. Ecol. 2002, 40, 107–112. [Google Scholar] [CrossRef]
- Kushkevych, I.; Dordević, D.; Vítězová, M. Possible synergy effect of hydrogen sulfide and acetate produced by sulfate-reducing bacteria on inflammatory bowel disease development. J. Adv. Res. 2020, 27, 71–78. [Google Scholar] [CrossRef]
- Hawrelak, J.A.; Myers, S.P. The causes of intestinal dysbiosis: A review. Altern. Med. Rev. 2004, 9, 180–197. [Google Scholar]
- Wang, R. Physiological implications of hydrogen sulfide: A whiff exploration that blossomed. Physiol. Rev. 2012, 92, 791–896. [Google Scholar] [CrossRef] [Green Version]
- Han, S.J.; Noh, M.R.; Jung, J.M.; Ishii, I.; Yoo, J.; Kim, J.I.; Park, K.M. Hydrogen sulfide-producing cystathionine γ-lyase is critical in the progression of kidney fibrosis. Free Radic. Biol. Med. 2017, 112, 423–432. [Google Scholar] [CrossRef]
- Zhao, M.; Liao, D.; Zhao, J. Diabetes-induced mechanophysiological changes in the small intestine and colon. World J. Diabetes 2017, 8, 249–269. [Google Scholar] [CrossRef] [PubMed]
- Kyoko, O.O.; Kono, H.; Ishimaru, K.; Miyake, K.; Kubota, T.; Ogawa, H.; Okumura, K.; Shibata, S.; Nakao, A. Expressions of tight junction proteins Occludin and Claudin-1 are under the circadian control in the mouse large intestine: Implications in intestinal permeability and susceptibility to colitis. PLoS ONE 2014, 9, e98016. [Google Scholar]
- Thaiss, C.A.; Levy, M.; Grosheva, I.; Zheng, D.; Soffer, E.; Blacher, E.; Braverman, S.; Tengeler, A.C.; Barak, O.; Elazar, M.; et al. Hyperglycemia drives intestinal barrier dysfunction and risk for enteric infection. Science 2018, 359, 1376–1383. [Google Scholar] [CrossRef] [Green Version]
- Chakaroun, R.M.; Massier, L.; Kovacs, P. Gut Microbiome, Intestinal Permeability, and Tissue Bacteria in Metabolic Disease: Perpetrators or Bystanders? Nutrients 2020, 12, 1082. [Google Scholar] [CrossRef] [Green Version]
- Fraulob, J.C.; Ogg-Diamantino, R.; Fernandes-Santos, C.; Aguila, M.B.; Mandarim-de-Lacerda, C.A. A Mouse Model of Metabolic Syndrome: Insulin Resistance, Fatty Liver and Non-Alcoholic Fatty Pancreas Disease (NAFPD) in C57BL/6 Mice Fed a High Fat Diet. J. Clin. Biochem. Nutr. 2010, 46, 212–223. [Google Scholar] [CrossRef] [Green Version]


Publisher’s Note: MDPI stays neutral with regard to jurisdictional claims in published maps and institutional affiliations. |
© 2022 by the authors. Licensee MDPI, Basel, Switzerland. This article is an open access article distributed under the terms and conditions of the Creative Commons Attribution (CC BY) license (https://creativecommons.org/licenses/by/4.0/).
Share and Cite
Bastos, R.M.C.; Simplício-Filho, A.; Sávio-Silva, C.; Oliveira, L.F.V.; Cruz, G.N.F.; Sousa, E.H.; Noronha, I.L.; Mangueira, C.L.P.; Quaglierini-Ribeiro, H.; Josefi-Rocha, G.R.; et al. Fecal Microbiota Transplant in a Pre-Clinical Model of Type 2 Diabetes Mellitus, Obesity and Diabetic Kidney Disease. Int. J. Mol. Sci. 2022, 23, 3842. https://doi.org/10.3390/ijms23073842
Bastos RMC, Simplício-Filho A, Sávio-Silva C, Oliveira LFV, Cruz GNF, Sousa EH, Noronha IL, Mangueira CLP, Quaglierini-Ribeiro H, Josefi-Rocha GR, et al. Fecal Microbiota Transplant in a Pre-Clinical Model of Type 2 Diabetes Mellitus, Obesity and Diabetic Kidney Disease. International Journal of Molecular Sciences. 2022; 23(7):3842. https://doi.org/10.3390/ijms23073842
Chicago/Turabian StyleBastos, Rosana M. C., Antônio Simplício-Filho, Christian Sávio-Silva, Luiz Felipe V. Oliveira, Giuliano N. F. Cruz, Eliza H. Sousa, Irene L. Noronha, Cristóvão L. P. Mangueira, Heloísa Quaglierini-Ribeiro, Gleice R. Josefi-Rocha, and et al. 2022. "Fecal Microbiota Transplant in a Pre-Clinical Model of Type 2 Diabetes Mellitus, Obesity and Diabetic Kidney Disease" International Journal of Molecular Sciences 23, no. 7: 3842. https://doi.org/10.3390/ijms23073842