
Butyrylcholinesterase–Protein Interactions in Human Serum

 , , , and
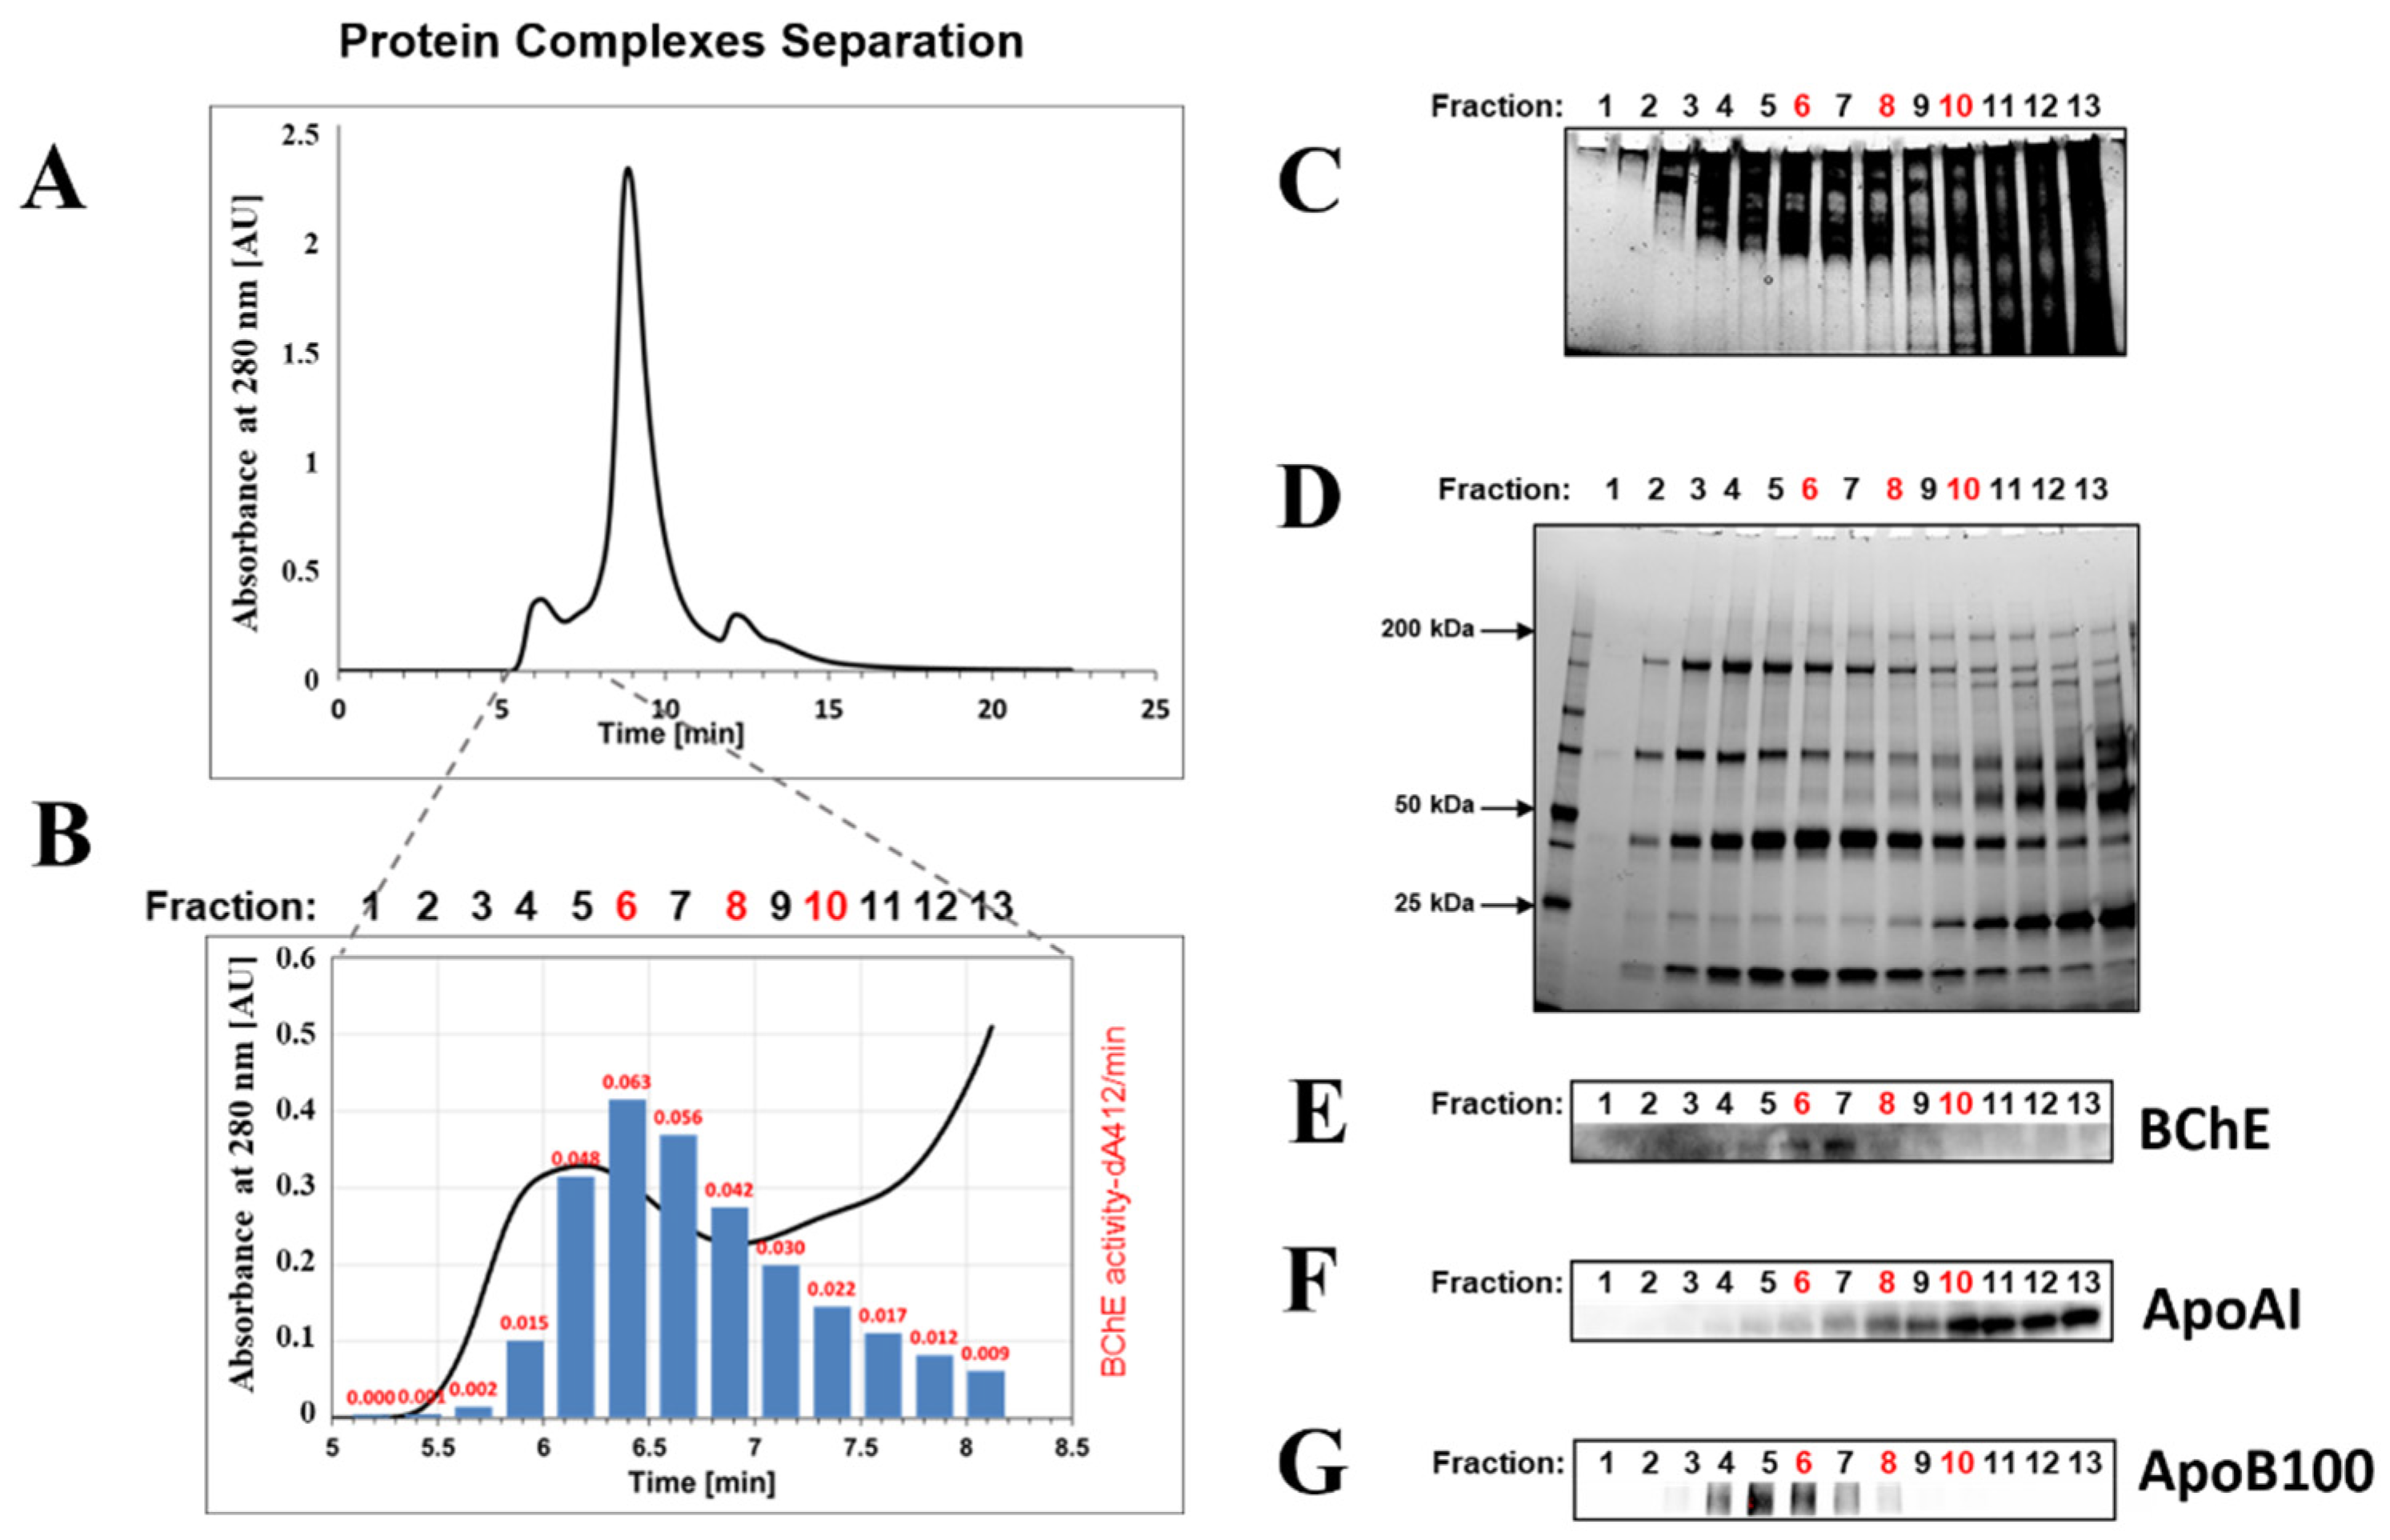
Abstract
:1. Introduction
2. Results
2.1. Isolation of BChE–Protein Complexes by Size-Exclusion Chromatography (SEC) of Serum Proteins
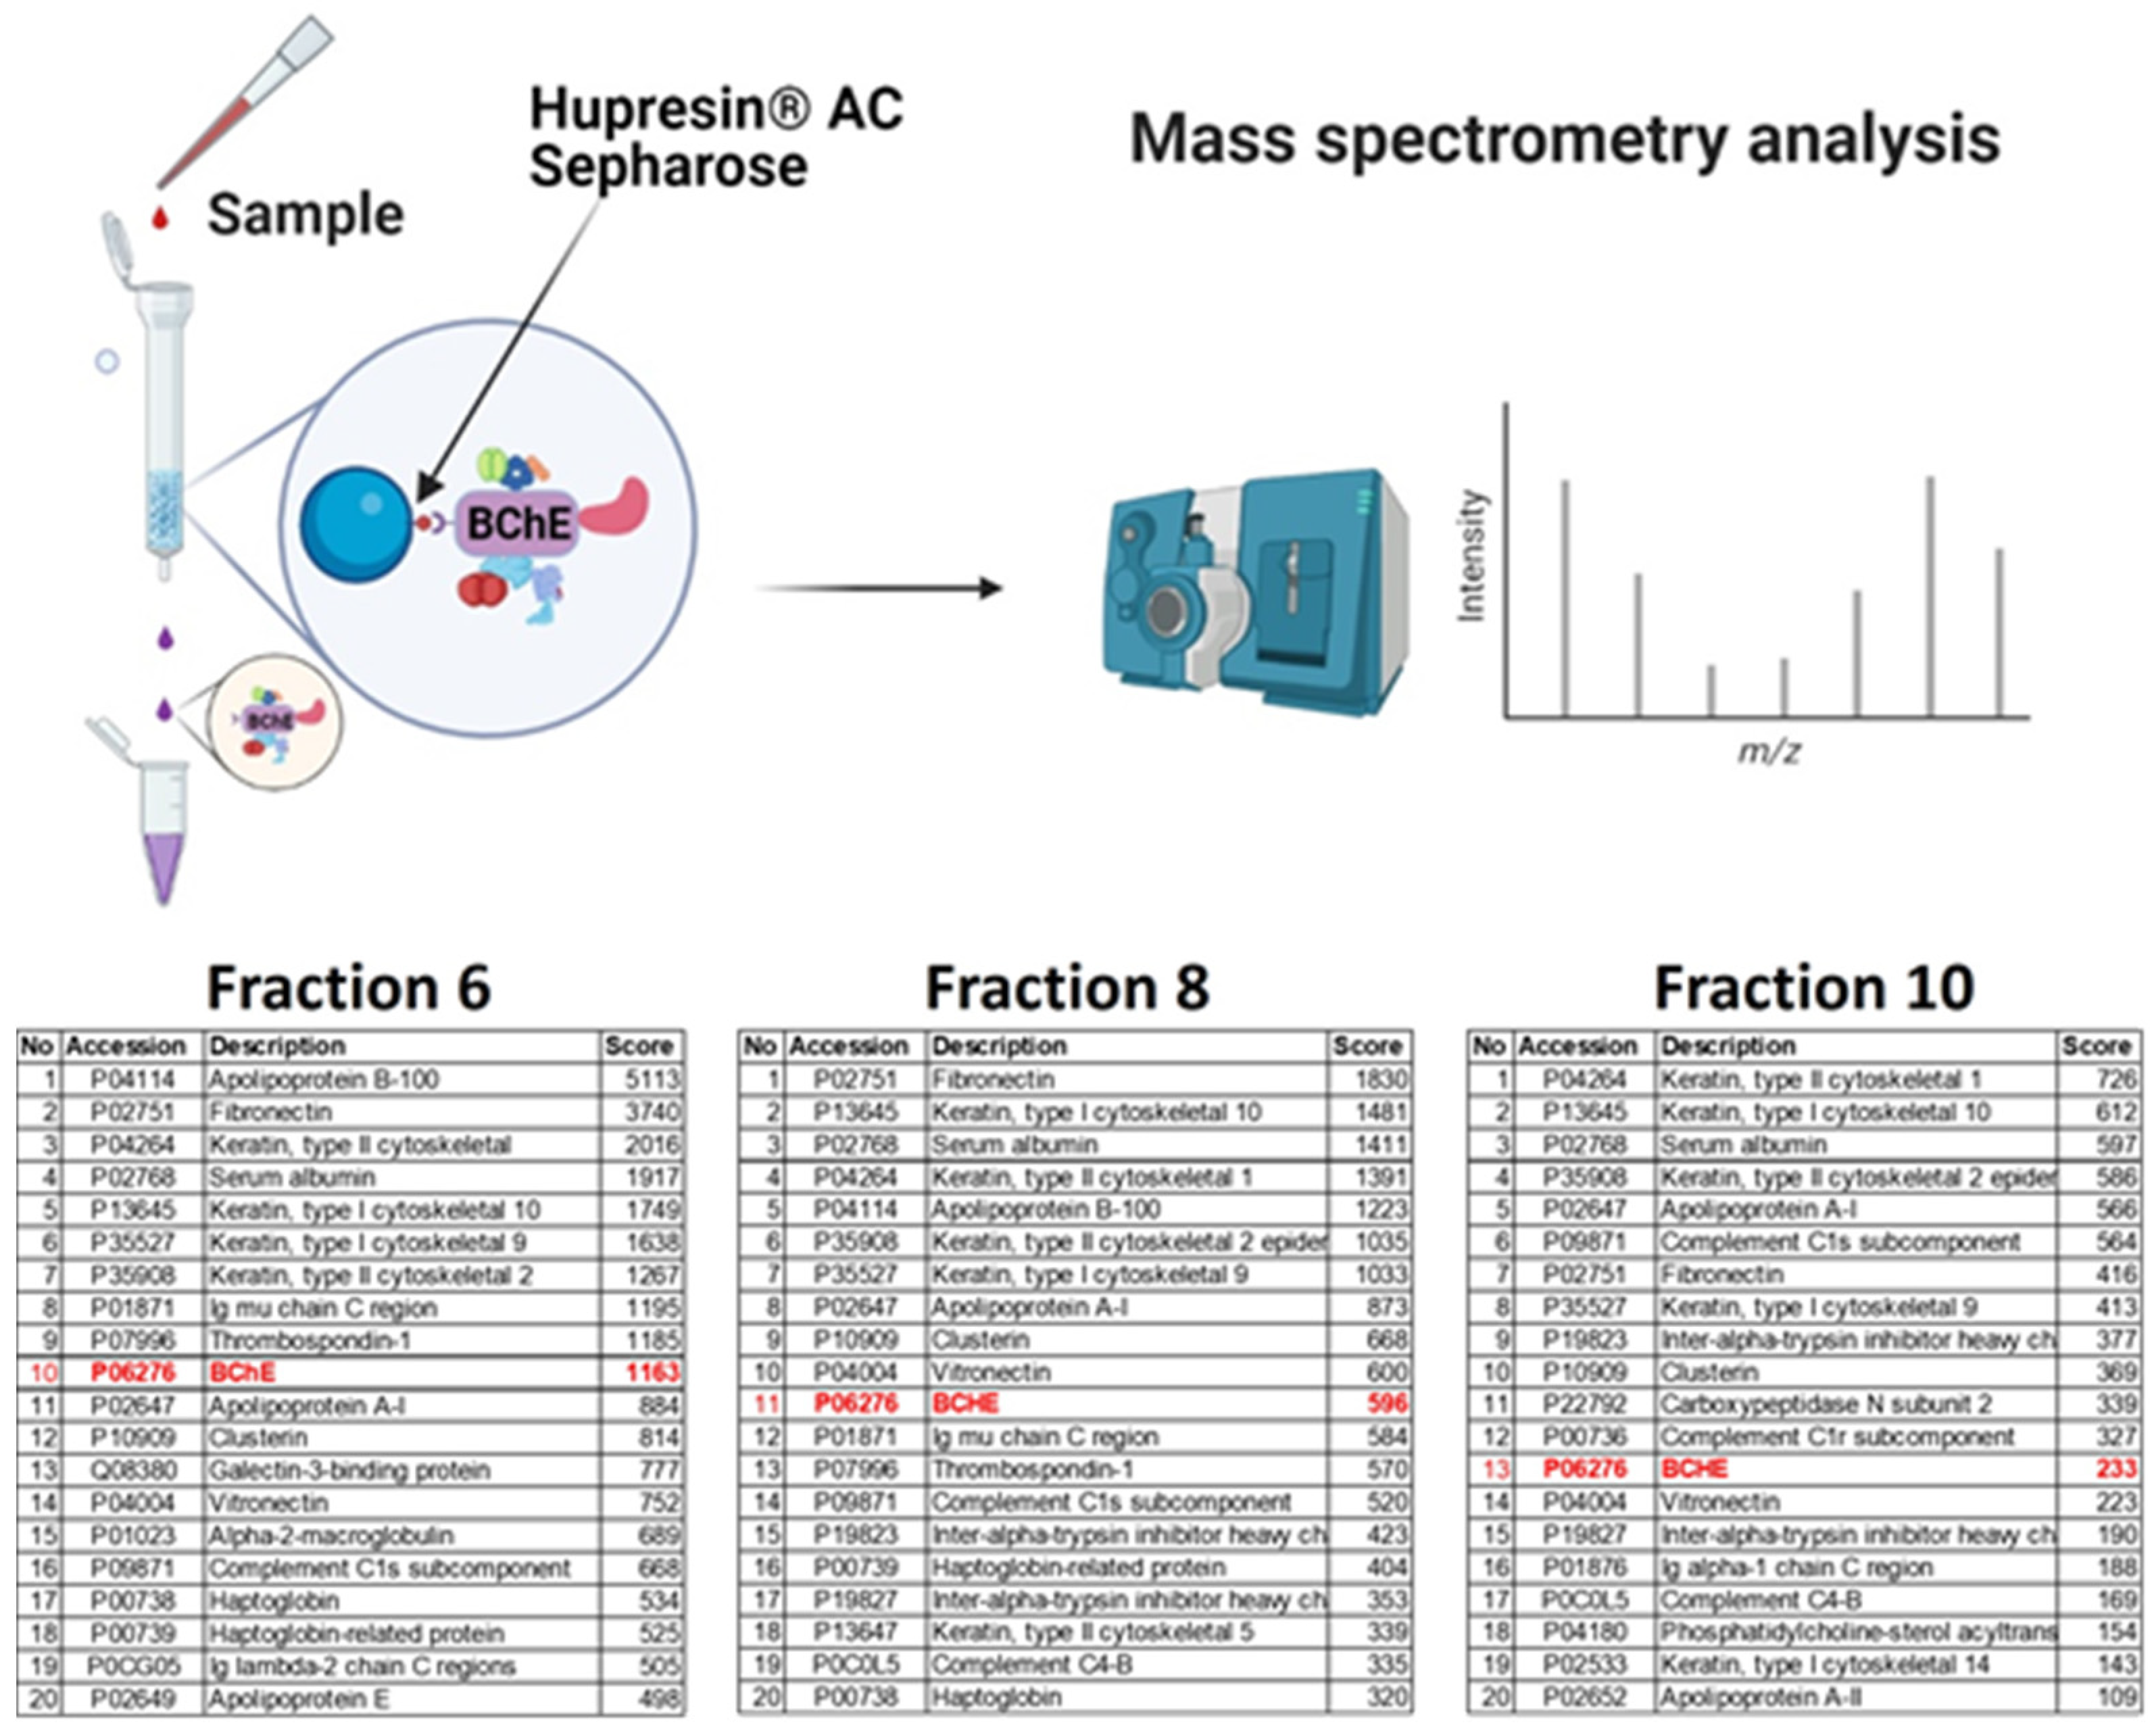
2.2. Binding of BChE–Protein Complexes by Affinity Chromatography on Hupresin AC Sepharose
2.3. Isolation of BChE–Protein Complexes by Fractionation of Blood Serum Proteins Using Density Gradient Ultracentrifugation
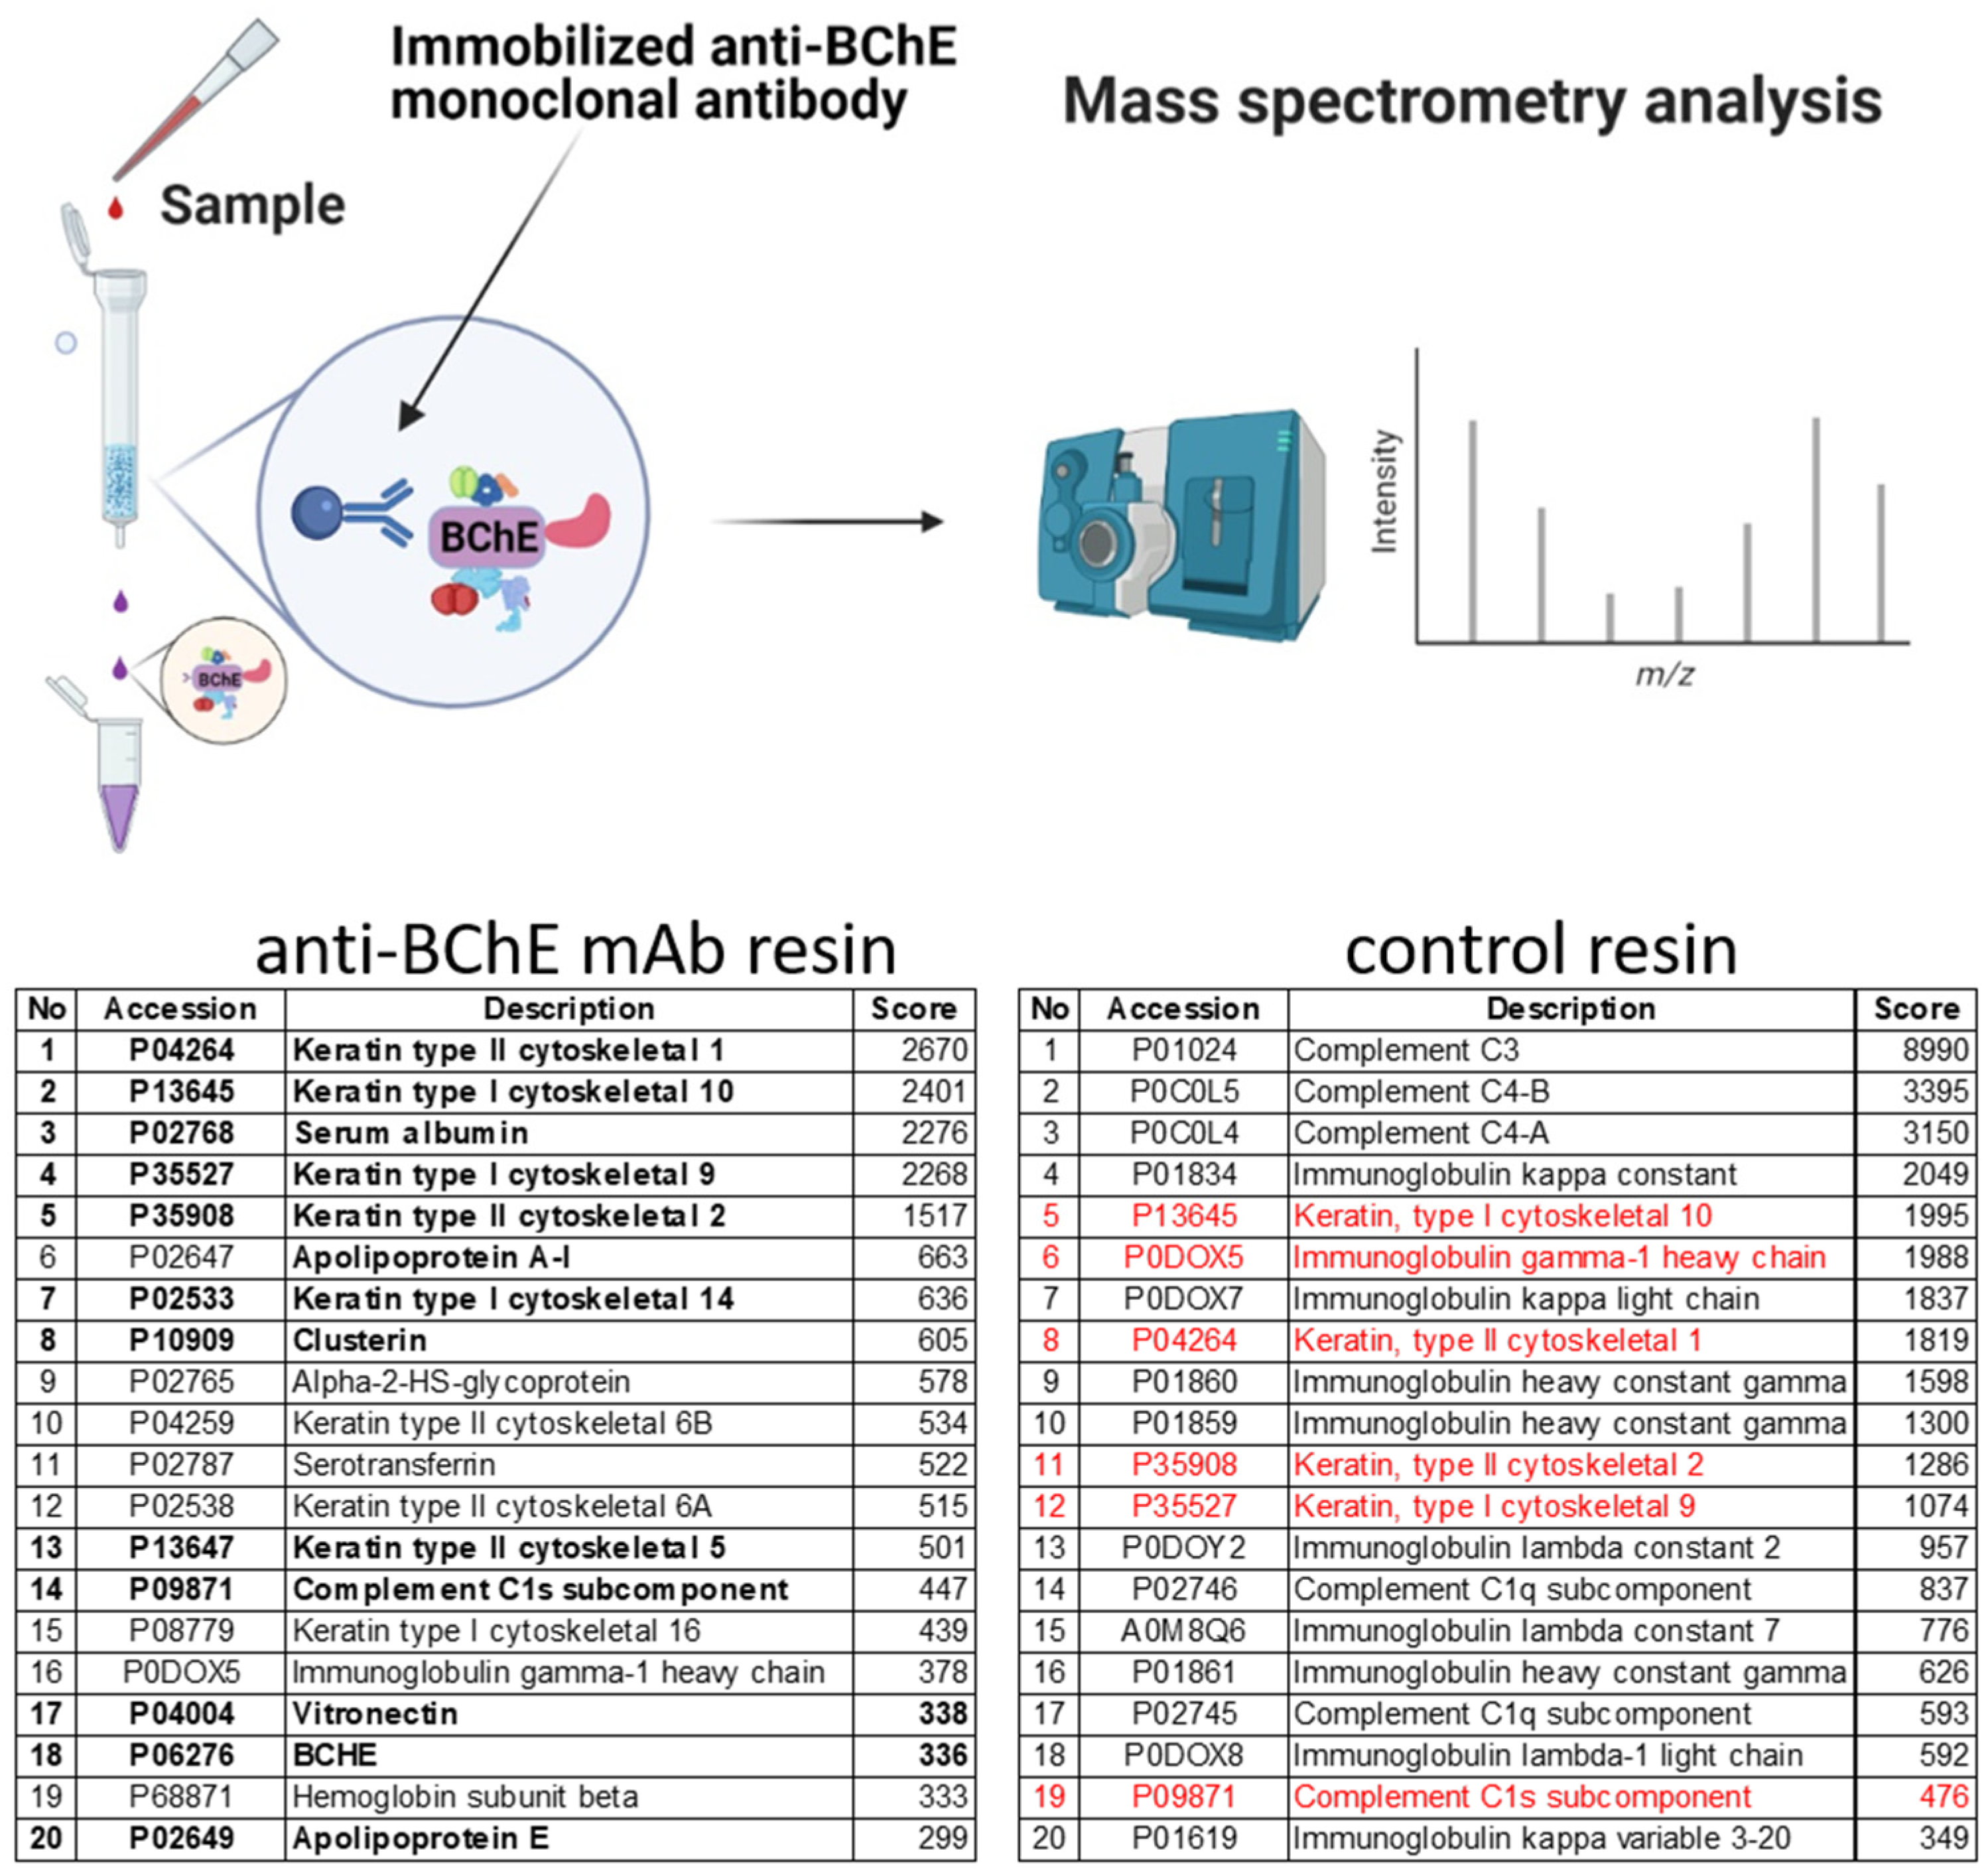
2.4. Isolation of Protein Complexes by Co-Immunoprecipitation and Identification by Mass Spectrometry
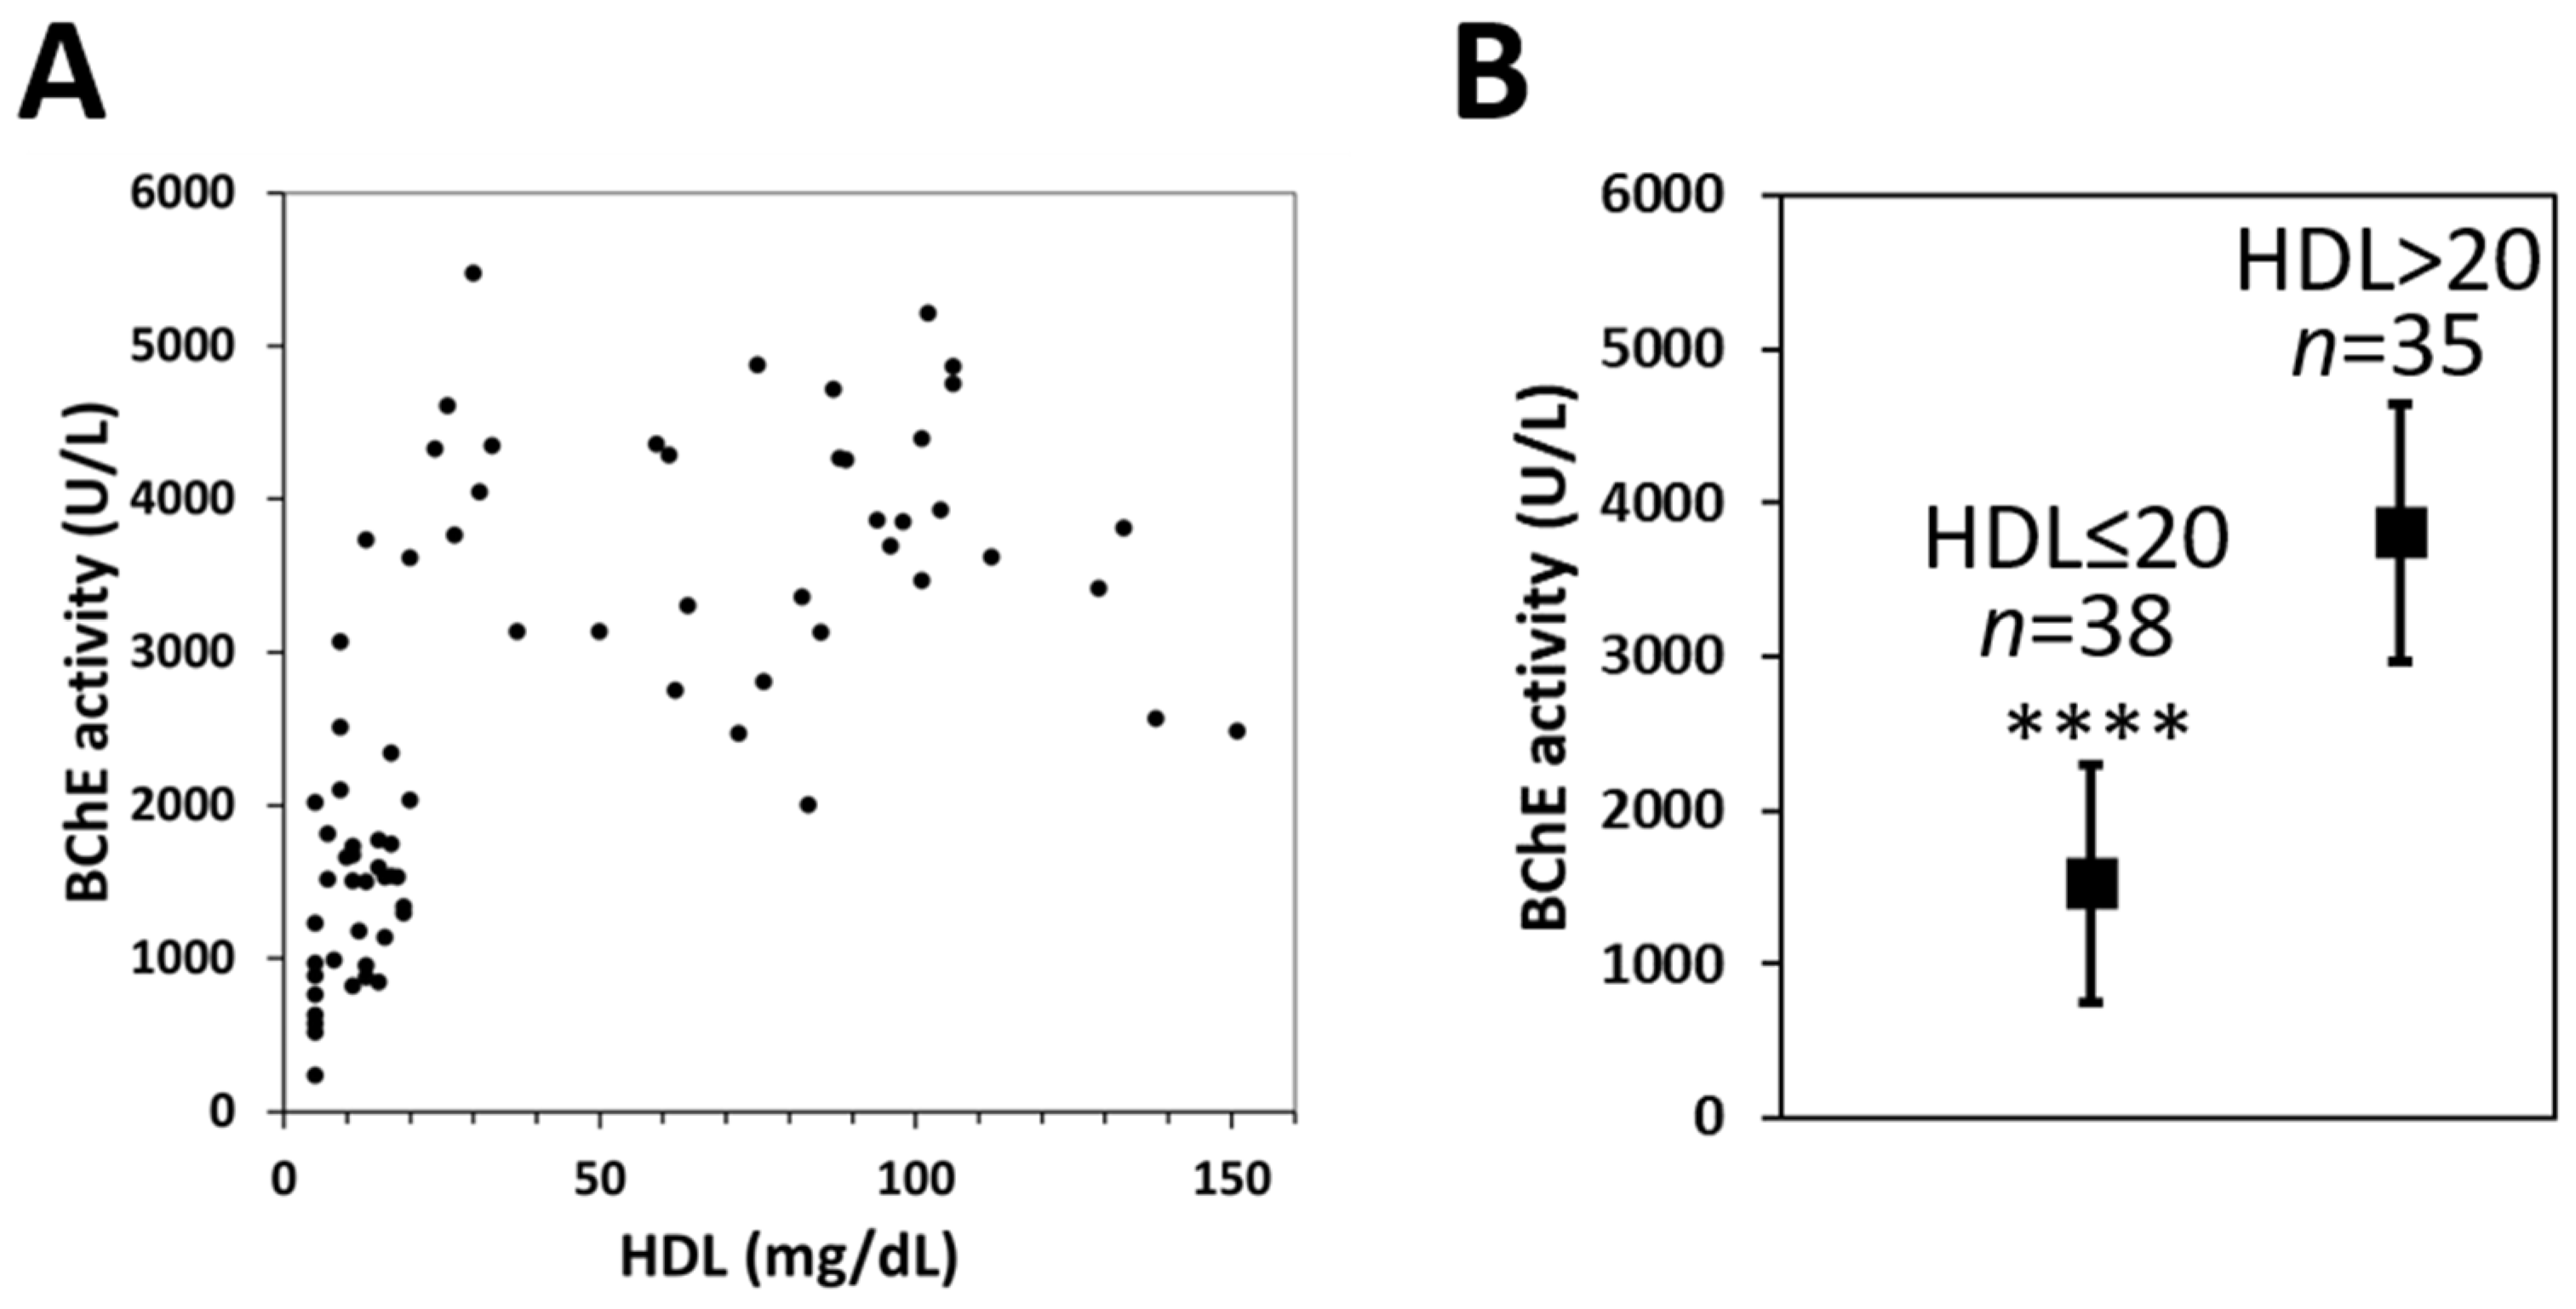
2.5. Measurement of BChE Activity in Subjects with Various HDL Levels
3. Discussion
4. Materials and Methods
4.1. Isolation of BChE–Protein Complexes by Size-Exclusion Chromatography (SEC) of Serum Proteins. Fractionation of Human Serum Proteins by HPLC
4.2. Determination of BChE Activity in the Fractions by Ellman’s Assay
4.3. Analysis of Protein Complexes by Native Polyacrylamide Gel Electrophoresis
4.4. SDS-PAGE and Western Blotting
4.5. Binding of BChE–Protein Complexes by Affinity Chromatography on Hupresin
4.6. Mass Spectrometry of Proteins
4.7. Isolation of BChE–Protein Complexes by Fractionation of Blood Serum Proteins Using Density Iodixanol Gradient Ultracentrifugation
4.8. Sudan Black Stained Agarose Gel Electrophoresis Profile of Separated Fractions
4.9. Isolation of the Protein Complexes by Immunoprecipitation and Mass Spectrometry
Author Contributions
Funding
Institutional Review Board Statement
Informed Consent Statement
Data Availability Statement
Acknowledgments
Conflicts of Interest
References
- Burtis, C.A.; Ashwood, E.R.; Bruns, D.E. Tietz, Fundamentals of Clinical Chemistry, 6th ed.; Saunders/Elsevier: St. Louis, MO, USA, 2008; Volume 54. [Google Scholar]
- Anderson, N.G.L.; Anderson, N.G.L. The Human Plasma Proteome. Mol. Cell. Proteom. 2002, 1, 845–867. [Google Scholar] [CrossRef] [Green Version]
- Adkins, J.N.; Varnum, S.M.; Auberry, K.J.; Moore, R.J.; Angell, N.H.; Smith, R.D.; Springer, D.L.; Pounds, J.G. Toward a Human Blood Serum Proteome. Mol. Cell. Proteom. 2002, 1, 947–955. [Google Scholar] [CrossRef] [PubMed] [Green Version]
- Rai, A.J.; Gelfand, C.A.; Haywood, B.C.; Warunek, D.J.; Yi, J.; Schuchard, M.D.; Mehigh, R.J.; Cockrill, S.L.; Scott, G.B.I.; Tammen, H.; et al. HUPO Plasma Proteome Project specimen collection and handling: Towards the standardization of parameters for plasma proteome samples. Proteomics 2005, 5, 3262–3277. [Google Scholar] [CrossRef] [PubMed]
- Johnson, G.; Moore, S.W. Why has butyrylcholinesterase been retained? Structural and functional diversification in a duplicated gene. Neurochem. Int. 2012, 61, 783–797. [Google Scholar] [CrossRef] [PubMed]
- Lockridge, O. Review of human butyrylcholinesterase structure, function, genetic variants, history of use in the clinic, and potential therapeutic uses. Pharmacol. Ther. 2015, 148, 34–46. [Google Scholar] [CrossRef]
- Lockridge, O.; Masson, P. Pesticides and susceptible populations: People with butyrylcholinesterase genetic variants may be at risk. Neurotoxicology 2000, 21, 113–126. [Google Scholar]
- Masson, P.; Lockridge, O. Butyrylcholinesterase for protection from organophosphorus poisons: Catalytic complexities and hysteretic behavior. Arch. Biochem. Biophys. 2010, 494, 107–120. [Google Scholar] [CrossRef] [Green Version]
- Mattes, C.E.; Lynch, T.J.; Singh, A.; Bradley, R.M.; Kellaris, P.A.; Brady, R.O.; Dretchen, K.L. Therapeutic use of butyrylcholinesterase for cocaine intoxication. Toxicol. Appl. Pharmacol. 1997, 145, 372–380. [Google Scholar] [CrossRef]
- Sun, H.; El Yazal, J.; Lockridge, O.; Schopfer, L.M.; Brimijoin, S.; Pang, Y.P. Predicted Michaelis-Menten complexes of cocaine-butyrylcholinesterase: Engineering effective butyrylcholinesterase mutants for cocaine detoxication. J. Biol. Chem. 2001, 276, 9330–9336. [Google Scholar] [CrossRef] [PubMed] [Green Version]
- Lockridge, O.; Mottershaw-Jackson, N.; Eckerson, H.W.; La Du, B.N. Hydrolysis of diacetylmorphine (heroin) by human serum cholinesterase. J. Pharmacol. Exp. Ther. 1980, 215, 1–8. [Google Scholar]
- Reed, B.A.; Sabourin, C.L.; Lenz, D.E. Human butyrylcholinesterase efficacy against nerve agent exposure. J. Biochem. Mol. Toxicol. 2017, 31, e21886. [Google Scholar] [CrossRef]
- Jiang, W.; Murashko, E.A.; Dubrovskii, Y.A.; Podolskaya, E.P.; Babakov, V.N.; Mikler, J.; Nachon, F.; Masson, P.; Schopfer, L.M.; Lockridge, O. Matrix-assisted laser desorption/ionization time-of-flight mass spectrometry of titanium oxide-enriched peptides for detection of aged organophosphorus adducts on human butyrylcholinesterase. Anal. Biochem. 2013, 439, 132–141. [Google Scholar] [CrossRef] [PubMed]
- Mathews, T.P.; Carter, M.D.; Johnson, D.; Isenberg, S.L.; Graham, L.A.; Thomas, J.D.; Johnson, R.C. High-Confidence Qualitative Identification of Organophosphorus Nerve Agent Adducts to Human Butyrylcholinesterase. Anal. Chem. 2017, 89, 1955–1964. [Google Scholar] [CrossRef] [Green Version]
- Jasiecki, J.; Wasąg, B. Butyrylcholinesterase protein ends in the pathogenesis of Alzheimer’s disease—could BCHE genotyping be helpful in Alzheimer’s therapy? Biomolecules 2019, 9, 592. [Google Scholar] [CrossRef] [PubMed] [Green Version]
- Chen, V.P.; Gao, Y.; Geng, L.; Parks, R.J.; Pang, Y.-P.; Brimijoin, S. Plasma butyrylcholinesterase regulates ghrelin to control aggression. Proc. Natl. Acad. Sci. USA 2015, 112, 2251–2256. [Google Scholar] [CrossRef] [Green Version]
- Li, B.; Duysen, E.G.; Lockridge, O. The butyrylcholinesterase knockout mouse is obese on a high-fat diet. Chem. Biol. Interact. 2008, 175, 88–91. [Google Scholar] [CrossRef] [PubMed]
- Brimijoin, S.; Chen, V.P.; Pang, Y.P.; Geng, L.; Gao, Y. Physiological roles for butyrylcholinesterase: A BChE-ghrelin axis. Chem. Biol. Interact. 2016, 259, 271–275. [Google Scholar] [CrossRef] [Green Version]
- Darvesh, S.; Grantham, D.L.; Hopkins, D.A. Distribution of butyrylcholinesterase in the human amygdala and hippocampal formation. J. Comp. Neurol. 1998, 393, 374–390. [Google Scholar] [CrossRef]
- Darvesh, S.; Hopkins, D.A. Differential distribution of butyrylcholinesterase and acetylcholinesterase in the human thalamus. J. Comp. Neurol. 2003, 463, 25–43. [Google Scholar] [CrossRef]
- Mesulam, M.M.; Geula, C. Butyrylcholinesterase reactivity differentiates the amyloid plaques of aging from those of dementia. Ann. Neurol. 1994, 36, 722–727. [Google Scholar] [CrossRef]
- Gómez-Ramos, P.; Bouras, C.; Morán, M.A. Ultrastructural localization of butyrylcholinesterase on neurofibrillary degeneration sites in the brains of aged and Alzheimer’s disease patients. Brain Res. 1994, 640, 17–24. [Google Scholar] [CrossRef]
- Lockridge, O.; Bartels, C.F.; Vaughan, T.A.; Wong, C.K.; Norton, S.E.; Johnson, L.L. Complete amino acid sequence of human serum cholinesterase. J. Biol. Chem. 1987, 262, 549–557. [Google Scholar] [CrossRef]
- Lockridge, O.; Schopfer, L.M.; Winger, G.; Woods, J.H. Large scale purification of butyrylcholinesterase from human plasma suitable for injection into monkeys; a potential new therapeutic for protection against cocaine and nerve agent toxicity. J. Med. Chem. Biol. Radiol. Def. 2005, 3, nihms5095. [Google Scholar] [PubMed]
- Scott, E.M.; Powers, R.F. Human serum cholinesterase, a tetramer. Nat. New Biol. 1972, 236, 83–84. [Google Scholar] [CrossRef] [PubMed]
- Leung, M.R.; van Bezouwen, L.S.; Schopfer, L.M.; Sussman, J.L.; Silman, I.; Lockridge, O.; Zeev-Ben-Mordehai, T. Cryo-EM structure of the native butyrylcholinesterase tetramer reveals a dimer of dimers stabilized by a superhelical assembly. Proc. Natl. Acad. Sci. USA 2018, 115, 13270–13275. [Google Scholar] [CrossRef] [PubMed] [Green Version]
- Boyko, K.M.; Baymukhametov, T.N.; Chesnokov, Y.M.; Hons, M.; Lushchekina, S.V.; Konarev, P.V.; Lipkin, A.V.; Vasiliev, A.L.; Masson, P.; Popov, V.O.; et al. 3D structure of the natural tetrameric form of human butyrylcholinesterase as revealed by cryoEM, SAXS and MD. Biochimie 2019, 156, 196–205. [Google Scholar] [CrossRef]
- Li, H.; Schopfer, L.M.; Masson, P.; Lockridge, O. Lamellipodin proline rich peptides associated with native plasma butyrylcholinesterase tetramers. Biochem. J. 2008, 411, 425–432. [Google Scholar] [CrossRef] [PubMed]
- Feng, G.; Krejci, E.; Molgo, J.; Cunningham, J.M.; Massoulié, J.; Sanes, J.R. Genetic analysis of collagen Q: Roles in acetylcholinesterase and butyrylcholinesterase assembly and in synaptic structure and function. J. Cell Biol. 1999, 144, 1349–1360. [Google Scholar] [CrossRef] [Green Version]
- Massoulié, J. The origin of the molecular diversity and functional anchoring of cholinesterases. NeuroSignals 2002, 11, 130–143. [Google Scholar] [CrossRef]
- Darvesh, S.; Hopkins, D.A.; Geula, C. Neurobiology of butyrylcholinesterase. Nat. Rev. Neurosci. 2003, 4, 131–138. [Google Scholar] [CrossRef]
- García-Ayllón, M.S.; Sáez-Valero, J.; Muoz-Delgado, E.; Vidal, C.J. Identification of hybrid cholinesterase forms consisting of acetyl- and butyrylcholinesterase subunits in human glioma. Neuroscience 2001, 107, 199–208. [Google Scholar] [CrossRef]
- Chen, V.P.; Luk, W.K.W.; Chan, W.K.B.; Leung, K.W.; Guo, A.J.Y.; Chan, G.K.L.; Xu, S.L.; Choi, R.C.Y.; Tsim, K.W.K. Molecular Assembly and Biosynthesis of Acetylcholinesterase in Brain and Muscle: The Roles of t-peptide, FHB Domain, and N-linked Glycosylation. Front. Mol. Neurosci. 2011, 4, 36. [Google Scholar] [CrossRef] [PubMed] [Green Version]
- Jońca, J.; Zuk, M.; Wasag, B.; Janaszak-Jasiecka, A.; Lewandowski, K.; Wielgomas, B.; Waleron, K.; Jasiecki, J. New insights into butyrylcholinesterase activity assay: Serum dilution factor as a crucial parameter. PLoS ONE 2015, 10, e0139480. [Google Scholar] [CrossRef]
- Onder, S.; David, E.; Tacal, O.; Schopfer, L.M.; Lockridge, O. Hupresin Retains Binding Capacity for Butyrylcholinesterase and Acetylcholinesterase after Sanitation with Sodium Hydroxide. Front. Pharmacol. 2017, 8, 713. [Google Scholar] [CrossRef] [PubMed] [Green Version]
- Ryhänen, R.J.; Jauhianen, M.S.; Laitinen, M.V.; Puhakainen, E.V. The relationships between human serum pseudocholinesterase, lipoproteins, and apolipoproteins (APOHDL). Biochem. Med. 1982, 28, 241–245. [Google Scholar] [CrossRef]
- von Eckardstein, A.; Kardassis, D. High Density Lipoproteins. In Handbook of Experimental Pharmacology; von Eckardstein, A., Kardassis, D., Eds.; Springer International Publishing: Cham, Switzerland, 2015; Volume 224, ISBN 978-3-319-09664-3. [Google Scholar]
- Kakafika, A.I.; Xenofontos, S.; Tsimihodimos, V.; Tambaki, A.P.; Lourida, E.S.; Kalaitzidis, R.; Cariolou, M.A.; Elisaf, M.; Tselepis, A.D. The PON1 M55L gene polymorphism is associated with reduced HDL-associated PAF-AH activity. J. Lipid Res. 2003, 44, 1919–1926. [Google Scholar] [CrossRef] [Green Version]
- De Oliveira e Silva, E.R.; Kong, M.; Han, Z.; Starr, C.; Kass, E.M.; Juo, S.H.; Foster, D.; Dansky, H.M.; Merkel, M.; Cundey, K.; et al. Metabolic and genetic determinants of HDL metabolism and hepatic lipase activity in normolipidemic females. J. Lipid Res. 1999, 40, 1211–1221. [Google Scholar] [CrossRef]
- Sorenson, R.C.; Bisgaier, C.L.; Aviram, M.; Hsu, C.; Billecke, S.; La Du, B.N. Human serum Paraoxonase/Arylesterase’s retained hydrophobic N-terminal leader sequence associates with HDLs by binding phospholipids : Apolipoprotein A-I stabilizes activity. Arterioscler. Thromb. Vasc. Biol. 1999, 19, 2214–2225. [Google Scholar] [CrossRef] [Green Version]
- Chapman, M.J.; Goldstein, S.; Lagrange, D.; Laplaud, P.M. A density gradient ultracentrifugal procedure for the isolation of the major lipoprotein classes from human serum. J. Lipid Res. 1981, 22, 339–358. [Google Scholar] [CrossRef]
- Graham, J.M.; Higgins, J.A.; Gillott, T.; Taylor, T.; Wilkinson, J.; Ford, T.; Billington, D. A novel method for the rapid separation of plasma lipoproteins using self-generating gradients of iodixanol. Atherosclerosis 1996, 124, 125–135. [Google Scholar] [CrossRef]
- Foster, E.M.; Dangla-Valls, A.; Lovestone, S.; Ribe, E.M.; Buckley, N.J. Clusterin in Alzheimer’s Disease: Mechanisms, Genetics, and Lessons From Other Pathologies. Front. Neurosci. 2019, 13, 164. [Google Scholar] [CrossRef] [PubMed] [Green Version]
- Schvartz, I.; Seger, D.; Shaltiel, S. Vitronectin. Int. J. Biochem. Cell Biol. 1999, 31, 539–544. [Google Scholar] [CrossRef]
- Neufeld, E.B.; Remaley, A.T.; Demosky, S.J.; Stonik, J.A.; Cooney, A.M.; Comly, M.; Dwyer, N.K.; Zhang, M.; Blanchette-Mackie, J.; Santamarina-Fojo, S.; et al. Cellular localization and trafficking of the human ABCA1 transporter. J. Biol. Chem. 2001, 276, 27584–27590. [Google Scholar] [CrossRef] [PubMed] [Green Version]
- Neufeld, E.B.; Stonik, J.A.; Demosky, S.J.J.; Knapper, C.L.; Combs, C.A.; Cooney, A.; Comly, M.; Dwyer, N.; Blanchette-Mackie, J.; Remaley, A.T.; et al. The ABCA1 transporter modulates late endocytic trafficking: Insights from the correction of the genetic defect in Tangier disease. J. Biol. Chem. 2004, 279, 15571–15578. [Google Scholar] [CrossRef] [Green Version]
- Jasiecki, J.; Limon-Sztencel, A.; Żuk, M.; Chmara, M.; Cysewski, D.; Limon, J.; Wasąg, B. Synergy between the alteration in the N-terminal region of butyrylcholinesterase K variant and apolipoprotein E4 in late-onset Alzheimer’s disease. Sci. Rep. 2019, 9, 1–7. [Google Scholar] [CrossRef]
- Kim, J.; Gee, H.Y.; Lee, M.G. Unconventional protein secretion–new insights into the pathogenesis and therapeutic targets of human diseases. J. Cell Sci. 2018, 131, jcs213686. [Google Scholar] [CrossRef] [PubMed] [Green Version]


Publisher’s Note: MDPI stays neutral with regard to jurisdictional claims in published maps and institutional affiliations. |
© 2021 by the authors. Licensee MDPI, Basel, Switzerland. This article is an open access article distributed under the terms and conditions of the Creative Commons Attribution (CC BY) license (https://creativecommons.org/licenses/by/4.0/).
Share and Cite
Jasiecki, J.; Szczoczarz, A.; Cysewski, D.; Lewandowski, K.; Skowron, P.; Waleron, K.; Wasąg, B. Butyrylcholinesterase–Protein Interactions in Human Serum. Int. J. Mol. Sci. 2021, 22, 10662. https://doi.org/10.3390/ijms221910662
Jasiecki J, Szczoczarz A, Cysewski D, Lewandowski K, Skowron P, Waleron K, Wasąg B. Butyrylcholinesterase–Protein Interactions in Human Serum. International Journal of Molecular Sciences. 2021; 22(19):10662. https://doi.org/10.3390/ijms221910662
Chicago/Turabian StyleJasiecki, Jacek, Anna Szczoczarz, Dominik Cysewski, Krzysztof Lewandowski, Piotr Skowron, Krzysztof Waleron, and Bartosz Wasąg. 2021. "Butyrylcholinesterase–Protein Interactions in Human Serum" International Journal of Molecular Sciences 22, no. 19: 10662. https://doi.org/10.3390/ijms221910662