Article

Modulation of Phosphate Deficiency-Induced Metabolic Changes by Iron Availability in Arabidopsis thaliana

1
Department of Molecular Signal Processing, Leibniz Institute of Plant Biochemistry, Weinberg 3, D-06120 Halle, Germany
2
Synergy Research Group Bioinformatics & Scientific Data, Leibniz Institute of Plant Biochemistry, Weinberg 3, D-06120 Halle, Germany
3
German Centre for Integrative Biodiversity Research (iDiv) Halle-Jena- Leipzig, Deutscher Platz 5e, D-04103 Leipzig, Germany
4
Department of Plant Science, University of California-Davis, Davis, CA 95616, USA
*
Author to whom correspondence should be addressed.
Int. J. Mol. Sci. 2021, 22(14), 7609; https://doi.org/10.3390/ijms22147609
Submission received: 7 July 2021 / Revised: 14 July 2021 / Accepted: 15 July 2021 / Published: 16 July 2021

Abstract

:
Concurrent suboptimal supply of several nutrients requires the coordination of nutrient-specific transcriptional, phenotypic, and metabolic changes in plants in order to optimize growth and development in most agricultural and natural ecosystems. Phosphate (Pi) and iron (Fe) deficiency induce overlapping but mostly opposing transcriptional and root growth responses in Arabidopsis thaliana. On the metabolite level, Pi deficiency negatively modulates Fe deficiency-induced coumarin accumulation, which is controlled by Fe as well as Pi deficiency response regulators. Here, we report the impact of Fe availability on seedling growth under Pi limiting conditions and on Pi deficiency-induced accumulation of amino acids and organic acids, which play important roles in Pi use efficiency. Fe deficiency in Pi replete conditions hardly changed growth and metabolite profiles in roots and shoots of Arabidopsis thaliana, but partially rescued growth under conditions of Pi starvation and severely modulated Pi deficiency-induced metabolic adjustments. Analysis of T-DNA insertion lines revealed the concerted coordination of metabolic profiles by regulators of Fe (FIT, bHLH104, BRUTUS, PYE) as well as of Pi (SPX1, PHR1, PHL1, bHLH32) starvation responses. The results show the interdependency of Pi and Fe availability and the interplay between Pi and Fe starvation signaling on the generation of plant metabolite profiles.

1. Introduction

Plant growth and development strongly depends on the availability of nutrients in agricultural and natural ecosystems. The efficiency with which plants utilize a certain nutrient is determined by the supply of a well-balanced ratio of several nutrients. Therefore, an increasing number of studies investigate the coordination of plant responses to nutrient ratios in order to elucidate the molecular components, which ensures optimal provision with all required nutrients under conditions of changing nutrient supply [1]. For example, phosphate deficiency regulators were shown to play an important role in the integration of phosphate and nitrate nutritional signals [2,3]. Phosphate deficiency regulators are also involved in the control of homeostasis of other macronutrients and of metals, such as sulfur and zinc, respectively [4].
Phosphorus possesses crucial roles in energy and nucleotide metabolism and as a constituent of membranes. It is taken up by the plant in the form of inorganic phosphate (Pi, H2PO4 or HPO42−) by epidermal and cortical cells of the roots and transferred to the xylem for translocation to the shoots, a process which is mediated by PHO 1 (PHOSPHATE1) in Arabidopsis thaliana [5,6,7]. Pi deficiency leads to profound phenotypic changes such as decreased shoot weight and increased root to shoot ratios, which are accompanied by reprogramming of cellular metabolism, such as the substitution of phospholipids by sulfolipids or the hyper-accumulation of starch. In addition, Pi uptake is optimized by increased expression of root Pi transporters and increased exudation of Pi solubilizing compounds, such as phosphatases, to release Pi organically bound to the rhizosphere. These adjustments are defined as systemic Pi deficiency responses [8]. Several factors mediating systemic Pi deficiency responses have been identified in recent years. The MYB transcription factors PHR1 (phosphate starvation response 1) and PHL (phosphate starvation response like) together with SPX proteins (named after SYG1 [supressor of yeast gpa1], PHO81 [CDK inhibitor in the yeast PHO pathway] and XPR1 [xenotropic and polytropic retrovirus receptor]) regulate the majority of Pi deficiency responses [2,9,10,11]. Under conditions of Pi sufficiency, the formation of complexes between SPX proteins and PHR1 or PHL proteins is promoted by Pi or phosphorylated compounds such as inositolphosphates, and prevents PHR1 or PHL from binding to the promoters of Pi deficiency response genes, thereby suppressing the induction of Pi starvation responses under conditions of Pi sufficiency [12,13,14]. Under Pi limiting conditions, decreasing levels of Pi or phosphorylated compounds lead to reduced formation of SPX-PHR1 and SPX-PHL complexes and the degradation of SPX proteins, enabling PHR1 and PHL binding to their target promoters and initiation of Pi deficiency responses. The basic helix-loop-helix type transcription factor bHLH32 was identified as a negative regulator of a subset of systemic Pi deficiency responses [15]. This factor was also shown to negatively regulate root hair formation in response to Pi starvation, indicating a role of bHLH32 in local Pi deficiency-responses: profound Pi deficiency-induced alterations in root system architecture resulting in increased formation of lateral roots and root hairs and in inhibition of primary root growth [16,17].
In dicotyledonous plants, Fe3+, the major form of iron in the soil, is first reduced and then taken up by the plant as Fe2+. Major phenotypic signs of Fe deficiency are yellowing of leaves provoked by chlorophyll loss and increased number of root hairs [18,19,20]. On the cellular level, there is a massive reprogramming of transcription, mainly of genes involved in iron uptake, distribution, and storage. Additionally, metabolic pathways leading to the production and exudation of Fe solubilizing compounds, such as malate, citrate, and coumarins, are induced [21,22,23,24,25,26,27,28]. These responses are activated by a complex multilayered regulatory network involving several bHLH type transcription factors. FIT (fer-like iron deficiency-induced transcription factor, bHLH29; [29,30] interacts with several subgroup Ib bHLH proteins [31], which, amongst others, are under the control of bHLH104 [20,32]. BHLH104 is also involved in the activation of PYE (popeye, bHLH47; [20,33]), which regulates several FIT-independent Fe deficiency responses. Furthermore, the protein level of bHLH104 is negatively regulated by BRUTUS (BTS), an E3 ligase containing a Fe binding hemerythrin domain, which relays the Fe status to the FIT-independent signal transduction network [20,34].
The regulatory networks controlling Pi or Fe deficiency responses have been comprehensively studied by comparing transcript profiles and phenotypes of WT plants and mutants with impaired expression of Pi and Fe deficiency response regulators. In contrast, there are only a few reports analyzing the contribution of Pi or Fe deficiency response regulators to Pi or Fe deficiency-induced metabolic changes. The comprehensive metabolite profiling study by Pant et al. [35] showed that Pi deficiency-induced accumulation of most metabolites was reduced in phr1 mutants. However, the contribution of other Pi deficiency response regulators, such as PHL, SPX, or bHLH32 to metabolic adjustments has not been reported so far. In contrast to the broad metabolite profiling studies performed in the context of Pi deficiency [35,36], reports on metabolic changes in response to Fe deficiency are mainly restricted to the analysis of a few selected metabolites, such as malate, citrate, and coumarins [26]. Fe deficiency-induced accumulation of these compounds was shown to be mainly regulated by FIT, but the contribution of other Fe deficiency response regulators in this process has hardly been investigated. Only recently, Chutia et al. [37] analyzed the role of bHLH104, BRUTUS, and PYE in the formation of coumarin profiles in response to nutrient deficiencies.
Phosporus and iron form strong complexes, thereby limiting each others bioavailability. Especially under acid soil conditions, plant Fe content is increased with decreased Pi availability [38], suggesting that plant responses to Pi and Fe availability need to be coordinated. Considering the local Pi deficiency response, modulation of Pi deficiency-induced changes in root system architecture by Fe availability is well documented [16,17,39]. As such, Pi deficiency-induced inhibition of primary root growth and increased formation of lateral roots are strongly alleviated in the absence of Fe. Furthermore, the expression of many genes is regulated in an opposite manner by Fe and Pi deficiency and the promoters of many genes involved in Fe homeostasis contain the phosphate responsive P1BS (PHR1 binding sequence) domain [40]. On the metabolite level, Fe and Pi deficiency have opposite effects on coumarin accumulation in roots and their exudation into the rhizosphere [28,41], and Fe deficiency-induced accumulation of coumarins is suppressed by concomitant Pi deficiency [37]. However, effects of Fe availability on systemic Pi deficiency responses, such as shoot growth or root to shoot ratios or Pi deficiency-induced metabolic changes, which mainly affects metabolites in primary metabolism, have not been investigated so far.
In this study, we investigate shoot and root growth as well as metabolic changes in roots and shoots of Arabidopsis thaliana plants subjected to individual and combined Pi or Fe deficiencies. Since we were interested in the impact of Fe deficiency on systemic Pi deficiency responses, we focused our analysis on amino acids and organic acids levels. Phenotypic and metabolic responses of mutants were also investigated in order to assess the role of several Pi and Fe deficiency response regulators in the interdependent control of growth responses and of metabolite profiles by Pi and Fe availability.

2. Results

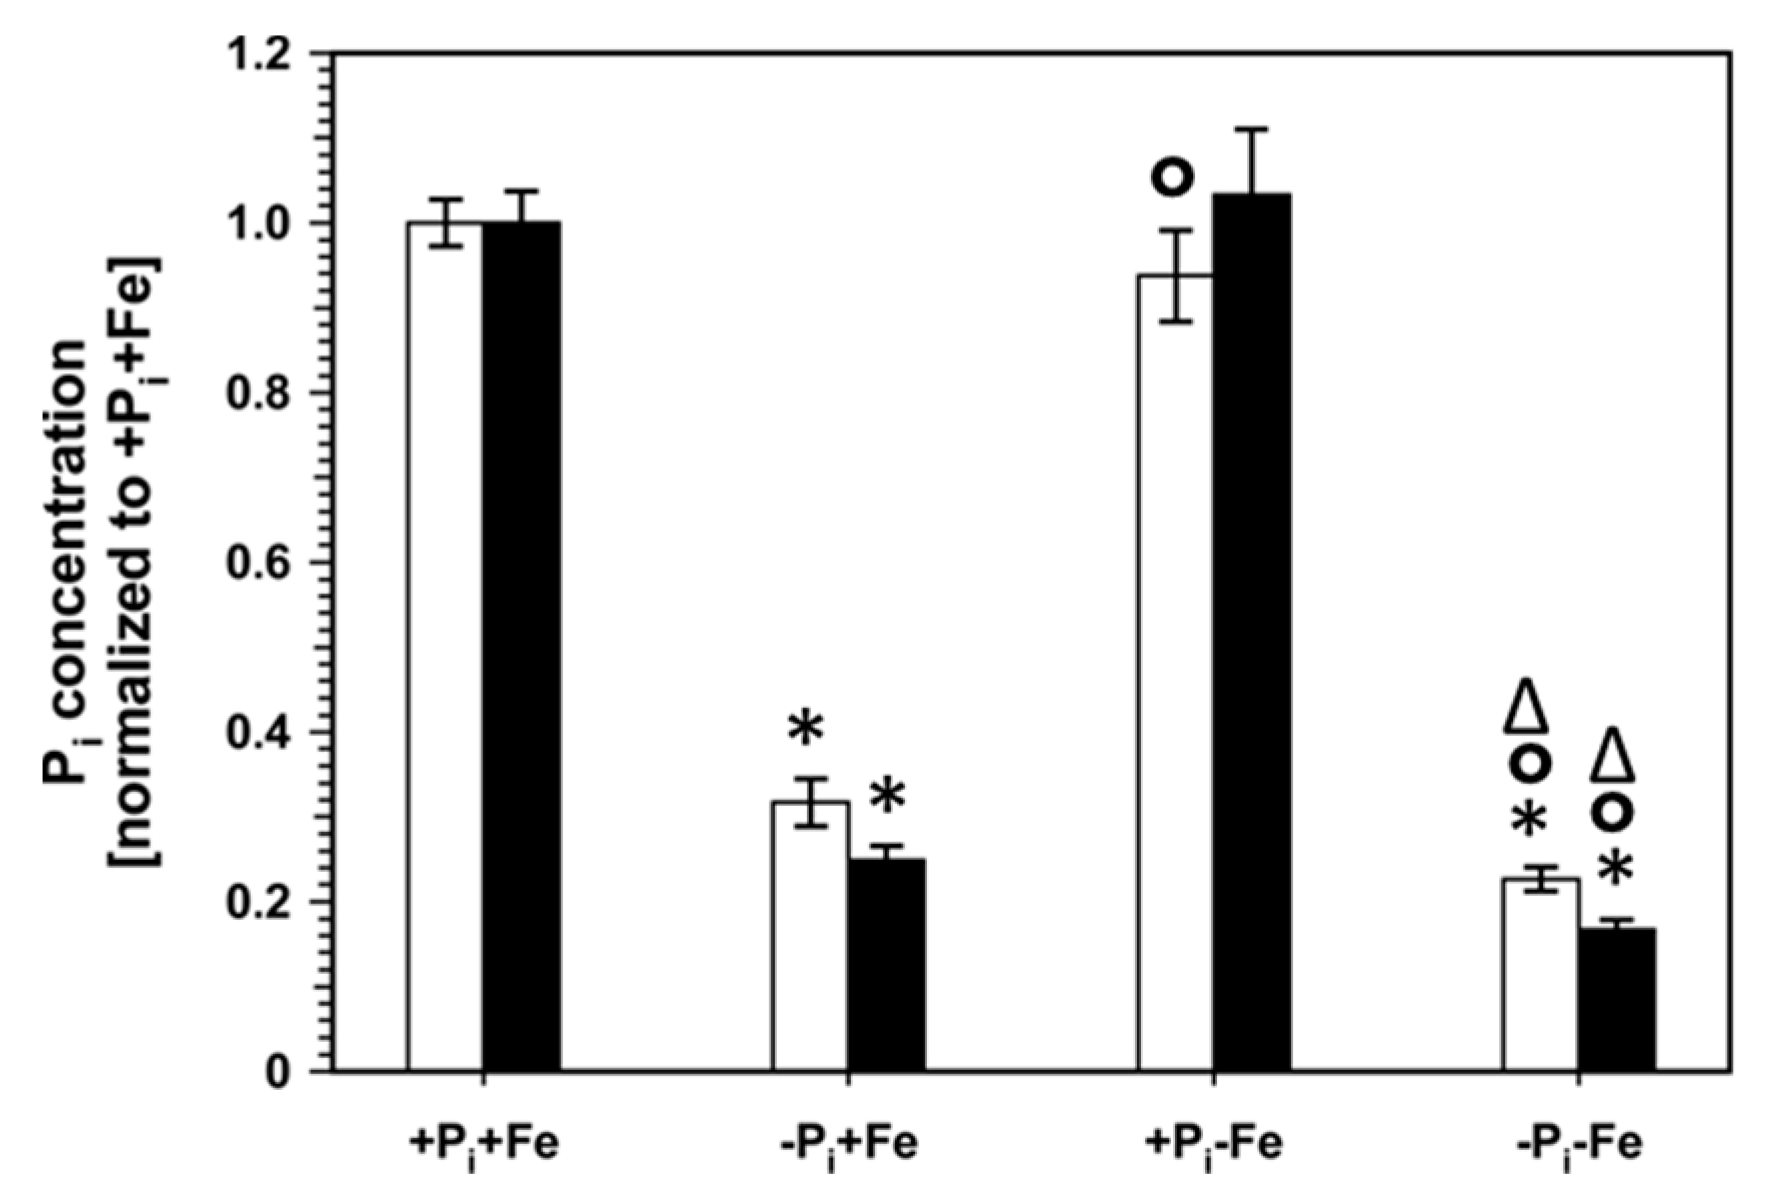
2.1. Phenotypic Changes of Col-0 Seedlings after Pi, Fe, and Combined Pi and Fe Deficiency

Six days after transfer from nutrient sufficient conditions to Pi limitation, Col-0 seedlings exhibited the typical systemic Pi deficiency response exemplified by decreased root, shoot, and seedling fresh weights as well as increased root to shoot ratios, whereas transfer to Fe deficient conditions did not result in any changes in these growth parameters (Figure 1, Dataset S1). Exposure of seedlings to Pi deficiency in the absence of Fe resulted in decreased shoot and seedling fresh weights and increased root to shoot ratios compared to seedlings grown under nutrient sufficient conditions. However, fresh weights and root to shoot ratios were significantly (p < 0.01) higher compared to seedlings transferred to Pi deficient conditions in the presence of Fe, indicating a positive effect of low Fe availability on seedling growth under conditions of suboptimal Pi availability.

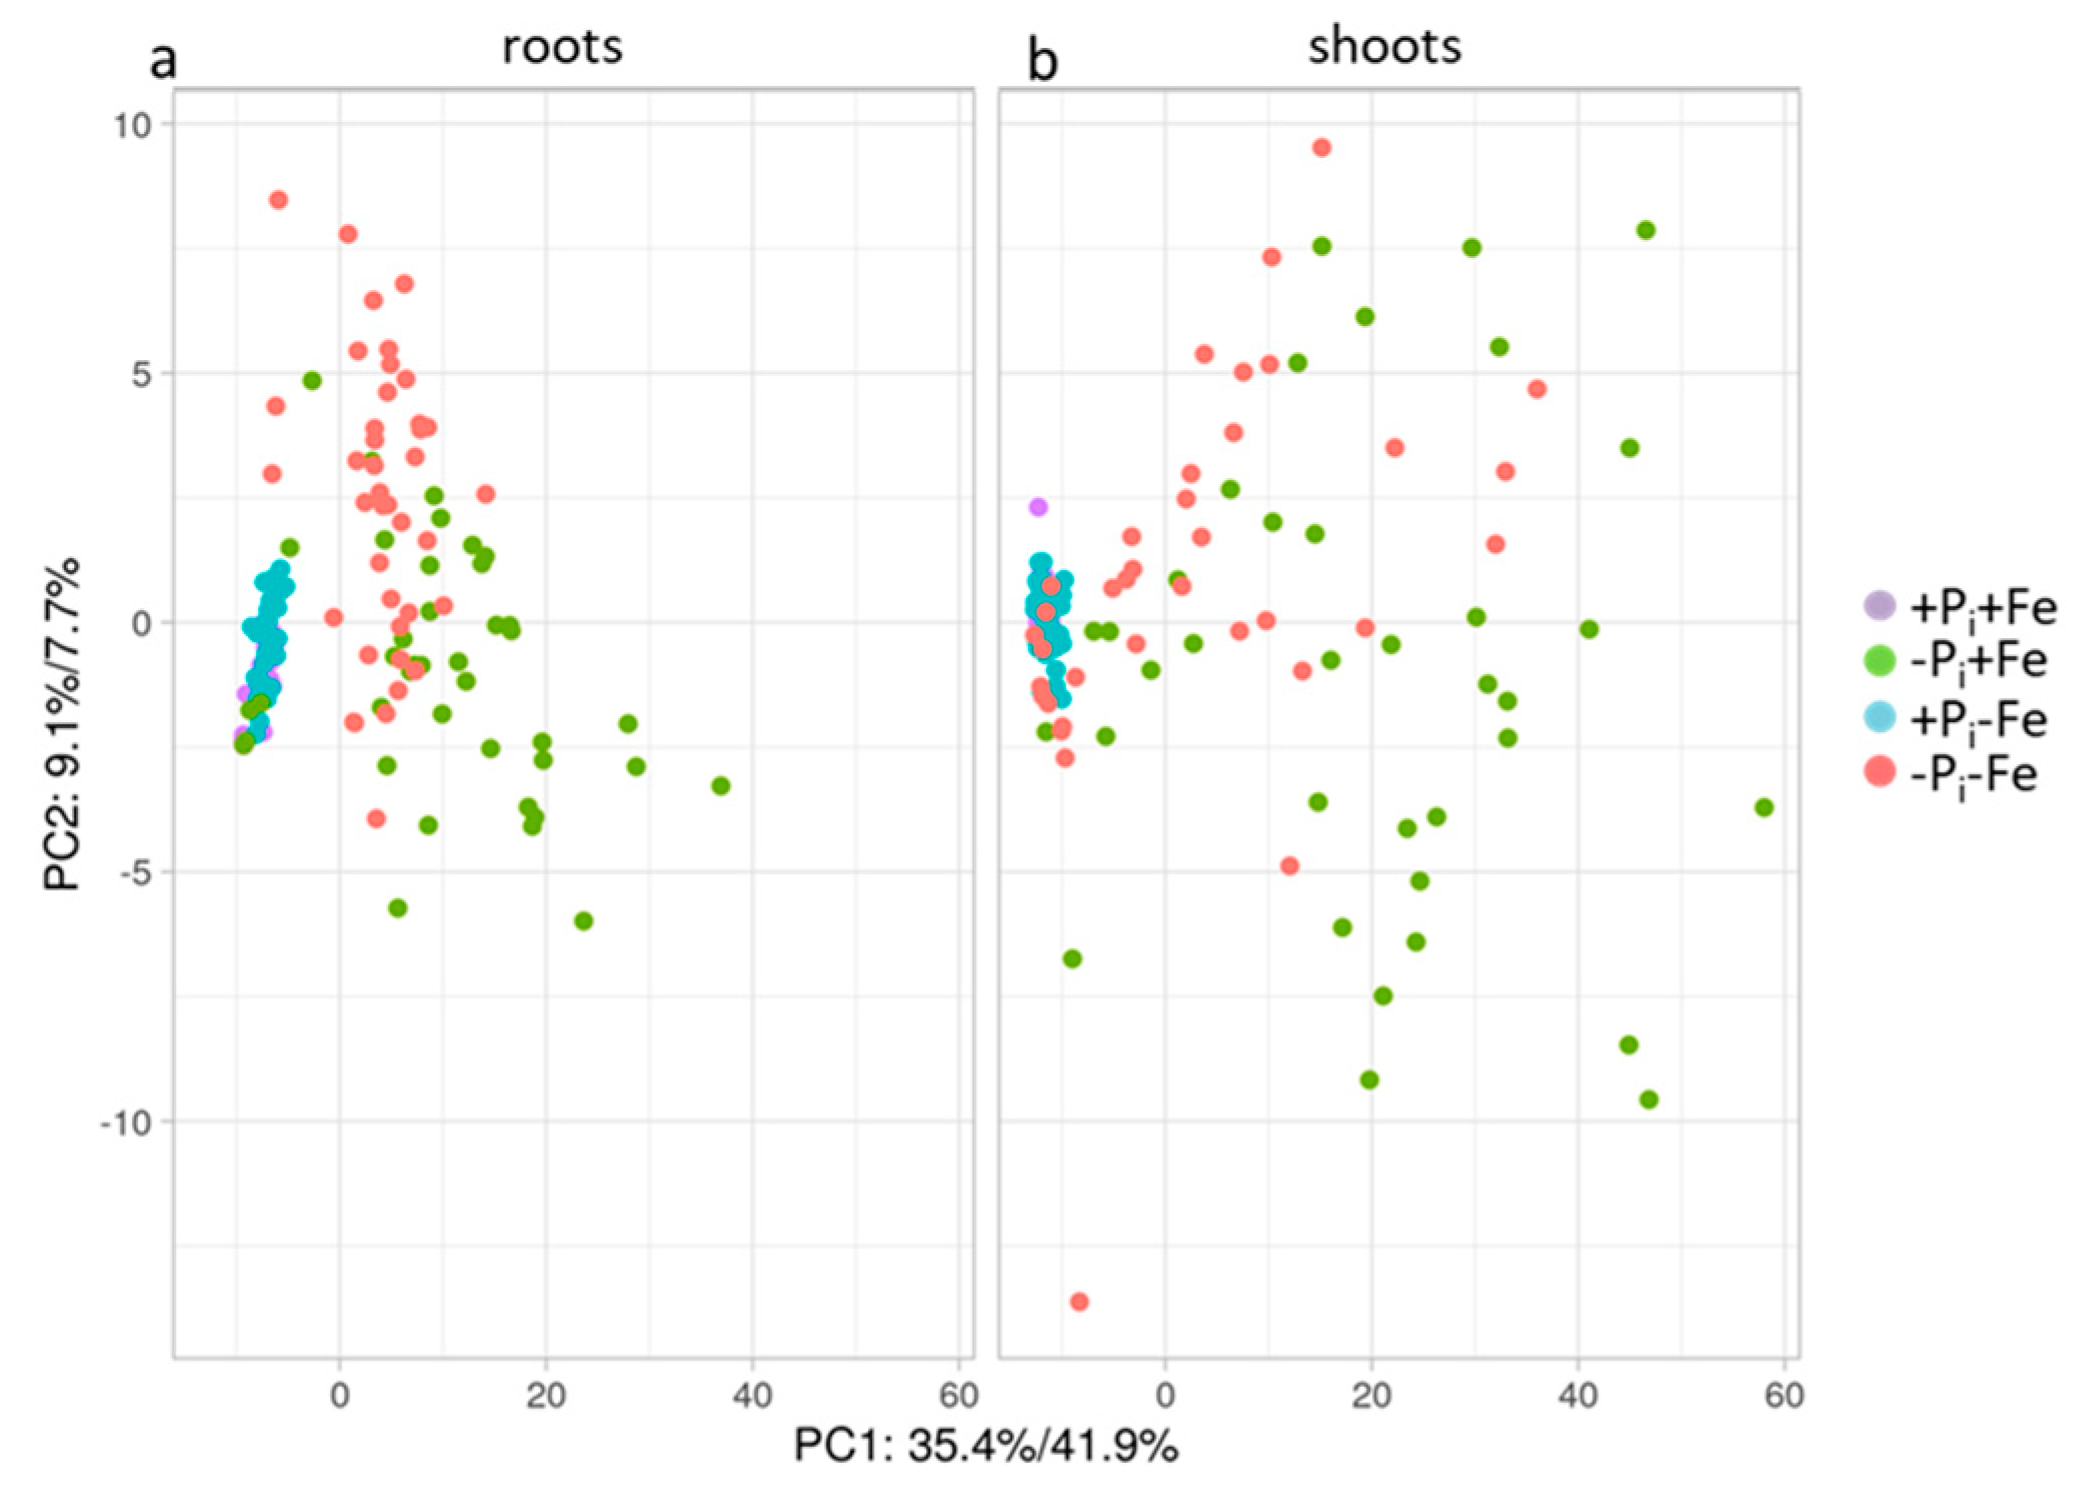
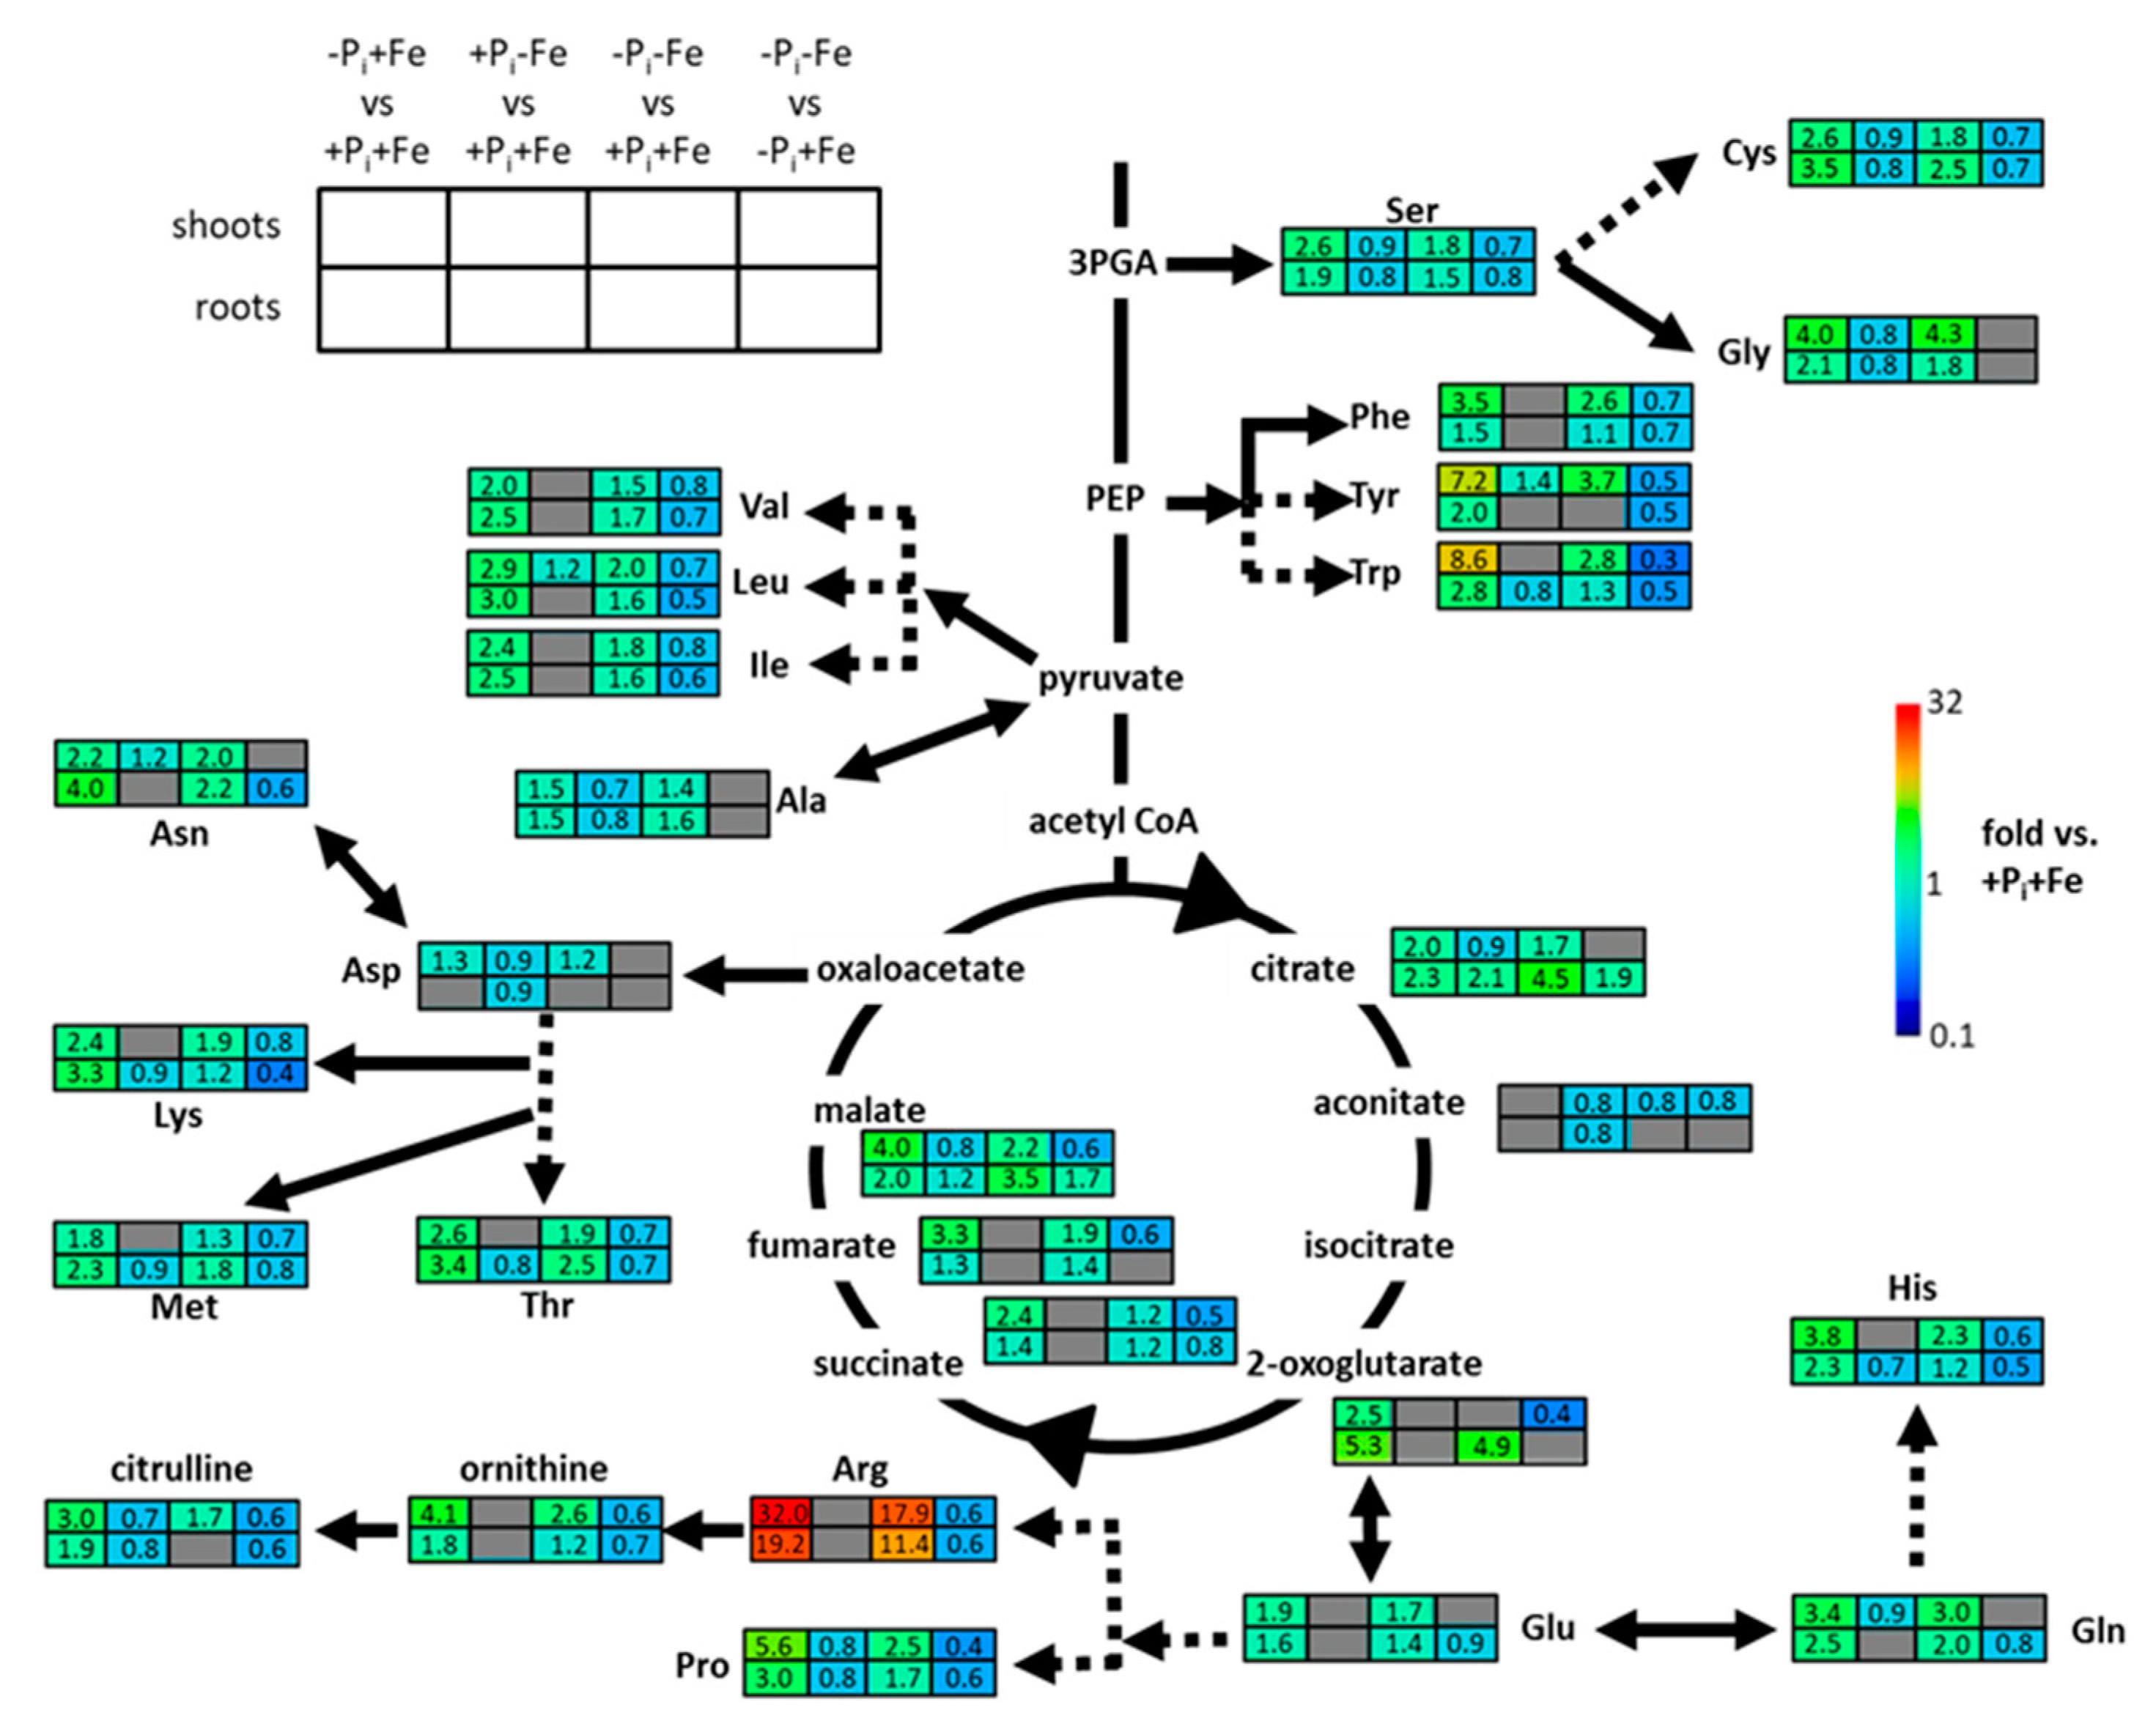
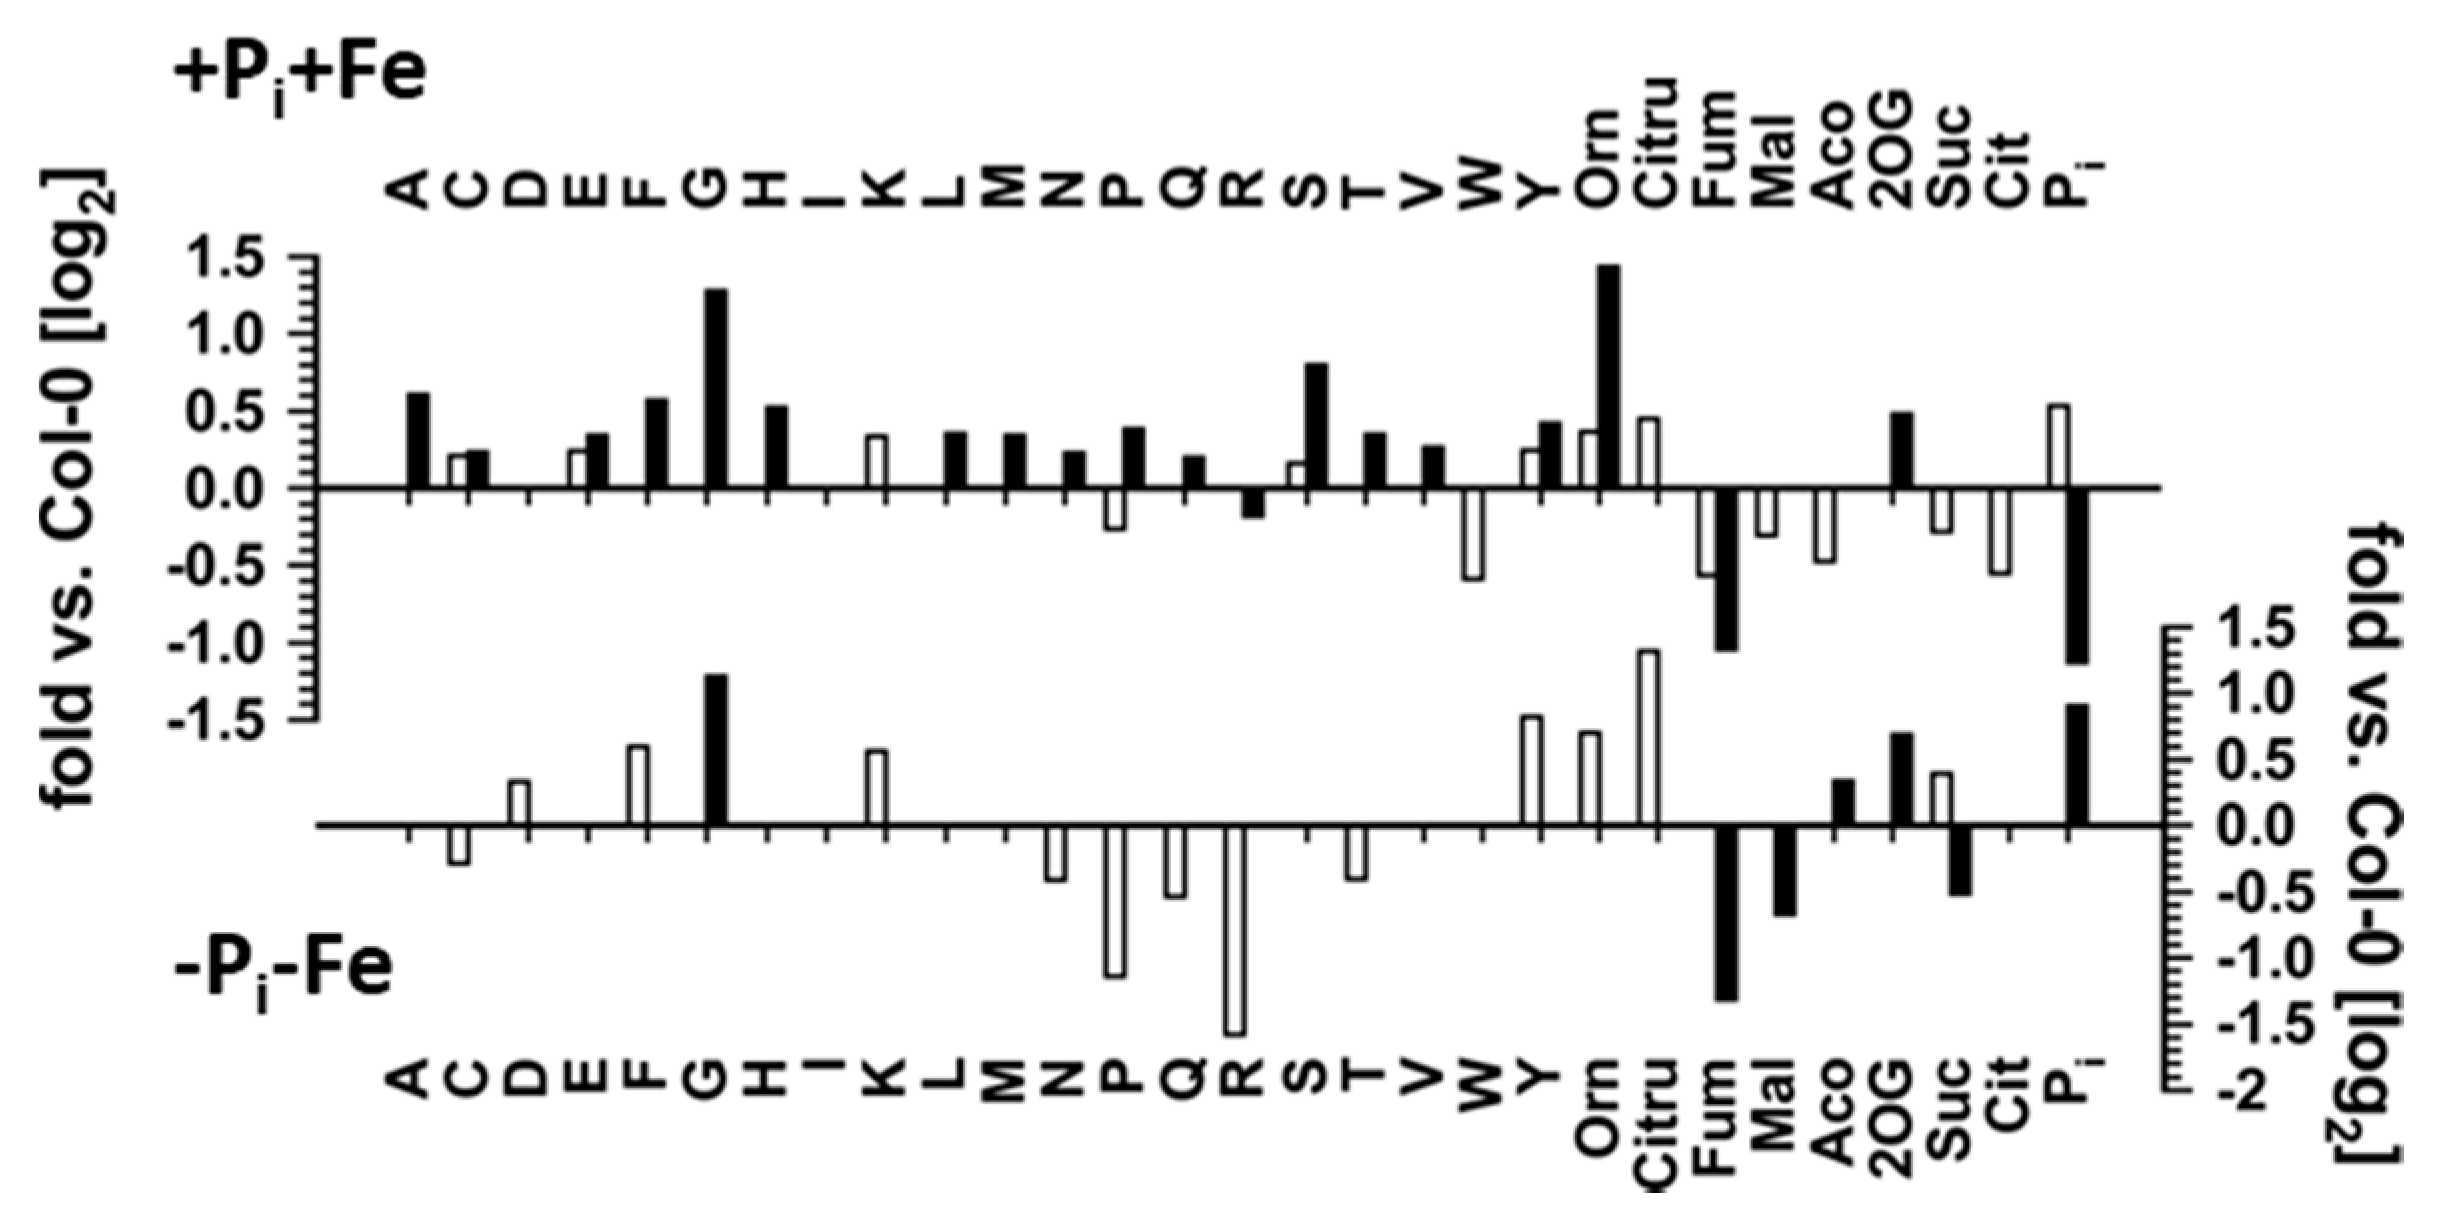
2.2. Metabolic Changes in Col-0 Seedlings after Pi, Fe, and Combined Pi and Fe Deficiency

In order to reveal whether the attenuation of the systemic Pi deficiency growth response under Fe deficient conditions also affects systemic Pi deficiency-induced metabolic changes, the concentrations of amino acids and organic acids in roots and shoots after treatment of Col-0 seedlings exposed to Pi, Fe, and combined Pi and Fe deficiency (−Pi+Fe, +Pi−Fe, −Pi−Fe, respectively) were analyzed. Principle component (PCA) analysis revealed a clear separation of samples exposed to Pi deficiency from samples transferred to nutrient sufficient conditions (Figure 2, Datafile S1).
Pi deficiency treatment (−Pi+Fe) resulted in increased levels of almost all analytes (Figure 3, Dataset S3). On average, these changes were more pronounced in shoots compared to roots, and were most prominent for amino acids containing one or more nitrogen atoms in their side chains, such as arginine, which accumulated 19- and 32-fold in roots and shoots, respectively. In contrast to Pi deficiency (−Pi+Fe), Fe deficiency (+Pi−Fe) only marginally influenced metabolite levels in roots and shoots compared to untreated plants (+Pi+Fe), as can be seen by an almost complete overlap in the PCA score plots (Figure 2). Fe deficiency-induced changes were very moderate with respect to the number of metabolites which exhibited significant (p ≤ 0.05; Student’s t-test, two tailed, equal variances) changes (about 50% of all analytes) as well as with respect to the extent of changes (Figure 3, Dataset S3). The majority of analytes showing significant changes upon Fe deficiency exhibited slightly decreased levels by about 20%. Asparagine, leucine, and tyrosine in shoots as well as malate and citrate in roots represented the only metabolites displaying Fe deficiency-induced accumulation (Figure 3, Dataset S3).
The PCA score plots further revealed separation of samples subjected to Pi deficiency in the presence of Fe (−Pi+Fe) from samples exposed to Pi deficiency in the absence of Fe (−Pi−Fe, Figure 2). This was more evident in roots compared to shoots. The plots also indicate that the metabolite profiles of samples treated with combined Pi and Fe deficiency (−Pi−Fe) were more similar to untreated (+Pi+Fe) and −Fe treated (+Pi−Fe) samples than to the metabolite profiles of samples exposed to Pi deficiency (−Pi+Fe). This was due to the reduction of Pi deficiency-induced amino acid levels by Fe deficiency, and was observed for all amino acids with the exception of alanine and glycine in roots and alanine, aspartate, asparagine, glycine, glutamate, and glutamine in shoots (Figure 3, Dataset S3).
On average, Fe deficiency reduced Pi deficiency-induced amino acids levels by 30%. We also observed the trend that the negative effects of Fe deficiency were more pronounced for amino acids that exhibited strong Pi deficiency-induced accumulation, especially in shoots. Interestingly, of all analyzed metabolites, only malate and citrate further accumulated in response to combined Fe and Pi deficiency compared to either Fe or Pi deficiency alone. However, this could only be observed in roots.

2.3. Correlation between Metabolite Profiles and Pi Content

These results indicate overlapping and mostly opposing effects of Fe and Pi nutrition on seedling growth and primary metabolite content. The attenuation of Pi deficiency-induced responses by Fe limitation could be due to increased tissue Pi levels, which would suppress systemic Pi starvation responses. As seen in Figure 4 (Dataset S3), Fe deficiency did not change endogenous Pi levels in plants in the presence of Pi.
However, the reduced tissue Pi content observed after Pi deficiency was even further diminished by about 30% in roots and shoots under conditions of combined Pi and Fe deficiency. This suggests that the alleviation of Pi deficiency-induced growth inhibition by concomitant Fe limitation and the negative effect of decreased Fe availability on the accumulation of most metabolites by Pi deficiency occur independently from the endogenous Pi status of the plants. In order to verify this suggestion, mutants with impaired pho1 expression, which exhibit an aberrant Pi distribution between roots and shoots [5,6,7] were analyzed (Figure 5, Datasets S4 and S5). As expected, pho1 plants exhibited lower and higher Pi content in shoots and roots, respectively, under conditions of Pi sufficiency. Accordingly, it was expected that metabolite levels in pho1 plants are higher in shoots and lower in roots compared to Col-0 plants. This was observed for most metabolites in shoots. In roots, however, the content of only half of the analytes was affected, and only organic acids levels exhibited the expected decrease, whereas the levels of most amino acids showing significant changes (p ≤ 0.05; Student’s t-test, two tailed, equal variances) between pho1 and Col-0 actually increased. Under combined Pi and Fe deficiency (−Pi−Fe), root Pi content was indistinguishable between Col-0 and pho1 plants. However, pho1 roots exhibited several alterations in metabolite levels. Most prominently, arginine and proline content was decreased by more than 50%, whereas citrulline levels more than doubled (Figure 5, Datasets S4 and S5).
Under conditions of combined deficiency (−Pi−Fe), shoot Pi content of pho1 plants was significantly higher compared to Col-0 plants. Accordingly, lower metabolite levels could have been expected. However, this only applied to some organic acids, such as fumarate, malate, and succinate, whereas no effect on amino acid levels was observed with the exception of glycine, which exhibited two-fold higher levels in pho1 shoots compared to Col-0 shoots.
Pho1 seedlings consistently exhibited lower tissue fresh weights compared to Col-0, even if increased tissue Pi concentrations were recorded. As such, root fresh weights were lower compared to Col-0 despite higher root Pi concentrations, and, although pho1 seedlings exposed to combined Pi and Fe deficiency exhibited almost two-fold increased shoot Pi levels compared to Col-0, they exhibited reduced shoot fresh weights (Figure 6, Dataset S6).
These results show that Pi deficiency results in comprehensive changes of plant growth and in metabolite profiles, and that these changes are strongly modulated by Fe availability. However, these modulations seem to be largely independent of internal Pi levels, suggesting regulation by additional, Pi-independent factors. In order to possibly identify these additional factors, we analyzed the contribution of several known Pi and Fe deficiency response regulators in the changes of seedling growth and in the generation of metabolites profiles induced by Pi, Fe and combined Pi and Fe deficiency.

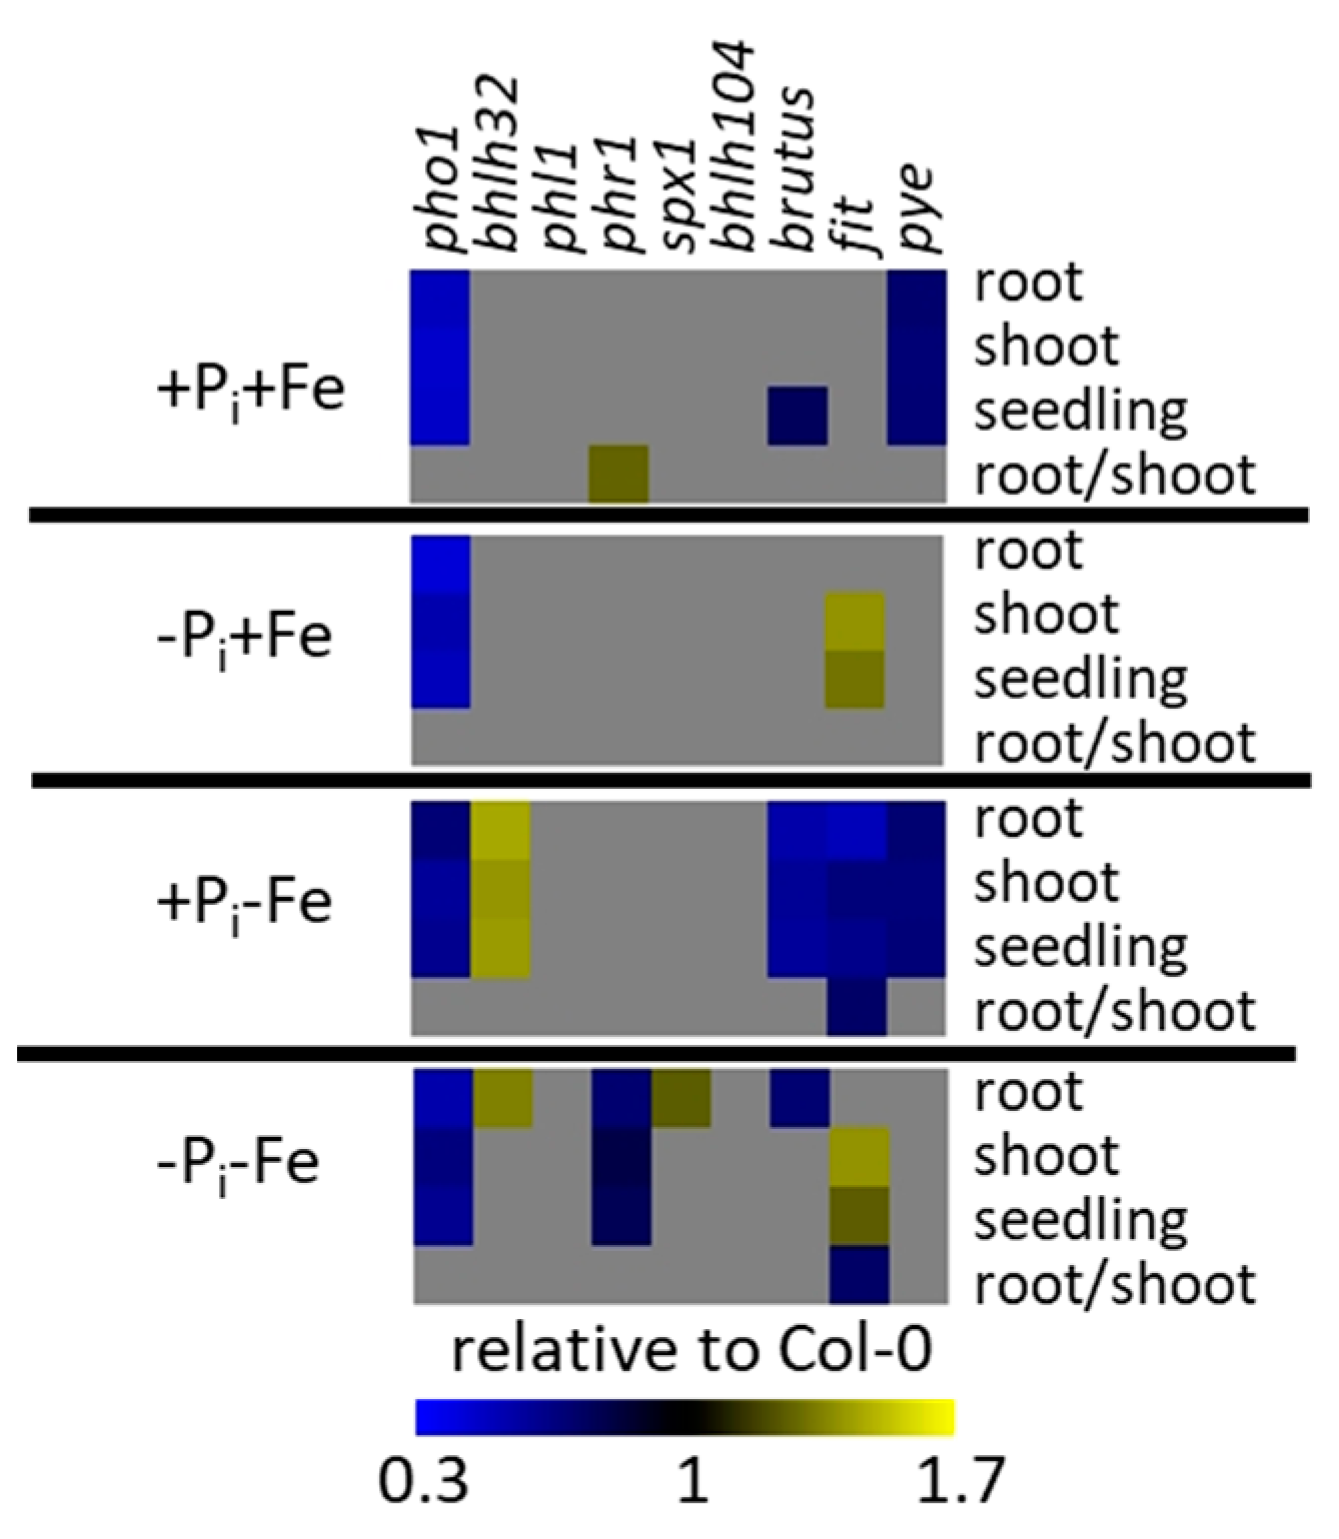
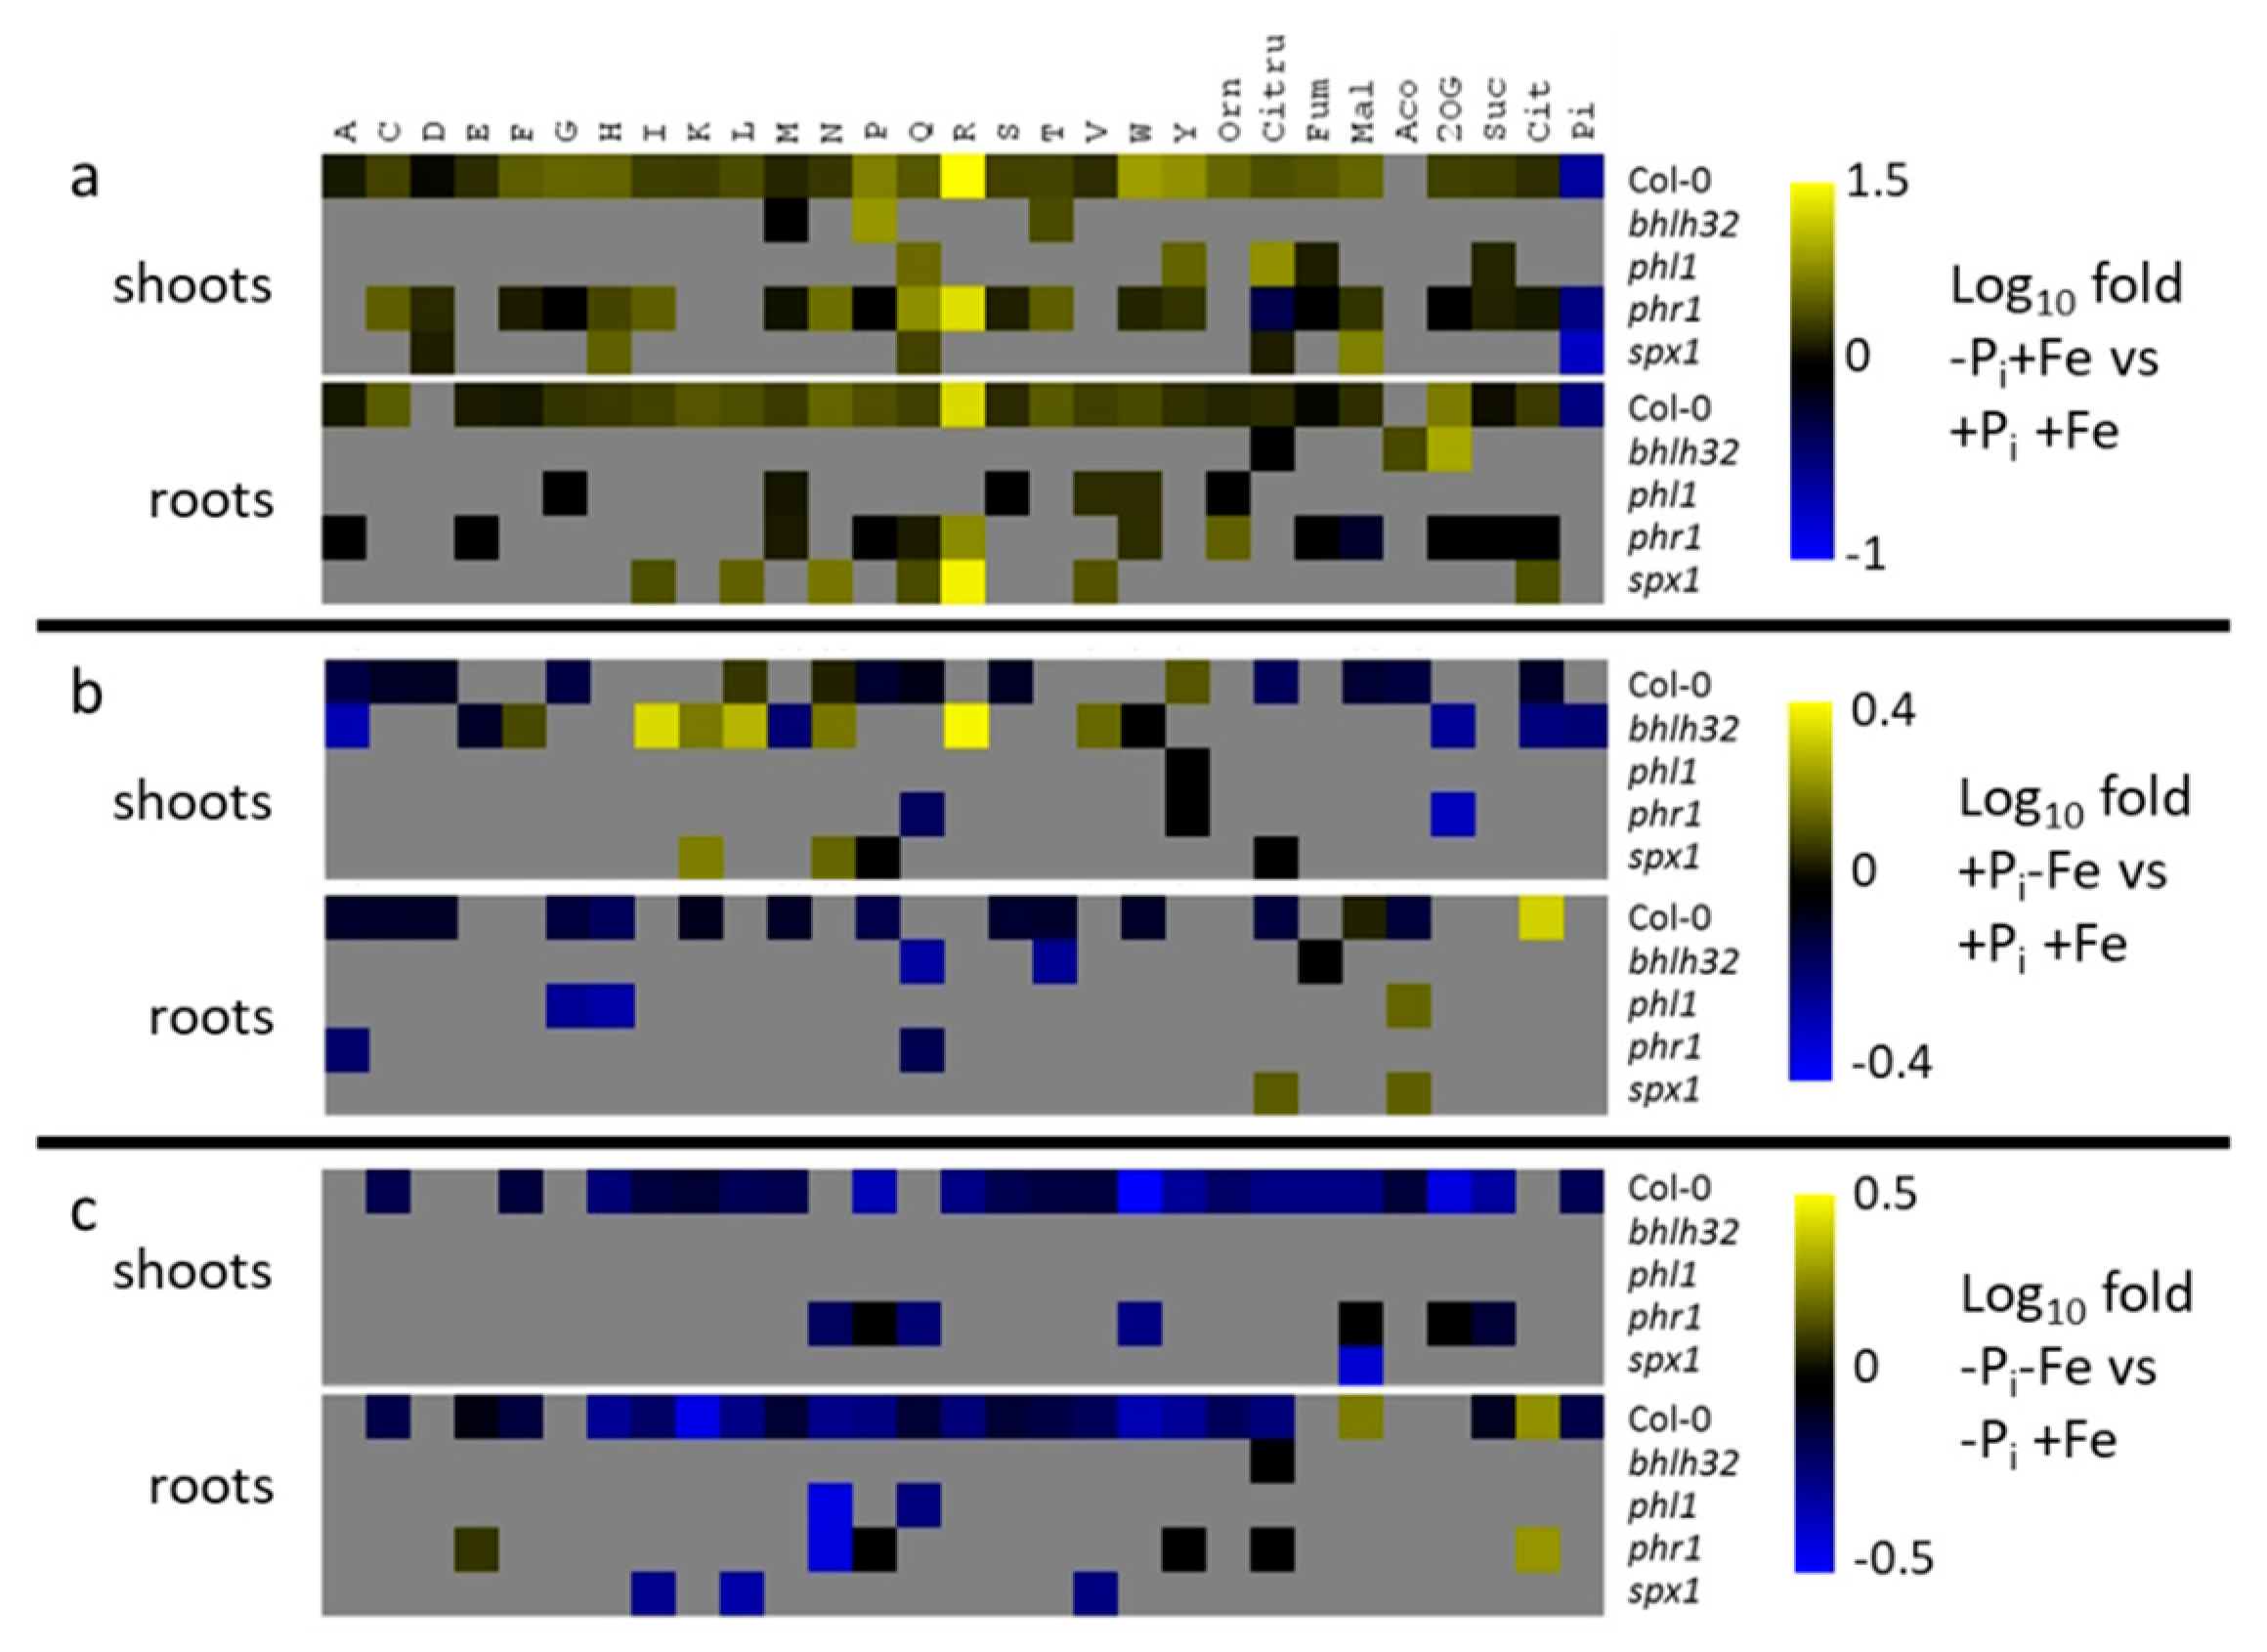
2.4. Effect of Pi Deficiency Response Regulators on Metabolite Profiles

Mutants impaired in the expression of Pi deficiency response regulators profoundly affected metabolite profiles compared to Col-0 plants (Figure S1, Datasets S4 and S5). Generally, the effects were more pronounced in shoots. In spite of indistinguishable growth compared to Col-0 (Figure 6), the mutants already showed strongly aberrant metabolite profiles in roots and shoots when seedlings were grown under nutrient sufficient (+Pi+Fe) conditions. Under these conditions, bHLH32 and SPX1 as well as PHL1 seem to be the main factors controlling amino acid and organic acid levels in shoots and roots, respectively. Under conditions of Pi deficiency, mutants with aberrant PHR1 expression revealed the strongest effects on metabolite profiles compared to Col-0 plants, although this mutant, like the other Pi deficiency response mutants, exhibited similar growth parameters compared to Col-0 (Figure 6). Although phr1 exhibited mostly lower metabolite levels compared to WT under Pi deficiency conditions, it was still responsive to Pi deficiency, as seen by the accumulation of several metabolites, which was indistinguishable from WT (Figure 7). Pi deficiency-induced levels of some metabolites, such as asparagine and glutamine, were even higher in shoots of phr1 compared to WT (Figure S1, Datasets S4 and S5). Phl1 plants, which are deficient in the expression of the PHR1 homologue PHL1, exhibited weaker effects on Pi deficiency-induced metabolite levels. Compared to the changes observed in phr1 plants, a much lower number of metabolites was affected by the mutation in PHL1 and the levels of these metabolites were less modified.
Spx1 plants, which are deficient in the expression of the negative Pi deficiency response regulator SPX1, exhibited increased content of several metabolites upon Pi starvation compared to WT in roots. It is worth noting that most of these changes affected metabolites, which are not under the control of PHR1 or PHL1. Whereas spx1 knock out plants exhibited higher metabolite concentrations after Pi deficiency predominantly in roots, bhlh32 mutants showed higher metabolite concentrations after Pi deficiency predominantly in shoots. Interestingly, the absence of these two Pi deficiency response regulators more strongly affected metabolite profiles in response to Fe compared to Pi deficiency specifically in shoots (Figure S1, Datasets S4 and S5). In case of bhlh32, the comparably strongly elevated metabolite concentrations were associated with increased root, shoot, and seedling fresh weights compared to Col-0 (Figure 6).
Since metabolite content differs between mutant and Col-0 plants grown under nutrient sufficient conditions, the comparison of only metabolite content between mutants and Col-0 plants exposed to nutrient limitations is not the appropriate means to elucidate the effect of Pi and Fe deficiency response regulators on the metabolic response upon nutrient deficiencies. Therefore, we determined differences in the responsiveness to the treatments between mutant and WT plants (Figure 7, Datasets S7 and S8). Compared to WT, phr1 plants exhibited most changes with respect to the number and the extent of Pi deficiency-induced metabolite accumulation. This was most evident in shoots. Although most analytes displayed reduced Pi deficiency-induced accumulation, some metabolites exhibited stronger accumulation in phr1 plants compared to WT, e.g., ornithine in roots, and cysteine, aspartate, asparagine, glutamine, and threonine in shoots. Absence of PHL1 affected Pi deficiency-induced accumulation of only a few compounds, and most of these were also affected in phr1 plants. However, some metabolites, such as glycine, serine, and valine, accumulated significantly less (two-way ANOVA p ≤ 0.05) compared to WT plants in phl1 but not in phr1 plants. Mutants impaired in the expression of the negative Pi deficiency response regulator SPX1 exhibited increased Pi deficiency-induced accumulation of metabolites in roots (Figure 7a, Datasets S7 and S8). Remarkably, increased accumulation was observed for metabolites, such as isoleucine, leucine and asparagine, which were not affected in phr1 or phl1 mutants, although SPX1 exerts its negative effects by binding to PHR1 or PHL1. In shoots, mutation of SPX1 led to decreased accumulation of some metabolites, such as glutamine and citrulline. Missing expression of bHLH32 only showed marginal effects on metabolite accumulation by Pi deficiency. However, bhlh32 mutants exhibited several changes concerning the metabolic response to Fe deficiency, especially in shoots (Figure 7b, Datasets S7 and S8). Compared to Col-0 plants, where Fe deficiency induced moderate depletion of metabolites, bhlh32 mutants exhibited considerable accumulation of several metabolites. Interestingly, this was found mainly for metabolites, which were unaffected by Fe deficiency in Col-0 plants, such as isoleucine or arginine. In roots, bhlh32 mutants responded to Fe deficiency by considerable decreases in glutamine and threonine concentrations (Figure 7b, Datasets S7 and S8). In phr1, phl1, and spx1 mutants, altered responsiveness to Fe deficiency was only sporadically observed for a few metabolites. Most evident was the considerable reduction in glycine and histidine levels by Fe deficiency in roots of phl1 plants. The reduction in Pi deficiency-induced accumulation of metabolites by concomitant exposure of plants to Fe deficiency, which was observed in WT plants, was predominantly affected in mutants impaired in the expression of the Pi deficiency response regulators phr1 and spx1, whereas the responses of phl1 and bhlh32 plants were almost indistinguishable from WT plants (Figure 7c, Datasets S7 and S8). The negative effect of Fe deficiency on Pi deficiency-induced metabolite levels was mostly less pronounced or even absent in phr1 and slightly enhanced in spx1 plants, respectively. However, we also observed an enhancement of the negative effects of Fe deficiency in phr1 plants for some metabolites, such as for asparagine in roots and for asparagine and glutamine in shoots. The weaker effect of Fe deficiency on Pi deficiency-induced metabolite levels in roots and shoots of phr1 was accompanied by reduced fresh weights of both tissues compared to Col-0 under these conditions, whereas the change in the metabolic response to combined Pi and Fe deficiency in spx1 was mainly restricted to roots, which exhibited increased fresh weight compared to WT roots (Figure 6).

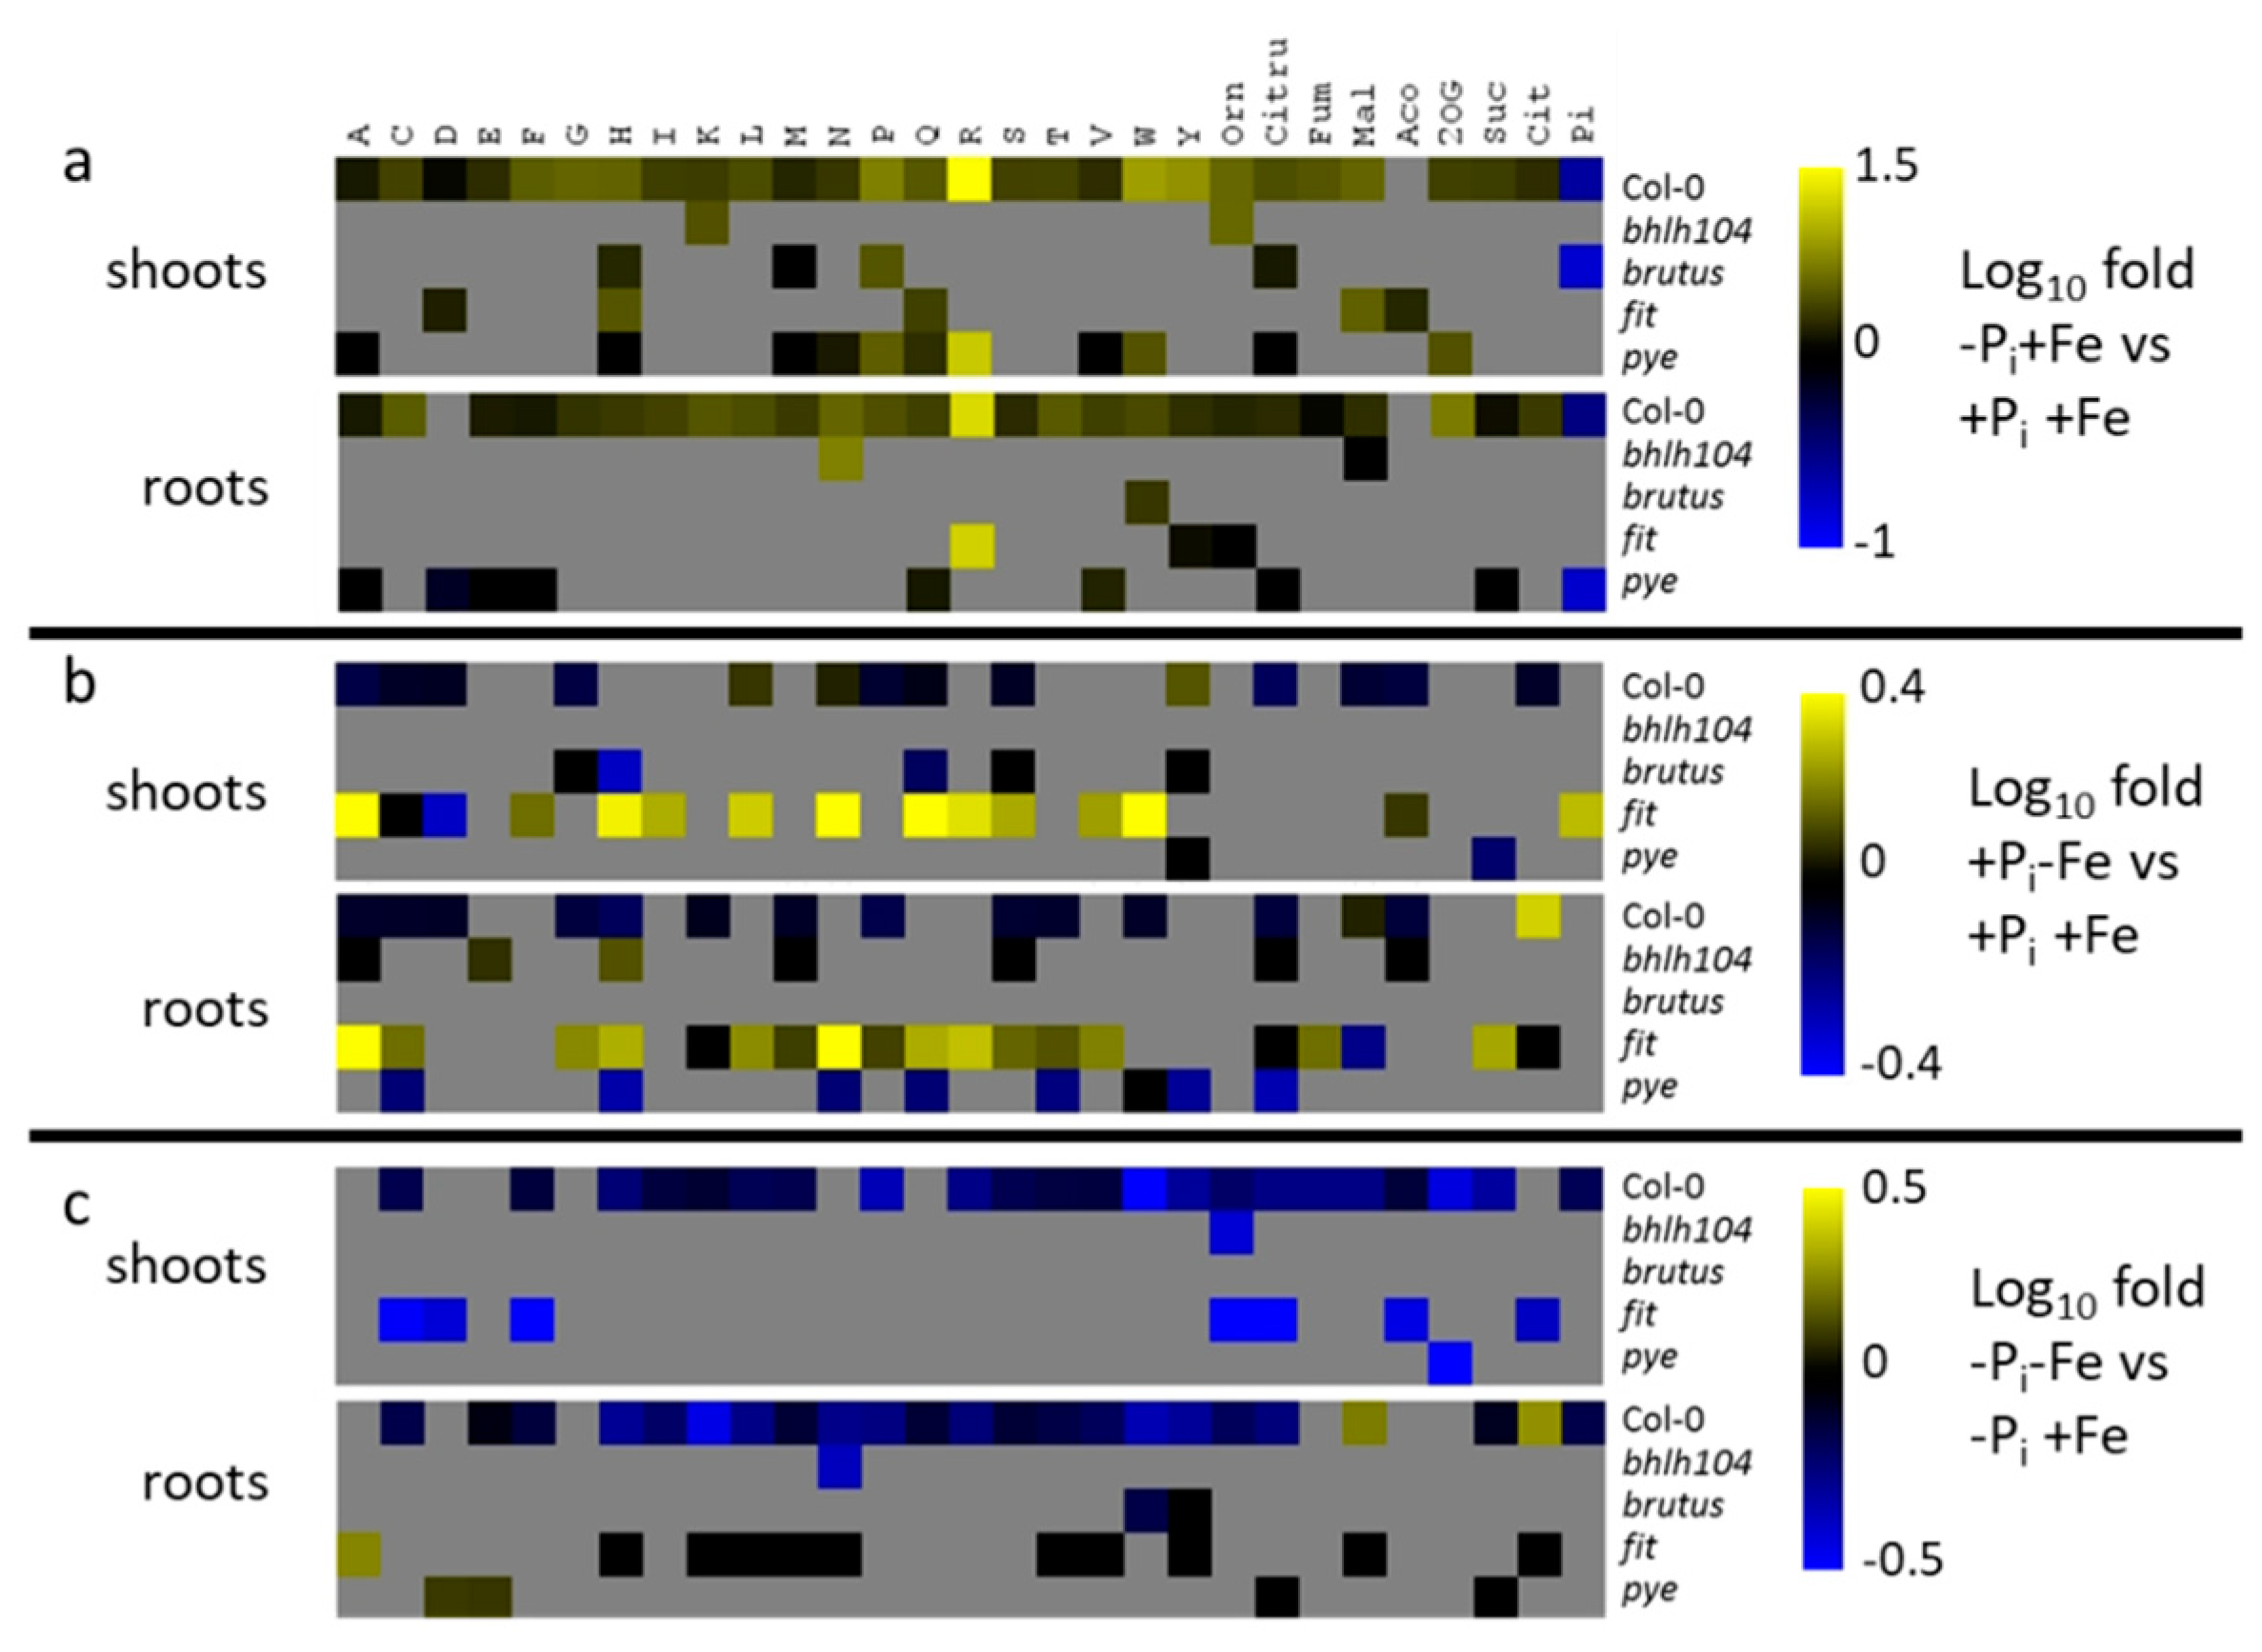
2.5. Effect of Fe Deficiency Response Regulators on Metabolite Profiles

Mutants impaired in the expression of Fe deficiency regulators also strongly altered metabolites profiles (Figure S2, Datasets S5 and S6). When grown in nutrient sufficient conditions, their impact on metabolite levels was even more pronounced compared to those observed in mutants deficient in the expression of Pi deficiency regulators (compare Figures S1 and S2, +Pi+Fe). This was especially evident in shoots, where misexpression of BRUTUS, FIT,and PYE showed most deviations in metabolite profiles compared to WT plants of all mutants analyzed in this study. Fit and pye plants exhibited mainly decreased and increased, respectively, metabolite levels in roots as well as in shoots, whereas metabolite concentrations were predominantly increased in shoots, but decreased in roots of brutus mutants. Bhlh104 mutants exhibited a lower number of changes compared to fit, brutus, and pye mutants, showing predominantly decreased and increased metabolite levels in roots and shoots, respectively, compared to WT plants. In spite of the strongly altered metabolite profiles in most of these mutants, only pye seedlings exhibited growth differences compared to Col-0, showing reduced root, shoot, and seedling fresh weights (Figure 6). Of all analyzed Fe deficiency response mutants, this mutant also exhibited the most striking metabolic changes compared to WT under conditions of Pi deficiency. It showed decreased and increased concentrations for amino and organic acids, respectively, in shoots, whereas root metabolite profiles were indistinguishable from Col-0 plants (Figure S2, Datasets S4 and S5). Differences in growth under conditions of Pi deficiency could only be observed for seedlings of fit, which displayed increased shoot and seedling fresh weights compared to Col-0 (Figure 6). Under conditions of Fe deficiency, pye mutant plants exhibited increased metabolite levels compared to Col-0 plants in roots and shoots. This effect was much more pronounced in fit mutants. In this mutant, the concentrations of most amino acids were increased, whereas the concentrations of most organic acids, especially malate and citrate, were decreased. These changes were less prominent in brutus and bhlh104 plants, and affected metabolite concentrations in roots as well as in shoots of brutus plants, but almost only in roots of bhlh104 plants under conditions of Fe deficiency (Figure S2, Datasets S4 and S5). In line with the comparably moderate metabolic changes, growth of bhlh104 under conditions of Fe deficiency was indistinguishable from Col-0, whereas brutus, fit, and pye seedlings were impaired in shoot, root, and seedling growth compared to Col-0 (Figure 6).
In analogy to the mutants with impaired expression of genes coding for Pi deficiency response regulators, we determined differences in the responsiveness to the individual treatment between Fe deficiency response mutants and Col-0 plants in order to assess their contribution to nutrient deficiency-induced metabolic alterations (Figure 8, Datasets S7 and S8).
The metabolic response induced by Pi starvation was different from WT plants mainly in pye mutants. In this mutant, Pi deficiency-induced accumulation was weaker or absent for several metabolites, in roots as well as in shoots. Fit and brutus plants showed predominantly lower accumulation of metabolites by Pi deficiency compared to WT plants, whereas bhlh104 plants exhibited slightly stronger accumulation. However, these effects were observed for a much lower number of metabolites compared to pye plants (Figure 8a, Datasets S7 and S8). Nutrient deficiency-induced changes in metabolite profiles were most different compared to WT plants under conditions of Fe deficiency. In this condition, fit plants exhibited the most differences, and responded to Fe deficiency by metabolite accumulation rather than by a reduction in metabolite content (Figure 8b, Datasets S7 and S8), as was observed in Col-0 plants. Interestingly, the concentrations of malate and citrate in roots, which were the only compounds showing Fe deficiency-induced accumulation in Col-0 plants, declined or did not change, respectively, in this mutant. Pye mutants exhibited contrasting effects compared to fit plants, and displayed enhanced Fe deficiency-induced reduction in metabolite concentrations compared to WT plants. This was only observed in roots, whereas the response in pye shoots was almost indistinguishable from Col-0 plants (Figure 8b, Datasets S7 and S8). Similarly, the Fe deficiency-induced metabolic response was altered in bhlh104 plants only in roots, but not in shoots. In contrast, the metabolic response of brutus mutants to Fe deficiency was only different from Col-0 plants in shoots, but not in roots.
The negative effects of Fe deficiency on Pi deficiency-induced metabolite accumulation was hardly affected in brutus and bhlh104 mutants (Figure 8c, Datasets S7 and S8). In roots of brutus, reduction of Pi deficiency-induced tryptophan and tyrosine levels by concomitant Fe deficiency was less pronounced compared to WT plants, whereas Fe deficiency led to an enhanced reduction in Pi deficiency-induced asparagine and ornithine concentrations in roots and shoots, respectively, of bhlh104 plants. The mutation in the Fe deficiency response regulator PYE also only marginally influenced the negative effect of Fe deficiency on Pi deficiency-induced metabolite profiles, showing increased or unaltered Pi deficiency-induced levels for aspartate and glutamate or citrulline and succinate, respectively, by Fe deficiency treatment in roots. In contrast, the reduction in Pi deficiency-induced metabolite levels by concomitant Fe deficiency was strongly compromised in plants impaired in the expression of FIT. However, the impact of this mutation was quite different between tissues. In roots, the negative effect of Fe deficiency on Pi deficiency-induced accumulation of metabolites was absent for several metabolites, whereas it was even enhanced for several metabolites in shoots (Figure 8c, Datasets S7 and S8). Whereas the absence of a metabolic response to combined deficiency in roots of fit seedling had no consequences on root growth, the increased reduction of Pi deficiency-induced metabolite accumulation by Fe deficiency in shoots was accompanied by a strongly increased shoot fresh weight compared to Col-0, which resulted in a decreased root to shoot ratio (Figure 6).

3. Discussion

Phosphate deficiency induces a profound reprogramming of cellular metabolism enabling the plant to cope with the low availability of Pi. This includes mechanisms to maintain Pi homeostasis by the reduction of Pi consuming metabolic activities and by prioritization of metabolic pathways which releases Pi. The accumulation of amino acids represents one prominent metabolic response to Pi deficiency. Our results showing the accumulation of almost all amino acids during exposure to Pi limiting conditions corroborate previous reports [35,36]. There are only minor, mainly quantitative, differences between the studies. The stronger accumulation of amino acids reported in the study by Pant et al. [35] is probably due to the initial growth of plants on low Pi containing medium before transfer to Pi depleted conditions, whereas the weaker accumulation observed by Morcuende et al. [36] might be due to a shorter exposure of plants to Pi depleted conditions. Nevertheless, amino acid accumulation can be considered as a very robust and consistent marker of Pi deficiency response. However, the physiological significance of amino acid accumulation under conditions of insufficient Pi supply is not entirely clear. Elevated amino acid concentrations as a result of inhibition of protein synthesis in combination with increased protein degradation have been suggested [35,36]. However, increased transcript levels of genes involved in amino acid biosynthesis also suggests that Pi deficiency-induced amino acid accumulation is due to increased amino acid biosynthesis [12,35,36]. Increased amino acid biosynthesis, especially of N-rich amino acids, such as histidine, tryptophan, and arginine, was discussed as a mechanism to assimilate and transport ammonia, which might accumulate to toxic levels by continuous nitrate reduction and by an increased rate of photorespiration under Pi limiting conditions [35]. According to our data, this does not seem to be decisive for plant growth under Pi limiting conditions, since fit mutants exhibited increased shoot and seedling fresh weight compared to Col-0, although the content as well as Pi deficiency-induced accumulation of N-rich amino acids were lower in fit compared to Col-0 (Figure 6, Figure 8 and Figure S2). Under conditions of combined Pi and Fe deficiency, increased levels of N- rich amino acids in fit roots might indicate better plant growth of this mutant because of improved assimilation of nitrate. However, the concentrations in shoots of these amino acids are lower compared to Col-0 despite improved shoot growth. It is generally difficult to elucidate a causal relationship between the concentrations of individual metabolites and plant growth. Our data only allow to infer a trend that metabolite concentrations and growth show an inverse correlation, such as in Col-0 seedlings grown under Pi limiting conditions as well as in brutus, fit, and pye mutants exposed to Fe deficiency, or in fit mutants subjected to Pi limiting conditions in the presence as well as in the absence of Fe (Figure 6, Figure 8 and Figure S2). However, this does not apply to all mutants, since bhlh32 plants showed increased growth and metabolite concentrations under conditions of Fe deficiency, whereas phr1 seedlings exhibited decreased growth and metabolite levels compared to Col-0 under conditions of combined deficiency (Figure 6, Figure 7 and Figure S1). Considering the multifaceted mechanisms determining plant growth, it is hardly possible to reason phenotypic plasticity of plants subjected to nutrient deficiencies by following the changes of a subset of metabolites, such as in this study. However, the strong and divergent changes in amino and organic acid levels of roots and shoots in response to various nutrient limitations in Col-0 and several mutants enabled us to provide a deeper understanding of the regulation of metabolic responses to nutrient limitations.

3.1. Regulation of Pi Deficiency-Induced Metabolite Profiles

Pant et al. [35] reported that amino acid accumulation was dependent on the MYB transcription factor PHR1, which is known to regulate more than 70% of Pi deficiency-induced transcriptional reprogramming [9]. Our study also indicates a major role of PHR1 in the accumulation of amino acids under conditions of Pi deficiency (Figure 7). However, according to our results, PHR1 seems to regulate the accumulation of only a subset of amino acids, especially in roots. In agreement with the study by Pant et al. [35], mutations in PHR1 did not completely abolish Pi deficiency-induced metabolite accumulation, indicating the cooperation by additional regulators, such as PHL1, which was shown to act in concert with PHR1 in the transcriptional reprogramming during Pi deficiency [9]. This cooperativity was also evident based on our metabolite profiles showing that mutations in PHL1 and PHR1 affected Pi deficiency-induced accumulation of an overlapping set of metabolites. However, reduced accumulation of several amino acids, such as glycine, serine, and valine, in phl1 but not in phr1 mutants also suggests distinct targets for both transcription factors. Furthermore, other factors besides PHR1 and PHL1 are probably involved in the regulation of Pi deficiency-induced metabolic adjustments, since accumulation of several metabolites was affected neither in phr1 nor phl1 mutants. Other PHR-like transcriptional regulators, of which 15 isoforms have been described in Arabidopsis [2,11], are likely candidates, and it will be interesting in the future to elucidate their contribution and specificity in metabolic reprogramming during Pi limitation.
The role of SPX proteins as negative regulators of Pi deficiency responses was also evident based on our metabolite profiles; however, mutants impaired in the expression of SPX1 showed increased accumulation of only a few amino acids exclusively in roots (Figure 7). Additionally, SPX1 seems to be involved in the regulation of Pi deficiency-induced accumulation of some metabolites, such as isoleucine, leucine, or asparagine, which are not subject to regulation by PHR1 or PHL1. Considering that SPX proteins exert negative regulation of Pi deficiency responses by binding to PHR1 and probably also PHL proteins [12], our results suggest complex and selective regulation of Pi deficiency-induced metabolic adjustments, which is accomplished by formation of specific interactions between SPX isoforms, of which four isoforms are described in Arabidopsis [10], and PHR1 or PHL isoforms. Additionally, our data showing tissue specificity of metabolic alterations in spx1, phr1, and phl1 mutants indicate that this interaction selectivity might vary in roots and shoots (Figure 7a).
The bHLH transcription factor bHLH32 seems to play a minor role in the regulation of metabolic alterations under conditions of Pi limitation. BHLH32 was identified as a negative Pi deficiency response regulator based on increased root hair formation and increased induction of the phosphoenolpyruvate carboxylase pathway under conditions of Pi limitation in bhlh32 mutants [15]. Curiously, this factor seems to play a considerable role with respect to Fe deficiency, especially in shoots, where bhlh32 mutants exhibited very different metabolic Fe deficiency responses compared to WT (Figure 7b). These data combined with the fact that root hair formation and induction of phosphoenolpyruvate carboxylase pathway genes are prominent Fe deficiency responses [19,21,22,33,40,43] instead suggest a role for bHLH32 in the regulation of Fe deficiency responses.
On the other hand, absence of PYE resulted in the suppression of Pi deficiency-induced accumulation of several metabolites (Figure 8a). This bHLH type transcription factor is involved in the regulation of several responses to Fe deficiency [33]. Considering metabolism, genes involved in the biosynthesis of the metal chelator nicotianamine were identified as a major target of PYE. Furthermore, microarray analysis revealed deregulation of several genes involved in amino acid metabolism in pye mutants under nutrient sufficient conditions, such as asparagine synthase, branched chain aminotransferase, arogenate dehydratase, or ATP-phosphoribosyl transferase [33]. This is reflected by considerable differences in metabolite concentrations between pye mutant and WT plants when grown in nutrient sufficient conditions (Figure S1). Therefore, the peculiar metabolic Pi deficiency response in this mutant might be a consequence of generally disturbed metabolic activities. However, fit as well as brutus mutants hardly showed changes in the metabolic responses to Pi deficiency, although they also revealed strong alterations in metabolite profiles compared to WT plants already under control conditions. As such, a specific role of PYE in the regulation of Pi deficiency-induced metabolic adjustments cannot be excluded. How this Fe deficiency regulator integrates into the existing regulatory network controlling Pi deficiency responses remains an interesting question for future experiment.

3.2. Regulation of Fe Deficiency-Induced Metabolite Profiles

The metabolic response to Fe deficiency was most different in fit mutants compared to WT, which emphasizes the importance of this major regulator of Fe deficiency responses [29] also in metabolic adjustments (Figure 8). Most importantly, our data show that FIT regulates the accumulation of malate and citrate in roots. Following exudation by roots of Fe starved plants, both organic acids were shown to chelate Fe bound to the rhizosphere leading to an increased bioavailability of Fe [44]. Mutants impaired in the expression of bHLH104 showed similar trends in the metabolic alterations compared to fit mutants, although the effects are milder with respect to the number and the extent of changes. This corroborates the current model, in which initiation of FIT dependent Fe deficiency responses requires the interactions of bHLH104 with several other bHLH proteins, but in which FIT dependent Fe deficiency responses can still be initiated in the absence of bHLH104, although to a lower extent [20,32].
The stronger metabolic response to Fe deficiency in pye mutants compared to Col-0 agrees with the proposed role of PYE as a negative regulator of a subset of Fe deficiency responses [33]. Interestingly, the Fe binding E3 ligase BTS plays only a minor role in the generation of Fe deficiency-induced metabolite profiles, although it was shown to coordinate FIT and PYE mediated Fe deficiency signaling by targeting bHLH104 and its interaction partners for degradation [33,45]. This suggests the existence of other Fe sensing proteins, which are involved in Fe dependent metabolic adjustments. Likely candidates are BRUTUS-LIKE E3 ligases, which are known to target FIT for degradation [46], since fit mutants exhibited most effects on metabolite profiles of all analyzed Fe deficiency response regulators. Alternatively, tissue Fe status might not represent the major determinant for the generation of metabolite profiles under conditions of low Fe supply because the effect of Fe deficiency on Pi deficiency-induced metabolite accumulation was PYE, bHLH104, BTS, and FIT-independent for the majority of the analyzed compounds (Figure 8c). A possible alternative mechanism leading to the negative effect of Fe deficiency on Pi deficiency-induced metabolite accumulation by will be discussed in more detail in the following paragraph.

3.3. Modulation of Pi Deficiency-Induced Metabolite Profiles by Fe Deficiency

Our data showing a strong negative effect of Fe deficiency on Pi deficiency-induced metabolite accumulation raise the question about the mechanism underlying this effect, especially since Fe deficiency alone only mildly affects the metabolite profiles (Figure 3). As mentioned above, the fact that mutations in bHLH104, BRUTUS, or PYE hardly modified this response might imply that modulation of metabolite profiles by Fe deficiency is not a direct effect of lower tissue Fe content. It is conceivable that low Fe leads to reduced formation of Fe−Pi complexes, thereby elevating tissue Pi concentration in tissues, which would alleviate the metabolic Pi deficiency response. This scenario is not supported by our data showing that Pi levels are rather decreased under conditions of combined deficiency (Figure 4) as well as by the experiments using pho1 mutants, in which no correlation between aberrant free Pi distribution and metabolic responses was detectable (Figure 5). Recent studies point to a more important role for the inositol pyrophosphates IP7 and IP8 rather than for free Pi as mediators of PHR or PHL interactions with SPX proteins in the suppression of systemic Pi deficiency responses [13,14]. Lowering endogenous Fe content by low external Fe supply could increase the level of free inositol 6-phosphate (IP6, phytate), a very potent Fe chelator [47], leading to increased substrate availability for the biosynthesis of IP7 and IP8, which exhibit the strongest affinity to SPX proteins [13]. Increased IP7 and IP8 formation in the absence of Fe could lead to enhanced formation of complexes between PHR or PHL and SPX proteins, preventing PHR or PHL from activating Pi deficiency responses. However, the negative effect of Fe deficiency on Pi deficiency-induced metabolite accumulation was only partially altered in phr1, phl1, and spx1 mutants (Figure 7c). Furthermore, transcriptome data do not reveal Fe deficiency-induced changes in transcript levels of genes involved in the biosynthesis of IP7 and IP8 [21,22,33,40,43], such as ITPK1, ITPK2, VIH1, and VIH2 [14,48]. Therefore, the mechanism, by which Fe suppresses Pi-deficiency responses, remains obscure, since the present data neither support signaling pathways which are initiated by reduced Fe content or by increased levels of Pi or inositol pyrophosphates. More comprehensive analyses of mutants, including more phl or spx mutants as well as more mutants deficient in the expression of Fe deficiency response regulators combined with studies of the transcriptome, the proteome, and the metabolome are clearly needed to decipher the molecular components coordinating Pi and Fe deficiency response signaling pathways.

3.4. Physiological Relevance of Pi and Fe Deficiency-Induced Metabolic Adjustments

An important question concerns the physiological relevance of decreased primary metabolite levels after Fe deficiency and the negative impact of Fe deficiency on Pi deficiency-induced metabolite accumulation. For combined deficiency, a general breakdown of metabolism under conditions of severe malnutrition of plants with respect to Fe and Pi could be discussed. However, plants were harvested before shoots exhibited visible signs of Fe deficiency, such as leaf chlorosis, Pi deficiency-induced metabolite accumulation was still present in the absence of Fe, and tissue fresh weights were higher compared to Pi deficiency in the presence of Fe. Furthermore, omission of Fe leads to an alleviation of Pi deficiency-induced primary root growth arrest [16,17], and Fe deficiency-induced coumarin accumulation was still detectable in Pi starved plants [37]. These findings indicate active metabolism also in case plants suffer from Pi and Fe starvation.
Possibly, Fe deficiency could lead to the allocation of primary metabolites to the synthesis of compounds which enable plants to maintain Fe homeostasis and to increase Fe acquisition. As such, decreased levels of aromatic amino acids as well as of Met, Arg, citrulline, and ornithine might be due to the Fe deficiency-induced accumulation of coumarins [22,24,25,26,27,28,37,49], nicotianamine [50], or putrescine [51]. However, we could only detect Fe deficiency dependent depletion of all these amino acids under conditions of low Pi supply. Possibly, the levels of these amino acids are high enough only at low Pi conditions so that they can be metabolized without biosynthetic replenishment, whereas, under conditions of high Pi, the consumption of these amino acids must be compensated by increased biosynthesis in order to maintain plant survival. This assumption might be supported by the fact that of all genes involved in amino acids metabolism, which are regulated by Fe deficiency, those implicated in the metabolism of aromatic amino acids, as well as of Met, Arg, citrulline, and ornithine, are overrepresented [21,22,33,40,43]. However, considering the strong allosteric regulation of primary metabolism, it is questionable whether the analysis of transcript levels is sufficient to estimate Fe deficiency-induced reprogramming of primary metabolism. In that respect, a more comprehensive analysis of primary metabolites as well as metabolic flux analysis is required to substantiate the assumption of increased utilization and consumption of amino acids as building blocks for the generation of compounds, which are known to alleviate Fe deficiency.
A further physiological role for the observed Fe deficiency-induced metabolite profiles could be inferred from the study by Zhu et al. [52]. They showed the pivotal role of ammonium accumulation in the regulation of Fe deficiency responses. It is conceivable, that Fe deficiency-induced depletion of amino acids, either by decreased biosynthesis or increased degradation, could result in the generation of ammonium, which was shown to upregulate genes involved in Fe uptake and translocation resulting in increased soluble Fe content and decreased sensitivity to Fe deficiency [52]. Thus, the contrasting effects of Fe and Pi deficiency on amino acid levels observed in this study could be interpreted as a strategy to balance the levels of ammonium, which is required to decrease sensitivity to Fe deficiency but which needs to be detoxified under conditions of Pi deficiency [35]. Clearly, more experimental evidence about the role of ammonium during Pi and Fe deficiency and about the biogenesis of ammonium under these conditions is needed to substantiate this assumption.
Interestingly, Pi and Fe deficiency act synergistically in the accumulation of the organic acids malate and citrate in roots. Both compounds are known to facilitate Pi and Fe nutrition, either by their potential to solubilize both nutrients from insoluble complexes in the rhizosphere or by mobilization of Fe. Possibly, increased plant growth under conditions of combined deficiencies compared to Pi deficiency might be a result of increased Pi acquisition mediated by the additional accumulation of malate caused by Fe deficiency. Vice versa, increased Fe acquisition and mobilization might result from the additional accumulation of citrate induced by Pi deficiency. Indeed, Fe content was shown to increase under conditions of Pi deficiency [38,53]. Combined Pi and Fe deficiency treatment did not elevate Pi concentrations compared to single Pi deficiency. However, it is possible that a larger proportion of Pi is organically bound in order to sustain plant growth, resulting in higher total P content. In this context, it would be interesting in the future to determine the level of total P and of phosphorylated compounds as well as to analyze Pi uptake.
In summary, our results clearly reveal that the strong and mainly contrasting effects of Pi and Fe deficiency are not only restricted to phenotypic responses, such as Pi deficiency-induced root growth inhibition [16,17], or to Fe deficiency-induced accumulation of secondary compounds [37]. Instead, Pi and Fe availability also lead to a mostly opposing reprogramming of primary metabolism, which is coordinated by the action of several Pi and Fe deficiency response regulators. It would be interesting in the future to elucidate the mechanisms underlying this complex regulation on the molecular level with respect to the interaction of Pi and Fe deficiency response regulators as well as with respect to the identification of the molecules or of the ratios of molecules, which are sensed and which initiate the signaling cascades.

4. Materials and Methods

4.1. Plant Lines and Growth Conditions

T-DNA insertion lines were obtained from the Nottingham Arabidopsis Stock Center (NASC, University of Nottingham, England, UK), and were all in the Arabidopsis thaliana accession Col-0 background, which was used as WT throughout the study. Homozygosity of the plants was confirmed as described [37].
Growth conditions were exactly as described [37] with some smaller modifications. Briefly, seeds were surface sterilized with chlorine gas and placed on sterile agar plates (1% (w/v) Phyto Agar, Duchefa, Haarlem, The Netherlands, purified according to [16]) containing 5 mM KNO3, 0.5 mM KH2PO4, 2 mM MgSO4, 2 mM Ca(NO3)2, 50 µM Fe-EDTA, 70 µM H3BO3, 14 µM MnCl2, 0.5 µM CuSO4, 1 µM ZnSO4, 0.2 µM Na2MoO4, 10 µM CoCl2, and 5 g L−1 of sucrose buffered with 2.5 mM Mes-KOH to pH 5.6. For −Fe medium, Fe-EDTA was omitted, and, for –Pi medium, the concentration of KH2PO4 was reduced to 5 µM. Including the Pi and Fe amount originating from the purified agar, the final concentrations of Pi and Fe amounted to 6 µM and 1 µM in −Pi and −Fe medium, respectively. Seed germination was synchronized by incubation of the plates for 2 days in the dark at 4 °C. Afterwards, agar plates were incubated in a vertical position in a growth chamber at 22 °C under illumination for 16 h daily (170 µmol s−1 m−2; Osram LumiluxDeLuxe Cool daylight L58W/965, Osram, Augsburg, Germany). After 5 days of growth in nutrient sufficient conditions (+Pi,+Fe), seedlings were transferred to fresh agar plates containing the respective conditions (+Pi,+Fe; −Pi,+Fe; +Pi,−Fe; −Pi,−Fe). After an additional 6 days of growth, roots were separated from the shoots, their fresh weight recorded, and frozen in liquid nitrogen until further processing. Average root, shoot, and seedling fresh weights as well as root to shoot ratios of Col-0 seedling exposed to all four conditions are shown in Dataset 1. The root, shoot, and seedling fresh weights as well as root to shoot ratios of all genotypes and treatments are listed in Dataset S2. Photographs of seedlings at the time of harvest are shown in [37]. For metabolite analysis, one biological replicate consisted of roots or shoots from two plants.

4.2. Metabolite Analysis

Tissues (1–5 mg of fresh weight) were ground using 5 mm steel beads in a bead mill at 25 Hz for 50 s, and the resulting powder was extracted by vigorous shaking for 20 min with 100 µL of 70% (v/v) methanol containing as internal standards 2 nmol norvaline (amino acid quantification), 5 nmol [2,2,3,3-2H] succinic acid (Pi, fumarate, succinate, and 2-oxoglutarate quantification), 5 nmol [2,2,3,-2H] malic acid (malate quantification), and [2,2,4,4-2H] citric acid (citrate and aconitate quantification). Clear extracts were obtained by two rounds of centrifugations (5 min, 12,000× g). Targeted amino acid profiling was performed by LC-ESI-MS/MS consisting of a 1290 LC system (Agilent, Waldbronn, Germany) coupled to an API 3200 triple quadrupole mass spectrometer (AB Sciex, Darmstadt, Germany) as described [54] using 25 µL of the extracts. For determination of organic acid and Pi content, 10 µL of the extracts were dried, methoxylated for 1.5 h at room temperature with 20 µL of 20 mg mL−1 of methoxyamine in pyridine (Sigma-Aldrich, St. Louis, MO, USA), and silylated for 30 min at 37 °C with 35 µL of Silyl 991 (Macherey-Nagel, Düren, Germany). Gas chromatography (GC)-MS/MS analysis was performed as described [37]. The Agilent 7890 GC system was equipped with an OPTIMA 5 column (10 m × 0.25 mm, 0.25 µm; Macherey-Nagel, Düren, Germany) and coupled to an Agilent 7000B triple quadrupole mass spectrometer (Agilent, Waldbronn, Germany) operated in the positive chemical ionization mode (reagent gas: methane, gas flow: 20%, ion source temperature; 230 °C). One microliter was injected [pulsed (25psi) splitless injection] at 220 °C. After 1 min at 60 °C, the temperature was initially increased at 35 °C min−1 to 200 °C and finally at 50 °C min−1 to 340 °C. The final temperature of 340 °C was held for 5 min. Helium was used as the carrier at 2.39 mL min−1. The transfer line was set to a temperature of 250 °C. Helium and N2 were used as quench and collision gases, respectively (2.25 and 1.5 mL min−1). Multiple reaction monitoring parameters for the detection of the metabolites are indicated in Table S1. The IntelliQuant algorithm of the Analyst 1.6.2 software (AB Sciex, Darmstadt, Germany) or the Agile algorithm of the MassHunter Quantitative Analysis software (version B06.00, Agilent, Waldbronn, Germany) were used to integrate the peaks for amino acids or organic acids and Pi, respectively. Metabolite concentrations were calculated using the respective internal standards and divided by the fresh weights. In order to account for variations in absolute metabolite concentrations between independent experiments, all values within individual experiments were normalized to the average values of the biological replicates of the Col0 +Pi+Fe treatment in the respective experiment. Average absolute metabolite concentrations in roots and shoots of Col-0 plants grown under nutrient sufficient conditions (+Pi+Fe) are listed in Dataset S9. Average absolute and relative metabolite concentrations for all treatments and genotypes can be found in Datasets S10 and S11.

4.3. Principle Component Analysis

Data was analyzed using R version 3.6.2, on a Linux ×86_64 server with Debian GNU/Linux 10. The data were mean centered, and PCA calculated with prcomp() in the stats package. The entire analysis behind Figure 2, including CSV data files, is available as R vignette and HTML as Datafile S1 and at 10.5281/zenodo.4337054.

Supplementary Materials

The following are available online at https://www.mdpi.com/article/10.3390/ijms22147609/s1.

Author Contributions

Conceptualization, J.Z. and R.C.; methodology, J.Z. and R.C.; software, S.N., S.S.; validation, J.Z., S.N., R.C. and S.S.; formal analysis, J.Z., S.N., R.C. and S.S.; investigation, R.C., J.Z. resources, S.A. and S.N.; data curation, J.Z. and S.N.; writing—original draft preparation, R.C. and J.Z.; writing—review and editing, R.C., S.A. and S.N.; visualization, R.C., J.Z., S.S. and S.N.; supervision, J.Z., S.A. and S.N.; funding acquisition, S.A. All authors have read and agreed to the published version of the manuscript.

Funding

This research was funded by core funding to the Leibniz Institute of Plant Biochemistry from the state of Saxony-Anhalt and the Federal Republic of Germany. R.C. was supported by the BRAVE scholarship program funded by the ERASMUS MUNDUS Action 2 program of the European Union.

Institutional Review Board Statement

Not applicable.

Informed Consent Statement

Not applicable.

Data Availability Statement

We do not report any additional data beyond those shown in this report.

Acknowledgments

We thank Birgit Ortel and Pascal Rudewig for technical assistance.

Conflicts of Interest

The authors declare no conflict of interest.

References

  1. Bouain, N.; Krouk, G.; Lacombe, B.; Rouached, H. Getting to the root of plant mineral nutrition: Combinatorial nutrient stresses reveal emergent properties. Trends Plant Sci. 2019, 24, 542–552. [Google Scholar] [CrossRef]
  2. Sega, P.; Pacak, A. Plant PHR Transcription Factors: Put on A Map. Genes 2019, 10, 1018. [Google Scholar] [CrossRef] [Green Version]
  3. Ueda, Y.; Yanagisawa, S. Perception, transduction, and integration of nitrogen and phosphorus nutritional signals in the transcriptional regulatory network in plants. J. Exp. Bot. 2019, 70, 3709–3717. [Google Scholar] [CrossRef]
  4. Briat, J.-F.; Rouached, H.; Tissot, N.; Gaymard, F.; Dubos, C. Integration of P, S, Fe and Zn nutrition signals in Arabidopsis thaliana: Potential involvement of PHOSPHATE STARVATION RESPONSE 1 (PHR1). Front. Plant Sci. 2015, 6, 290. [Google Scholar] [CrossRef] [Green Version]
  5. Hamburger, D.; Rezzonico, E.; MacDonald-Comber Petetot, J.; Somerville, C.; Poirier, Y. Identification and characterization of the Arabidopsis PHO1 gene involved in phosphate loading to the xylem. Plant Cell 2002, 14, 889–902. [Google Scholar] [CrossRef] [Green Version]
  6. Poirier, Y.; Thoma, S.; Somerville, C.; Schiefelbein, J. A Mutant of Arabidopsis deficient in xylem loading of phosphate. Plant Physiol. 1991, 97, 1087–1093. [Google Scholar] [CrossRef] [PubMed] [Green Version]
  7. Rouached, H.; Stefanovic, A.; Secco, D.; Bulak Arpat, A.; Gout, E.; Bligny, R.; Poirier, Y. Uncoupling phosphate deficiency from its major effects on growth and transcriptome via PHO1 expression in Arabidopsis. Plant J. 2011, 65, 557–570. [Google Scholar] [CrossRef] [PubMed]
  8. Thibaud, M.C.; Arrighi, J.F.; Bayle, V.; Chiarenza, S.; Creff, A.; Bustos, R.; Paz-Ares, J.; Poirier, Y.; Nussaume, L. Dissection of local and systemic transcriptional responses to phosphate starvation in Arabidopsis. Plant J. 2010, 64, 775–789. [Google Scholar] [CrossRef] [PubMed]
  9. Bustos, R.; Castrillo, G.; Linhares, F.; Puga, M.I.; Rubio, V.; Perez-Perez, J.; Solano, R.; Leyva, A.; Paz-Ares, J. A central regulatory system largely controls transcriptional activation and repression responses to phosphate starvation in Arabidopsis. PLoS Genet. 2010, 6, e1001102. [Google Scholar] [CrossRef] [Green Version]
  10. Duan, K.; Yi, K.; Dang, L.; Huang, H.; Wu, W.; Wu, P. Characterization of a sub-family of Arabidopsis genes with the SPX domain reveals their diverse functions in plant tolerance to phosphorus starvation. Plant J. 2008, 54, 965–975. [Google Scholar] [CrossRef] [PubMed]
  11. Rubio, V.; Linhares, F.; Solano, R.; Martin, A.C.; Iglesias, J.; Leyva, A.; Paz-Ares, J. A conserved MYB transcription factor involved in phosphate starvation signaling both in vascular plants and in unicellular algae. Genes Dev. 2001, 15, 2122–2133. [Google Scholar] [CrossRef] [Green Version]
  12. Puga, M.I.; Mateos, I.; Charukesi, R.; Wang, Z.; Franco-Zorrilla, J.M.; de Lorenzo, L.; Irigoyen, M.L.; Masiero, S.; Bustos, R.; Rodriguez, J.; et al. SPX1 is a phosphate-dependent inhibitor of Phosphate Starvation Response 1 in Arabidopsis. Proc. Natl. Acad. Sci. USA 2014, 111, 14947–14952. [Google Scholar] [CrossRef] [Green Version]
  13. Wild, R.; Gerasimaite, R.; Jung, J.Y.; Truffault, V.; Pavlovic, I.; Schmidt, A.; Saiardi, A.; Jessen, H.J.; Poirier, Y.; Hothorn, M.; et al. Control of eukaryotic phosphate homeostasis by inositol polyphosphate sensor domains. Science 2016, 352, 986–990. [Google Scholar] [CrossRef] [Green Version]
  14. Zhu, J.; Lau, K.; Puschmann, R.; Harmel, R.K.; Zhang, Y.; Pries, V.; Gaugler, P.; Broger, L.; Dutta, A.K.; Jessen, H.J.; et al. Two bifunctional inositol pyrophosphate kinases/phosphatases control plant phosphate homeostasis. eLife 2019, 8, e43582. [Google Scholar] [CrossRef]
  15. Chen, Z.H.; Nimmo, G.A.; Jenkins, G.I.; Nimmo, H.G. BHLH32 modulates several biochemical and morphological processes that respond to Pi starvation in Arabidopsis. Biochem. J. 2007, 405, 191–198. [Google Scholar] [CrossRef] [PubMed] [Green Version]
  16. Ward, J.T.; Lahner, B.; Yakubova, E.; Salt, D.E.; Raghothama, K.G. The effect of iron on the primary root elongation of Arabidopsis during phosphate deficiency. Plant Physiol. 2008, 147, 1181–1191. [Google Scholar] [CrossRef] [PubMed] [Green Version]
  17. Müller, J.; Toev, T.; Heisters, M.; Teller, J.; Moore, K.L.; Hause, G.; Dinesh, D.C.; Bürstenbinder, K.; Abel, S. Iron-dependent callose deposition adjusts root meristem maintenance to phosphate availability. Dev. Cell 2015, 33, 216–230. [Google Scholar] [CrossRef] [PubMed] [Green Version]
  18. Ivanov, R.; Brumbarova, T.; Bauer, P. Fitting into the harsh reality: Regulation of iron-deficiency responses in dicotyledonous plants. Mol. Plant 2012, 5, 27–42. [Google Scholar] [CrossRef] [Green Version]
  19. Müller, M.; Schmidt, W. Environmentally induced plasticity of root hair development in Arabidopsis. Plant Physiol. 2004, 134, 409–419. [Google Scholar] [CrossRef] [Green Version]
  20. Zhang, J.; Liu, B.; Li, M.; Feng, D.; Jin, H.; Wang, P.; Liu, J.; Xiong, F.; Wang, J.; Wang, H.B. The bHLH transcription factor bHLH104 interacts with IAA-LEUCINE RESISTANT3 and modulates iron homeostasis in Arabidopsis. Plant Cell 2015, 27, 787–805. [Google Scholar] [CrossRef] [PubMed] [Green Version]
  21. Mai, H.J.; Pateyron, S.; Bauer, P. Iron homeostasis in Arabidopsis thaliana: Transcriptomic analyses reveal novel FIT-regulated genes, iron deficiency marker genes and functional gene networks. BMC Plant Biol 2016, 16, 211. [Google Scholar] [CrossRef]
  22. Rodríguez-Celma, J.; Lin, W.-D.; Fu, G.-M.; Abadía, J.; López-Millán, A.-F.; Schmidt, W. Mutually Exclusive Alterations in Secondary Metabolism Are Critical for the Uptake of Insoluble Iron Compounds by Arabidopsis and Medicago truncatula. Plant Physiol. 2013, 162, 1473–1485. [Google Scholar] [CrossRef]
  23. Abadía, J.; López-Millán, A.-F.; Rombolà, A.; Abadía, A. Organic acids and Fe deficiency: A review. Plant Soil 2002, 241, 75–86. [Google Scholar] [CrossRef]
  24. Rajniak, J.; Giehl, R.F.H.; Chang, E.; Murgia, I.; von Wiren, N.; Sattely, E.S. Biosynthesis of redox-active metabolites in response to iron deficiency in plants. Nat. Chem. Biol. 2018, 14, 442–450. [Google Scholar] [CrossRef]
  25. Schmid, N.B.; Giehl, R.F.H.; Döll, S.; Mock, H.-P.; Strehmel, N.; Scheel, D.; Kong, X.; Hider, R.C.; von Wirén, N. Feruloyl-coa 6′-hydroxylase1-dependent coumarins mediate iron acquisition from alkaline substrates in Arabidopsis. Plant Physiol. 2014, 164, 160–172. [Google Scholar] [CrossRef] [PubMed] [Green Version]
  26. Schmidt, H.; Gunther, C.; Weber, M.; Sporlein, C.; Loscher, S.; Bottcher, C.; Schobert, R.; Clemens, S. Metabolome analysis of Arabidopsis thaliana roots identifies a key metabolic pathway for iron acquisition. PLoS ONE 2014, 9, e102444. [Google Scholar] [CrossRef] [PubMed] [Green Version]
  27. Tsai, H.H.; Rodriguez-Celma, J.; Lan, P.; Wu, Y.C.; Velez-Bermudez, I.C.; Schmidt, W. Scopoletin 8-Hydroxylase-Mediated Fraxetin Production Is Crucial for Iron Mobilization. Plant Physiol. 2018, 177, 194–207. [Google Scholar] [CrossRef] [PubMed] [Green Version]
  28. Ziegler, J.; Schmidt, S.; Strehmel, N.; Scheel, D.; Abel, S. Arabidopsis Transporter ABCG37/PDR9 contributes primarily highly oxygenated Coumarins to Root Exudation. Sci. Rep. 2017, 7, 3704. [Google Scholar] [CrossRef] [Green Version]
  29. Colangelo, E.P.; Guerinot, M.L. The essential basic helix-loop-helix protein FIT1 is required for the iron deficiency response. Plant Cell 2004, 16, 3400–3412. [Google Scholar] [CrossRef] [PubMed] [Green Version]
  30. Jakoby, M.; Wang, H.Y.; Reidt, W.; Weisshaar, B.; Bauer, P. FRU (BHLH029) is required for induction of iron mobilization genes in Arabidopsis thaliana. FEBS Lett. 2004, 577, 528–534. [Google Scholar] [CrossRef] [Green Version]
  31. Wang, N.; Cui, Y.; Liu, Y.; Fan, H.; Du, J.; Huang, Z.; Yuan, Y.; Wu, H.; Ling, H.Q. Requirement and functional redundancy of Ib subgroup bHLH proteins for iron deficiency responses and uptake in Arabidopsis thaliana. Mol. Plant 2013, 6, 503–513. [Google Scholar] [CrossRef] [Green Version]
  32. Li, X.; Zhang, H.; Ai, Q.; Liang, G.; Yu, D. Two bHLH transcription factors, bHLH34 and bHLH104, regulate iron homeostasis in Arabidopsis thaliana. Plant Physiol. 2016, 170, 2478–2493. [Google Scholar] [CrossRef] [PubMed] [Green Version]
  33. Long, T.A.; Tsukagoshi, H.; Busch, W.; Lahner, B.; Salt, D.E.; Benfey, P.N. The bHLH transcription factor POPEYE regulates response to iron deficiency in Arabidopsis roots. Plant Cell 2010, 22, 2219–2236. [Google Scholar] [CrossRef] [PubMed] [Green Version]
  34. Selote, D.; Samira, R.; Matthiadis, A.; Gillikin, J.W.; Long, T.A. Iron-binding E3 ligase mediates iron response in plants by targeting basic helix-loop-helix transcription factors. Plant Physiol. 2015, 167, 273–286. [Google Scholar] [CrossRef] [Green Version]
  35. Pant, B.D.; Pant, P.; Erban, A.; Huhman, D.; Kopka, J.; Scheible, W.R. Identification of primary and secondary metabolites with phosphorus status-dependent abundance in Arabidopsis, and of the transcription factor PHR1 as a major regulator of metabolic changes during phosphorus limitation. Plant Cell Environ. 2015, 38, 172–187. [Google Scholar] [CrossRef]
  36. Morcuende, R.; Bari, R.; Gibon, Y.; Zheng, W.; Pant, B.D.; Blasing, O.; Usadel, B.; Czechowski, T.; Udvardi, M.K.; Stitt, M.; et al. Genome-wide reprogramming of metabolism and regulatory networks of Arabidopsis in response to phosphorus. Plant Cell Environ. 2007, 30, 85–112. [Google Scholar] [CrossRef]
  37. Chutia, R.; Abel, S.; Ziegler, J. Iron and phosphate deficiency regulators concertedly control coumarin profiles in Arabidopsis thaliana roots during iron, phosphate, and combined deficiencies. Front. Plant Sci. 2019, 10, 113. [Google Scholar] [CrossRef] [PubMed] [Green Version]
  38. Hirsch, J.; Marin, E.; Floriani, M.; Chiarenza, S.; Richaud, P.; Nussaume, L.; Thibaud, M.C. Phosphate deficiency promotes modification of iron distribution in Arabidopsis plants. Biochimie 2006, 88, 1767–1771. [Google Scholar] [CrossRef]
  39. Svistoonoff, S.; Creff, A.; Reymond, M.; Sigoillot-Claude, C.; Ricaud, L.; Blanchet, A.; Nussaume, L.; Desnos, T. Root tip contact with low-phosphate media reprograms plant root architecture. Nat. Genet. 2007, 39, 792–796. [Google Scholar] [CrossRef] [Green Version]
  40. Li, W.; Lan, P. Genome-wide analysis of overlapping genes regulated by iron deficiency and phosphate starvation reveals new interactions in Arabidopsis roots. BMC Res. Notes 2015, 8, 555. [Google Scholar] [CrossRef] [PubMed] [Green Version]
  41. Ziegler, J.; Schmidt, S.; Chutia, R.; Muller, J.; Bottcher, C.; Strehmel, N.; Scheel, D.; Abel, S. Non-targeted profiling of semi-polar metabolites in Arabidopsis root exudates uncovers a role for coumarin secretion and lignification during the local response to phosphate limitation. J. Exp. Bot 2016, 67, 1421–1432. [Google Scholar] [CrossRef]
  42. Thimm, O.; Bläsing, O.; Gibon, Y.; Nagel, A.; Meyer, S.; Krüger, P.; Selbig, J.; Müller, L.A.; Rhee, S.Y.; Stitt, M. MAPMAN: A user-driven tool to display genomics data sets onto diagrams of metabolic pathways and other biological processes. Plant J. 2004, 37, 914–939. [Google Scholar] [CrossRef] [PubMed]
  43. Yang, T.J.; Lin, W.D.; Schmidt, W. Transcriptional profiling of the Arabidopsis iron deficiency response reveals conserved transition metal homeostasis networks. Plant Physiol. 2010, 152, 2130–2141. [Google Scholar] [CrossRef] [PubMed] [Green Version]
  44. Ryan, P.; Delhaize, E.; Jones, D. Function and mechanism of organic anion exudation from plant roots. Annu. Rev. Plant Physiol. Plant Mol. Biol. 2001, 52, 527–560. [Google Scholar] [CrossRef] [PubMed]
  45. Kobayashi, T.; Nagasaka, S.; Senoura, T.; Itai, R.N.; Nakanishi, H.; Nishizawa, N.K. Iron-binding haemerythrin RING ubiquitin ligases regulate plant iron responses and accumulation. Nat. Commun. 2013, 4, 2792. [Google Scholar] [CrossRef] [PubMed] [Green Version]
  46. Rodríguez-Celma, J.; Connorton, J.M.; Kruse, I.; Green, R.T.; Franceschetti, M.; Chen, Y.T.; Cui, Y.; Ling, H.Q.; Yeh, K.C.; Balk, J. Arabidopsis BRUTUS-LIKE E3 ligases negatively regulate iron uptake by targeting transcription factor FIT for recycling. Proc. Natl. Acad. Sci. USA 2019, 116, 17584–17591. [Google Scholar] [CrossRef] [PubMed] [Green Version]
  47. Lemmens, E.; Moroni, A.V.; Pagand, J.; Heirbaut, P.; Ritala, A.; Karlen, Y.; Lê, K.-A.; Van den Broeck, H.C.; Brouns, F.J.P.H.; De Brier, N.; et al. Impact of cereal seed sprouting on its nutritional and technological properties: A critical review. Compr. Rev. Food Sci. Food Saf. 2019, 18, 305–328. [Google Scholar] [CrossRef] [Green Version]
  48. Laha, D.; Parvin, N.; Hofer, A.; Giehl, R.F.H.; Fernandez-Rebollo, N.; von Wirén, N.; Saiardi, A.; Jessen, H.J.; Schaaf, G. Arabidopsis ITPK1 and ITPK2 have an evolutionarily conserved phytic acid kinase activity. ACS Chem. Biol. 2019, 14, 2127–2133. [Google Scholar] [CrossRef] [Green Version]
  49. Fourcroy, P.; Sisó-Terraza, P.; Sudre, D.; Savirón, M.; Reyt, G.; Gaymard, F.; Abadía, A.; Abadia, J.; Alvarez-Fernández, A.; Briat, J.F. Involvement of the ABCG37 transporter in secretion of scopoletin and derivatives by Arabidopsis roots in response to iron deficiency. New Phytol. 2014, 201, 155–167. [Google Scholar] [CrossRef]
  50. Klatte, M.; Schuler, M.; Wirtz, M.; Fink-Straube, C.; Hell, R.; Bauer, P. The analysis of Arabidopsis nicotianamine synthase mutants reveals functions for nicotianamine in seed iron loading and iron deficiency responses. Plant Physiol. 2009, 150, 257–271. [Google Scholar] [CrossRef] [Green Version]
  51. Zhu, X.F.; Wang, B.; Song, W.F.; Zheng, S.J.; Shen, R.F. Putrescine alleviates iron deficiency via NO-dependent reutilization of root cell-wall Fe in Arabidopsis. Plant Physiol. 2016, 170, 558–567. [Google Scholar] [CrossRef] [PubMed]
  52. Zhu, X.F.; Dong, X.Y.; Wu, Q.; Shen, R.F. Ammonium regulates Fe deficiency responses by enhancing nitric oxide signaling in Arabidopsis thaliana. Planta 2019, 250, 1089–1102. [Google Scholar] [CrossRef] [PubMed]
  53. Misson, J.; Raghothama, K.G.; Jain, A.; Jouhet, J.; Block, M.A.; Bligny, R.; Ortet, P.; Creff, A.; Somerville, S.; Rolland, N.; et al. A genome-wide transcriptional analysis using Arabidopsis thaliana Affymetrix gene chips determined plant responses to phosphate deprivation. Proc. Natl. Acad. Sci. USA 2005, 102, 11934–11939. [Google Scholar] [CrossRef] [PubMed] [Green Version]
  54. Ziegler, J.; Hussain, H.; Neubert, R.H.H.; Abel, S. Sensitive and selective amino acid profiling of minute tissue amounts by HPLC/electrospray negative tandem mass spectrometry using 9-fluorenylmethoxycarbonyl (Fmoc-Cl) derivatization. In Amino Acid Analysis; Humana: New York, NY, USA, 2019; pp. 365–379. [Google Scholar]
Figure 1. Root, shoot, and seedling fresh weight as well as root to shoot ratios of Col-0. After five days on nutrient sufficient conditions (+Pi+Fe), seedlings were transferred to the indicated conditions and allowed to grow for an additional 6 days before harvest. +Pi: 500 µM, −Pi: 5 µM, +Fe: 50 µM, −Fe: no Fe added. Error bars indicate SE (n = 40). Significance analyses between treatments were performed by Student’s t-test (two tailed, equal variances). * p < 0.01 compared to +Pi+Fe; ° p < 0.01 compared to −Pi+Fe;  p < 0.01 compared to +Pi−Fe. The respective numbers are shown in Datasets S1 and S2.
Ijms 22 07609 g001
Figure 2. PCA score plots of the different treatments, (a) Col-0 roots; (b) Col-0 shoots. After an initial growth period of five days on nutrient sufficient conditions (+Pi+Fe), seedlings were transferred to the indicated conditions and allowed to grow for an additional six days before harvest. +Pi: 500 µM, −Pi: 5 µM, +Fe: 50 µM, −Fe: no Fe added.
Ijms 22 07609 g002
Figure 3. Metabolic changes in Col-0 plants presented in the form of a core metabolism overview, modified based on MAPMAN [42]. Upper and lower rows indicate the normalized metabolite concentrations (normalized to +Pi+Fe) in shoots and roots, respectively, after treatment with Pi (−Pi+Fe), Fe (+Pi−Fe) and combined Pi and Fe (−Pi−Fe) deficiencies (columns from left to right). Columns to the right represent the ratios between metabolite levels after combined Pi and Fe deficiency (−Pi−Fe) and Pi deficiency (−Pi+Fe). Cells colored in gray indicate no difference to plants grown under nutrient sufficient conditions (+Pi+Fe) or between −Pi−Fe and −Pi+Fe treatments at p ≤ 0.05 (Student’s t-test, two tailed, equal variances, n ≥ 27). The numbers refer to the values shown in Dataset S3.
Ijms 22 07609 g003
Figure 4. Pi concentrations in roots (open bars) and shoots (closed bars) of Col-0 plants. After an initial growth period of five days on nutrient sufficient conditions (+Pi+Fe), seedlings were transferred to the indicated conditions and allowed to grow for an additional six days before harvest. +Pi: 500 µM, −Pi: 5 µM, +Fe: 50 µM, −Fe: no Fe added. Data are normalized to Col-0 +Pi+Fe, average absolute amounts: roots: 10.7 nmol mg−1 FW; shoots: 7.6 nmol mg−1 FW. Error bars indicate SE (n ≥ 27). Significance analyses between treatments were performed by Student’s t-test (two tailed, equal variances). * p ≤ 0.05 compared to +Pi+Fe; ° p ≤ 0.05 compared to −Pi+Fe;  p ≤ 0.05 compared to +Pi−Fe. The respective numbers are shown in Dataset S3.
Ijms 22 07609 g004
Figure 5. Metabolic changes in roots (open bars) and shoots (closed bars) of pho1 mutants relative to Col-0 plants after transfer to nutrient sufficient (+Pi+Fe) conditions (upper graph) or to conditions of combined Pi and Fe nutrient deficiencies (−Pi−Fe, lower graph). After an initial growth period of five days on nutrient sufficient conditions (+Pi+Fe), seedlings were transferred to +Pi+Fe or −Pi−Fe and allowed to grow for an additional six days before harvest. +Pi: 500 µM, −Pi: 5 µM, +Fe: 50 µM, −Fe: no Fe added. Bars denote the log2 fold change in metabolite levels between pho1 and Col-0. Only changes at p ≤ 0.05 (Student’s t-test two tailed, equal variances) are shown (n ≥ 8). The corresponding data are listed in Datasets S4 and S5. Orn: ornithine; Citru: citrulline; Fum: fumarate; Mal: malate; Aco: aconitate; 2OG: 2-oxoglutarate; Suc: succinate; Cit: citrate.
Ijms 22 07609 g005
Figure 6. Root, shoot, and seedling fresh weights as well as root to shoot ratios in mutants with impaired expression of Pi and Fe deficiency response regulators relative to Col-0. Grey boxes indicate no significant differences (p ≤ 0.05, Student’s t-test, two tailed, equal variances, n ≥ 8) between mutants and Col-0. After an initial growth period of five days on nutrient sufficient conditions (+Pi+Fe), seedlings were transferred to the indicated conditions and allowed to grow for an additional six days before harvest. +Pi: 500 µM, −Pi: 5 µM, +Fe: 50 µM, −Fe: no Fe added. Heat maps were generated according to the data shown in Datasets S6.
Ijms 22 07609 g006
Figure 7. Metabolite changes in shoots (upper panels) and roots (lower panels) of Col-0 plants and mutants with impaired expression of Pi deficiency response regulators. (a) response to Pi deficiency in the presence of Fe (−Pi+Fe vs. +Pi+Fe); (b) response to Fe deficiency in the presence of Pi (+Pi−Fe vs. +Pi+Fe); (c) response to combined Pi and Fe deficiency compared to Pi deficiency (−Pi−Fe vs. −Pi+Fe). After an initial growth period of five days on nutrient sufficient conditions (+Pi+Fe), seedlings were transferred to the indicated conditions and allowed to grow for an additional six days before harvest. +Pi: 500 µM, −Pi: 5 µM, +Fe: 50 µM, −Fe: no Fe added. The log10 fold changes are color coded. For Col-0, only changes at p ≤ 0.05 (Student’s t-test, two tailed, equal variances) are color coded. For the mutants, changes are color coded, if the metabolic response was different compared to the WT response at p ≤ 0.05 (two way ANOVA, n ≥ 8). Grey boxes indicate no change in metabolite concentrations in Col-0 by the respective treatment, or no difference in the metabolic response to the respective treatments between mutants and WT. Orn: ornithine; Citru: citrulline; Fum: fumarate; Mal: malate; Aco: aconitate; 2OG: 2-oxoglutarate; Suc: succinate; Cit: citrate. Heat maps have been generated according to the data shown in Datasets S7 and S8.
Ijms 22 07609 g007
Figure 8. Metabolite changes in shoots (upper panels) and roots (lower panels) of Col-0 plants and mutants with impaired expression of Fe deficiency response regulators. (a) response to Pi deficiency in the presence of Fe (−Pi+Fe vs. +Pi+Fe); (b) Fe deficiency response in the presence of Pi (+Pi−Fe vs. +Pi+Fe); (c) response to combined Pi and Fe deficiency compared to Pi deficiency (−Pi−Fe vs. −Pi+Fe). After an initial growth period of five days on nutrient sufficient conditions (+Pi+Fe), seedlings were transferred to the indicated conditions and allowed to grow for an additional six days before harvest. +Pi: 500 µM, −Pi: 5 µM, +Fe: 50 µM, −Fe: no Fe added. The log10 fold changes are color coded. For Col-0, only changes at p ≤ 0.05 (Student’s t-test two tailed, equal variances) are color coded. For the mutants, changes are color coded, if the metabolic response was different compared to the Col-0 response at p ≤ 0.05 (two way ANOVA, n ≥ 8). Grey boxes indicate no change in metabolite concentrations in Col-0 by the respective treatment, or no difference in the metabolic response to the respective treatments between mutants and Col-0. Orn: ornithine; Citru: citrulline; Fum: fumarate; Mal: malate; Aco: aconitate; 2OG: 2-oxoglutarate; Suc: succinate; Cit: citrate. Heat maps have been generated according to the data shown in Datasets S7 and S8.
Ijms 22 07609 g008
Publisher’s Note: MDPI stays neutral with regard to jurisdictional claims in published maps and institutional affiliations.

