High Stroma T-Cell Infiltration is Associated with Better Survival in Stage pT1 Bladder Cancer

 , , , and
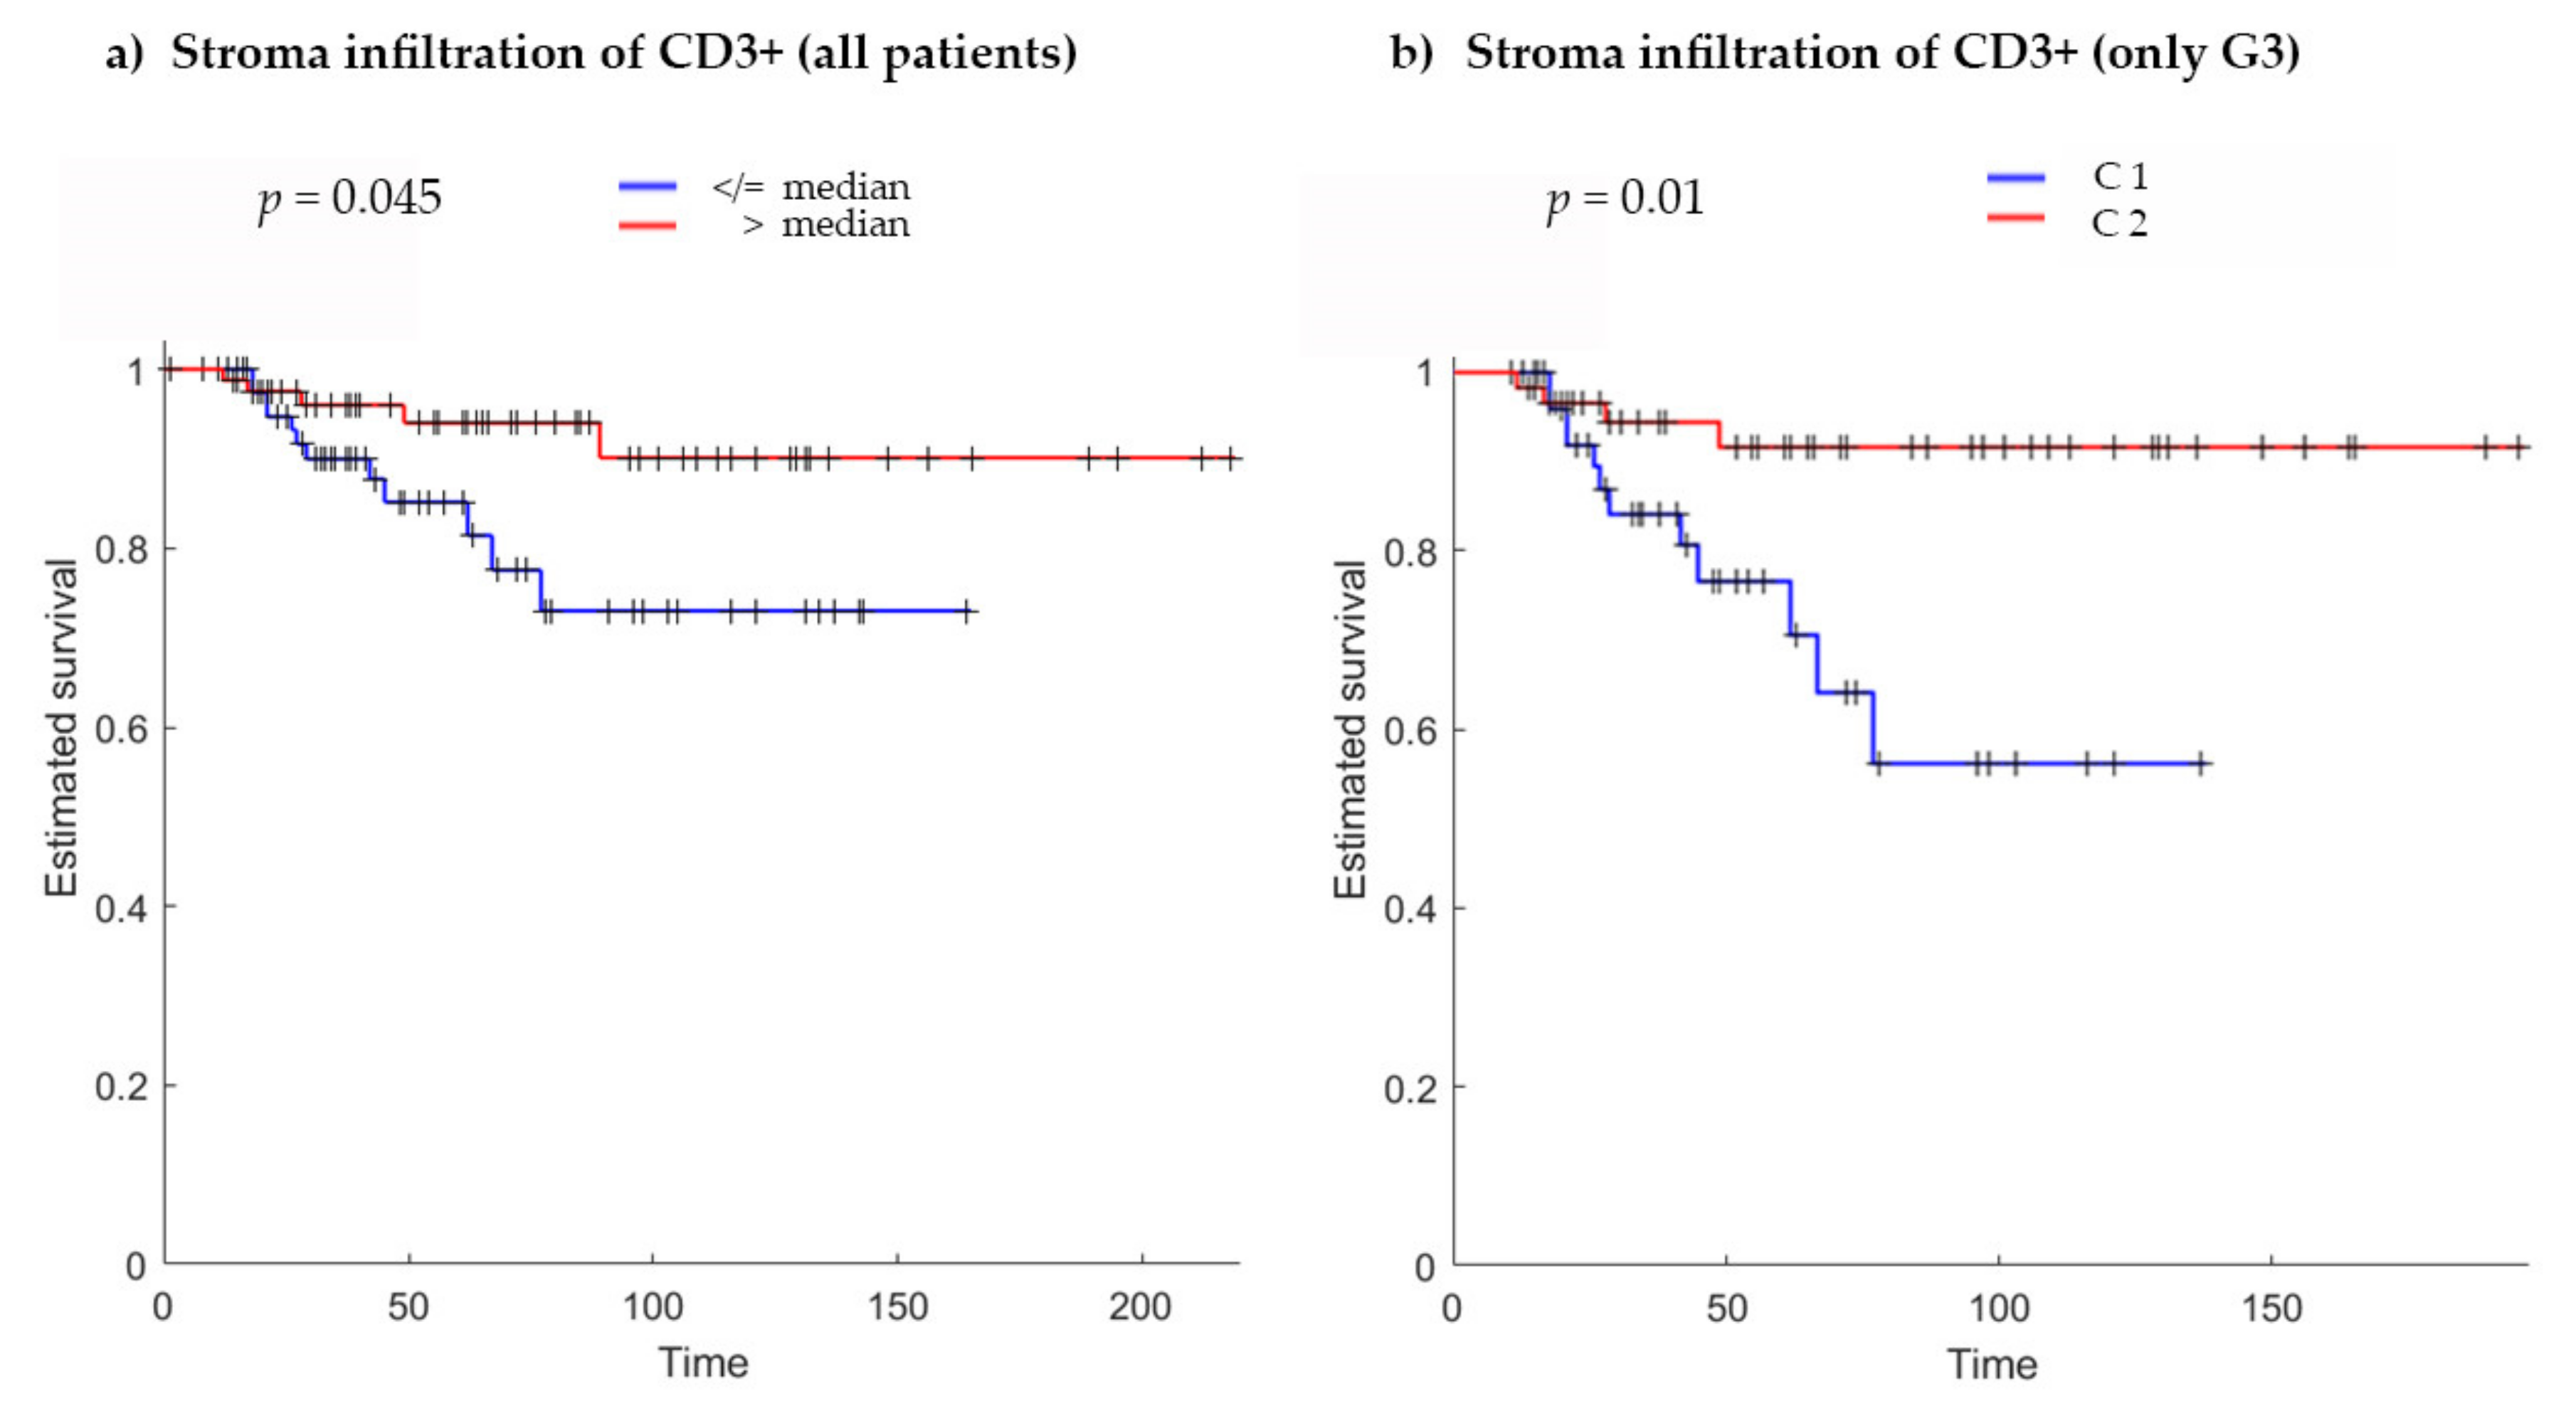
Abstract
:1. Introduction
2. Results
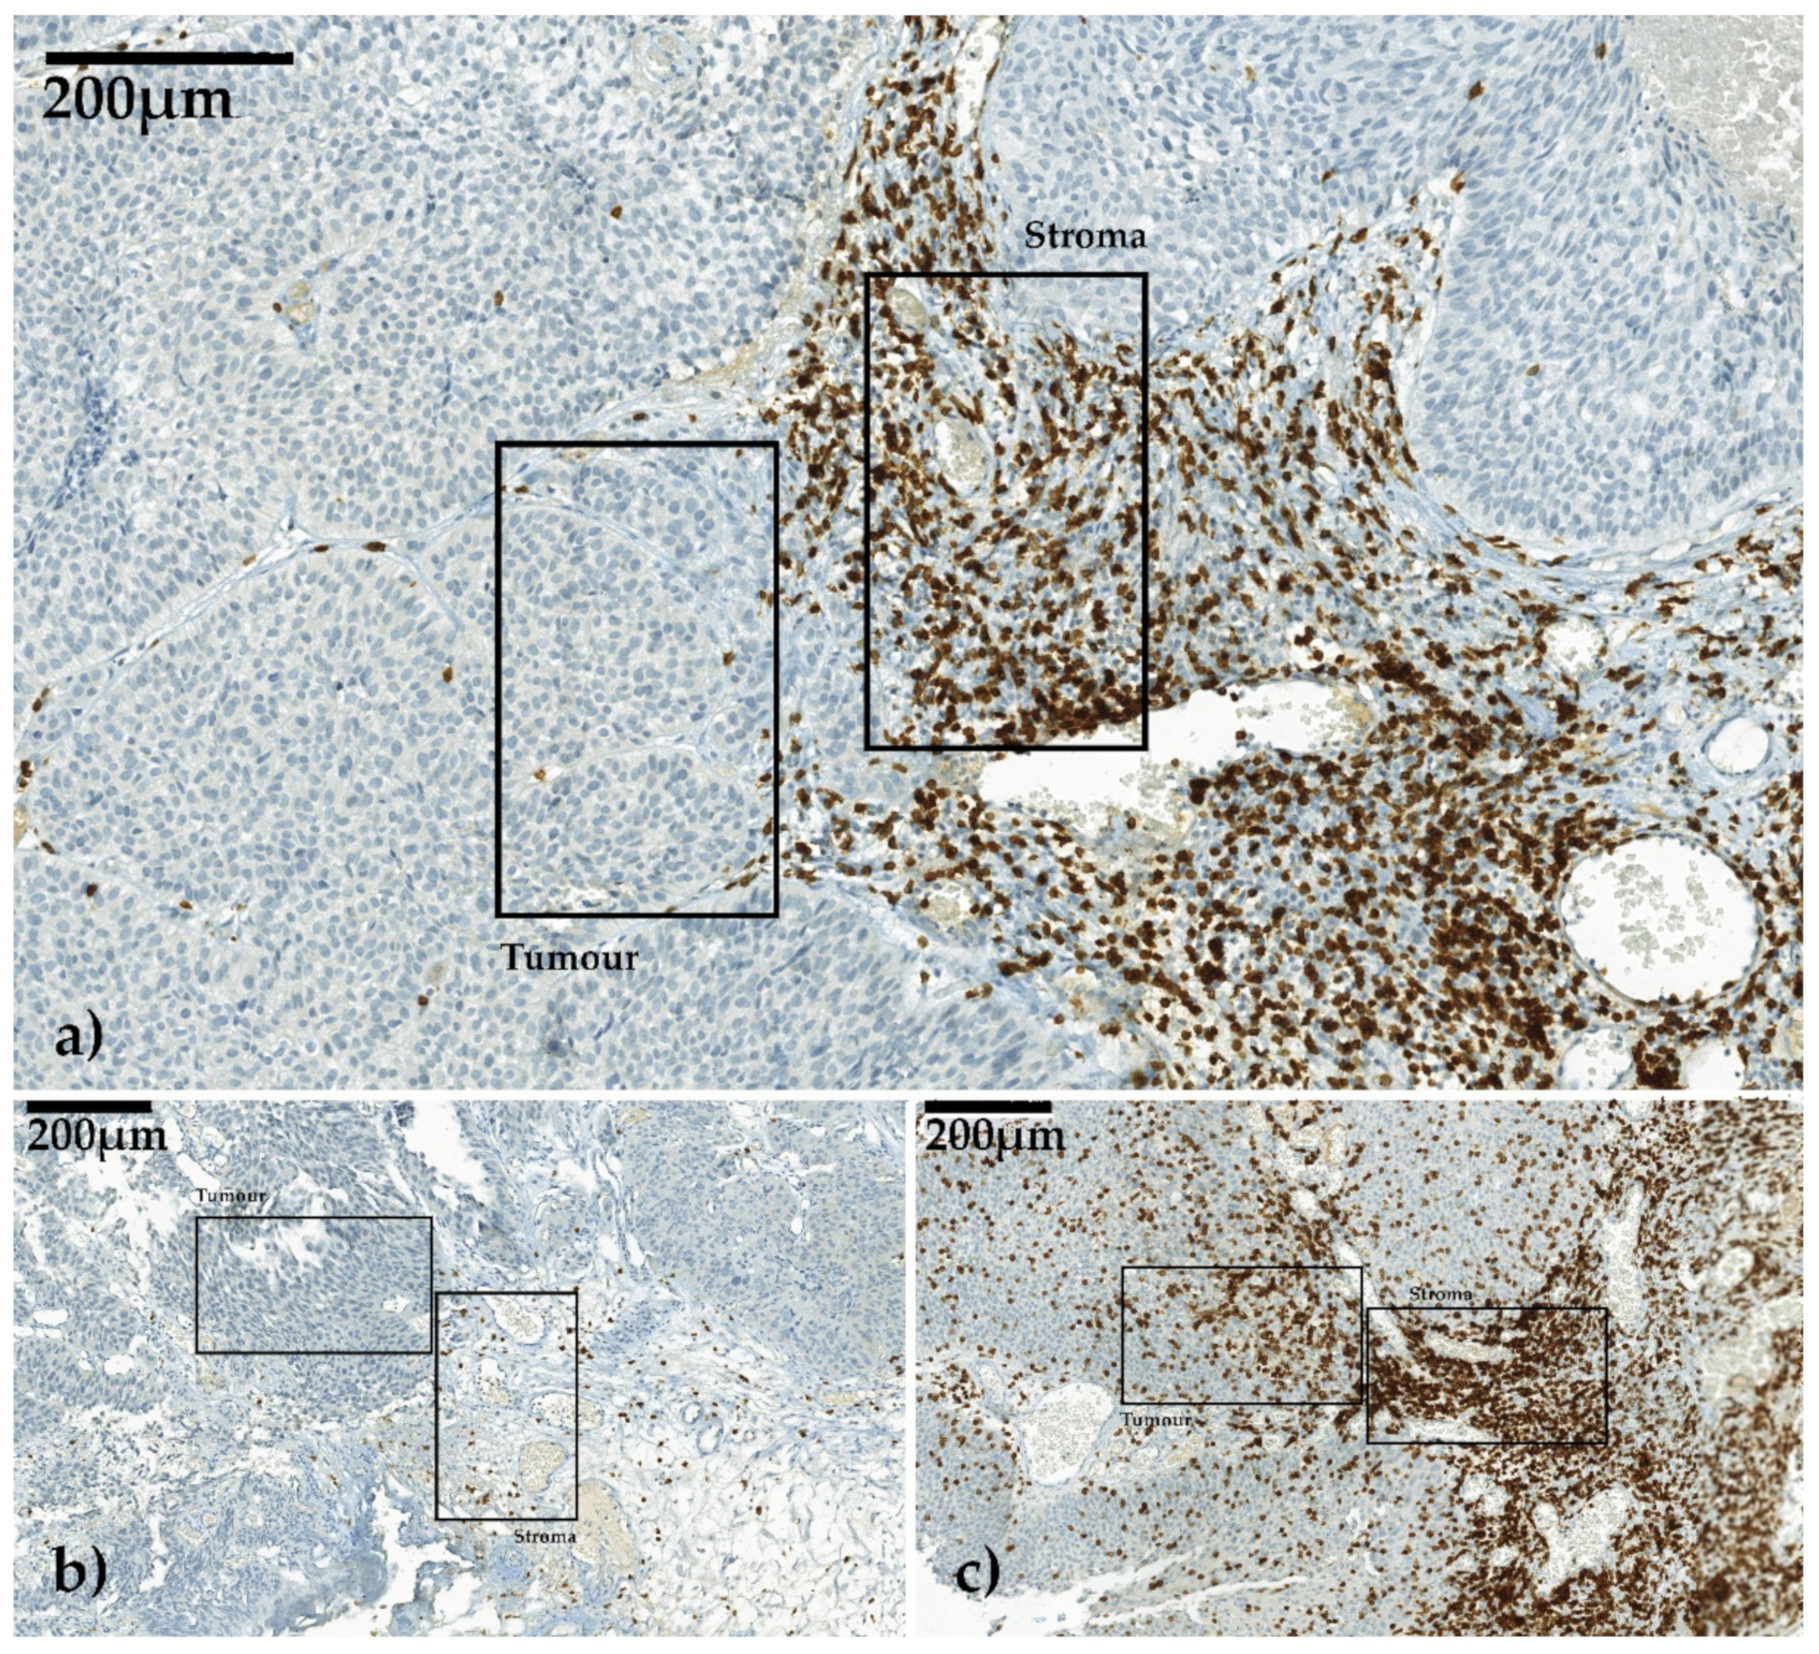
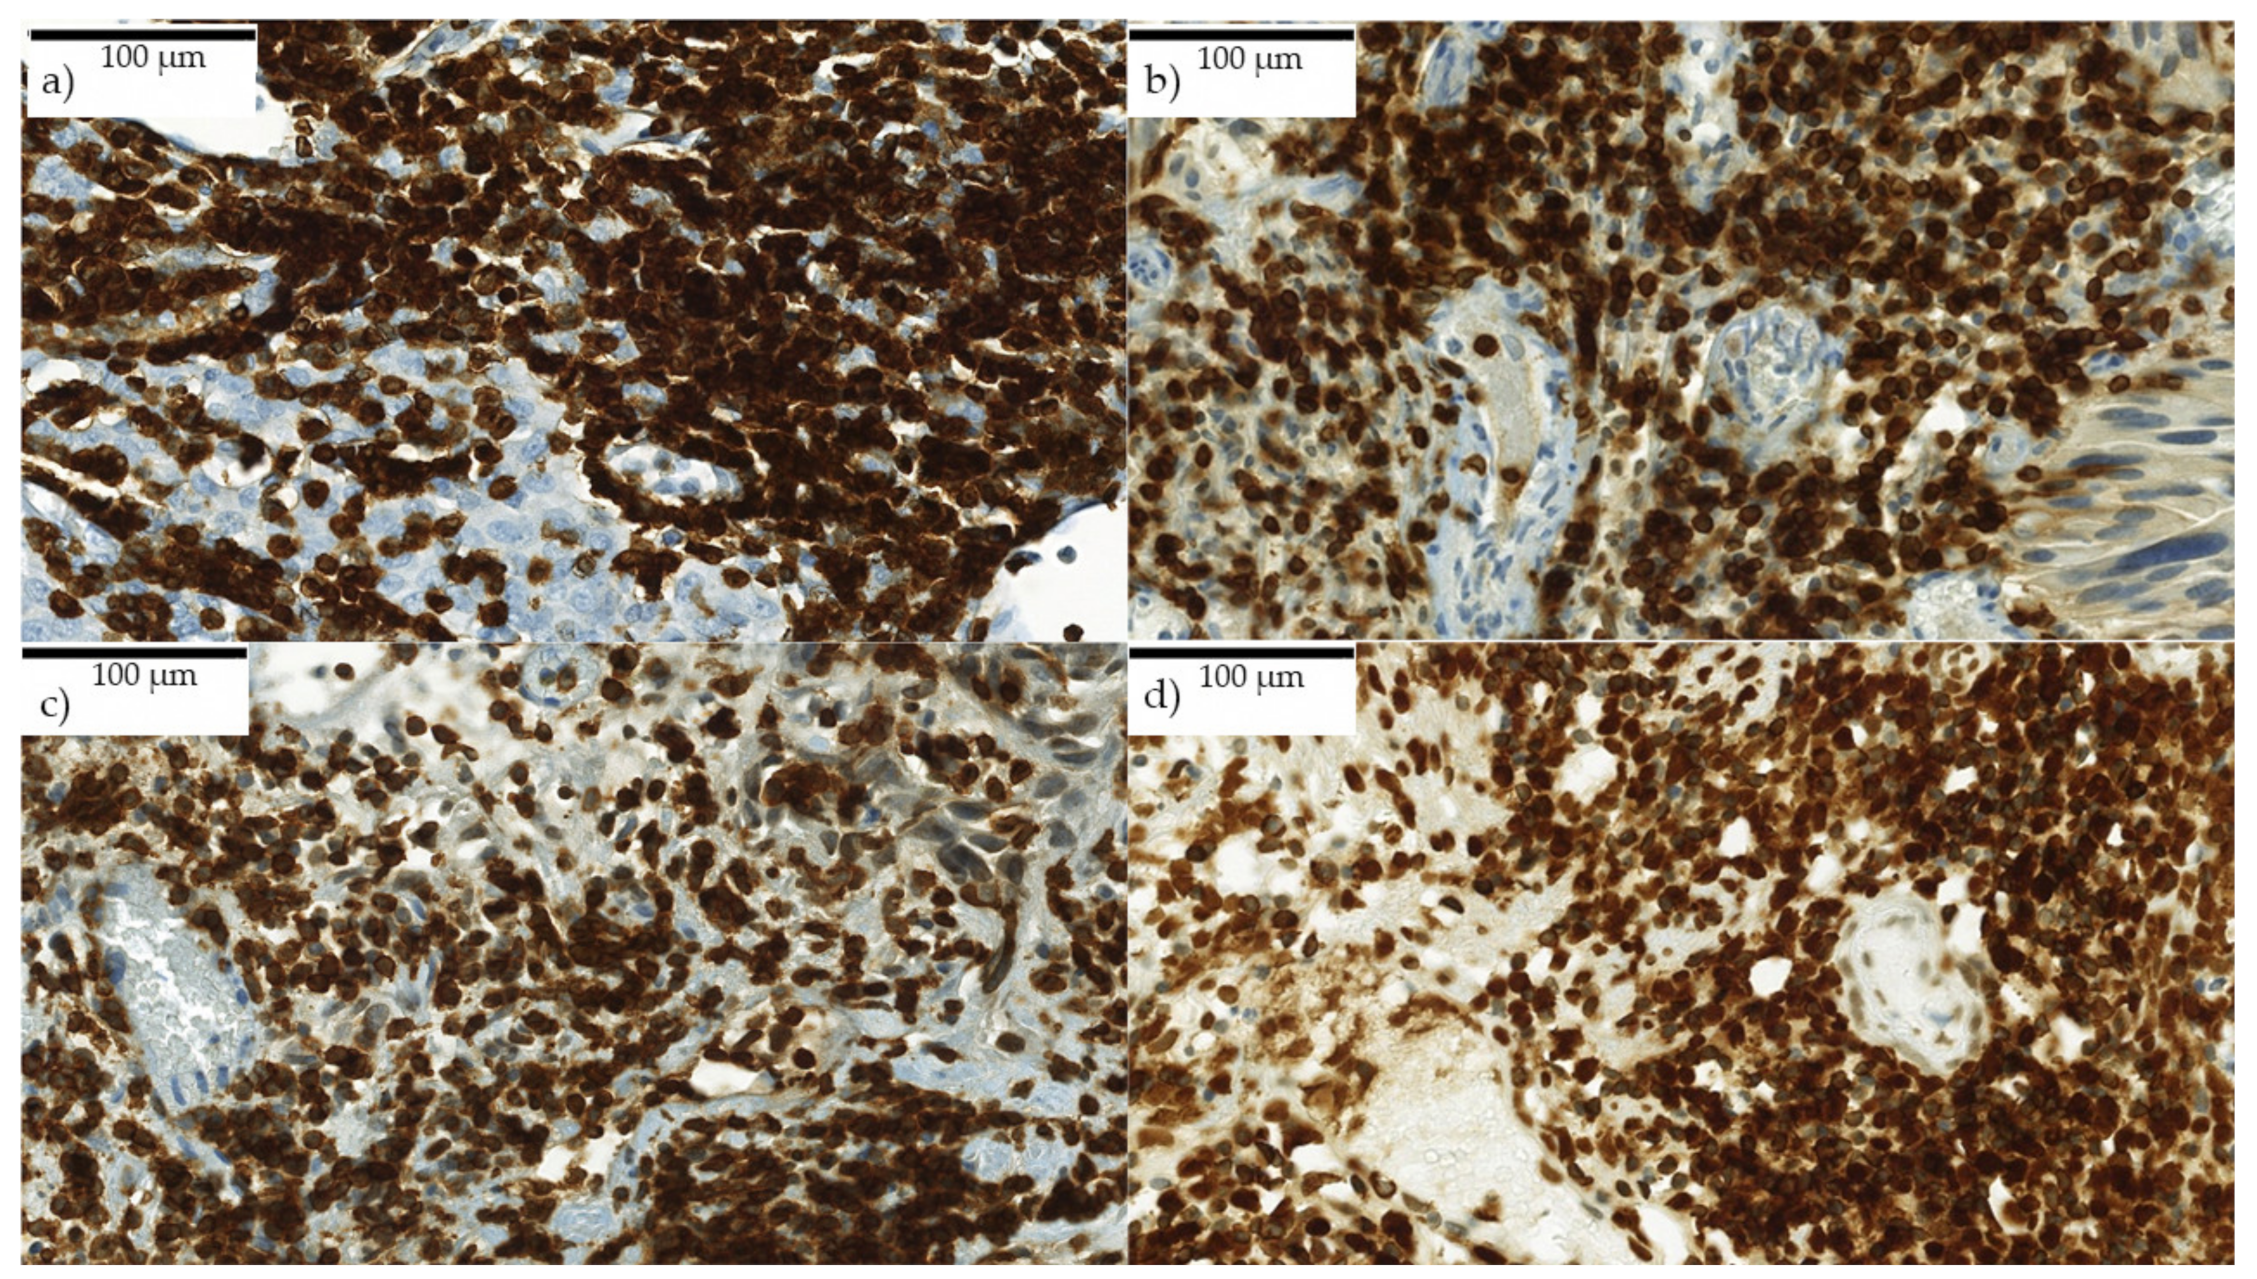
2.1. T-Cell Infiltration Patterns in Stroma and Tumor
2.2. T-Cell Infiltration in Stroma
2.3. T-Cell Infiltration in Tumor
2.4. Tertiary Lymphoid Structures
2.5. Clinicopathological Data and Survival Endpoints
3. Discussion
4. Materials and Methods
4.1. Clinicopathological Data
4.2. Immunhistochemistry and Quantification
4.3. Digital Image Analysis and Region of Interest (ROI) Selection
4.4. Statistics
5. Conclusions
Supplementary Materials
Author Contributions
Funding
Research Ethics
Acknowledgments
Conflicts of Interest
Abbreviations
| BC | bladder cancer |
| BCG | bacillus Calmette–Guérin |
| BRIDGE | Bladder Cancer Research Initiative for Drug Targets Germany |
| CSS | cancer-specific survival |
| DFS EAU | disease-free survival European Association of Urology |
| HPF | high power field |
| LA | lymphocyte aggregates |
| MD | medical doctor |
| MIBC | muscle-invasive bladder cancer |
| NMIBC | non-muscle-invasive bladder cancer |
| OS | overall survival |
| PFS | progression-free survival |
| RFS | recurrence-free survival |
| ROI | region of interest |
| TILs | tumor-infiltrating lymphocytes |
| TLS | tertiary lymphoid structures |
| TURB | transurethral resection of the bladder |
| WHO | World Health Organization |
References
- Bray, F.; Me, J.F.; Soerjomataram, I.; Siegel, R.L.; Torre, L.A.; Jemal, A. Global cancer statistics 2018: GLOBOCAN estimates of incidence and mortality worldwide for 36 cancers in 185 countries. CA A Cancer J. Clin. 2018, 68, 394–424. [Google Scholar] [CrossRef] [PubMed] [Green Version]
- Babjuk, M.; Böhle, A.; Burger, M.; Capoun, O.; Cohen, D.; Compérat, E.; Hernández, V.; Kaasinen, E.; Palou, J.; Rouprêt, M.; et al. EAU Guidelines on Non–Muscle-invasive Urothelial Carcinoma of the Bladder: Update 2016. Eur. Urol. 2017, 71, 447–461. [Google Scholar] [CrossRef]
- Shahin, O.; Thalmann, G.N.; Rentsch, C.; Mazzucchelli, L.; Studer, U.E. A retrospective analysis of 152 patients treated with or withour intravesical bacillus calmette-guerin for primary stage T1 grade 3 bladder cancer: Recurrence, progression and survival. J. Urol. 2003, 169, 96–100. [Google Scholar] [CrossRef]
- Van Den Bosch, S.; Witjes., J.A. Long-term Cancer-specific Survival in Patients with High-risk, Non–muscle-invasive Bladder Cancer and Tumour Progression: A Systematic Review. Eur. Urol. 2011, 60, 493–500. [Google Scholar] [CrossRef] [PubMed]
- Pagès, F.; Galon, J.; Dieu-Nosjean, M.-C.; Tartour, E.; Sautès-Fridman, C.; Fridman, W.-H. Immune infiltration in human tumors: A prognostic factor that should not be ignored. Oncogene 2009, 29, 1093–1102. [Google Scholar] [CrossRef] [PubMed] [Green Version]
- Hermitte, F. Biomarkers immune monitoring technology primer: Immunoscore® Colon. J. Immuno. Ther. Cancer 2016, 4, 57. [Google Scholar] [CrossRef] [PubMed] [Green Version]
- Yao, Q.; Bao, X.; Xue, R.; Liu, H.; Liu, H.; Li, J.; Dong, J.; Duan, Z.; Ren, M.; Zhao, J.; et al. Prognostic value of immunoscore to identify mortality outcomes in adults with HBV-related primary hepatocellular carcinoma. Medicine 2017, 96, e6735. [Google Scholar] [CrossRef]
- Jiang, Y.; Zhang, Q.; Hu, Y.; Li, T.; Yu, J.; Zhao, L.; Ye, G.; Deng, H.; Mou, T.; Cai, S.; et al. ImmunoScore Signature. Ann. Surg. 2018, 267, 504–513. [Google Scholar] [CrossRef]
- Galon, J.; Pagès, F.; Marincola, F.M.; Angell, H.K.; Thurin, M.; Lugli, A.; Zlobec, I.; Berger, A.; Bifulco, C.B.; Botti, G.; et al. Cancer classification using the Immunoscore: A worldwide task force. J. Transl. Med. 2012, 10, 205. [Google Scholar] [CrossRef]
- Pfannstiel, C.; Strissel, P.L.; Chiappinelli, K.B.; Sikic, D.; Wach, S.; Wirtz, R.M.; Wullweber, A.; Taubert, H.; Breyer, J.; Otto, W.; et al. The Tumor Immune Microenvironment Drives a Prognostic Relevance That Correlates with Bladder Cancer Subtypes. Cancer Immunol. Res. 2019, 7, 923–938. [Google Scholar] [CrossRef] [PubMed]
- Otto, W. Stage T1 bladder cancer: Historic background and latest tracks for its demystification. Transl. Androl. Urol. 2018, 7, 760–763. [Google Scholar] [CrossRef]
- Otto, W.; Van Rhijn, B.W.; Breyer, J.; Bertz, S.; Eckstein, M.; Mayr, R.; Lausenmeyer, E.M.; Denzinger, S.; Burger, M.; Hartmann, A. Infiltrative lamina propria invasion pattern as an independent predictor for cancer-specific and overall survival of instillation treatment-naïve stage T1 high-grade urothelial bladder cancer. Int. J. Urol. 2018, 25, 442–449. [Google Scholar] [CrossRef] [Green Version]
- Hedegaard, J.; Lamy, P.; Nordentoft, I.; Algaba, F.; Høyer, S.; Ulhøi, B.P.; Vang, S.; Reinert, T.; Hermann, G.G.; Mogensen, K.; et al. Comprehensive Transcriptional Analysis of Early-Stage Urothelial Carcinoma. Cancer Cell 2016, 30, 27–42. [Google Scholar] [CrossRef]
- Galon, J.; Costes, A.; Sanchez-Cabo, F.; Kirilovsky, A.; Mlecnik, B.; Lagorce-Pagès, C.; Tosolini, M.; Camus, M.; Berger, A.; Wind, P.; et al. Type, Density, and Location of Immune Cells Within Human Colorectal Tumors Predict Clinical Outcome. Science 2006, 313, 1960–1964. [Google Scholar] [CrossRef] [Green Version]
- Bergman, E.A.; Hartana, C.A.; Johansson, M.; Linton, L.B.; Berglund, S.; Hyllienmark, M.; Lundgren, C.; Holmström, B.; Palmqvist, K.; Hansson, J.; et al. Increased CD4+ T cell lineage commitment determined by CpG methylation correlates with better prognosis in urinary bladder cancer patients. Clin. Epigenetics 2018, 10, 102. [Google Scholar] [CrossRef] [PubMed]
- Shi, M.-J.; Meng, X.-Y.; Wu, Q.-J.; Zhou, X.-H. High CD3D/CD4 ratio predicts better survival in muscle-invasive bladder cancer. Cancer Manag. Res. 2019, 11, 2987–2995. [Google Scholar] [CrossRef] [Green Version]
- Sharma, P.; Shen, Y.; Wen, S.; Yamada, S.; Jungbluth, A.A.; Gnjatic, S.; Bajorin, D.F.; Reuter, V.E.; Herr, H.; Old, L.J.; et al. CD8 tumor-infiltrating lymphocytes are predictive of survival in muscle-invasive urothelial carcinoma. Proc. Natl. Acad. Sci. USA 2007, 104, 3967–3972. [Google Scholar] [CrossRef] [Green Version]
- Otto, W.; Denzinger, S.; Wieland, W.F.; Hartmann, A. First analysis of immune cell infiltration in stage pT1 urothelial bladder carcinoma: CD3 positivity as a prognostic marker for cancer-specific survival. World J. Urol. 2012, 30, 875–877. [Google Scholar] [CrossRef]
- Ingels, A.; Salas, R.E.S.; Ravery, V.; Fromont-Hankard, G.; Validire, P.; Patard, J.-J.; Pignot, G.; Prapotnich, D.; Olivier, F.; Galiano, M.; et al. T-helper 1 immunoreaction influences survival in muscle-invasive bladder cancer: Proof of concept. Ecancermedicalscience 2014, 8. [Google Scholar] [CrossRef] [Green Version]
- Lipponen, P.K.; Eskelinen, M.J.; Jauhiainen, K.; Harju, E.; Terho, R. Tumor infiltrating lymphocytes as an independent prognostic factor in transitional cell bladder cancer. Eur. J. Cancer 1992, 29A, 69–75. [Google Scholar]
- Wang, B.; Pan, W.; Yang, M.; Yang, W.; He, W.; Chen, X.; Bi, J.; Jiang, N.; Huang, J.; Lin, T. Programmed death ligand-1 is associated with tumor infiltrating lymphocytes and poorer survival in urothelial cell carcinoma of the bladder. Cancer Sci. 2018, 110, 489–498. [Google Scholar] [CrossRef]
- Yu, A.; Mansure, J.J.; Solanki, S.K.; Siemens, D.R.; Koti, M.; Dias, A.B.T.; Burnier, M.M.; Brimo, F.; Kassouf, W. Presence of lymphocytic infiltrate cytotoxic T lymphocyte CD3+, CD8+, and immunoscore as prognostic marker in patients after radical cystectomy. PLoS ONE 2018, 13, e0205746. [Google Scholar] [CrossRef]
- Leitlinienprogramm Onkologie (Deutsche Krebsgesellschaft, Deutsche Krebshilfe, AWMF): S3-Leitlinie zur Früherkennung, Diagnose, Therapie und Nachsorge des Harnblasenkarzinoms, Leitlinienreport1.1. AWMF-Registrierungsnummer 032/038OL, Version 1.1. 2016, pp. 1–371. Available online: http://leitlinienprogramm-onkologie.de/Blasenkarzinom.92.0.html (accessed on 20 November 2016).


Publisher’s Note: MDPI stays neutral with regard to jurisdictional claims in published maps and institutional affiliations. |
© 2020 by the authors. Licensee MDPI, Basel, Switzerland. This article is an open access article distributed under the terms and conditions of the Creative Commons Attribution (CC BY) license (http://creativecommons.org/licenses/by/4.0/).
Share and Cite
Hülsen, S.; Lippolis, E.; Ferrazzi, F.; Otto, W.; Distel, L.; Fietkau, R.; Denzinger, S.; Breyer, J.; Burger, M.; Bertz, S.; et al. High Stroma T-Cell Infiltration is Associated with Better Survival in Stage pT1 Bladder Cancer. Int. J. Mol. Sci. 2020, 21, 8407. https://doi.org/10.3390/ijms21218407
Hülsen S, Lippolis E, Ferrazzi F, Otto W, Distel L, Fietkau R, Denzinger S, Breyer J, Burger M, Bertz S, et al. High Stroma T-Cell Infiltration is Associated with Better Survival in Stage pT1 Bladder Cancer. International Journal of Molecular Sciences. 2020; 21(21):8407. https://doi.org/10.3390/ijms21218407
Chicago/Turabian StyleHülsen, Sabine, Eleonora Lippolis, Fulvia Ferrazzi, Wolfgang Otto, Luitpold Distel, Rainer Fietkau, Stefan Denzinger, Johannes Breyer, Maximilian Burger, Simone Bertz, and et al. 2020. "High Stroma T-Cell Infiltration is Associated with Better Survival in Stage pT1 Bladder Cancer" International Journal of Molecular Sciences 21, no. 21: 8407. https://doi.org/10.3390/ijms21218407