Article

Photosystem Disorder Could be the Key Cause for the Formation of Albino Leaf Phenotype in Pecan

Institute of Botany, Jiangsu Province and Chinese Academy of Sciences, Nanjing 210014, China
*
Author to whom correspondence should be addressed.
Int. J. Mol. Sci. 2020, 21(17), 6137; https://doi.org/10.3390/ijms21176137
Submission received: 31 July 2020 / Revised: 15 August 2020 / Accepted: 20 August 2020 / Published: 26 August 2020
(This article belongs to the Section Molecular Plant Sciences)

Abstract

:
Pecan is one of the most famous nut species in the world. The phenotype of mutants with albino leaves was found in the process of seeding pecan, providing ideal material for the study of the molecular mechanisms leading to the chlorina phenotype in plants. Both chlorophyll a and chlorophyll b contents in albino leaves (ALs) were significantly lower than those in green leaves (GLs). A total of 5171 differentially expression genes (DEGs) were identified in the comparison of ALs vs. GLs using high-throughput transcriptome sequencing; 2216 DEGs (42.85%) were upregulated and 2955 DEGs (57.15%) were downregulated. The expressions of genes related to chlorophyll biosynthesis (HEMA1, encoding glutamyl-tRNA reductase; ChlH, encoding Mg-protoporphyrin IX chelatase (Mg-chelatase) H subunit; CRD, encoding Mg-protoporphyrin IX monomethylester cyclase; POR, encoding protochlorophyllide reductase) in ALs were significantly lower than those in GLs. However, the expressions of genes related to chlorophyll degradation (PAO, encoding pheophorbide a oxygenase) in ALs were significantly higher than those in GLs, indicating that disturbance of chlorophyll a biosynthesis and intensification of chlorophyll degradation lead to the absence of chlorophyll in ALs of pecan. A total of 72 DEGs associated with photosynthesis pathway were identified in ALs compared to GLs, including photosystem I (15), photosystem II (19), cytochrome b6-f complex (3), photosynthetic electron transport (6), F-type ATPase (7), and photosynthesis-antenna proteins (22). Moreover, almost all the genes (68) mapped in the photosynthesis pathway showed decreased expression in ALs compared to GLs, declaring that the photosynthetic system embedded within the thylakoid membrane of chloroplast was disturbed in ALs of pecan. This study provides a theoretical basis for elucidating the molecular mechanism underlying the phenotype of chlorina seedlings of pecan.

1. Introduction

Plants synthesize the carbohydrates and energy needed for growth and development through photosynthesis in leaves. Leaf color directly affects photosynthesis. Usually, the leaf color is green; however, leaf color variations, including chlorina, albino, red, and green leaves, with white or yellow interion, have been observed in plenty of plants, such as tea plant [1,2,3], Anthurium andraeanum [4], red maple [5], and oilseed rapa [6]. To our knowledge, the occurrence of leaf color variations is a very complex biological process and is largely determined by genetic and environmental factors. Mutants with leaf color variations are ideal genetic material for exploring the physiological, biochemical, and molecular mechanisms of chlorophyll biosynthesis, chloroplast structure and function, and photosynthesis. Dismembering the leaf color variations’ fundamental mechanism is all-important for broadening the theoretical knowledge of plant growth and development.
The key aspects influencing leaf color formation are the contents of chlorophyll, carotenoid, and anthocyanin. Chlorophyll, which is synthesized in chloroplasts, is the major component in typical green leaves. The chloroplast is composed of the chloroplast membrane, thylakoid, and matrix. Chloroplast development, the number and size of chloroplasts, and chlorophyll biosynthesis in the leaf directly affect its color. Therefore, any fault in these processes can lead to the leaf losing the green color. Previous reports have shown that the expression of genes related to chloroplast development and chlorophyll biosynthesis can result in variations in leaf color. Those genes directly or indirectly regulate the structure of chloroplasts, chlorophyll biosynthesis, and several metabolic processes that affect the depth of leaf color have been identified in leaf color mutants [1,4,7,8,9]. Moreover, the variations of leaf color are affected by environmental factors, including light and temperature. Thus, it is very difficult to declare the leaf color variation mechanism due to the variations in leaf color being affected by complex environmental factors.
The pecan (Carya illinoensis), native to North America, is one of the most important economic nut trees in the world. Since the 21st century, the pecan industry has been rapidly developed in China. Some albino leaf seedlings were found from the pecan seed seedlings, which provided new ideal material for studying the molecular mechanism of leaf color formation. The mechanism of leaf color formation in pecan has not been investigated in detail so far. The pecan whole genome has been sequenced and reported [10,11], providing abundant genetic information for research on the transcriptome. Thus, the chlorophyll and carotenoid contents of the albino leaf (AL) and green leaf (GL) were measured in this study. Leaf transcriptomes from GL and AL were sequenced and differentially expressed genes between GL and AL were identified to fully understand the gene expression difference between AL and GL and explore the cause of albino leaf formation in pecan. This study will broaden our understanding of phenotypes in the leaf color variants. The results provide an appreciated resource for genetic and genomic studies in plants for leaf color formation.

2. Results

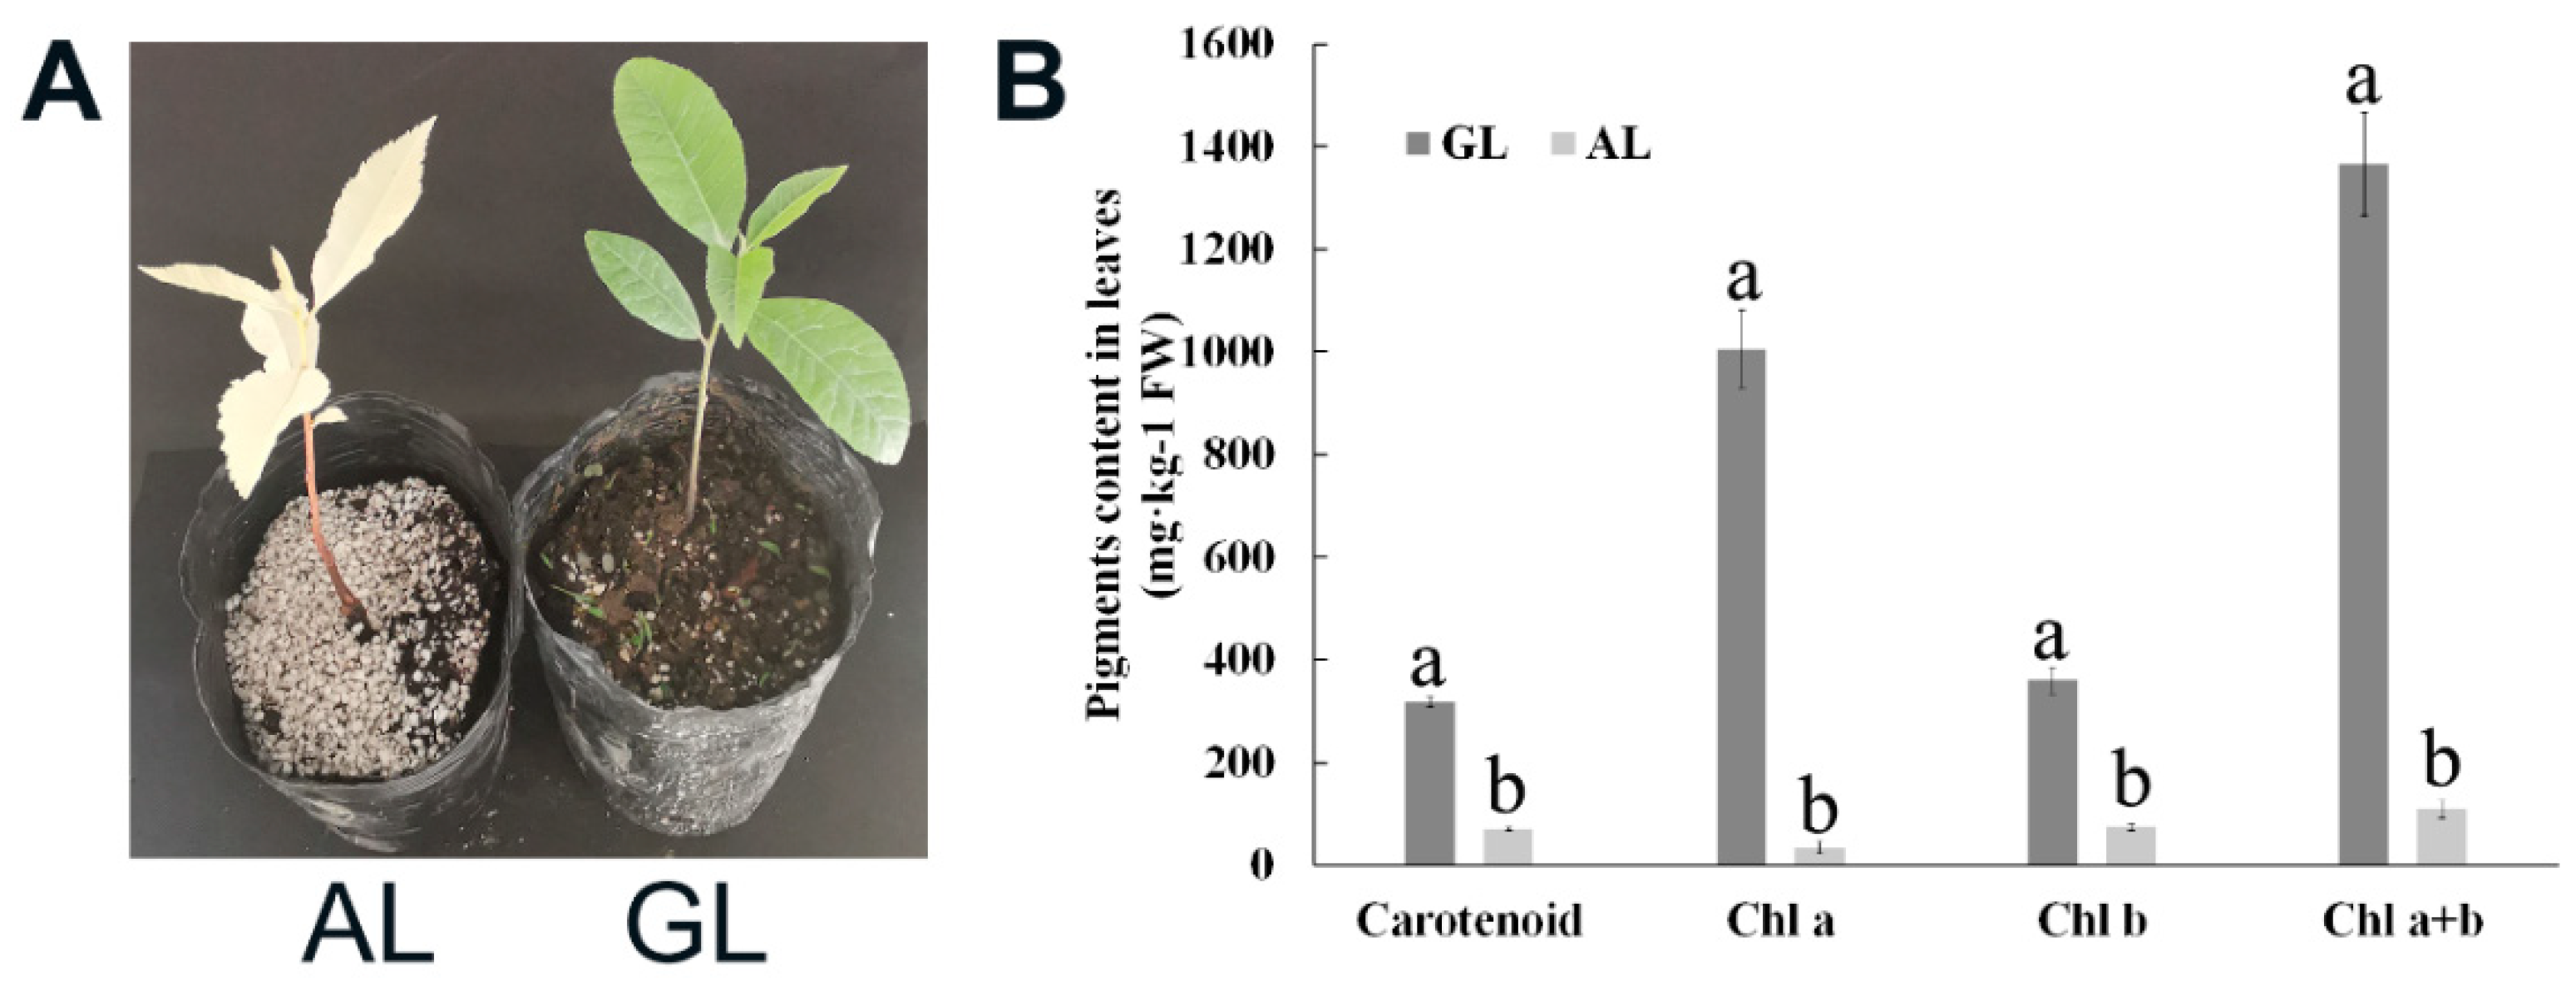
2.1. Content of Chlorophyll and Carotenoid in Green and Albino Leaves in Pecan

A few pecan seedlings with albino leaves were found during the progress of seeding (Figure S1). It is well known that chlorophyll biosynthesis leads to leaf greening, and the chlorophyll contents of leaves from green leaf (GL) seedlings and albino leaf (AL) seedlings were measured, respectively (Figure 1). The results showed that in AL, both chlorophyll a and chlorophyll b contents were significantly lower than those in GL (approximately 3.46% and 20.87% of the contents in GL, respectively; Figure 1B). The ratio of chlorophyll a/b in GL was significantly lower than that in AL (Table S1). The carotenoid contents in AL were significantly lower than those in GL (Figure 1B), and the ratio of carotenoid/chlorophyll in AL was significantly high than that in GL (Table S1). These results suggested that albino leaves result from reduced chlorophyll levels and that the lower chlorophyll content might have resulted from abnormal chlorophyll biosynthesis and degradation.

2.2. RNA Sequencing of Leaf Transcriptomes of the GL and AL Seedlings and Mapping of RNA Sequences to the Reference Genome

RNA-seq, followed by strict quality control and processing, generated a total of 32.35 GB of clean data from 6 transcriptome libraries. The six transcriptome libraries represented two groups with three repetitions. After filtering out duplicate sequences and ambiguous and low-quality reads, we obtained a total of 231, 590, and 820 high-quality (HQ) clean reads: 115, 546, and 190 reads and 116, 044, and 630 reads were generated for GL and AL, respectively (Table S2). The average GC percentage was 45.51%, with a QC30 base percentage above 90.01%. Details on data and data quality, before and after filtering, are shown in Table S3. HQ clean reads were mapped to the pecan reference genome (Cil.genome.fa). Approximately 35.83 million clean reads (92.81% of the total) were mapped; 34.91 million were unique. An overview and detailed data are given in Table 1 and Table S2.

2.3. Differentially Expressed Gene Analysis

Three biological replicates were used for RNA-seq. To test sample repeatability, we calculated the correlation coefficient between the samples. The correlation coefficient in the repeat group was greater than 0.9375 (Figure S2), indicating the consistency among the three biological replicates. Thus, the RNA-seq results were confirmed to be highly reliable for further analyses.
In the current study, a total of 5171 DEGs was identified in the comparison of AL vs. GL; 2216 DEGs (42.85%) were upregulated, and 2955 DEGs (57.15%) were downregulated (Table S3). Additionally, 4389 out of the 5171 DEGs (84.88%) were aligned to known proteins in the nr database, whereas 3596 (69.54%) could be annotated based on sequences in the Swiss-Prot database (Table 2 and Table S4). Moreover, 1546 (29.90%) DEGs were categorized in 25 cluster of orthologous groups of proteins (COG) (Figure 2A and Table 2). The three largest categories were (1) general function prediction only (415, 26.84%), (2) transcription (191, 12.35%), and (3) carbohydrate transport and metabolism (190, 12.29%).
In total, 3337 DEGs (64.53%) were categorized into three different GO trees of cellular components, molecular functions, and biological processes (Figure 2B, Table 2 and Table S5). The three main categories were further classified into 51 functional groups. In the category of cellular components, the largest groups were cell, cell part, and organelle. Binding, catalytic activity, and transcription regulator activity were the dominant groups in the molecular function category, and for the biological processes, DEGs with cellular process, metabolic process, and response to stimulus formed the major groups. The top-ten enrichment of GO were chloroplast thylakoid membrane, photosystem I, photosystem II, chlorophyll binding, reductive pentose–phosphate cycle photosynthesis, light-harvesting in photosynthesis, pigment binding, chloroplast envelope, photosynthesis, and integral component of membrane (Table S6). Furthermore, in order to understand the biological function of these DEGs, all DEGs were also mapped to terms in the KEGG database. Finally, 939 (18.16%) DEGs were matched and assigned to 128 KEGG pathways (Table S7). The first three biological pathways involved in photosynthesis (51), photosynthesis-antenna proteins (22), and metabolic pathways (360) were significantly enriched between AL and GL1 (Table 3).

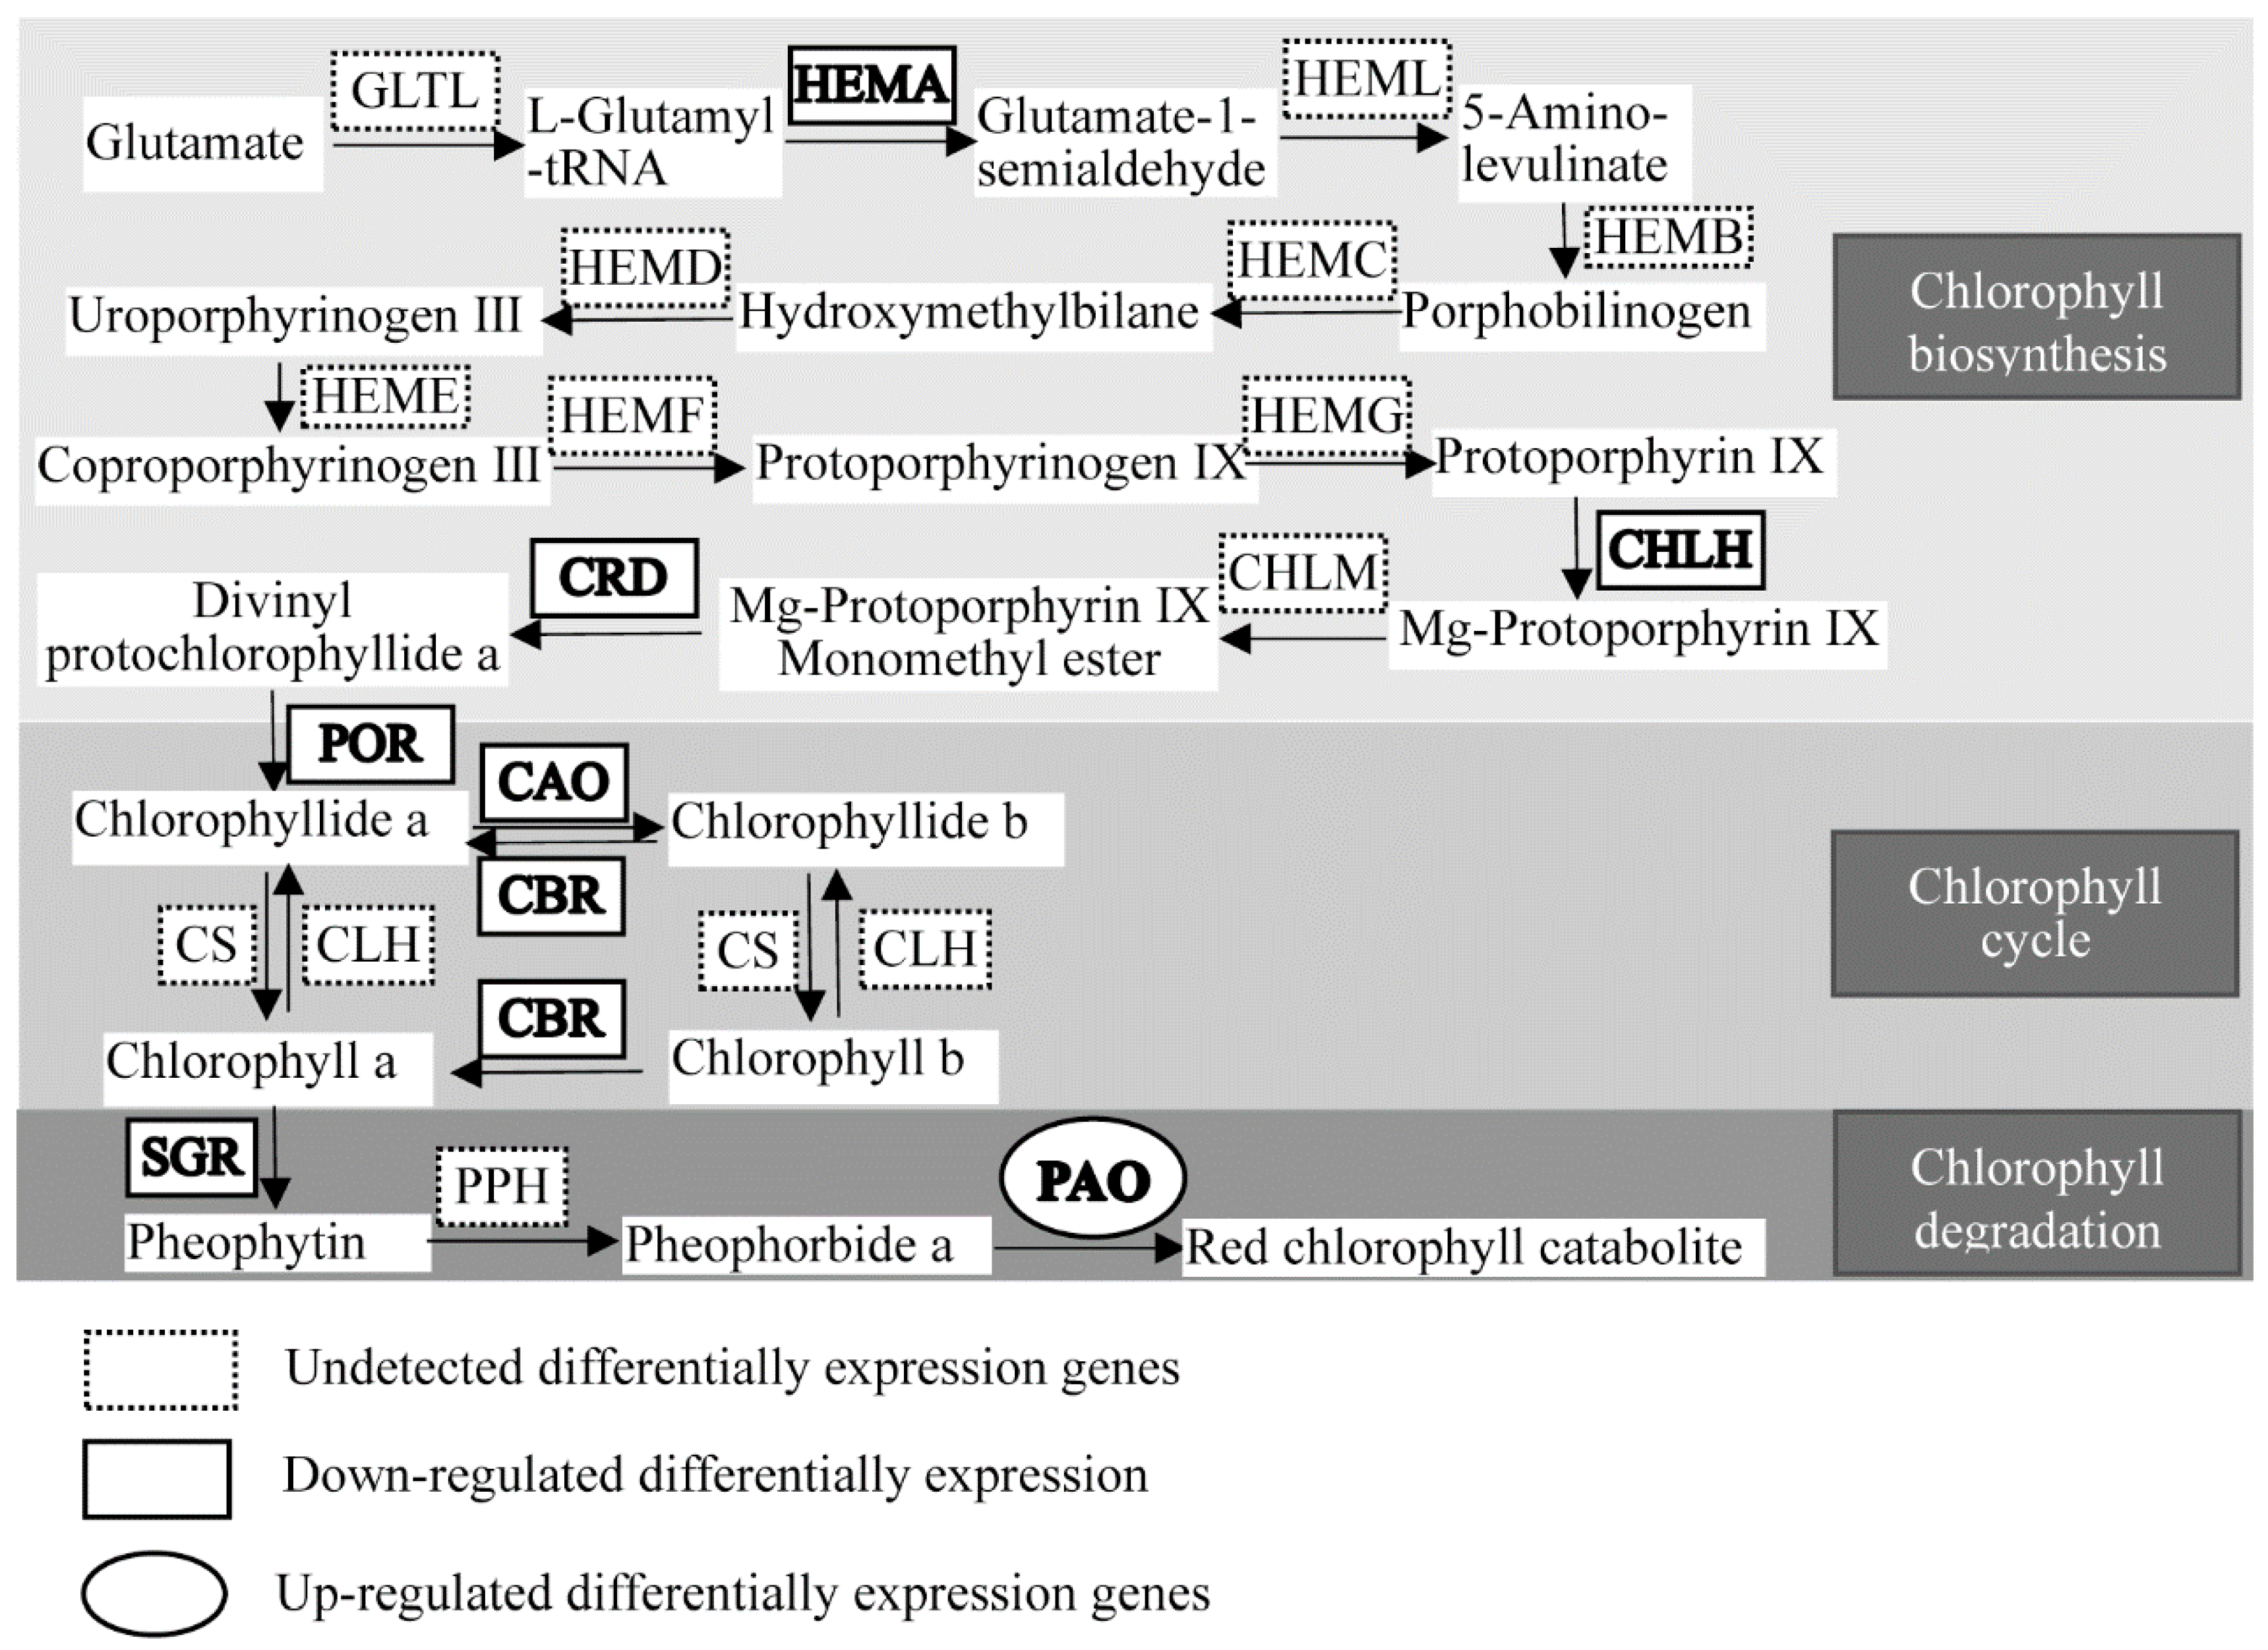
2.4. Chlorophyll Metabolism-Related Genes Expression Analysis

To validate the RNA sequencing data, chlorophyll metabolism-related genes were selected for qRT-PCR analysis. The qRT-PCR results indicated that all of these DEGs exhibited similar expression kinetics to those obtained from the RNA sequencing analysis (Figure S3), thus supporting the validity of the method used for determining DEGs from the RNA sequencing analysis.
Twelve genes involved in chlorophyll metabolism, including biosynthesis, cycle, and degradation, were expressed differentially in the comparison of AL vs. GL using de novo transcriptome sequencing (Table 4 and Figure 3). In chlorophyll biosynthesis, HEMA1 (encoding glutamyl-tRNA reductase), ChlH (encoding Mg-protoporphyrin IX chelatase (Mg-chelatase) H subunit), CRD (encoding Mg-protoporphyrin IX monomethylester cyclase), and POR (encoding protochlorophyllide reductase) showed significantly lower expression in ALs than in GLs, indicating that chlorophyll biosynthesis was downregulated in ALs. Among genes related to the chlorophyll cycle, the expression of two CAO (encoding chlorophyllide a oxygenase) and three CBR (encoding chlorophyll (ide) b reductase NYC1) genes were also significantly lower in expression in ALs than in GLs. Among DEGs related to chlorophyll degradation, the expression of SGR (STAY-GREEN, encoding Mg-dechelatase) in ALs were significantly lower than those in GLs. However, two PAO (encoding pheophorbide a oxygenase) genes in ALs were significantly higher than those in GLs, indicated that chlorophyll degradation was upregulated in ALs.

2.5. Identified Differentially Expressed Genes Involved in Photosynthesis

A total of 72 DEGs associated with the photosynthesis pathway was identified in AL compared to GL (Table 5), including PSI (15), PSII (19), cytochrome b6-f complex (3), photosynthetic electron transport (6), F-type ATPase (7), and photosynthesis-antenna proteins (22). Moreover, almost all the genes (68) mapped in the photosynthesis pathway showed decreased expression in AL compared to GL except for PsaC (PSI, MSTRG.1756), petH (photosynthetic electron transport, CIL1219S0022), A (F-type ATPase, CIL0936S0006), and B (F-type ATPase, MSTRG.3669). The expressions of PsaA, PsaD, PsaE (2), PsaF, PsaG, PsaH (2), PsaK (2), PsaL, PsaN (2), and PsaO in PSI were downregulated in AL compared to GL; however, only the PsaC expression was upregulated. All of the DEGs in PSII were downregulated, including PsbA, PsbB (2), PsbK (2), PsbO, PsbP (3) PsbQ (3), PsbR, PsbS (2), PsbW (2), PsbY, and Psb27-H1. A petB and 2 petCs related to the cytochrome b6-f complex revealed a significant reduction in their expression levels. Additionally, 6 genes involved in the photosynthetic electron transport unveiled that petEs (CIL0131S0022 and CIL1192S0070), petF, petH, and petJ were downregulated and only one transcript of petH (CIL1219S0022) was upregulated when compared with control. Among the F-type ATPase-related DEGs, the expressions of 5 genes (atpB, atpC, atpD, atpH, and atpB) were downregulated and 2 genes (A and B) were upregulated in AL compared to GL. In addition, all of the photosynthesis-antenna protein-related genes (22) were found to be significantly downregulated in AL compared to GL, including LHCA1(2), LHCA2(2), LHCA3, LHCA4, LHCA5, LHCA6, LHCB1(4), LHCB2, LHCB3(2), LHCB4(2), LHCB5(3), and LHCB6(2) (Table 5). The results show that these genes may be associated with the leaf color variation and that the photosynthesis pathway was destroyed in ALs of pecan.

2.6. Response of Transcription Factors in the Comparison of AL vs. GL

Differentially expressed transcription factor genes were analyzed to identify the transcription factors involved in the regulation of chlorophyll metabolism in pecan (Table 6 and Table S8). Forty-two categories of different transcription factor families were identified in the comparison of AL and GL in this study (Table 2 and Table S8). We identified 40 MYB transcription factors expressed differentially and significantly, including 16 upregulated and 24 downregulated members, suggesting that MYB transcription factors could be involved in chlorophyll metabolism. Among the AP2/ERF transcription factor family, 23 members were upregulated and 12 members were downregulated in AL compared with GL. NAC, C2C2, C2H2, bHLH, and WRKY transcription factor families were over-represented in the list of regulated genes, indicating that those transcription factor families probably also play key roles in the transcriptional regulation of genes in the chlorophyll metabolism of pecan.

3. Discussions

A few pecan seedlings with albino leaves were found during the progress of seeding (Figure S1). Chlorophyll content was significantly lower than that in GL (Figure 1B), suggesting that the albino leaves resulted from reduced chlorophyll levels. In order to elucidate the key factors in the formation of AL mutation of pecan, de novo transcriptome sequencing and comparative analysis of DEGs were performed in comparing AL vs. GL. GO classification showed that genes associated with the chloroplast thylakoid membrane, photosystem I, photosystem II, chlorophyll binding, reductive pentose–phosphate cycle photosynthesis, light-harvesting in photosynthesis, pigment binding, chloroplast envelope, and photosynthesis (Table S6) were highly represented among the significantly regulated genes in AL. Additionally, the result showed that many of the genes related to photosynthesis were transcriptionally downregulated in AL.
Chlorophyll metabolism, including chlorophyll biosynthesis, chlorophyll cycling, and chlorophyll degradation, is a complex biological process in plants. Twelve genes engaging 10 enzymes exhibited significant regulation in AL. One of the key factors was that the content of chlorophyll was much lower in AL than in GL. The expression of four chlorophyll biosynthesis genes (encoding HEMA, CHLH, CRD, and POR) was lower in AL than in GL. It has been reported that these enzymes are considered key enzymes for chlorophyll biosynthesis during photomorphogenesis in plants [12,13,14,15,16,17]. Due to the remarkably low levels of expression of these genes, we conclude that chlorophyll biosynthesis activity is lower in AL than in GL. This would explain why the content of chlorophyll a in AL was much lower than in GL. The interconversion of chlorophyll a and chlorophyll b is called the “chlorophyll cycle” [18,19]. Previous studies have reported that a portion of chlorophyll a was converted to chlorophyll b through the activity of CAO. Additionally, chlorophyll b can be reversibly converted to chlorophyll a through 7-hydroxymethyl chlorophyll-a via CBR and 7-hydroxymethyl chlorophyll a reductase (HCAR) [20,21,22]. Two members of CAO and three members of CBR were downregulated in AL. This might explain why the contents of chlorophyll-a and chlorophyll b in AL were lower than those in GL under the condition of disturbance of chlorophyll a biosynthesis. PAO, which encodes pheophorbide, a oxygenase, catalyzes the oxidation of pheophytin a. Chen et al. reported that the chlorophyll degradation pathway is also called the “PAO pathway” [5]. In our study, compared to GL, two members of PAO expression levels in AL were upregulated, suggesting that chlorophyll degradation was enhanced in ALs of pecan. Based on our results, we hypothesize that the disturbance of chlorophyll a biosynthesis and intensification of chlorophyll degradation lead to the absence of chlorophyll in ALs of pecan.
Abnormal chloroplast structure was observed in yellow and variegated leaves compared with green leaves in C. sinensis, and the expression levels of the proteins related to the chlorophyll a-b binding protein, plastid-encoded genes (Lhcb, rbcL, rbcS, psaA, and psbA), photosystem I P700 chlorophyll A apoprotein A1, photosystem II Qb protein D1, and ribulose bisphosphate carboxylase were remarkably repressed in the variegated leaf, suggesting that the abnormal chloroplast profiles in yellow leaf and variegated leaf might be connected with the downregulation of the abovementioned proteins in C. sinensis [1]. The transcripts of differentially expressed proteins related to PSI subunits, PSII subunits, antenna proteins, cytochrome b6/f complex, and beta F-type ATPase were declined in yellow and variegated leaves compared with green leaves in C. sinensis [1]. Thus, a dramatic downregulation of proteins related to the photosystem might be linked to abnormal chloroplast profiles. In this study, most of the genes related to the PSI subunits, PSII subunits, cytochrome b6/f complex, photosynthetic electron transcript, F-type ATPase, and photosynthesis-antenna proteins were declined significantly in AL comparing with GL (Table 5), declaring that the photosynthetic system embedded within the thylakoid membrane of the chloroplast was disturbed in ALs of pecan.
Most of the transcript factors play important roles in developmental processes in plants [23]. In tomato fruit, SlMYB72 directly targets protochlorophyllide reductase, Mg-chelatase H subunit, and knotted1-like homeobox2 genes and regulates chlorophyll biosynthesis and chloroplast development [24]. Kiwifruit MYB7 plays a role in modulating carotenoid and chlorophyll pigment accumulation in tissues through transcriptional activation of metabolic pathway genes [25]. LfWRKY70, LfWRKY75, LfWRKY65, LfNAC1, LfSPL14, LfNAC100, and LfMYB113 were shown to be key regulators of leaf senescence, and the genes regulated by LfWRKY75, LfNAC1, and LfMYB113 are candidates to link chlorophyll degradation and anthocyanin biosynthesis to senescence in Formosan gum [26]. The LHCB members, which are the apoproteins of the light-harvesting complex of photosystem II, were shown to be targets of WRKY40. Additionally, the positive function of LHCBs was balanced through WRKY40 by repressing the expression of LHCB in ABA signaling [27]. The overexpression of SlNAC1 resulted in reduced carotenoids by altering carotenoid pathway flux and decreasing ethylene synthesis, mediated mainly by the reduced expression of ethylene biosynthetic genes of system-2 in tomato [28]. Reduced expression of SlNAC4 by RNA interference (RNAi) in tomato resulted in delayed fruit ripening, suppressed chlorophyll breakdown, and decreased ethylene synthesis [29]. Plenty of differentially expressed transcript factor members were identified in this study, including MYB, NAC, and WRKY (Table 6), indicating that those transcript factor members were involved in leaf formation in pecan.

4. Materials and Methods

4.1. Plant Materials and Sample Preparation

For this study, the mutant material with albino leaves was found in a nursery during the seedings of pecan (Figure S1). The seedlings were planted in seedbeds at the Institute of Botany, Jiangsu Province, and the Chinese Academy of Sciences, Jiangsu, China. The substrate contained peat, perlite, and vermiculite in the ratio 5:1:1. The growth conditions consisted of relative humidity of ~60%, a 12 h light/12 h dark photoperiod for 24 h, and a mean temperature of 25 °C. The albino leaves (ALs) and green leaves (GLs) were harvested from six-month-old seedlings. Three independent biological replicates were performed, and each replicate was collected from a pecan seedling. All samples were flash-frozen in liquid nitrogen and stored at −80 °C for future experiments.

4.2. Chlorophyll and Carotenoid Content Analysis

Chlorophyll and carotenoid contents were measured using high-performance liquid chromatography (HPLC), as published by Montefiori et al. [30]. Samples were ground into powder in liquid nitrogen and extracted with acetone. Chlorophyll and carotenoid contents were analyzed in biological triplicate.

4.3. RNA Isolation, cDNA Library Preparation and Sequencing

Total RNA was extracted from roots using the cetyltrimethylammonium bromide(CTAB) method [31] and then concentrated using oligo (dT) magnetic adsorption. The cDNA library was constructed using an Illumina TruSeq RNA Sample Preparation Kit (Illumina, San Diego, CA, United States). The samples were sequenced using the Illumina HiSeq 2000 machine in Nanjing Genepioneer Biotechnologies Co Ltd., China.

4.4. Analysis of Differentially Expressed Genes

After adaptor trimming and quality trimming, the clean reads were mapped to the pecan (Carya illinoensis) transcriptome (Cil.genome.fa, ftp://parrot.genomics.cn/gigadb/pub/10.5524/100001_101000/100571/) using HISAT2. The RPKM (reads per kilobase of exon model per million mapped reads) [32] values were preferred in order to measure the expression of reads using the software StringTie (The Center for Computational Biology at Johns Hopkins University, Baltimore, Maryland, United States). Gene expression differences between log 2 and early stationary phases were obtained by DESeq2 software (European Molecular Biology Laboratory, Heidelberg, Germany) [33]. We defined genes with at least 2-fold change between two samples and FDR (false discovery rate) less than 0.05 as differentially expressed genes. All differentially expressed gene sequences were searched against GenBank’s nonredundant (nr) protein, Swiss-Prot, KEGG, and COG databases using BLASTx to identify the most descriptive annotation for each sequence. In order to understand the biological functions of genes, gene ontology (GO) enrichment (p-value < 0.05) was studied by exposing all DEGs to the GO database (http://www.geneontology.org/) to further classify genes or their products into terms (molecular function, biological process, and cellular component). Pathway projects were performed according to the KEGG pathway database in order to perform pathway enrichment analysis of DEGs.

4.5. Illumina RNA-seq Result Validation by qRT-PCR

To validate the Illumina RNA-seq results, the differentially expressed genes related to chlorophyll metabolism were selected for qRT-PCR analysis. RNA was isolated from leaves using the abovementioned methods [31], and RNA quality and quantity met the requirements of the qRT-PCR experiment. First-strand cDNA synthesis was performed using the PrimeScript RT Reagent Kit with gDNA Eraser (Takara, Dalian, China) according to the manufacturer’s protocol. The primer sequences used were designed based on gene sequences and Beacon designer software (PREMIER Biosoft, San Francisco, CA, USA), as shown in Table S9 in this study. To ensure gene-specific amplification, normal PCR reactions were performed with the primers (Table S9) to amplify the target genes. A single PCR fragment of the expected size was amplified, suggesting that the primers were suitable for qRT-PCR analyses. The resulting PCR products were cloned and sequenced to confirm the expected fragment of the target genes. qRT-PCR was carried out, as previously described [34], on an Applied Biosystems 7300 Real-Time PCR System (Applied Biosystems, Waltham, MA, USA) using TaKaRa Company SYBR Premix Ex TaqTM II (Perfect Real Time, TaKaRa, code: DRR041A, Dalian, China). Dissociation curves from 55 to 95 °C were generated for each reaction to ensure specific amplification. The CiActin gene was used as a positive internal control [35]. The relative levels of genes to control actin mRNAs were analyzed using the 7300 System’s software (Applied Biosystems, Waltham, MA, USA) and the 2−DDCt method [36].

5. Conclusions

A total of 5171 DEGs was identified in the comparison of AL vs. GL through de novo transcriptome sequencing; 2216 DEGs (42.85%) were upregulated and 2955 DEGs (57.15%) were downregulated. Chlorophyll contents in AL were significantly lower than those in GL. Additionally, the expression of genes related to chlorophyll biosynthesis (HEMA1, ChlH, CRD, and POR) in AL was significantly suppressed and chlorophyll degradation (PAO) genes were enhanced in AL, suggesting that the disturbance of chlorophyll biosynthesis and the intensification of chlorophyll degradation lead to the absence of chlorophyll in ALs of pecan. Genes associated with the chloroplast thylakoid membrane, photosystem I, photosystem II, chlorophyll binding, reductive pentose–phosphate cycle photosynthesis, light-harvesting in photosynthesis, pigment binding, chloroplast envelope, and photosynthesis were highly represented in AL, indicating that photosynthesis was destroyed in ALs. Plenty of genes associated with photosynthesis were regulated in AL, declaring that the photosynthetic system embedded within the thylakoid membrane of chloroplast was disturbed in ALs of pecan. These results indicated that the photosynthetic system disturbance was the key cause for the formation of an albino leaf phenotype in pecan. This study provides the theoretical basis for elucidating the molecular mechanism underlying the phenotype of chlorina seedlings of pecan.

Supplementary Materials

The following are available online at https://www.mdpi.com/1422-0067/21/17/6137/s1, Figure S1: Albino leaf seedlings of pecan. Figure S2: The correlation coefficient in the repeat group of ALs and GLs. Figure S3: QRT-PCR analysis validation, Table S1: Content of chlorophyll and carotenoid in leaves of green leaves (GL) seedling and albino leaves (AL) seedling in pecan, Table S2: Information statistics of data after filtering and mapped to the pecan genome. Table S3: List of differentially expressed genes (DEGs) in albino leaf compared to green leaf. Table S4: Function annotation of DEGs. Table S5: Gene ontology (GO) functional annotation of DEGs. Table S6: GO function of DEGs. Table S7: KEGG pathway mapping. Table S8: Transcription factors differentially expressed in the comparison of AL vs GL. Table S9: Genes primers in this paper.

Author Contributions

J.-Y.Z. and G.W. designed the experiments and wrote the manuscript. J.-Y.Z., Y.-Z.L., T.W., and Z.-H.J. performed the experiments. J.-Y.Z., G.W., and Z.-R.G. analyzed the data. T.W. supervised the gene expression data analyses. All authors read and approved the final manuscript.

Funding

This study was supported by the Science and Technology project of Jiangsu in China (BE2016385).

Conflicts of Interest

The authors declare no conflict of interest.

References

  1. Ma, C.; Cao, J.; Li, J.; Zhou, B.; Tang, J.; Miao, A. Phenotypic, histological and proteomic analyses reveal multiple differences associated with chloroplast development in yellow and variegated variants from Camellia sinensis. Sci. Rep. 2016, 6, 33369. [Google Scholar] [CrossRef] [PubMed] [Green Version]
  2. Wang, L.; Yue, C.; Cao, H.; Zhou, Y.; Zeng, J.; Yang, Y.; Wang, X. Biochemical and transcriptome analyses of a novel chlorophyll-deficient chlorina tea plant cultivar. BMC Plant Boil. 2014, 14, 352. [Google Scholar] [CrossRef] [PubMed] [Green Version]
  3. Li, Q.; Huang, J.; Liu, S.; Li, J.; Yang, X.; Liu, Y.; Liu, Z. Proteomic analysis of young leaves at three developmental stages in an albino tea cultivar. Proteome Sci. 2011, 9, 44. [Google Scholar] [CrossRef] [PubMed] [Green Version]
  4. Yang, Y.; Chen, X.; Xu, B.; Li, Y.; Ma, Y.; Wang, G. Phenotype and transcriptome analysis reveals chloroplast development and pigment biosynthesis together influenced the leaf color formation in mutants of Anthurium andraeanum ‘Sonate’. Front. Plant Sci. 2015, 6, 139. [Google Scholar] [CrossRef] [PubMed] [Green Version]
  5. Chen, Z.; Lu, X.; Xuan, Y.; Tang, F.; Wang, J.; Shi, D.; Fu, S.; Ren, J. Transcriptome analysis based on a combination of sequencing platforms provides insights into leaf pigmentation in Acer rubrum. BMC Plant Boil. 2019, 19, 240. [Google Scholar] [CrossRef] [PubMed] [Green Version]
  6. Zhao, Y.; Wang, M.; Zhang, Y.Z.; Du, L.F.; Pan, T. A chlorophyll-reduced seedling mutant in oilseed rape, Brassica napus, for utilization in F1 hybrid production. Plant Breed. 2000, 119, 131–135. [Google Scholar] [CrossRef]
  7. Jung, K.-H.; Hur, J.; Ryu, C.-H.; Choi, Y.; Chung, Y.-Y.; Miyao, A.; Hirochika, H.; An, G. Characterization of a rice chlorophyll-deficient mutant using the T-DNA gene-trap system. Plant Cell Physiol. 2003, 44, 463–472. [Google Scholar] [CrossRef] [Green Version]
  8. Chen, W.-H.; Hsu, C.-Y.; Cheng, H.-Y.; Chang, H.; Chen, H.-H.; Ger, M.-J. Downregulation of putative UDP-glucose: Flavonoid 3-O-glucosyltransferase gene alters flower coloring in Phalaenopsis. Plant Cell Rep. 2011, 30, 1007–1017. [Google Scholar] [CrossRef]
  9. Yasumura, Y.; Moylan, E.C.; Langdale, J. A conserved transcription factor mediates nuclear control of organelle biogenesis in anciently diverged land plants. Plant Cell 2005, 17, 1894–1907. [Google Scholar] [CrossRef] [Green Version]
  10. Huang, Y.; Xiao, L.; Zhang, Z.; Zhang, R.; Wang, Z.; Huang, C.; Huang, R.; Luan, Y.; Fan, T.; Wang, J.; et al. The genomes of pecan and Chinese hickory provide insights into Carya evolution and nut nutrition. GigaScience 2019, 8, 5. [Google Scholar] [CrossRef]
  11. Guo, W.; Chen, J.; Li, J.; Huang, J.; Wang, Z.; Lim, K.-J. Portal of Juglandaceae: A comprehensive platform for Juglandaceae study. Hortic. Res. 2020, 7, 35–38. [Google Scholar] [CrossRef] [PubMed] [Green Version]
  12. McCormac, A.C.; Terry, M.J. Light-signalling pathways leading to the co-ordinated expression of HEMA1 and Lhcb during chloroplast development in Arabidopsis thaliana. Plant J. 2002, 32, 549–559. [Google Scholar] [CrossRef] [PubMed]
  13. Wang, Z.; Hong, X.; Hu, K.; Wang, Y.; Wang, X.; Du, S.; Li, Y.; Hu, D.; Cheng, K.; An, B.; et al. Impaired magnesium protoporphyrin IX methyltransferase (ChlM) impedes chlorophyll synthesis and plant growth in rice. Front. Plant Sci. 2017, 8, 1694. [Google Scholar] [CrossRef] [PubMed] [Green Version]
  14. Inagaki, N.; Kinoshita, K.; Kagawa, T.; Tanaka, A.; Ueno, O.; Shimada, H.; Takano, M. Phytochrome B mediates the regulation of chlorophyll biosynthesis through transcriptional regulation of ChlH and GUN4 in rice seedlings. PLoS ONE 2015, 10, e0135408. [Google Scholar] [CrossRef]
  15. Shi, C.; Shi, X.-M. Characterization of three genes encoding the subunits of light-independent protochlorophyllide reductase in chlorella protothecoides CS-41. Biotechnol. Prog. 2006, 22, 1050–1055. [Google Scholar] [CrossRef]
  16. Stephenson, P.G.; Terry, M.J. Light signalling pathways regulating the Mg-chelatase branchpoint of chlorophyll synthesis during de-etiolation in Arabidopsis thaliana. Photochem. Photobiol. Sci. 2008, 7, 1243. [Google Scholar] [CrossRef]
  17. Ji-Yu, Z.; Pan, D.-L.; Jia, Z.-H.; Wang, T.; Wang, G.; Guo, Z. Chlorophyll, carotenoid and vitamin C metabolism regulation in Actinidia chinensis ’Hongyang’ outer pericarp during fruit development. PLoS ONE 2018, 13, e0194835. [Google Scholar] [CrossRef]
  18. Tanaka, R.; Tanaka, A. Chlorophyll cycle regulates the construction and destruction of the light-harvesting complexes. Biochim. Biophys. Acta (BBA) Bioenerg. 2011, 1807, 968–976. [Google Scholar] [CrossRef] [Green Version]
  19. Rüdiger, W. Biosynthesis of chlorophyll b and the chlorophyll cycle. Photosynth. Res. 2002, 74, 187–193. [Google Scholar] [CrossRef]
  20. Kanematsu, S.; Sakuraba, Y.; Tanaka, A.; Tanaka, R. Characterization of Arabidopsis mutants defective in the regulation of chlorophyllide a oxygenase. Photochem. Photobiol. Sci. 2008, 7, 1196. [Google Scholar] [CrossRef]
  21. Tanaka, R.; Koshino, Y.; Sawa, S.; Ishiguro, S.; Okada, K.; Tanaka, A. Overexpression of chlorophyllide a oxygenase (CAO) enlarges the antenna size of photosystem II in Arabidopsis thaliana. Plant J. 2001, 26, 365–373. [Google Scholar] [CrossRef] [PubMed]
  22. Nakajima, S.; Ito, H.; Tanaka, R.; Tanaka, A. Chlorophyll b reductase plays an essential role in maturation and storability of Arabidopsis seeds. Plant Physiol. 2012, 160, 261–273. [Google Scholar] [CrossRef] [PubMed] [Green Version]
  23. Wu, L.; Liu, T.; Xu, Y.; Chen, W.; Liu, B.; Zhang, L.; Liu, D.-C.; Zhang, H.; Zhang, B. Comparative transcriptome analysis of two selenium-accumulating genotypes of Aegilops tauschii Coss. in response to selenium. BMC Genet. 2019, 20, 9. [Google Scholar] [CrossRef] [Green Version]
  24. Wu, M.; Xu, X.; Hu, X.; Liu, Y.; Cao, H.; Chan, H.; Gong, Z.; Yuan, Y.; Luo, Y.; Feng, B.; et al. SlMYB72 regulates the metabolism of chlorophylls, carotenoids, and flavonoids in tomato fruit. Plant Physiol. 2020, 183, 854–868. [Google Scholar] [CrossRef] [PubMed]
  25. Ampomah-Dwamena, C.; Thrimawithana, A.H.; Dejnoprat, S.; Lewis, D.; Espley, R.V.; Allan, A.C. A kiwifruit (Actinidia deliciosa) R2R3-MYB transcription factor modulates chlorophyll and carotenoid accumulation. New Phytol. 2018, 221, 309–325. [Google Scholar] [CrossRef] [Green Version]
  26. Wen, C.-H.; Lin, S.-S.; Chu, F.-H. Transcriptome analysis of a subtropical deciduous tree: Autumn leaf senescence gene expression profile of Formosan Gum. Plant Cell Physiol. 2014, 56, 163–174. [Google Scholar] [CrossRef] [Green Version]
  27. Liu, R.; Xu, Y.-H.; Jiang, S.-C.; Lu, K.; Lu, Y.-F.; Feng, X.-J.; Wu, Z.; Liang, S.; Yu, Y.-T.; Wang, X.-F.; et al. Light-harvesting chlorophyll a/b-binding proteins, positively involved in abscisic acid signalling, require a transcription repressor, WRKY40, to balance their function. J. Exp. Bot. 2013, 64, 5443–5456. [Google Scholar] [CrossRef] [Green Version]
  28. Ma, N.-N.; Feng, H.; Meng, X.; Li, D.; Yang, D.; Wu, C.; Meng, Q. Overexpression of tomato SlNAC1 transcription factor alters fruit pigmentation and softening. BMC Plant Boil. 2014, 14, 351. [Google Scholar] [CrossRef] [Green Version]
  29. Zhu, M.; Chen, G.; Zhou, S.; Tu, Y.; Wang, Y.; Dong, T.; Hu, Z. A New Tomato NAC (NAM/ATAF1/2/CUC2) transcription factor, SlNAC4, functions as a positive regulator of fruit ripening and carotenoid accumulation. Plant Cell Physiol. 2013, 55, 119–135. [Google Scholar] [CrossRef] [Green Version]
  30. Montefiori, M.; McGhie, T.; Hallett, I.C.; Costa, G. Changes in pigments and plastid ultrastructure during ripening of green-fleshed and yellow-fleshed kiwifruit. Sci. Hortic. 2009, 119, 377–387. [Google Scholar] [CrossRef]
  31. Tong, Z.; Qu, S.; Zhang, J.; Wang, F.; Tao, J.; Gao, Z.; Zhang, Z. A Modified protocol for RNA extraction from different peach tissues suitable for gene isolation and real-time PCR analysis. Mol. Biotechnol. 2011, 50, 229–236. [Google Scholar] [CrossRef] [PubMed]
  32. Trapnell, C.; Williams, B.A.; Pertea, G.; Mortazavi, A.; Kwan, G.; Van Baren, M.J.; Salzberg, S.L.; Wold, B.J.; Pachter, L. Transcript assembly and quantification by RNA-Seq reveals unannotated transcripts and isoform switching during cell differentiation. Nat. Biotechnol. 2010, 28, 511–515. [Google Scholar] [CrossRef] [PubMed] [Green Version]
  33. Anders, S.; Huber, W. Differential expression analysis for sequence count data. Genome Biol. 2010, 11, R106. [Google Scholar] [CrossRef] [PubMed] [Green Version]
  34. Pan, D.-L.; Wang, G.; Wang, T.; Jia, Z.-H.; Guo, Z.; Ji-Yu, Z. AdRAP2.3, a novel ethylene response factor VII from Actinidia deliciosa, enhances waterlogging resistance in transgenic tobacco through improving expression levels of PDC and ADH genes. Int. J. Mol. Sci. 2019, 20, 1189. [Google Scholar] [CrossRef] [PubMed] [Green Version]
  35. Mo, Z.; Feng, G.; Su, W.; Liu, Z.; Peng, F. Transcriptomic analysis provides insights into grafting union development in pecan (Carya illinoinensis). Genes 2018, 9, 71. [Google Scholar] [CrossRef] [Green Version]
  36. Livak, K.J.; Schmittgen, T.D. Analysis of relative gene expression data using real-time quantitative PCR and the 2(-Delta Delta C(T)). Methods 2001, 25, 402–408. [Google Scholar] [CrossRef]
Figure 1. Chlorophyll content in leaves of pecan. (A): Photographs of green leaf (GL) seedling and albino leaf (AL) seedling. (B): Chlorophyll content in GL and AL. Mean values (±SD) of three biological replicates are shown. Different lowercase letters above the error bars indicate a significant difference of correlation at 0.05 levels (one-way ANOVA, p-value < 0.05).
Ijms 21 06137 g001
Figure 2. Functional annotation of differentially expressed genes of pecan in the comparison of AL vs. GL. (A): COG classification. (B): GO classification.
Ijms 21 06137 g002
Figure 3. Chlorophyll metabolic pathway (KO00860) in albino leaves of pecan. CAO: chlorophyllide a oxygenase; CBR: chlorophyll(ide) b reductase NYC1; CHLH: magnesium chelatase H subunit; CHLM: Mg-proto IX methyltransferase; CLH: chlorophyllase; CRD1: Mg-protophyrin IX monomethylester (oxidative) cyclase; CS: chlorophyll synthase; GLTL: glutamate tRNA ligase; HEMA: glutamyl-tRNA reductase; HEMB: 5-aminolevulinate dehydrogenase; HEMC: porphobilinogen deaminase; HEMD: uroporphyrinogen III synthase; HEME: uroporphyrinogen III decarboxylase; HEMF: coproporphyrinogen III oxidase; HEMG: protoporphyrinogen oxidase; HEML: glutamate-1-semialdehyde; PAO: pheophorbide a oxygenase; POR: protochlorophyllide reductase; PPH: pheophytin pheophorbide hydrolase; SGR: STAY-GREEN LIKE.
Ijms 21 06137 g003
Table 1. Sequencing and statistics for the two group’s transcriptome data with the reference genome (Cil.genome.fa).
Group NameGLAL
No. of total reads (×106)38.51 ± 5.3638.68 ± 4.23
No. of mapped reads (×106)35.87 ± 4.9035.78 ± 4.08
Mapped percentage93.15% ± 0.27%92.46% ± 0.47%
Unique Mapped reads (×106)34.93 ± 3.8734.90 ± 3.21
Table 2. Summary of functional annotation of the differentially expressed genes.
Database 37, 254 All Unigenes5171 Differentially Expressed Genes
Number of Annotated SequencesPercentage of Annotated SequencesNumber of Annotated SequencesPercentage of Annotated Sequences
NR (E-value < 10−5)33,85990.89438984.88
SwissProt26,55871.29359669.54
COG11,78931.64154629.90
KEGG770120.6793918.16
GO24,67066.22333764.53
Table 3. The top-10 KEGG pathways mapping enriched differential progress.
PathwayPathway IDQ-ValueDEGs
Photosynthesisko001951.86 × 10−2451
Photosynthesis-antenna proteinsko001962.86 × 10−1422
Metabolic pathwaysko011007.84 × 10−11360
Nitrogen metabolismko009101.66 × 10−732
Biosynthesis of secondary metabolitesko011101.70 × 10−6182
Carbon fixation in photosynthetic organismsko007102.41 × 10−635
Starch and sucrose metabolismko005001.01 × 10−557
Glyoxylate and dicarboxylate metabolismko006300.000813224
Alanine, aspartate and glutamate metabolismko002500.000810622
Glycine, serine and threonine metabolismko002600.000844625
Table 4. Identified differentially expressed proteins involved in chlorophyll metabolism.
Genes IDProteinGenelog2(AL/GL)p-ValueRegulated
CIL0203S0025PREDICTED: glutamyl-tRNA reductase 1, chloroplastic-likeHEMA−1.163625261.22 × 10−7down
CIL1034S0072PREDICTED: magnesium-chelatase subunit ChlH, chloroplasticCHLH−2.028560095.50 × 10−24down
CIL1166S0028PREDICTED: magnesium-protoporphyrin (oxidative) cyclase, chloroplasticCRD−2.028560095.50 × 10−24down
CIL1444S0041PREDICTED: chloroplasticPOR−1.852841221.14 × 10−19down
CIL1192S0055PREDICTED: chlorophyllide a oxygenase, chloroplastic isoform ×1CAO−1.976087444.99 × 10−43down
CIL1335S0038PREDICTED: chlorophyllide a oxygenase, chloroplastic-likeCAO−2.039586661.67 × 10−16down
CIL0897S0166PREDICTED: probable chlorophyll(ide) b reductase NYC1, chloroplasticCBR−1.310528471.92 × 10−21down
CIL1224S0038PREDICTED: probable chlorophyll(ide) b reductase NYC1, chloroplasticCBR−1.210822381.61 × 10−15down
CIL0897S0167PREDICTED: probable chlorophyll(ide) b reductase NYC1, chloroplasticCBR−1.310528471.92 × 10−21down
CIL1230S0045PREDICTED: protein STAY-GREEN LIKE, chloroplastic-likeSGR−1.670024371.22 × 10−13down
CIL0946S0047PREDICTED: pheophorbide a oxygenase, chloroplastic-likePAO1.488253522.60 × 10−58up
CIL1523S0003PREDICTED: pheophorbide a oxygenase, chloroplastic-likePAO1.2329435381.36 × 10−8up
Table 5. Identified differentially expressed genes involved in the photosynthesis pathway.
Genes IDProteinGenelog2
(AL/GL)
p-ValueRegulated
Photosystem I
MSTRG.12608Photosystem I P700 apoprotein A1 (chloroplast) PsaA−1.707011.18 × 10−9down
MSTRG.1756Photosystem I iron-sulfur centerPsaC1.5711265.12 × 10−13up
CIL1061S0088PREDICTED: photosystem I reaction center subunit II, chloroplastic-like PsaD−2.064166.02 × 10−46down
CIL1130S0012PREDICTED: photosystem I reaction center subunit IV, chloroplastic-likePsaE−2.640871.29 × 10−66down
CIL1293S0081PREDICTED: photosystem I reaction center subunit IV B, chloroplastic-like PsaE2−2.244471.54 × 10−28down
CIL0957S0008PREDICTED: photosystem I reaction center subunit III, chloroplastic-like PsaF−2.272274.74 × 10−43down
CIL1454S0024PREDICTED: photosystem I reaction center subunit V, chloroplastic PsaG−2.152521.79 × 10−45down
CIL0121S0006PREDICTED: photosystem I reaction center subunit VI, chloroplastic-like PsaH−3.318391.62 × 10−68down
CIL1184S0026PREDICTED: photosystem I reaction center subunit VI-2, chloroplastic PsaH2−1.803559.55 × 10−31down
CIL0225S0008PREDICTED: photosystem I reaction center subunit psaK, chloroplastic-like PsaK−2.885067.68 × 10−70down
CIL1120S0015PREDICTED: photosystem I reaction center subunit psaK, chloroplastic-likePsaK−2.100150.000806down
CIL0070S0007PREDICTED: photosystem I reaction center subunit XI, chloroplastic PsaL−2.347728.07 × 10−41down
CIL0479S0005PREDICTED: photosystem I reaction center subunit N, chloroplastic-like PsaN−2.987761.44 × 10−13down
CIL1492S0029PREDICTED: photosystem I reaction center subunit N, chloroplastic PsaN−2.114712.07 × 10−42down
CIL0899S0004PREDICTED: photosystem I subunit O PsaO−2.382358.89 × 10−52down
Photosystem II
CIL0840S0001Putative photosystem II protein D1(Helianthus annuus)PsbA−3.251589.61 × 10−43down
MSTRG.6696Photosystem II CP47 chlorophyll apoprotein, partial (plastid) PsbB−2.098930.001337down
MSTRG.28118PsbB, partial (chloroplast) PsbB−1.904470.000545down
MSTRG.12382Photosystem II protein K (chloroplast) psbK−2.140625.63 × 10−16down
MSTRG.11850Photosystem II protein K (chloroplast) psbK−2.05124.08 × 10−29down
CIL1409S0029PREDICTED: oxygen-evolving enhancer protein 1, chloroplastic-like PsbO−3.250731.79 × 10−72down
CIL0990S0108PREDICTED: psbP-like protein 1, chloroplastic PsbP−1.030859.74 × 10−12down
CIL0990S0110PREDICTED: photosynthetic NDH subunit of lumenal location 1, chloroplasticPsbP−1.821766.22 × 10−33down
CIL1351S0018PREDICTED: oxygen-evolving enhancer protein 2, chloroplastic PsbP−1.813571.90 × 10−31down
CIL1099S0039PREDICTED: oxygen-evolving enhancer protein 3-2, chloroplastic-like PsbQ−2.369137.49 × 10−56down
CIL1258S0023PREDICTED: photosynthetic NDH subunit of lumenal location 2, chloroplastic PsbQ−2.247849.86 × 10−43down
CIL1577S0034PREDICTED: photosynthetic NDH subunit of lumenal location 3, chloroplastic PsbQ−2.06151.01 × 10−36down
CIL1048S0062PREDICTED: photosystem II 10 kDa polypeptide, chloroplastic PsbR−1.392113.63 × 10−21down
CIL1112S0006PREDICTED: photosystem II 22 kDa protein, chloroplastic PsbS−1.626976.31 × 10−13down
CIL1192S0058PREDICTED: photosystem II 22 kDa protein, chloroplastic PsbS−1.75046.05 × 10−43down
CIL0970S0081PREDICTED: photosystem II reaction center W protein, chloroplastic-like PsbW−2.15311.81 × 10−36down
CIL1034S0038PREDICTED: photosystem II reaction center W protein, chloroplastic-like isoform X1PsbW−1.001994.32 × 10−5down
CIL0929S0055PREDICTED: photosystem II core complex proteins psbY, chloroplastic PsbY−2.070951.48 × 10−28down
CIL1040S0004PREDICTED: photosystem II repair protein PSB27-H1, chloroplastic PSB27-H1−2.453997.91 × 10−65down
Cytochrome b6-f complex
MSTRG.12087Cytochrome b6 (chloroplast) petB−1.125817.22 × 10−5down
CIL1135S0039PREDICTED: cytochrome b6-f complex iron-sulfur subunit 1, chloroplastic-like petC−1.624371.20 × 10−24down
CIL1405S0081PREDICTED: cytochrome b6-f complex iron-sulfur subunit 1, chloroplastic-like petC−1.647442.11 × 10−47down
Photosynthetic electron transport
CIL0131S0022PlastocyaninpetE−3.74989.31 × 10−59down
CIL1192S0070PREDICTED: plastocyanin B&apos;/B&apos;&apospetE−2.199157.47 × 10−48down
CIL1082S0115PREDICTED: ferredoxin-likepetF−1.924181.88 × 10−68down
CIL1146S0002ferredoxin--NADP reductase, leaf-type isozyme, chloroplastic petH−1.846926.72 × 10−27down
CIL1219S0022PREDICTED: ferredoxin--NADP reductase, root isozyme, chloroplastic petH1.5587782.18 × 10−11up
CIL1099S0062PREDICTED: cytochrome c6, chloroplastic-likepetJ−1.072581.22 × 10−7down
F-Type ATPase
CIL0009S0016ATP synthase beta subunit, partial (chloroplast)atpB−2.282951.64 × 10−10down
CIL0922S0023PREDICTED: ATP synthase gamma chain, chloroplastic atpC−1.319481.26 × 10−32down
CIL1157S0078PREDICTED: ATP synthase delta chain, chloroplastic-like atpD−2.89148.90 × 10−61down
CIL1064S0097PREDICTED: ATP synthase subunit delta, chloroplastic-like atpH−1.745554.63 × 10−24down
CIL0936S0006ATP synthase F0, A subunitA1.2386793.76 × 10−5up
CIL1413S0005REDICTED: ATP synthase subunit b&apos; chloroplastic B−1.735147.32 × 10−46down
MSTRG.3669ATPase subunit 8 (mitochondrion) B1.3779490.007137up
Photosynthesis—antenna proteins
CIL1196S0069PREDICTED: chlorophyll a-b binding protein 6A, chloroplastic-likeLHCA1−3.00031.28 × 10−57down
CIL1348S0032PREDICTED: chlorophyll a-b binding protein 6, chloroplastic-like LHCA1−3.259031.92 × 10−53down
CIL1458S0020Chlorophyll a-b binding protein, chloroplasticLHCA2−2.357873.49 × 10−50down
CIL1486S0034PREDICTED: chlorophyll a-b binding protein, chloroplasticLHCA2−2.935681.46 × 10−48down
CIL1118S0087PREDICTED: chlorophyll a-b binding protein 8, chloroplasticLHCA3−2.107533.33 × 10−45down
CIL1578S0015Chlorophyll a-b binding protein 4, chloroplastic LHCA4−3.587171.06 × 10−73down
CIL1507S0004PREDICTED: photosystem I chlorophyll a/b-binding protein 5, chloroplastic LHCA5−1.204131.03 × 10−14down
CIL1582S0038PREDICTED: photosystem I chlorophyll a/b-binding protein 6, chloroplastic LHCA6−2.172698.46 × 10−33down
CIL0258S0015Chlorophyll a-b binding protein of LHCII type 1 LHCB1−2.836843.34 × 10−44down
CIL1047S0026Chlorophyll a-b binding protein of LHCII type 1LHCB1−3.638319.87 × 10−74down
CIL1187S0057Chlorophyll a-b binding protein of LHCII type 1 LHCB1−2.823881.67 × 10−29down
CIL1393S0038Chlorophyll a-b binding protein of LHCII type 1 LHCB1−4.161375.33 × 10−123down
CIL1384S0010PREDICTED: chlorophyll a-b binding protein 151, chloroplastic LHCB2−3.651643.05 × 10−102down
CIL1078S0110PREDICTED: chlorophyll a-b binding protein 13, chloroplastic LHCB3−4.014045.76 × 10−57down
CIL1135S0055PREDICTED: chlorophyll a-b binding protein 13, chloroplastic LHCB3−6.024374.65 × 10−51down
CIL1122S0046PREDICTED: chlorophyll a-b binding protein CP29.1, chloroplastic-like LHCB4−2.907235.76 × 10−59down
CIL1204S0057PREDICTED: chlorophyll a-b binding protein CP29.3, chloroplasticLHCB4−3.629461.16 × 10−51down
CIL0010S0054PREDICTED: chlorophyll a-b binding protein CP26, chloroplastic-like LHCB5−2.549867.61 × 10−42down
CIL0948S0124PREDICTED: chlorophyll a-b binding protein CP26, chloroplasticLHCB5−1.602570.000693down
CIL0948S0127PREDICTED: chlorophyll a-b binding protein CP26, chloroplasticLHCB5−2.179185.06 × 10−35down
CIL0424S0004PREDICTED: chlorophyll a-b binding protein CP24 10A, chloroplasticLHCB6−2.833521.64 × 10−41down
CIL1082S0041PREDICTED: chlorophyll a-b binding protein CP24 10A, chloroplastic-like LHCB6−3.784677.49 × 10−69down
Table 6. Response of transcription factors in the comparison of AL vs. GL.
CategoryTotalUpregulationDownregulation
MYB2771624
AP2/ERF1972312
NAC122258
C2C2110616
C2H2149146
bHLH159811
WRKY93712
HB11294
bZIP8175
GARP6335
LOB5444
B36934
MADS6325
AUX/IAA4315
GRF1460

