An Innovative Therapeutic Option for the Treatment of Skeletal Sarcomas: Elimination of Osteo- and Ewing’s Sarcoma Cells Using Physical Gas Plasma

 , , and
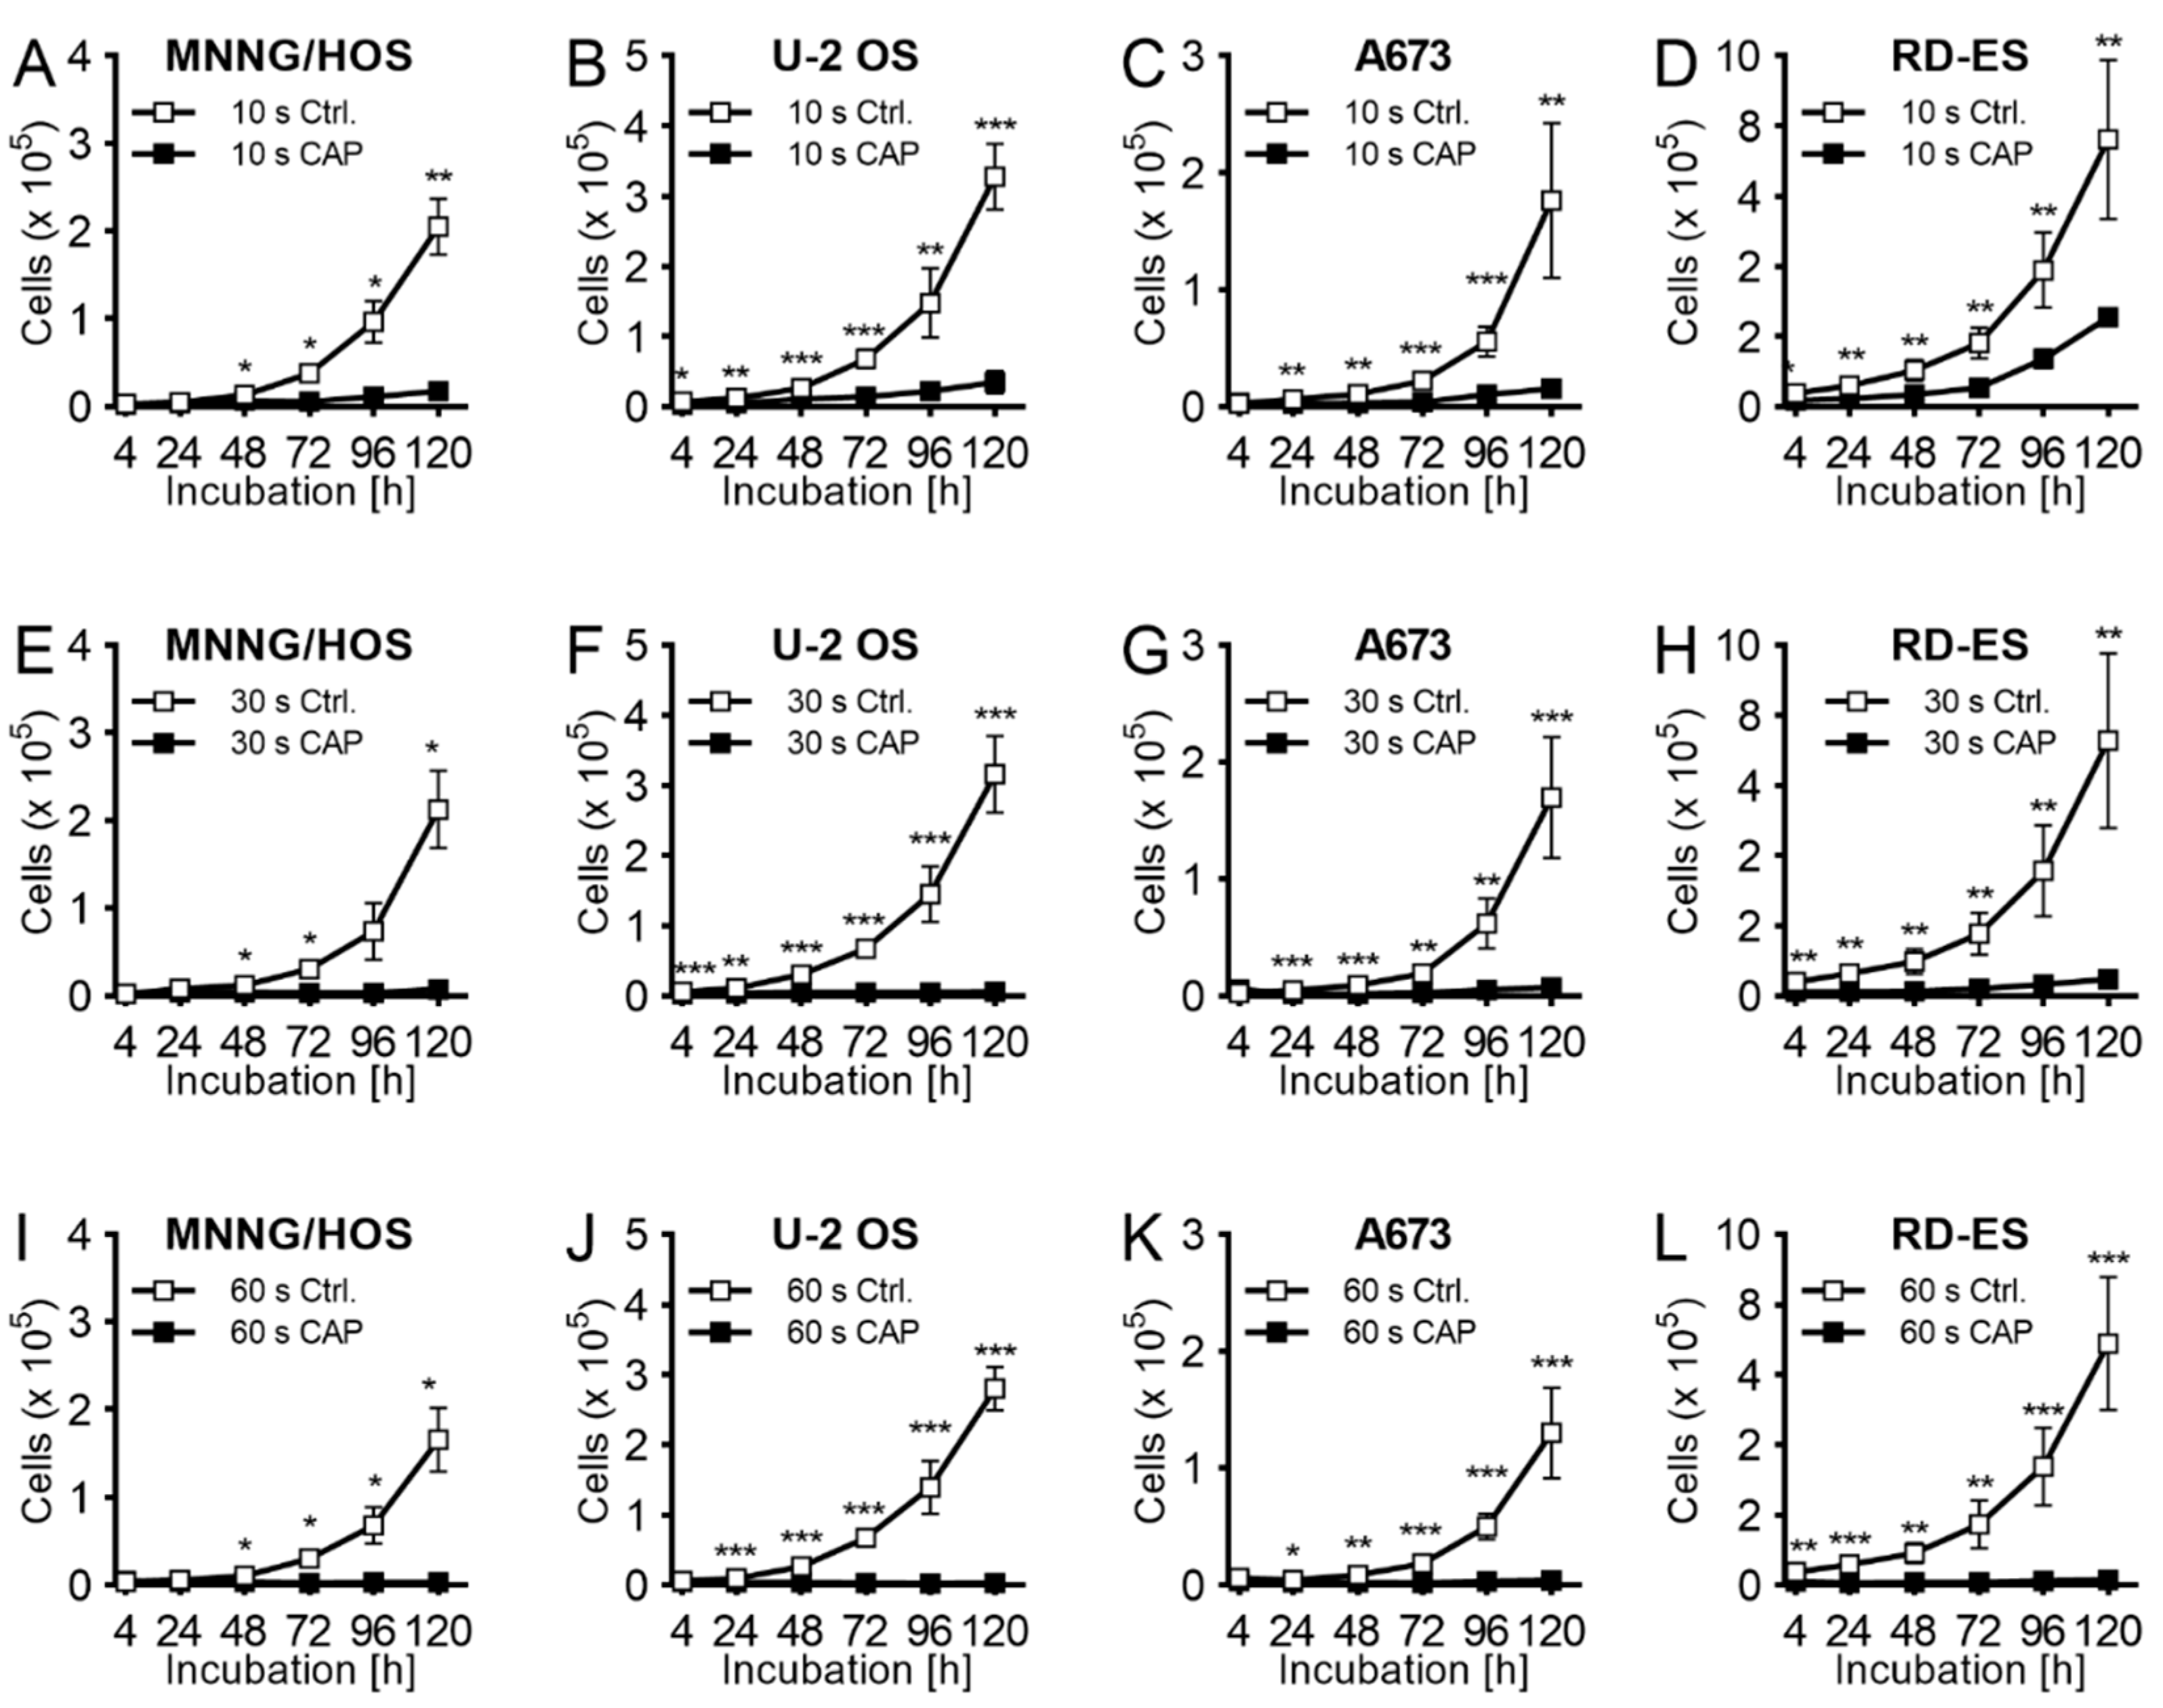
Abstract
:1. Introduction
2. Results
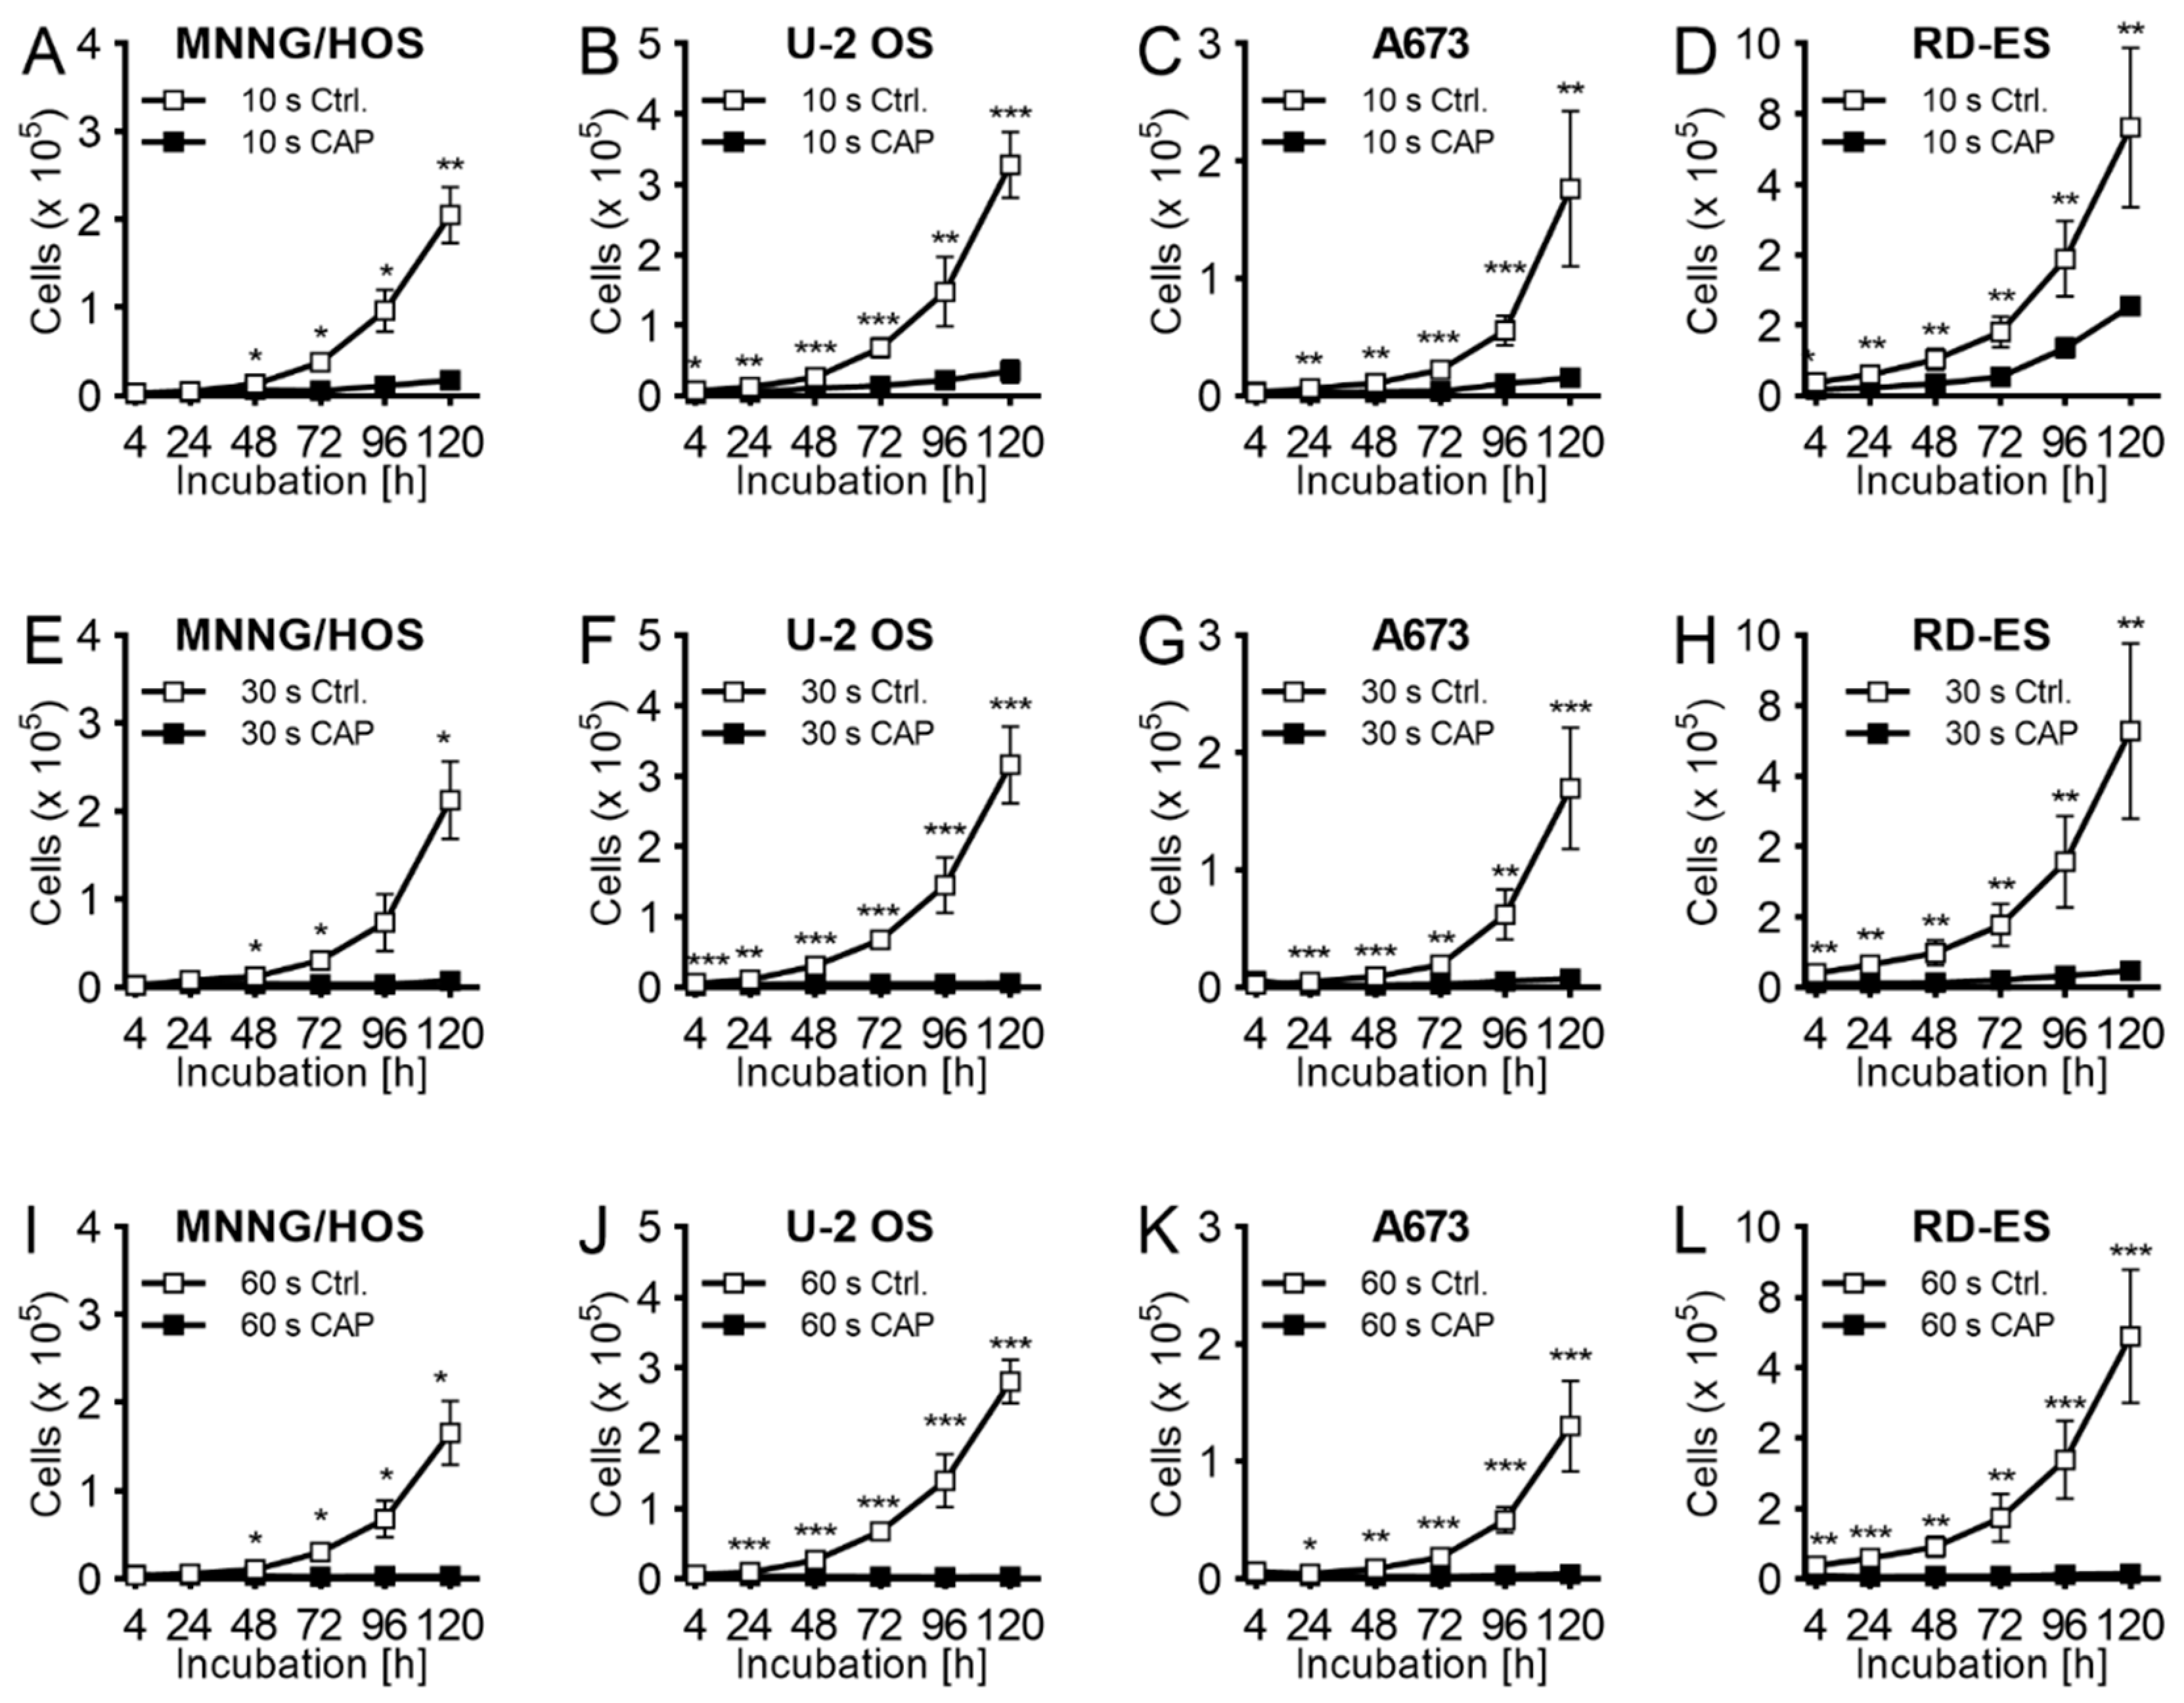
2.1. Proliferation
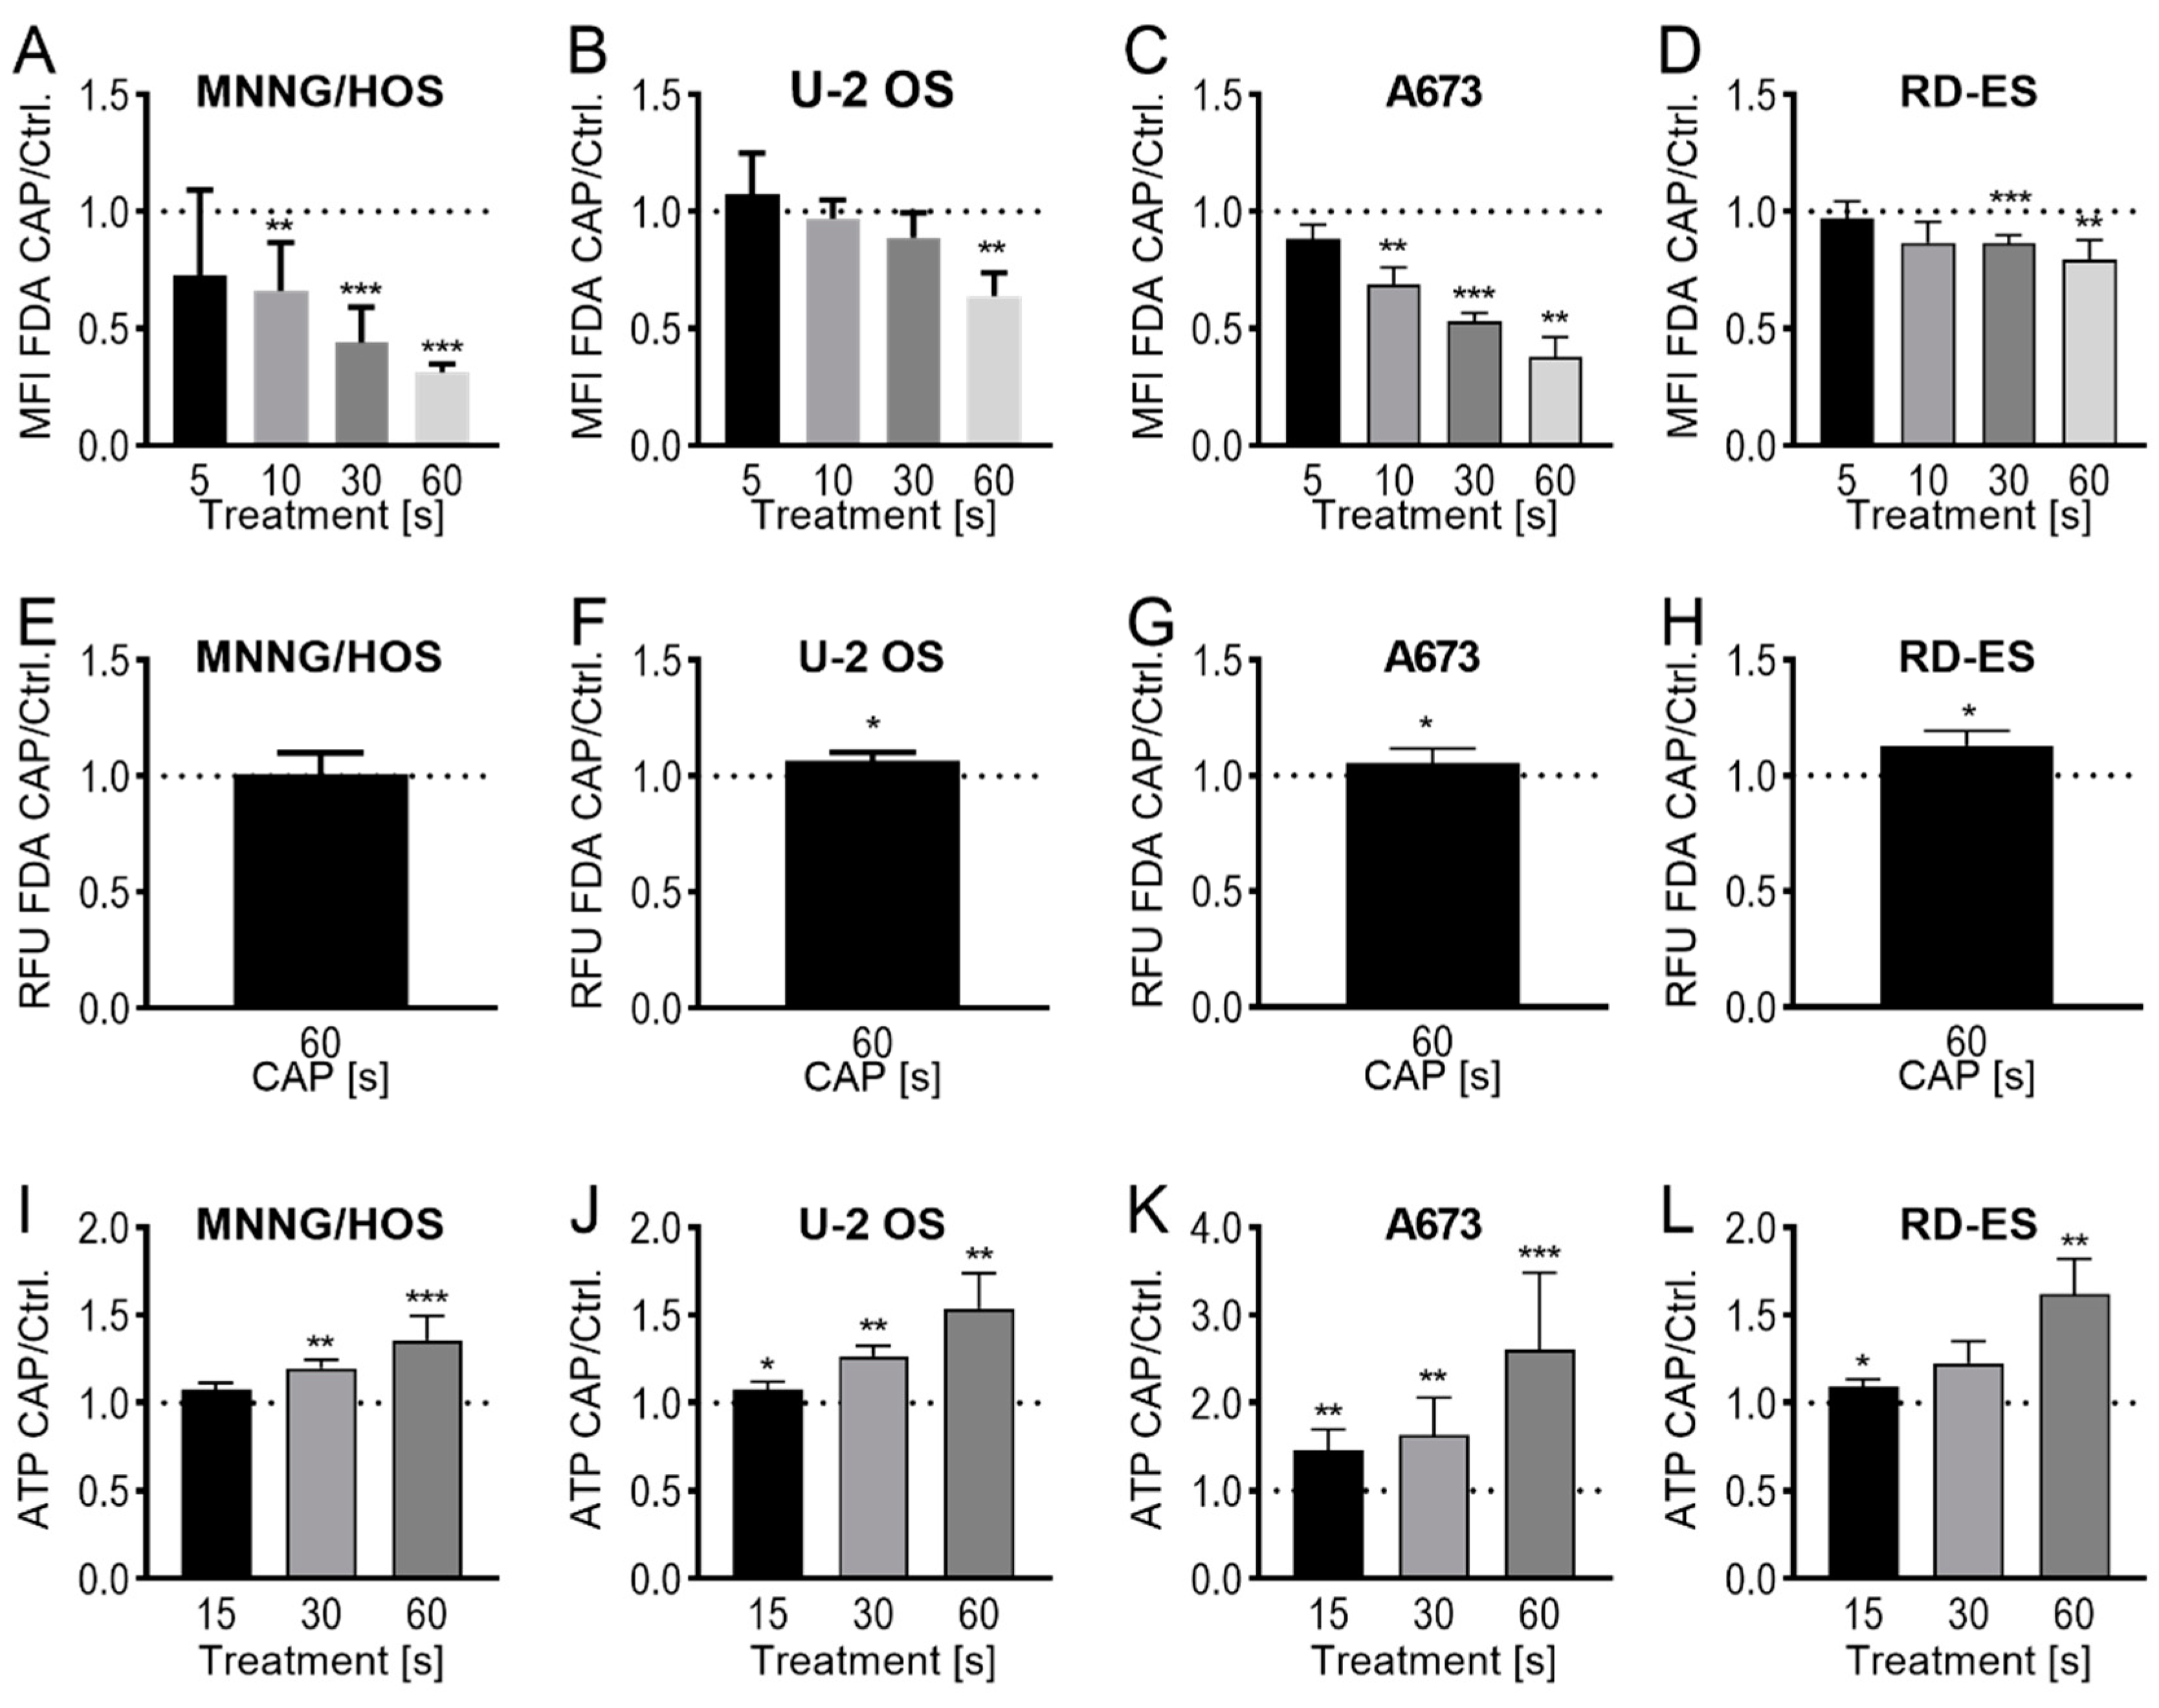
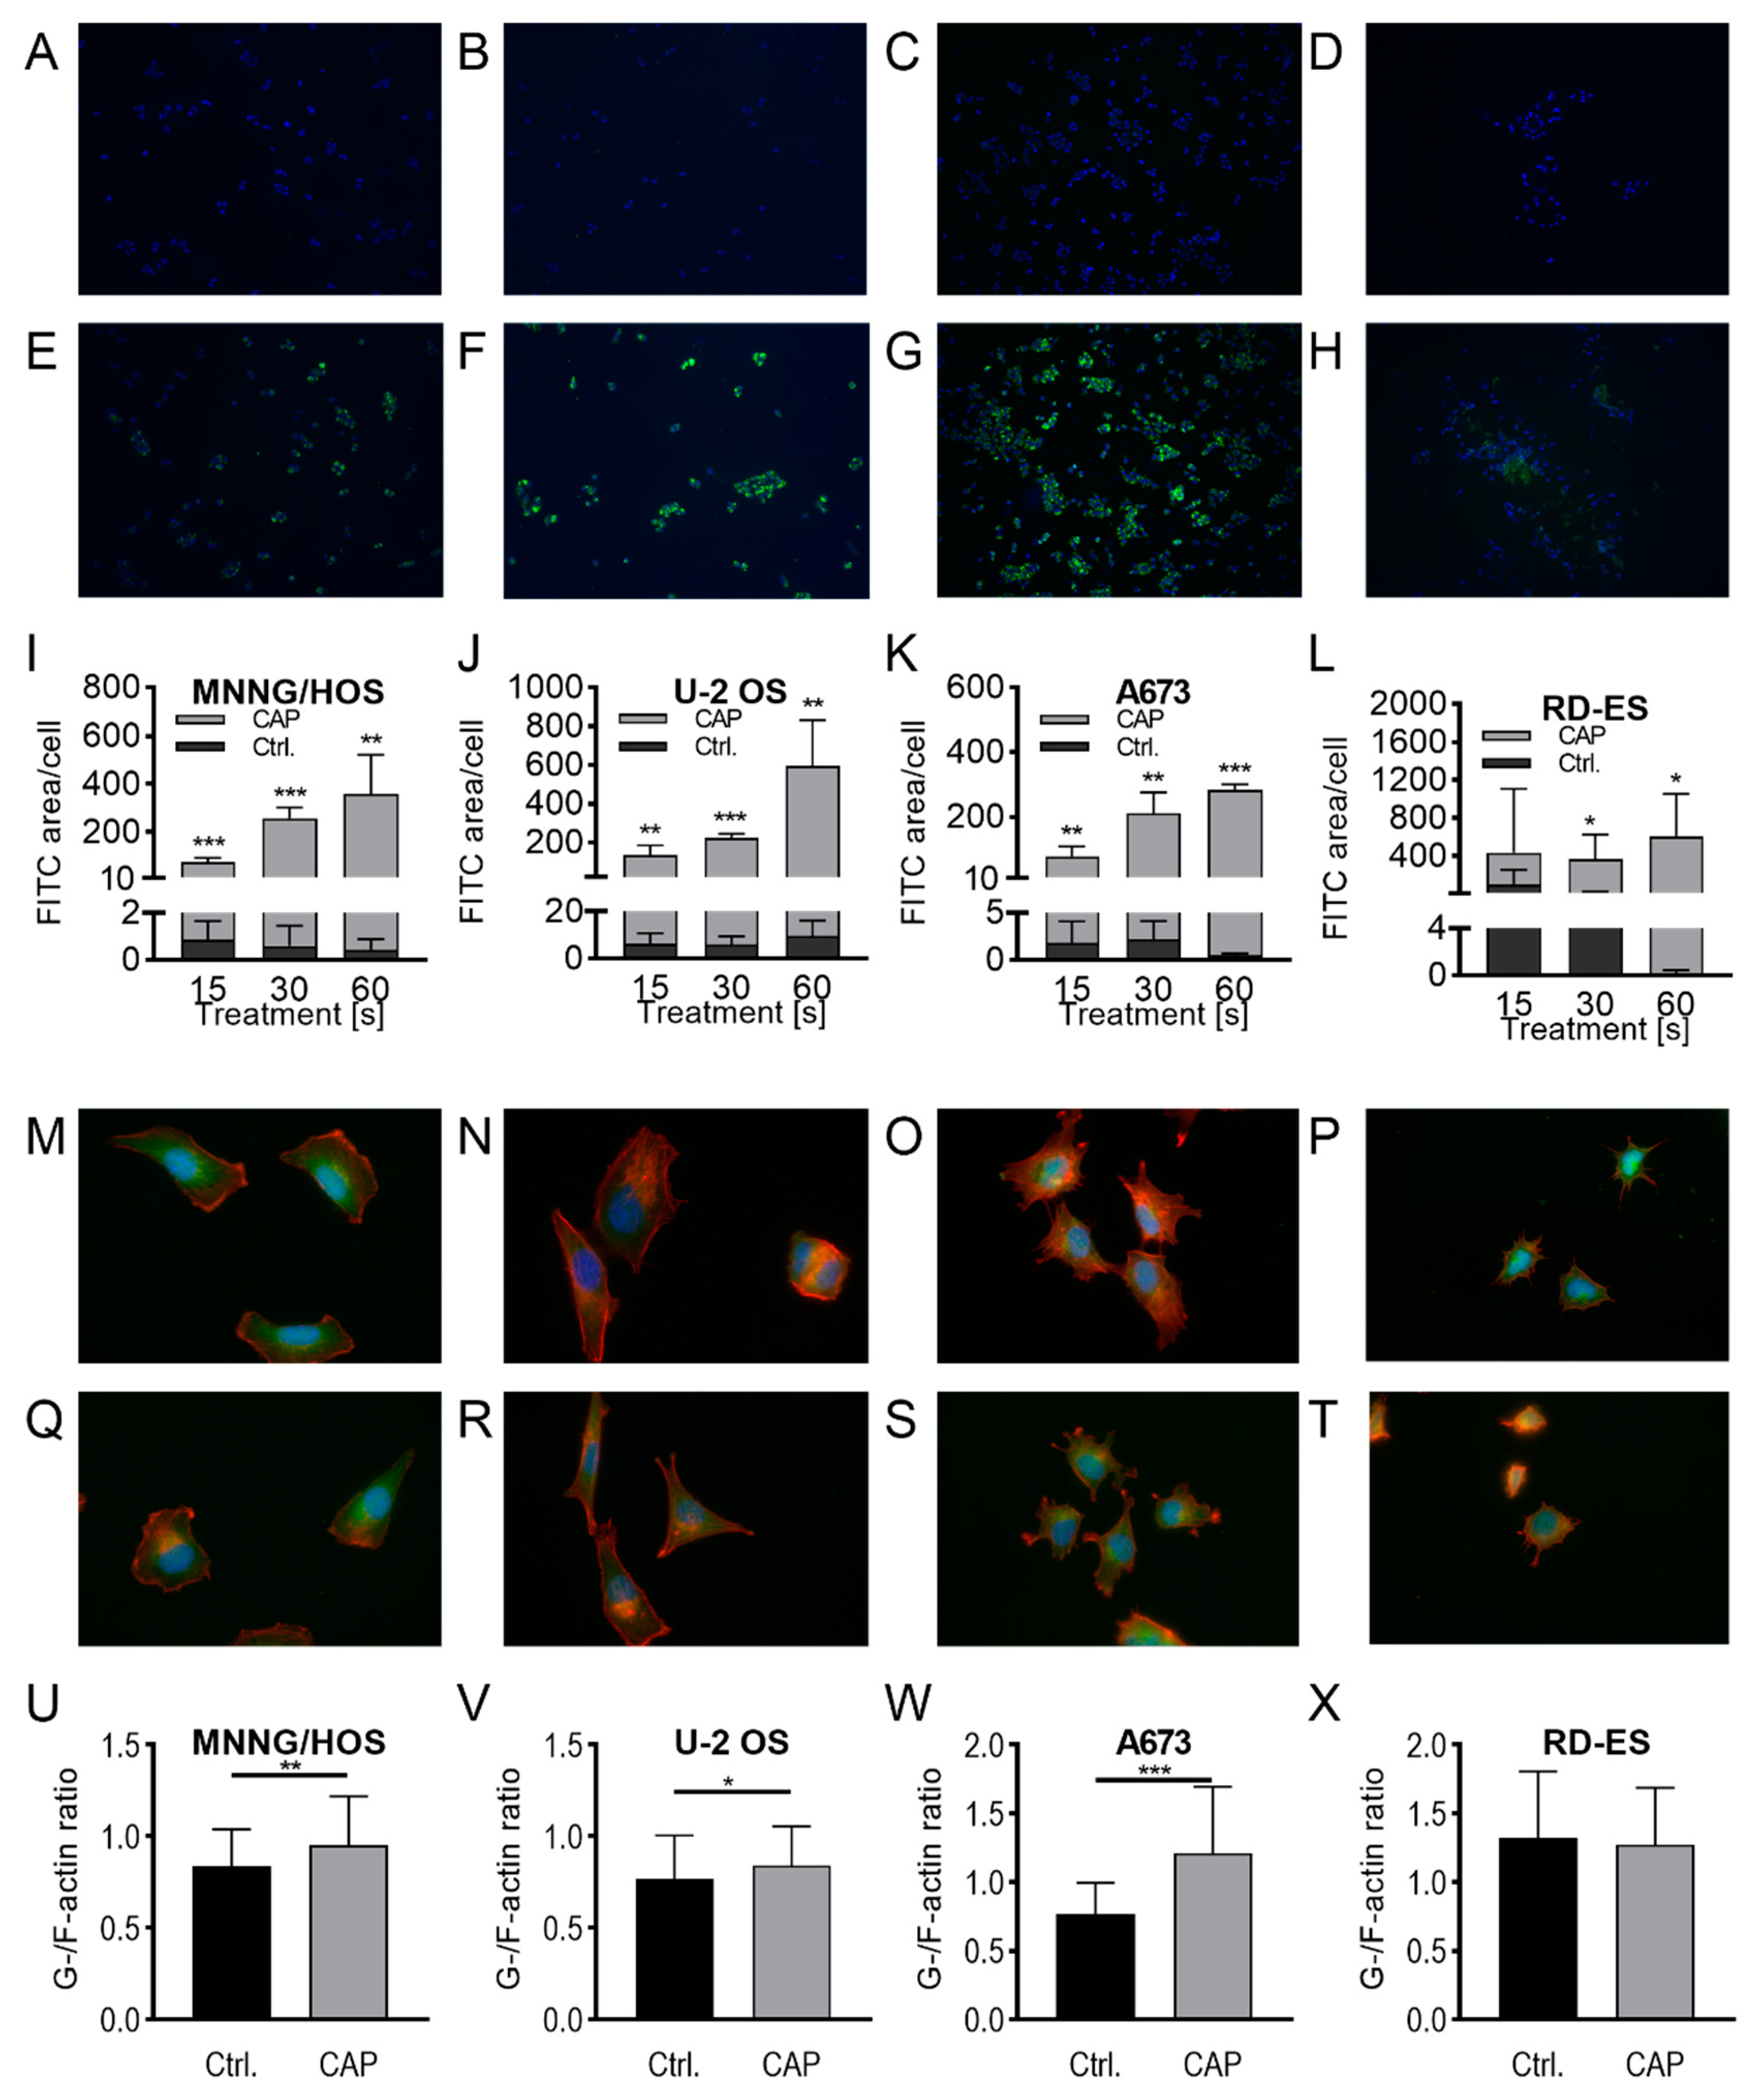
2.2. Membrane and Cytoskeleton
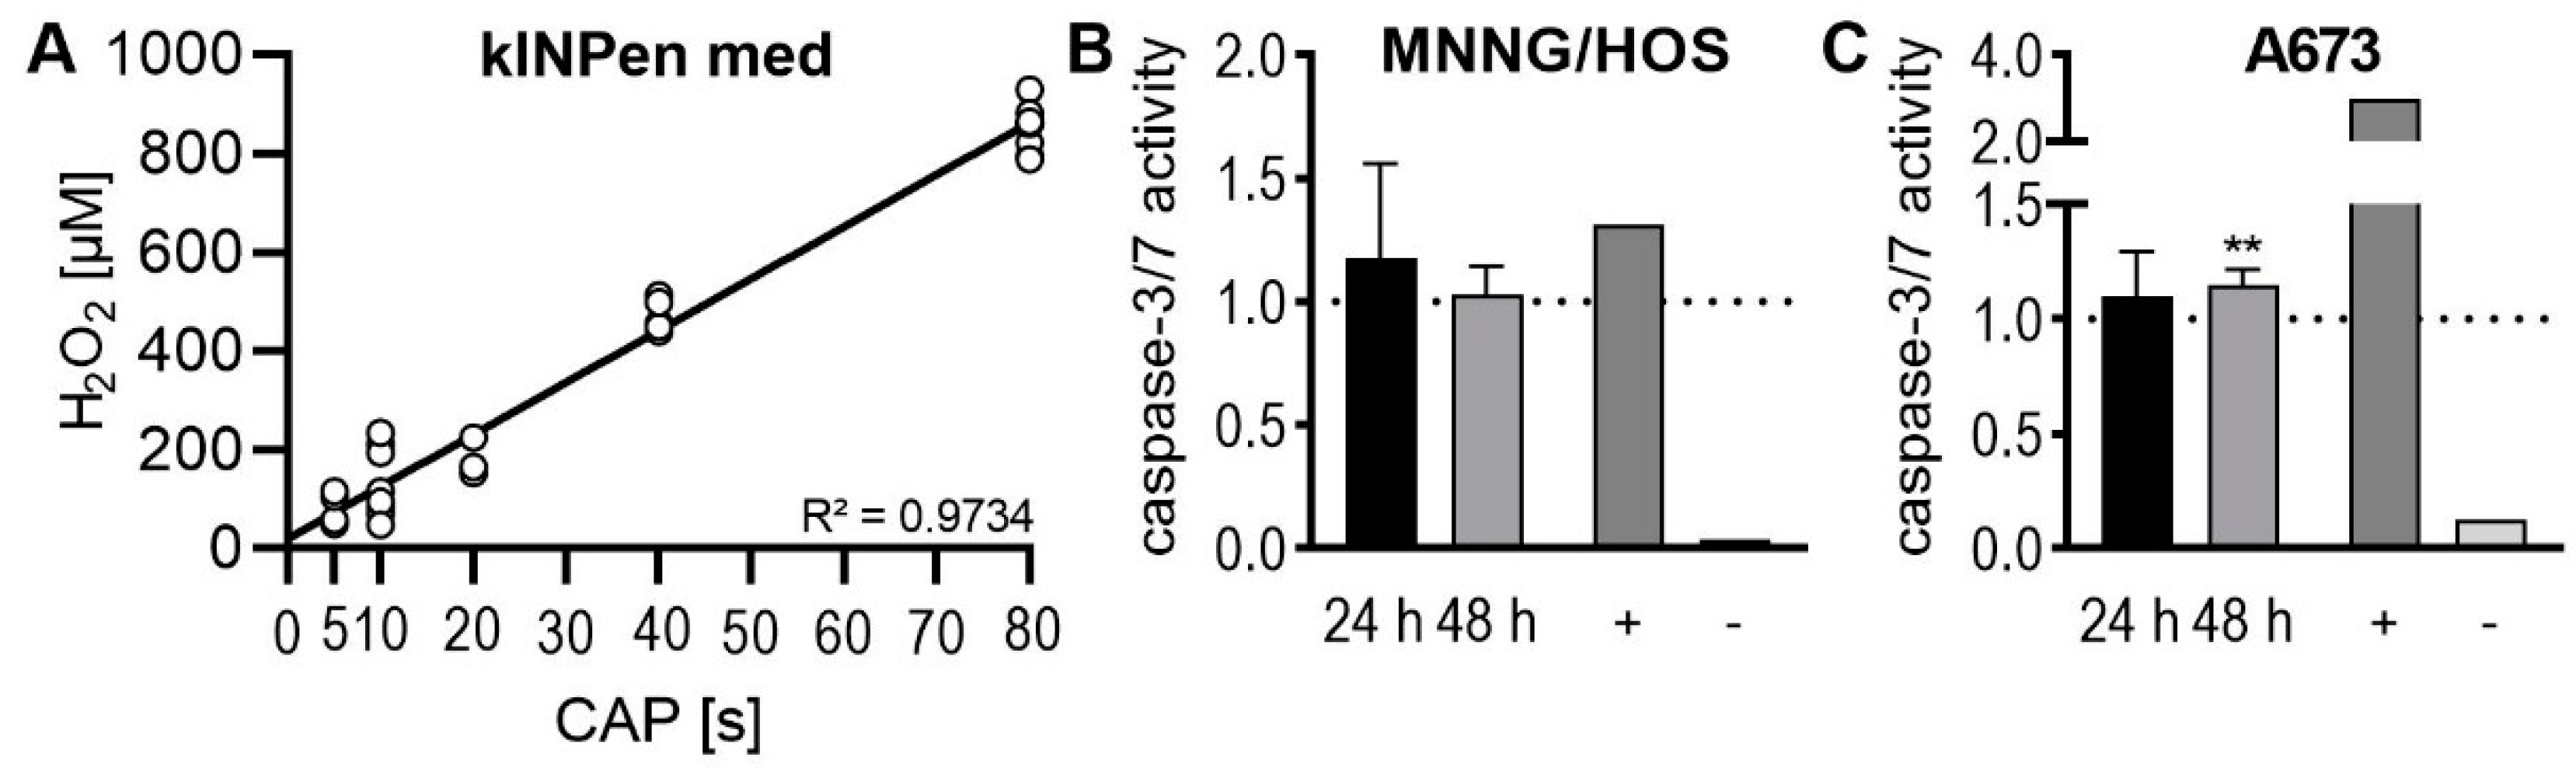
2.3. Apoptosis
3. Discussion
4. Materials and Methods
4.1. Cell Culture
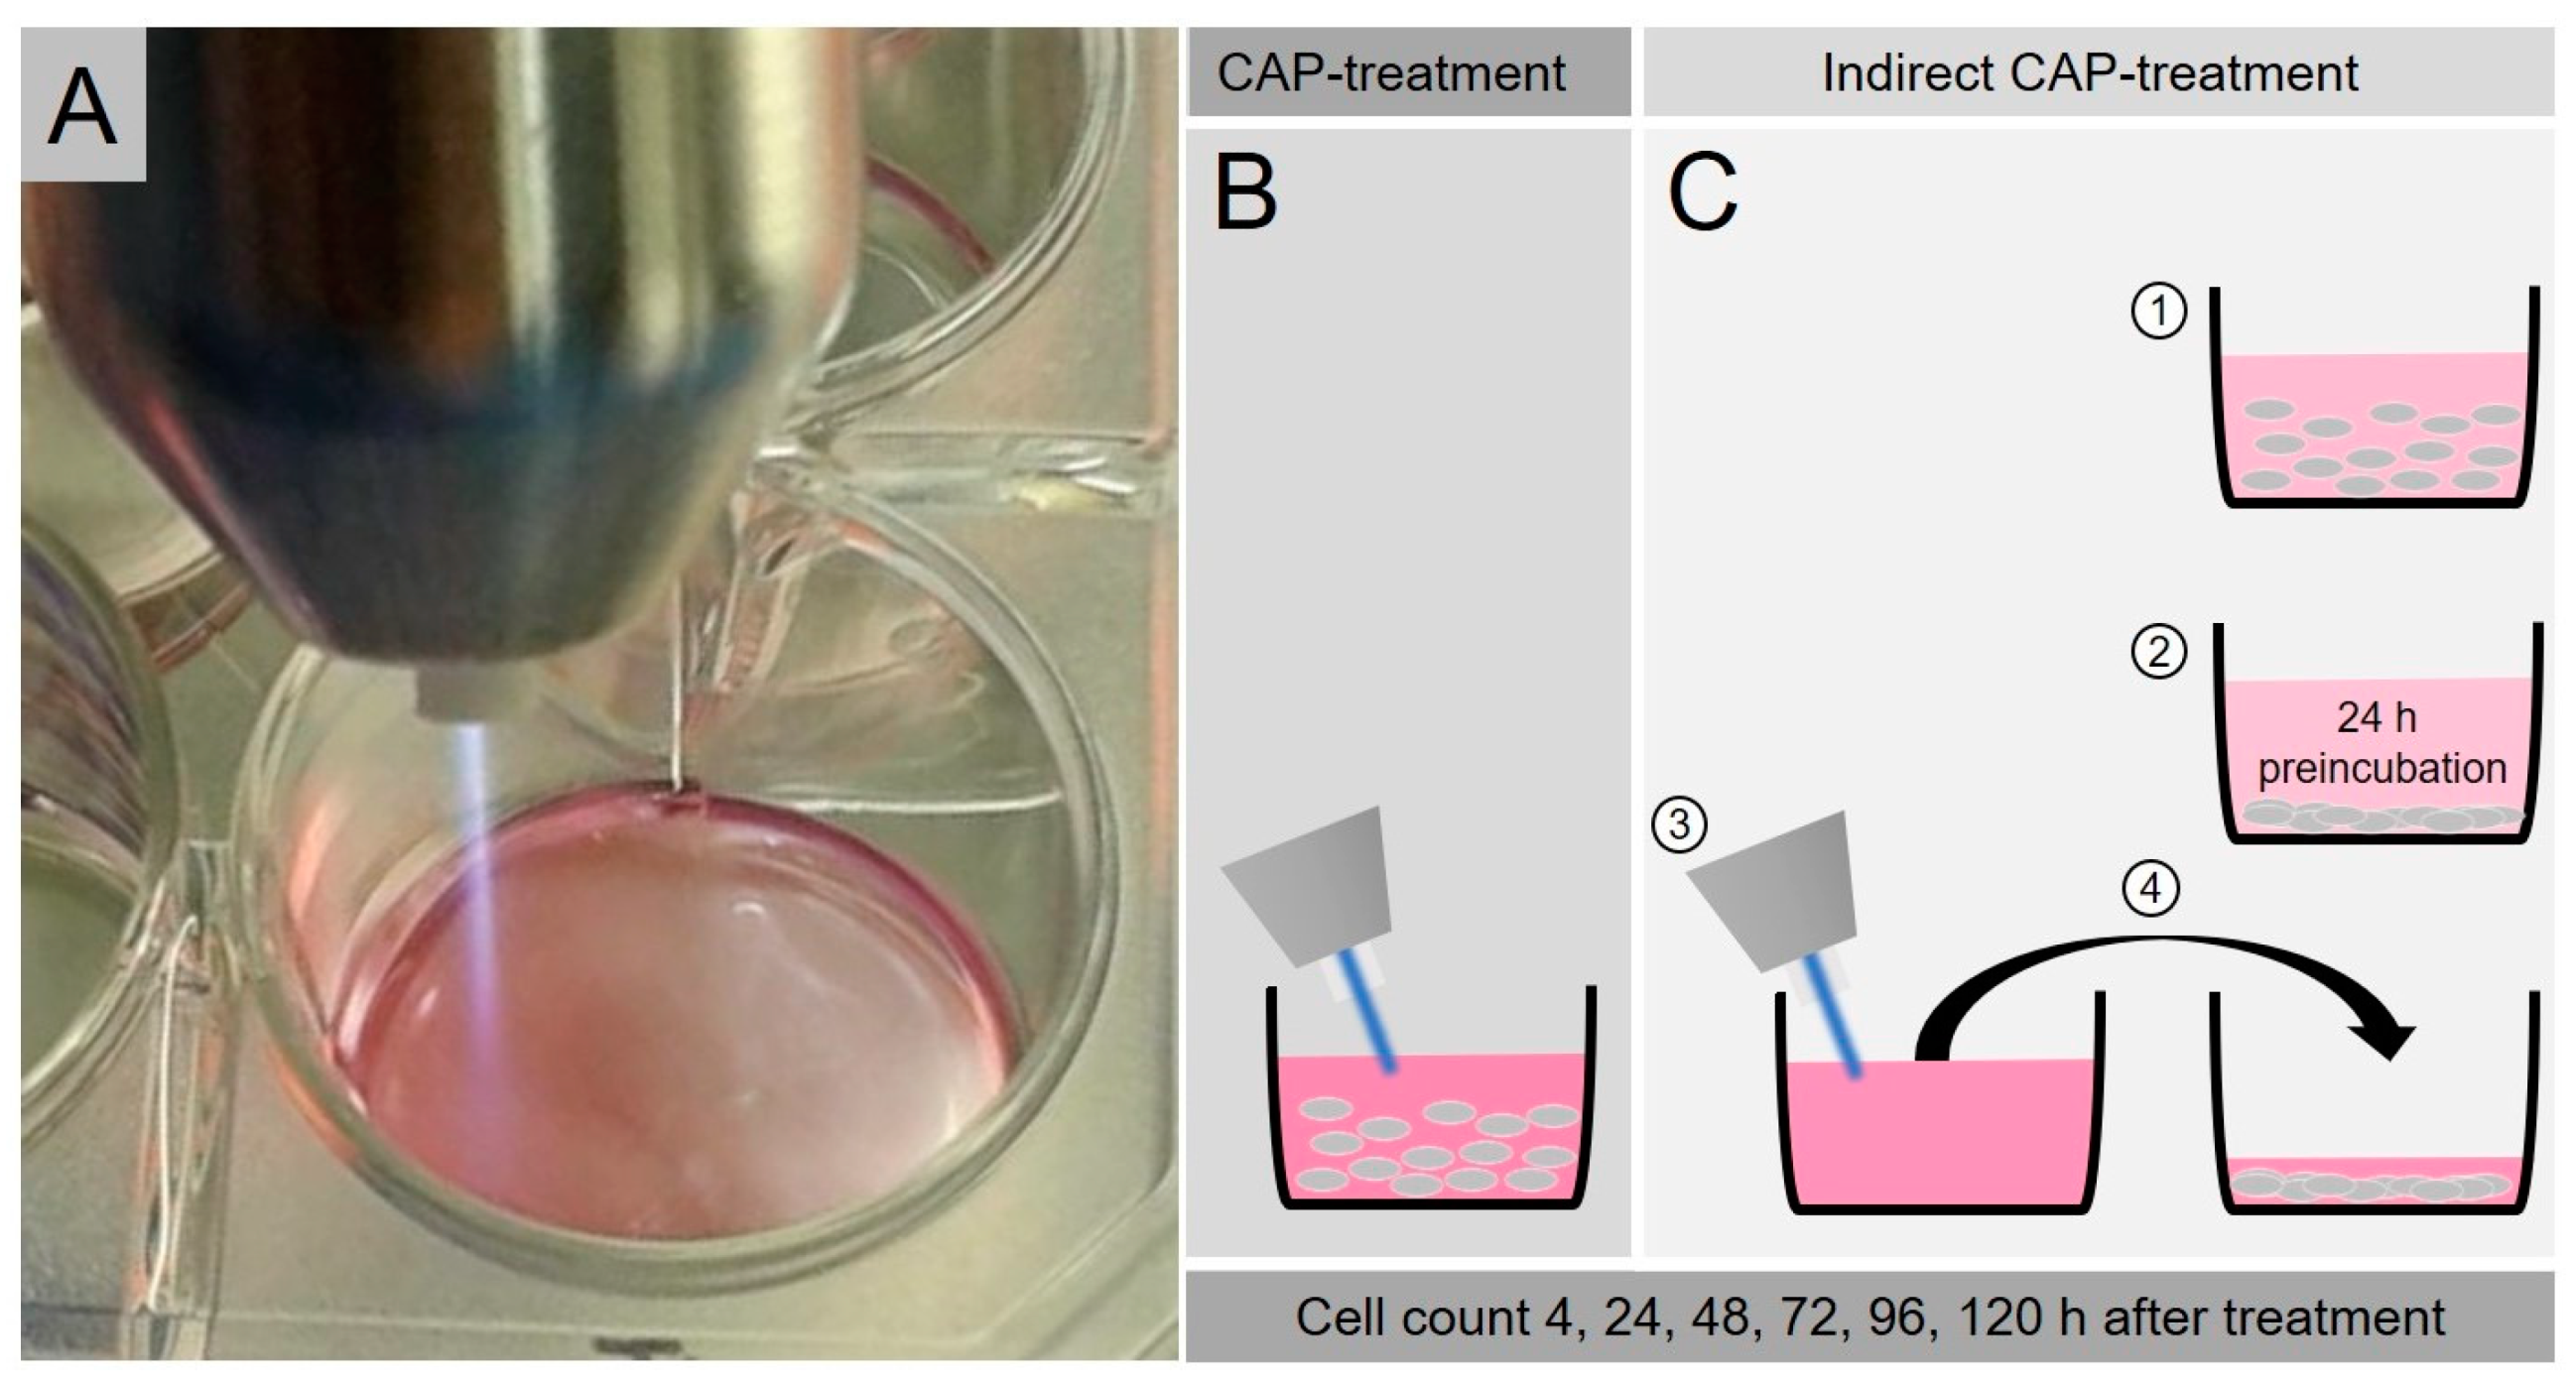
4.2. CAP-Treatment
4.3. Proliferation Assay after CAP-Exposure
4.4. Proliferation Assay after Indirect CAP-Exposure
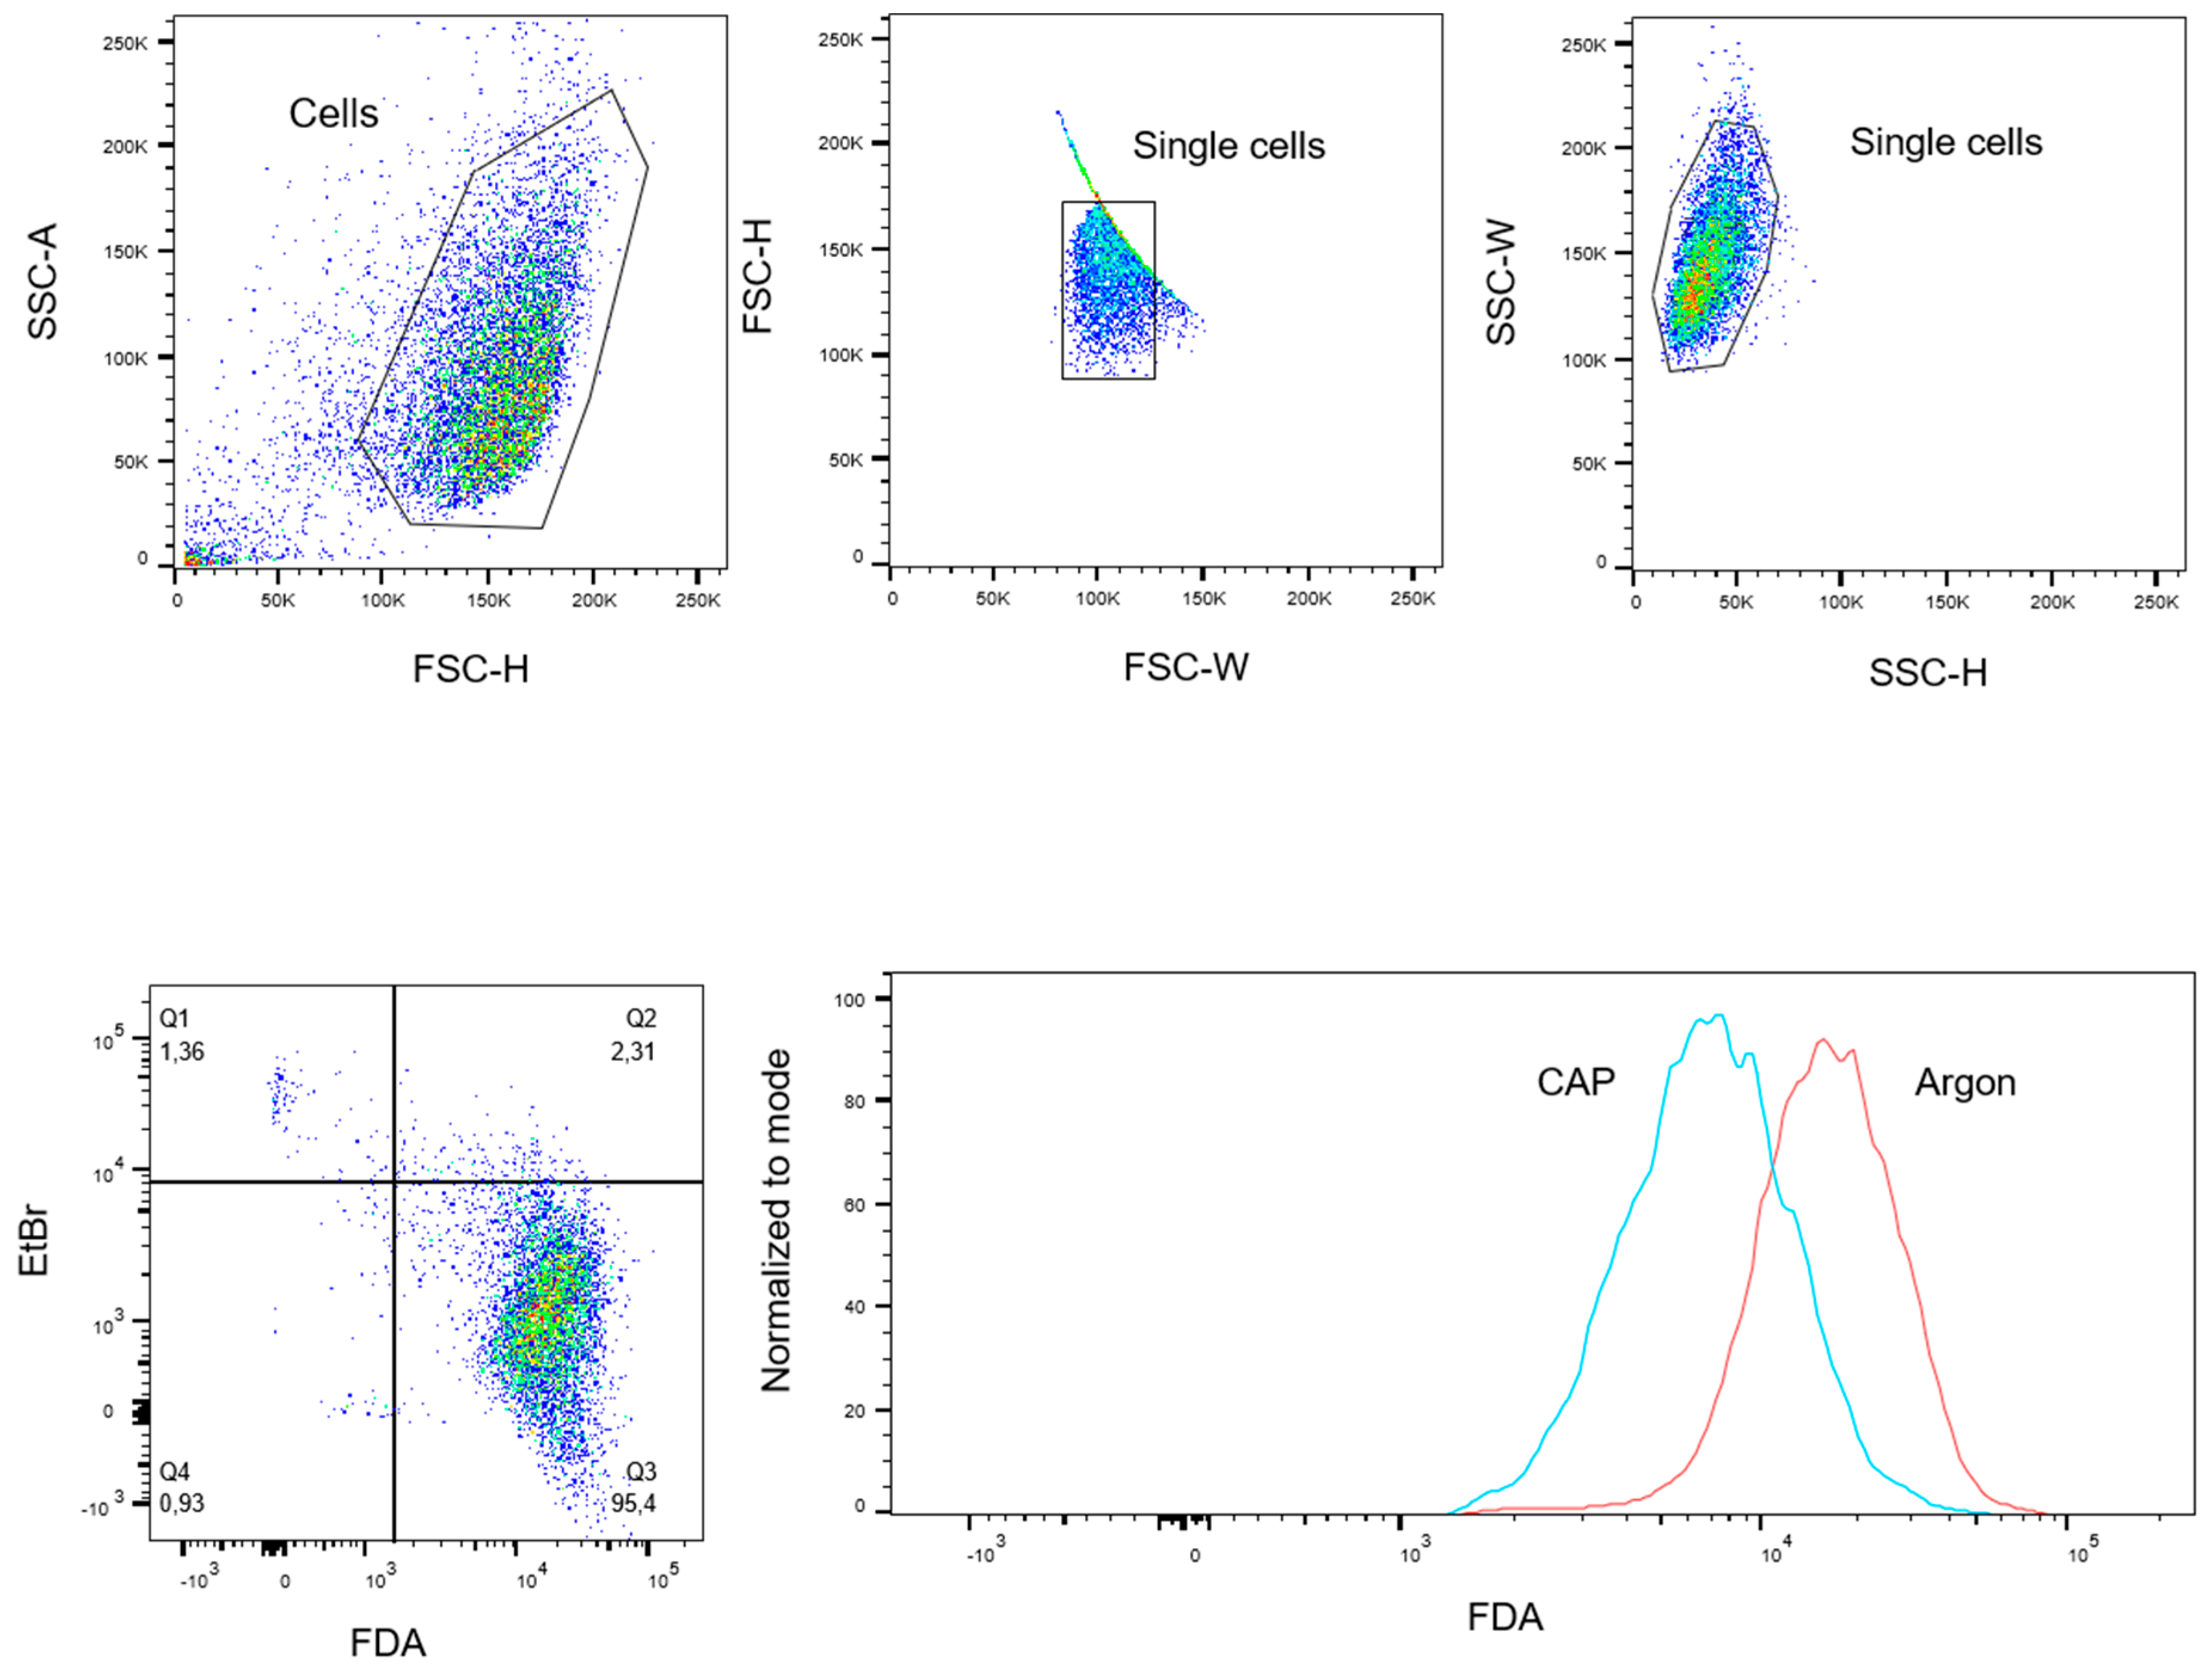
4.5. FDA-Uptake Assay
4.6. FDA-Release Assay
4.7. ATP-Release Assay
4.8. Dextran-Uptake Assay
4.9. G-/F-Actin Assay
4.10. Caspase Assay
4.11. TUNEL Assay
4.12. Hydrogenperoxid Assay
4.13. Data Analysis
5. Conclusions
Author Contributions
Funding
Acknowledgments
Conflicts of Interest
References
- Savage, S.A.; Mirabello, L. Using epidemiology and genomics to understand osteosarcoma etiology. Sarcoma 2011. [Google Scholar] [CrossRef] [PubMed] [Green Version]
- Ritter, J.; Bielack, S.S. Osteosarcoma. Ann. Oncol. 2010, 21 (Suppl. S7), vii320–vii325. [Google Scholar] [CrossRef] [PubMed]
- Mirabello, L.; Troisi, R.J.; Savage, S.A. Osteosarcoma incidence and survival rates from 1973 to 2004: Data from the Surveillance, Epidemiology, and End Results Program. Cancer 2009, 115, 1531–1543. [Google Scholar] [CrossRef] [Green Version]
- Arndt, C.A.S.; Rose, P.S.; Folpe, A.L.; Laack, N.N. Common musculoskeletal tumors of childhood and adolescence. Mayo Clin. Proc. 2012, 87, 475–487. [Google Scholar] [CrossRef] [PubMed] [Green Version]
- Esiashvili, N.; Goodman, M.; Marcus, R.B., Jr. Changes in incidence and survival of Ewing sarcoma patients over the past 3 decades: Surveillance Epidemiology and End Results data. J. Pediatr. Hematol. Oncol. 2008, 30, 425–430. [Google Scholar] [CrossRef] [PubMed]
- Taran, S.J.; Taran, R.; Malipatil, N.B. Pediatric Osteosarcoma: An Updated Review. Indian J. Med. Paediatr. Oncol. 2017, 38, 33–43. [Google Scholar] [CrossRef] [Green Version]
- Damron, T.A.; Ward, W.G.; Stewart, A. Osteosarcoma, chondrosarcoma, and Ewing’s sarcoma: National Cancer Data Base Report. Clin. Orthop. Relat. Res. 2007, 459, 40–47. [Google Scholar] [CrossRef]
- Lawlor, E.R.; Sorensen, P.H. Twenty Years on: What Do We Really Know about Ewing Sarcoma and What Is the Path Forward? Crit. Rev. Oncog. 2015, 20, 155–171. [Google Scholar] [CrossRef] [Green Version]
- Karski, E.E.; Matthay, K.K.; Neuhaus, J.M.; Goldsby, R.E.; Dubois, S.G. Characteristics and outcomes of patients with Ewing sarcoma over 40 years of age at diagnosis. Cancer Epidemiol. 2013, 37, 29–33. [Google Scholar] [CrossRef] [Green Version]
- Grünewald, T.G.P.; Cidre-Aranaz, F.; Surdez, D.; Tomazou, E.M.; de Álava, E.; Kovar, H.; Sorensen, P.H.; Delattre, O.; Dirksen, U. Ewing sarcoma. Nat. Rev. Dis. Primers 2018, 4, 1–22. [Google Scholar] [CrossRef]
- Sluga, M.; Windhager, R.; Pfeiffer, M.; Ofner, P.; Lang, S.; Dominkus, M.; Nehrer, S.; Zoubek, A.; Kotz, R. Osteosarcoma and Ewing’s sarcoma—The most frequent malignant bone tumors in children—therapy and outcome. Zeitschrift fur Orthopadie und ihre Grenzgebiete 2002, 140, 652–655. [Google Scholar] [CrossRef] [PubMed]
- Armstrong, G.T.; Kawashima, T.; Leisenring, W.; Stratton, K.; Stovall, M.; Hudson, M.M.; Sklar, C.A.; Robison, L.L.; Oeffinger, K.C. Aging and risk of severe, disabling, life-threatening, and fatal events in the childhood cancer survivor study. J. Clin. Oncol. 2014, 32, 1218–1227. [Google Scholar] [CrossRef] [PubMed]
- Ginsberg, J.P.; Goodman, P.; Leisenring, W.; Ness, K.K.; Meyers, P.A.; Wolden, S.L.; Smith, S.M.; Stovall, M.; Hammond, S.; Robison, L.L.; et al. Long-term survivors of childhood Ewing sarcoma: Report from the childhood cancer survivor study. J. Natl. Cancer Inst. 2010, 102, 1272–1283. [Google Scholar] [CrossRef] [PubMed] [Green Version]
- Privat-Maldonado, A.; Schmidt, A.; Lin, A.; Weltmann, K.D.; Wende, K.; Bogaerts, A.; Bekeschus, S. ROS from Physical Plasmas: Redox Chemistry for Biomedical Therapy. Oxid. Med. Cell. Longev. 2019, 2019, 29. [Google Scholar] [CrossRef] [Green Version]
- Bekeschus, S.; Schmidt, A.; Weltmann, K.-D.; von Woedtke, T. The plasma jet kINPen—A powerful tool for wound healing. Clin. Plasma Med. 2016, 4, 19–28. [Google Scholar] [CrossRef]
- Lendeckel, D.; Eymann, C.; Emicke, P.; Daeschlein, G.; Darm, K.; O’Neil, S.; Beule, A.G.; von Woedtke, T.; Völker, U.; Weltmann, K.-D.; et al. Proteomic Changes of Tissue-Tolerable Plasma Treated Airway Epithelial Cells and Their Relation to Wound Healing. BioMed Res. Int. 2015, 2015, 17. [Google Scholar] [CrossRef]
- Heinlin, J.; Isbary, G.; Stolz, W.; Morfill, G.; Landthaler, M.; Shimizu, T.; Steffes, B.; Nosenko, T.; Zimmermann, J.; Karrer, S. Plasma applications in medicine with a special focus on dermatology. JEADV 2011, 25, 1–11. [Google Scholar] [CrossRef]
- Weiss, M.; Gümbel, D.; Hanschmann, E.-M.; Mandelkow, R.; Gelbrich, N.; Zimmermann, U.; Walther, R.; Ekkernkamp, A.; Sckell, A.; Kramer, A.; et al. Cold Atmospheric Plasma Treatment Induces Anti-Proliferative Effects in Prostate Cancer Cells by Redox and Apoptotic Signaling Pathways. PLoS ONE 2015, 10, e0130350. [Google Scholar] [CrossRef]
- Weltmann, K.-D.; Kindel, E.; Brandenburg, R.; Meyer, C.; Bussiahn, R.; Wilke, C.; von Woedtke, T. Atmospheric Pressure Plasma Jet for Medical Therapy: Plasma Parameters and Risk Estimation. Contrib. Plasma Phys. 2009, 49, 631–640. [Google Scholar] [CrossRef]
- Weltmann, K.-D.; Von Woedtke, T. Basic requirements for plasma sources in medicine. Eur. Phys. J. Appl. Phys. 2011, 55, 10. [Google Scholar] [CrossRef]
- Martens, P.A.; Galliani, V.; Graham, G.; Caputo, R.A. Sterilization of medical products using gas plasma technology. In Sterilization of Drugs and Devices; Routledge: Abingdon, UK, 2018; pp. 157–195. [Google Scholar]
- Daeschlein, G.; von Woedtke, T.; Kindel, E.; Brandenburg, R.; Weltmann, K.D.; Jünger, M. Antibacterial activity of an atmospheric pressure plasma jet against relevant wound pathogens in vitro on a simulated wound environment. Plasma Process. Polym. 2010, 7, 224–230. [Google Scholar] [CrossRef]
- Daeschlein, G.; Scholz, S.; von Woedtke, T.; Niggemeier, M.; Kindel, E.; Brandenburg, R.; Weltmann, K.-D.; Junger, M. In vitro killing of clinical fungal strains by low-temperature atmospheric-pressure plasma jet. IEEE Trans. Plasma Sci. 2010, 39, 815–821. [Google Scholar] [CrossRef]
- Gostev, V.; Ignakhin, V.; Popova, E.; Ostashkov, O. Cold plasma-a powerful agent for biological applications. In Plasma Assisted Decontamination of Biological and Chemical Agents; Springer: Dordrecht, The Netherlands, 2008; pp. 65–77. [Google Scholar]
- Hübner, N.-O.; Matthes, R.; Koban, I.; Rändler, C.; Müller, G.; Bender, C.; Kindel, E.; Kocher, T.; Kramer, A. Efficacy of chlorhexidine, polihexanide and tissue-tolerable plasma against Pseudomonas aeruginosa biofilms grown on polystyrene and silicone materials. Ski. Pharmacol. Physiol. 2010, 23, 28–34. [Google Scholar] [CrossRef] [PubMed]
- Pan, J.; Sun, K.; Liang, Y.; Sun, P.; Yang, X.; Wang, J.; Zhang, J.; Zhu, W.; Fang, J.; Becker, K.H. Cold plasma therapy of a tooth root canal infected with Enterococcus faecalis biofilms in vitro. J. Endod. 2013, 39, 105–110. [Google Scholar] [CrossRef] [PubMed]
- Von Woedtke, T.; Reuter, S.; Masur, K.; Weltmann, K.-D. Plasmas for medicine. Phys. Rep. 2013, 530, 291–320. [Google Scholar] [CrossRef]
- Tanaka, H.; Mizuno, M.; Ishikawa, K.; Nakamura, K.; Kajiyama, H.; Kano, H.; Kikkawa, F.; Hori, M. Plasma-Activated Medium Selectively Kills Glioblastoma Brain Tumor Cells by Down-Regulating a Survival Signaling Molecule, AKT Kinase. Plasma Med. 2011, 1, 265–277. [Google Scholar] [CrossRef] [Green Version]
- Partecke, L.I.; Evert, K.; Haugk, J.; Doering, F.; Normann, L.; Diedrich, S.; Weiss, F.-U.; Evert, M.; Huebner, N.O.; Guenther, C.; et al. Tissue tolerable plasma (TTP) induces apoptosis in pancreatic cancer cells in vitro and in vivo. BMC Cancer 2012, 12, 1–10. [Google Scholar] [CrossRef] [Green Version]
- Bekeschus, S.; Rödder, K.; Fregin, B.; Otto, O.; Lippert, M.; Weltmann, K.-D.; Wende, K.; Schmidt, A.; Gandhirajan, R.K. Toxicity and Immunogenicity in Murine Melanoma following Exposure to Physical Plasma-Derived Oxidants. Oxid. Med. Cell. Longev. 2017, 2017, 12. [Google Scholar] [CrossRef]
- Kang, S.U.; Cho, J.H.; Chang, J.W.; Shin, Y.S.; Kim, K.I.; Park, J.K.; Yang, S.S.; Lee, J.S.; Moon, E.; Lee, K.; et al. Nonthermal plasma induces head and neck cancer cell death: The potential involvement of mitogen-activated protein kinase-dependent mitochondrial reactive oxygen species. Cell Death Dis. 2014, 5, e1056. [Google Scholar] [CrossRef]
- Plewa, J.-M.; Yousfi, M.; Frongia, C.; Eichwald, O.; Ducommun, B.; Merbahi, N.; Lobjois, V. Low-temperature plasma-induced antiproliferative effects on multi-cellular tumor spheroids. New J. Phys. 2014, 16, 043027. [Google Scholar] [CrossRef]
- Joh, H.M.; Choi, J.Y.; Kim, S.J.; Chung, T.H.; Kang, T.-H. Effect of additive oxygen gas on cellular response of lung cancer cells induced by atmospheric pressure helium plasma jet. Sci. Rep. 2014, 4, 6638. [Google Scholar] [CrossRef] [PubMed]
- Bekeschus, S.; Wende, K.; Hefny, M.M.; Rödder, K.; Jablonowski, H.; Schmidt, A.; von Woedtke, T.; Weltmann, K.-D.; Benedikt, J. Oxygen atoms are critical in rendering THP-1 leukaemia cells susceptible to cold physical plasma-induced apoptosis. Sci. Rep. 2017, 7, 2791. [Google Scholar] [CrossRef] [Green Version]
- Hattori, N.; Yamada, S.; Torii, K.; Takeda, S.; Nakamura, K.; Tanaka, H.; Kajiyama, H.; Kanda, M.; Fujii, T.; Nakayama, G.; et al. Effectiveness of plasma treatment on pancreatic cancer cells. Int. J. Oncol. 2015, 47, 1655–1662. [Google Scholar] [CrossRef] [PubMed] [Green Version]
- Daeschlein, G.; Scholz, S.; Lutze, S.; Arnold, A.; von Podewils, S.; Kiefer, T.; Tueting, T.; Hardt, O.; Haase, H.; Grisk, O.; et al. Comparison between cold plasma, electrochemotherapy and combined therapy in a melanoma mouse model. Exp. Derm. 2013, 22, 582–586. [Google Scholar] [CrossRef]
- Utsumi, F.; Kajiyama, H.; Nakamura, K.; Tanaka, H.; Mizuno, M.; Ishikawa, K.; Kondo, H.; Kano, H.; Hori, M.; Kikkawa, F. Effect of indirect nonequilibrium atmospheric pressure plasma on anti-proliferative activity against chronic chemo-resistant ovarian cancer cells in vitro and in vivo. PLoS ONE 2013, 8, e81576. [Google Scholar] [CrossRef] [Green Version]
- Mirpour, S.; Piroozmand, S.; Soleimani, N.; Jalali Faharani, N.; Ghomi, H.; Fotovat Eskandari, H.; Sharifi, A.M.; Mirpour, S.; Eftekhari, M.; Nikkhah, M. Utilizing the micron sized non-thermal atmospheric pressure plasma inside the animal body for the tumor treatment application. Sci. Rep. 2016, 6, 29048. [Google Scholar] [CrossRef] [PubMed]
- Vandamme, M.; Robert, E.; Lerondel, S.; Sarron, V.; Ries, D.; Dozias, S.; Sobilo, J.; Gosset, D.; Kieda, C.; Legrain, B.; et al. ROS implication in a new antitumor strategy based on non-thermal plasma. Int. J. Cancer 2012, 130, 2185–2194. [Google Scholar] [CrossRef] [PubMed]
- Metelmann, H.R.; Seebauer, C.; Rutkowski, R.; Schuster, M.; Bekeschus, S.; Metelmann, P. Treating cancer with cold physical plasma: On the way to evidence-based medicine. Contrib. Plasma Phys. 2018, 58, 415–419. [Google Scholar] [CrossRef]
- Metelmann, H.-R.; Nedrelow, D.S.; Seebauer, C.; Schuster, M.; von Woedtke, T.; Weltmann, K.-D.; Kindler, S.; Metelmann, P.H.; Finkelstein, S.E.; Von Hoff, D.D. Head and neck cancer treatment and physical plasma. Clin. Plasma Med. 2015, 3, 17–23. [Google Scholar] [CrossRef]
- Schuster, M.; Seebauer, C.; Rutkowski, R.; Hauschild, A.; Podmelle, F.; Metelmann, C.; Metelmann, B.; von Woedtke, T.; Hasse, S.; Weltmann, K.-D. Visible tumor surface response to physical plasma and apoptotic cell kill in head and neck cancer. J. Cranio-Maxillofac. Surg. 2016, 44, 1445–1452. [Google Scholar] [CrossRef]
- Metelmann, H.-R.; Seebauer, C.; Miller, V.; Fridman, A.; Bauer, G.; Graves, D.B.; Pouvesle, J.-M.; Rutkowski, R.; Schuster, M.; Bekeschus, S. Clinical experience with cold plasma in the treatment of locally advanced head and neck cancer. Clin. Plasma Med. 2018, 9, 6–13. [Google Scholar] [CrossRef]
- Escribá, P.V.; Nicolson, G.L. Membrane structure and function: Relevance of lipid and protein structures in cellular physiology, pathology and therapy. Biochim. Biophys. Acta 2014, 1838, 1449–1450. [Google Scholar] [CrossRef] [PubMed] [Green Version]
- Koensgen, D.; Besic, I.; Gumbel, D.; Kaul, A.; Weiss, M.; Diesing, K.; Kramer, A.; Bekeschus, S.; Mustea, A.; Stope, M.B. Cold Atmospheric Plasma (CAP) and CAP-Stimulated Cell Culture Media Suppress Ovarian Cancer Cell Growth—A Putative Treatment Option in Ovarian Cancer Therapy. Anticancer Res. 2017, 37, 6739–6744. [Google Scholar] [CrossRef] [PubMed]
- Wang, M.; Holmes, B.; Cheng, X.; Zhu, W.; Keidar, M.; Zhang, L.G. Cold atmospheric plasma for selectively ablating metastatic breast cancer cells. PLoS ONE 2013, 8, 1–11. [Google Scholar] [CrossRef]
- Haralambiev, L.; Wien, L.; Gelbrich, N.; Lange, J.; Bakir, S.; Kramer, A.; Burchardt, M.; Ekkernkamp, A.; Gümbel, D.; Stope, M.B. Cold atmospheric plasma inhibits the growth of osteosarcoma cells by inducing apoptosis, independent of the device used. Oncol. Lett. 2020, 19, 283–290. [Google Scholar] [CrossRef] [Green Version]
- Haralambiev, L.; Nitsch, A.; Einenkel, R.; Muzzio, D.O.; Gelbrich, N.; Burchardt, M.; Zygmunt, M.; Ekkernkamp, A.; Stope, M.B.; Gümbel, D. The Effect of Cold Atmospheric Plasma on the Membrane Permeability of Human Osteosarcoma Cells. Anticancer Res. 2020, 40, 841–846. [Google Scholar] [CrossRef]
- Gümbel, D.; Suchy, B.; Wien, L.; Gelbrich, N.; Napp, M.; Kramer, A.; Ekkernkamp, A.; Daeschlein, G.; Stope, M.B. Comparison of Cold Atmospheric Plasma Devices’ Efficacy on Osteosarcoma and Fibroblastic In Vitro Cell Models. Anticancer Res. 2017, 37, 5407–5414. [Google Scholar] [CrossRef]
- Gümbel, D.; Gelbrich, N.; Weiss, M.; Napp, M.; Daeschlein, G.; Sckell, A.; Ender, S.A.; Kramer, A.; Burchardt, M.; Ekkernkamp, A.; et al. New Treatment Options for Osteosarcoma-Inactivation of Osteosarcoma Cells by Cold Atmospheric Plasma. Anticancer Res. 2016, 36, 5915–5922. [Google Scholar] [CrossRef] [Green Version]
- Gümbel, D.; Gelbrich, N.; Napp, M.; Daeschlein, G.; Kramer, A.; Sckell, A.; Burchardt, M.; Ekkernkamp, A.; Stope, M.B. Peroxiredoxin Expression of Human Osteosarcoma Cells Is Influenced by Cold Atmospheric Plasma Treatment. Anticancer Res. 2017, 37, 1031–1038. [Google Scholar] [CrossRef] [Green Version]
- Haralambiev, L.; Wien, L.; Gelbrich, N.; Kramer, A.; Mustea, A.; Burchardt, M.; Ekkernkamp, A.; Stope, M.B.; Gümbel, D. Effects of Cold Atmospheric Plasma on the Expression of Chemokines, Growth Factors, TNF Superfamily Members, Interleukins, and Cytokines in Human Osteosarcoma Cells. Anticancer Res. 2019, 39, 151–157. [Google Scholar] [CrossRef]
- Dubuc, A.; Monsarrat, P.; Virard, F.; Merbahi, N.; Sarrette, J.-P.; Laurencin-Dalicieux, S.; Cousty, S. Use of cold-atmospheric plasma in oncology: A concise systematic review. Ther. Adv. Med. Oncol. 2018, 10, 1–12. [Google Scholar] [CrossRef] [PubMed]
- Mohades, S.; Barekzi, N.; Laroussi, M. Efficacy of Low Temperature Plasma against SCaBER Cancer Cells. Plasma Process. Polym. 2014, 11, 1150–1155. [Google Scholar] [CrossRef]
- Bekeschus, S.; Käding, A.; Schröder, T.; Wende, K.; Hackbarth, C.; Liedtke, K.R.; van der Linde, J.; von Woedtke, T.; Heidecke, C.-D.; Partecke, L.-I. Cold Physical Plasma-Treated Buffered Saline Solution as Effective Agent Against Pancreatic Cancer Cells. Anti Cancer Agents Med. Chem. 2018, 18, 824–831. [Google Scholar] [CrossRef] [PubMed]
- Mateu-Sanz, M.; Tornín, J.; Brulin, B.; Khlyustova, A.; Ginebra, M.-P.; Layrolle, P.; Canal, C. Cold Plasma-Treated Ringer’s Saline: A Weapon to Target Osteosarcoma. Cancers 2020, 12, 227. [Google Scholar] [CrossRef] [Green Version]
- Attri, P.; Park, J.H.; Ali, A.; Choi, E.H. How Does Plasma Activated Media Treatment Differ From Direct Cold Plasma Treatment? Anti Cancer Agents Med. Chem. 2018, 18, 805–814. [Google Scholar] [CrossRef] [PubMed]
- Yan, D.; Sherman, J.H.; Keidar, M. Cold atmospheric plasma, a novel promising anti-cancer treatment modality. Oncotarget 2017, 8, 15977–15995. [Google Scholar] [CrossRef] [PubMed] [Green Version]
- Yan, D.; Xu, W.; Yao, X.; Lin, L.; Sherman, J.H.; Keidar, M. The Cell Activation Phenomena in the Cold Atmospheric Plasma Cancer Treatment. Sci. Rep. 2018, 8, 1–10. [Google Scholar] [CrossRef] [Green Version]
- Yan, X.; Xiong, Z.; Zou, F.; Zhao, S.; Lu, X.; Yang, G.; He, G.; Ostrikov, K. Plasma-Induced Death of HepG2 Cancer Cells: Intracellular Effects of Reactive Species. Plasma Process. Polym. 2012, 9, 59–66. [Google Scholar] [CrossRef]
- Zamzami, N.; Marchetti, P.; Castedo, M.; Decaudin, D.; Macho, A.; Hirsch, T.; Susin, S.A.; Petit, P.X.; Mignotte, B.; Kroemer, G. Sequential reduction of mitochondrial transmembrane potential and generation of reactive oxygen species in early programmed cell death. J. Exp. Med. 1995, 182, 367–377. [Google Scholar] [CrossRef]
- Graves, D.B. Reactive species from cold atmospheric plasma: Implications for cancer therapy. Plasma Process. Polym. 2014, 11, 1120–1127. [Google Scholar] [CrossRef]
- Moloney, J.N.; Cotter, T.G. ROS signalling in the biology of cancer. Semin. Cell Dev. Biol. 2018, 80, 50–64. [Google Scholar] [CrossRef]
- Wende, K.; von Woedtke, T.; Weltmann, K.-D.; Bekeschus, S. Chemistry and biochemistry of cold physical plasma derived reactive species in liquids. Biol. Chem. 2018, 400, 19–38. [Google Scholar] [CrossRef] [PubMed]
- Bekeschus, S.; Brüggemeier, J.; Hackbarth, C.; von Woedtke, T.; Partecke, L.-I.; van der Linde, J. Platelets are key in cold physical plasma-facilitated blood coagulation in mice. Clin. Plasma Med. 2017, 7–8, 58–65. [Google Scholar] [CrossRef]
- Kanduc, D.; Mittelman, A.; Serpico, R.; Sinigaglia, E.; Sinha, A.A.; Natale, C.; Santacroce, R.; Di Corcia, M.G.; Lucchese, A.; Dini, L.; et al. Cell death: Apoptosis versus necrosis (review). Int. J. Oncol. 2002, 21, 165–170. [Google Scholar] [CrossRef] [Green Version]
- Cohen, G.M. Caspases: The executioners of apoptosis. Biochem. J. 1997, 326, 1–16. [Google Scholar] [CrossRef] [Green Version]
- Bortner, C.D.; Oldenburg, N.B.; Cidlowski, J.A. The role of DNA fragmentation in apoptosis. Trends Cell Biol. 1995, 5, 21–26. [Google Scholar] [CrossRef]
- Liou, G.-Y.; Storz, P. Reactive oxygen species in cancer. Free Radic. Res. 2010, 44, 479–496. [Google Scholar] [CrossRef] [Green Version]
- Han, L.; Patil, S.; Keener, K.M.; Cullen, P.J.; Bourke, P. Bacterial inactivation by high-voltage atmospheric cold plasma: Influence of process parameters and effects on cell leakage and DNA. J. Appl. Microbiol. 2014, 116, 784–794. [Google Scholar] [CrossRef] [Green Version]
- Joshi, S.G.; Cooper, M.; Yost, A.; Paff, M.; Ercan, U.K.; Fridman, G.; Friedman, G.; Fridman, A.; Brooks, A.D. Nonthermal dielectric-barrier discharge plasma-induced inactivation involves oxidative DNA damage and membrane lipid peroxidation in Escherichia coli. Antimicrob. Agents Chemother. 2011, 55, 1053–1062. [Google Scholar] [CrossRef] [Green Version]
- Waskow, A.; Betschart, J.; Butscher, D.; Oberbossel, G.; Klöti, D.; Büttner-Mainik, A.; Adamcik, J.; von Rohr, P.R.; Schuppler, M. Characterization of Efficiency and Mechanisms of Cold Atmospheric Pressure Plasma Decontamination of Seeds for Sprout Production. Front. Microbiol. 2018, 9, 1–15. [Google Scholar] [CrossRef] [Green Version]
- Yu, Q.S.; Huang, C.; Hsieh, F.H.; Huff, H.; Duan, Y. Bacterial inactivation using a low-temperature atmospheric plasma brush sustained with argon gas. J. Biomed. Mater. Res. Part. B 2007, 80, 211–219. [Google Scholar] [CrossRef] [PubMed]
- Aeschbacher, M.; Reinhardt, C.A.; Zbinden, G. A rapid cell membrane permeability test using fluorescent dyes and flow cytometry. Cell Biol. Toxicol. 1986, 2, 247–255. [Google Scholar] [CrossRef] [PubMed]
- Nitsch, A.; Haralambiev, L.; Einenkel, R.; Muzzio, D.O.; Zygmunt, M.T.; Ekkernkamp, A.; Burchardt, M.; Stope, M.B. Determination of In Vitro Membrane Permeability by Analysis of Intracellular and Extracellular Fluorescein Signals in Renal Cells. In Vivo 2019, 33, 1767–1771. [Google Scholar] [CrossRef] [PubMed] [Green Version]
- Johnston, M.D.; Hanlon, G.W.; Denyer, S.P.; Lambert, R.J.W. Membrane damage to bacteria caused by single and combined biocides. J. Appl. Microbiol. 2003, 94, 1015–1023. [Google Scholar] [CrossRef]
- Oliva, B.; O’Neill, A.J.; Miller, K.; Stubbings, W.; Chopra, I. Anti-staphylococcal activity and mode of action of clofazimine. J. Antimicrob. Chemother. 2004, 53, 435–440. [Google Scholar] [CrossRef]
- Smelt, J.P.P.M.; Rijke, A.G.F.; Hayhurst, A. Possible mechanism of high pressure inactivation of microorganisms. High. Press. Res. 1994, 12, 199–203. [Google Scholar] [CrossRef]
- Lin, A.; Truong, B.; Patel, S.; Kaushik, N.; Choi, H.E.; Fridman, G.; Fridman, A.; Miller, V. Nanosecond-Pulsed DBD Plasma-Generated Reactive Oxygen Species Trigger Immunogenic Cell Death in A549 Lung Carcinoma Cells through Intracellular Oxidative Stress. Int. J. Mol. Sci 2017, 18, 966. [Google Scholar] [CrossRef] [Green Version]
- Zhang, J.J.; Wang, X.Z.; Luong Do, H.; Chandimali, N.; Kang, T.Y.; Kim, N.; Ghosh, M.; Lee, S.B.; Mok, Y.S.; Kim, S.B.; et al. MicroRNA-7450 regulates non-thermal plasma-induced chicken Sertoli cell apoptosis via adenosine monophosphate-activated protein kinase activation. Sci. Rep. 2018, 8, 8761. [Google Scholar] [CrossRef]
- Azzariti, A.; Iacobazzi, R.M.; Di Fonte, R.; Porcelli, L.; Gristina, R.; Favia, P.; Fracassi, F.; Trizio, I.; Silvestris, N.; Guida, G.; et al. Plasma-activated medium triggers cell death and the presentation of immune activating danger signals in melanoma and pancreatic cancer cells. Sci. Rep. 2019, 9, 4099. [Google Scholar] [CrossRef]
- Rödder, K.; Moritz, J.; Miller, V.; Weltmann, K.-D.; Metelmann, H.-R.; Gandhirajan, R.; Bekeschus, S. Activation of Murine Immune Cells upon Co-culture with Plasma-treated B16F10 Melanoma Cells. Appl. Sci. 2019, 9, 660. [Google Scholar] [CrossRef] [Green Version]
- Sagwal, S.K.; Pasqual-Melo, G.; Bodnar, Y.; Gandhirajan, R.K.; Bekeschus, S. Combination of chemotherapy and physical plasma elicits melanoma cell death via upregulation of SLC22A16. Cell Death Dis. 2018, 9, 1179. [Google Scholar] [CrossRef]
- Kepp, O.; Senovilla, L.; Vitale, I.; Vacchelli, E.; Adjemian, S.; Agostinis, P.; Apetoh, L.; Aranda, F.; Barnaba, V.; Bloy, N.; et al. Consensus guidelines for the detection of immunogenic cell death. Oncoimmunology 2014, 3, e9556911. [Google Scholar] [CrossRef] [PubMed] [Green Version]
- Marschewski, M.; Hirschberg, J.; Omairi, T.; Höfft, O.; Viöl, W.; Emmert, S.; Maus-Friedrichs, W. Electron spectroscopic analysis of the human lipid skin barrier: Cold atmospheric plasma-induced changes in lipid composition. Exp. Derm. 2012, 21, 921–925. [Google Scholar] [CrossRef] [PubMed]
- Tolouie, H.; Mohammadifar, M.A.; Ghomi, H.; Hashemi, M. Cold atmospheric plasma manipulation of proteins in food systems. Crit. Rev. Food Sci. Nutr. 2018, 58, 2583–2597. [Google Scholar] [CrossRef] [PubMed] [Green Version]
- Kvam, E.; Davis, B.; Mondello, F.; Garner, A.L. Nonthermal atmospheric plasma rapidly disinfects multidrug-resistant microbes by inducing cell surface damage. Antimicrob. Agents Chemother. 2012, 56, 2028–2036. [Google Scholar] [CrossRef] [PubMed] [Green Version]
- Brückner, B.R.; Nöding, H.; Skamrahl, M.; Janshoff, A. Mechanical and morphological response of confluent epithelial cell layers to reinforcement and dissolution of the F-actin cytoskeleton. Prog. Biophys. Mol. Biol. 2019, 144, 77–90. [Google Scholar] [CrossRef] [PubMed]
- Arndt, S.; Wacker, E.; Li, Y.-F.; Shimizu, T.; Thomas, H.M.; Morfill, G.E.; Karrer, S.; Zimmermann, J.L.; Bosserhoff, A.-K. Cold atmospheric plasma, a new strategy to induce senescence in melanoma cells. Exp. Derm. 2013, 22, 284–289. [Google Scholar] [CrossRef]
- Schmidt, A.; von Woedtke, T.; Stenzel, J.; Lindner, T.; Polei, S.; Vollmar, B.; Bekeschus, S. One Year Follow-Up Risk Assessment in SKH-1 Mice and Wounds Treated with an Argon Plasma Jet. Int. J. Mol. Sci. 2017, 18, 868. [Google Scholar] [CrossRef]
- Sarkar, A.; Pal, D.; Das, L.; Saha, S.; Sarkar, S. Cold atmospheric plasma, a new promising advanced treatment modality for oral cancer. JIDA J. Indian Dent. Assoc. 2019, 13, 20–27. [Google Scholar]
- Keidar, M.; Yan, D.; Sherman, J.H. The anti-cancer mechanism of cold atmospheric plasma in vitro. In Cold Plasma Cancer Therapy; Morgan & Claypool Publishers: Williston, VT, USA, 2019; pp. 4–11. [Google Scholar]
- Canal, C.; Fontelo, R.; Hamouda, I.; Guillem-Marti, J.; Cvelbar, U.; Ginebra, M.-P. Plasma-induced selectivity in bone cancer cells death. Free Radic. Biol. Med. 2017, 110, 72–80. [Google Scholar] [CrossRef] [Green Version]


© 2020 by the authors. Licensee MDPI, Basel, Switzerland. This article is an open access article distributed under the terms and conditions of the Creative Commons Attribution (CC BY) license (http://creativecommons.org/licenses/by/4.0/).
Share and Cite
Jacoby, J.M.; Strakeljahn, S.; Nitsch, A.; Bekeschus, S.; Hinz, P.; Mustea, A.; Ekkernkamp, A.; Tzvetkov, M.V.; Haralambiev, L.; Stope, M.B. An Innovative Therapeutic Option for the Treatment of Skeletal Sarcomas: Elimination of Osteo- and Ewing’s Sarcoma Cells Using Physical Gas Plasma. Int. J. Mol. Sci. 2020, 21, 4460. https://doi.org/10.3390/ijms21124460
Jacoby JM, Strakeljahn S, Nitsch A, Bekeschus S, Hinz P, Mustea A, Ekkernkamp A, Tzvetkov MV, Haralambiev L, Stope MB. An Innovative Therapeutic Option for the Treatment of Skeletal Sarcomas: Elimination of Osteo- and Ewing’s Sarcoma Cells Using Physical Gas Plasma. International Journal of Molecular Sciences. 2020; 21(12):4460. https://doi.org/10.3390/ijms21124460
Chicago/Turabian StyleJacoby, Josephine M., Silas Strakeljahn, Andreas Nitsch, Sander Bekeschus, Peter Hinz, Alexander Mustea, Axel Ekkernkamp, Mladen V. Tzvetkov, Lyubomir Haralambiev, and Matthias B. Stope. 2020. "An Innovative Therapeutic Option for the Treatment of Skeletal Sarcomas: Elimination of Osteo- and Ewing’s Sarcoma Cells Using Physical Gas Plasma" International Journal of Molecular Sciences 21, no. 12: 4460. https://doi.org/10.3390/ijms21124460