Article

Can Ceylon Leadwort (Plumbago zeylanica L.) Acclimate to Lead Toxicity?—Studies of Photosynthetic Apparatus Efficiency

1
Department of Botany, Physiology and Plant Protection, Faculty of Biotechnology and Horticulture, University of Agriculture in Krakow, Al. 29 Listopada 54, 31-425 Kraków, Poland
2
Department of Technique and Food Development, Institute of Human Nutrition Sciences, Warsaw University of Life Sciences, Nowoursynowska 159 C, 02-776 Warsaw, Poland
3
Department of Botany, Institute of Biology, Warsaw University of Life Sciences, Nowoursynowska 159/37, 02-776 Warsaw, Poland
4
Plant-Microorganism Interactions Group, Malopolska Centre of Biotechnology, Jagiellonian University, Gronostajowa 7A, 30-387 Kraków, Poland
5
Institute of Biotechnology and Molecular Medicine, Trzy Lipy 3, 80-172 Gdansk, Poland
6
Institute of Biology, Biotechnology and Environmental Protection, Faculty of Natural Sciences, University of Silesia, Bankowa 9, 40-007 Katowice
*
Author to whom correspondence should be addressed.
Int. J. Mol. Sci. 2020, 21(5), 1866; https://doi.org/10.3390/ijms21051866
Submission received: 13 February 2020 / Revised: 5 March 2020 / Accepted: 6 March 2020 / Published: 9 March 2020
(This article belongs to the Section Molecular Plant Sciences)

Abstract

:
Ceylon leadwort (Plumbago zeylanica) is ornamental plant known for its pharmacological properties arising from the abundant production of various secondary metabolites. It often grows in lead polluted areas. The aim of presented study was to evaluate the survival strategy of P. zeylanica to lead toxicity via photosynthetic apparatus acclimatization. Shoots of P. zeylanica were cultivated on media with different Pb concentrations (0.0, 0.05, and 0.1 g Pb∙l−1). After a four-week culture, the efficiency of the photosynthetic apparatus of plants was evaluated by Chl a fluorescence measurement, photosynthetic pigment, and Lhcb1, PsbA, PsbO, and RuBisCo protein accumulation, antioxidant enzymes activity, and chloroplast ultrastructure observation. Plants from lower Pb concentration revealed no changes in photosynthetic pigments content and light-harvesting complex (LHCII) size, as well as no limitation on the donor side of Photosystem II Reaction Centre (PSII RC). However, the activity and content of antioxidant enzymes indicated a high risk of limitation on the acceptor side of Photosystem I. In turn, plants from 0.1 g Pb∙l−1 showed a significant decrease in pigments content, LHCII size, the amount of active PSII RC, oxygen-evolving complex activity, and significant remodeling of chloroplast ultrastructure indicated limitation of PSII RC donor side. Obtained results indicate that P. zeylanica plants acclimate to lead toxicity by Pb accumulation in roots and, depending on Pb concentration, by adjusting their photosynthetic apparatus via the activation of alternative (cyclic and pseudocyclic) electron transport pathways.

Graphical Abstract

1. Introduction

The intensive development of metallurgy, ore mining, chemical and fertilizer industry, municipal services, and other industries involves the production of various waste types that increase environmental pollution. Among most hazardous wastes are heavy metals [1,2]. Despite many attempts to withdraw heavy metals from use, complete elimination of the problem associated with the emission of these elements into the environment is still not possible [1]. The most toxic heavy metals that threaten human health are cadmium, lead, arsenic, and mercury [3]. People are exposed to them through different pathways like air, household dust, street dirt, soil, water and food, including the consumption of plants growing in polluted areas [4].
Lead is a threat not only to people but also exerts a negative effect on plants [5]. Visible symptoms of lead toxicity to plants are manifested by retardation of the growth and development of plant organs and the reduction of plant yield [5,6,7,8]. These reductions result mainly from oxidative stress, photosynthesis inhibition, and damage to DNA and its consequences caused by Pb ions [9]. Although lead is classified as a metal with low redox activity, i.e., it cannot generate ROS in a direct oxidoreductive reaction such as the Haber–Weiss/Fenton reaction, it still increases ROS in the cells. Lead causes emergence of ROS by stimulation of NADPH oxidase, substitution of divalent cations at enzyme cofactors, limitation of enzyme activity by binding to -SH or -COOH groups, or peroxidation of lipids [10,11]. Moreover, lead decreases activity of antioxidant enzymes by interference with the effective accumulation of K, P, Fe, Zn, Cu, Mg and Ca elements [12]. Pb may restrain photosynthesis by reducing chlorophyll synthesis (associated with ALAD activity), interfering with electron transport within Photosystem II (PSII) and Photosystem I (PSI), as well as inhibiting plastoquinone synthesis, damaging oxygen-evolving complex (OEC), or lowering activity of Calvin-Benson cycle enzymes [13,14]. The light-independent reactions of photosynthesis (“dark reactions”) seems to be very sensitive to Pb which significantly decreases CO2 assimilation rate and activity of RuBisCo [15]. Lead genotoxicity results from its ability to binding directly or indirectly (by proteins) to DNA and disrupting DNA replication or repair [16]. Moreover, Pb disturbs mitotic activity of cells, very often leading to c-mitosis [17]. Disruptions of mitosis may also result from Pb interference with the cytoskeleton, which leads to chromosome aberrations [18].
First reaction of plants to the lead presence in soil is metal retention on the root surface and/or selective metal collection [13]. After entering into cells, lead is neutralized by accumulation in inter-cell spaces, cell walls (binding to pectin carboxyl groups), vacuoles, and in small amounts in dictyosomes and the endoplasmatic reticulum [10,14,19,20]. Thanks to these mechanisms lead is mainly accumulated in the roots and only a small amount of lead is transported to plant shoots, most likely because of the physical barrier of Casparian strips in endoderm cells [13]. Nevertheless, some amounts of Pb ions entering the cells trigger the plant’s defense mechanisms based mainly on antioxidant system (enzymes and small-molecule antioxidant) [5,8]. Moreover, in the case of Pb penetration to the aboveground plant cells, plant survival will be determined by the ability to acclimatize the photosynthetic apparatus to the existing conditions [20].
Ceylon leadwort (Plumbago zeylanica L.) is a decorative plant known for its pharmacological properties resulting from the abundant production of various secondary metabolites, among which the most-known is plumbagin (a derivative of 1,4-naphthoquinone) [21]. Ceylon leadwort belongs to Plumbaginaceae family known from species, like sea thrift (Armeria maritime) and cape leadwort (Plumbago auriculata Lam) often found in lead polluted regions [22]. The Plumbago genus name that originated from Latin words plumbum (“lead”) is believed to refer to lead-blue flower colour, the ability of the sap to create lead-colored stains on skin, or the belief that the plant was a cure for lead poisoning [23]. The natural place of Plumbago occurrence is South Asia, especially India. Moreover, it can be found in subtropical and tropical regions above 2000 m above sea level, where soils are rich in trace elements [24]. All this suggests that Plumbago plants are associated with lead and may be tolerant to this harmful element. However, there are no papers on the effect of lead ions on P. zeylanica, an otherwise very important pharmacological species.
Therefore, presented research was focused on the response of P. zeylanica to lead toxicity. Our aim was to evaluate the plants survival strategy mainly in the context of photosynthetic apparatus acclimatization. Experiments were conducted under controlled in vitro conditions to exclude malfunctions of plant metabolism caused by other adverse factors, such as drought, high light intensity, pathogens, etc.
Presented research indicates that P. zeylanica plants acclimate to lead toxicity by adjusting their photosynthetic apparatus via different mechanisms (alternative electron transport pathways) depending on Pb ion concentration.

2. Results

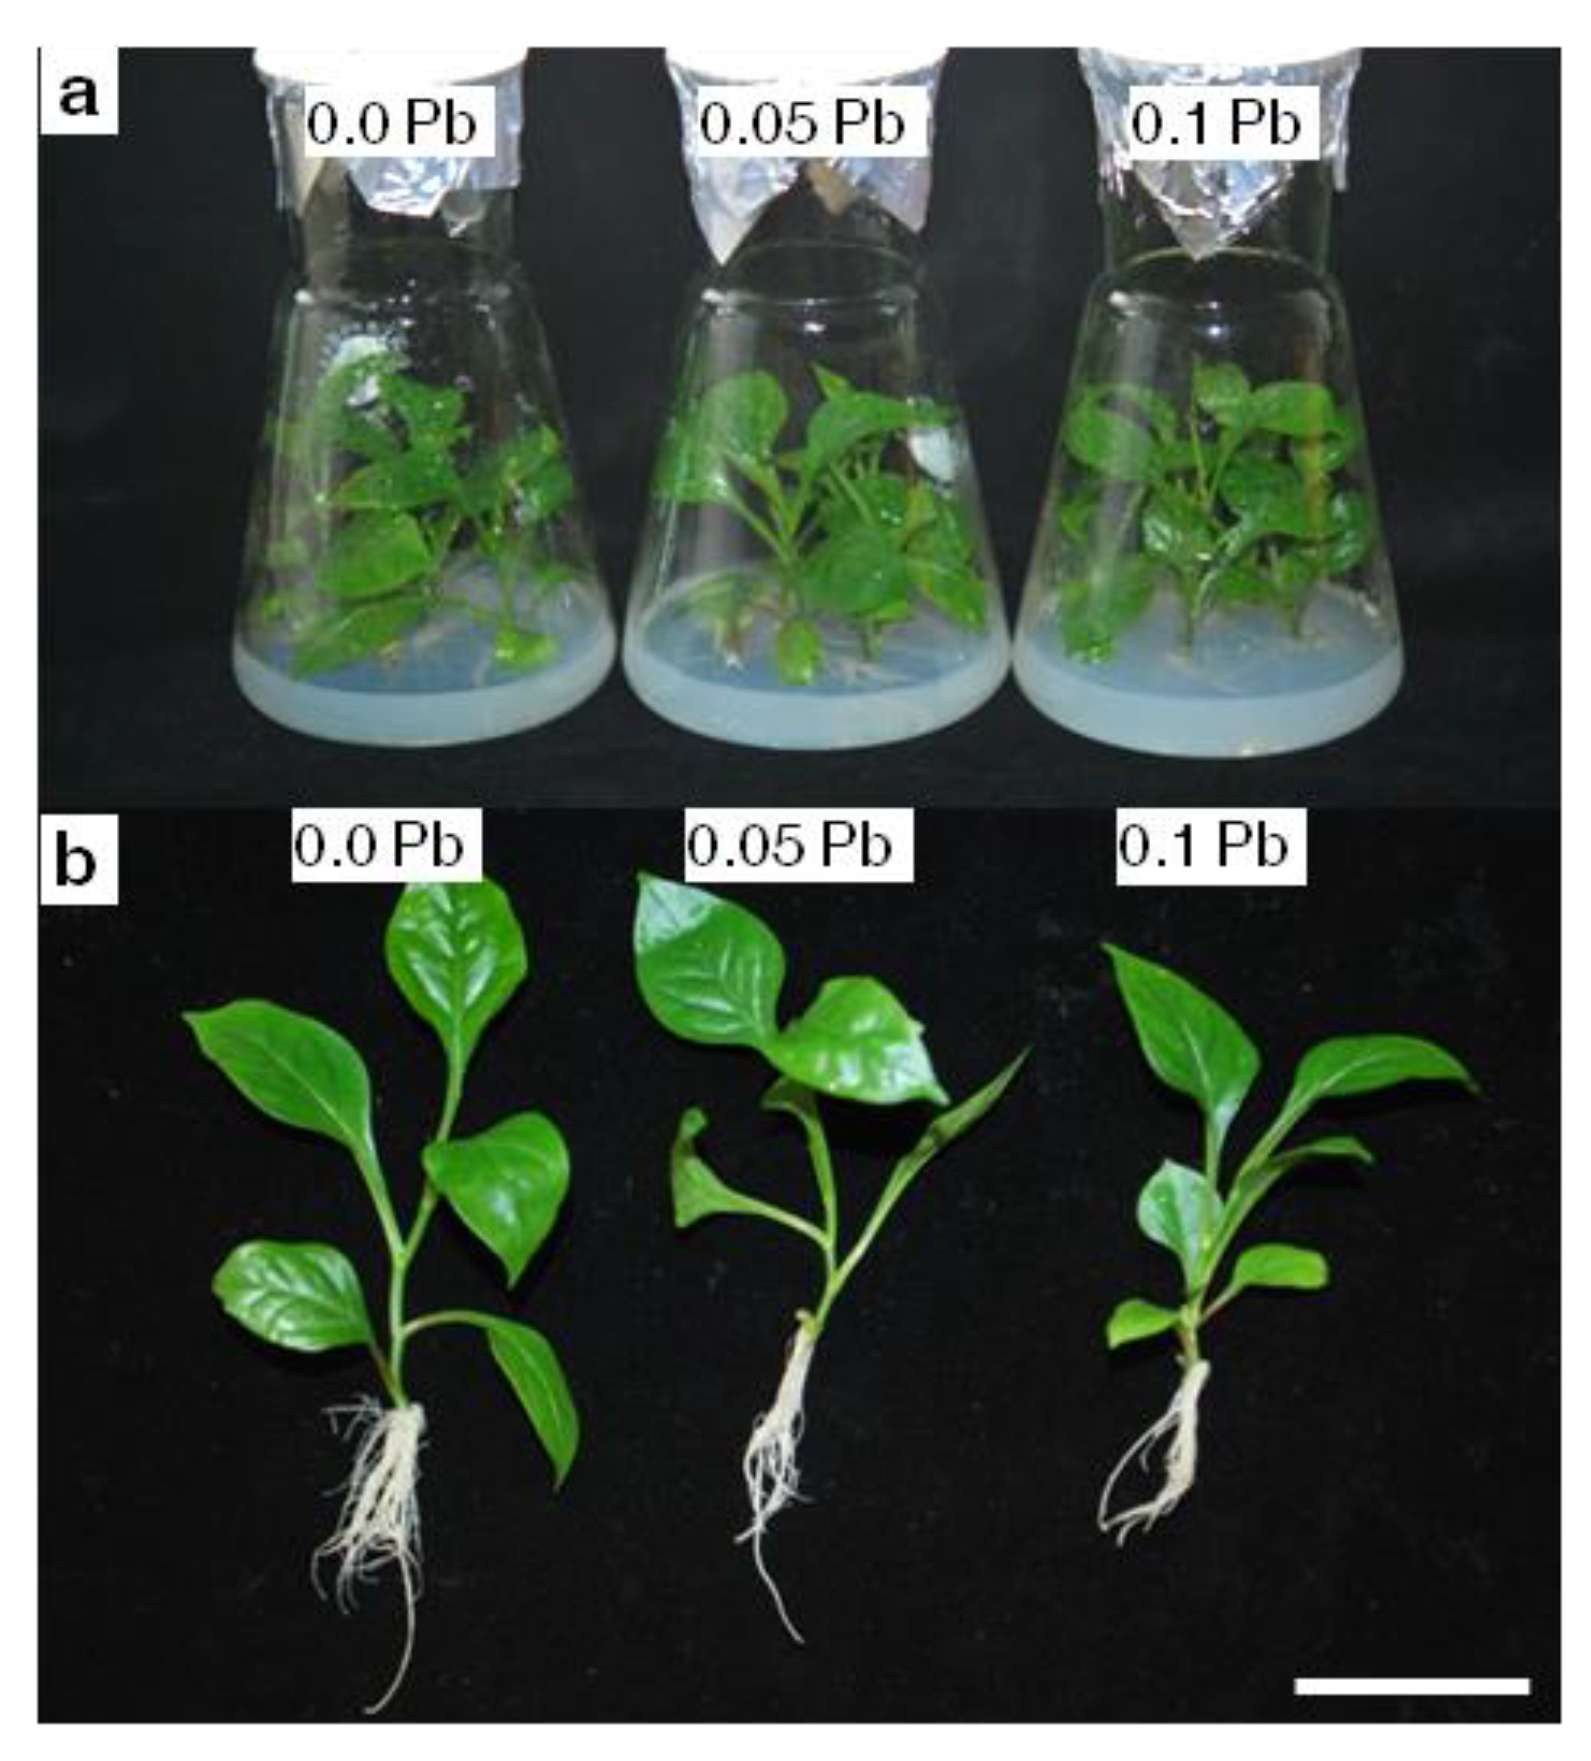
2.1. Growth and Development of P. zeylanica

First symptom of lead toxicity is reduction of plant size and biomass [8,13]. To evaluate effect of lead on P. zeylanica growth and development, estimation of the fresh shoot mass increase in relation to the final fresh shoot mass (shoot growth index), rooting efficiency, and dry weight of organs were measured. After 4 weeks of P. zeylanica culture no statistically significant differences were noted in shoot growth index on media containing different concentrations of Pb (Figure 1a,b, Table 1). While, in presented study it was observed that roots are more vulnerable to lead toxicity. Pb affected rooting efficiency, both rooting percentage and root length (Table 1). Nonetheless, rooting percentage was reduced only on the medium with 0.1 g Pb∙l−1 but average root length decreased in presence of both Pb concentrations applied. However, media supplemented in Pb did not influence root dry weight content, but shoot dry weight content increased in the medium containing the highest Pb concentration (Table 1). It seems that analyzed plants in terms of growth parameters are not very susceptible to Pb ions.

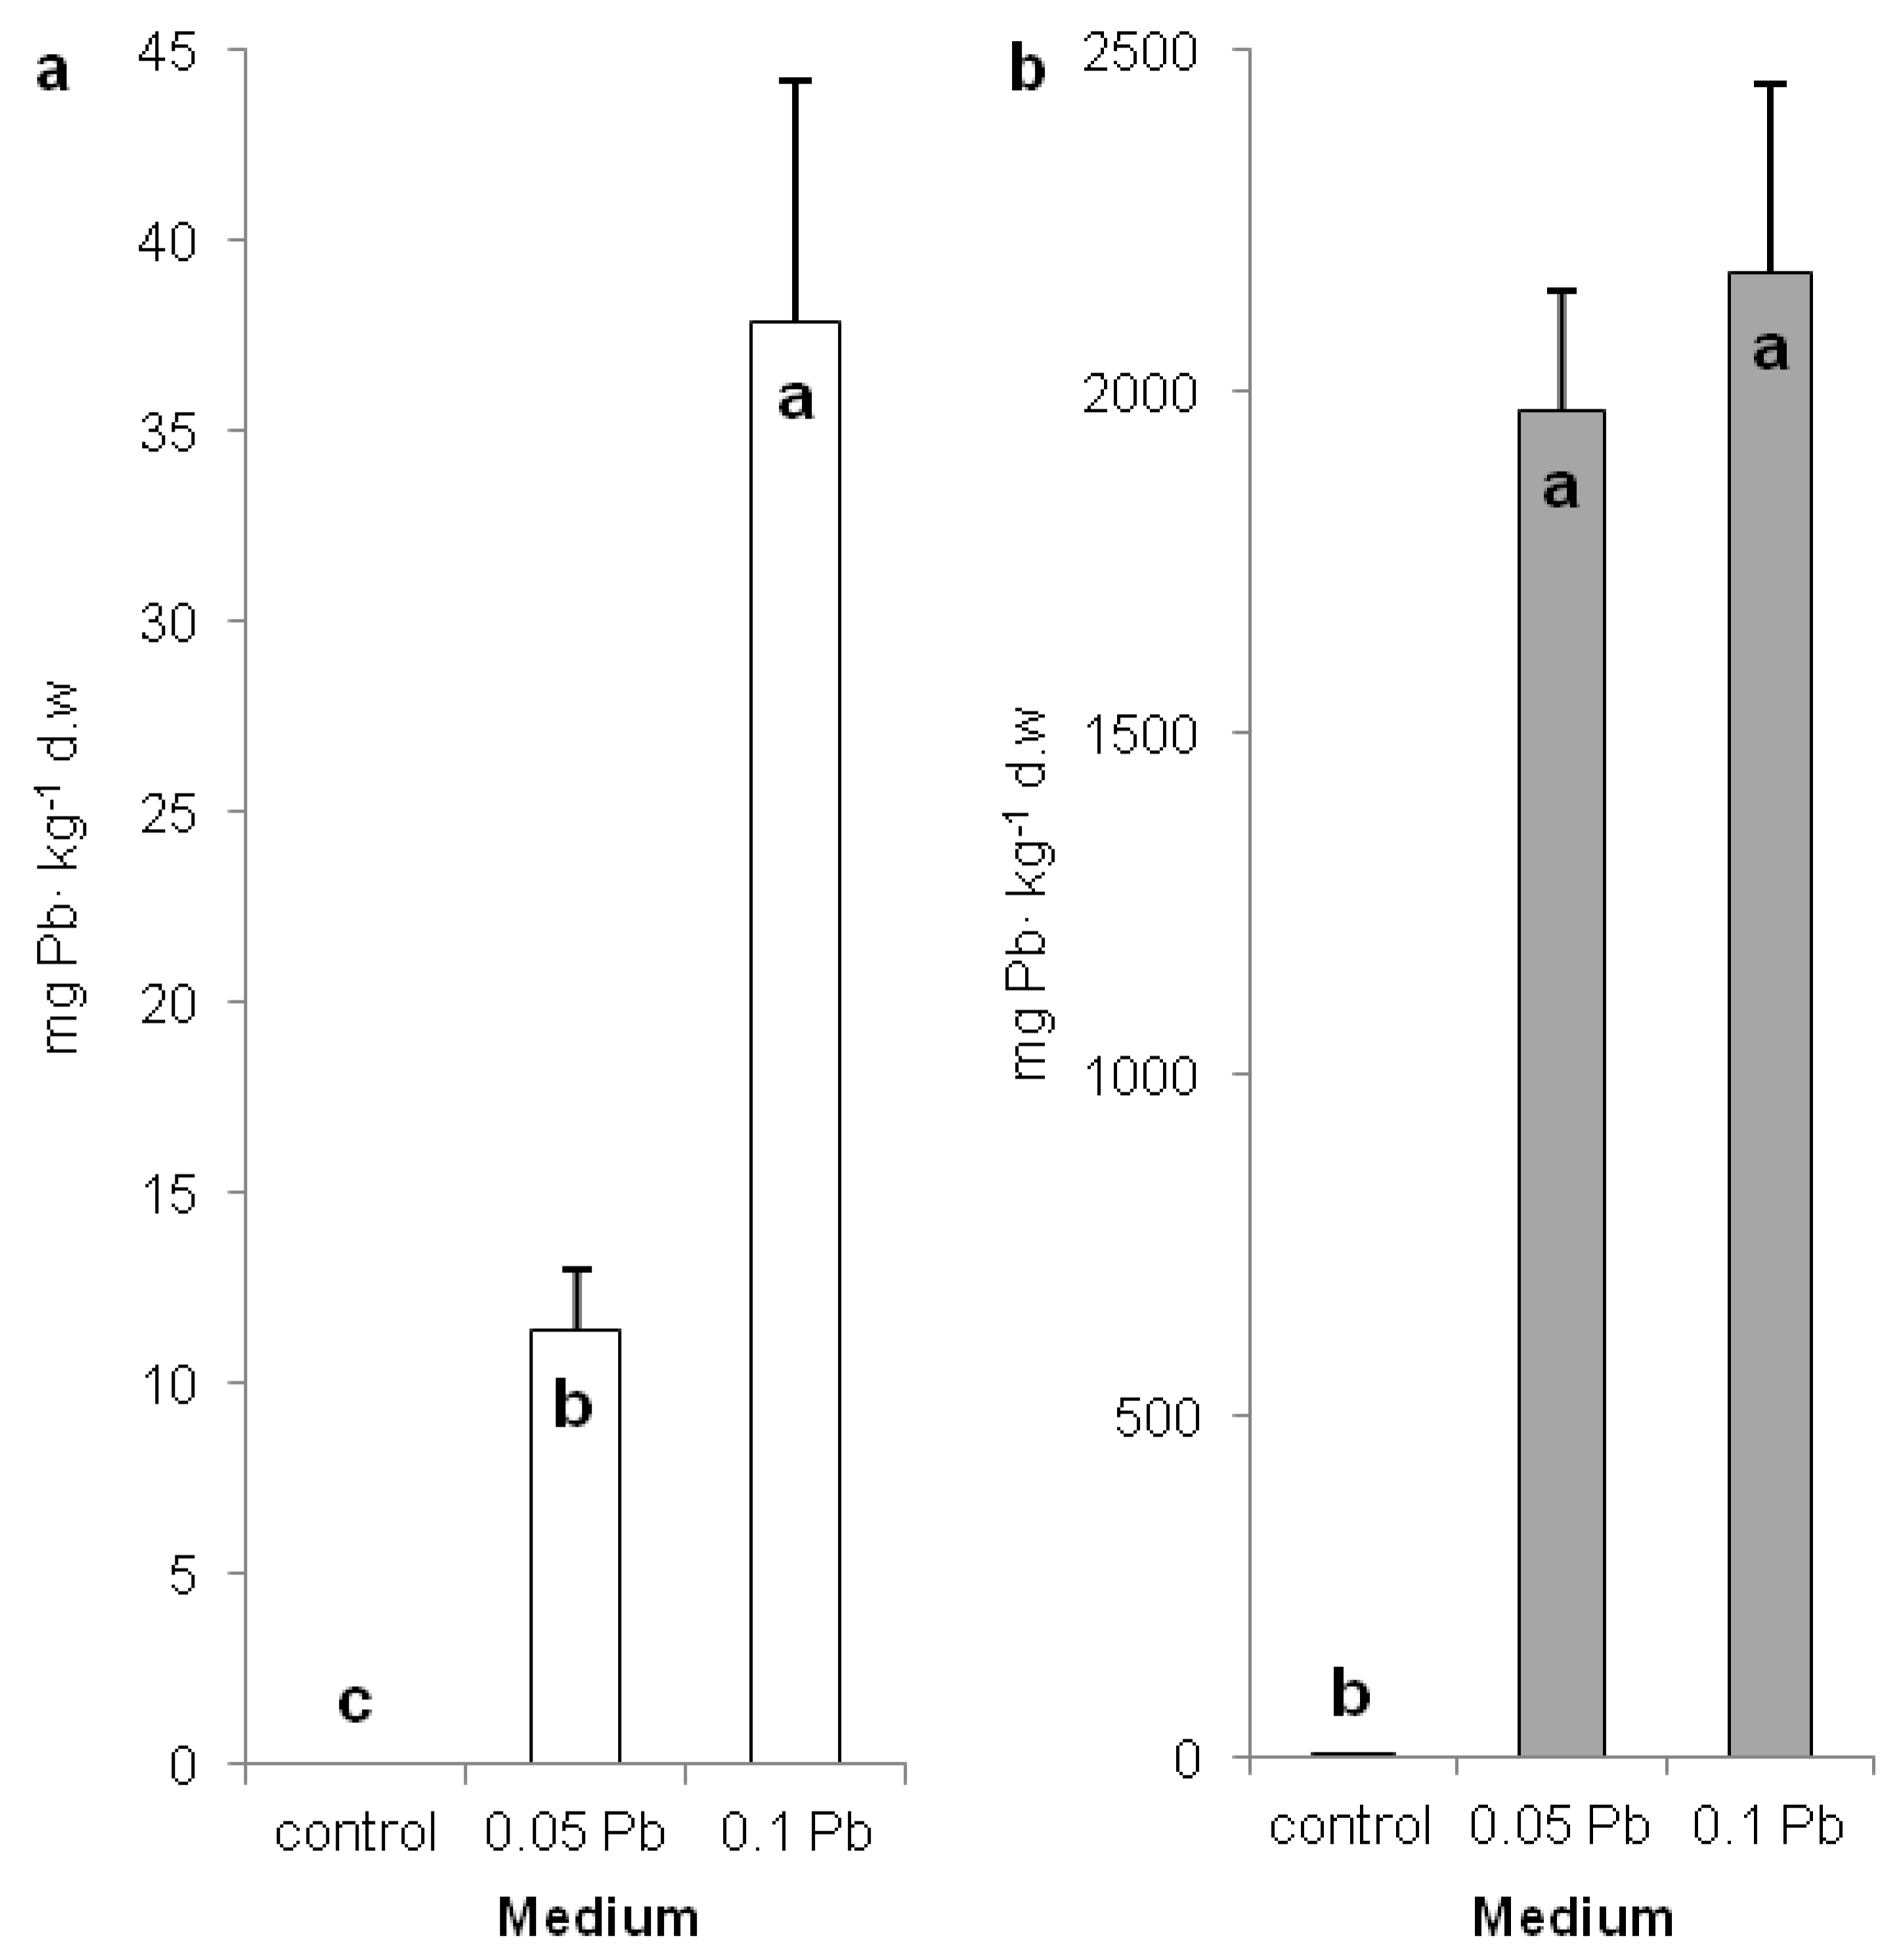
2.2. Lead Concentration in Shoots and Roots

Assessment of the content of lead in different plant organs indicate the lead accumulation mode. P. zeylanica accumulated significantly more lead in shoots of plants cultivated on medium with 0.1 g Pb∙l−1 (38 mg∙kg−1 DW) than on medium with 0.05 g Pb∙l−1 (11 mg∙kg−1 DW) (Figure 2a). Meanwhile, lead accumulation was hundreds of times higher (1970 and 2174 mg∙kg−1 DW) in the roots but no statistical differences were observed between applied Pb doses (Figure 2b). The obtained results suggest that P. zeylanica is not a hyperaccumulator plant [25].

2.3. The Level of Cell Membranes Damage

Malondialdehyde (MDA) is a biomarker for the estimation of lipid-membranes peroxidation in oxidative stress [26]. In P. zeylanica plants MDA accumulation significantly increased in shoots after 4 weeks of culture on medium supplemented with 0.1 g∙l−1 Pb (Table 2). In turn, MDA content did not change in roots regardless of the Pb concentration used (Table 2). This suggest that Pb ions accumulated in shoot cells, evoked significant oxidative stress, which, contrary to root cell response, were not excluded by shoot cell defense mechanisms.

2.4. Accumulation of Protecting Secondary Metabolites

Phenolic compounds content in plants changed under Pb stress (Table 2). In shoots of P. zeylanica content of phenolic compound significantly decreased with increased concentration of Pb in the medium. In turn, roots of examined plants accumulated significantly more phenolic compounds on media with lead. After 4 weeks of culture on media containing Pb, cinnamic acid derivatives accumulation did not change in leadwort shoots (Table 2). In contrast, cinnamic acid derivatives accumulation in roots decreased with an increased dose of Pb in the medium. Flavonols content decreased in shoots of P. zeylanica on medium with 0.1 g Pb∙l−1, while in roots on media with both applied Pb doses (Table 2). Anthocyanin accumulation generally decreased in plants (shoots and roots) growing on media containing Pb. The exception was shoots from medium with 0.05 g Pb∙l−1, in which anthocyanin accumulation increased (Table 2). Plumbagin accumulation decreased in roots of plants cultured on media with Pb, but did not change in shoots of these plants (Table 2).

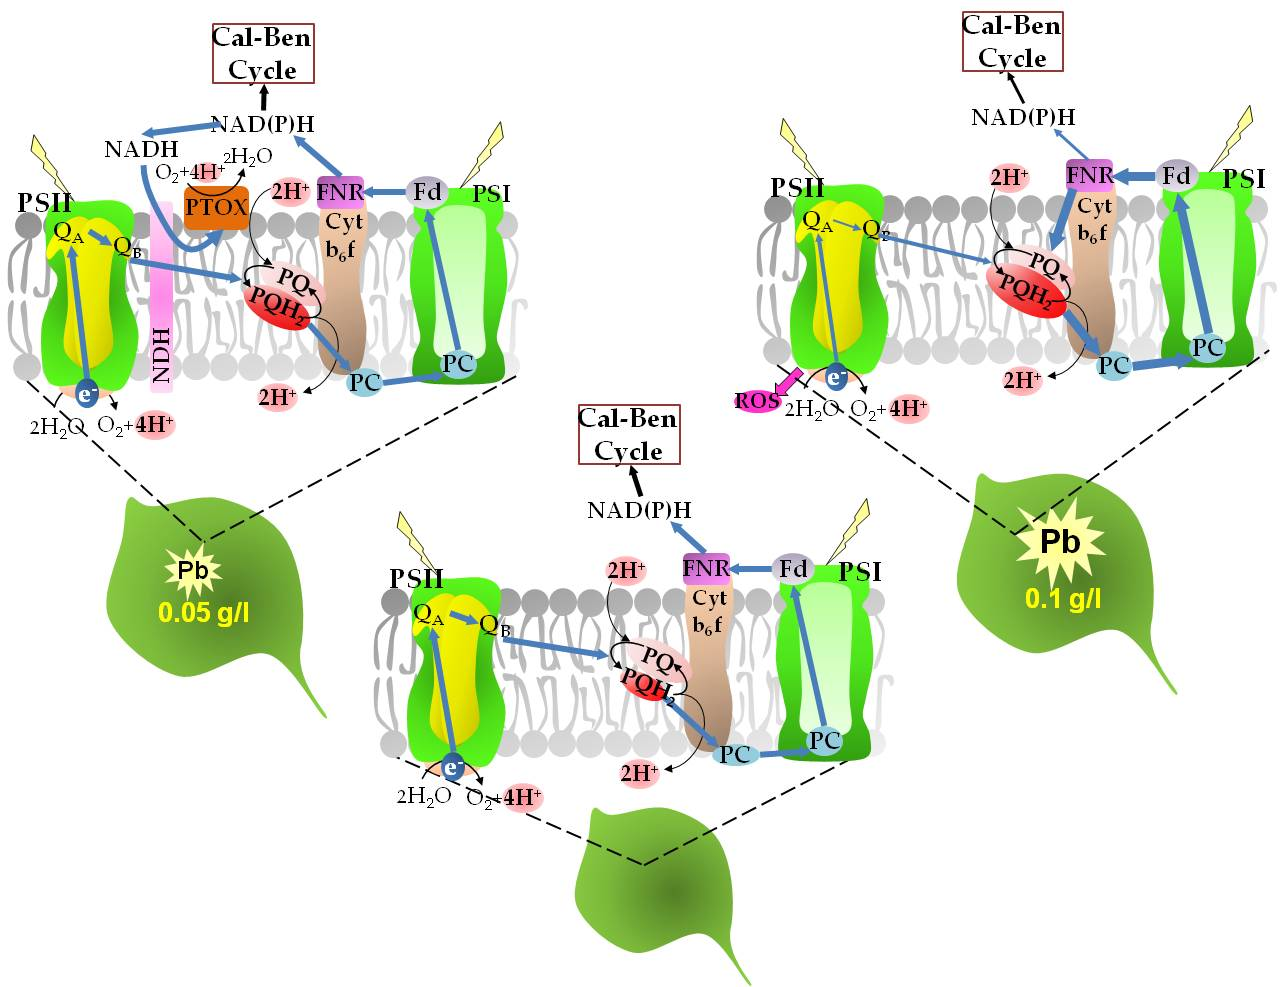
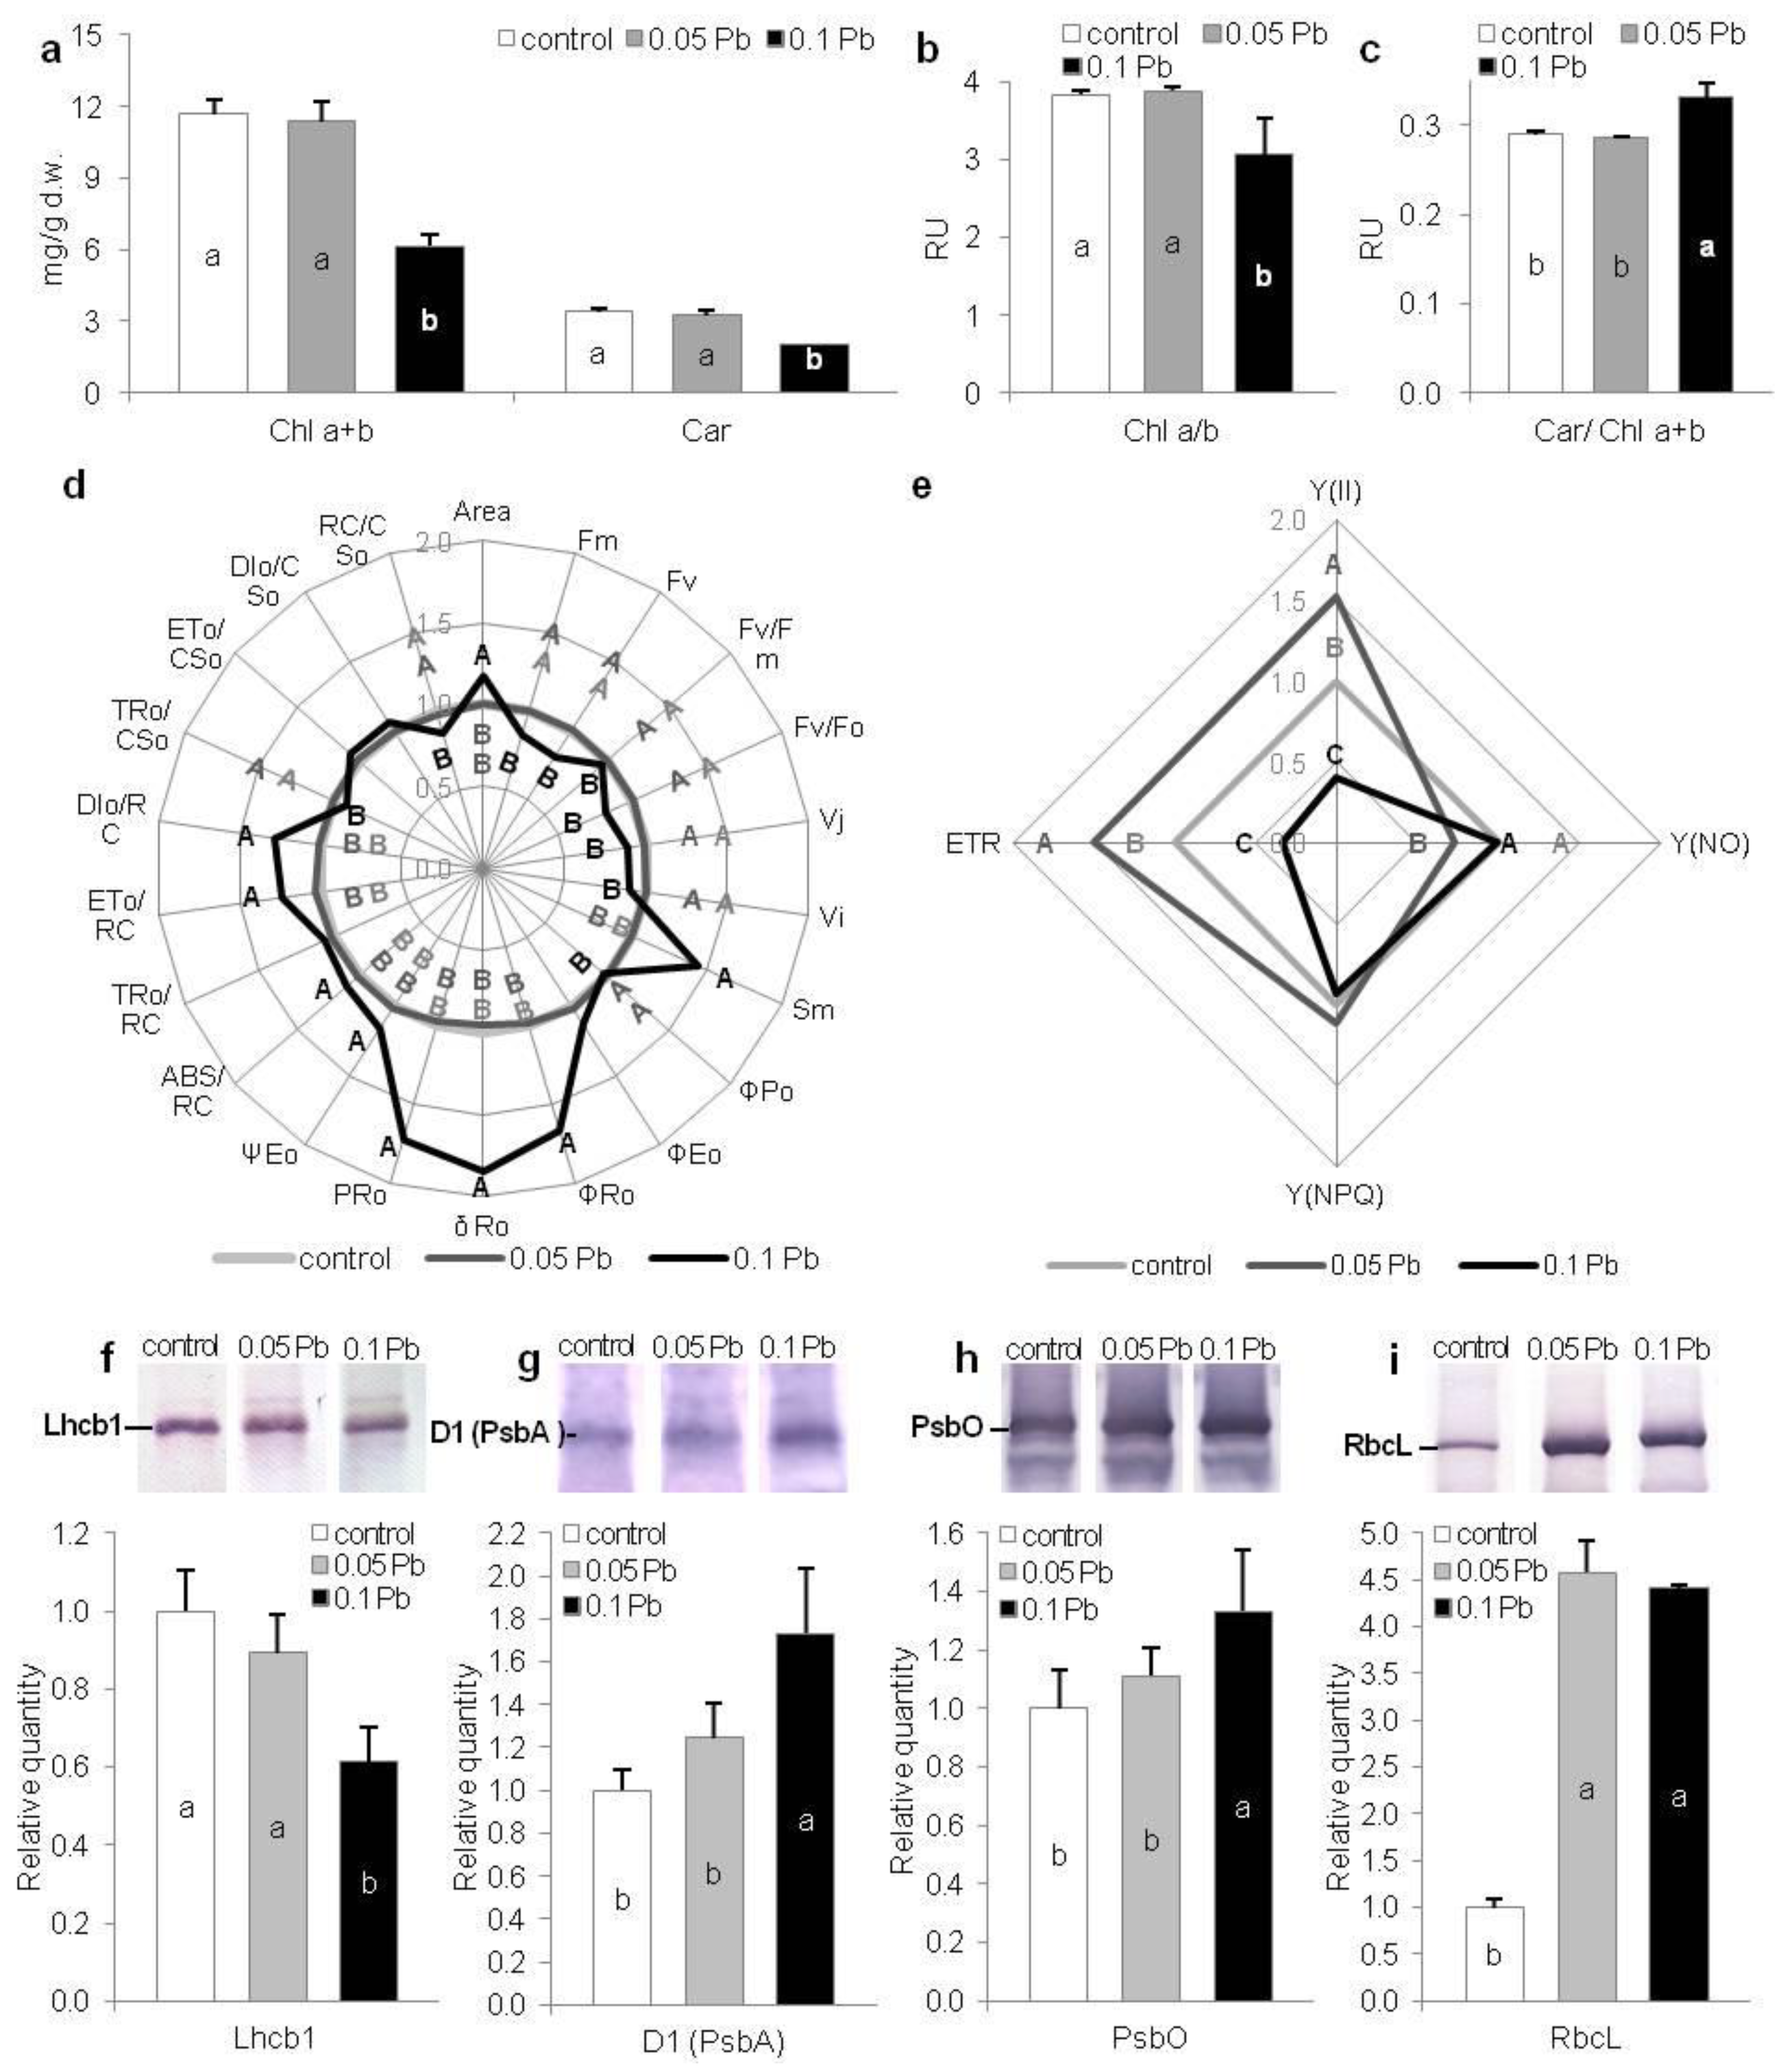
2.5. Effect of Lead on Photosynthetic Apparatus Efficiency

2.5.1. Photosynthetic Pigments’ Content

To estimate condition of photosynthetic apparatus in P. zeylanica plants growing under Pb stress, content of photosynthetic pigments have been assayed. After 4 weeks of plants cultivation, a statistically significant decrease of total chlorophyll and carotenoids content together with simultaneous decrease of Chl a/b ratio was recorded in plants cultured on media with higher Pb concentration (0.1 g·l−1) (Figure 3a,b). Contrary, in the same conditions, Car/Chl a+b ratio significantly increased comparing to control conditions (Figure 3c). Chlorophyll and carotenoids contents as well as pigments ratios of plants from 0.05 g Pb·l−1 was on the same level as in control plants (Figure 3a–c).

2.5.2. Chlorophyll a Fluorescence

Chl a fluorescence measurement enable assessment of PSII photochemistry efficiency and is widely used as an indicator of plant conditions under different abiotic stresses [27,28,29,30]. Generally, there were no differences between fast kinetics Chl a fluorescence parameters of plants cultivated on the media with 0.05 g Pb·l−1 and control plants (Figure 3d). In contrast, plants exposed to higher Pb concentration (0.1 g Pb·l−1) exhibited changed Chl a fluorescence parameters. Fluorescence parameters (maximum and variable fluorescence) declined in these plants (Figure 3d). Maximum quantum yield of PSII (FV/FM) and activity of water-splitting complex (Fv/F0) were also reduced in comparison to control plants. While reduced plastoquinone pool (Area) and total electron carriers per reaction center (RC) (Sm) increased. Also, parameters related to the electron flows (ψEo, ρRo, δRo) and quantum yield for the reduction of end acceptors of PSI per photon absorbed (φRo) increased in plants exposed to higher concentration of lead ions. Moreover, specific fluxes per RC (ABS/RC, ET0/RC, DI0/RC) increased but trapped energy flux per cross section (CS) (TR0/CS0) and amount of active PSII RCs per CS (RC/CS0) decreased (Figure 3d). Contrary, slow kinetics fluorescence parameters showed significant changes between control plants and plants from lower Pb concentration in the medium (0.05 g·l−1) (Figure 3e). Quantum photosynthetic yield of PSII—Y(II) increased in 0.05 g Pb·l−1 plants but decreased in 0.1 g Pb∙l−1 plants. While, all other non-photo-protective non-photochemical quenching—Y(NO) decreased in 0.05 g Pb·l−1 plants and did not change in 0.1 g Pb·l−1 plants (Figure 3e). In turn, photoprotective non-photochemical quenching—Y(NPQ) did not vary between examined plants from different conditions (Figure 3e). Moreover, electron transport rate (ETR) grew in 0.05 g Pb·l−1 plants and decreased in 0.1 g Pb∙l−1 plants (Figure 3e).

2.5.3. Key Photosynthetic Proteins

Quantitative participation of photosystem proteins (Lhcb1, D1 (PsbA), PsbO) and RuBiSco was estimated by SDS-PAGE and immunobloting in shoots of P. zeylanica plants. The level of Lhcb1 decreased in plants treated with 0.1 g Pb·l−1 (Figure 3f), while in the same conditions, the quantity of D1 and PsbO proteins significantly increased compared to control plants (Figure 3g–i). Higher accumulation of RbcL was also noted in P. zeylanica shoots from media containing Pb (both concentrations) in comparison to control (Figure 3i).

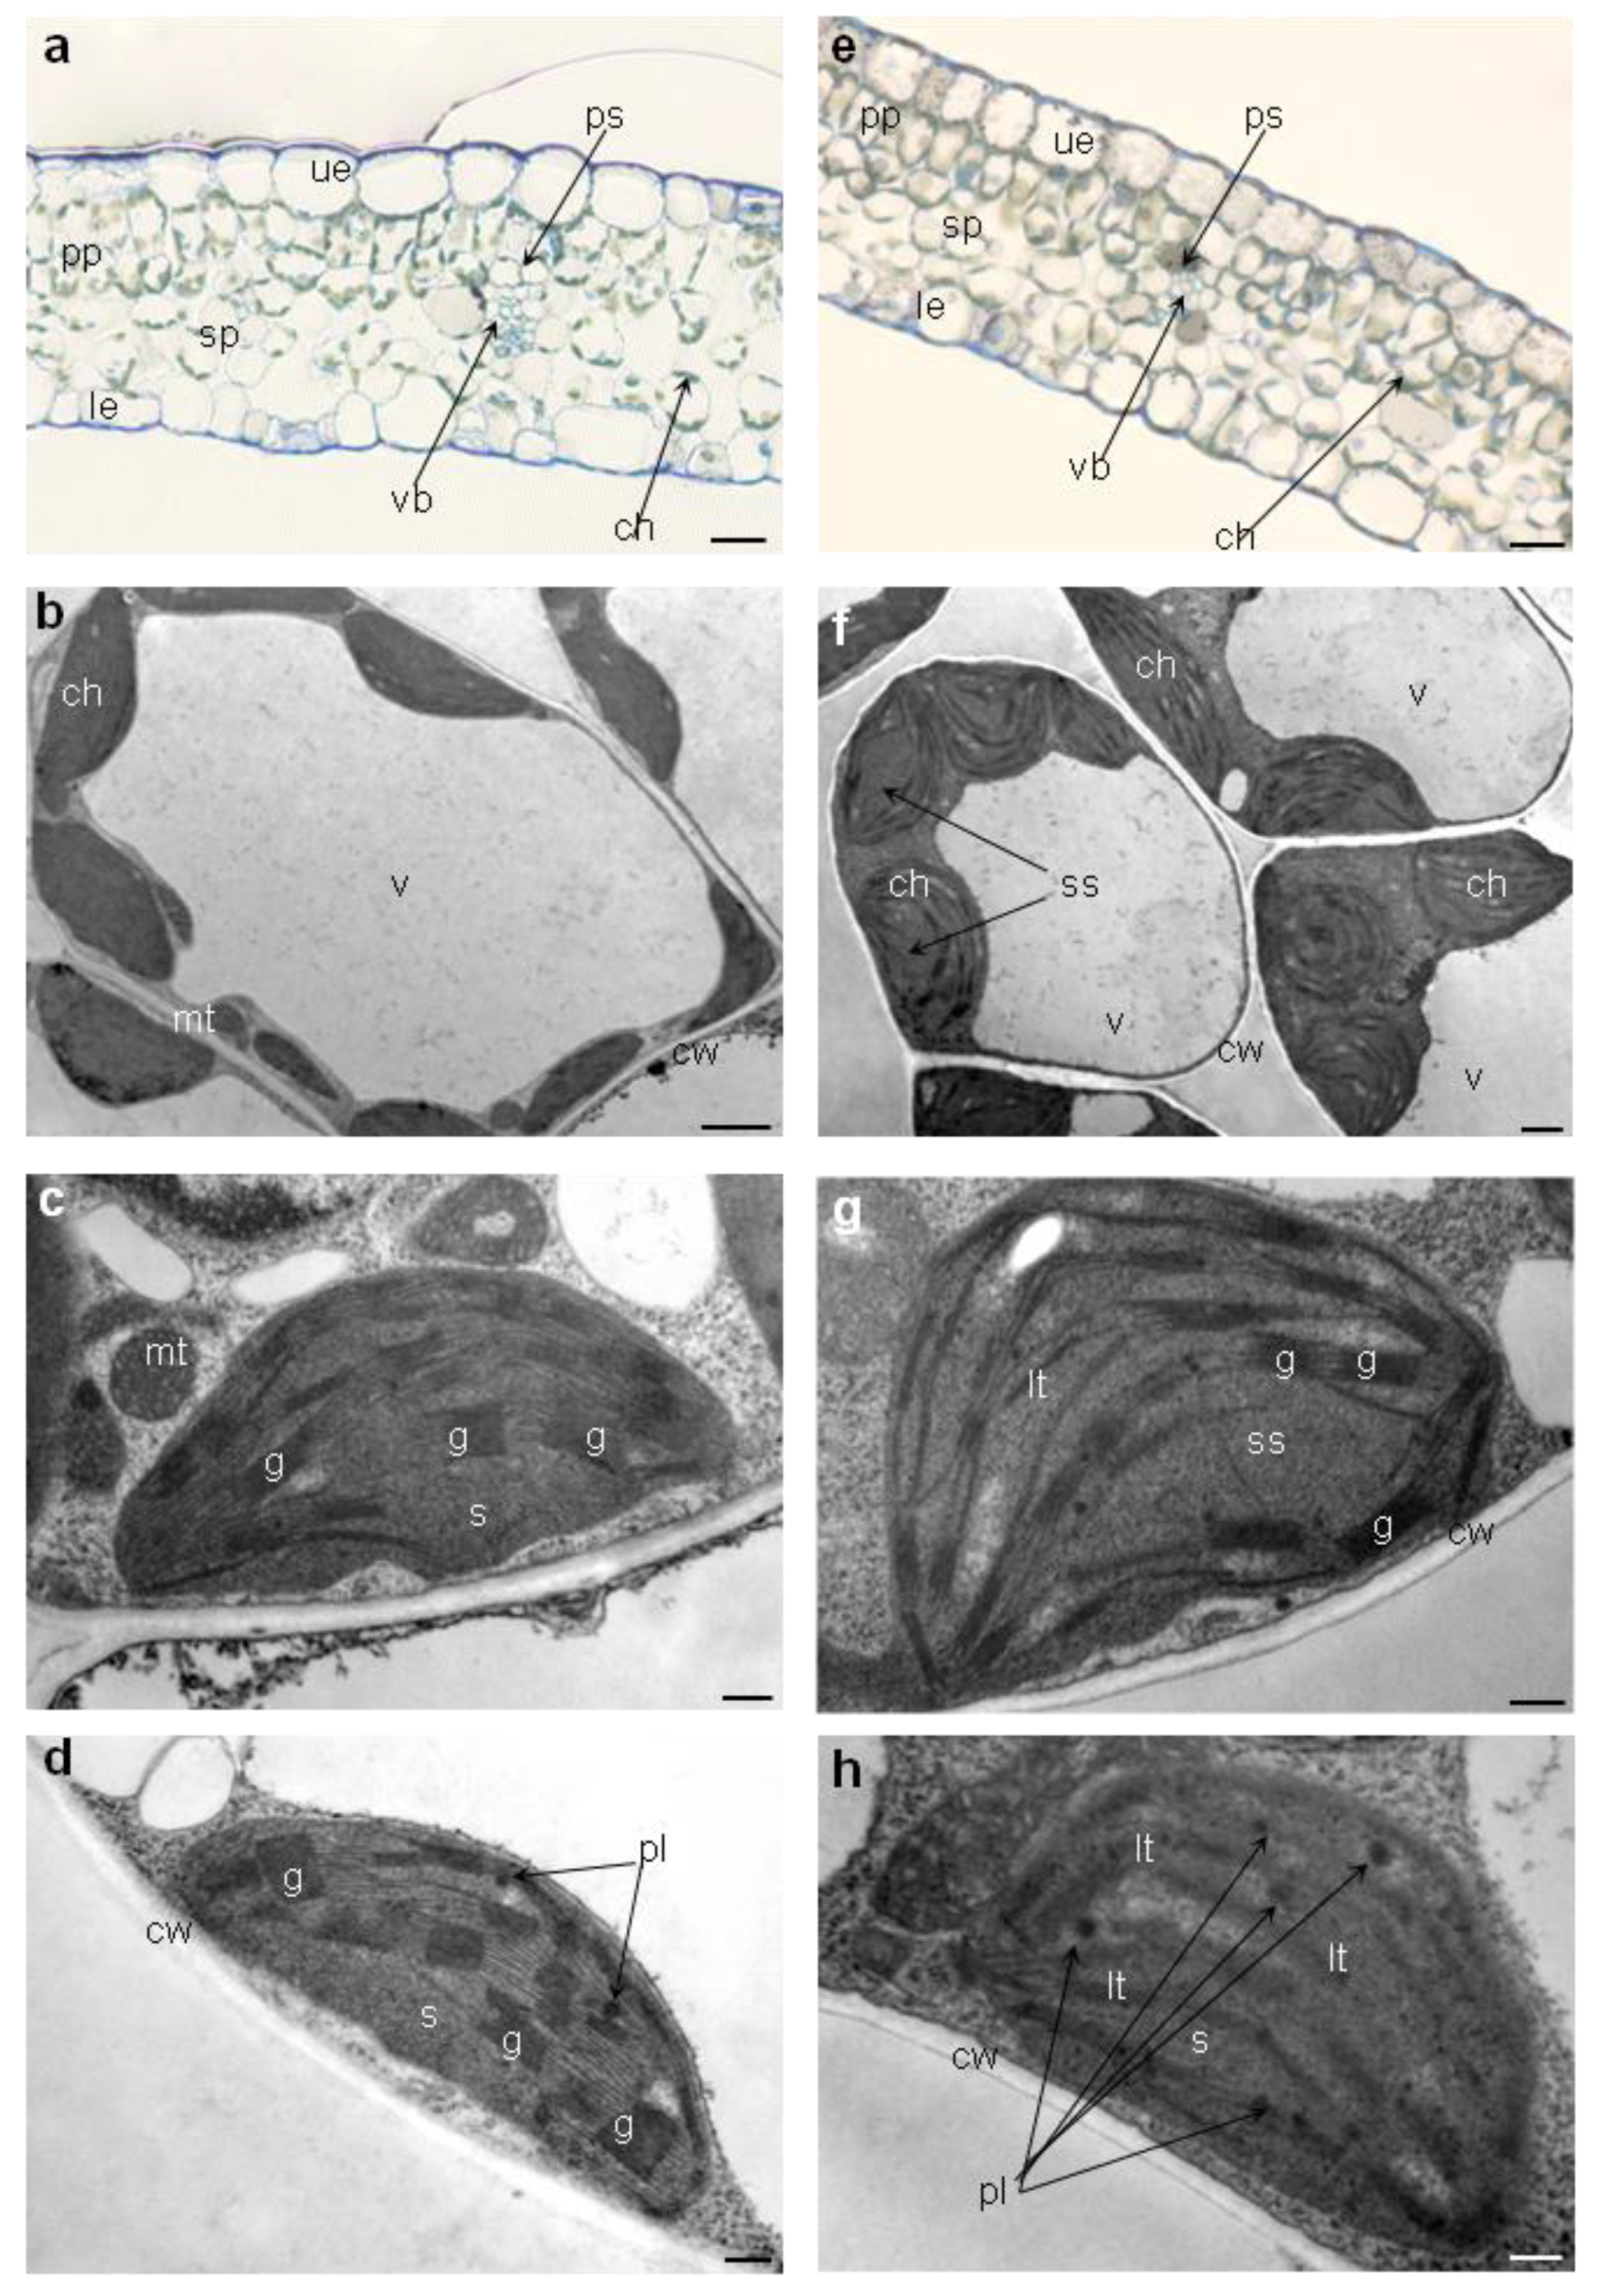
2.5.4. Leaves’ Anatomy and Chloroplasts’ Ultrastructure

Generally, leaf anatomy of plants exposed to Pb toxicity did not vary from leaves of control plants (Figure 4a,b). They had normally formed upper and lower epidermis, palisade and spongy parenchyma and vascular bundle surrounded by parenchyma sheath (Figure 4a-b). Only difference could be observed in the smaller number of chloroplasts in spongy parenchyma cells of leaves from media with 0.1 g Pb·l−1 (Figure 4e). More pronounced differences were noted in the chloroplast ultrastructure (Figure 4c–h). Chloroplast of plants exposed to higher concentration of Pb (0.1 g·l−1) had swollen stroma, dilatated or poorly formed grana thylakoids, and more plastoglobules (Figure 4f–h) in comparison to chloroplasts of control plants and plants exposed to lower Pb concentration (0.05 g·l−1) (Figure 4b–d). We did not observe differences in ultrastructure between chloroplasts from control and 0.05 g Pb·l−1 plants (Figure 4c,d).

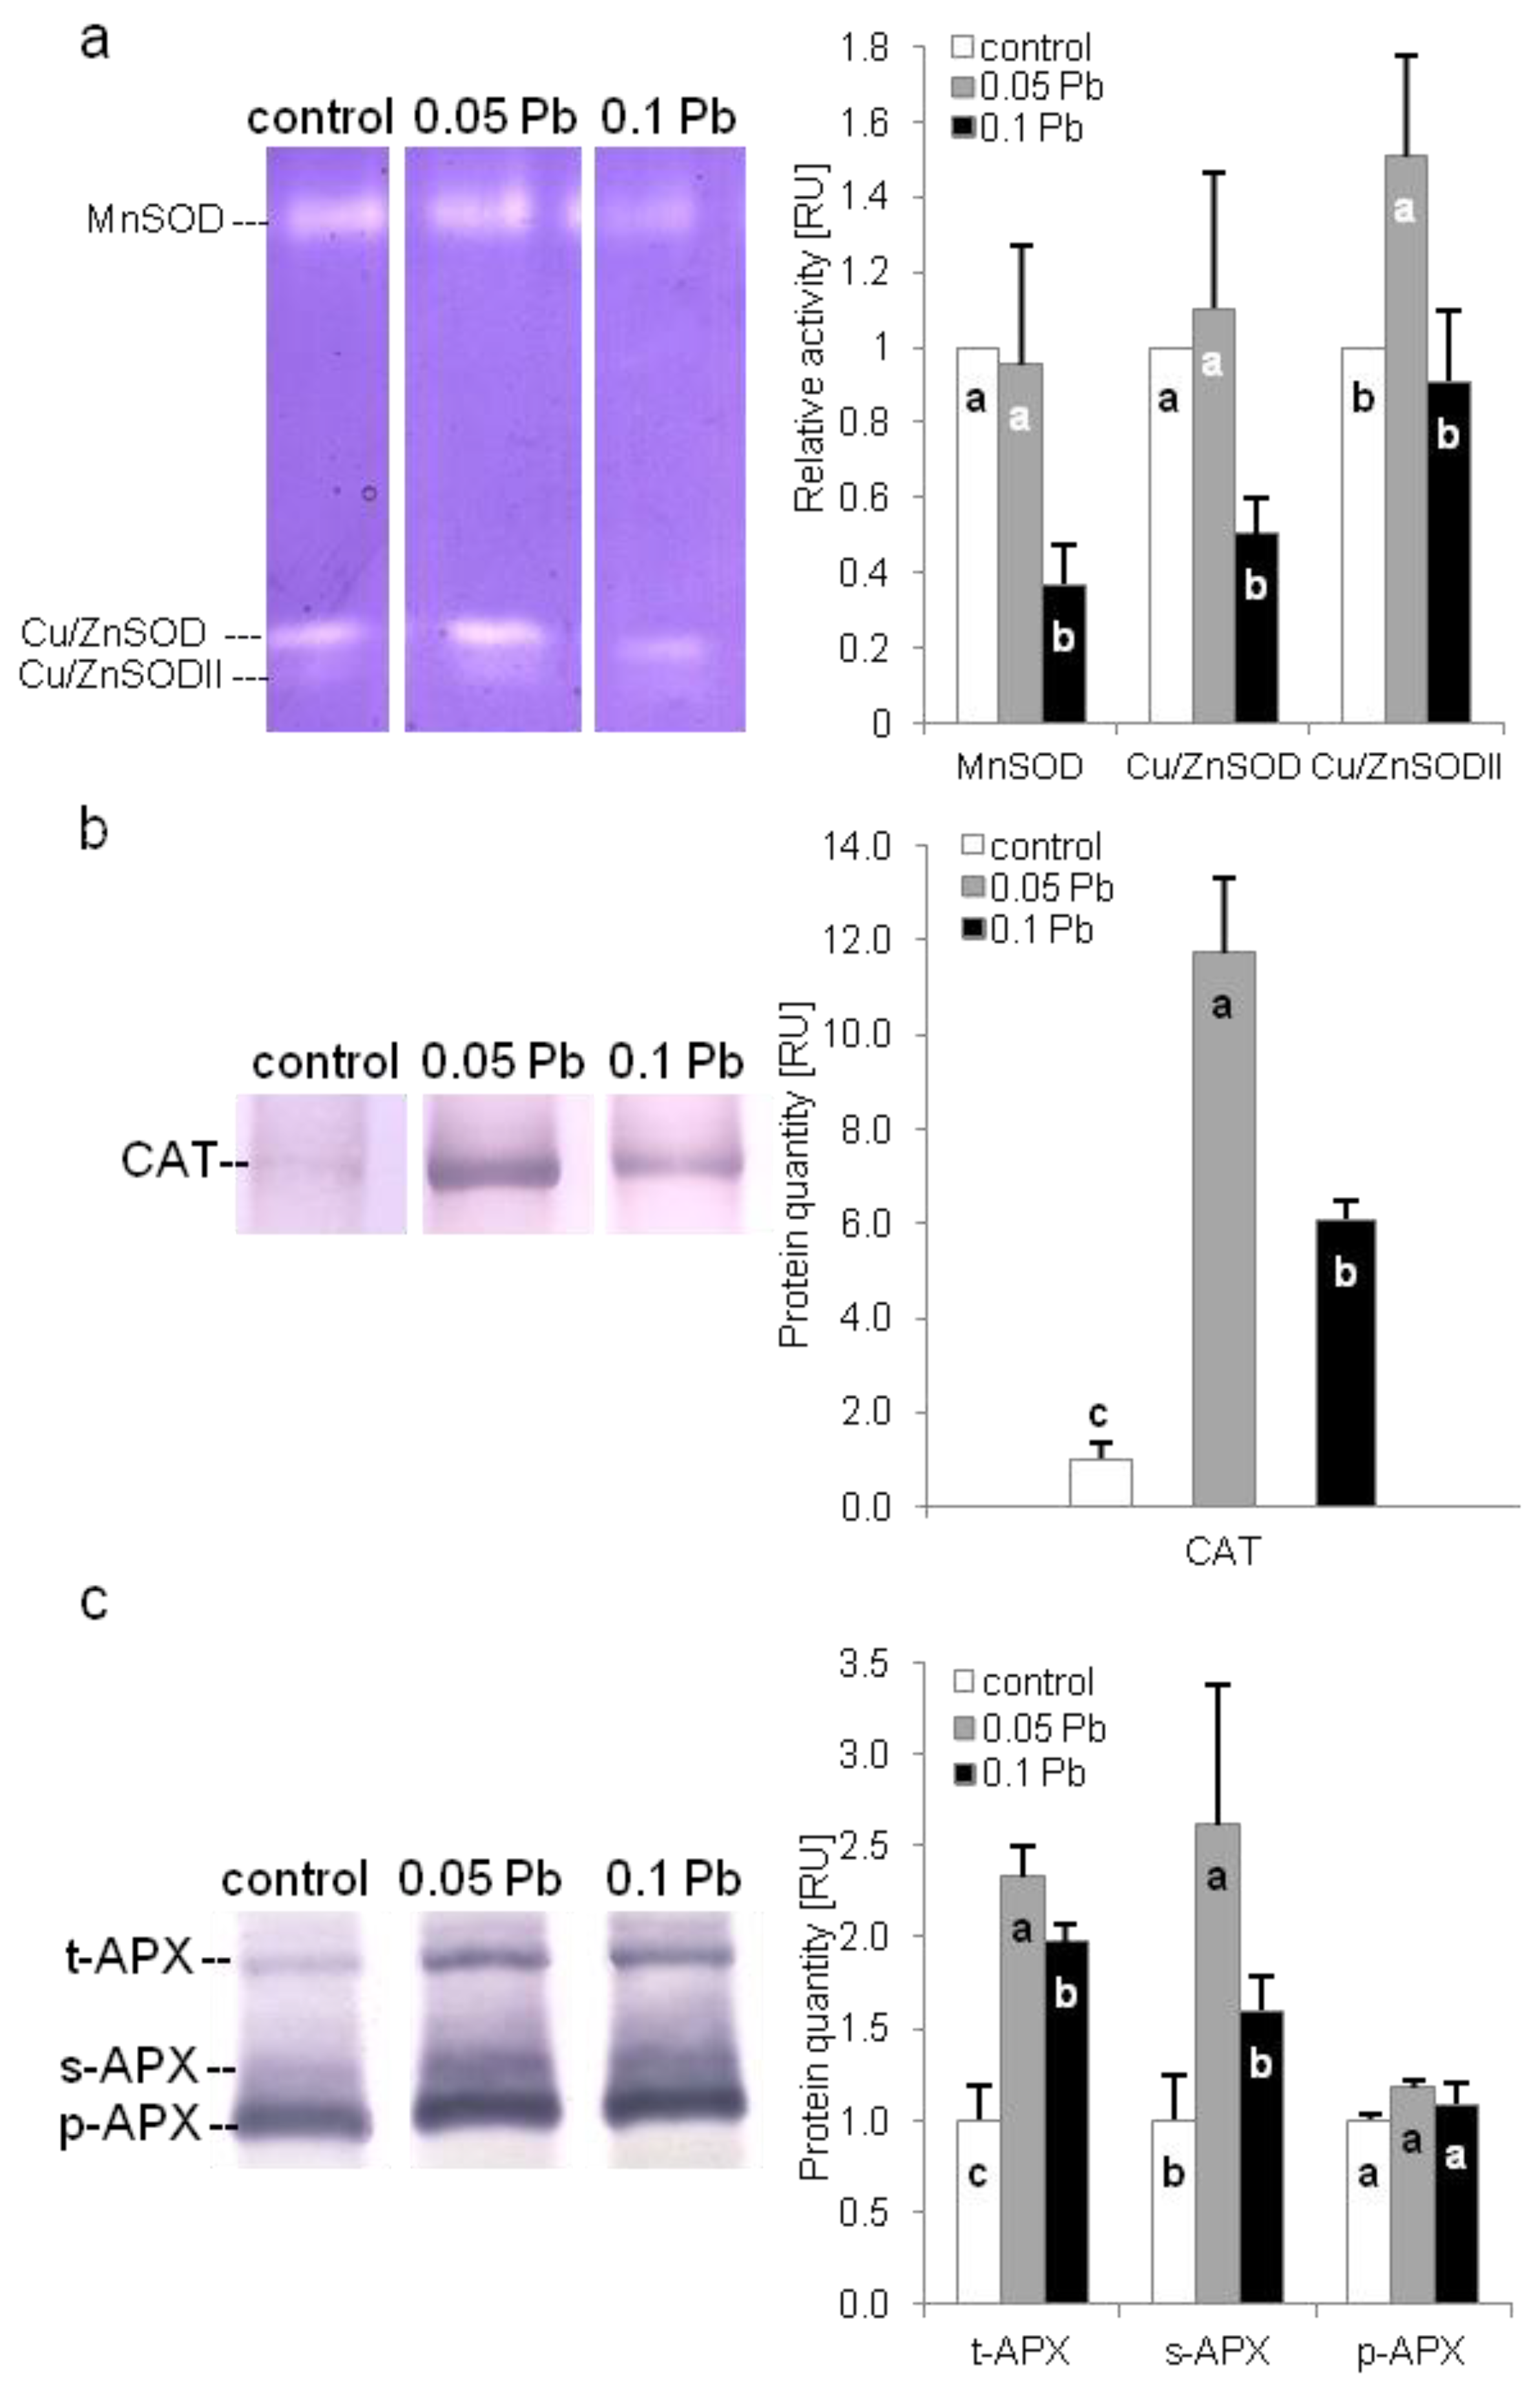
2.5.5. Antioxidant Enzymes Protection

The activity of three superoxide dismutase (SOD) isoforms, namely MnSOD, Cu/ZnSOD, and Cu/ZnSODII, were evaluated in shoots of P. zeylanica plants using native polyacrylamide gel electroforesis (PAGE). Higher concentration of Pb significantly reduced activity of MnSOD and Cu/ZnSOD isoforms. While Cu/ZnSODII activity increased in Plumbago plants exposed to 0.05 g Pb∙l−1 (Figure 5a). Catalase (CAT) and ascorbate peroxidase (APX) isoforms content were determined by SDS-PAGE electrophoresis and immunoblotting. Catalase accumulation increased in P. zeylanica shoots under Pb stress (Figure 5b). Higher accumulation was observed on medium with 0.05 g Pb∙l−1. Level of three APX isoforms: thylakoid (t-apx), stromal (s-apx) and peroxisomal (p-apx) were estimated in P. zeylanica shoots (Figure 5c). Thylakoid isoform of APX increased in plants cultivated on media with Pb. However, higher t-apx accumulation were recorded on media with lower Pb concentration. In turn, stromal isoform increased only in plants cultivated on medium with 0.05 g Pb∙l−1. Meanwhile, peroxisomal isoform accumulation did not change under Pb stress.

3. Discussion

Lead ions enter plants mainly through roots. The first and constitutive protecting mechanism of plants against lead toxicity is absorbing Pb ions on the root surface, thus limiting their penetration inside the plant [31]. After entering the root, lead ions can move apoplastically [32]. However, due to their high affinity for carboxylic groups, they are bound to cell wall components and retained there [33]. Nevertheless, this barrier is insufficient with higher concentrations of lead and prolonged stress [34]. When lead ions get inside the cells, the plant starts the next stage of defense relying on binding Pb ions with organic ligands (organic acids, amino acids and thiols) and/or sequestration in vacuoles [32]. This immobilization of lead in the roots allows the plant to protect aerial parts, especially organs and cells where the key process for plant life, i.e., photosynthesis, takes place [35]. Moreover, few plants belong to the group of hyperaccumulators that are capable of transporting large amounts of lead to shoots. However, in most plants, transport of small Pb amounts to shoots is observed [36]. In presented studies, the way of lead accumulation in Ceylon leadwort, depending on lead concentration in medium, was examined for the first time. The results indicate that, as in most plants, lead in large quantities is immobilized in the root system. However, increasing lead concentration in the medium twice (from 0.05 to 0.1 g∙l−1) caused over three times more Pb ions to be transported to aerial parts. The high toxicity of lead is related to the fact that even a small amount of ions getting into the symplast has an adverse effect on plants, interacting with cellular components and disrupting physiological processes [13,36,37].
The easiest to observe, nonspecific symptoms of lead toxicity are plant growth and development disorders. In many plants exposed to Pb ions, the first visible stage of these disorders is rapid reduction of root growth [8,20]. Pb ions, binding to the components of the cell wall, lead to its mineralization and loss of plasticity. In addition, Pb disrupts the microtubule network in the cell. All this leads to disorders in cell division, cell elongation and morphogenesis processes [32]. Similarly, in the case of the species studied, morphogenetic processes (root formation) were clearly disturbed on the medium with a higher concentration of lead. In turn, cell division and the process of cell elongation, and thus root growth, were more susceptible to lead ions as they were also interfered by the lower Pb concentration. Limitation of plant growth as a result of lead toxicity (disturbance of water and mineral management) is also manifested in the decrease of both fresh and dry weight of shoots and roots [8,13]. In P. zeylanica plants, we observed not only no decrease in dry weight of the organs, but also an increase in shoot dry weight. This may indicate some tolerance of this species to lead despite limitations in root growth.
No change in the content of malondialdehyde (MDA) in root tissues may point to some level of P. zeylanica tolerance to lead. Malondialdehyde, as a product of the decomposition of the lipid hydroperoxide unstable molecules, is evidence of the lipid peroxidation process [38]. Lipid peroxidation is a result of activity of reactive oxygen species (ROS), generated by the action of lead ions. Lipid peroxidation leads to changes in the structure of cell membranes increasing their permeability and damaging the membrane proteins [11,38]. Lack of increase in MDA content in Plumbago shoot tissues under lower lead ions concentration may indicate a well-functioning antioxidant system scavenging ROS. However, the antioxidant system in shoot cells was not sufficient to cope with higher lead concentration in the medium which was reflected in the increase of MDA. This corresponds with results obtained for activity of antioxidant enzymes and contents of phenols which were higher in shoots from 0.05 g Pb·l−1 than in shoots from 0.1 g Pb·l−1 treatment.
Pb toxicity in P. zeylanica shoots were manifested in the decreased content of photosynthetic pigments, both total chlorophylls and carotenoids. A reduction of the pigments content in the presence of lead ions is related to both their degradation and synthesis inhibition [8,13]. Chlorophyll degradation is due to lead-induced chlorophyllase activity [14]. However, inhibition of pigment synthesis has a greater importance. Lead can inhibit chlorophyll synthesis directly by disturbed synthesis of its precursor—porphobilinogen by lowered ALAD activity resulting from inactivation of enzyme active side (lead affinity to—SH groups) [14] and indirectly, as a result of impaired mineral metabolism (lack of necessary ions, especially Mg2+) [39]. Pb inactivates also enzymes associated with carotenoid synthesis pathway (MEP-methyl eritrythol phosphate pathway) [40]. It is believed that more sensitive to lead ions is chlorophyll b [41]. Our research does not confirm this, because the ratio of Chl a/b decreased significantly under the influence of a higher concentration of lead in the medium.
A decrease in the content of carotenoids and chlorophylls, especially Chl a, is one of the factors leading to changes in the chloroplast ultrastructure of plant growing in conditions of high lead concentration [37]. The reason for this is that the formation and stabilization of chloroplast grana depend on the LHCII complex, half of which are chlorophyll molecules [42]. Further, a reduction of protein Lhcb1 complex content may indicate changes in chloroplast structure. The level of changes in the chloroplast ultrastructure is linked with Pb concentration [37]. Low Pb doses make no or small ultrastructure disturbances [20,43,44] but high ones lead to serious chloroplast remodeling like swelling or shrinkage of whole organelle and loss and relaxation of thylakoid grana [45,46,47,48]. Changes in chloroplast structure result from the affinity of lead for amino and thiol groups of thylakoid membrane structural proteins [49]. Similarly as in other research, P. zeylanica chloroplasts from leaves of plants treated with lower lead concentration (0.05 g Pb∙l−1) had no changed ultrastructure, but treated with higher one showed some swelling and relaxation of thylakoid grana, which was in accordance with the observed decrease in the content of chlorophylls and protein Lhcb1 complex. On the other hand we observed increase of RuBisCo content which as a large and spatial stromal protein partisipates in maintenance of forming grana [50,51]. This may indicate some acclimatization mechanisms activated by Plumbago plants. The evidence of acclimatization process in P. zeylanica shoots are also plastoglobules observed mainly in chloroplasts from 0.1 g Pb∙l−1 medium but also sporadically in chloroplasts from 0.05 g Pb∙l−1 (Figure 4d,h). Plastoglobules are believed to be reservoirs and synthesis sites of neutral lipids which are used to rebuild membrane lipids during stress [42], and thus can stabilize the photosynthetic apparatus [20]. Otherwise, changes in the arrangements of granal and stromal thylakoids of chloroplasts affect directly both linear and cyclical electron transport between photosystems [34,48].
Lead causes detrimental effects on light-dependent and light-independent reactions of photosynthesis [37]. In Photosystem II (PSII), the first place of light reactions, it influences donor side (water splitting complex), light harvesting complex (LHC), reaction center (RC) and acceptor side (plastoquinone) [39,52]. In Plumbago shoots we observed that high lead concentration negatively affected water splitting (oxygen evolving—OEC) complex. The main role in this complex is played by the PsbO protein, one of the extrinsic subunits of PSII, also called the water splitting enzyme of photosynthesis, which stabilizes Mn cluster (Mn4CaO5) and optimizes the levels of cofactors (Ca2+ and Cl-) necessary for the water splitting process [53]. OEC can be damaged by substitution of Mn2+ and/or Ca2+ ions with Pb2+ ions and by conformational changes arising from Pb association with protein thiol groups [54]. In Plumbago shoots from medium with 0.1 g Pb∙l−1, lead ions caused significant decrease of water splitting complex activity (FV/F0) despite an increased PsbO protein quantity. This led to a limitation in electron flow on the donor side of PS II RC.
The amount of energy transferred to the RC PSII depends on the size and efficiency of the main LHC II external antennas, which include Chl a and mostly Chl b [20,37,51]. By inhibiting the synthesis of chlorophylls and activation of chlorophyllase, Pb causes a size decrease of the LHC II. Moreover, Pb ions may cause monomerization of PSII light harvesting complex proteins and inhibit synthesis of the light harvesting core proteins [55,56]. In Plumbago shoots from high lead concentration, the reduced amount of Lhcb1 protein, one of three proteins building LHCII, in conjunction with chlorophyll b content decrease (data not shown) indicates disturbances in the amount of energy transferred to the RC of PSII.
In the PSII reaction center, Pb interferes mainly with Chl a molecules, impairing their function by the substitution of Mg2+ ions in porphyrin rings [57], leading to their constant excitation, and thus permanent inactivation of RC [58]. As we mentioned earlier, content of chlorophylls decreased only in Plumbago shoots treated with the high lead concentration. Besides Chl molecules, Pb attacks structural proteins of RC, like D1 (PsbA) and D2 protein, by association with their—SH groups and thus changing their spatial structure, obstructing transport of electrons outside PSII [59]. In our research, the increase of PsbA protein content in Plumbago shoots cultivated on medium with 0.1 g Pb∙l−1, indicates its rapid damage and attempts to its quick reconstruction. Damage of the PSII reaction centers is also confirmed by a decrease of Vj, which indicates the number of active reaction centers to all reaction centers that can be closed [60]. This is also reflected in the decrease in the number of active reaction centers per cross section (RC/CS0). In PsbA protein, lead often associates with QB site preventing electron transport between QA and QB sites but also beyond QB [30,61]. In case of P. zeylanica shoots, we noted decrease of φPo and increase of ψEo, what informs on the one hand about reduced electron flow efficiency between QA and QB and on the other hand about the increase of probability that trapped exciton moves an electron beyond QB in these plants. Undisturbed electron transport rate beyond QB could come out of larger plastoquinone pool (Area) resulting in higher amount of total electron carriers per RC (Sm). Furthermore, this points out that PSII acceptor side of Pb-treated Plumbago shoots were not affected by lead action, which can be observed in other plants [52]. Similar plant response to Pb toxicity was noted in kidney vetch plants [19].
Photosystem I (PSI) appears to be relatively resistant to lead ions. However, lead-induced changes in thylakoid membrane properties affect electron transporters, like plastocyanin (PC) and ferredoxin (Fd) [55]. Moreover, Pb can also directly impacts these transporters. It reduces synthesis and activity of PC (substitution of copper ions) and limits activity of NADP+ ferredoxin reductase (combining with thiol groups) thus suppressing reduction power (NADPH) synthesis [62]. Disorders at this stage of photosynthesis could be manifested by decrease of maximal fluorescence (FM), QB oxidation (δRo), the efficiency of quantum yield for reduction of PSI end acceptors (φRo) and the efficiency of electron transport (ρRo) [30,63]. In the case of P. zeylanica plants growing under high lead stress, we observed on the one hand a significant reduction of FM but on the other a significant increase of δRo, φRo, and ρRo. Moreover, a decrease of VI value suggests that the efficiency of electron transport was not disturbed especially from QB to the PSI end electron acceptors. Decrease of fluorescence can be explained by the reduced chlorophyll content [28]. Whereas, increase of other parameters may be result of changing plastoquinone pool but also the effective cycle electron flow (CEF) or/and other alternative electron cycles.
Some authors believe that light-independent reactions of photosynthesis are more susceptible to Pb, because of Pb-induced interferences in synthesis and activity of Calvin-Benson cycle enzymes, mainly RuBisCo [9,15,64]. This point of view is also indirectly confirmed in our research. Although, RuBisCo content not only did not decrease, but increased in Plumbago shoots cultivated under both tested Pb concentrations. Because RuBisCo is abundant in plant cells, increased accumulation points to the problems with its efficiency [65].
Under natural conditions, the photosynthetic apparatus may be exposed to the potentially damaging effects of excessive radiation [66,67]. Under conditions of abiotic stress, including heavy metals, which limit photosynthetic metabolism, even moderate radiation may be excessive and activating dangerous photo-oxidative reactions, which lead to emerging highly reactive singlet oxygen [37,68,69]. The primary defense mechanism of plants is based on the harmless emission of absorbed energy as heat and is called non-photochemical energy dissipation/conversion [68]. Parameters such as Y(NPQ), Y(NO), and Y(II) allow to describe the excitation energy fate and show how plants cope with excess excitation energy and indirectly with arising stress [70]. The quantum photosynthetic yield of PSII (Y(II)) is the energy photo-chemically converted in PSII. Y(NPQ) and Y(NO) correspond to non-photochemical quenching, thus energy dissipated in the form of a heat or fluorescence. The first one reflects regulated energy dissipation via the photoprotective NPQ-mechanism. The second one corresponds to passive energy dissipation through non-photo-protective mechanisms [70]. Plants exhibit a high photoprotective capacity when values of Y(II) are maximal and Y(NPQ) are higher than Y(NO). On the other hand, eventually photodamage can be reflected by high values of Y(NO) and low values of Y(NPQ) [70]. In the case of our study, we noted statistically higher value of Y(II), lower value of Y(NO) and no change in value of Y(NPQ) in plants from 0.05 g Pb∙l−1 in comparison to control plants what means that photoprotective mechanisms worked flawlessly. In contrast, in plants from 0.1 g Pb∙l−1, we recorded no changes in values of Y(NPQ) and Y(NO) what can mean that NPQ-generated reactions were not affected by emerging stress [70]. However, the quantum photosynthetic yield of PSII (Y(II)) in these plants were statistically lower what can correspond with diminish linear electron flow [71].
To trigger NPQ-mechanisms (xanthophyll cycle), it is necessary to create a proton gradient across the thylakoid membrane [71]. In the case of diminish linear electron flow, proton gradient may be generated via cycling electron flow. In stress conditions, plants switch over to cycling electron flow (CEF), which helps to dissipate excess energy and protect PSII from photoinhibition [72]. Taking into account Y(NPQ) value maintained at the control level and high level of energy dissipation (increased value of DIo/RC) in Plumbago leaves from medium with 0.1 g Pb∙l−1, we assumed that in these plants the electrons are redirected to cyclical transport around PSI to protect PSII.
Plants can preserve their photosystems not only by redirecting electrons to cycling flow but also via several other alternative electron transport pathways, like ‘water-water cycle’ (O2 reduction at the acceptor side of PSI followed by ascorbate peroxidase reaction) [73] and chlororespiration (terminal plastoquinone oxidase (PTOX)-mediated reduction of O2 when PQ-pool is over-reduced) [65,74]. The activation of these pathways is often observed in plants under stress conditions and connected with redox state unbalance influencing both ferrodoxin and PQ pool [75]. The impairment of redox state can result from the excessive energy absorbed and failure in its exploitation on the PSI acceptor side and/or in the dark reactions of photosynthesis. Rodriguez et al. [15] demonstrate that inactivation of ferredoxin and thioredoxin as well as Calvin–Benson cycle enzymes is the first effect of Pb ions toxicity on the photosynthetic apparatus. The malfunction of electron carriers and enzymes leads, in the first place, to inactivation of PSI, then to PQ pool overreduction and, consequently, to PSII photoxidation. To secure the efficient photosystems functioning, plants increase the activity of PTOX which catalyzes the electron transfer from PQH2 to O2 [65]. Under conditions of limitation on the acceptor side of the PSI, redundant electrons are redirected by PTOX to O2, thus allowing free flow of electrons beyond QB and preventing PSII photoxidation [62]. Inactivation of Calvin–Benson cycle enzymes lead to reduction of PQ pool by redirection of electron via two pathways: (1) ferredoxin (Fd)—ferredoxin-plastoquinone oxidoreductase (FQR)—nicotinamide adenine dinucleotide phosphate (NADPH); (2) Fd—chloroplastic NAD(P)H dehydrogenase complex (NDH). In the second pathway, the lumen is acidified, and NPQ mechanisms are activated [65,76]. It appears that the chlororespiration mechanism has been activated to secure efficient photosynthesis in Plumbago shoots from 0.05 g Pb∙l−1 medium. This is demonstrated on the one hand by efficient electron transport maintained beyond of QB (high ETR) and on the other by inefficient RuBisCo (as mentioned above) and slightly reduced values of the parameters φRo, δRo; ρRo indicating the limitation on the PSI acceptor side. In addition, a significant increase in the activity of Cu/Zn SODII and the amounts of CAT and stromal APX may suggest the generation of reactive oxygen species during the oxidation of reduced PQ by PTOX.

4. Materials and Methods

4.1. Plant Material

Experimental material comprised established in vitro culture of Plumbago zeylanica Linn. plants (from the collection of Department of Biotechnology and Horticulture, University of Agriculture in Krakow) growing on basal medium containing ½ MS [77] macro-, microelements and vitamins, with 30 g·l−1 of sucrose, solidified with 8 g·l−1 of agar, with no growth regulators and pH = 5.8 (prior autoclaving). Plant materials were cultured at 25 ± 1 °C under a 16/8 h light photoperiod of 50 μmol m−2 s−1 photosynthetic photon flux density.

4.2. Experimental Conditions and Stress Treatment

Explants (shoot fragments with two leaves) were obtained from initial in vitro cultures and placed on basal medium with addition of lead nitrate (Pb(NO3)2) at concentrations: 0.0 (control), 0.05, and 0.1 g Pb∙l−1. In vitro cultures were kept at the same temperature and light conditions as initial plant material. For each experimental treatment, five explants each were placed in ten vessels. The whole experiment was repeated in triplicate.

4.3. Biometric Assay

After 4 weeks of culture, the growth index (GI) of plants was estimated. Growth index was determined according to formula: GI[%] = (FFW − IFW)/FFW∗100, where FFW is final fresh weight of shoot and IFW is initial fresh weight of shoot. Rooting efficiency was estimated as rooting percentage and average length of the longest root per explants. Shoots and roots were separately freeze-dried for 48 h and percentage of dry weight content were counted.

4.4. Estimation of Lead Concentration in Plant Tissue

Plant freeze-dried samples (200 mg) were digested in 5 mL HNO3 and 1.65 mL H2O2 to dissolve all elements presented in plant tissue. Samples were filtered, adjusted to 25 mL with MQ-water and analyzed with Atomic Absorption Spectrometry (flame atomic absorption spectroscopy [FAAS] or graphite furnace atomic absorption spectroscopy [GF-AAS], equipped with Zeeman effect background correction and an CSX 260 auto-sampler [Thermo Scientific, Waltham, MA USA]), to determine the metal concentrations. Results have been expressed as mg Pb∙kg−1 of DW.

4.5. Estimation of Lipid Membranes Peroxidation Level

To estimate peroxidation level of lipid membranes, malondialdehyde (MDA) content was measured, separately in shoots and roots, according to Dhindsa et al. [78] with modifications. In brief, plant material (ap. 10 mg of DW) were homogenized in 1.0 mL of 0.1% TCA (trichloroacetic acid) and centrifuged (4 °C, 15 min, 10,000× g). The, 0.2 mL of supernatant was collected and mixed with 0.8 mL of 20% TCA containing 0.5% of TBA (thiobarbituric acid). Then, samples were incubated 30 min in 95 °C, after that cooled on ice, and centrifuged (4 °C, 10 min, 10,000× g). The absorbance of mixtures was measured at 532 nm and 600 nm, using Double Beam spectrophotometer U-2900. The value at 532 nm (A532) was reduced by the value at 600 nm (A600, the correction value): Ax = A532 − A600. The concentration of MDA was calculated using absorbance coefficient for MDA ε = 155 mM−1cm−1, and expressed as nM MDA per 1 g of DW.

4.6. Phenolic Compounds’ Content Determination

4.6.1. Total Phenols

To estimate content of total phenolic compounds in shoots and roots, photometric method by Swain and Hillis [79] with Folin–Ciocalteu (F-C) reagent was used, with small modifications. Dry plant tissue (10 mg) was extracted in 1 mL of 80% methanol and centrifuged (4 °C, 15 min, 20,000× g). 1 mL of diluted extract was mixed with 0.2 mL of F-C reagent (Sigma-Aldrich Chemie, GmBH, Steinheim, Germany) and 1.6 mL of 5% Na2CO3. Reaction mixture was incubated 20 min in 40 °C. After incubation, the absorption of samples was measured at 740 nm, using double beam spectrophotometer U-2900. Chlorogenic acid was used as standard. The content of phenolic compounds was expressed as milligram of chlorogenic acid per 1 g of DW.

4.6.2. Specific Phenol Groups

The content of cinnamic acid derivatives (CAD), flavonols, and anthocyanins was determined using the spectrophotometric method according to Fukumoto and Mazza [80]. Plant material (10 mg) was homogenized in 80% methanol in 4 °C. Samples were centrifuged for 15 min (20,000× g, 4 °C). Diluted supernatant was mixed with: 0.25 mL 0.1% HCl in 96% EtOH and 4.55 mL 2% HCl in H2O. After 15 min, the absorbance was measured at wavelengths of 320, 360, and 520 nm. Using calibration curves made for caffeic acid, quercetin, and cyanidin, the content of CAD, flavonols, and anthocyanins was calculated. Results were expressed as milligram of CAD, flavonols, and anthocyanins per 1 g of DW.

4.6.3. Plumbagin

Determination of plumbagin concentration in shoot and roots of P. zeylanica plants have been performed using high-pressure liquid chromatography (HPLC). Briefly, 10 mg of dry plant tissue was extracted in 0.5 mL MQ-water and 0.5 of tetrahydrofuran (THF) and sonicated per 30 min. Next, 200 mg of NaCl was added. Samples were shaken to dissolve the salt and centrifuged (4 °C, 15 min, 20,000× g). The supernatant was used in HPLC analysis. The chromatographic separation was carried out using Beckmann Gold System (Beckman Coulter, Brea, CA, USA) equipped with a Thermo Separations Spectra 100 variable wavelength detector (Thermo Scientific, Waltham, MA, USA) and a Rheodyne 6-way injection valve. For the stationary phase, an Agilent XDB-C18 (4.6 × 50 mm, 1.8 µm) was used. The flow rate used was 1 mL∙min−1. The sample injection volume was 10 µL. The mobile phase for the analysis consisted of methanol as eluent A and water as eluent B. The separation was performed in isocratic conditions (60% A). The length of the analysis was 5 min. The retention time of plumbagin was 2.78 min. The separation was carried at room temperature. For determining the concentration of plumbagin a 4-point, 3-level standard curve was used. Monitoring was performed at 254 nm.

4.7. Evaluation of Photosynthetic Apparatus Efficiency

4.7.1. Photosynthetic Pigment Content Estimation

To estimate photosynthetic pigment content photometric method by Lichtenthaler [81] with modifications has been used. Briefly, dry shoot tissue (10 mg) was extracted in 1 mL of 80% acetone with magnesium chloride, in ice-cold conditions. Samples were centrifuged (4 °C, 15 min, 20,000× g) and supernatant were collected in glass cylinder, while samples were extracted two more times with 1 mL of 80% acetone with magnesium chloride and centrifuged (4 °C, 15 min, 20,000× g). Supernatant was diluted to 5 mL with 80% acetone with magnesium chloride. Samples were mixed and the absorbance was measured at 663 nm (Chl a), 646 nm (Chl b) and 470 nm (Car), using double beam spectrophotometer U-2900 (Hitachi High-Technologies Corporation, Tokyo, Japan). Content of pigment was calculated during Wellburn [82].

4.7.2. Chlorophyll a Fluorescence Measurement

Chlorophyll a fluorescence induction curves analysis were done on in vitro plants’ leaves. Leaves from 15 plants of each combination were adapted to the dark for 25 min. Fast kinetics chlorophyll fluorescence induction were measured using Handy-PEA (Hansatech, King’s Lynn, UK) spectrofluorometer on the basis of the relevant standard procedures. The fluorescence were induced by red light: λmax = 650 nm, 2000 μmol∙m−2∙s−1. Selected functional and structural photosynthetic parameters (Table 3) were calculated ac. to Jiang et al. [63] and Kalaji et al. [83]. Recorded curves were analysed using the fluorometer producer’s soft-ware (PEA-Plus). Slow kinetics chlorophyll fluorescence induction were measured using OS1p chlorophyll fluorometer (Opti-Sciences, Hudson, NH, USA). The fluorescence were measured using a modulated light source of 25 µmol∙m−2∙s−1 at 660 nm and a saturation pulse from a white light light-emitting diode with an intensity of 7700 µmol∙m−2∙s−1 for a duration of 0.8 s. Quantum photosynthetic yield of PSII (Y(II)), photoprotective non-photochemical quenching (Y(NPQ)) and all other non-photo-protective non-photochemical quenching Y(NO) were evaluated using quenching tests protocol and electron transport rate (ETR) using rapid light curves (RLC) protocol.

4.7.3. Protein Content Determination

To determine the content of proteins: ascorbate peroxidase (APX), catalase (CAT), rubisco large subunit (RbcL) and photosystem’s proteins, like: PsbA, Lhcb1 and PsbO plant tissue (shoots) were extracted in buffer according to Laureau et al. [84] with modifications, in 4 °C. Protein concentration was determined according to Bradford [85] with BSA as a standard. SDS-PAGE were performed at 4 °C, with 24 mA for 15 min, 34 mA for 35 min and 68 mA for 60 min, on 12% polyacrylamide gels. For each line 5 µg of protein extract was applied. Blotting was performed on a polyvinylidene fluoride membrane (PVPD) (BioRad). Identification of protein bands was done with polyclonal antibodies (Agrisera), and detection was performed with alkaline phosphate buffer with BCIP/NBT as a substrate. Membranes were scanned, and the intensity of bands was calculated using ImageJ version 1.52n (open source software, OSS). The content of each protein was expressed as arbitral units, defined as area under the curve per µg of protein applied to the line. After analysis, the highest protein quantities at each gel were expressed as 1, and all data were normalized to it.

4.7.4. Histological and TEM Observation

After 4 weeks of culture, fragments of leaves and roots were incubated in 2% paraformaldehyde and 2% glutaraldehyde in 0.1 M cacodylate buffer (pH 7.2) for 2 h, rinsed 4 times in cacodylate buffer, and post-fixed in a solution of 2% osmium tetroxide in cacodylate buffer for 3 h at 4 °C. Plant tissue was dehydrated through a graded ethanol series and substituted by propylene oxide, and then embedded in glycid ether 100 epoxy resin (SERVA) equivalent to the former Epon812. The resin was polymerized at 65 °C for 24h. Semi-thin sections were prepared with Jung RM 2065 microtome, stained with methylene blue and azur A, and examined under a light microscope (Olympus-Provis, Tokyo, Japan). Ultra-thin sections were prepared with Ultracut UCT Leica microtome, collected on formvar coated grids and stained with uranyl acetate followed by lead citrate for 1 min. Examinations were made under a transmission electron microscope (Morgagni 268D, Hillsboro, OR, USA).

4.7.5. Evaluation of Antioxidant Enzymes

The activity of SOD isoforms was examined according to Miszalski et al. [86] with modifications. Briefly, native polyacrylamide gel electrophoresis (PAGE) with specific staining for SOD was used to separate and visualized SOD isoforms. For protein isolation 0.1 M phosphate buffer with DTT, EDTA and PVPP, with pH = 7.5 was used. Protein concentration was determined according to Bradford [85] with BSA as a standard. PAGE was performed at 4 °C, 180V, 1 h on 13% polyacrylamide gels, with electrophoresis buffer according to Laemmli [87] with no SDS addition. For each line, 20 µg of protein extract was applied. Activity of SOD isoforms was visualized after 30 min incubation of gels in the darkness at the room temperature, after exposition to daily light. Incubation was performed in staining buffer described by Miszalski et al. [86]. Gels were scanned, and intensity of bands were calculated using ImageJ (open source software, OSS). Activity of isoforms was expressed as arbitral units, defined as area under the curve per µg of protein applied to the line. After analysis, the highest protein quantities at each gel were expressed as 1 and all data were normalized to it.

4.8. Statistical Analyses

All biometric parameters and chl a fluorescence measurements were done in 10 replicates, all spectrophotometric analyses were done in 5 replicates and AAS, HPLC and electrophoresis analyses were done in 3 replicates. All results were subjected to one-way analysis of variance (ANOVA). The significant differences between means were determined with DUNCUN test at p < 0.05 level. Statistica 12.0 (StatSoft Inc., Tulsa, OK, USA) was used to carry out statistical analyses. Results obtained for the shoots and roots in vitro plants were separately statistically verified.

5. Conclusions

The photosynthetic apparatus of Plumbago plants cultivated on media with lower Pb concentration was characterized by no changes in both the content of photosynthetic pigments and the size of LHC II antennas, as well as the lack of limitation on the RC PSII donor side. As a result, no changes in the efficiency and performance of the PSII compared to the control plants were observed. At the same time, in these plants statistically significantly higher activity of Cu/Zn-SODII chloroplast isoform and content of stromal ascorbate peroxidase and catalase were noted, indicating a high risk of limitation on the acceptor side of PSI. It seems that in these plants the mechanism of acclimatization of the photosynthetic apparatus to elevated Pb concentration in shoots is associated with the decoupling of linear electron transport in favor of alternative electron flows, i.e., pseudocyclic (chlororespiration). Such a mechanism would allow for the maintenance of a stable oxidoreductive balance of chloroplasts and no risk of PSI photooxidation.
In plants cultivated on a medium containing higher Pb concentration, a significant decrease in the photosynthetic pigments content, the size of LHC II photosynthetic antennas, the amount of active RC PSII, and OEC activity were observed. Moreover, a significant remodeling of the chloroplast ultrastructure, decreasing the number of grana thylakoids in favor of stromal thylakoids appeared. These results indicate a significant limitation of PS II on the donor side and reaction center resulting in a PSII performance decrease. However, the lack of limitation on the PSI acceptor side may suggest that the acclimatization mechanism of Plumbago plants to higher Pb concentration is associated with the dominance of cyclic electron transport over linear transport. This strategy would allow plants the most effective use of a limited amount of absorbed light energy while reducing the risk of both PSII and PSI photoxidation.
Presented research indicates that P. zeylanica plants accumulate large amounts of lead in roots, which is very important considering that this organ is mainly used for preparation of pharmacologically important extracts [88]. Furthermore, P. zeylanica acclimates to lead toxicity by adjusting photosynthetic apparatus via different mechanisms depending on Pb ion concentration.

Author Contributions

Conceptualization, K.M.T. and W.M.; methodology, R.J. and R.B.; validation, K.M.T., W.M. and B.T.; formal analysis, W.M. and B.T.; investigation, W.M., M.H., E.S., E.M., R.J., R.B. and Ł.C.; resources, S.M.; writing—original draft preparation, K.M.T., B.T., W.M. and M.H.; writing—review and editing, K.M.T and B.T.; visualization, B.T.; supervision, K.M.T.; project administration, W.M.; funding acquisition, S.M. All authors have read and agreed to the published version of the manuscript.

Funding

This research received no external funding.

Acknowledgments

The research was supported from subsidies (SUB/2019-0511000000-D507 and SUB/2019-0517000000-D510) and the APC was funded by subsidy (SUB/2020-050012-D011) of the Ministry of Science and Higher Education of the Republic of Poland aimed at maintenance and development of research potential of the Department of Botany, Physiology and Plant Protection.

Conflicts of Interest

The authors declare no conflict of interest.

Abbreviations

ALAD alpha amino levulinic dehydrogenase
APXascorbate peroxidase
BCIP5-bromo-4-chloro-3-indolyl phosphate
BSAbovine serum albumin
CADcinnamic acid derivatives
CATcatalase
CEFcyclic electron flow
CScross section
Cu/ZnSODcopper- and zinc-containing superoxide dismutase
Cu/ZnSODIIchloroplastic copper- and zinc-containing superoxide dismutase
DTTdithiothreitol
DWdry weight
EDTAethylenediaminetetraacetic acid
ETRelectron transport rate
F-CFolin–Ciocalteu
Fdferredoxin
FFWferredoxin
FQRferredoxin-plastoquinone oxidoreductase
GIgrowth index
HPLChigh performance liquid chromatography
IFWinitial fresh weight
Lhcb1light-harvesting chlorophyll a/b binding protein
LHCIIlight-harvesting complex of PSII
MDAmalondialdehyde
MEPmethyl eritrythol phosphate pathway
MnSODmanganese superoxide dismutase
MQMilli-Q
MSMurashige and Skoog medium
NADP+nicotinamide adenine dinucleotide phosphate
NADPHreduced nicotinamide adenine dinucleotide phosphate
NBTnitro blue tetrazolium
NDHNAD(P)H dehydrogenase complex
NPQnon-photochemical quenching
OECoxygen evolving complex
PCplastocyanin
PQplastoquinone
PsbAPhotosystem II reaction center protein A
PsbOoxygen-evolving enhancer protein 1
PSIPhotosystem I
PSIIPhotosystem II
PTOXterminal plastoquinone oxidase
PVPDpolyvinylidene fluoride membrane
PVPPpolyvinylpolypyrrolidone
RCreaction center
RbcLrubisco large subunit
ROSreactive oxygen species
Rubiscoribulose-1,5-bisphosphate carboxylase
SDS-PAGEsodium dodecyl sulfate–polyacrylamide gel electrophoresis
SODsuperoxide dismutase
TBAthiobarbituric acid
TCAtrichloroacetic acid
TEMtransmission electron microscopy
THFtetrahydrofuran

References

  1. Alloway, B.J. Sources of heavy metals and metalloids in soils. In Heavy Metals in Soils. Environmental Pollution, 3rd ed.; Alloway, B., Ed.; Springer: Dordrecht, The Netherlands, 2013; Volume 22, pp. 11–50. [Google Scholar]
  2. Rozpądek, P.; Domka, A.; Ważny, R.; Nosek, M.; Jędrzejczyk, R.; Tokarz, K.; Turnau, K. How does the endophytic fungus Mucor sp. improve Arabidopsis arenosa vegetation in the degraded environment of a mine dump? Environ. Exp. Bot. 2018, 147, 31–42. [Google Scholar] [CrossRef]
  3. De Lurdes Dinis, M.; Fiúza, A. Exposure assessment to heavy metals in the environment: Measures to eliminate or reduce the exposure to critical receptors. In Environmental Heavy Metal Pollution and Effects on Child Mental Development. NATO Science for Peace and Security Series C: Environmental Securit; Simeonov, L., Kochubovski, M., Simeonova, B., Eds.; Springer: Dordrecht, The Netherlands, 2011; Volume 1, pp. 27–50. [Google Scholar]
  4. Tong, S.; Schirnding, Y.E.V.; Prapamontol, T. Environmental lead exposure: A public health problem of global dimensions. B World Health. Organ. 2000, 78, 1068–1077. [Google Scholar]
  5. Gupta, D.; Huang, H.; Yang, X.; Razafindrabe, B.; Inouhe, M. The detoxification of lead in Sedum alfredii H. is not related to phytochelatins but the glutathione. J. Hazard. Mater. 2010, 177, 437–444. [Google Scholar] [CrossRef]
  6. Krzesłowska, M.; Lenartowska, M.; Mellerowicz, E.J.; Samardakiewicz, S.; Woźny, A. Pectinous cell wall thickenings formation—a response of moss protonemata cells to lead. Environ. Exp. Bot. 2009, 656565, 119–131. [Google Scholar] [CrossRef]
  7. Maestri, E.; Marmiroli, M.; Visioli, G.; Marmiroli, N. Metal tolerance and hyperaccumulation:costs and trade-offs between traits and environment. Environ. Exp. Bot. 2010, 688, 1–13. [Google Scholar] [CrossRef]
  8. Sharma, P.; Dubey, R.S. Lead toxicity in plants. Braz. J. Plant Physiol. 2005, 1717, 35–52. [Google Scholar] [CrossRef] [Green Version]
  9. Küpper, H. Lead toxicity in plants. In Lead—Its Effects on Environment and Health; Astrid, S., Sigel, H., Sigel, R.K.O., Eds.; Walter de Gruyter: Berlin, Germany, 2017; Volume 17, pp. 491–500. [Google Scholar]
  10. Cegiełkowska, W.; Michaska-Kacymirow, M.; Wierzbicka, M. Heavy metals in the environment. In Ecotoxicology of Plants, Soils, Metals; Wierzbicka, M., Ed.; University of Warsaw Publisher: Warszawa, Poland, 2015; Volume 1, pp. 22–36. (In Polish) [Google Scholar]
  11. Shahid, M.; Pourrut, B.; Dumat, C.; Nadeem, M.; Aslam, M.; Pinelli, E. Heavy-metal-induced reactive oxygen species: Phytotoxicity and physicochemical changes in plants. In Reviews of Environmental Contamination and Toxicology; Whitacre, D.M., Ed.; Springer International Publishing: Cham, Switzerland, 2014; Volume 232, pp. 114–131. [Google Scholar]
  12. Yilmaz, K.; Akinci, İ.E.; Akinci, S. Effect of lead accumulation on growth and mineral composition of eggplant seedlings (Solarium melongena). N. Z. J. Crop Hort. 2009, 37, 189–199. [Google Scholar] [CrossRef] [Green Version]
  13. Pourrut, B.; Shahid, M.; Dumat, C.; Winterton, P.; Pinelli, E. Lead uptake, toxicity and detoxification in plants. Rev. Environ. Contam. Toxicol. 2011, 213, 113–136. [Google Scholar]
  14. Sengar, R.S.; Gautam, M.; Sengar, R.S.; Garg, S.K.; Senger, K.; Chaudhary, R. Lead stress effects on physiobiochemical activities of higher plants. Rev. Environ. Contam. Toxicol. 2008, 196, 73–93. [Google Scholar]
  15. Rodriguez, E.; da Conceição Santos, M.; Azevedo, R.; Correia, C.; Moutinho-Pereira, J.; de Oliveira, J.M.P.F.; Dias, M.C. Photosynthesis light-independent reactions are sensitive biomarkers to monitor lead phytotoxicity in a Pb-tolerant Pisum sativum cultivar. Environ. Sci. Pollut. R. 2015, 22, 574–585. [Google Scholar] [CrossRef]
  16. Kaur, G.; Singh, H.P.; Batish, D.R.; Kohli, R.K. Pb-inhibited mitotic activity in onion roots involves DNA damage and disruption of oxidative metabolism. Ecotoxicology 2014, 23, 1292–1304. [Google Scholar] [CrossRef]
  17. Patra, M.; Bhowmik, N.; Bandopadhyay, B.; Sharma, A. Comparison of mercury, lead and arsenic with respect to genotoxic effects on plant systems and the development of genetic tolerance. Environ. Exp. Bot. 2004, 52, 199–223. [Google Scholar] [CrossRef]
  18. Samardakiewicz, S.; Krzeszowiec-Jeleń, W.; Bednarski, W.; Jankowski, A.; Suski, S.; Gabryś, H.; Woźny, A. Pb-induced avoidance-like chloroplast movements in fronds of Lemna trisulca L. PLoS ONE 2015, 10, 0116757. [Google Scholar] [CrossRef]
  19. Kopittke, P.M.; Asher, C.J.; Kopittke, R.A.; Menzies, N.W. Toxic effects of Pb2+ on growth of cowpea (Vigna unguiculata). Environ. Pollut. 2007, 150, 280–287. [Google Scholar] [CrossRef] [Green Version]
  20. Piwowarczyk, B.; Tokarz, K.; Muszyńska, E.; Makowski, W.; Jędrzejczyk, R.; Gajewski, Z.; Hanus-Fajerska, E. The acclimatization strategies of kidney vetch (Anthyllis. vulneraria L.) to Pb toxicity. Environ. Sci. Pollut. R. 2018, 25, 19739–19752. [Google Scholar] [CrossRef] [Green Version]
  21. Nalina, L.; Shanthanu, K.; Rajamani, K.; John Joe, A.; Dhanani, T.; Singh, R.; Kumar, S. Morphological, yield and quality variability among the accessions of Plumbago zeylanica. Electron. J. Plant Breed 2017, 8, 680–687. [Google Scholar] [CrossRef]
  22. Gawronski, S.W.; Greger, M.; Gawronska, H. Plant taxonomy and metal phytoremediation. In Soil Biology. Detoxification of Heavy Metals; Sherameti, I., Varma, A., Eds.; Springer: Berlin/Heidelberg, Germany, 2011; Volume 30, pp. 91–109. [Google Scholar]
  23. Saji, A.; Antony, V.T. Plumbago auriculata Lam. Int. J. Pharm. Sci. Rev. Res. 2015, 33, 281–284. [Google Scholar]
  24. Tyagi, R.I.; Menghani, E. A review on Plumbago zeylanica a compelling herb. Int. J. Pharm. Sci. Rev. Res. 2014, 5, 119–126. [Google Scholar]
  25. Vogel-Mikuš, K.; Pongrac, P.; Kump, P.; Nečemer, M.; Regvar, M. Colonisation of a Zn, Cd and Pb hyperaccumulator Thlaspi praecox Wulfen with indigenous arbuscular mycorrhizal fungal mixture induces changes in heavy metal and nutrient uptake. Environ. Pollut. 2006, 139, 362–371. [Google Scholar] [CrossRef]
  26. Tsikas, D. Assessment of lipid peroxidation by measuring malondialdehyde (MDA) and relatives in biological samples: Analytical and biological challenges. Anal. Biochem. 2017, 524, 13–30. [Google Scholar] [CrossRef]
  27. Golemiec, E.; Tokarz, K.; Wielanek, M.; Niewiadomska, E. A dissection of the effects of ethylene, H2O2 and high irradiance on antioxidants and several genes associated with stress and senescence in tobacco leaves. J. Plant Physiol. 2014, 171, 269–275. [Google Scholar] [CrossRef]
  28. Kalaji, H.M.; Jajoo, A.; Oukarroum, A.; Brestic, M.; Zivcak, M.; Samborska, I.A.; Cetner, M.D.; Łukasik, I.; Goltsev, V.; Ladle, R.J. Chlorophyll a fluorescence as a tool to monitor physiological status of plants under abiotic stress conditions. Acta. Physiol. Plant 2016, 38, 102. [Google Scholar] [CrossRef] [Green Version]
  29. Rozpądek, P.; Nosek, M.; Domka, A.; Ważny, R.; Jędrzejczyk, R.; Tokarz, K.; Pilarska, M.; Niewiadomska, E.; Turnau, K. Acclimation of the photosynthetic apparatus and alterations in sugar metabolism in response to inoculation with endophytic fungi. Plant Cell Environ. 2019, 42, 1408–1423. [Google Scholar] [CrossRef]
  30. Stirbet, A.; Riznichenko, G.Y.; Rubin, A.B. Modeling chlorophyll a fluorescence transient: Relation to photosynthesis. Biochem. Mosc. 2014, 79, 291–323. [Google Scholar] [CrossRef]
  31. Marmiroli, M.; Antonioli, G.; Maestri, E.; Marmiroli, N. Evidence of the involvement of plant ligno-cellulosic structure in the sequestration of Pb: An X-ray spectroscopy-based analysis. Environ. Pollut. 2005, 134, 217–227. [Google Scholar] [CrossRef]
  32. Wierzbicka, M.H.; Przedpełska, E.; Ruzik, R.; Ouerdane, L.; Połec-Pawlak, K.; Jarosz, M.; Szpunar, J.; Szakiel, A. Comparison of the toxicity and distribution of cadmium and lead in plant cells. Protoplasma 2007, 231, 99–111. [Google Scholar] [CrossRef]
  33. Krzesłowska, M.; Lenartowska, M.; Samardakiewicz, S.; Bilski, H.; Woźny, A. Lead deposited in the cell wall of Funaria hygrometrica protonemata is not stable–a remobilization can occur. Environ. Pollut. 2010, 158, 325–338. [Google Scholar] [CrossRef]
  34. Seregin, I.V.; Shpigun, L.K.; Ivanov, V.B. Distribution and toxic effects of cadmium and lead on maize roots. Russ. J. Plant Physiol. 2004, 51, 525–533. [Google Scholar] [CrossRef]
  35. Rascio, N.; Navari-Izzo, F. Heavy metal hyperaccumulating plants: How and why do they do it? And what makes them so interesting? Plant Sci. 2011, 180, 169–181. [Google Scholar] [CrossRef]
  36. Pourrut, B.; Shahid, M.; Douay, F.; Dumat, C.; Pinelli, E. Molecular mechanisms involved in lead uptake, toxicity and detoxification in higher plants. In Heavy Metal Stress in Plants; Corpas, F.J., Palma, J.M., Gupta, D.K., Eds.; Springer: Berlin, Germany, 2013; pp. 121–147. [Google Scholar]
  37. Tokarz, K.; Piwowarczyk, B.; Makowski, W. Mechanisms involved in photosynthetic apparatus protection against lead toxicity. In Lead in Plants and the Environment. Radionuclides and Heavy Metals in the Environment; Gupta, D., Chatterjee, S., Walther, C., Eds.; Springer: Cham, Switzerland, 2020; pp. 117–128. [Google Scholar]
  38. Bhattacharjee, S. The language of reactive oxygen species signaling in plants. J. Bot. 2012, 2012, 985298. [Google Scholar] [CrossRef] [Green Version]
  39. Cenkci, S.; Cigerci, I.H.; Yildiz, M.; Özay, C.; Bozdag, A.; Terzi, H. Lead contamination reduces chlorophyll biosynthesis and genomic template stability in Brassica rapa L. Environ. Exp. Bot. 2010, 67, 467–473. [Google Scholar] [CrossRef]
  40. Giuliano, G. Plant carotenoids: Genomics meets multi-gene engineering. Curr. Opin. Plant. Biol. 2014, 19, 111–117. [Google Scholar] [CrossRef] [Green Version]
  41. Xiong, Z.; Zhao, F.; Li, M. Lead toxicity in Brassica pekinensis Rupr.: Effect on nitrate assimilation and growth. Environ. Toxicol. 2006, 21, 147–153. [Google Scholar] [CrossRef]
  42. Rottet, S.; Besagni, C.; Kessler, F. The role of plastoglobules in thylakoid lipid remodeling during plant development. BBA-Bioenergetics 2015, 1847, 889–899. [Google Scholar] [CrossRef] [Green Version]
  43. Arena, C.; Figlioli, F.; Sorrentino, M.C.; Izzo, L.G.; Capozzi, F.; Giordano, S.; Spagnuolo, V. Ultrastructural, protein and photosynthetic alterations induced by Pb and Cd in Cynara cardunculus L., and its potential for phytoremediation. Ecotox. Environ. Saf. 2017, 145, 83–89. [Google Scholar] [CrossRef]
  44. Figlioli, F.; Sorrentino, M.C.; Memoli, V.; Arena, C.; Maisto, G.; Giordano, S.; Capozzi, F.; Spagnuolo, V. Overall plant responses to Cd and Pb metal stress in maize: Growth pattern, ultrastructure, and photosynthetic activity. Environ. Sci. Pollut. R 2019, 26, 1781–1790. [Google Scholar] [CrossRef]
  45. Khan, M.M.; Islam, E.; Irem, S.; Akhtar, K.; Ashraf, M.Y.; Iqbal, J.; Liu, D. Pb-induced phytotoxicity in para grass (Brachiaria mutica) and Castorbean (Ricinus communis L.): Antioxidant and ultrastructural studies. Chemosphere 2018, 200, 257–265. [Google Scholar] [CrossRef]
  46. Reis, G.S.M.; de Almeida, A.A.F.; de Almeida, N.M.; de Castro, A.V.; Mangabeira, P.A.O.; Pirovani, C.P. Molecular, biochemical and ultrastructural changes induced by Pb toxicity in seedlings of Theobroma cacao L. PLoS ONE 2015, 10, e0129696. [Google Scholar] [CrossRef]
  47. Shen, J.; Song, L.; Müller, K.; Hu, Y.; Song, Y.; Yu, W.; Wang, H.; Wu, J. Magnesium alleviates adverse effects of lead on growth, photosynthesis, and ultrastructural alterations of Torreya grandis seedlings. Front. Plant Sci. 2016, 7, 1819. [Google Scholar] [CrossRef] [Green Version]
  48. Zhou, J.; Jiang, Z.; Ma, J.; Yang, L.; Wei, Y. The effects of lead stress on photosynthetic function and chloroplast ultrastructure of Robinia pseudoacacia seedlings. Environ. Sci. Pollut. R. 2017, 24, 10718–10726. [Google Scholar] [CrossRef]
  49. Piotrowska, A.; Bajguz, A.; Godlewska-Żyłkiewicz, B.; Czerpak, R.; Kamińska, M. Jasmonic acid as modulator of lead toxicity in aquatic plant Wolffia arrhiza (Lemnaceae). Environ. Exp. Bot. 2009, 66, 507–513. [Google Scholar] [CrossRef]
  50. Dekker, J.P.; Boekema, E.J. Supramolecular organization of thylakoid membrane proteins in green plants. BBA-Bioenergetics 2005, 1706, 12–39. [Google Scholar] [CrossRef] [Green Version]
  51. Garstka, M. Structural background of photosynthetic light reaction. Adv. Cell Biol. 2007, 34, 445–476. (In Polish) [Google Scholar]
  52. Gupta, D.K.; Nicoloso, F.T.; Schetinger, M.R.C.; Rossato, L.V.; Pereira, L.B.; Castro, G.Y.; Srivastava, S.; Tripathi, R.D. Antioxidant defense mechanism in hydroponically grown Zea mays seedlings under moderate lead stress. J. Hazard Mater. 2009, 172, 479–484. [Google Scholar] [CrossRef]
  53. De Las Rivas, J.; Barber, J. Analysis of the structure of the PsbO protein and its implications. Photosynth. Res. 2004, 81, 329–343. [Google Scholar] [CrossRef]
  54. Sersen, F.; Kralova, K.; Pesko, M.; Cigan, M. Effect of Pb2+ ions on photosynthetic apparatus. Gen. Physiol. Biophys. 2014, 33, 131–136. [Google Scholar] [CrossRef] [Green Version]
  55. Dao, L.H.; Beardall, J. Effects of lead on two green microalgae Chlorella and cenedesmus: Photosystem II activity and heterogeneity. Algal. Res. 2016, 16, 150–159. [Google Scholar] [CrossRef]
  56. Janik, E.; Szczepaniuk, J.; Maksymiec, W. Organization and functionality of chlorophyll-protein complexes in thylakoid membranes isolated from Pb-treated Secale cereale. J. Photoch. Photobio. B. 2013, 125, 98–104. [Google Scholar] [CrossRef]
  57. Harpaz-Saad, S.; Azoulay, T.; Arazi, T.; Ben-Yaakov, E.; Mett, A.; Shiboleth, Y.M.; Hörtensteiner, S.; Gidoni, D.; Gal-On, A.; Goldschmidt, E.E.; et al. Chlorophyllase is a rate-limiting enzyme in chlorophyll catabolism and is posttranslationally regulated. Plant Cell 2007, 19, 1007–1022. [Google Scholar] [CrossRef] [Green Version]
  58. Romanowska, E.; Wróblewska, B.; Drożak, A.; Zienkiewicz, M.; Siedlecka, M. Effect of Pb ions on superoxide dismutase and catalase activities in leaves of pea plants grown in high and low irradiance. Biol. Plantarum. 2008, 52, 80. [Google Scholar] [CrossRef]
  59. Qufei, L.; Fashui, H. Effects of Pb2+ on the structure and function of photosystem II of Spirodela polyrrhiza. Biol. Trace. Elem. Res. 2009, 129, 251. [Google Scholar] [CrossRef]
  60. Force, L.; Critchley, C.; van Rensen, J.J. New fluorescence parameters for monitoring photosynthesis in plants. Photosynth. Res. 2003, 78, 17. [Google Scholar] [CrossRef]
  61. Belatik, A.; Hotchandani, S.; Carpentier, R. Inhibition of the water oxidizing complex of photosystem II and the reoxidation of the quinone acceptor QA− by Pb2+. PLoS ONE 2013, 8, e68142. [Google Scholar] [CrossRef] [Green Version]
  62. Doncheva, S.; Ananieva, K.; Stefanov, D.; Vassilev, A.; Gesheva, E.; Dinev, N. Photosynthetic electron transport and antioxidant defense capacity of sunflower plants under combined heavy metal stress. Genet Plant Physiol. 2018, 8, 3–23. [Google Scholar]
  63. Jiang, H.X.; Chen, L.S.; Zheng, J.G.; Han, S.; Tang, N.; Smith, B.R. Aluminum-induced effects on photosystem II photochemistry in Citrus leaves assessed by the chlorophyll a fluorescence transient. Tree Physiol. 2008, 28, 1863–1871. [Google Scholar] [CrossRef] [PubMed]
  64. Singh, R.; Tripathi, R.D.; Dwivedi, S.; Kumar, A.; Trivedi, P.K.; Chakrabarty, D. Lead bioaccumulation potential of an aquatic macrophyte Najas indica are related to antioxidant system. Bioresour. Technol. 2010, 101, 3025–3032. [Google Scholar] [CrossRef] [PubMed]
  65. McDonald, A.E.; Ivanov, A.G.; Bode, R.; Maxwell, D.P.; Rodermel, S.R.; Hüner, N.P. Flexibility in photosynthetic electron transport: The physiological role of plastoquinol terminal oxidase (PTOX). BBA-Bioenergetics 2011, 1807, 954–967. [Google Scholar] [CrossRef] [PubMed] [Green Version]
  66. Tokarz, K.; Makowski, W.; Banasiuk, R.; Krolicka, A.; Piwowarczyk, B. Response of Dionaea muscipula J. Ellis to light stress in in vitro: Physiological study. Plant Cell Tiss. Organ. Cult. 2018, 134, 65–77. [Google Scholar] [CrossRef] [Green Version]
  67. Tokarz, K.; Piwowarczyk, B.; Wysocka, A.; Wójtowicz, T.; Makowski, W.; Golemiec, E. Response of grass pea (Lathyrus sativus L.) photosynthetic apparatus to short-term intensive UV-A: Red radiation. Acta. Physiol. Plant 2019, 41, 168. [Google Scholar] [CrossRef] [Green Version]
  68. Krause, G.H.; Jahns, P. Non-photochemical energy dissipation determined by chlorophyll fluorescence quenching: Characterization and function. In Chlorophyll a Fluorescence. Advances in Photosynthesis and Respiration; Papageorgiou, G.C., Govindjee, Eds.; Springer: Dordrecht, The Netherlands, 2004; Volume 19, pp. 463–495. [Google Scholar]
  69. Makowski, W.; Tokarz, B.; Banasiuk, R.; Królicka, A.; Dziurka, M.; Wojciechowska, R.; Tokarz, K.M. Is a blue–red light a good elicitor of phenolic compounds in the family Droseraceae? A comparative study. J. Photochem. Photobiol. B 2019, 201, 111679. [Google Scholar] [CrossRef] [PubMed]
  70. Klughammer, C.; Schreiber, U. Complementary PS II quantum yields calculated from simple fluorescence parameters measured by PAM fluorometry and the saturation pulse method. PAM Appl. Notes 2008, 1, 201–247. [Google Scholar]
  71. Huang, W.; Zhang, S.B.; Cao, K.F. Evidence for leaf fold to remedy the deficiency of physiological photoprotection for photosystem II. Photosynth. Res. 2012, 110, 185–191. [Google Scholar] [CrossRef] [PubMed]
  72. Takahashi, S.; Milward, S.E.; Fan, D.Y.; Chow, W.S.; Badger, M.R. How does cyclic electron flow alleviate photoinhibition in Arabidopsis? Plant Physiol. 2009, 149, 1560–1567. [Google Scholar] [CrossRef] [PubMed] [Green Version]
  73. Laisk, A.; Eichelmann, H.; Oja, V.; Rasulov, B.; Rämma, H. Photosystem II cycle and alternative electron flow in leaves. Plant Cell Physiol. 2006, 47, 972–983. [Google Scholar] [CrossRef] [PubMed]
  74. Rumeau, D.; Peltier, G.; Cournac, L. Chlororespiration and cyclic electron flow around PSI during photosynthesis and plant stress response. Plant Cell Environ. 2007, 30, 1041–1051. [Google Scholar] [CrossRef] [PubMed]
  75. Stirbet, A.; Lazár, D.; Guo, Y.; Govindjee, G. Photosynthesis: Basics, history and modelling. Ann. Bot. in press. [CrossRef]
  76. Tikhonov, A.N. Induction events and short-term regulation of electron transport in chloroplasts: An overview. Photosynth. Res. 2015, 125, 65–94. [Google Scholar] [CrossRef]
  77. Murashige, T.; Skoog, F. A revised medium for rapid growth and bioassays with tobacco tissue cultures. Physiol. Plant 1962, 15, 473–497. [Google Scholar] [CrossRef]
  78. Dhindsa, R.S.; Plumb-Dhindsa, P.; Thorpe, T.A. Leaf senescence: Correlated with increased levels of membrane permeability and lipid peroxidation, and decreased levels of superoxide dismutase and catalase. J. Exp. Bot. 1981, 32, 93–101. [Google Scholar] [CrossRef]
  79. Swain, T.; Hillis, W.E. Phenolic constituents of Prunus domestica. I Quantitative analysis of phenolic constituents. J. Sci. Food Agr. 1959, 10, 63–68. [Google Scholar] [CrossRef]
  80. Fukumoto, L.; Mazza, G. Assessing antioxidant and prooxidant activities of phenolic compounds. J. Agric. Food Chem. 2000, 48, 3597–3604. [Google Scholar] [CrossRef] [PubMed]
  81. Lichtenthaler, H.K. Chlorophylls and carotenoids: Pigments of photosynthetic biomembranes. Methods Enzymol. 1987, 148, 350–382. [Google Scholar]
  82. Wellburn, A.R. The spectral determination of chlorophylls a and b, as well as total carotenoids, using various solvents with spectrophotometers of different resolution. J. Plant Physiol. 1994, 144, 307–313. [Google Scholar] [CrossRef]
  83. Kalaji, H.M.; Bosa, K.; Kościelniak, J.; Żuk-Gołaszewska, K. Effects of salt stress on photosystem II efficiency and CO2 assimilation of two Syrian barley landraces. Environ. Exp. Bot. 2011, 73, 64–72. [Google Scholar] [CrossRef]
  84. Laureau, C.; De Paepe, R.; Latouche, G.; Moreno-Chacon, M.; Finazzi, G.; Kuntz, M.; Cornic, G.; Streb, P. Plastid terminal oxidase (PTOX) has the potential to act as a safety valve for excess excitation energy in the alpine plant species Ranunculus glacialis L. Plant Cell Environ. 2013, 36, 1296–1310. [Google Scholar] [CrossRef]
  85. Bradford, M.M. A Rapid and sensitive method for the quantitation of microgram quantities of protein utilizing the principle of protein -dye binding. Anal. Biochem. 1976, 72, 248–254. [Google Scholar] [CrossRef]
  86. Miszalski, Z.; Ślesak, I.; Niewiadomska, E.; Baczek-Kwinta, R.; Lüttge, U.; Ratajczak, R. Subcellular localization and stress responses of superoxide dismutase isoforms from leaves in the C3-CAM intermediate halophyte Mesembryanthemum crystallinum L. Plant Cell Environ. 1998, 21, 169–179. [Google Scholar] [CrossRef]
  87. Laemmli, U.K. Cleavage of structural proteins during assembly of the head of bacteriophage T4. Nature 1970, 227, 680–685. [Google Scholar] [CrossRef]
  88. Sharma, U.; Agrawal, V. In vitro shoot regeneration and enhanced synthesis of plumbagin in root callus of Plumbago zeylanica L.—an important medicinal herb. In Vitro Cell. Dev. Plant 2018, 54, 423–435. [Google Scholar] [CrossRef]
Figure 1. In vitro culture (a) and plants (b) of Ceylon leadwort (P. zeylanica) after 4 weeks of culture on the media with different Pb concentration. Scale bar, 5 cm.
Ijms 21 01866 g001
Figure 2. Lead content in shoots (a) and roots (b) of Ceylon leadwort (Plumbago P. zeylanica) depending on Pb concentration in the medium after 4 weeks of culture (different letters—statistically significant difference within each organ at p ≤ 0.05).
Ijms 21 01866 g002
Figure 3. Photosynthetic apparatus efficiency of Ceylon leadwort (P. zeylanica) plants depending on Pb concentration in the medium after 4 weeks of culture; (a) chlorophylls and carotenoids content; (b) Chl a/b ratio; c) Car/Chl a+b ratio; (d) extracted and calculated fast kinetics Chl a fluorescent parameters; e) slow kinetics Chl a fluorescence parameters; (fh) photosynthetic proteins’ content (e) Lhcb1; (f) D1(PsbA); (g) PsbO; (h) RcbL (different letters—statistically significant difference within each parameter at p ≤ 0.05; (d,e) values are given in relation to control (set as 1); abbreviations—see Table 3; RU—relative units).
Ijms 21 01866 g003
Figure 4. Leaf anatomy and chloroplasts ultrastructure of Ceylon leadwort (P. zeylanica) after 4 weeks of culture on the media with different Pb concentration; (a) anatomy of leaf from control medium; (b) mesophyll cell of leaf from control medium; c) ultrastructure of chloroplasts from control medium d) ultrastructure of chloroplasts from medium with 0.05 g Pb∙l−1; (e) anatomy of leaf from medium with 0.1 g Pb∙l−1; (f) mesophyll cell of leaf from medium with 0.1 g Pb∙l−1; (g) and h) ultrastructure of chloroplasts from medium with 0.1 g Pb∙l−1. Abbreviations: ue—upper epidermis, le—lower epidermis, pp—palisade parenchyma, sp—spongy parenchyma, ps—parenchyma sheath, vb—vascular bundle, ch—chloroplast, mt—mitochondrion, v—vacuole, cw—cell wall, s—stroma, ss—swollen stroma, g—grana, lt—loose thylakoids, pl—plastoglobule. Scale bars, 50 µm (a,e), 5 µm (b,f), 1 µm (c,d,g,h).
Ijms 21 01866 g004
Figure 5. Antioxidant enzyme activity or content of Ceylon leadwort (P. zeylanica) shoots after 4 weeks of culture on the media with different Pb concentration; (a) activity of different superoxide dismutase (SOD) isoforms; (b) catalase (CAT) content; (c) content of thylakoid (t), stromal (s) and peroxisomal (p) ascorbate peroxidise (APX) (different letters—statistically significant difference within each parameter at p ≤ 0.05; RU-relative units).
Ijms 21 01866 g005
Table 1. Growing parameters of Ceylon leadwort (P. zeylanica) plants depending on Pb concentration in the medium after 4 weeks of culture (different letters—statistically significant difference within each parameter at p ≤ 0.05).
Pb Concentration [g/l]Parameters [±SD]
Growth Index [%]Shoot Dry Weight Content [%]Rooting [%]Root Length [cm]Root Dry Weight Content [%]
0.0 (control)69.0a ±12.211.1b ±1.192.0a ±9.86.3a ±1.612.7a ±1.7
0.0573.5a ±10.311.2b ±0.996.0a ±8.95.0b ±1.013.3a ±1.2
0.171.8a ±13.912.4a ±0.974.3b ±19.04.3c ±1.312.2a ±1.3
Table 2. Lipid peroxidation level and phenolic compounds content in shoots and roots of Ceylon leadwort (P. zeylanica) plants depending on Pb concentration in the medium after 4 weeks of culture (different letters—statistically significant difference within each parameter and organ at p ≤ 0.05).
Pb
Concentration
[g/l]
OrganParameters [±SD]
MDA*
[nM∙g−1DW]
TP
[mg∙g−1DW]
CAD
[mg∙g−1DW]
FLAV
[mg∙g−1DW]
ANT
[mg∙g−1DW]
PLUMB
[mg∙g−1DW]
0.0 (control)shoot180.9b ± 2.444.6a ± 0.712.0a ± 0.711.0a ± 0.74.4b ± 0.433.3a ± 3.5
0.05179.8b ± 5.141.6b ± 0.712.4a ± 0.511.5a ± 0.53.0a ± 0.230.4a± 0.5
0.1185.7a ± 2.839.5c ± 2.011.2a ± 1.39.6b ± 1.21.7c ± 0.428.5a ± 1.0
0.0 (control)root261.3a± 16.327.8b ± 1.55.1a ± 0.22.7a ± 0.11.0a ± 0.114.7a ± 1.0
0.05236.7a± 11.537.5a ± 0.84.3b ± 0.22.3b ± 0.20.7b ± 0.113.2b ± 0.8
0.1251.3a± 5.943.9a ± 8.13.7c ± 0.32.2b ± 0.20.7b ± 0.112.1b ± 0.0
* MDA—malondialdehyde; TP—total phenols; CAD—cinnamic acid derivatives; FLAV—flavonoles; ANT—anthocyanins; PLUMB—plumbagine.
Table 3. Extracted and calculated parameters of fast kinetics Chl a fluorescence (according to Jiang et al. [63], Kalaji et al. [83]).
Extracted parametersCalculated parameters
FOMinimum fluorescence, when all PSII reaction centers (RCs) are openFvvariable fluorescence; Fm − F0
FMMaximum fluorescence, when all PSII reaction centers are closedFv/Fmmaximum quantum yield of PSII; (Fm − F0)/Fm
F50μs, F100μs, F300μs, F2ms, F30 msFluorescence intensities at 50, 100, 300 μs, 2, 30 ms, respectivelyFv/F0activity of the water-splitting complex on the donor side of the PSII; (Fm − F0)/F0
Area Total complementary area between fluorescence induction curve and F = Fm
OJIP parameters (calculated)Yields or flux ratios (calculated)
VJRelative variable fluorescence at 2 ms (J-step); VJ = (F2msFo)/(FmFo)φPoMaximum quantum yield of primary photochemistry at t = 0; φPo = 1Fo/Fm = Fv/Fm
VIRelative variable fluorescence at 30 ms (I-step); VI = (F30msFo)/(FmFo)φEoQuantum yield for electron transport at t = 0; φEo = (Fv/Fm)(1VJ)
Sm Normalized total complementary area above the OJIP transient (reflecting multiple-turnover QA reduction events) or total electron carriers r RC; Sm = Area/(FmFo)ψEoProbability (at time 0) that trapped exciton moves an electron into the electron transport chain beyond; ψEo = 1VJ
ρRoEfficiency with which a trapped exciton can move an electron into the electron transport chain from QA‾ to the PSI and electron acceptors; ρRo = ψEoδRo = (1VJ)(1VI)/(1VJ)
δRoEfficiency with which an electron can move from the reduced intersystem electron acceptors to the PSI end electron acceptors; δRo = REo/ETo = (1VI)/(1VJ)
φRoQuantum yield for the reduction of end acceptors of PSI per photon absorbed; φRo = REo/ABS = φPoψEoδRo
Specific fluxes or activities per reaction center (RC) (calculated)Phenomenological fluxes or activities per excited cross section (CS) (calculated)
ABS/RCAbsorption flux per RC; ABS/RC = Mo/VJ = 4(F300μsFo)/(FmFo)/VJTRo/CSoTrapped energy flux per CS at t = 0; TRo/CSo = (ABS/CSoPo
TRo/RCTrapped energy flux per RC at t = 0; TRo/RC = Mo/VJETo/CSoElectron transport flux per CS at t = 0; ETo/CSo = (ABS/CSo)φEo
ETo/RCElectron transport flux per RC at t = 0; ETo/RC = (Mo/VJ)ψEoDIo/CSoDissipated energy flux per CS at t = 0; DIo/CSo = ABS CSoTRo/CSo
DIo/RCDissipated energy flux per RC at t = 0; DIo/RC = ABS/RCTRo/RC
Density of reaction centers (calculated)
RC/CSoAmount of active PSII RCs per CS at t = 0; RC/CSo = φPo(ABS/CSo)(VJ/Mo)

