Quantitative Phosphoproteomic and Physiological Analyses Provide Insights into the Formation of the Variegated Leaf in Catalpa fargesii

 ,
,
Abstract
:1. Introduction
2. Results
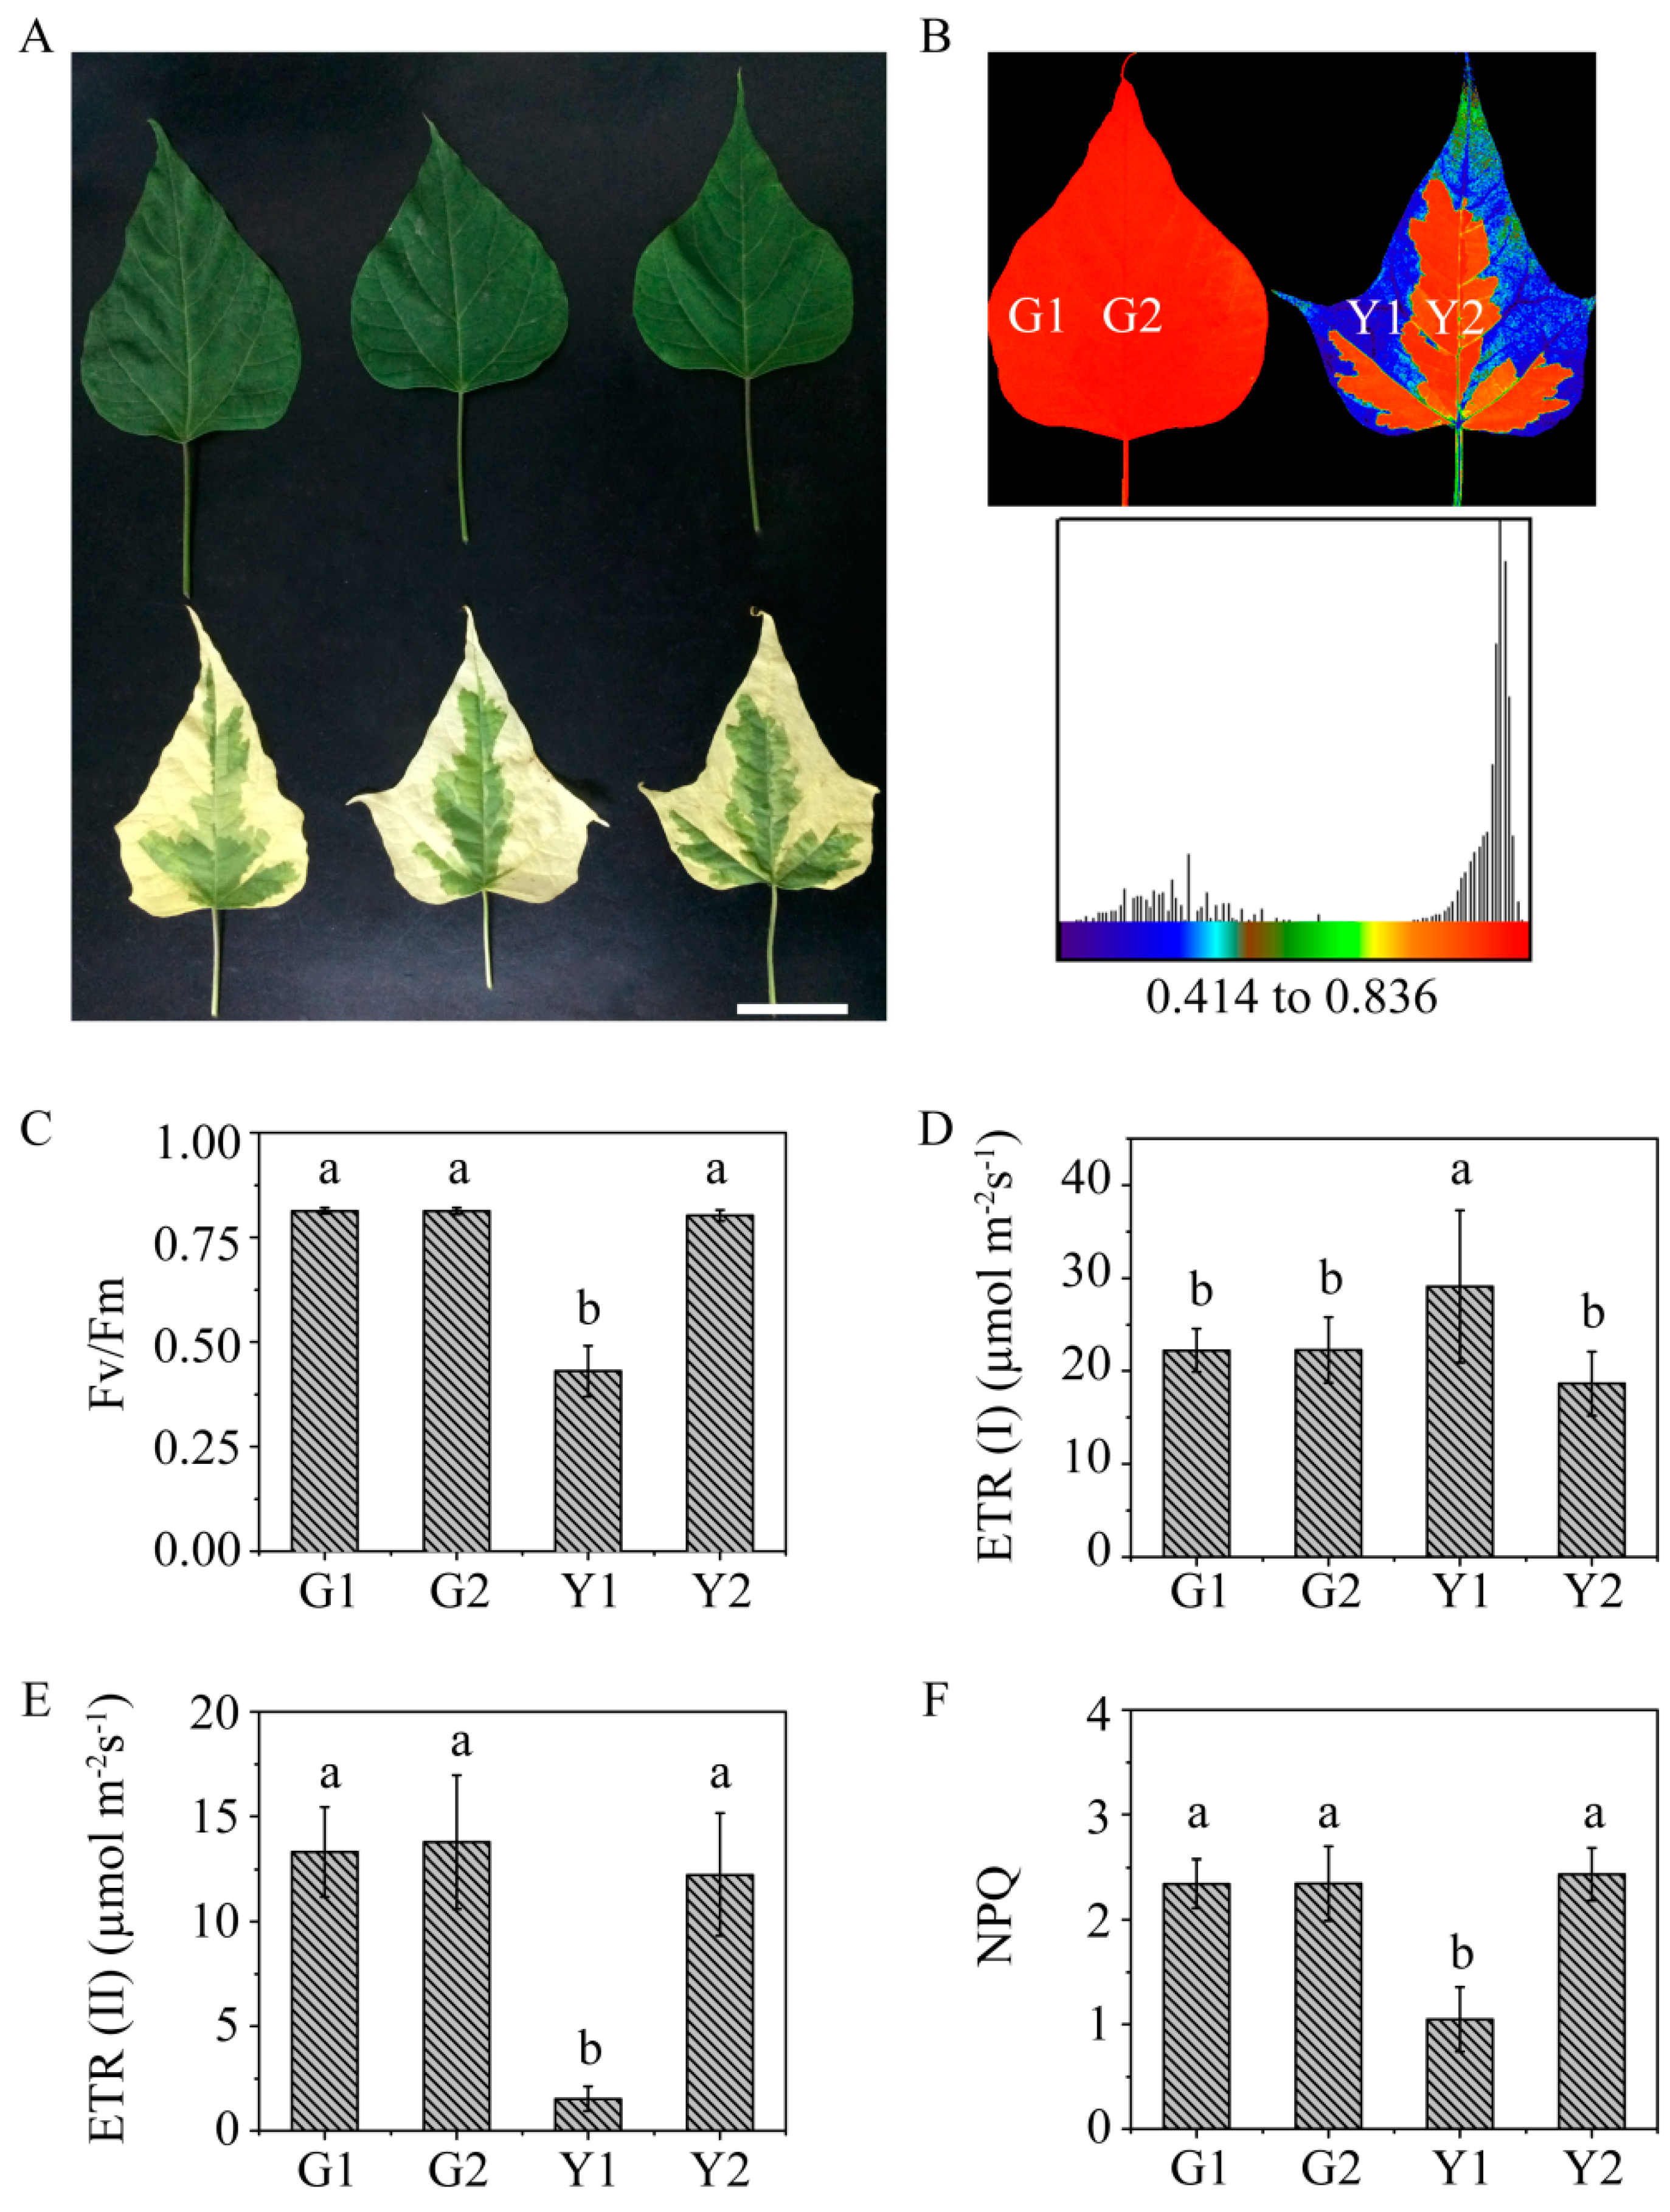
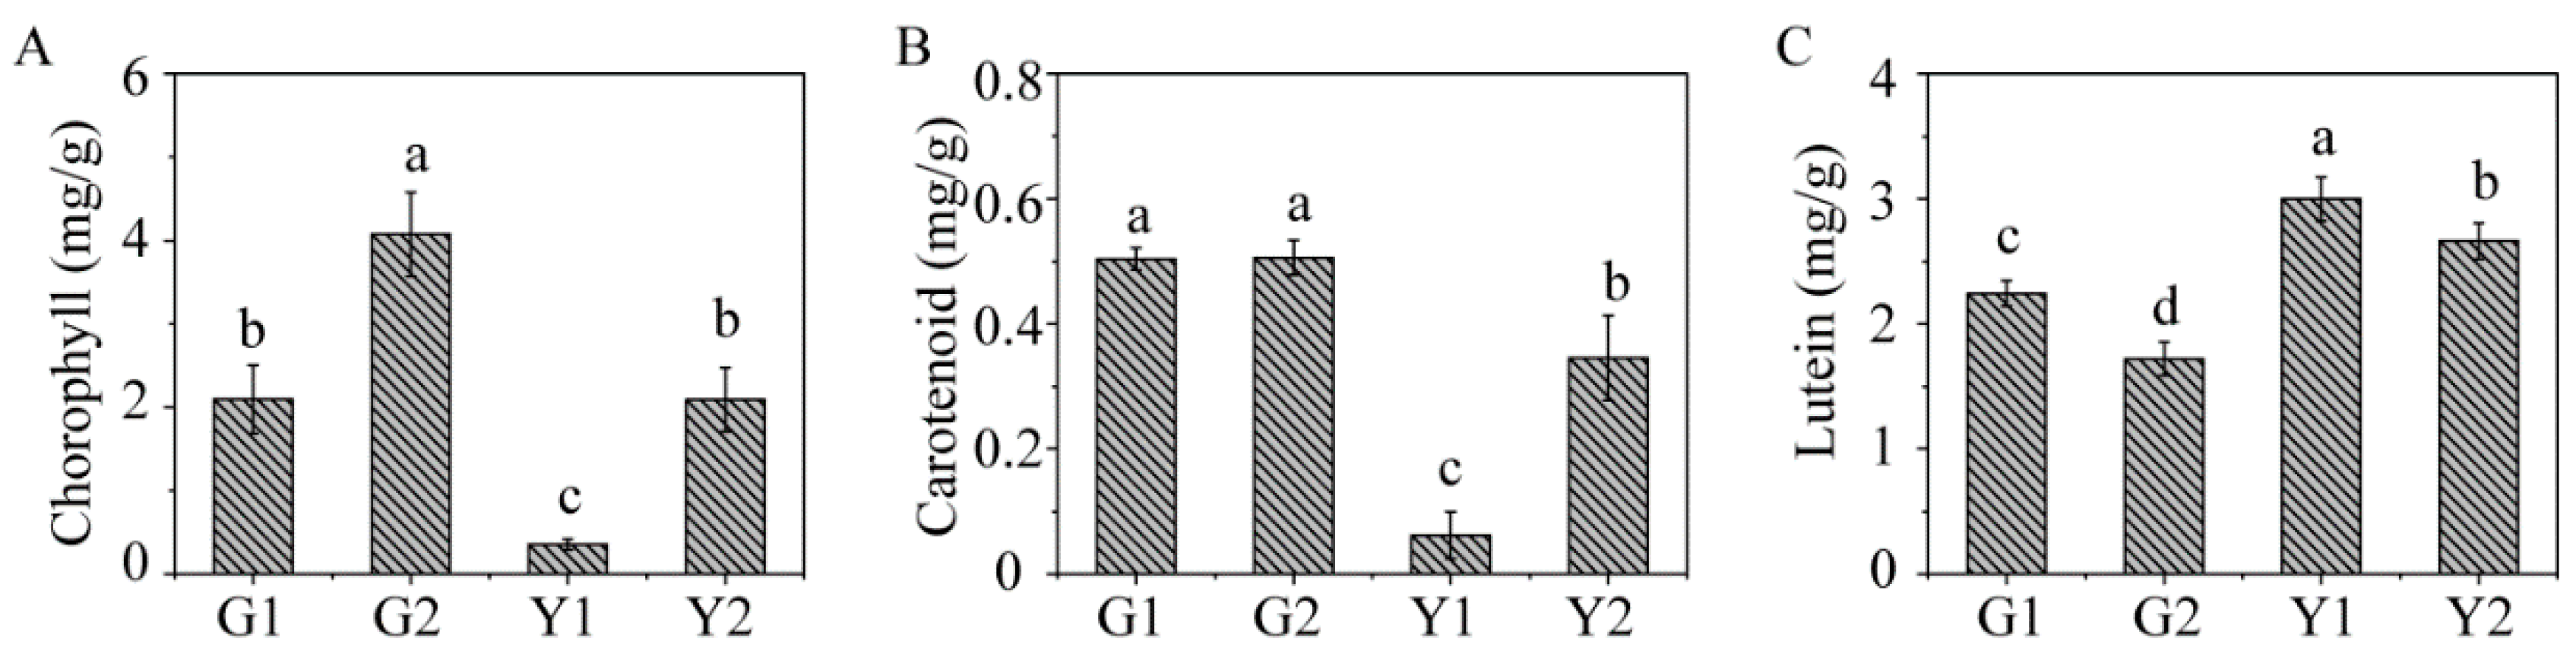
2.1. Phenotypic Character and Physiological Parameters in Maiyuanjinqiu and C. fargesii
2.2. Analyses of Global Phosphorylated Proteins and Sites in Maiyuanjinqiu and C. fargesii
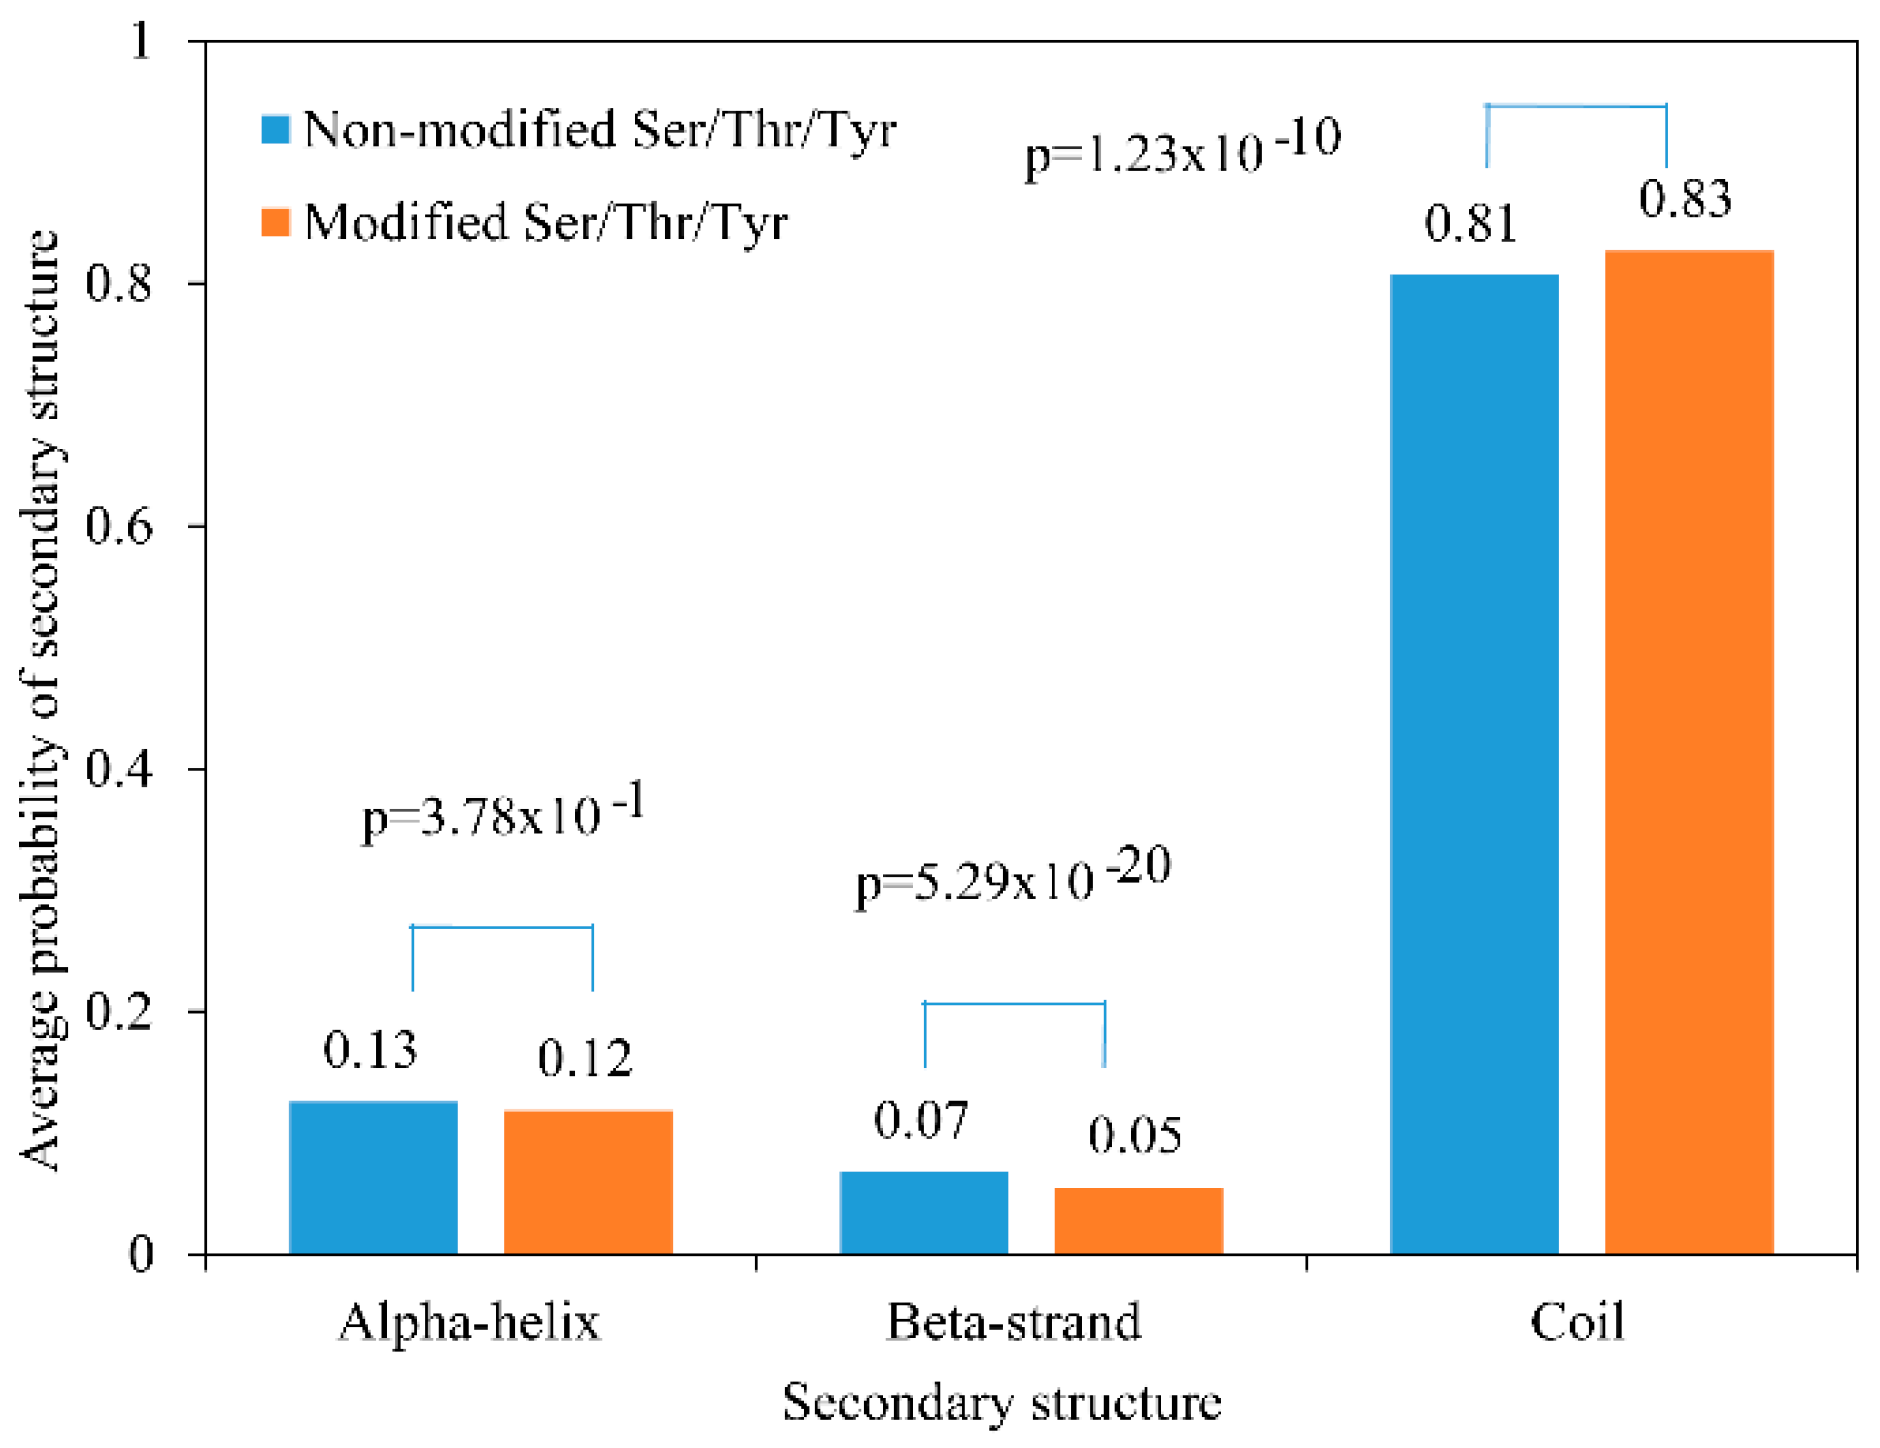
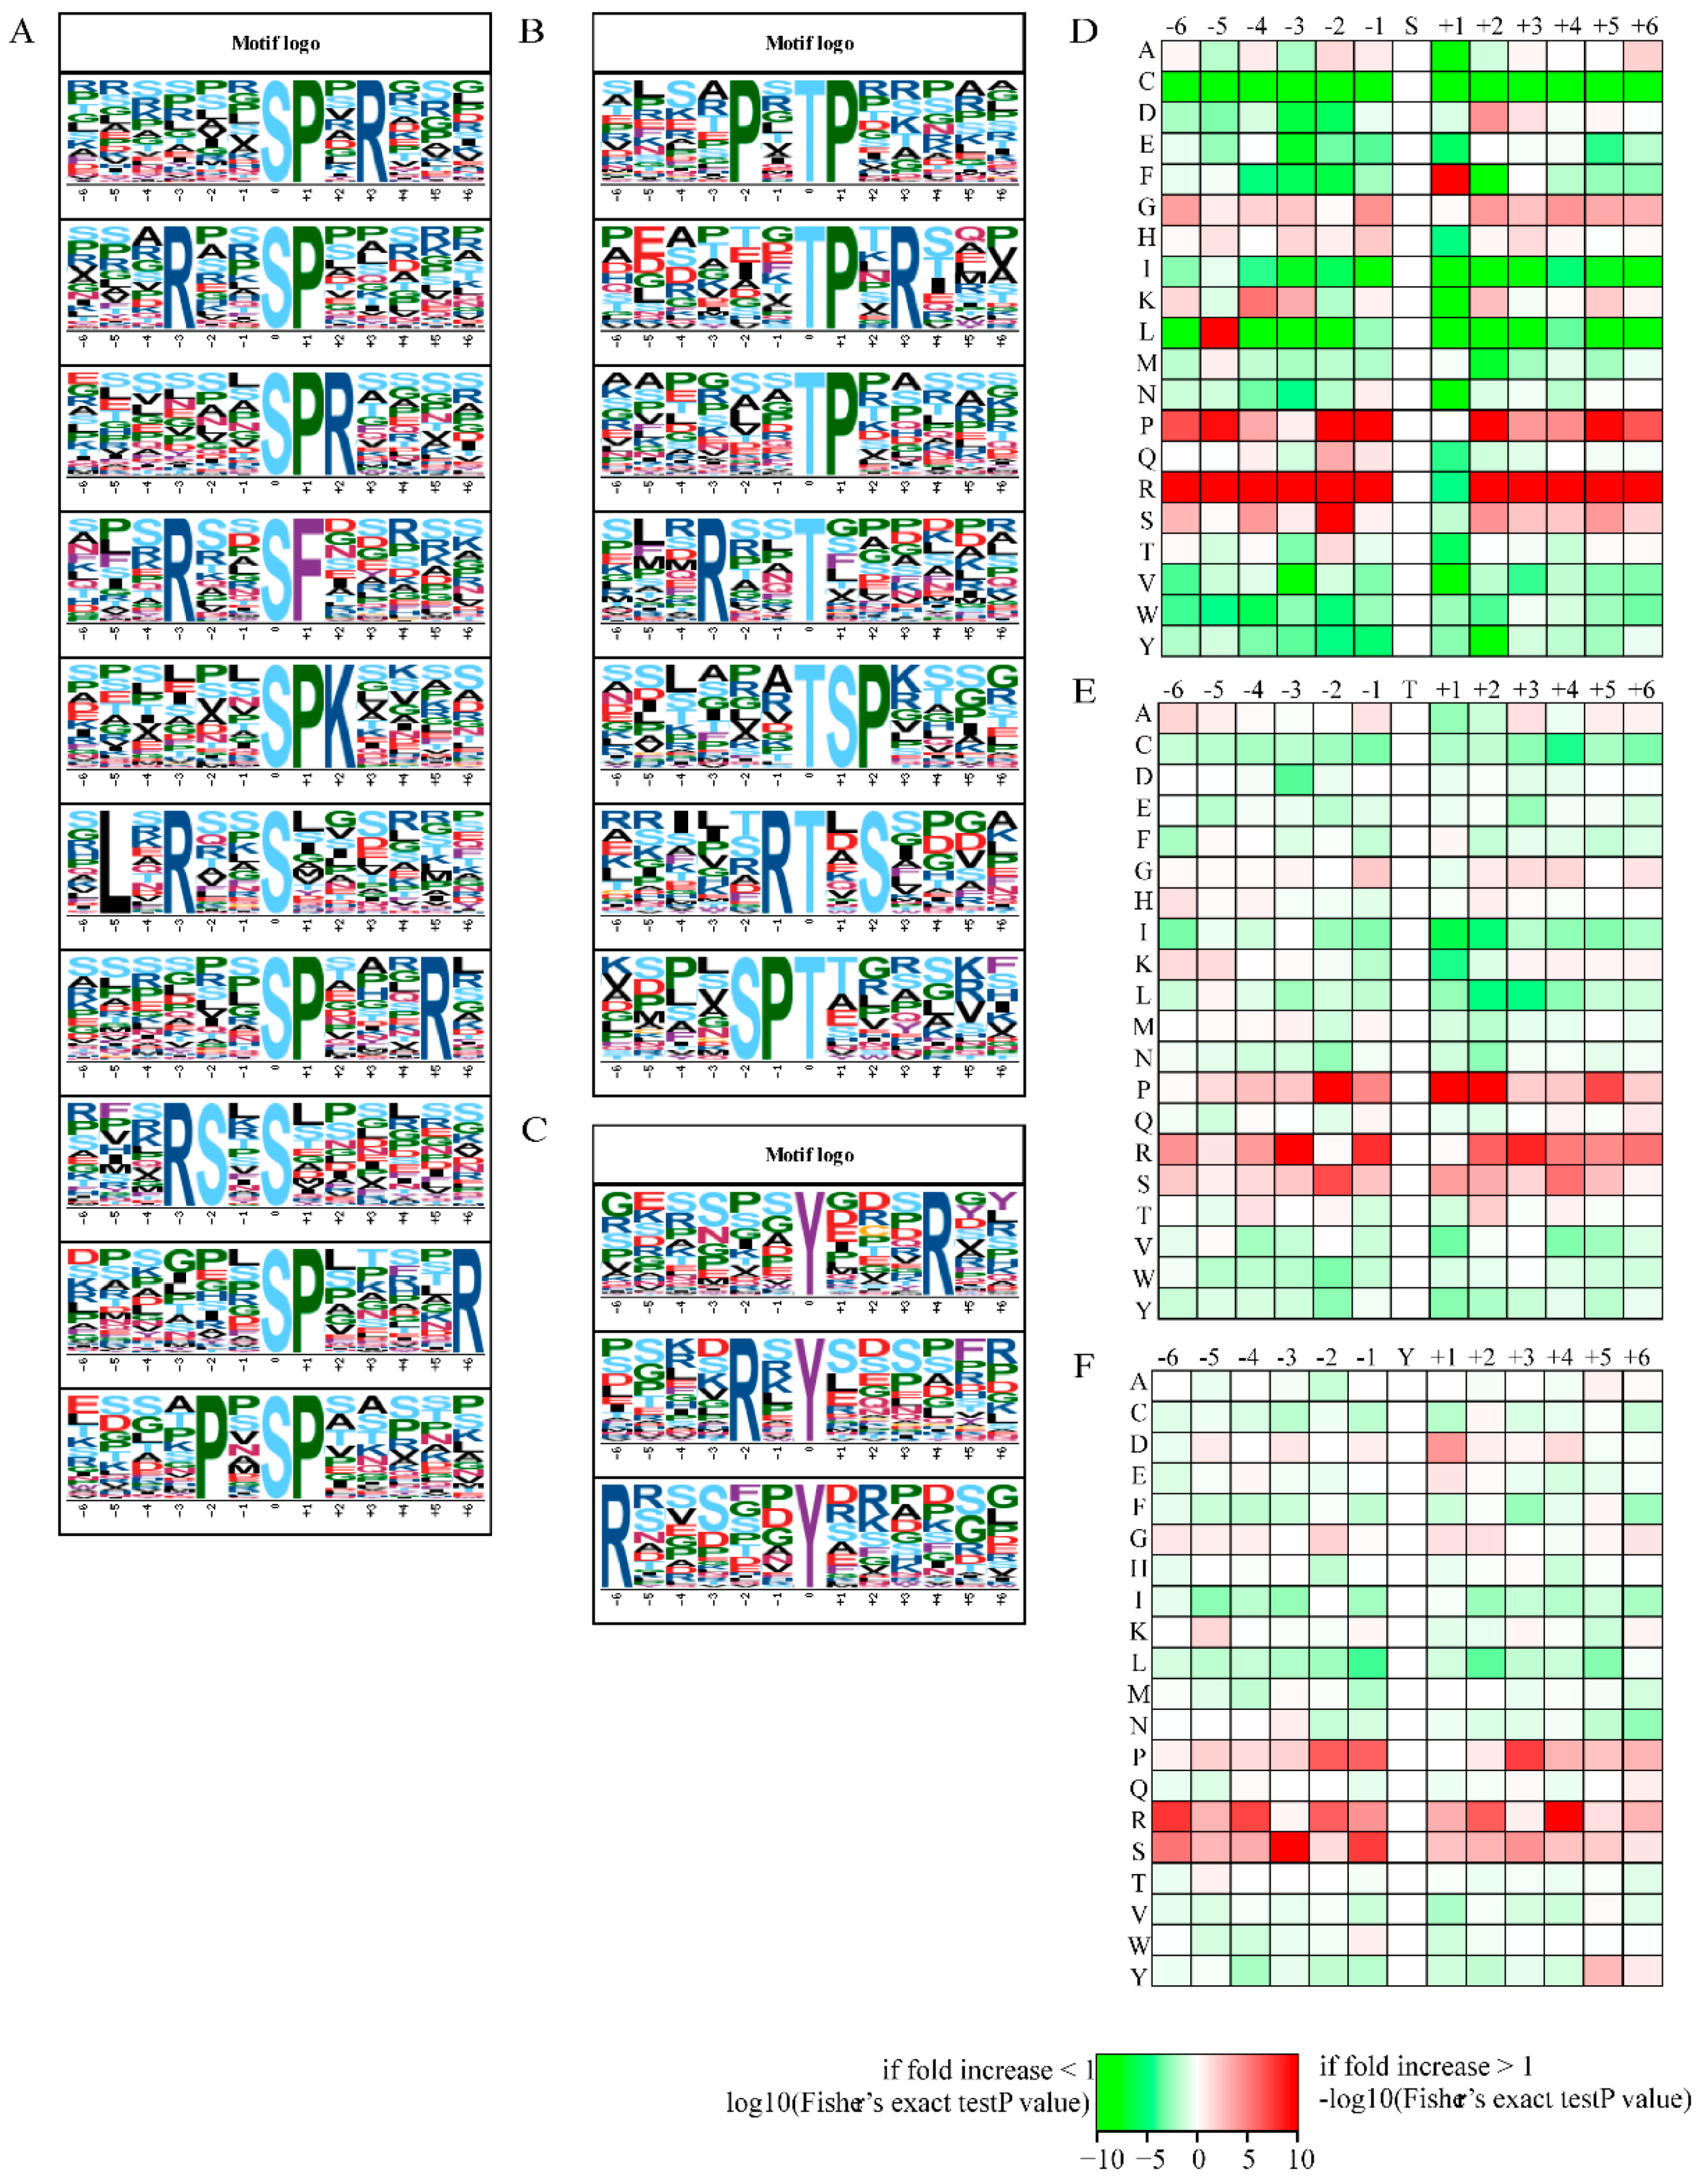
2.3. Secondary Structure and Motif Analysis of Phosphoproteins
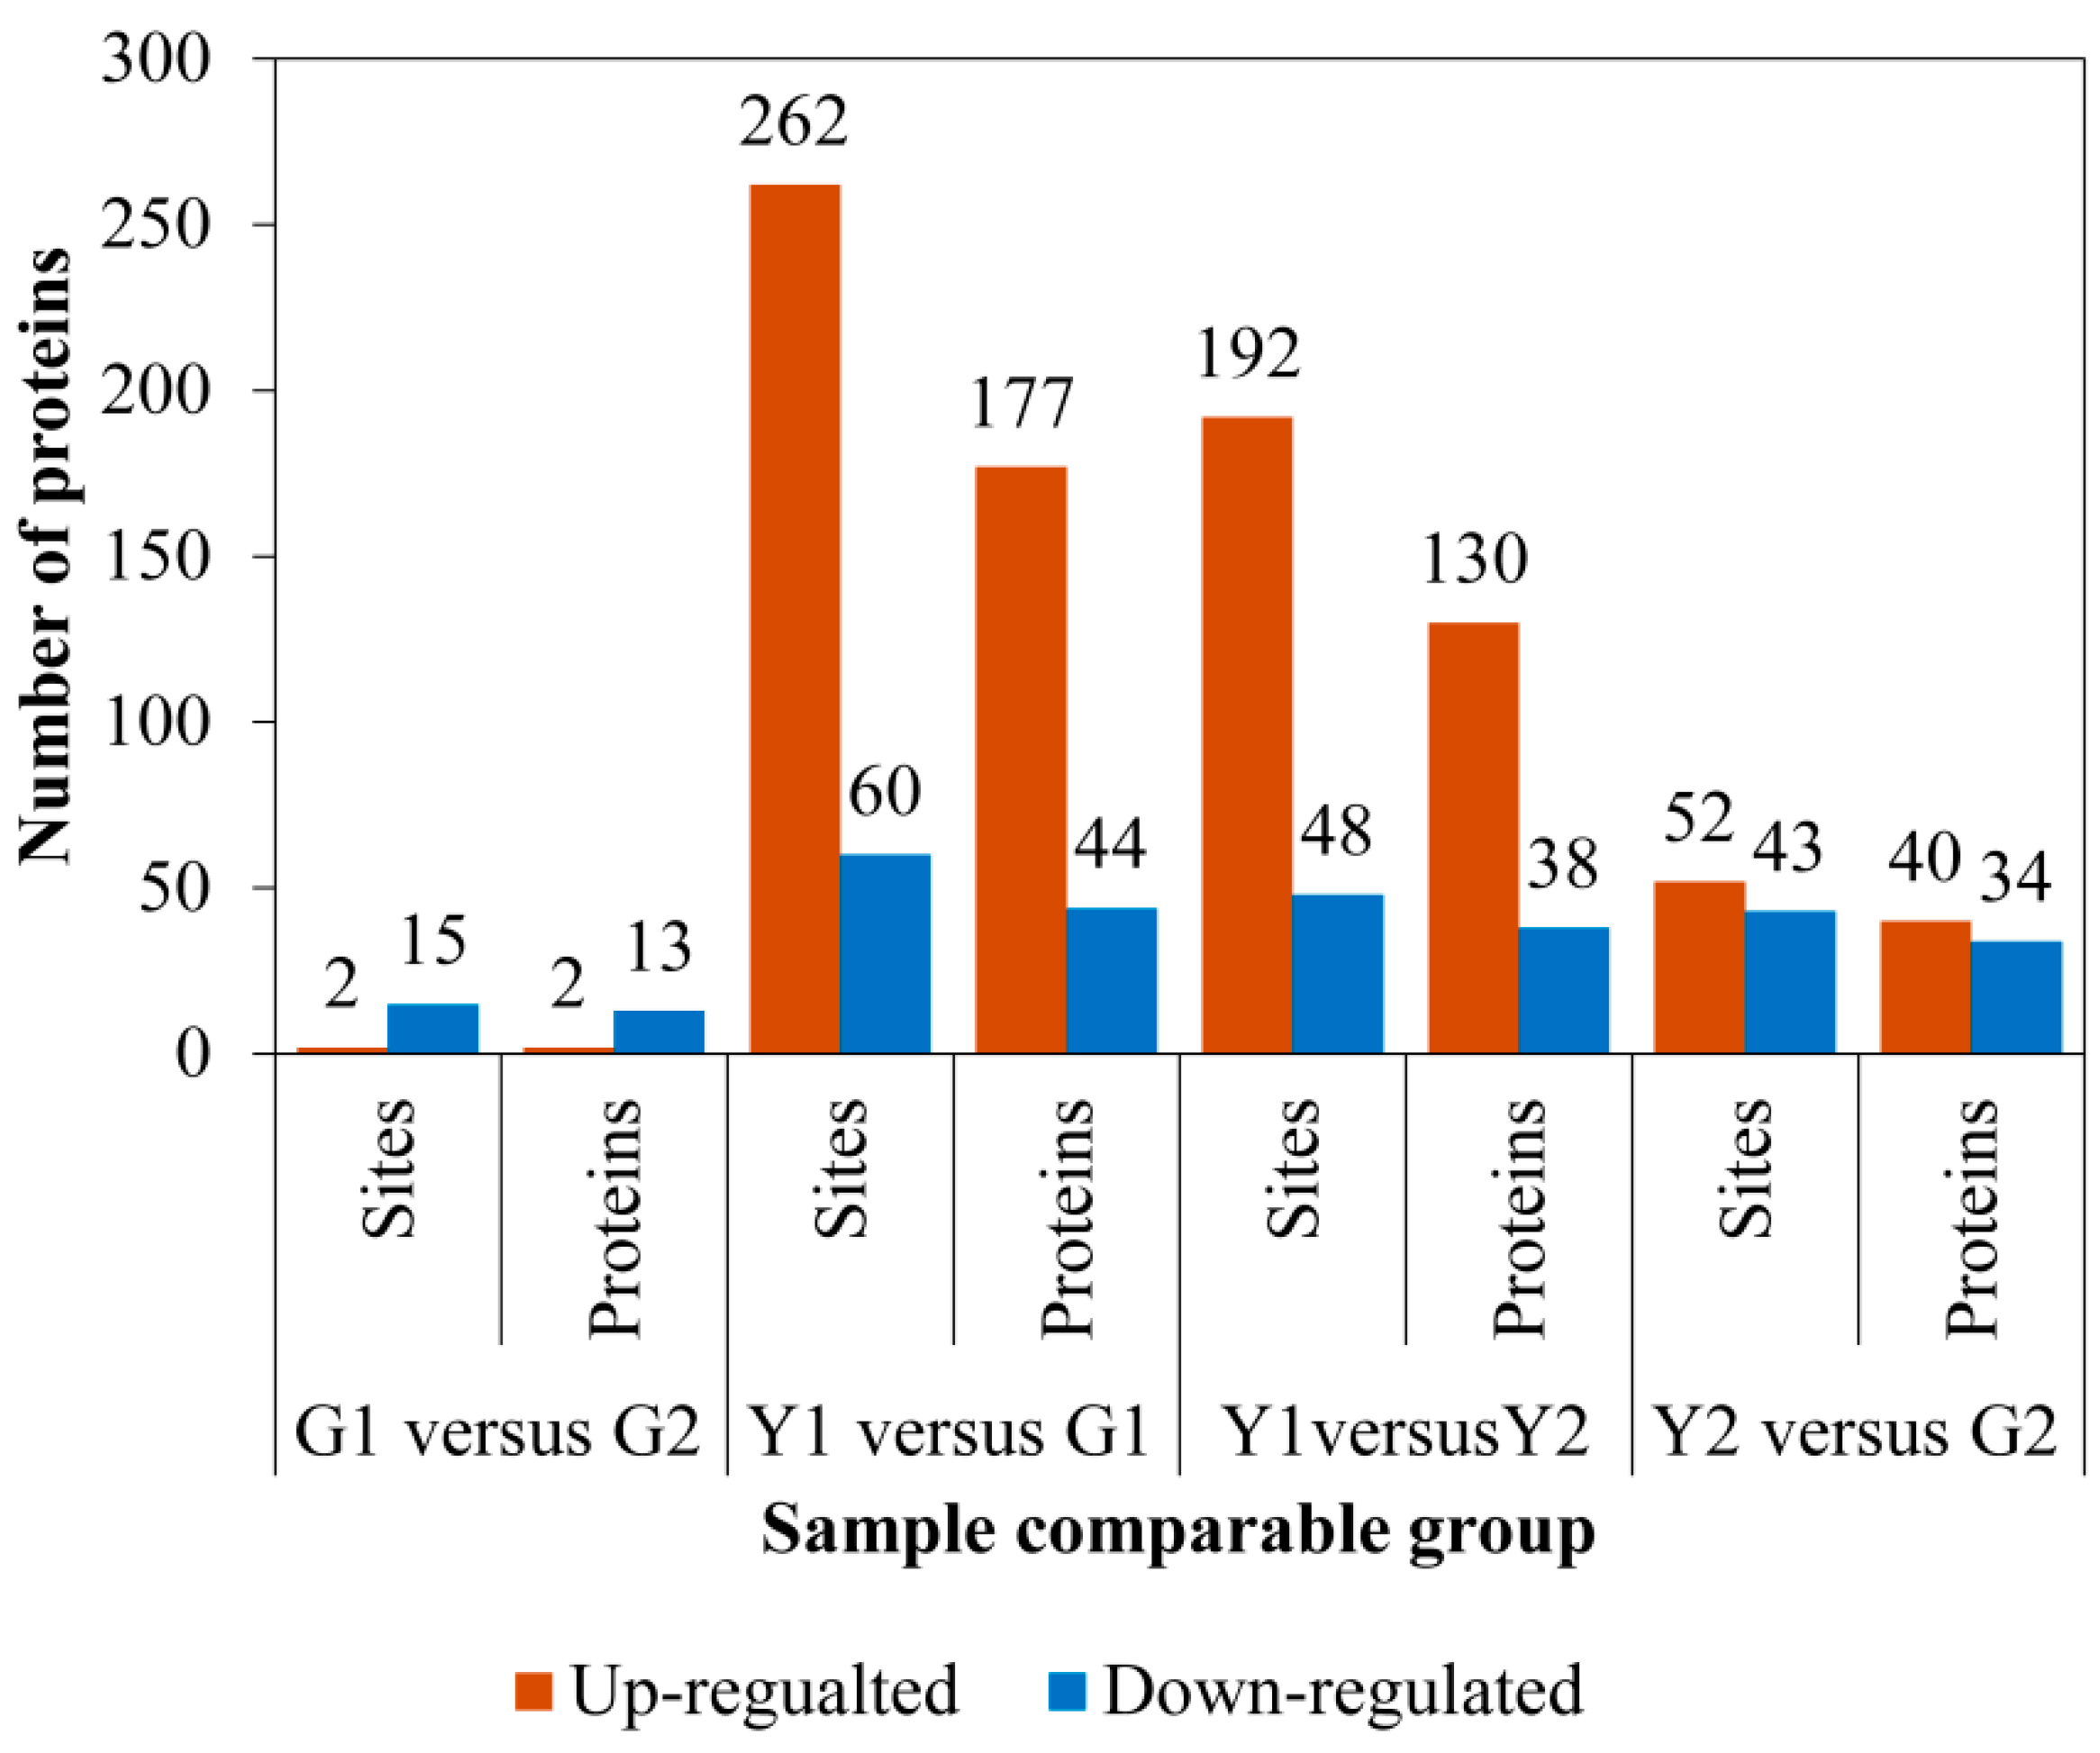
2.4. Identification of Differential Phosphoproteins (DPs)
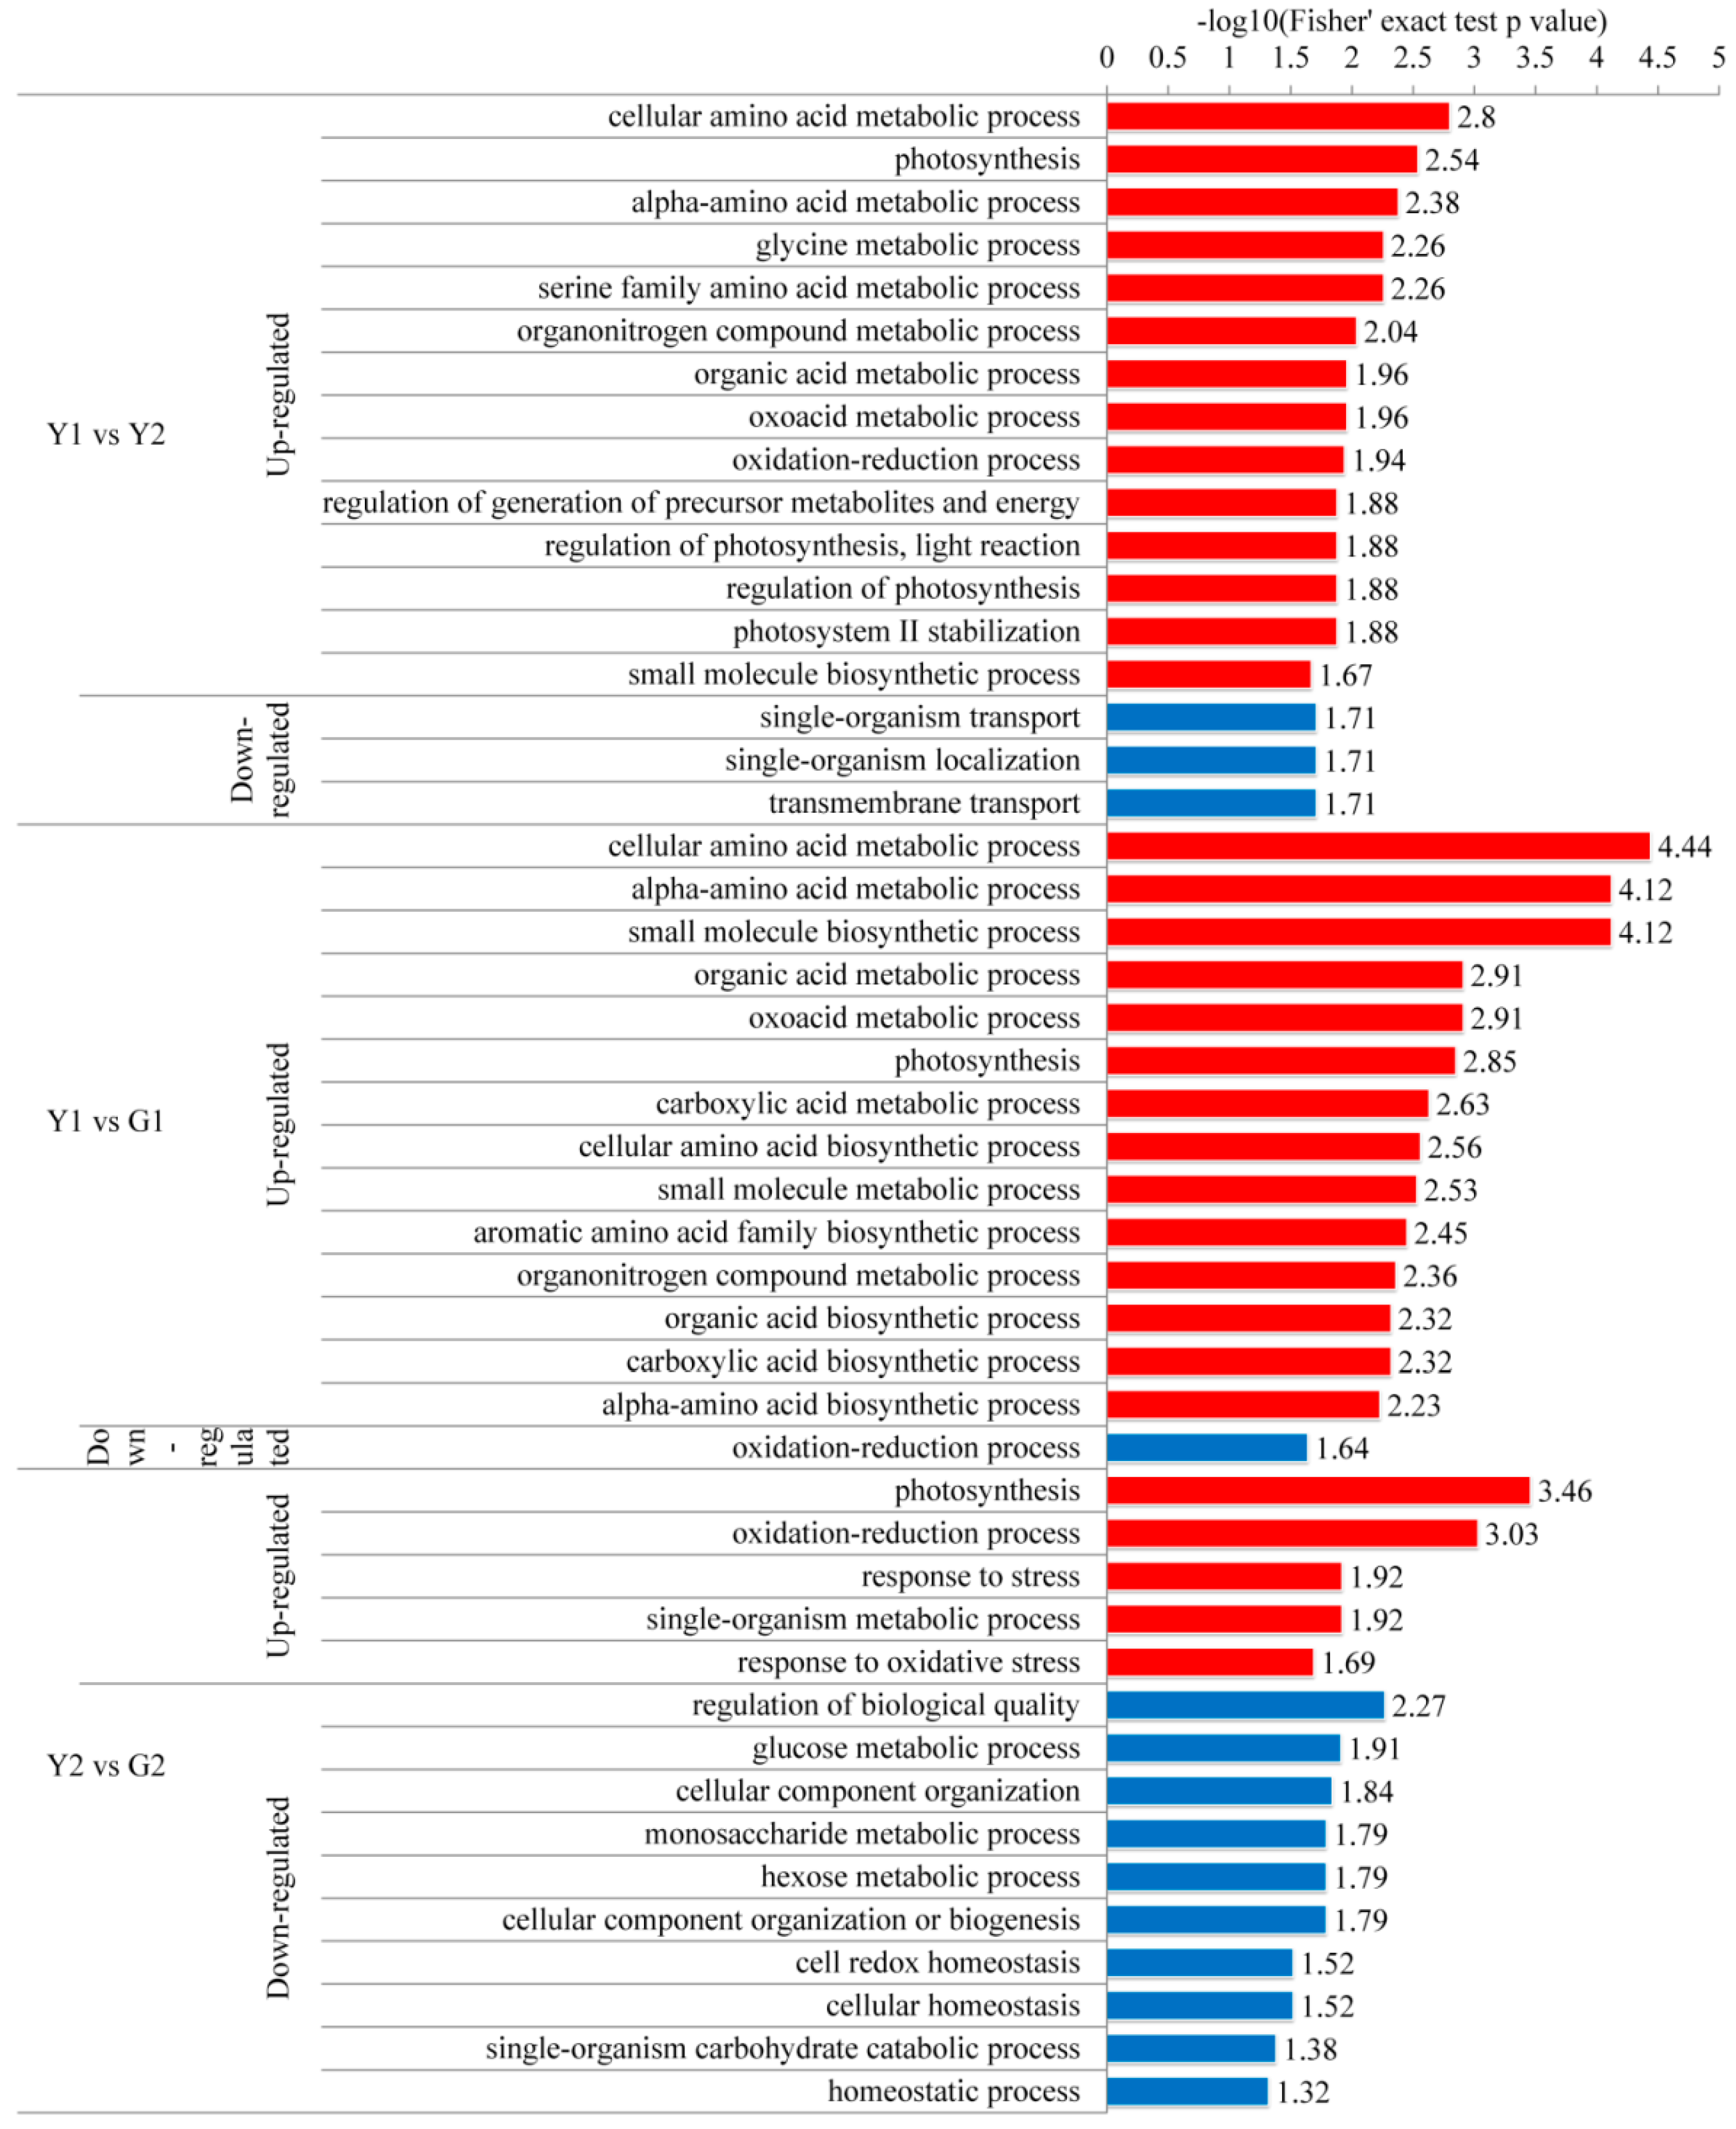
2.5. Gene Ontology (GO) Functional Classification, Subcellular Localization, and GO Enrichment Analysis
2.6. Domain Enrichment Analysis
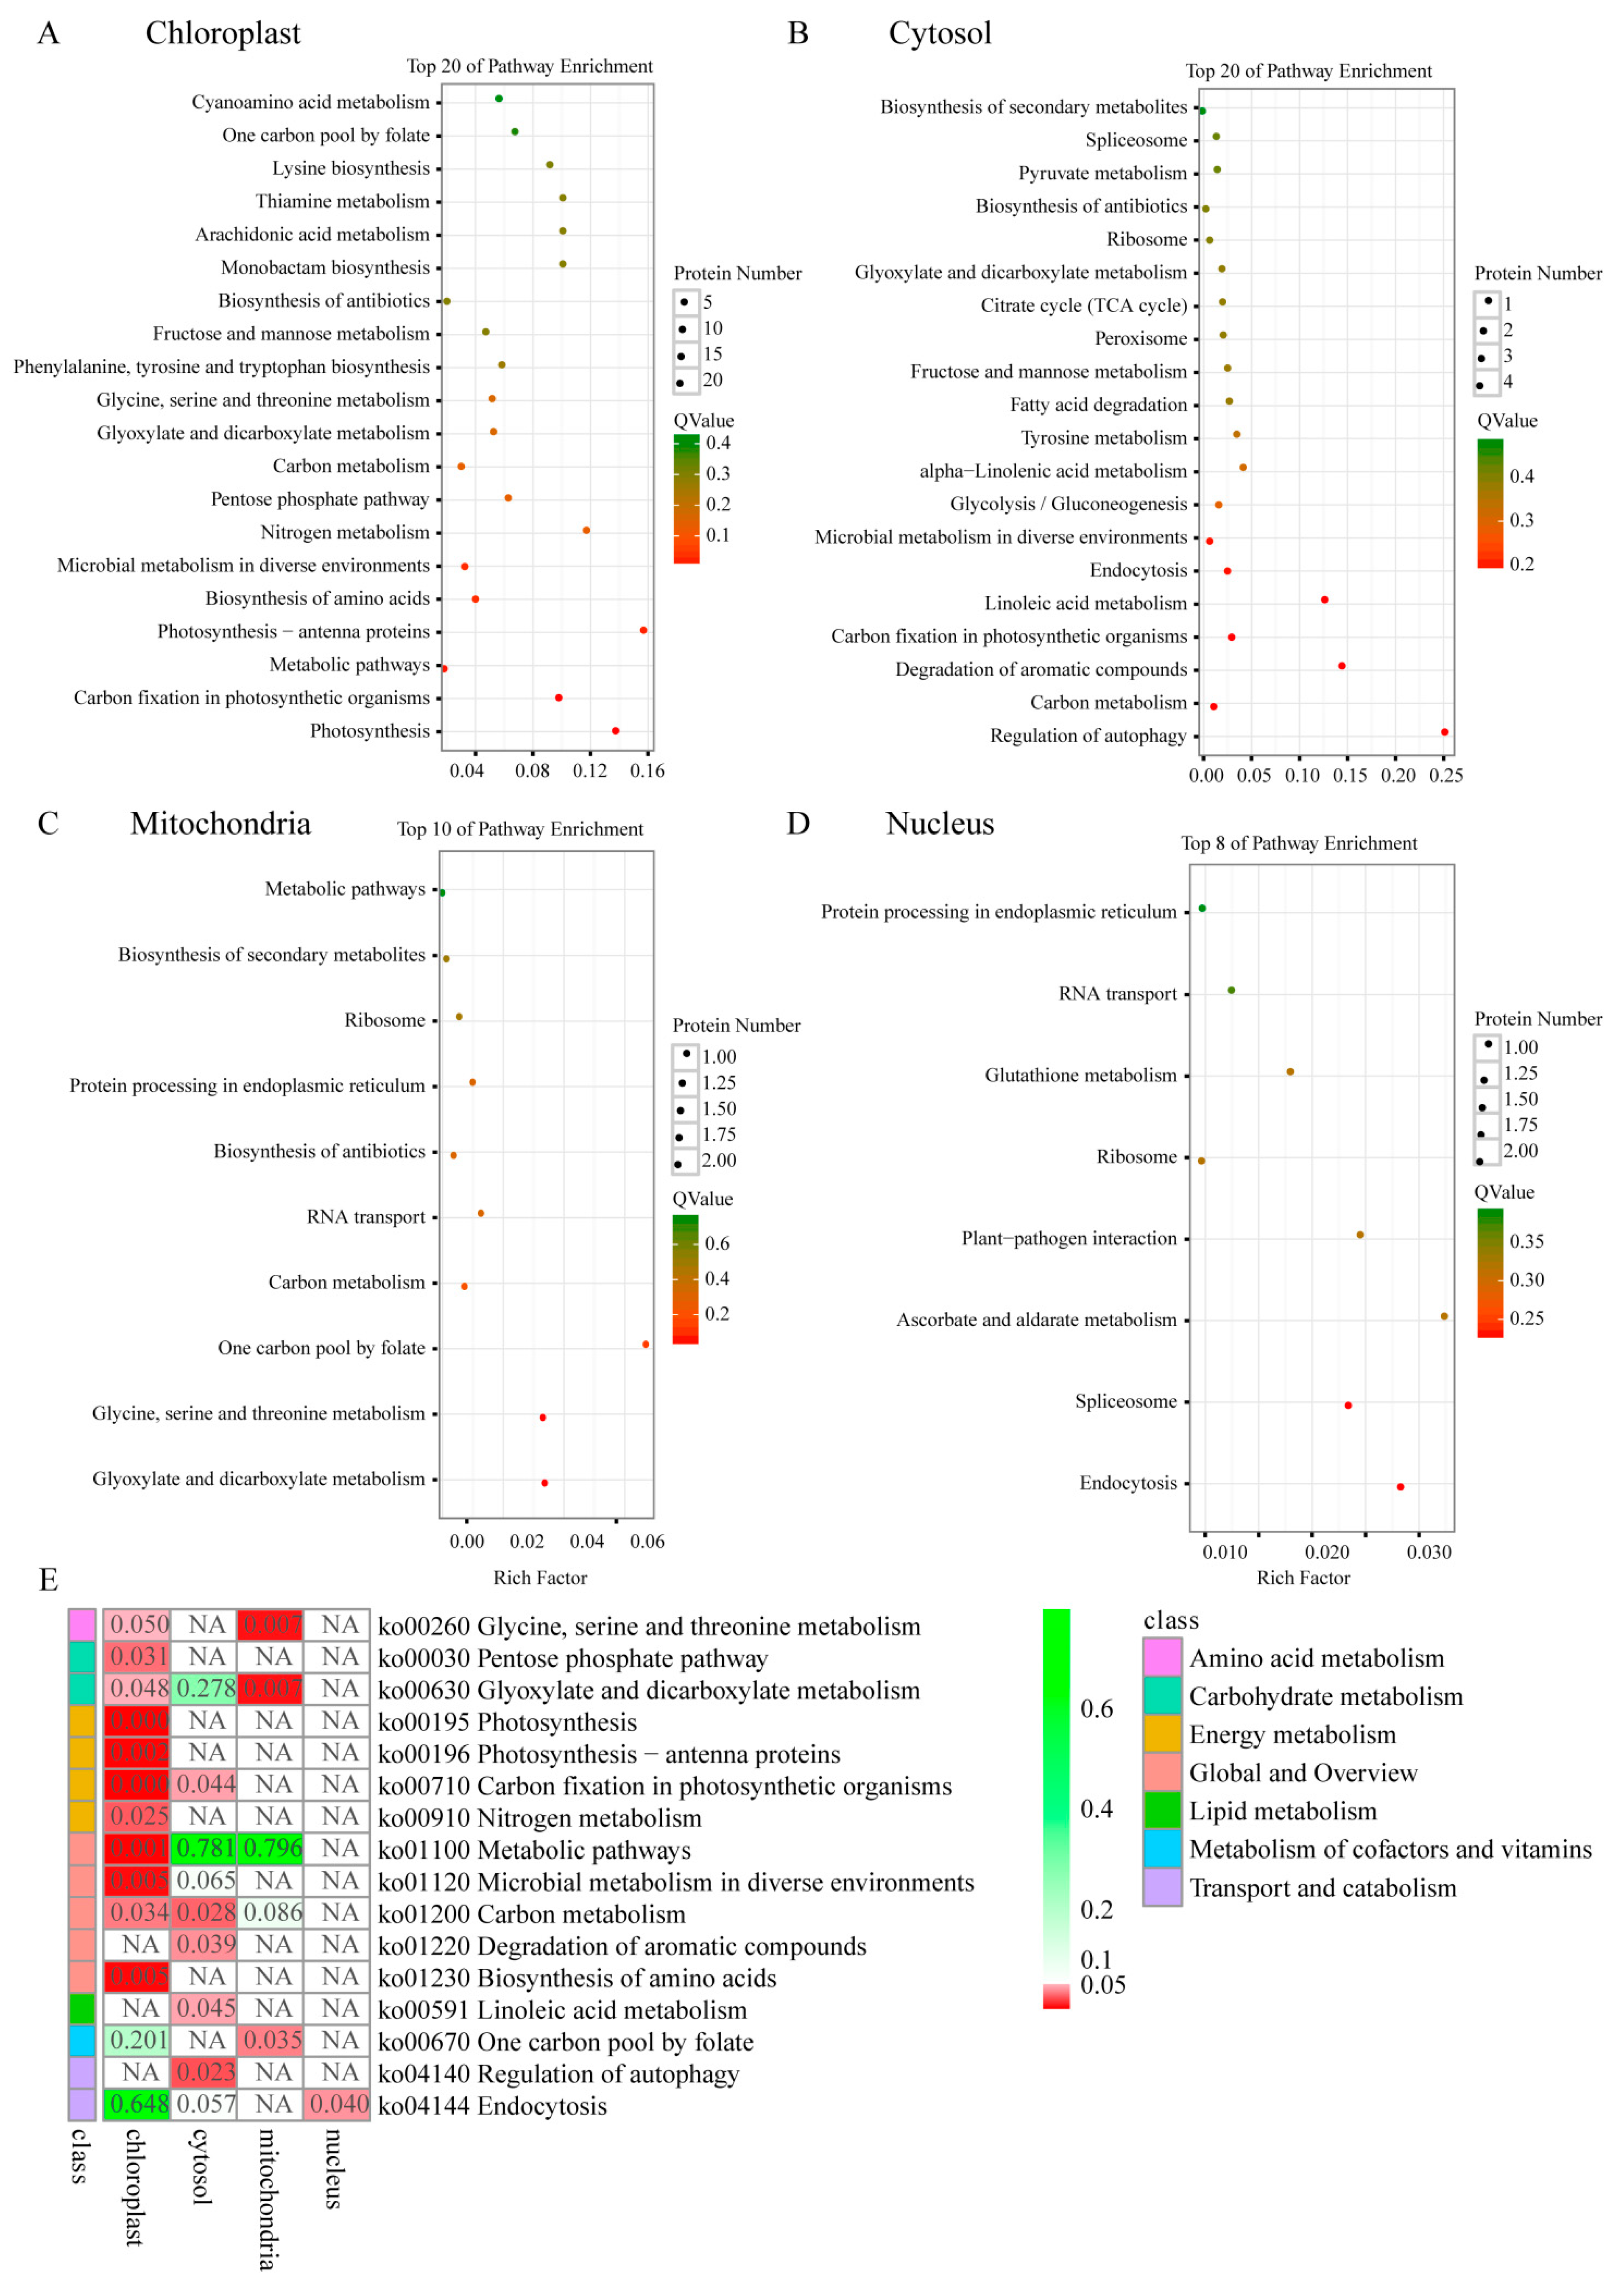
2.7. KEGG Pathway of Differential Phosphoproteins in Different Sectors of Maiyuanjinqiu
2.8. Protein–Protein Interaction (PPI) Network of Phosphoproteins
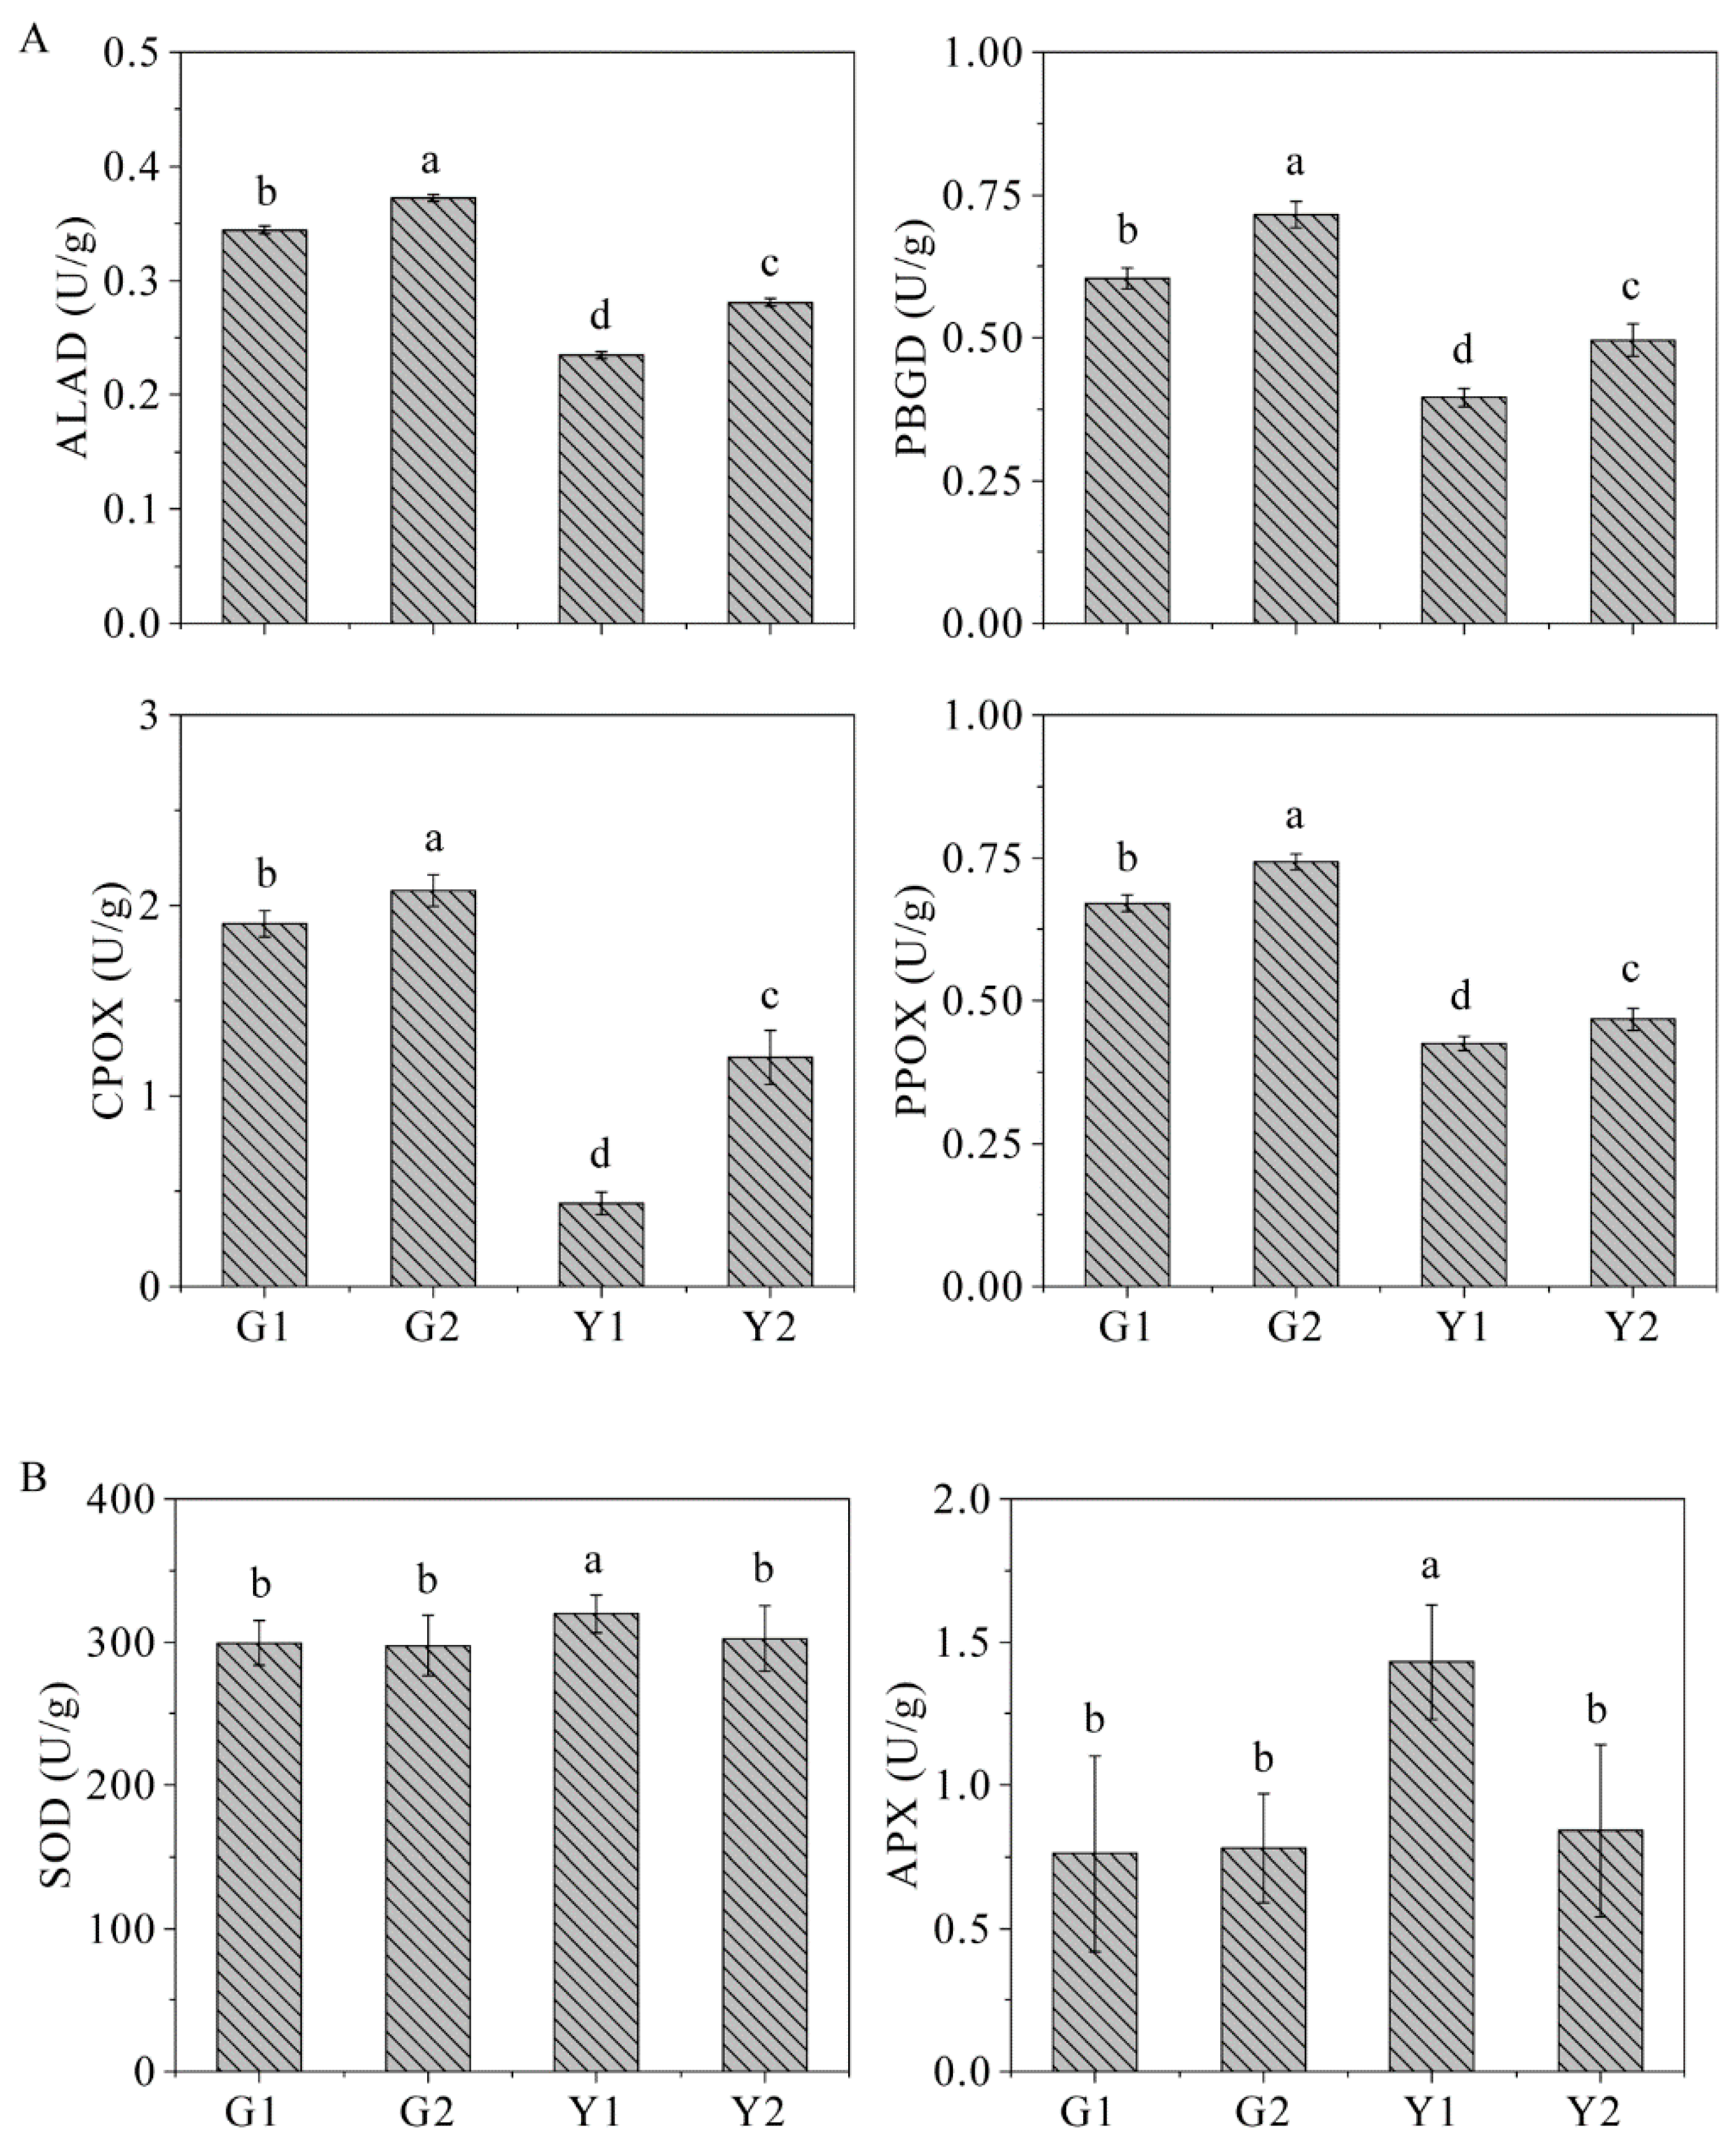
2.9. The Key Enzyme Activities
3. Discussion
3.1. Global Analysis of Phosphorylome Profiling Associated with Leaf Color
3.2. DPs Involved in Pigment Biosynthesis and Photosynthesis
3.3. DPs Involved in Energy Metabolism
3.4. DPs Involved in Stress Response and Defense
3.5. DPs Involved in Protein Homeostasis
3.6. DPs Involved in Transcriptional Regulation and Transport
4. Materials and Methods
4.1. Plant Material
4.2. Determination of Photosynthetic Fluorescence Parameters and Pigment Contents
4.3. Protein Extraction, Trypsin Digestion, and TMT Labeling
4.4. HPLC Fractionation and Affinity Enrichment
4.5. LC-MS/MS Analysis
4.6. Database Search and Data Analysis
4.7. Bioinformatics Methods
4.8. Key Enzyme Activities
5. Conclusions
Supplementary Materials
Author Contributions
Funding
Acknowledgments
Conflicts of Interest
Abbreviations
| Fv/Fm | Maximum quantum yield of PSII |
| ETR | Electron transport rate |
| NPQ | Non photochemical quenching |
| PS | Photosystem |
| LC-MS/MS | Liquid chromatography–mass spectrometry/mass spectrometry |
| GO | Gene ontology |
| DPs | Differential phosphoproteins |
| LHCB | Chlorophyll a-b binding protein |
| ATPF 1G | ATP synthase subunit gamma |
| PsbO | Oxygen-evolving enhancer protein 1 |
| PsbP | Oxygen-evolving enhancer protein 2 |
| PsbQ | Oxygen-evolving enhancer protein 3 |
| PsbR | Photosystem II reaction center protein H |
| PsbH | Photosystem II reaction center protein H |
| LHCB | Chlorophyll a-b binding protein |
| PsaE | Putative Photosystem I reaction center subunit IV |
| PsaF | Putative photosystem I reaction center subunit III |
| PC | Plastocyanin |
| GluTR | Glutamyl-tRNA reductase |
| NCED | 9-cis-epoxycarotenoid dioxygenase 1 |
| P450 | Cytochrome P450 family protein, expressed |
| 3.1.3.37 | Putative fructose-1,6-bisphosphatase |
| PRK | Phosphoribulokinase |
| rbcL | Ribulose bisphosphate carboxylase large chain |
| ALDO | Fructose-bisphosphate aldolase |
| GAPA | EST C74302 (E30840) corresponds to a region of the predicted gene |
| GAPDH | Glyceraldehyde-3-phosphate dehydrogenase 2, cytosolic |
| PGK | Phosphoenolpyruvate carboxykinase |
| PK | Pyruvate kinase |
| gpml | Putative 2, 3-bisphosphoglycerate-independent phosphoglycerate mutase |
| glgC | Glucose-1-phosphate adenylyltransferase |
| Glu | Glutamine syntheses |
| TrpA | Tryptophan synthase alpha chain |
| GLDC | Putative glycine dehydrogenase |
| GGAT | Alanine aminotransferase |
| gcvT | Aminomethyltransferase |
| AGXT | Serine-glyoxylate aminotransferase |
| asd | Aspartate-semialdehyde dehydrogenase family protein, expressed |
| SNF2 | SNF2 transcription factor |
| MYB | MYB transcription factor |
| H2B | Histone H2B |
| APX | Ascorbate peroxidase |
| RP | Ribosomal protein |
| EIF | Eukaryotic translation initiation factor |
| Clp | ATP-dependent Clp protease proteolytic subunit |
| FTSH1 | ATP-dependent zinc metalloprotease FTSH 1, chloroplastic |
| DNM | Putative dynamin homolog |
| GIDIL | Gibberellin receptor GID1L2 |
| lacZ | Glycoside hydrolase family 2 family protein |
| PMA | H-ATPase |
| ALAD | ALA dehydrogenase |
| PBGD | Porphobilinogen deaminase |
| CPOX | Coproporphyrinogen III oxidase |
| PPOX | Protoporphyrinogen IX oxidase |
| SOD | Superoxide dismutase |
| ELISA | Enzyme-linked immunosorbent assay |
Appendix A

| Protein Description (Abbreviation/Phosphorylated Amino Acid/Site) | G1 | G2 | Y1 | Y2 |
|---|---|---|---|---|
| Pigment biosynthesis | ||||
| Glutamyl-tRNA reductase (GluTR/S/55) | 0.53 | 0.69 | 2.37 | 0.92 |
| Porphobilinogen deaminase, chloroplastic (hemC/T/339) | 0.72 | 0.78 | 1.34 | 1.17 |
| 9-cis-epoxycarotenoid dioxygenase 1 (NCED/S/51) | 0.42 | 0.44 | 1.66 | 1.84 |
| Cytochrome P450 family protein, expressed (P450/S/251) | 0.53 | 0.74 | 1.17 | 1.52 |
| Cytochrome P450 family protein, expressed (P450/S/134) | 0.46 | 0.69 | 1.08 | 1.62 |
| Photosynthesis | ||||
| Oxygen-evolving enhancer protein 1 (PsbO/Y/252) | 0.26 | 0.34 | 3.29 | 0.95 |
| Oxygen-evolving enhancer protein 1 (PsbO/S/239) | 0.35 | 0.48 | 3.12 | 0.84 |
| Oxygen-evolving enhancer protein 1 (PsbO/S/174) | 0.20 | 0.27 | 3.02 | 0.88 |
| Oxygen-evolving enhancer protein 1 (PsbO/S/173) | 0.40 | 0.46 | 2.73 | 0.76 |
| Oxygen-evolving enhancer protein 1 (PsbO/S/141) | 0.50 | 0.67 | 2.65 | 0.80 |
| Oxygen-evolving enhancer protein 1 (PsbO/Y/187) | 0.37 | 0.48 | 2.64 | 0.83 |
| Oxygen-evolving enhancer protein 1 (PsbO/S/88) | 0.77 | 0.99 | 1.46 | 0.90 |
| Oxygen-evolving enhancer protein 1 (PsbO/S/153) | 0.77 | 0.82 | 1.35 | 1.18 |
| Oxygen-evolving enhancer protein 1 (PsbO/S/249) | 0.86 | 0.97 | 1.34 | 0.95 |
| Oxygen-evolving enhancer protein 1 (PsbO/S/238) | 0.16 | 0.21 | 3.65 | 0.96 |
| Oxygen-evolving enhancer protein 2 (PsbP/S/50) | 0.26 | 0.30 | 5.13 | 0.94 |
| Oxygen-evolving enhancer 2-1, chloroplastic (PsbP/Y/21) | 0.89 | 0.95 | 1.71 | 1.04 |
| Oxygen-evolving enhancer 2-1, chloroplastic (PsbP/T/22) | 0.89 | 0.94 | 1.64 | 1.07 |
| Oxygen-evolving enhancer protein 3-1 (PsbQ/T/123) | 0.84 | 0.81 | 2.54 | 1.28 |
| Oxygen-evolving enhancer protein 3-1 (PsbQ/Y/118) | 0.82 | 0.92 | 1.30 | 1.39 |
| Photosystem II reaction center protein H (PsbH/T/3) | 1.05 | 1.18 | 0.85 | 0.76 |
| Photosystem II reaction center protein H (PsbH/T/5) | 0.95 | 1.19 | 2.08 | 0.68 |
| Photosystem II 10 kDa polypeptide (PsbR/Y/74) | 0.79 | 1.13 | 1.64 | 0.93 |
| Plastocyanin (PetE/S/154) | 0.79 | 0.88 | 1.32 | 0.85 |
| Putative photosystem I reaction center subunit III (PsaF/S/100) | 0.69 | 0.78 | 3.53 | 1.38 |
| Putative Photosystem I reaction center subunit IV (PsaE/S/93) | 0.42 | 0.50 | 3.46 | 1.37 |
| Putative Photosystem I reaction center subunit IV (PsaE/S/101) | 0.74 | 0.77 | 2.31 | 1.05 |
| Putative photosystem I reaction center subunit III (PsaF/S/99) | 0.69 | 0.78 | 3.39 | 1.35 |
| ATP synthase subunit gamma (ATPF1G/S/348) | 0.53 | 0.65 | 3.33 | 1.13 |
| ATP synthase subunit gamma (ATPF1G/Y/351) | 0.55 | 0.66 | 3.28 | 1.11 |
| ATP synthase subunit gamma (ATPF1G/S/99) | 0.55 | 0.66 | 3.28 | 1.11 |
| Photosynthesis –antenna proteins | ||||
| Chlorophyll a/b-binding protein (LHCB4/S/49) | 0.94 | 0.97 | 2.15 | 0.91 |
| Chlorophyll a/b-binding protein (LHCB4/S/49) | 0.94 | 0.97 | 2.15 | 0.91 |
| Chlorophyll a-b binding protein 2, chloroplastic (LHCB1/S/38) | 0.76 | 0.89 | 3.90 | 0.90 |
| Chlorophyll a-b binding protein 1(LHCB1/T/23) | 0.76 | 0.89 | 1.73 | 1.01 |
| Chlorophyll a-b binding protein 1 (LHCB1/S/43) | 0.48 | 0.59 | 1.66 | 1.97 |
| Chlorophyll a-b binding protein 1 (LHCB1/Y/49) | 1.14 | 1.09 | 0.59 | 0.84 |
| Chlorophyll a-b binding protein 2, chloroplastic (LHCB1/S/47) | 1.01 | 1.00 | 0.45 | 1.01 |
| Chlorophyll a-b binding protein 1 (LHCB1/S/41) | 1.11 | 1.08 | 0.42 | 1.00 |
| Chlorophyll a-b binding protein 2, chloroplastic (LHCB1/Y/50) | 1.05 | 0.97 | 0.27 | 1.01 |
| Stress and stimulus response proteins | ||||
| Catalase (katE/S/347) | 0.52 | 0.59 | 2.23 | 1.12 |
| Catalase (katE/S/349) | 0.49 | 0.70 | 2.16 | 1.03 |
| Catalase (katE/S/112) | 0.55 | 0.66 | 2.00 | 1.15 |
| Catalase (katE/T/115) | 0.59 | 0.65 | 1.95 | 1.14 |
| Catalase (katE/S/11) | 0.78 | 0.85 | 1.35 | 0.98 |
| Catalase (katE/T/351) | 0.47 | 0.59 | 1.85 | 1.41 |
| Probable L-ascorbate peroxidase 3 (E1.11.1.11/S/150) | 0.70 | 0.74 | 2.19 | 1.25 |
| OSJNBb0048E02.12 protein (OSJNBb0048E02.12/S/8) | 0.62 | 0.78 | 1.44 | 0.89 |
| Glutaredoxin domain containing protein (S/154) | 0.66 | 1.02 | 1.43 | 0.94 |
| OSJNBb0048E02.12 protein (OSJNBb0048E02.12/S/50) | 0.80 | 0.77 | 1.40 | 0.81 |
| OSJNBb0048E02.12 protein (OSJNBb0048E02.12/Y/3) | 0.66 | 0.78 | 1.39 | 0.96 |
| OSJNBb0048E02.12 protein (OSJNBb0048E02.12/S/5) | 0.68 | 0.8 | 1.36 | 0.98 |
| Putative cinnamyl-alcohol dehydrogenase family protein (E1.1.1.195/T/7) | 1.00 | 1.08 | 1.39 | 0.90 |
| Glutaredoxin domain containing protein (S/99) | 0.87 | 1.00 | 1.38 | 0.79 |
| Glutaredoxin domain containing protein (S/46) | 0.87 | 1.06 | 0.79 | 1.27 |
| Probable cinnamyl alcohol dehydrogenase 3 (S/20) | 0.90 | 1.03 | 1.38 | 0.83 |
| Glutaredoxin domain containing protein (S/103) | 0.86 | 1.00 | 1.34 | 0.84 |
| Putative nuclear snf4-like (S/48) | 0.91 | 0.98 | 1.32 | 0.87 |
| Homeobox-leucine zipper protein ROC1 (S/46) | 1.01 | 1.08 | 4.2 | 0.40 |
| Lipoxygenase (LOX2S/S/76) | 0.46 | 0.59 | 2.71 | 1.31 |
| Lipoxygenase (LOX2S/S/74) | 0.44 | 0.51 | 2.7 | 1.5 |
| Putative ENTH/ANTH/VHS superfamily protein isoform 1 (S/180) | 0.78 | 0.81 | 1.78 | 0.71 |
| Integral membrane single C2 domain protein (T/475) | 0.83 | 0.90 | 1.66 | 0.73 |
| Integral membrane single C2 domain protein (T/473) | 0.82 | 0.93 | 1.64 | 0.73 |
| Clathrin assembly protein AP180 short form-like (S/306) | 0.84 | 0.91 | 1.62 | 0.78 |
| Clathrin assembly protein AP180 short form-like (T/307) | 0.93 | 0.94 | 1.42 | 0.77 |
| Putative ENTH/ANTH/VHS superfamily protein isoform 1 (T/221) | 0.91 | 0.93 | 1.26 | 0.78 |
| Peroxisomal (S)-2-hydroxy-acid oxidase GLO5 (HAO/T/159) | 0.97 | 1.14 | 1.22 | 0.79 |
| Monodehydroascorbate reductase (E1.6.5.4/S/344) | 0.74 | 1.33 | 1.17 | 0.74 |
| Monodehydroascorbate reductase (E1.6.5.4/T/346) | 0.69 | 1.30 | 1.16 | 0.86 |
| Chaperonin (Chaperonin/T/125) | 0.73 | 0.81 | 1.09 | 1.25 |
| Glutathione peroxidase (gpx/S/129) | 0.98 | 1.19 | 0.75 | 1.33 |
| Putative C2 domain-containing protein (S/406) | 0.87 | 1.05 | 0.71 | 1.32 |
| L-lactate dehydrogenase (LDH/S/26) | 1.22 | 1.24 | 0.75 | 0.81 |
| Energy and metabolism | ||||
| Fructose-bisphosphate aldolase (ALDO/T/88) | 0.67 | 0.67 | 3.48 | 0.97 |
| Fructose-bisphosphate aldolase (ALDO/S/42) | 0.56 | 0.70 | 2.72 | 0.78 |
| Fructose-bisphosphate aldolase (ALDO/S/82) | 0.67 | 0.88 | 1.68 | 0.91 |
| Fructose-bisphosphate aldolase (ALDO/S/73) | 0.76 | 1.06 | 1.44 | 0.93 |
| Fructose-bisphosphate aldolase (ALDO/S/83) | 0.79 | 0.91 | 1.44 | 0.82 |
| Fructose-bisphosphate aldolase (ALDO/S/349) | 0.92 | 0.99 | 1.42 | 0.76 |
| Fructose-bisphosphate aldolase (ALDO/T/80) | 0.83 | 0.96 | 1.36 | 1.13 |
| Transketolase isoform 1 (transketolase [EC:2.2.1.1]/Y/426) | 0.66 | 0.67 | 3.35 | 0.77 |
| Transketolase isoform 1(transketolase ([EC:2.2.1.1]/S/434) | 0.77 | 0.89 | 1.76 | 0.78 |
| Transketolase isoform 1 ( transketolase [EC:2.2.1.1]/S/430) | 0.97 | 1.14 | 1.22 | 0.83 |
| EST C74302(E30840) corresponds to a region of the predicted gene (GAPA/S/26) | 0.40 | 0.57 | 2.35 | 0.79 |
| EST C74302(E30840) corresponds to a region of the predicted gene (GAPA/S/27) | 0.48 | 0.59 | 2.27 | 0.82 |
| EST C74302(E30840) corresponds to a region of the predicted gene (GAPA/S/25) | 0.75 | 0.82 | 1.52 | 0.81 |
| EST C74302(E30840) corresponds to a region of the predicted gene (GAPA/S/278) | 0.81 | 0.90 | 1.37 | 1.14 |
| EST C74302(E30840) corresponds to a region of the predicted gene (GAPA/T/295) | 0.90 | 1.29 | 1.12 | 0.99 |
| putative 2,3-bisphosphoglycerate-independent phosphoglycerate mutase (gpmI/S/81) | 0.84 | 0.88 | 1.53 | 0.77 |
| Phosphoenolpyruvate carboxykinase (ATP), conserved site-containing protein (E4.1.1.49/T/71) | 0.76 | 1.06 | 1.44 | 0.66 |
| Phosphoglucomutase/phosphomannomutase, C-terminal domain, putative (pgn/T/5) | 0.81 | 0.86 | 1.27 | 0.75 |
| Carbonic anhydrase (cynT/S/111) | 0.51 | 0.66 | 2.14 | 0.75 |
| Carbonic anhydrase (cynT/S/109) | 0.80 | 0.86 | 1.19 | 0.78 |
| Carbonic anhydrase (cynT/S/83) | 0.84 | 1.01 | 1.52 | 1.26 |
| Phosphoribulokinase (PRK/T/78) | 0.60 | 0.60 | 2.03 | 0.85 |
| Phosphoribulokinase (PRK/S/219) | 0.64 | 0.80 | 1.45 | 0.94 |
| Phosphoribulokinase (PRK/S/79) | 0.88 | 1.03 | 1.45 | 0.85 |
| Putative fructose-1,6-bisphosphatase (E3.1.3.37/S/320) | 0.72 | 0.82 | 1.80 | 0.83 |
| Serine-glyoxylate aminotransferase (AGXT/Y/35) | 0.85 | 0.87 | 1.76 | 1.02 |
| Serine-glyoxylate aminotransferase (AGXT/S/37) | 0.69 | 0.73 | 1.46 | 1.00 |
| Ribulose bisphosphate carboxylase small chain (rbcS/S/114) | 0.7 | 1.24 | 1.59 | 1.16 |
| Ribulose bisphosphate carboxylase small chain (rbcS/Y/118) | 1.01 | 1.00 | 1.37 | 1.21 |
| Ribulose bisphosphate carboxylase small chain (rbcS/Y/117) | 0.95 | 1.26 | 1.21 | 1.20 |
| GLO5 Peroxisomal (S)-2-hydroxy-acid oxidase GLO5 (HAO/T/159) | 0.79 | 0.97 | 1.42 | 0.79 |
| 2-oxoglutarate dehydrogenase, putative (OGDH/S/344) | 0.94 | 1.01 | 1.33 | 0.91 |
| Putative fructose-1,6-bisphosphatase (E3.1.3.37/S/318) | 0.88 | 0.89 | 1.31 | 1.10 |
| Phosphoglycerate kinase (PGK/S/276) | 0.83 | 0.94 | 1.26 | 1.05 |
| Aminomethyltransferase (gcvT/S/268) | 0.75 | 0.94 | 2.09 | 0.92 |
| Aminomethyltransferase (gcvT/Y/390) | 1.02 | 1.22 | 1.10 | 1.10 |
| Aminomethyltransferase (gcvT/S/339) | 0.74 | 1.02 | 0.83 | 0.82 |
| Glucose-1-phosphate adenylyltransferase (glgC/S/263) | 0.39 | 0.41 | 2.13 | 1.10 |
| Glucose-1-phosphate adenylyltransferase (glgC/S/424) | 0.48 | 0.47 | 2.05 | 1.05 |
| UDP-glucose 6-dehydrogenase (UGDH/S/393) | 1.15 | 1.12 | 0.69 | 0.96 |
| 1,3-beta-glucan synthase component-like (S/1019) | 0.80 | 1.04 | 1.43 | 0.79 |
| Putative beta 1,3 glucan synthase (T/27) | 0.76 | 1.05 | 1.41 | 0.91 |
| Serine hydroxymethyltransferase (glyA/S/384) | 0.72 | 0.82 | 1.8 | 1.06 |
| Phospho-2-dehydro-3-deoxyheptonate aldolase 1, chloroplastic (E2.5.1.54/S/67) | 0.43 | 0.47 | 1.72 | 1.10 |
| Aspartate-semialdehyde dehydrogenase family protein, expressed (ASD/S/137) | 0.72 | 0.79 | 1.65 | 0.78 |
| Orange pericarp1 (trpB/S/76) | 0.79 | 0.97 | 1.48 | 0.91 |
| Cellulose synthase-like protein E6 (IPR029044/S/393) | 0.5 | 0.63 | 1.8 | 1.36 |
| Glyceraldehyde-3-phosphate dehydrogenase 2, cytosolic (GAPDH/Y/257) | 0.75 | 0.82 | 1.52 | 0.74 |
| Putative beta 1,3 glucan synthase (S/29) | 0.81 | 1.08 | 1.29 | 0.90 |
| putative 6-phosphofructo-2-kinase / fructose-2, 6-bisphosphate 2-phosphatase(S/276) | 1.04 | 1.16 | 0.56 | 1.28 |
| Glutamine synthetase (Gs/S/175) | 0.76 | 0.87 | 1.61 | 0.98 |
| Putative glycine dehydrogenase (GLDC/S/51) | 0.77 | 0.89 | 1.76 | 0.95 |
| Thiamine thiazole synthase, chloroplastic (THI4/S/27) | 0.37 | 0.37 | 2.41 | 0.62 |
| Nitrogen regulatory protein P-II homolog (/T114) | 0.51 | 0.62 | 1.71 | 0.63 |
| Nitrogen regulatory protein P-II homolog (/T113) | 0.57 | 0.7 | 1.61 | 0.68 |
| Nitrate-induced NOI protein, expressed (RIN4/T/161) | 0.61 | 0.96 | 1.53 | 0.70 |
| Nitrate-induced NOI protein, expressed (RIN4/T/206) | 0.77 | 1.13 | 1.34 | 0.64 |
| Nitrate-induced NOI protein, expressed (RIN4/T/216) | 0.74 | 1.16 | 1.32 | 0.68 |
| Nitrate-induced NOI protein, expressed (RIN4/T/227) | 0.79 | 1.07 | 1.22 | 0.88 |
| Nitrate-induced NOI protein, expressed (RIN4/T/168) | 0.77 | 0.78 | 1.54 | 0.63 |
| Nitrate-induced NOI protein, expressed (RIN4/S/170) | 0.82 | 0.74 | 1.39 | 0.68 |
| Nitrate-induced NOI protein, expressed (RIN4/S/96) | 0.96 | 0.95 | 1.31 | 0.66 |
| Nitrate-induced NOI protein, expressed (RIN4/T/165) | 0.79 | 0.88 | 1.4 | 0.75 |
| Nitrate-induced NOI protein, expressed (RIN4/T/228) | 0.86 | 0.87 | 1.32 | 0.82 |
| Nitrate-induced NOI protein, expressed (RIN4/S/154) | 0.99 | 1.03 | 1.19 | 0.77 |
| Nitrate-induced NOI protein, expressed (RIN4/S/183) | 0.87 | 0.91 | 1.28 | 0.84 |
| Nitrate-induced NOI protein, expressed (RIN4/S/127) | 0.93 | 0.96 | 1.23 | 0.81 |
| Nitrate-induced NOI protein, expressed (RIN4/S/164) | 0.83 | 0.92 | 1.28 | 0.85 |
| Nitrate-induced NOI protein, expressed (RIN4/S/225) | 0.72 | 1.31 | 1.09 | 0.92 |
| Nitrate-induced NOI protein, expressed (RIN4/S/133) | 1.22 | 1.16 | 0.97 | 0.77 |
| Nitrate-induced NOI protein, expressed (RIN4/S/185) | 1.59 | 1.84 | 0.4 | 0.43 |
| Nitrate-induced NOI protein, expressed (RIN4/S/95) | 1.17 | 1.39 | 0.75 | 0.84 |
| Protein synthesis | ||||
| 50S ribosomal protein L21 (RP-L21/S/52) | 0.32 | 0.38 | 2.4 | 1.18 |
| 60S acidic ribosomal protein P0 (RP-LP0/S/311) | 0.25 | 0.35 | 1.53 | 0.25 |
| 60S acidic ribosomal protein P1 (RP-LP1/S/103) | 0.23 | 0.21 | 1.51 | 0.28 |
| 60S ribosomal protein L6 (RP-L6e/S/204) | 0.9 | 0.92 | 1.36 | 0.86 |
| 60S acidic ribosomal protein P2A (RP-LP2/S/105) | 0.15 | 0.34 | 1.33 | 0.15 |
| 60S acidic ribosomal protein P3 (RP-LP1/S/110) | 0.35 | 0.47 | 1.31 | 0.37 |
| 60S ribosomal protein L24 (RP-L24e/S/28) | 0.82 | 1.09 | 1.24 | 0.86 |
| 40S ribosomal protein S27 (RP-S27e/S/80) | 1.15 | 1.70 | 0.65 | 0.80 |
| 40S ribosomal protein S6 (RP-S6e/S/231) | 1.00 | 1.17 | 0.65 | 0.96 |
| 40S ribosomal protein S6 (RP-S6e/S/237) | 1.02 | 1.3 | 0.51 | 0.76 |
| 40S ribosomal protein S6 (RP-S6e/S/229) | 1.21 | 1.32 | 0.29 | 0.56 |
| Putative translational activator (S/1831) | 0.78 | 0.83 | 1.88 | 0.78 |
| 4G-1 Eukaryotic translation initiation factor isoform 4G-1 (EIF4G/S/527) | 0.86 | 1.11 | 1.34 | 0.74 |
| 4B Eukaryotic translation initiation factor 4B (EIF4B/S/128) | 0.72 | 0.84 | 1.29 | 0.86 |
| 3H Eukaryotic translation initiation factor 3 subunit H (EIF3H/S/222) | 0.96 | 1.27 | 0.91 | 0.79 |
| 4G Eukaryotic translation initiation factor 4G (EIF4G/T/1579) | 1.49 | 1.52 | 0.8 | 1.15 |
| 4B Eukaryotic translation initiation factor 4B (EIF4B/Y/536) | 1.15 | 1.12 | 0.73 | 1.17 |
| 4G Eukaryotic translation initiation factor 4G (EIF4G/S/184) | 1.74 | 1.53 | 0.73 | 1.13 |
| 4G Eukaryotic translation initiation factor 4G (EIF4G/S1401) | 2.24 | 1.76 | 0.59 | 1.00 |
| Elongation factor 1-alpha (EEF1A/S/176) | 1.22 | 1.07 | 0.54 | 1.18 |
| Protein Degradation | G1 | G2 | Y1 | Y2 |
| Putative dynamin homolog (DNM/S/894) | 0.47 | 0.57 | 2.53 | 1.44 |
| Putative dynamin homolog (DNM/S/897) | 0.52 | 0.60 | 2.49 | 1.38 |
| Putative dynamin homolog (DNM/S/887) | 0.77 | 0.84 | 1.67 | 0.80 |
| Putative dynamin homolog (DNM/Y/886) | 0.69 | 0.88 | 1.67 | 0.75 |
| Putative dynamin homolog (DNM/T/736) | 0.79 | 0.88 | 1.56 | 1.11 |
| Putative dynamin homolog (DNM/S/733) | 0.80 | 0.86 | 1.49 | 1.20 |
| Putative dynamin homolog (DNM/S/730) | 0.80 | 0.87 | 1.48 | 1.19 |
| Putative dynamin homolog (DNM/T/535) | 0.88 | 0.95 | 1.32 | 1.00 |
| Dynamin-related protein 1C, putative, expressed (DNM/S/271) | 0.76 | 0.82 | 1.66 | 1.06 |
| ATP-dependent Clp protease proteolytic subunit (ClpP/S/288) | 0.31 | 0.37 | 2.46 | 0.89 |
| ATP-dependent Clp protease proteolytic subunit (ClpP/S/287) | 0.30 | 0.46 | 2.23 | 0.90 |
| ATP-dependent zinc metalloprotease FTSH 1, chloroplastic (FTSH1/T/539) | 0.39 | 0.53 | 2.42 | 0.90 |
| ATP-dependent Clp protease proteolytic subunit (ClpP/S/287) | 0.30 | 0.46 | 2.23 | 0.90 |
| ATP-dependent Clp protease proteolytic subunit (ClpP/S/96) | 0.49 | 0.60 | 1.70 | 1.00 |
| H-ATPase (PMA1/Y/955) | 0.83 | 0.40 | 2.02 | 1.07 |
| H-ATPase (PMA1/T/956) | 0.67 | 0.80 | 2.01 | 0.79 |
| Pleiotropic drug resistance protein 5 (S/26) | 0.56 | 0.77 | 1.83 | 0.98 |
| Pleiotropic drug resistance protein 6 (S/14) | 0.94 | 1.05 | 1.28 | 0.73 |
| Pleiotropic drug resistance protein 6 (S/12) | 0.93 | 1.08 | 1.21 | 0.79 |
| Chloroplast thylakoidal processing peptidase-like protein (S/392) | 0.54 | 0.62 | 1.65 | 1.11 |
| Neutral/alkaline invertase (Neutral/alkaline invertase/S/48) | 0.81 | 0.99 | 1.62 | 0.85 |
| Beta-glucosidase 11 (Beta-glucosidase 11/S546) | 0.57 | 0.60 | 1.62 | 0.99 |
| Endonuclease III homologue (NTH/S/346) | 0.80 | 0.82 | 1.61 | 0.83 |
| Gibberellin receptor GID1L2 (GID1L2/S/309) | 0.62 | 0.71 | 1.60 | 1.25 |
| Beta-glucosidase 11 (Beta-glucosidase 11/S545) | 0.60 | 0.62 | 1.58 | 0.98 |
| Beta-glucosidase 11 (Beta-glucosidase 11/S555) | 0.67 | 0.72 | 1.50 | 0.93 |
| Beta-glucosidase 11 (Beta-glucosidase 11/S/1007) | 0.69 | 0.77 | 1.45 | 1.13 |
| Beta-glucosidase 11 (Beta-glucosidase 11/S/249) | 0.70 | 0.78 | 1.25 | 1.21 |
| Beta-glucosidase 24 (Beta-glucosidase 24/S/279) | 0.66 | 0.64 | 1.47 | 0.8 |
| Beta-glucosidase 24 (Beta-glucosidase 24 /Y/286) | 0.64 | 0.63 | 1.47 | 0.81 |
| Beta-glucosidase 24 (Beta-glucosidase 24/S/271) | 0.66 | 0.83 | 1.35 | 0.87 |
| Beta-glucosidase 24 (Beta-glucosidase 24/S/269) | 0.66 | 0.73 | 1.33 | 0.94 |
| DNA topoisomerase I (DNA topoisomerase I/S/139) | 0.90 | 0.98 | 1.41 | 0.89 |
| DNA topoisomerase I (DNA topoisomerase I/S/142) | 0.90 | 0.98 | 1.41 | 0.89 |
| Glycoside hydrolase family 2 family protein (lacZ/S/567) | 0.68 | 0.74 | 1.35 | 1.35 |
| Ubiquitin family protein (Ubiquitin family protein/T/351) | 0.93 | 0.92 | 1.33 | 0.74 |
| H2B Filamentation temperature-sensitive H2B (S/198) | 0.81 | 1.02 | 1.24 | 0.95 |
| H2B Filamentation temperature-sensitive H2B (S/199) | 0.81 | 1.02 | 1.24 | 0.95 |
| putative endo-1,3;1,4-beta-D-glucanase (S/209) | 0.93 | 1.06 | 1.23 | 0.81 |
| Beta-glucosidase-like SFR2, chloroplastic (S/132) | 0.75 | 1.11 | 0.85 | 1.30 |
| Soluble inorganic pyrophosphatase (ppa/S/33) | 0.82 | 1.17 | 0.77 | 1.25 |
| Soluble inorganic pyrophosphatase (ppa/S/34) | 0.80 | 1.10 | 0.77 | 1.33 |
| DNA topoisomerase I (DNA topoisomerase I/S/192) | 1.11 | 1.21 | 0.71 | 0.63 |
| CER5 (CER5/S/330) | 1.01 | 1.24 | 0.64 | 1.09 |
| Transcriptional regulation | ||||
| Histone H2B (H2B/S/135) | 0.92 | 1.02 | 1.30 | 0.77 |
| Histone H2B (H2B/S/19) | 1.25 | 1.12 | 0.73 | 0.9 |
| SNF2 transcription factor (MSI/S/95) | 1.28 | 1.25 | 0.72 | 1.16 |
| MYB transcription factor (S/184) | 1.15 | 1.19 | 0.66 | 1.06 |
| Putative MYB DNA-binding domain superfamily protein (S/171) | 0.75 | 1.02 | 1.25 | 1.01 |
| Zinc finger CCCH domain-containing protein 8 (S/436) | 1.36 | 1.2 | 0.82 | 0.78 |
| Zinc finger CCCH domain-containing protein 8 (S/238) | 1.27 | 1.34 | 0.59 | 1.01 |
| Zinc-finger homeodomain protein 1 (S/199) | 0.70 | 0.86 | 1.30 | 1.24 |
| Zinc-finger homeodomain protein 1 (T/37) | 0.78 | 1.04 | 1.22 | 1.00 |
| Zinc-finger homeodomain protein 1 (T/17) | 1.01 | 0.88 | 1.40 | 0.73 |
| Zinc-finger homeodomain protein 3 (Y/151) | 0.76 | 1.00 | 1.33 | 1.03 |
| Zinc finger CCCH domain-containing protein 8 (S/436) | 1.36 | 1.20 | 0.82 | 0.78 |
| Zinc finger CCCH domain-containing protein 8 (S/238) | 1.27 | 1.34 | 0.59 | 1.01 |
| Zinc finger CCCH domain-containing protein 63 (S/408) | 0.69 | 0.97 | 1.84 | 0.85 |
| Zinc finger CCCH domain-containing protein 63 (S/410) | 0.72 | 1.01 | 1.80 | 0.81 |
| Zinc finger CCCH domain-containing protein 63 (S/183) | 0.76 | 1.04 | 1.76 | 0.73 |
| Zinc finger CCCH domain-containing protein 63 (T/185) | 0.89 | 1.08 | 1.48 | 0.72 |
| Zinc finger CCCH domain-containing protein 63 (S/424) | 0.90 | 0.93 | 1.38 | 0.93 |
| ROC1 Homeobox-leucine zipper protein ROC1 (ROC1/S/46) | 1.01 | 1.08 | 4.20 | 0.40 |
| DNA binding protein, mRNA (S/176) | 0.94 | 0.92 | 0.75 | 1.28 |
| DNA binding protein, mRNA (S/204) | 0.8 | 0.92 | 1.33 | 1.07 |
| DNA binding protein, mRNA (S/64) | 1.11 | 1.09 | 0.69 | 1.02 |
| Transport | ||||
| Hexose transporter (Hexose transporter/S/643) | 0.55 | 0.64 | 2.11 | 0.86 |
| Hexose transporter (Hexose transporter/S/70) | 0.61 | 0.75 | 1.78 | 0.97 |
| Putative sulfate transporter (S/643) | 0.68 | 0.96 | 1.90 | 0.68 |
| Putative sulfate transporter (Putative sulfate transporter/S/651) | 0.73 | 0.9 | 1.69 | 0.82 |
| Sugar transport1 isoform 1 (Sugar transport1 isoform 1/S/33) | 0.66 | 0.77 | 1.56 | 0.66 |
| Sugar transport1 isoform 1 (Sugar transport1 isoform 1/S/32) | 0.84 | 0.98 | 1.31 | 0.75 |
| Sugar transport1 isoform 1 (Sugar transport1 isoform 1/S/485) | 1.24 | 1.32 | 0.65 | 1.16 |
| Amino acid permease-like (Amino acid permease-like/S/20) | 0.22 | 0.47 | 0.98 | 2.45 |
| Amino acid permease-like (Amino acid permease-like/S/47) | 1.10 | 1.25 | 0.61 | 1.03 |
| Amino acid permease-like (Amino acid permease-like/Y/49) | 1.25 | 1.22 | 0.52 | 1.02 |
| Amino acid permease-like (Amino acid permease-like /T/41) | 1.26 | 1.23 | 0.47 | 1.01 |
| Amino acid permease-like (Amino acid permease-like/S/42) | 1.28 | 1.22 | 0.45 | 1.01 |
| Calcium-transporting ATPase 1, plasma membrane-type (S/45) | 0.87 | 1.17 | 0.73 | 1.15 |
| MATE efflux family protein (MATE efflux family protein/S/12) | 1.10 | 1.07 | 0.65 | 1.01 |
| ABC transporter family protein, putative, expressed (S/99) | 0.69 | 0.89 | 2.43 | 0.61 |
| ABC transporter family protein, putative, expressed (S/7) | 0.70 | 0.92 | 2.36 | 0.61 |
| ABC transporter family protein, putative, expressed (S/63) | 0.81 | 0.72 | 2.30 | 0.72 |
| ABC-2 type transporter family protein (S/617) | 0.75 | 0.80 | 1.53 | 1.13 |
References
- Aluru, M.R.; Zola, J.; Foudree, A.; Rodermel, S.R. Chloroplast photooxidation-induced transcriptome reprogramming in Arabidopsis immutans white leaf sectors. Plant Physiol. 2009, 150, 904–923. [Google Scholar] [CrossRef]
- Wu, W.; Zhu, Y.; Ma, Z.; Sun, Y.; Quan, Q.; Li, P.; Hu, P.; Shi, T.; Lo, C.; Chu, I.K.; et al. Proteomic evidence for genetic epistasis: ClpR4 mutations switch leaf variegation to virescence in Arabidopsis. Plant J. 2013, 76, 943–956. [Google Scholar] [CrossRef]
- Miura, E.; Kato, Y.; Sakamoto, W. Comparative transcriptome analysis of green/white variegated sectors in Arabidopsis yellow variegated2: Responses to oxidative and other stresses in white sectors. J. Exp. Bot. 2010, 61, 2433–2445. [Google Scholar] [CrossRef] [PubMed]
- Ashe, A.; Morgan, D.K.; Whitelaw, N.C.; Bruxner, T.J.; Vickaryous, N.K.; Cox, L.L.; Butterfield, N.C.; Wicking, C.; Blewitt, M.E.; Wilkins, S.J.; et al. A genome-wide screen for modifiers of transgene variegation identifies genes with critical roles in development. Genome Biol. 2008, 9, R182. [Google Scholar] [CrossRef]
- Motohashi, R.; Rodiger, A.; Agne, B.; Baerenfaller, K.; Baginsky, S. Common and specific protein accumulation patterns in different albino/pale-green mutants reveals regulon organization at the proteome level. Plant Physiol. 2012, 160, 2189–2201. [Google Scholar] [CrossRef]
- Yu, J.; Zhang, J.; Zhao, Q.; Liu, Y.; Chen, S.; Guo, H.; Shi, L.; Dai, S. Proteomic analysis reveals the leaf color regulation mechanism in Chimera Hosta “gold standard” leaves. Int. J. Mol. Sci. 2016, 17, 346. [Google Scholar] [CrossRef]
- Zhou, Y.; Wu, X.; Zhang, Z.; Gao, Z. Comparative proteomic analysis of floral color variegation in peach. Biochem. Biophys. Res. Commun. 2015, 464, 1101–1106. [Google Scholar] [CrossRef] [PubMed]
- Chen, Y.; Hoehenwarter, W. Changes in the phosphoproteome and metabolome link early signaling events to rearrangement of photosynthesis and central metabolism in salinity and oxidative stress response in Arabidopsis. Plant Physiol. 2015, 169, 3021–3033. [Google Scholar] [CrossRef]
- Steiner, S.; Dietzel, L.; Schroter, Y.; Fey, V.; Wagner, R.; Pfannschmidt, T. The role of phosphorylation in redox regulation of photosynthesis genes psaA and psbA during photosynthetic acclimation of mustard. Mol. Plant 2009, 2, 416–429. [Google Scholar] [CrossRef] [PubMed]
- Lundin, B.; Hansson, M.; Schoefs, B.; Vener, A.V.; Spetea, C. The Arabidopsis PsbO2 protein regulates dephosphorylation and turnover of the photosystem II reaction centre D1 protein. Plant J. 2007, 49, 528–539. [Google Scholar] [CrossRef]
- Longoni, P.; Douchi, D.; Cariti, F.; Fucile, G.; Goldschmidt-Clermont, M. Phosphorylation of the light-harvesting complex II isoform Lhcb2 is central to state transitions. Plant Physiol. 2015, 169, 2874–2883. [Google Scholar] [CrossRef]
- Trotta, A.; Suorsa, M.; Rantala, M.; Lundin, B.; Aro, E.M. Serine and threonine residues of plant STN7 kinase are differentially phosphorylated upon changing light conditions and specifically influence the activity and stability of the kinase. Plant J. 2016, 87, 484–494. [Google Scholar] [CrossRef]
- Bonardi, V.; Pesaresi, P.; Becker, T.; Schleiff, E.; Wagner, R.; Pfannschmidt, T.; Jahns, P.; Leister, D. Photosystem II core phosphorylation and photosynthetic acclimation require two different protein kinases. Nature 2005, 437, 1179–1182. [Google Scholar] [CrossRef] [PubMed]
- Wang, J.P.; Chuang, L.; Loziuk, P.L.; Chen, H.; Lin, Y.C.; Shi, R.; Qu, G.Z.; Muddiman, D.C.; Sederoff, R.R.; Chiang, V.L. Phosphorylation is an on/off switch for 5-hydroxyconiferaldehyde O-methyltransferase activity in poplar monolignol biosynthesis. Proc. Natl. Acad. Sci. USA 2015, 112, 8481–8486. [Google Scholar] [CrossRef] [PubMed]
- Zagari, N.; Sandoval-Ibanez, O.; Sandal, N.; Su, J.; Rodriguez-Concepcion, M.; Stougaard, J.; Pribil, M.; Leister, D.; Pulido, P. Snowy cotyledon 2 promotes chloroplast development and has a role in leaf variegation in both Lotus japonicus and Arabidopsis thaliana. Mol. Plant 2017, 10, 721–734. [Google Scholar] [CrossRef]
- Swiatek, M.; Kuras, R.; Sokolenko, A.; Higgs, D.; Olive, J.; Cinque, G.; Muller, B.; Eichacker, L.A.; Stern, D.B.; Bassi, R.; et al. The chloroplast gene ycf9 encodes a photosystem II (PSII) core subunit, PsbZ, that participates in PSII supramolecular architecture. Plant Cell 2001, 13, 1347–1367. [Google Scholar] [CrossRef] [PubMed]
- Baginsky, S. Protein phosphorylation in chloroplasts—a survey of phosphorylation targets. J. Exp. Bot. 2016, 67, 3873–3882. [Google Scholar] [CrossRef]
- Wioleta, W.; Anna, D.; Ilona, B.; Kamila, K.; Elżbieta, R. Lead induced changes in phosphorylation of PSII proteins in low light grown pea plants. Biometals 2015, 28, 151–162. [Google Scholar] [CrossRef] [PubMed]
- Zhao, Q.; Chen, W.; Bian, J.; Xie, H.; Li, Y.; Xu, C.; Ma, J.; Guo, S.; Chen, J.; Cai, X.; et al. Proteomics and phosphoproteomics of heat stress-responsive mechanisms in spinach. Front Plant Sci. 2018, 9, 800. [Google Scholar] [CrossRef] [PubMed]
- Zhou, H.; Ye, M.; Dong, J.; Corradini, E.; Cristobal, A.; Heck, A.J.R.; Zou, H.; Mohammed, S. Robust phosphoproteome enrichment using monodisperse microsphere–based immobilized titanium (IV) ion affinity chromatography. Nat. Protoc. 2013, 8, 461–480. [Google Scholar] [CrossRef]
- Zhang, C.; Guo, X.; Xie, H.; Li, J.; Liu, X.; Zhu, B.; Liu, S.; Li, H.; Li, M.; He, M.; et al. Quantitative phosphoproteomics of lectin receptor-like kinase VI.4 dependent abscisic acid response in Arabidopsis thaliana. Physiol. Plant 2018. [Google Scholar] [CrossRef]
- Xue, X.; Wang, Q.; Qu, Y.; Wu, H.; Dong, F.; Cao, H.; Wang, H.L.; Xiao, J.; Shen, Y.; Wan, Y. Development of the photosynthetic apparatus of Cunninghamia lanceolata in light and darkness. New Phytol. 2017, 213, 300–313. [Google Scholar] [CrossRef]
- Su, V.; Hsu, B.D. Cloning and expression of a putative cytochrome P450 gene that influences the colour of Phalaenopsis flowers. Biotechnol. Lett. 2003, 25, 1933–1939. [Google Scholar] [CrossRef] [PubMed]
- Iuchi, S.; Kobayashi, M.; Taji, T.; Naramoto, M.; Seki, M.; Kato, T.; Tabata, S.; Kakubari, Y.; Yamaguchi-Shinozaki, K.; Shinozaki, K. Regulation of drought tolerance by gene manipulation of 9-cis-epoxycarotenoid dioxygenase, a key enzyme in abscisic acid biosynthesis in Arabidopsis. Plant J. 2010, 27, 325–333. [Google Scholar] [CrossRef]
- Saito, A.; Shimizu, M.; Nakamura, H.; Maeno, S.; Katase, R.; Miwa, E.; Higuchi, K.; Sonoike, K. Fe deficiency induces phosphorylation and translocation of Lhcb1 in barley thylakoid membranes. FEBS Lett. 2014, 588, 2042–2048. [Google Scholar] [CrossRef] [PubMed]
- Grieco, M.; Tikkanen, M.; Paakkarinen, V.; Kangasjarvi, S.; Aro, E.M. Steady-state phosphorylation of light-harvesting complex II proteins preserves photosystem I under fluctuating white light. Plant Physiol. 2012, 160, 1896–1910. [Google Scholar] [CrossRef]
- Allahverdiyeva, Y.; Suorsa, M.; Rossi, F.; Pavesi, A.; Kater, M.M.; Antonacci, A.; Tadini, L.; Pribil, M.; Schneider, A.; Wanner, G.; et al. Arabidopsis plants lacking PsbQ and PsbR subunits of the oxygen-evolving complex show altered PSII super-complex organization and short-term adaptive mechanisms. Plant J. 2013, 75, 671–684. [Google Scholar] [CrossRef] [PubMed]
- Gao, S.; Gu, W.; Xiong, Q.; Ge, F.; Xie, X.; Li, J.; Chen, W.; Pan, G.; Wang, G. Desiccation enhances phosphorylation of PSII and affects the distribution of protein complexes in the thylakoid membrane. Physiol. Plant 2015, 153, 492–502. [Google Scholar] [CrossRef]
- Grieco, M.; Jain, A.; Ebersberger, I.; Teige, M. An evolutionary view on thylakoid protein phosphorylation uncovers novel phosphorylation hotspots with potential functional implications. J. Exp. Bot. 2016, 67, 3883–3896. [Google Scholar] [CrossRef]
- Slekar, K.H.; Kosman, D.J.; Culotta, V.C. The yeast copper/zinc superoxide dismutase and the pentose phosphate pathway play overlapping roles in oxidative stress protection. J. Biol. Chem. 1996, 271, 28831–28836. [Google Scholar] [CrossRef]
- Pandolfi, P.P.; Sonati, F.; Rivi, R.; Mason, P.; Grosveld, F.; Luzzatto, L. Targeted disruption of the housekeeping gene encoding glucose 6-phosphate dehydrogenase (G6PD): G6PD is dispensable for pentose synthesis but essential for defense against oxidative stress. EMBO J. 1995, 14, 5209–5215. [Google Scholar] [CrossRef] [PubMed]
- Rapala-Kozik, M.; Wolak, N.; Kujda, M.; Banas, A.K. The upregulation of thiamine (vitamin B1) biosynthesis in Arabidopsis thaliana seedlings under salt and osmotic stress conditions is mediated by abscisic acid at the early stages of this stress response. BMC Plant Biol. 2012, 12, 2. [Google Scholar] [CrossRef]
- Wang, R.; Zhao, J.; Jia, M.; Xu, N.; Liang, S.; Shao, J.; Qi, Y.; Liu, X.; An, L.; Yu, F. Balance between cytosolic and chloroplast translation affects leaf variegation. Plant Physiol. 2017. [Google Scholar] [CrossRef]
- Wang, Y.; Hou, Y.; Qiu, J.; Li, Z.; Zhao, J.; Tong, X.; Zhang, J. A quantitative acetylomic analysis of early seed development in rice (Oryza sativa L.). Int. J. Mol. Sci. 2017, 18, 1376. [Google Scholar] [CrossRef]
- Xia, Y.; Jing, D.; Kong, L.; Zhang, J.; OuYang, F.; Zhang, H.; Wang, J.; Zhang, S. Global lysine acetylome analysis of desiccated somatic embryos of Picea asperata. Front Plant Sci. 2016, 7, 1927. [Google Scholar] [CrossRef] [PubMed]
- Finnemann, J.; Schjoerring, J.K. Post-translational regulation of cytosolic glutamine synthetase by reversible phosphorylation and 14-3-3 protein interaction. Plant J. 2010, 24, 171–181. [Google Scholar] [CrossRef]
- Wang, X.; Bian, Y.; Cheng, K.; Gu, L.F.; Ye, M.; Zou, H.; Sun, S.S.; He, J.X. A large-scale protein phosphorylation analysis reveals novel phosphorylation motifs and phosphoregulatory networks in Arabidopsis. J. Proteomics 2013, 78, 486–498. [Google Scholar] [CrossRef]
- Axel, T.; Katrin, P.; Anja, B.; Natalia, P.; Rowan, M.K.; Halford, N.G.; Peter, G. Evidence that SNF1-related kinase and hexokinase are involved in separate sugar-signalling pathways modulating post-translational redox activation of ADP-glucose pyrophosphorylase in potato tubers. Plant J. 2003, 35, 490–500. [Google Scholar]
- Sun, H.; Xia, B.; Wang, X.; Gao, F.; Zhou, Y. Quantitative phosphoproteomic analysis provides insight into the response to short-term drought stress in Ammopiptanthus mongolicus roots. Int. J. Mol. Sci. 2017, 18, 2158. [Google Scholar] [CrossRef]
- Wang, X.; Xu, Y.; Li, J.; Ren, Y.; Wang, Z.; Xin, Z.; Lin, T. Identification of two novel wheat drought tolerance-related proteins by comparative proteomic analysis combined with virus-induced gene silencing. Int. J. Mol. Sci. 2018, 19, 4020. [Google Scholar] [CrossRef]
- Zhang, Y.; Li, D.; Zhou, R.; Wang, X.; Dossa, K.; Wang, L.; Zhang, Y.; Yu, J.; Gong, H.; Zhang, X.; et al. Transcriptome and metabolome analyses of two contrasting sesame genotypes reveal the crucial biological pathways involved in rapid adaptive response to salt stress. BMC Plant Biol. 2019, 19, 66. [Google Scholar] [CrossRef]
- Rodermel, S. Pathways of plastid-to-nucleus signaling. Trends Plant Sci. 2001, 6, 471–478. [Google Scholar] [CrossRef]
- Miura, E.; Kato, Y.; Matsushima, R.; Albrecht, V.; Laalami, S.; Sakamoto, W. The balance between protein synthesis and degradation in chloroplasts determines leaf variegation in Arabidopsis yellow variegated mutants. Plant Cell 2007, 19, 1313–1328. [Google Scholar] [CrossRef]
- Sonenberg, N.; Morgan, M.A.; Merrick, W.C.; Shatkin, A.J. A polypeptide in eukaryotic initiation factors that crosslinks specifically to the 5’-terminal cap in mRNA. Proc. Natl. Acad. Sci. USA 1978, 75, 4843–4847. [Google Scholar] [CrossRef]
- Lamphear, B.J.; Kirchweger, R.; Skern, T.; Rhoads, R.E. Mapping of functional domains in eukaryotic protein synthesis initiation factor 4G (eIF4G) with picornaviral proteases. Implications for cap-dependent and cap-independent translational initiation. J. Biol. Chem. 1995, 270, 21975. [Google Scholar] [CrossRef]
- Zheng, M.; Liu, X.; Liang, S.; Fu, S.; Qi, Y.; Zhao, J.; Shao, J.; An, L.; Yu, F. Chloroplast translation initiation factors regulate leaf variegation and development. Plant Physiol. 2016, 172, 1117–1130. [Google Scholar] [CrossRef]
- Yu, F.; Liu, X.; Alsheikh, M.; Park, S.; Rodermel, S. Mutations in suppressor of variegation 1, a factor required for normal chloroplast translation, suppress var2-mediated leaf variegation in Arabidopsis. Plant Cell 2008, 20, 1786–1804. [Google Scholar] [CrossRef]
- Wu, L.; Wang, S.; Wu, J.; Han, Z.; Wang, R.; Wu, L.; Zhang, H.; Chen, Y.; Hu, X. Phosphoproteomic analysis of the resistant and susceptible genotypes of maize infected with sugarcane mosaic virus. Amino Acids 2015, 47, 483–496. [Google Scholar] [CrossRef]
- Kim, J.; Olinares, P.D.; Oh, S.H.; Ghisaura, S.; Poliakov, A.; Ponnala, L.; van Wijk, K.J. Modified Clp protease complex in the ClpP3 null mutant and consequences for chloroplast development and function in Arabidopsis. Plant Physiol. 2013, 162, 157–179. [Google Scholar] [CrossRef]
- Adam, Z.; Adamska, I.; Zheng, B.; Vallon, O.; Rodermel, S.R.; Shinozaki, K.; Clarke, A.K. Chloroplast and mitochondrial proteases in Arabidopsis. A proposed nomenclature. Plant Physiol. 2001, 125, 1912–1918. [Google Scholar] [CrossRef]
- Apitz, J.; Nishimura, K.; Schmied, J.; Wolf, A.; Hedtke, B.; van Wijk, K.J.; Grimm, B. Posttranslational control of ALA synthesis includes GluTR degradation by Clp protease and stabilization by GluTR-binding protein. Plant Physiol. 2016, 170, 2040–2051. [Google Scholar] [CrossRef]
- Ramundo, S.; Casero, D.; Muhlhaus, T.; Hemme, D.; Sommer, F.; Crevecoeur, M.; Rahire, M.; Schroda, M.; Rusch, J.; Goodenough, U.; et al. Conditional depletion of the Chlamydomonas chloroplast ClpP protease activates nuclear genes involved in autophagy and plastid protein quality control. Plant Cell 2014, 26, 2201–2222. [Google Scholar] [CrossRef] [PubMed]
- Kato, Y.; Miura, E.; Ido, K.; Ifuku, K.; Sakamoto, W. The variegated mutants lacking chloroplastic FtsHs are defective in D1 degradation and accumulate reactive oxygen species. Plant Physiol. 2009, 151, 1790–1801. [Google Scholar] [CrossRef]
- Kurokawa, M.; Kornbluth, S. Caspases and kinases in a death grip. Cell 2009, 138, 838–854. [Google Scholar] [CrossRef]
- Tikkanen, M.; Aro, E.M. Thylakoid protein phosphorylation in dynamic regulation of photosystem II in higher plants. Biochim. Biophys. Acta 2012, 1817, 232–238. [Google Scholar] [CrossRef]
- Zhang, D.; Li, Y.; Zhang, X.; Zha, P.; Lin, R. The SWI2/SNF2 chromatin remodeling ATPase BRAHMA regulates chlorophyll biosynthesis in Arabidopsis. Mol. Plant 2017, 10, 155–167. [Google Scholar] [CrossRef]
- Peirats-Llobet, M.; Han, S.K.; Gonzalez-Guzman, M.; Jeong, C.W.; Rodriguez, L.; Belda-Palazon, B.; Wagner, D.; Rodriguez, P.L. A direct link between abscisic acid sensing and the chromatin-remodeling ATPase BRAHMA via core ABA signaling pathway components. Mol. Plant 2016, 9, 136–147. [Google Scholar] [CrossRef]
- Pi, E.; Zhu, C.; Fan, W.; Huang, Y.; Qu, L.; Li, Y.; Zhao, Q.; Ding, F.; Qiu, L.; Wang, H. Quantitative phosphoproteomic and metabonomic analyses reveal GmMYB173 optimizes flavonoid metabolism in soybean under salt stress. Mol. Cell. Proteomics 2018, 17, 1209–1224. [Google Scholar] [CrossRef]
- Gu, Z.; Zhu, J.; Hao, Q.; Yuan, Y.W.; Duan, Y.; Men, S.; Wang, Q.; Hou, Q.; An Liu, Z.; Shu, Q.; et al. A novel R2R3-MYB transcription factor contributes to petal blotch formation by regulating organ-specific expression of PsCHS in tree peony (Paeonia suffruticosa). Plant Cell Physiol. 2018, 60, 599–611. [Google Scholar] [CrossRef]
- Seibert, M.; Kruger, M.; Watson, N.A.; Sen, O.; Daum, J.R.; Slotman, J.A.; Braun, T.; Houtsmuller, A.B.; Gorbsky, G.J.; Jacob, R.; et al. CDK1-mediated phosphorylation at H2B serine 6 is required for mitotic chromosome segregation. J. Cell Biol. 2019, 218, 1164. [Google Scholar] [CrossRef]
- Baker, N.R.; Oxborough, K. Chlorophyll fluorescence as a probe of photosynthetic productivity. In Chlorophyll a Fluorescence; Papageorgiou, G.C., Govindjee, Eds.; Springer: Dordrecht, the Netherlands, 2004; pp. 65–82. [Google Scholar]
- Lichtenthaler, H.K. Chlorophylls and carotenoids: Pigments of photosynthetic biomembranes. Methods Enzymol. 1987, 148C, 350–382. [Google Scholar]
- Tong, J.; Helmy, M.; Cavalli, F.M.; Jin, L.; St-Germain, J.; Karisch, R.; Taylor, P.; Minden, M.D.; Taylor, M.D.; Neel, B.G.; et al. Integrated analysis of proteome, phosphotyrosine-proteome, tyrosine-kinome, and tyrosine-phosphatome in acute myeloid leukemia. Proteomics 2017, 17, 1600361. [Google Scholar] [CrossRef] [PubMed]
- Xu, X.; Liu, T.; Yang, J.; Chen, L.; Liu, B.; Wang, L.; Jin, Q. The first whole cell proteome and lysine acetylome based comparison between Trichophyton rubrum conidial and mycelial stages. J. Proteome Res. 2018, 17, 1436–1451. [Google Scholar] [CrossRef]
- Wang, J. The Genome of Catalpa bungei Provides Insights into the Disease Resistance and the Wood Formation. Unpublished work. 2019. [Google Scholar]
- Wang, N.; Zhang, S.; Wang, J. Comprehensive Analyses Reveal the Mechanism of Natural Variegated Leaf in Catalpa fargesii by Transcriptome and Proteome Profiling. Unpublished work. 2019. [Google Scholar]


© 2019 by the authors. Licensee MDPI, Basel, Switzerland. This article is an open access article distributed under the terms and conditions of the Creative Commons Attribution (CC BY) license (http://creativecommons.org/licenses/by/4.0/).
Share and Cite
Wang, N.; Zhu, T.; Lu, N.; Wang, Z.; Yang, G.; Qu, G.; Kong, L.; Zhang, S.; Ma, W.; Wang, J. Quantitative Phosphoproteomic and Physiological Analyses Provide Insights into the Formation of the Variegated Leaf in Catalpa fargesii. Int. J. Mol. Sci. 2019, 20, 1895. https://doi.org/10.3390/ijms20081895
Wang N, Zhu T, Lu N, Wang Z, Yang G, Qu G, Kong L, Zhang S, Ma W, Wang J. Quantitative Phosphoproteomic and Physiological Analyses Provide Insights into the Formation of the Variegated Leaf in Catalpa fargesii. International Journal of Molecular Sciences. 2019; 20(8):1895. https://doi.org/10.3390/ijms20081895
Chicago/Turabian StyleWang, Nan, Tianqing Zhu, Nan Lu, Zhi Wang, Guijuan Yang, Guanzheng Qu, Lisheng Kong, Shougong Zhang, Wenjun Ma, and Junhui Wang. 2019. "Quantitative Phosphoproteomic and Physiological Analyses Provide Insights into the Formation of the Variegated Leaf in Catalpa fargesii" International Journal of Molecular Sciences 20, no. 8: 1895. https://doi.org/10.3390/ijms20081895