Article

Oligomeric Architecture of Mouse Activating Nkrp1 Receptors on Living Cells

1
Laboratory of Structural Biology and Cell Signaling, Institute of Microbiology, The Czech Academy of Sciences, Vídeňská 1083, 14220 Prague 4, Czech Republic
2
Department of Biophysical Chemistry, J. Heyrovsky Institute of Physical Chemistry, The Czech Academy of Sciences, Dolejškova 2155/3, 18223 Prague 8, Czech Republic
3
Department of Biochemistry, Charles University, Hlavova 8, 12843 Prague 2, Czech Republic
*
Author to whom correspondence should be addressed.
Int. J. Mol. Sci. 2019, 20(8), 1884; https://doi.org/10.3390/ijms20081884
Submission received: 12 March 2019 / Revised: 4 April 2019 / Accepted: 10 April 2019 / Published: 16 April 2019
(This article belongs to the Special Issue Protein Structural Dynamics 2019)

Abstract

:
Mouse activating Nkrp1 proteins are commonly described as type II transmembrane receptors with disulfide-linked homodimeric structure. Their function and the manner in which Nkrp1 proteins of mouse strain (C57BL/6) oligomerize are still poorly understood. To assess the oligomerization state of Nkrp1 proteins, mouse activating EGFP-Nkrp1s were expressed in mammalian lymphoid cells and their oligomerization evaluated by Förster resonance energy transfer (FRET). Alternatively, Nkrp1s oligomers were detected by Western blotting to specify the ratio between monomeric and dimeric forms. We also performed structural characterization of recombinant ectodomains of activating Nkrp1 receptors. Nkrp1 isoforms c1, c2 and f were expressed prevalently as homodimers, whereas the Nkrp1a displays larger proportion of monomers on the cell surface. Cysteine-to-serine mutants revealed the importance of all stalk cysteines for protein dimerization in living cells with a major influence of cysteine at position 74 in two Nkrp1 protein isoforms. Our results represent a new insight into the oligomerization of Nkrp1 receptors on lymphoid cells, which will help to determine their function.

1. Introduction

Natural killer (NK) cells are innate lymphocytes that play an essential role against virally infected and tumor cells [1]. The specificity of NK cells is controlled by a repertoire of activating and inhibitory cell surface receptors [2], which are divided into two distinct structural groups: the immunoglobulin superfamily and the C-Type Lectin-like Receptor (CTLR) family [3]. Mouse Nkrp1 proteins belong to the CTLR family and have been initially compared with their rat homolog. The rat Nkrp1 is a type II transmembrane disulfide-linked homodimer [4] which stimulates NK cells [5,6], especially phosphatidylinositol turnover, Ca2+ mobilization [7], cytolytic processes [6] and cell degranulation [6]. These findings have been subsequently extrapolated to the mouse Nkrp1 molecule. The murine Nkrp1 gene family encodes five members with either an activating or an inhibitory function; isoforms Nkrp1a, c and f are activating, and b/d and g have inhibitory function [4,8,9,10,11,12]. The first receptor identified to be selectively expressed by NK cells was the mouse NK1.1 antigen [13], later named Nkrp1c. The NK1.1 was defined as a 39 kDa glycoprotein [14] capable of inducing lytic functions of NK cells after cross-linking with a specific monoclonal antibody (PK136) [15]. Characterization of other NK alloantigens [16] and molecular cloning of mouse Nkrp1 proteins [8,17] provided a new insight into the nature of this receptor. In 1992, Ryan et al. [17] demonstrated that mouse NK1.1 antigen exhibits a homodimeric state when immunoprecipitated by the PK136 antibody, similar to its rat homolog.
An increasing body of evidence in recent years has provided support for Nkrp1 binding of C-type lectin-related ligands (Clr) [18,19], which are genetically linked to the Nkrp1 genes [18,20]. Recent work has shown that a structurally divergent, viral Ig-like m12 immunoevasin is also a ligand for the inhibitory Nkrp1b and activating Nkrp1a/c receptors [21].
In previous studies, all Nkrp1 receptors were considered to be disulfide-linked dimers. However, the number of extracellular cysteine residues varies, e.g., in between activating Nkrp1 proteins expressed in C57BL/6 mouse strain. Four cysteines of the extracellular domain are highly conserved and form two intramolecular disulfide bridges [22]. Intriguingly, besides simply connecting the CTLD to the plasma membrane, the stalk region might be a key player in the oligomeric architecture of the Nkrp1 receptors. Experimental data support the existence of dimers for Nkrp1b/d [18] and Nkrp1c proteins [17]. The oligomeric state of the remaining murine isoforms is unknown. Furthermore, no live cell imaging data for any of the Nkrp1 receptors have been published so far.
To investigate the oligomerization state of murine activating Nkrp1 proteins, a panel of native receptors and their stalk cysteine-to-serine mutants fused to EGFP protein was expressed in mammalian cells. Using microscopic techniques, the protein subcellular localization was studied. A monomer/dimer distribution on the plasma membrane of living cells were monitored by a variant of Förster resonance energy transfer (FRET) technique—fluorescence anisotropy (also called homo-FRET). The existence of monomer and dimer isoforms of mouse Nkrp1 was further verified by immunoblotting after solubilization of cell membranes. Additionally, ectodomains of native activating Nkrp1 isoforms (a, c1, c2, and f) were heterologously produced, refolded and structurally characterized. All our data indicate tight control of the dimeric state of Nkrp1 isoforms by specific cysteine residues present in their stalk domains.

2. Results

2.1. Surface Localization of Mouse Activating Nkrp1 Proteins in Mammalian Cells

To function as NK receptors, Nkrp1 proteins must localize to the cell surface. We have thus evaluated the surface expression of EGFP-fusion of murine activating Nkrp1 proteins in cultured human Jurkat cells which do not express murine receptors endogenously. Endogenous expression of Nkrp1 proteins would affect FRET analysis used to determine dimerization state of the receptors (see below). As shown in Figure 1A–D, all tested Nkrp1 isoforms were efficiently sorted to the plasma membrane of Jurkat T cells.
Cysteines in the extracellular part are often involved in dimerization of surface receptors [23]. In the stalk region, there are two cysteines in Nkrp1a, three in Nkrp1c1, two in Nkrp1c2 and sole a cysteine residue in Nkrp1f which can potentially form intermolecular disulfide bonds. Cysteine-to-serine mutants were prepared to determine the involvement of these residues in dimerization of murine activating Nkrp1 proteins. We were thus interested in whether these cysteine-to-serine mutations influence protein expression and cell surface localization of the receptors. None of these mutations altered distribution of tested variants (Figure A1). Cysteine-to-serine mutants were localized at the surface of Jurkat cells similar to their native variants. All receptor variants also exhibited localization to the Golgi apparatus which was probably caused by transient expression of these proteins. It is worth mention that cysteine-to-serine mutation instead cysteine-to-alanine was selected because serine and cysteine differ only in the swap of a sulfur atom with oxygen and share a high level of similarity in terms of size and structure. Furthermore, all mutations were located only in the stalk region which is expected to be fully exposed to the solvent. Thus, the substitution to serine residue, rather than alanine residue, which is more hydrophobic, appears to be more meaningful.

2.2. Stoichiometry of Nkrp1 Proteins in Mammalian Cells

2.2.1. Homo-FRET Analysis of Nkrp1 Proteins in Living Jurkat Cells

A sufficient expression and surface localization of all Nkrp1 variants enabled direct analysis of their oligomerization state in living cells by fluorescence anisotropy (donor-donor energy transfer). This technique was preferred for studies of Nkrp1 homo-oligomerization for two main reasons: First, results of more common hetero-FRET analysis (energy transfer from one fluorescent dye–donor–to another dye–acceptor) are strongly affected by expression levels of donor and acceptor. The use of a single fluorescently labelled protein (as for the anisotropy technique) eliminates this limitation. Second, stochastic pairing of proteins tagged with the same fluorophore (e.g., GFP-GFP) reduces sensitivity of hetero-FRET measurements to homo-dimers. Since FRET measurements using fluorescent proteins in living cells are prone to low sensitivity [24], it is important to select conditions which maximize sensitivity. This is fulfilled by measuring homo-FRET of exogenous fluorescently labelled proteins in the absence of endogenous interacting molecules. On the other hand, homo-FRET measurements are strictly semi-quantitative [25] and require calibration by monomeric and dimeric controls. Till this point, we used monomeric LAT (linker of activated T cells) and dimeric CD8α proteins as controls for homo-FRET oligomerization analysis of Nkrp1 proteins. As anticipated, steady-state anisotropy of LAT was significantly higher than that of CD8α, corresponding to CD8α forming dimers or higher oligomeric states and monomeric state of LAT (Figure 2A,B).
Figure 2A also presents steady-state anisotropy values determined for Nkrp1 proteins transiently expressed in Jurkat cells in the form of EGFP fusion proteins. Almost identical values of steady-state anisotropy were measured for dimeric control (CD8α) and Nkrp1c1. These data from living cells thus support the earlier observation that murine Nkrp1c1 forms stable dimers [17]. Isoforms c1 and c2 differ only by three amino acid residues in the stalk region, one of which is cysteine at the position 88 (with respect to Nkrp1c1 numbering; Figure A2). Since Nkrp1c1 has one additional cysteine compared to the c2 isoform, it is important to determine its involvement in protein dimerization. The data obtained reveals comparable levels of dimerization for Nkrp1c1, Nkrp1c2, as well as Nkrp1f isoforms (Figure 2A). Cysteine 88, which is also missing in the stalk region of Nkrp1f, therefore cannot be involved in dimerization of Nkrp1 receptors. Much higher steady-state anisotropy was measured for Nkrp1a1 which contains cysteine 88 in its stalk region but lacks one of the cysteine residues at the positions 74–75 when compared to the native Nkrp1c1 isoform. This result suggests less dimeric character of this isoform. However, Nkrp1a1 anisotropy also diverges from a monomeric control (LAT; Figure 2A), indicating the existence of some proportion of Nkrp1a1 dimers/oligomers which are in equilibrium with monomers on the surface of living Jurkat cells. Altogether, the steady-state anisotropy measurements imply the existence of diverse populations of Nkrp1 receptors in the plasma membrane of living Jurkat cells (Figure 2A).
Cysteine-to-serine stalk mutants of Nkrp1 proteins support these conclusions (Figure 2B). Whereas no change in measured steady-state anisotropy was observed for single residue mutants (C74S or C88S) of Nkrp1a1, its dimerization was significantly reduced when both cysteines were changed for serines (C74,88S variant; Figure 2B). On the contrary, a mutation of single cysteine (C74S) strongly reduced dimerization level of Nkrp1f. Indeed, steady-state anisotropy values measured for this mutant corresponded to that of double cysteine mutant (C74,88S) of Nkrp1a1, (Table A1) indicating that this mutation leads to similar changes in the organization of Nkrp1 on the surface of Jurkat cells. Steady-state anisotropy values measured for Nkrp1c1_C74,75S double mutant correspond to that of a single cysteine mutant C74S of Nkrp1a. Cysteine residue at the position 88 remains intact in these mutants. These live-cell data thus demonstrate formation of tight dimers by c1, c2 and f isoforms but much looser assemblies of the a1 isoform at the plasma membrane of Jurkat cells. The formation is regulated by exact positions of cysteine residues in the stalk region of the Nkrp1 proteins. The overview of cysteines mutation represents Figure 2C.

2.2.2. Western Blotting of Nkrp1 Protein Variants in COS-7 cell Lysates

To further support diverse oligomerization states of Nkrp1 isoforms in mammalian cells, we determined the molecular weight of Nkrp1 protein complexes by immunoblotting of cell lysates after non-reducing acrylamide gel electrophoresis. This biochemical approach required a larger number of transfected cells for each sample, thus we employed COS-7 cells for a larger scale protein expression. In addition, the use of such a different cell type (Rhesus monkey kidney fibroblasts) provides another model to investigate cell-type independent oligomerization of Nkrp1 receptors. COS-7 cells were transiently transfected with native isoforms and cysteine-to-serine mutants of EGFP-Nkrp1 fusion proteins. Cells were lysed on ice in the presence of iodoacetamide to block free thiol groups of cysteines and prevent non-specific disulfide bond scrambling. Cell lysates were then analyzed by immunoblotting with anti-GFP antibody. Under reducing conditions, all EGFP-Nkrp1 proteins migrated as monomers (Figure 3A). Results from non-reducing conditions showed a presence of a mixture of monomers, dimers and higher order oligomers for almost all tested EGFP-Nkrp1 proteins including cysteine-to-serine stalk mutants (Figure 3B). In agreement with FRET results, dimers were the dominant oligomeric state detected for isoforms c1, c2 and f. In these experiments, a larger proportion of monomers was found for Nkrp1c2 compared to Nkrp1c1 proteins. A lower expression level of Nkrp1a prevents its direct comparison to the abovementioned dimeric isoforms but the presence of both, the protein monomers and dimers is well detectable, as is for its mutants (Figure 3B). Interestingly, only dimers were detected for C88S single residue mutant of Nkrp1a1. This result contrasts with the anisotropy values measured in living Jurkat cells, which are comparable to the native Nkrp1a protein, and may indicate slight differences between the cell environment or limitations of this method. Decreased appearance in the level of dimers found for C74,88S double mutant compared to its native variant supports lower oligomerization of this mutant observed by homo-FRET (Figure 2B). A similar effect was observed for C74S mutant of Nkrp1f. On the contrary, only minor increase of monomers was observed for C74,75S double mutant of c1 isoform which, similar to the native protein, exhibited almost exclusively dimeric character in these experiments (Figure 3B). These biochemical results indicate that Nkrp1 receptors form dimers with isoform-specific efficiency and, thus, support the homo-FRET data acquired in living lymphoid cells. Actin was used as a loading control (Figure 3C).

2.3. Refolding, Purification and Evaluation of Disulfide Bonds in Recombinant Murine Activating Nkrp1 Proteins

To better understand how extracellular cysteines of Nkrp1 receptors are involved in the formation of intra- and inter-molecular disulfide bridges, recombinant ectodomains of these proteins (Nkrp1ECTO) were expressed in E. coli, purified, refolded and structurally characterized (see Material and Methods for more details). The final yields of purified Nkrp1 ectodomains per liter of bacterial culture were: 12 mg of Nkrp1aECTO, 1-2 mg of dimeric Nkrp1c1ECTO, 8 mg of Nkrp1c2ECTO, and 6.5 mg of Nkrp1fECTO. Size-exclusion chromatography of purified protein ectodomains was performed to characterize the homogeneity of the samples (Figure A3). Receptor isoforms a1 and c2 show almost exclusively a single peak in the chromatograms indicating their high purity and low variation in stoichiometry. On the contrary, a broader spectrum of peaks was detected on chromatograms for ectodomains of isoforms c1 and f (Figure A3). This suggests the coexistence of two or more oligomeric states under these conditions. Main peaks were used to isolate individual forms of recombinant Nkrp1 ectodomains and analyzed by SDS-PAGE in a 15% polyacrylamide gel under reducing and non-reducing conditions (Figure 4). Ectodomains of isoforms c1 and f were found to form both monomers and dimers. Only monomeric forms were found for the remaining isoforms (a1 and c2).
To further demonstrate the capacity of Nkrp1 ectodomains to dimerize and the oxidative state of cysteines, the exact mass of purified recombinant Nkrp1ECTO proteins was determined by electrospray ESI-FT-ICR mass spectrometry. Monoisotopic masses of Nkrp1ECTO proteins in native and reducing conditions are summarized in Table 1. The difference between monoisotopic mass of oxidized and reduced proteins corresponded to the predicted monoisotopic mass for proteins with all paired cysteines. Ectodomains of Nkrp1a and Nkrp1c2 possess four disulfide bonds, Nkrp1c1ECTO protein has four disulfide bridges and one free cysteine, and Nkrp1fECTO contains three cysteine pairs and one unpaired cysteine residue. Moreover, the Nkrpc1ECTO and Nkrp1fECTO bearing odd number of cysteine residues were found in both monomerric and dimeric states.
The ectodomains of mouse Nkrp1 proteins contain six to nine cysteine residues. We were thus interested to know which cysteines form intra- and inter-molecular bonds. Purified recombinant Nkrp1ECTO proteins were subjected to proteolytic reactions by trypsin, AspN and GluC proteases according to published protocol [26] and disulfide bond mapping was performed. Peptides generated by the enzymatic digestion containing disulfide-linkages are summarized in Table A4. Standard cysteine linkages of C-Type Lectin-like Domain (CTLD) were observed for all activating Nkrp1 proteins (Figure 5, grey area). The only differences were found in the stalk region. Intramolecular bonds between C74-C88 were observed within Nkrp1aECTO and C74-C75 within Nkrp1c1ECTO and Nkrp1c2ECTO molecules. Moreover, intermolecular connections between C88-C88 and C74-C74 were identified within Nkrp1c1ECTO and Nkrp1fECTO molecules, respectively. Such observation was supported by the fact that C88 of Nkrp1c1ECTO and C74 of Nkrp1fECTO were identified as an unpaired cysteine bearing cysteamine moiety when the monomeric forms were analyzed. Schematic illustration of the final disulfide arrangement of recombinant Nkrp1 ectodomains is shown in Figure 5. Structural models of Nkrp1aECTO and Nkrp1c1ECTO proteins (Figure A4) display positions of the surface available to cysteine residues potentially available for intermolecular disulfide bonding.

3. Discussion

Dimerization and oligomerization can positively or negatively regulate function of proteins without a need for their de novo synthesis or downregulation. In biological systems, many key cell-surface proteins such as G-protein-coupled receptors [27,28], ion channels [29], insulin receptor [30], receptor tyrosine kinases [31], members of the cytokine receptor superfamily [32,33] and enzyme complexes [34,35,36], can exist as homo- or hetero-di/oligomers. Historically, functional and biochemical data acquired in the experiments using rat Nkrp1 protein were widely and directly extrapolated to Nkrp1 molecules from other species (including mouse). Virtually all Nkrp1 receptors have been previously schematically depicted as disulfide-linked homodimers. However, to date, there is literally just a single study demonstrating homodimerization of mouse Nkrp1c upon antibody crosslinking [17]. To approach for the function of mouse Nkrp1 proteins, which is still unclear, understanding of basic protein structure is fundamental and obligatory.
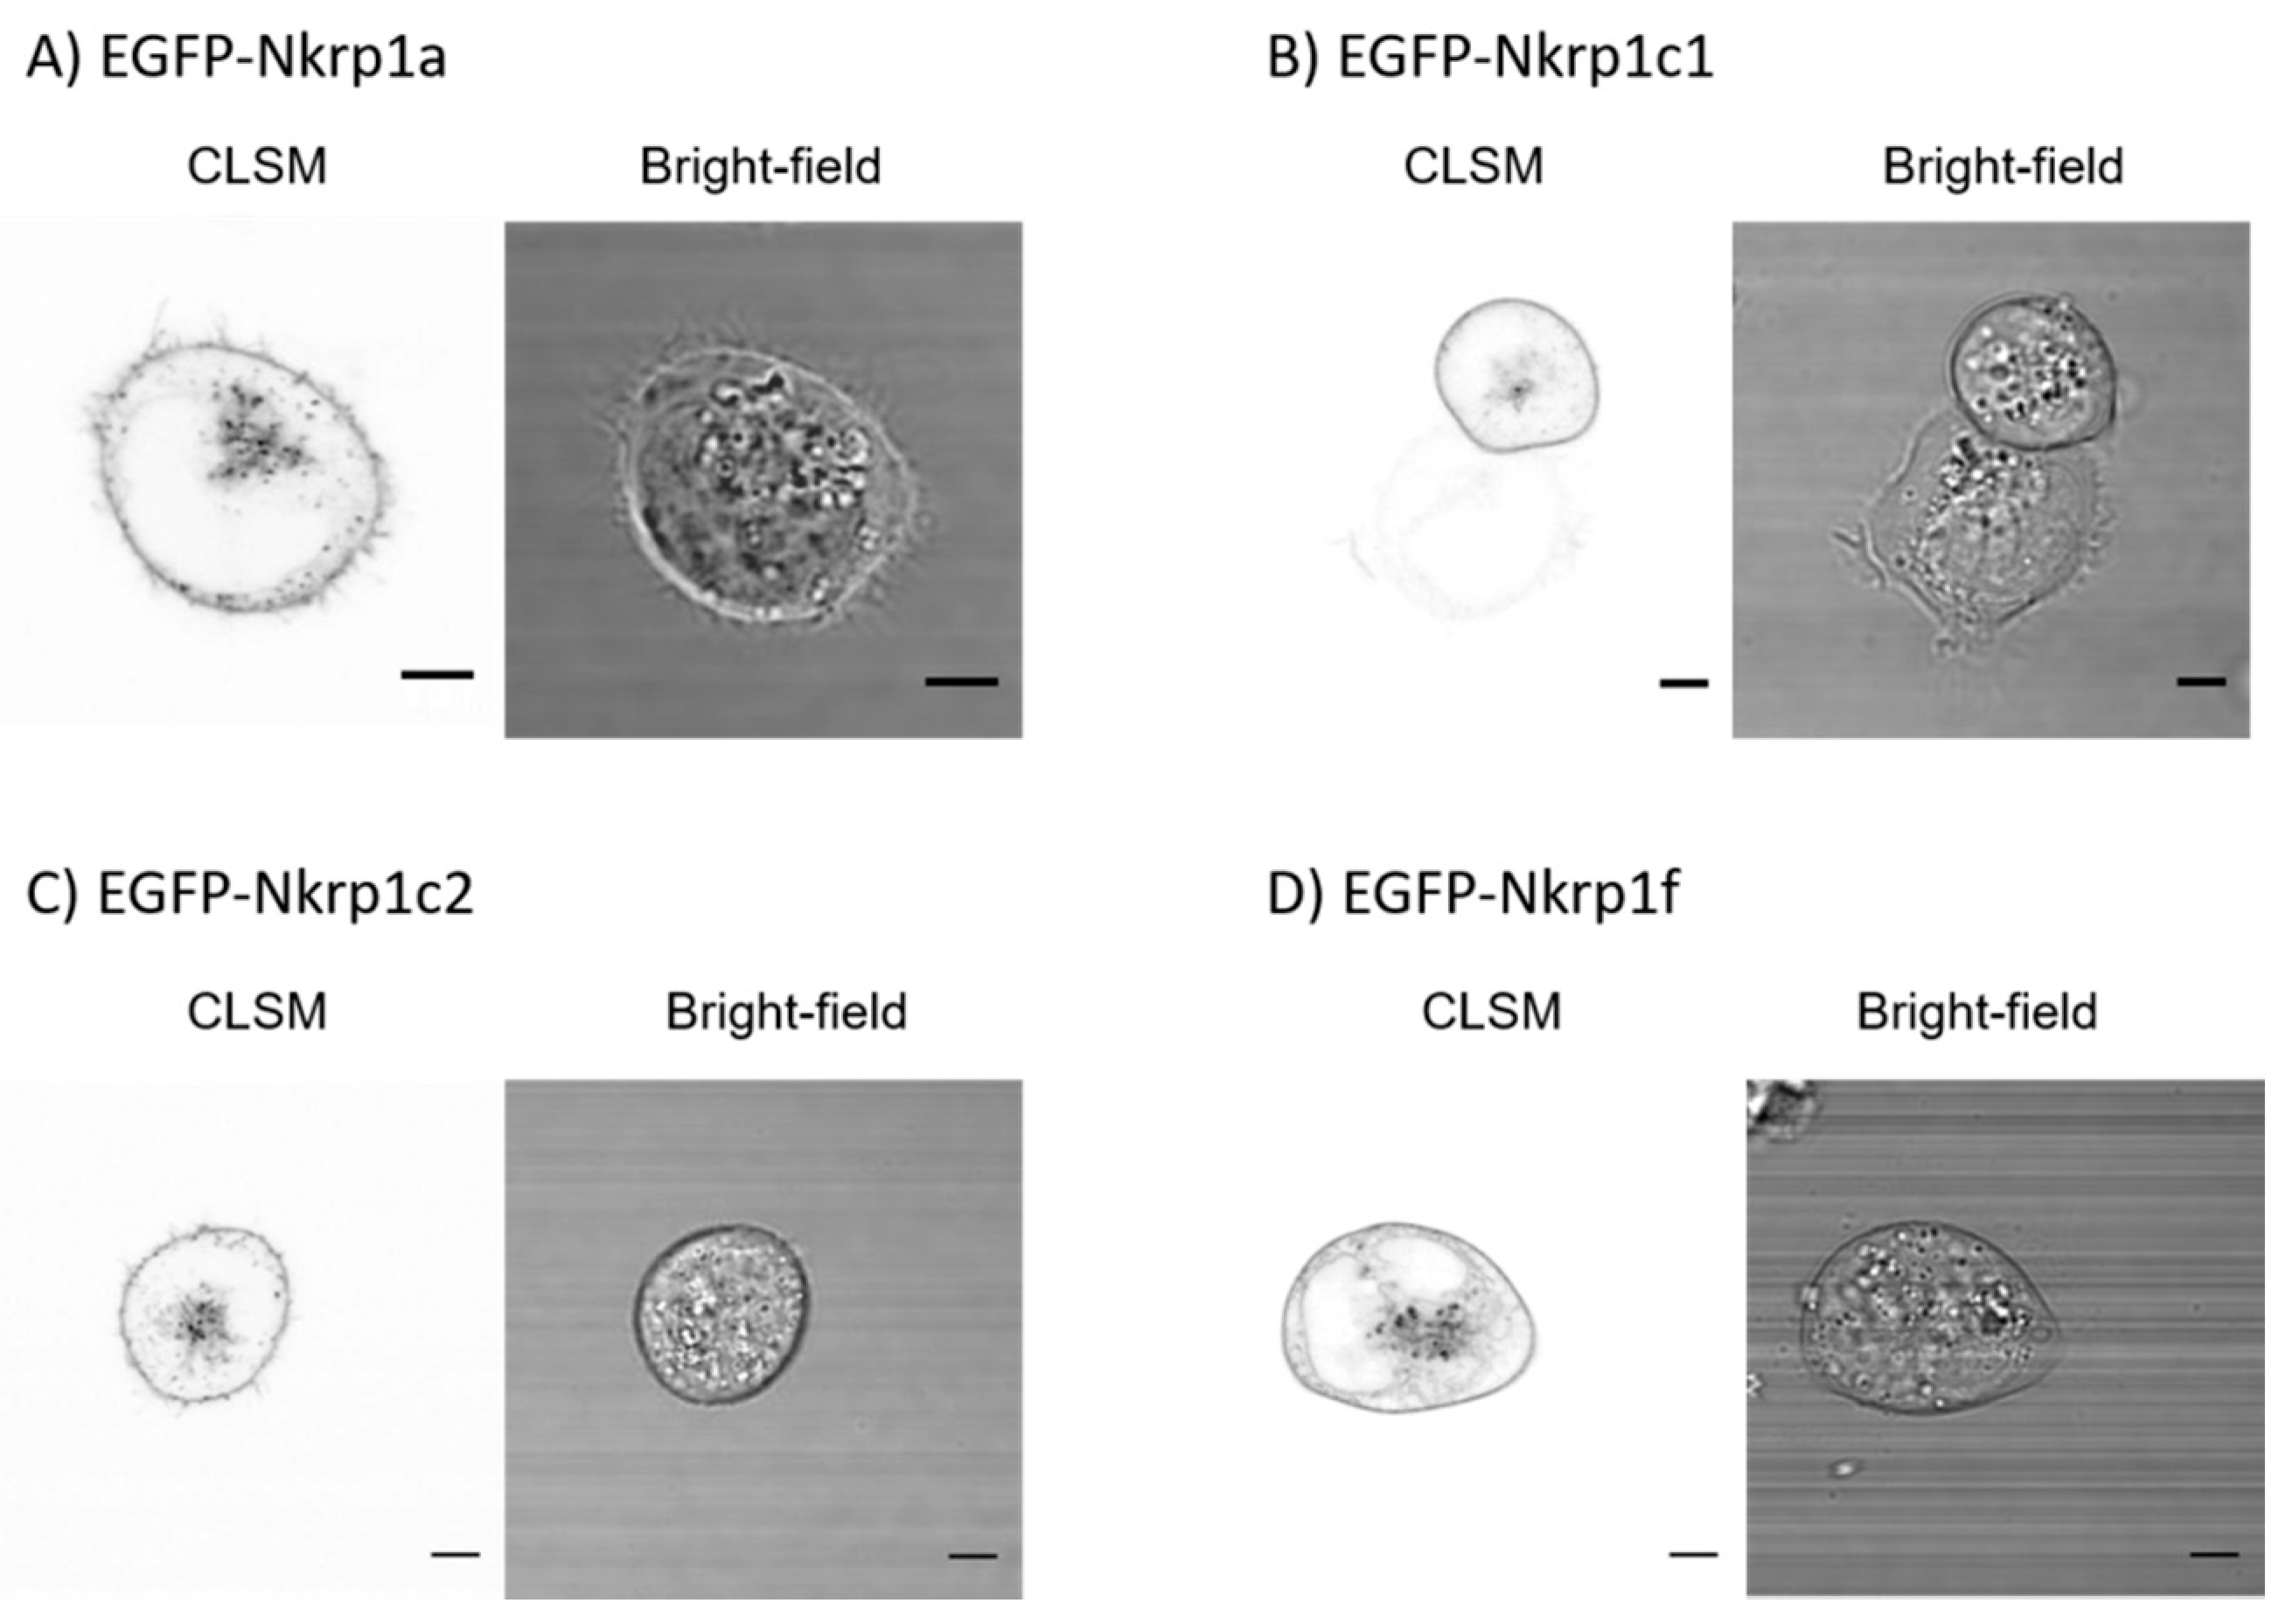
Here, we determined the oligomeric state of mouse activating Nkrp1 proteins in living mammalian cells. As expected, a good surface expression was found for all tested Nkrp1 proteins in several cell lines (Jurkat T-cells, COS-7, RAW264.7 and HeLa cells; Figure 1, A1 and ref. [37]). Interestingly, mouse Nkrp1 receptors conjugated to EGFP protein were toxic for the mouse macrophage RAW264.7 cells [37]. On the contrary, good protein expression was achieved in Jurkat (Figure 1), COS-7 (Figure 3) and HeLa cells [37]. Cysteine-to-serine mutations in the stalk region did not significantly affect protein localization in Jurkat cells (Figure A1). For live cell imaging and steady-state anisotropy measurements, suspension Jurkat cell line was utilized considering easier manipulation during experiments and their lymphoid origin. Moreover, their round cell morphology is advantageous for homo-FRET data analysis. Monkey kidney cells, COS-7, were used to investigate oligomeric state of Nkrp1 receptors by biochemical approach due to higher yields of proteins required for this technique.
Our results from fluorescence microscopy (Figure 2), biochemical (Figure 3) and structural analyses (Figure 4 and 
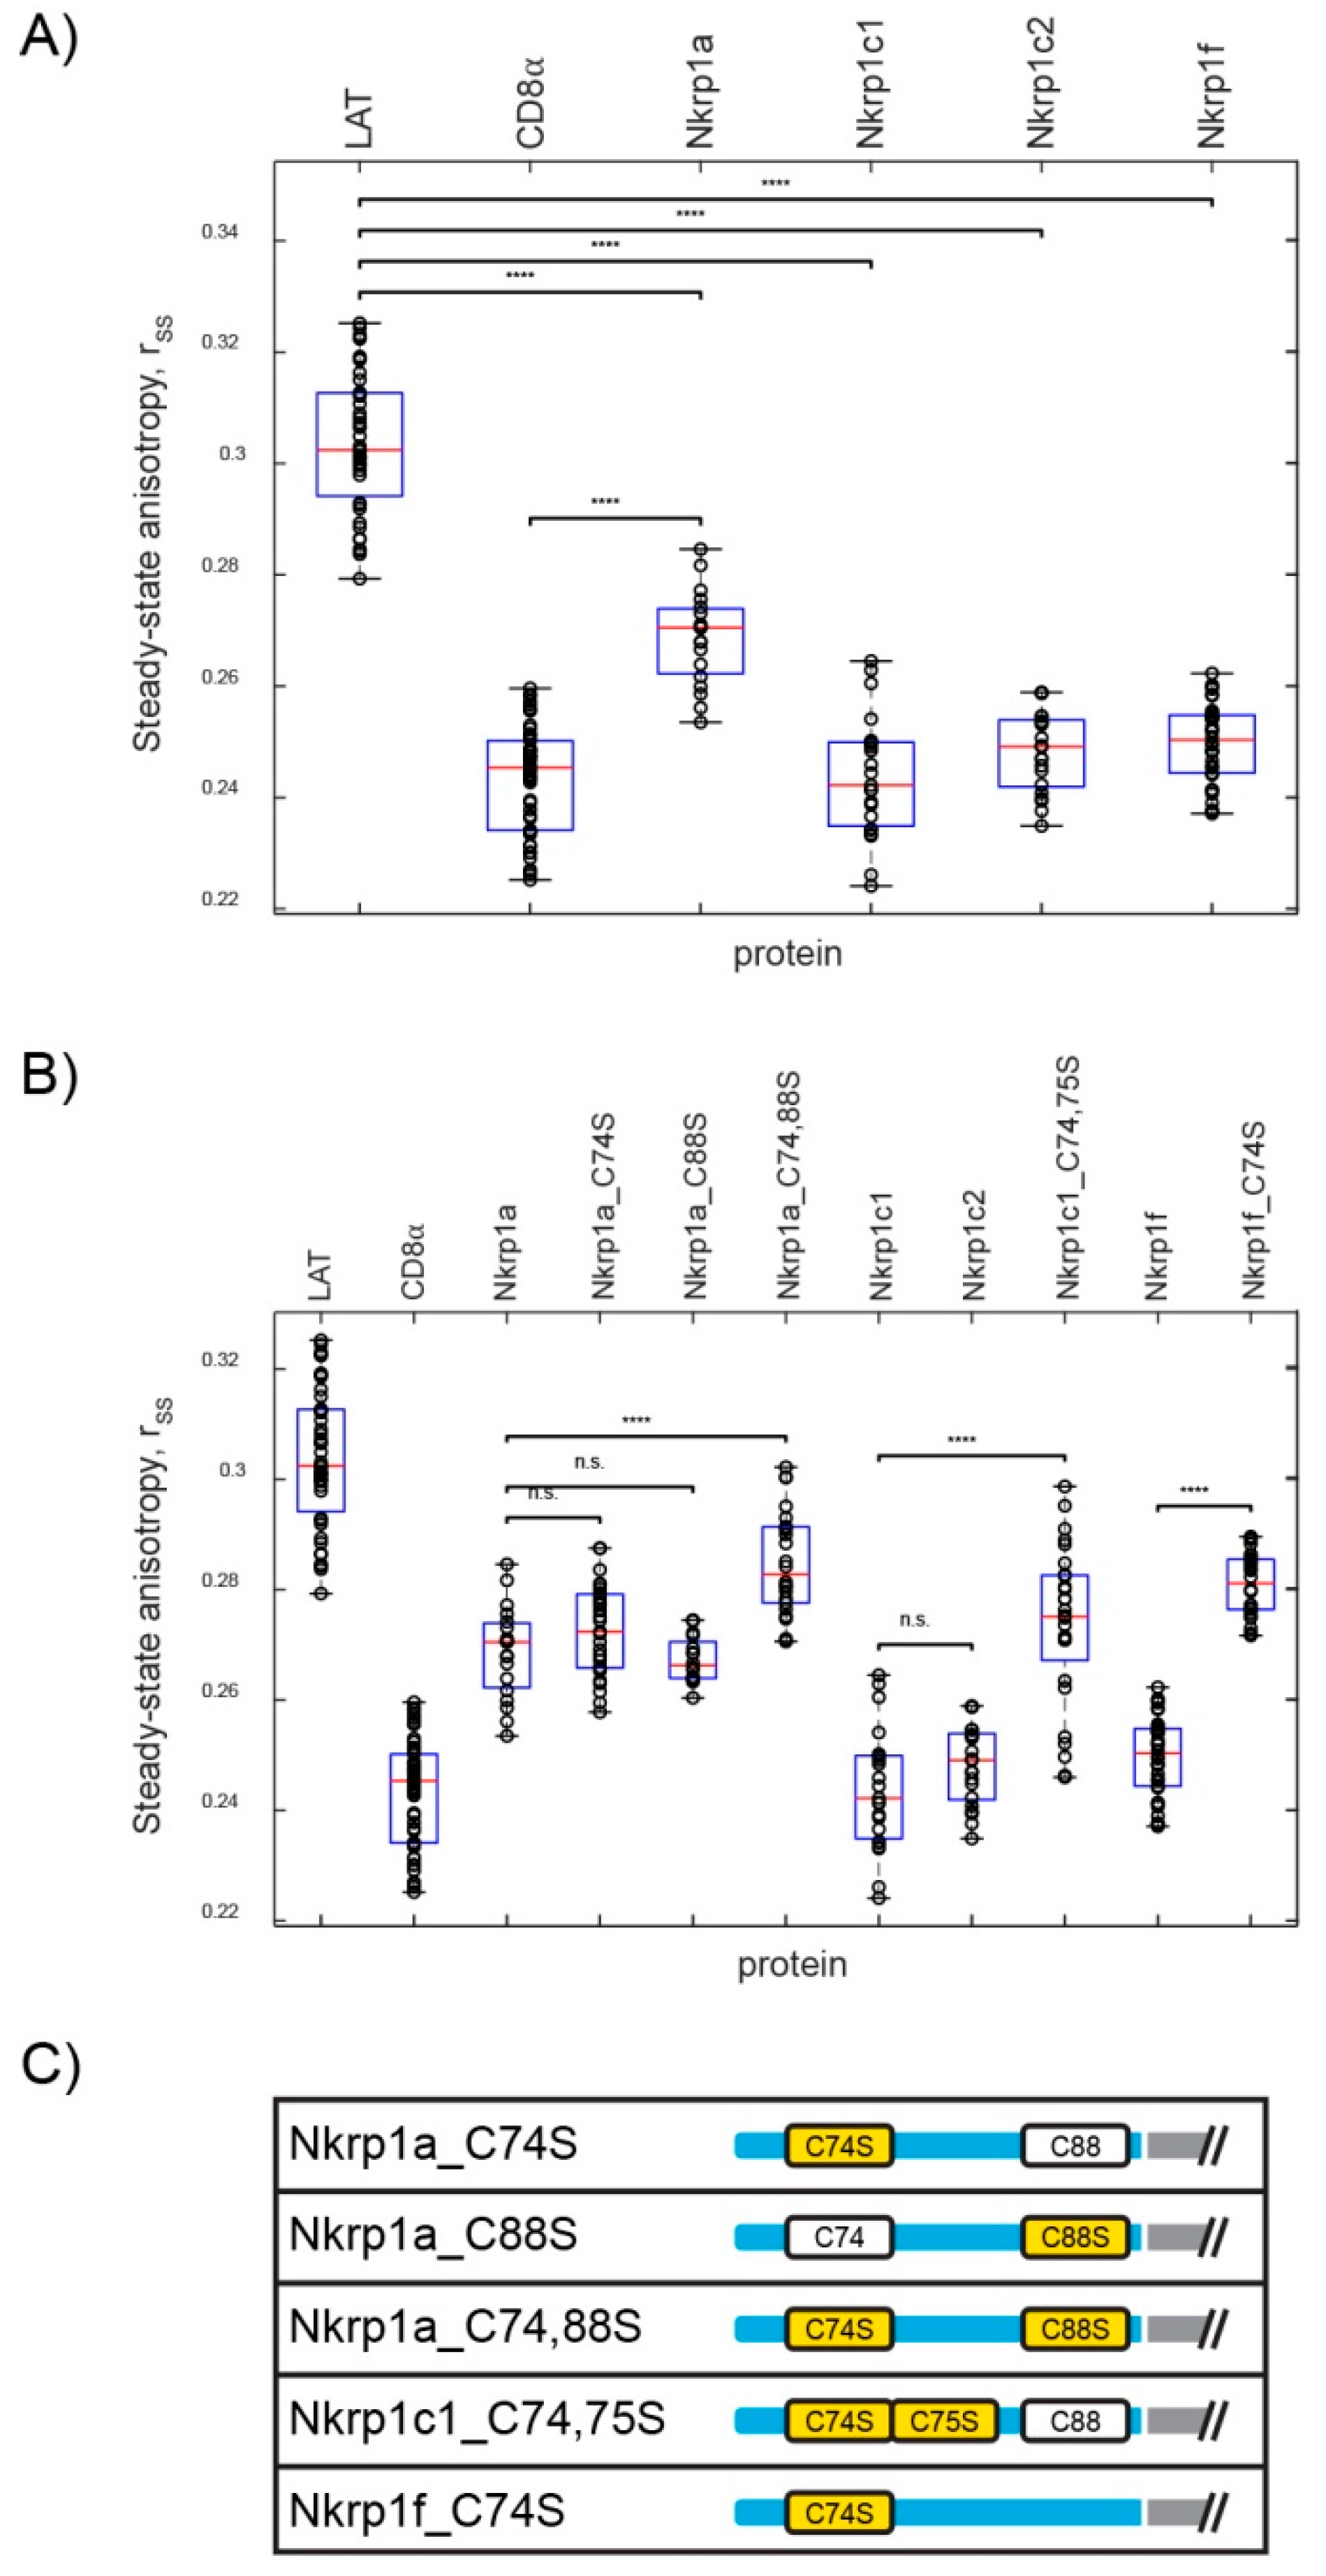
Figure 5) point towards complex regulation of oligomerization of murine Nkrp1 receptors. Native Nkrp1c1, Nkrpc2 and Nkrp1f receptors form prevalently dimers (or higher order structures) on the surface of living lymphoid cells (Figure 2A). The native form of Nkrp1a displayed a more monomeric character when compared to the other isoforms (
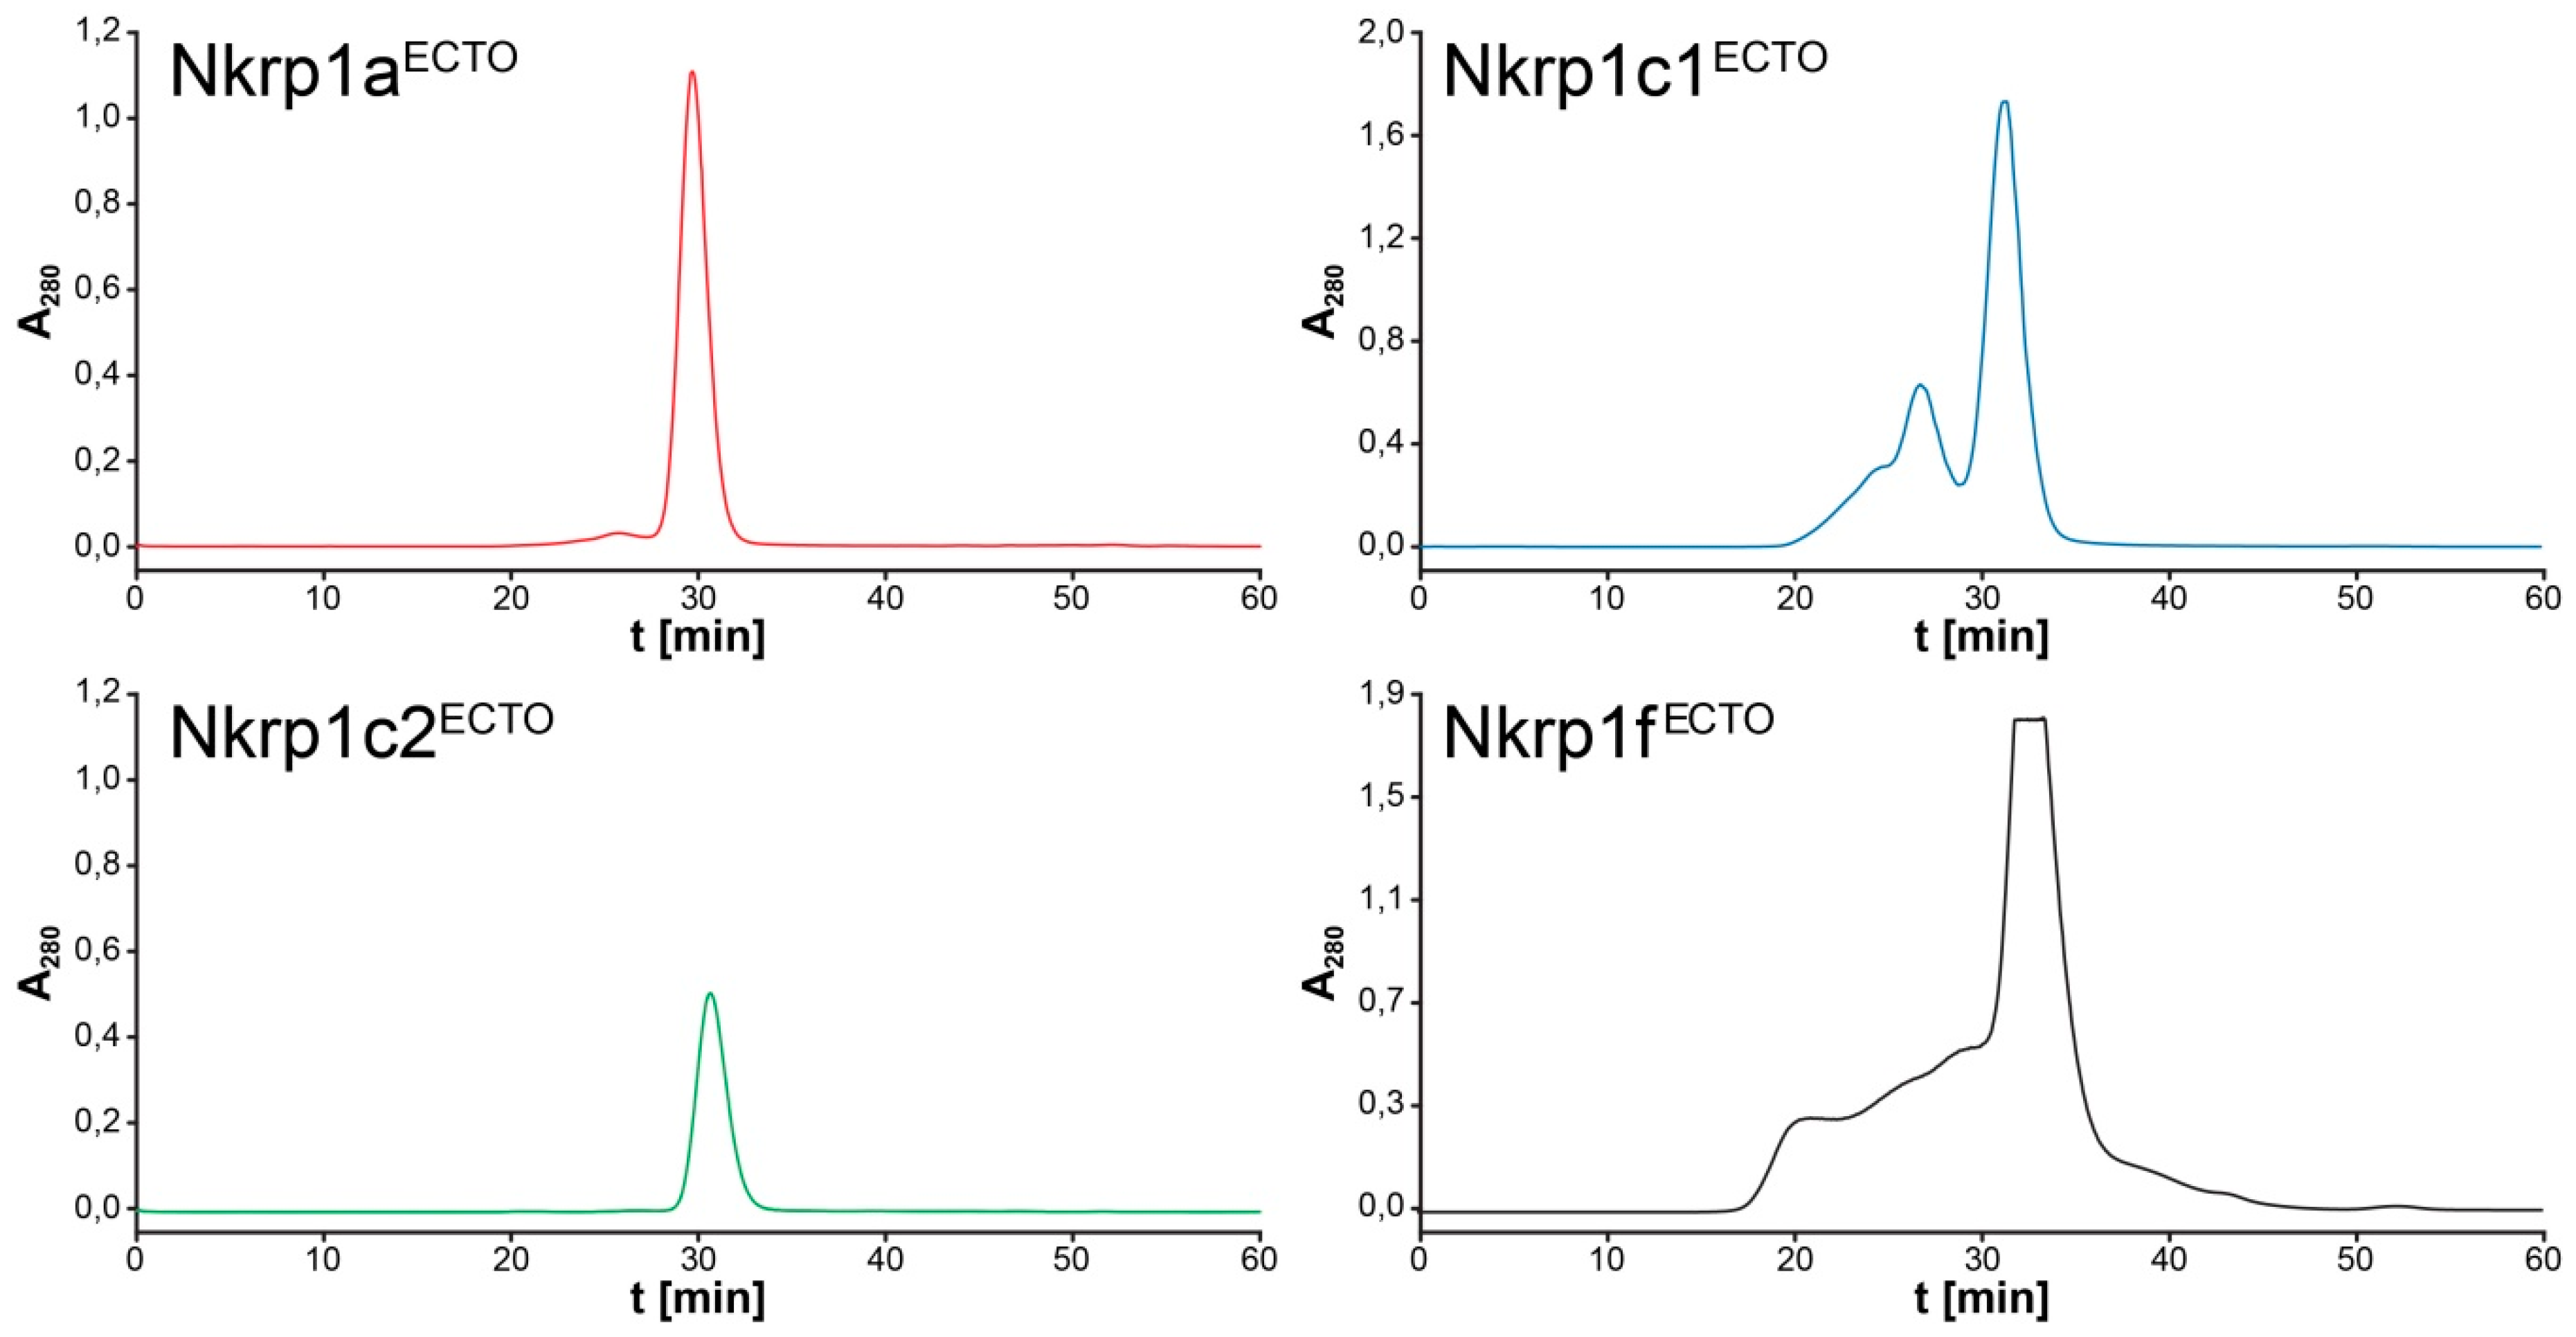
Figure 2A). Steady-state anisotropy values measured for Nkrp1a differed significantly from both controls, monomeric LAT and dimeric CD8α. Moreover, higher abundance of monomers was detected in lysates of cells expressing Nkrp1a than those expressing isoforms c1 or c2. These cell-based data indicate that Nkrp1a can form dimers, but these are less stable than highly abundant and stable dimers of isoforms c1, c2 and f. These data are also supported by purified recombinant proteins. The Nkrp1aECTO protein was prepared as a monomer (Figure 4), which is in accordance with already published results [38,39]. However, it was previously demonstrated that the Nkrp1a can form non-covalent dimers through its stalk region [40].
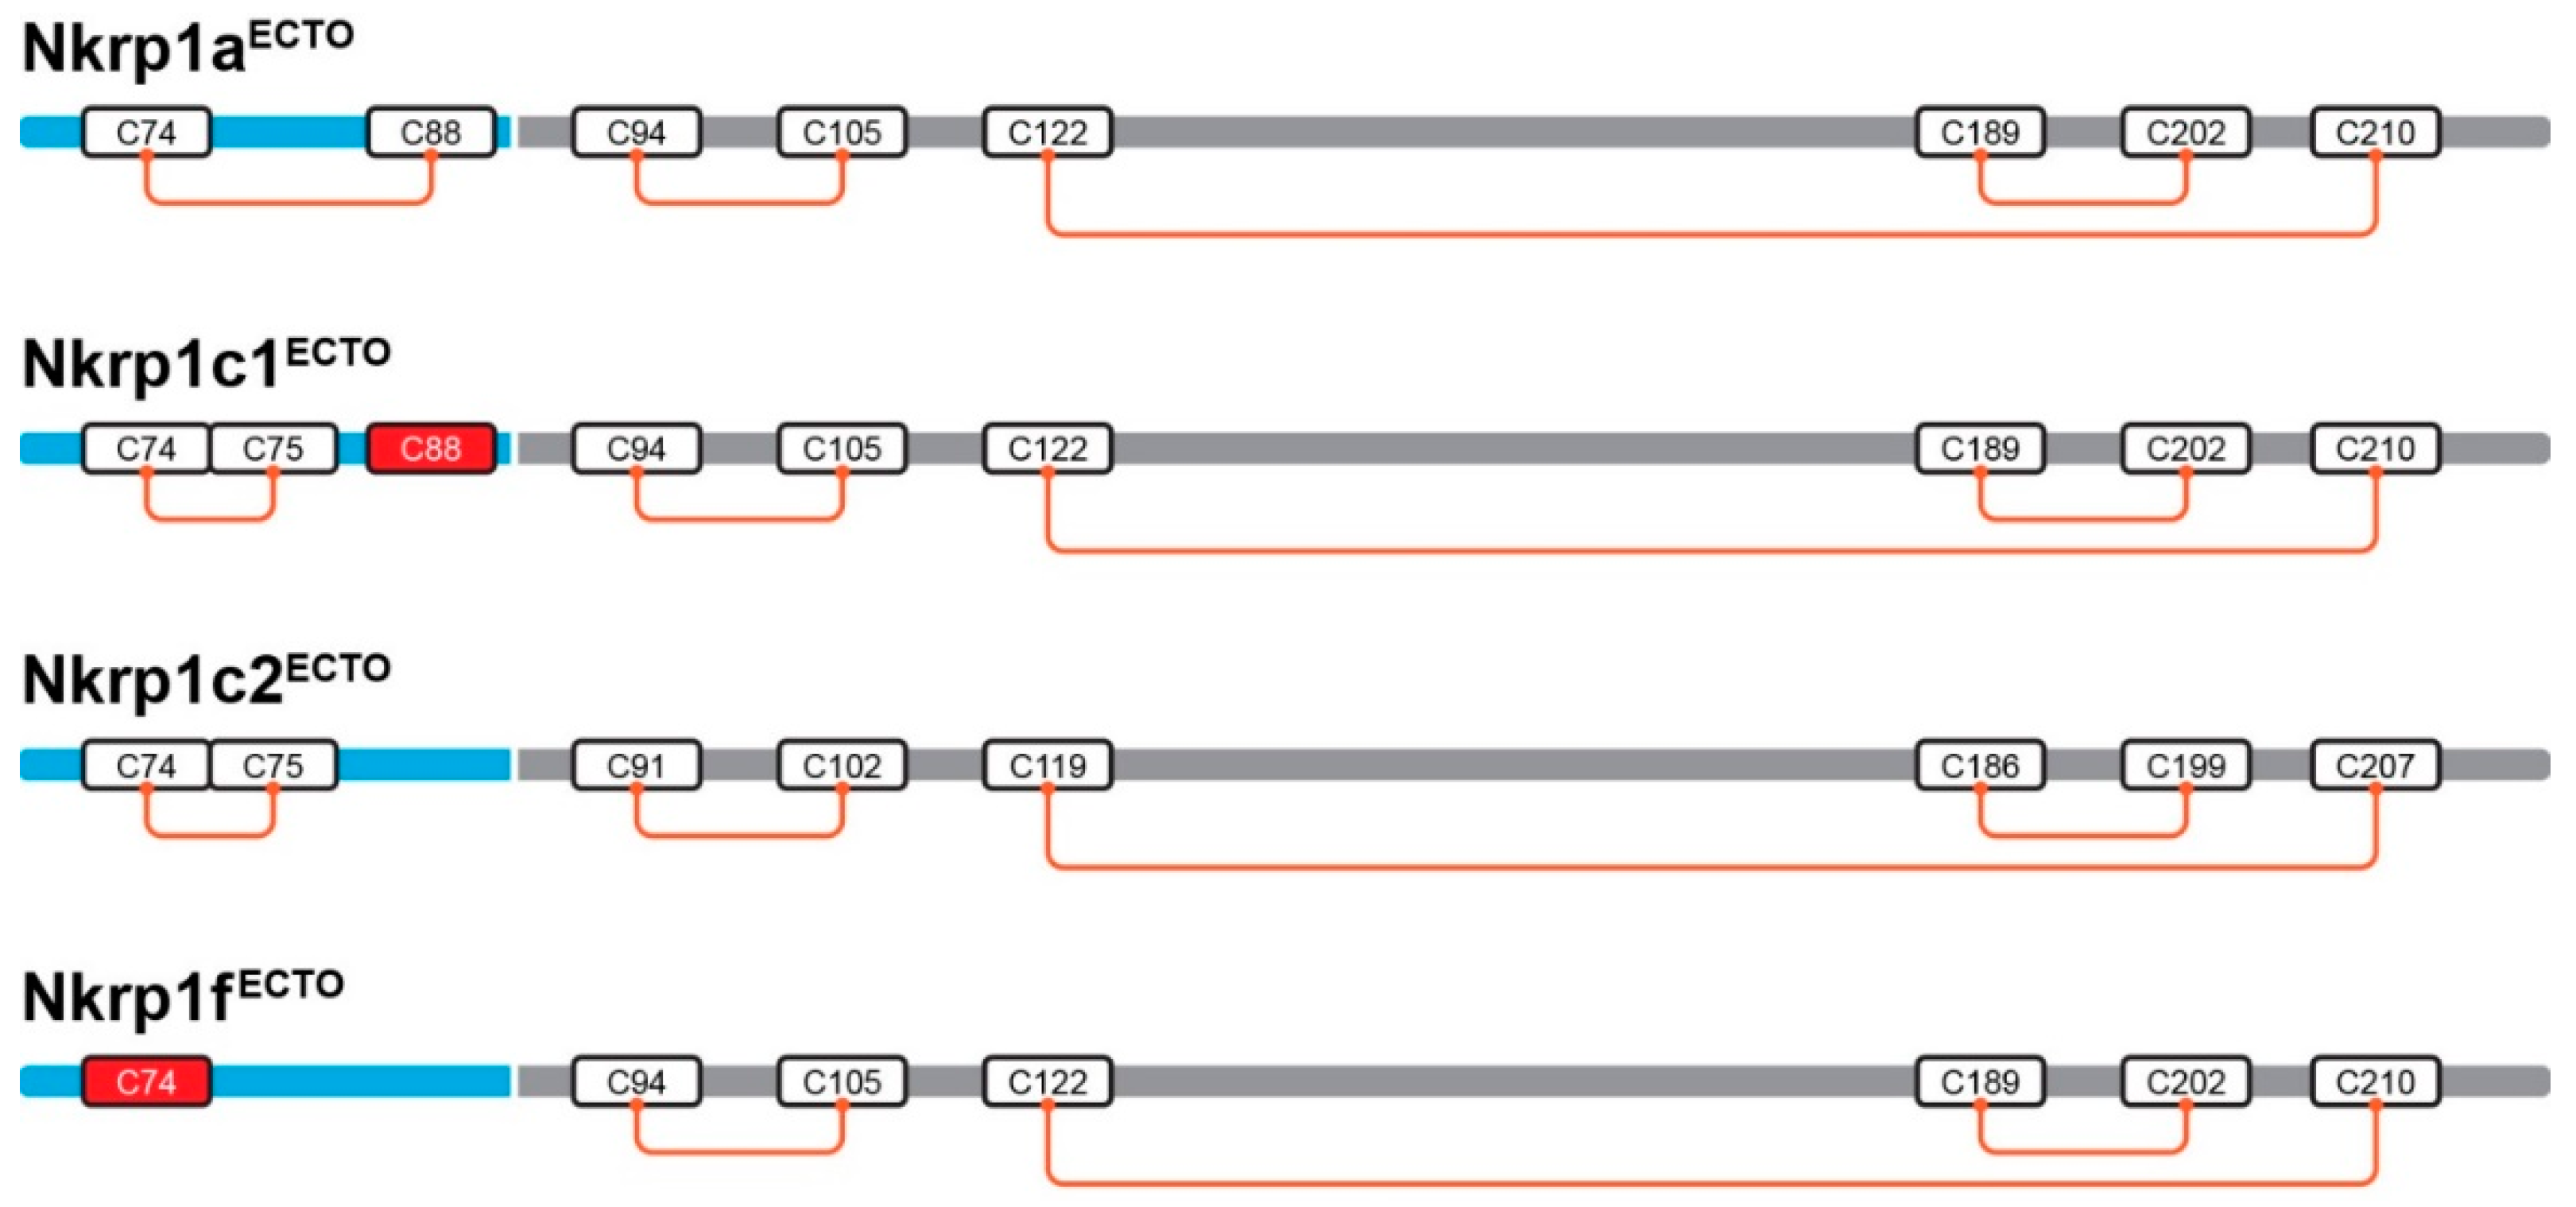
Mapping of intermolecular disulfide bridges responsible for receptor dimerization was rather straightforward for Nkrp1f which contains a sole cysteine residue in its stalk region. Strong prevalence of dimeric population on the plasma membrane was found using homo-FRET analysis (Figure 2A). Since mass spectrometric analysis of recombinant Nkrp1fECTO protein determined cysteines of CTLD forming intramolecular connections and C74 as a dimerization interphase (Figure 5 and Table A4), mutant variant lacking C74 was created to confirm such observation in living cells. Indeed, mainly monomers of Nkrp1f_C74S mutant were found on the plasma membrane using homo-FRET and immunoblotting analysis (Figure 2B and Figure 3).
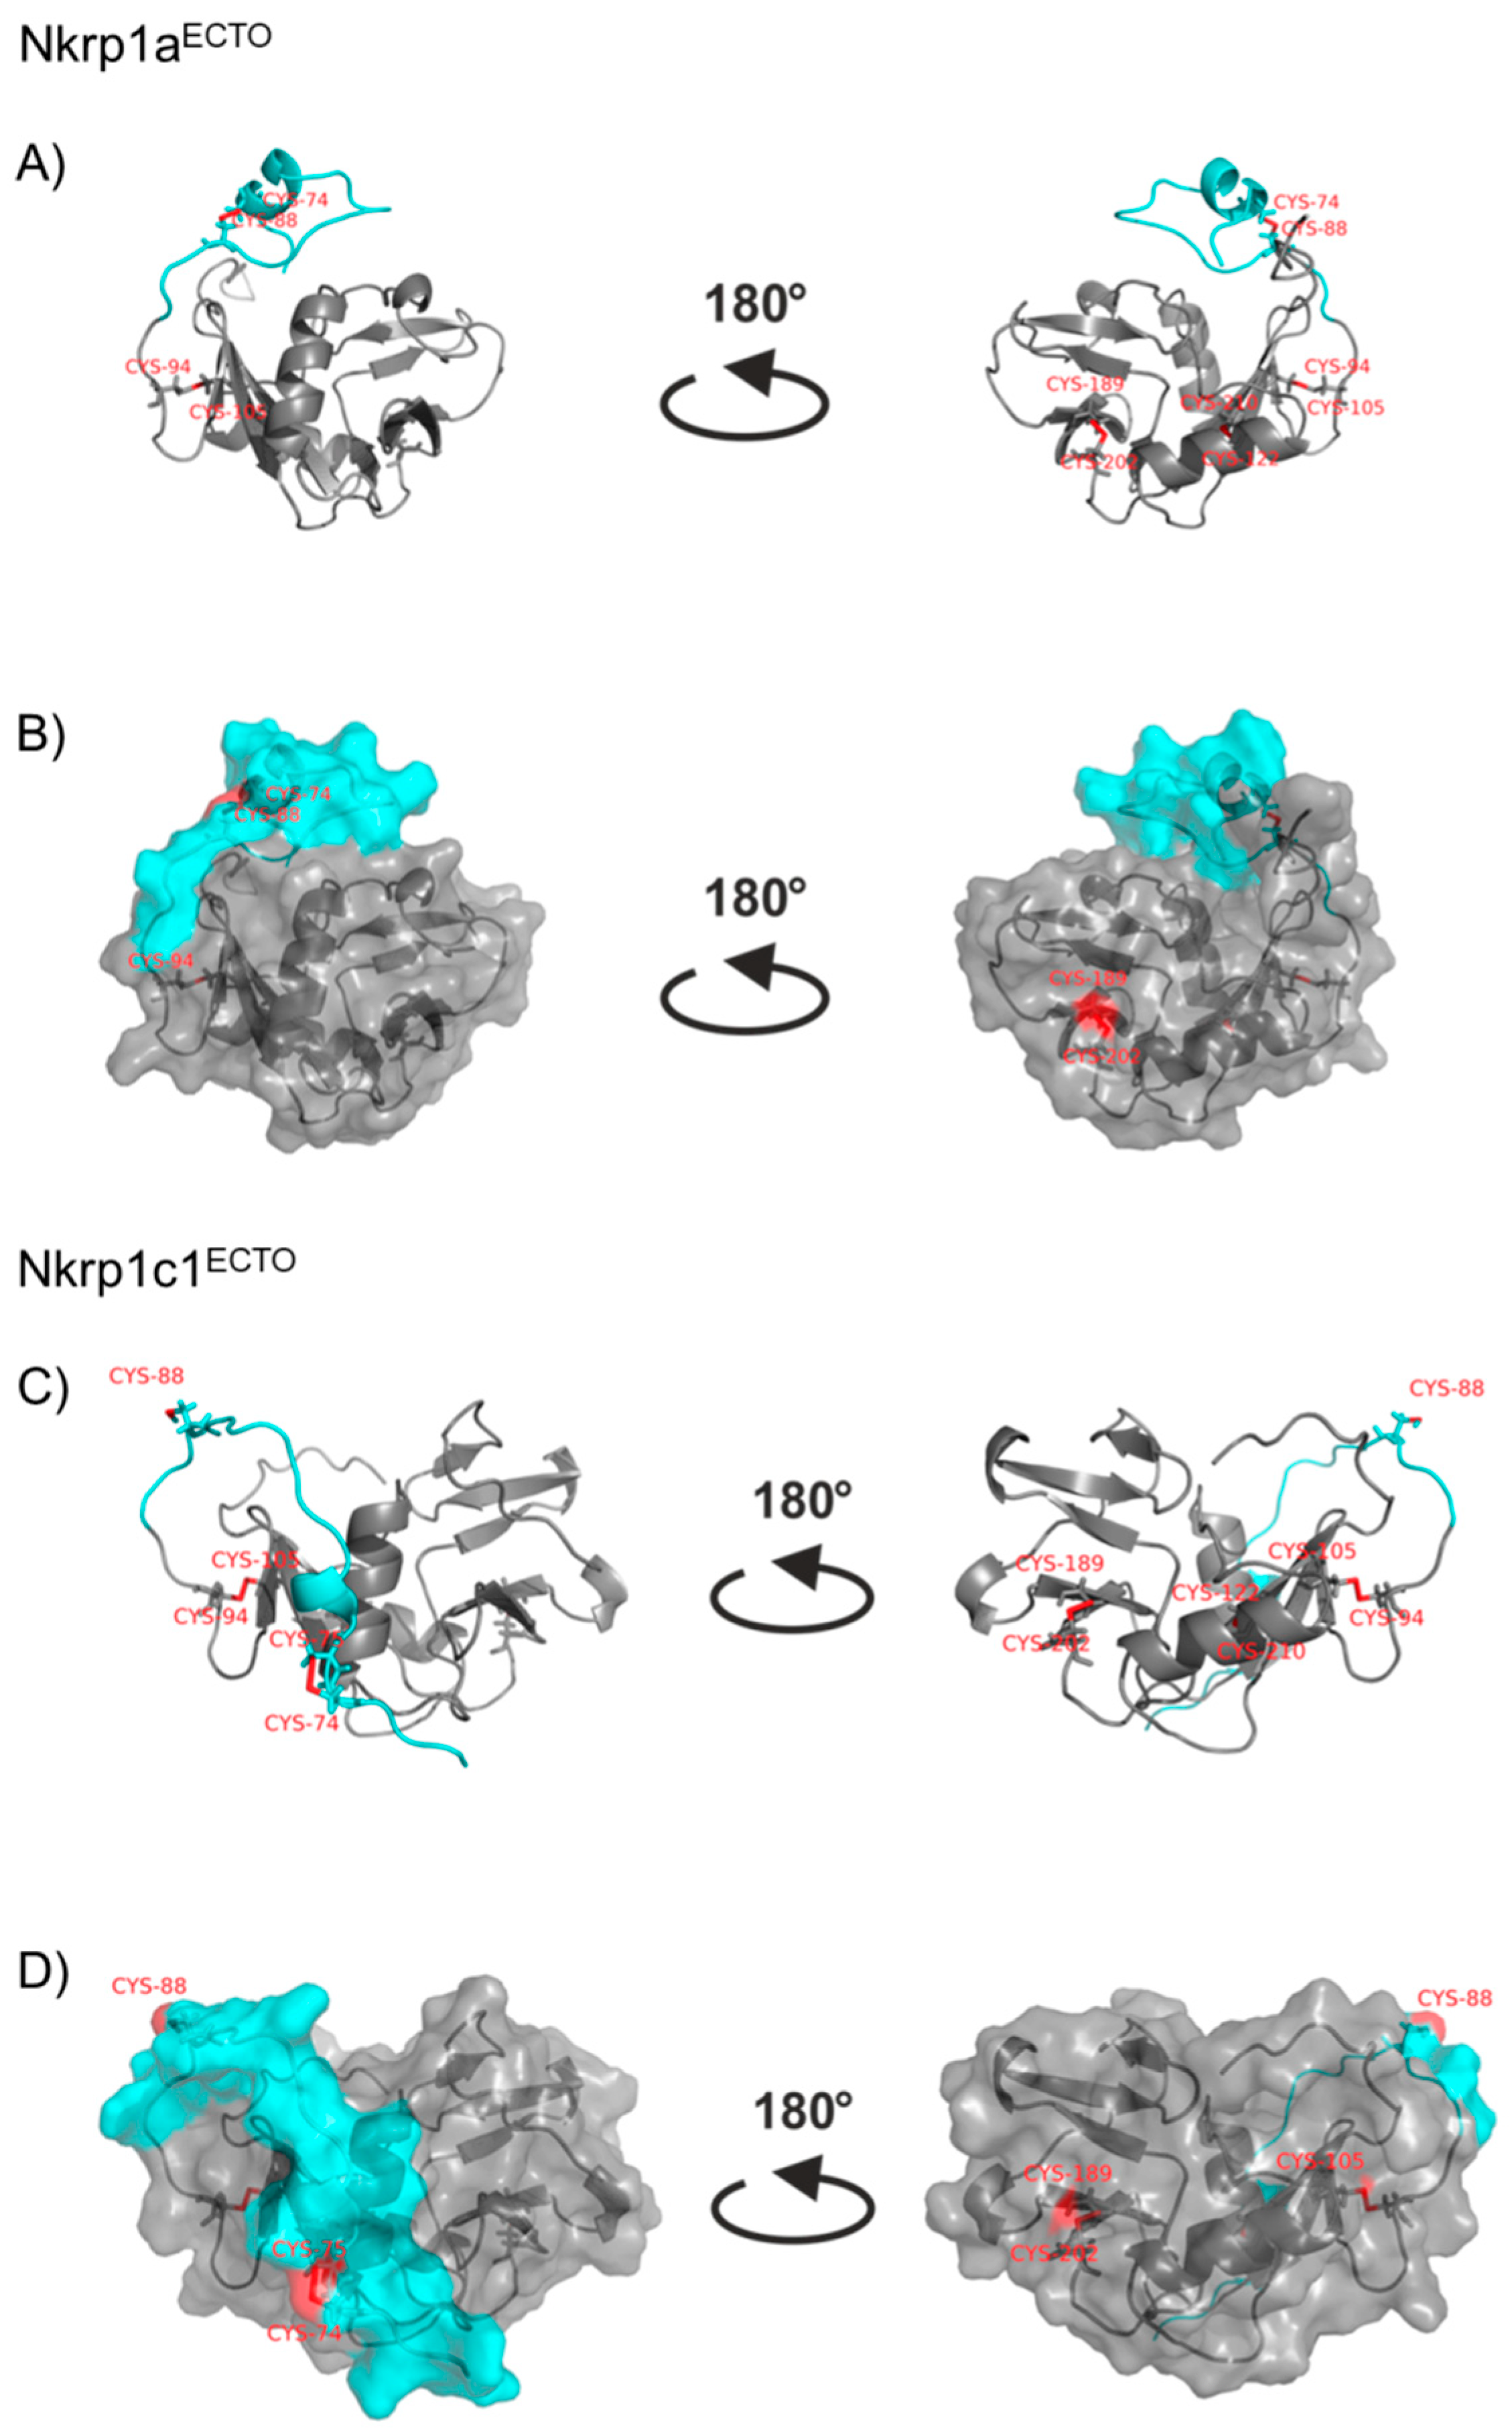
The remaining isoforms Nkrp1a, Nkrp1c1 and Nkrp1c2 share the same arrangement of cysteine bridges in CTLD of the receptor with Nkrp1f (Figure 5 and Table A4). However, they contain two or three cysteine residues in the stalk region. Thus, more cysteine-to-serine mutants had to be designed to study the effect of cysteine residues on their oligomerization. In the case of Nkrp1a isoform, point mutations of C74S or C88S showed no significant effect on protein oligomerization in living Jurkat T cells. However, similar to Nkrp1f_C74S mutant, prevalently monomeric state was observed for a double Nkrp1a_C74,88S mutant (Figure 2B and Figure 3). These two mutants lack cysteine residue in their stalk region and indicate a comparable ratio of Nkrp1 dimers (or oligomers) which are in equilibrium with monomers on the plasma membrane of Jurkat cells. Altogether, our data from homo-FRET and immunoblotting suggest that all stalk cysteines play a role in Nkrp1 dimerization. It is likely that a small portion of non-covalent dimers are presented on the cell membrane. This assumption reflects the Nkrp1f state with the respect to their sequence similarity and it is further supported by dominant covalent dimer formation on western blot (Figure 3B). In the case of Nkrp1a receptor, a non-covalent association through the stalk region, which was also previously demonstrated by Kolenko et al. [40], influences a full conversion into the monomer for the double mutant as well (Figure 2B and Figure 3B). Furthermore, it has been shown that a related human activating receptor NKp65 can form non-disulfide-linked homodimers [41] but interacts with its non-covalent dimeric ligand (keratinocyte-associated C-type lectin, KACL) as a monomer [42].
Nkrp1a lacks free cysteine residue in its stalk region. It was, therefore, expected that single cysteine mutant will have limited impact on dimerization of this receptor. Interestingly, dual mutation of cysteine residues (C74,88S) significantly reduced dimer levels of Nkrp1a on the cell surface. We speculate that such dual mutation affects the overall structure of the ectodomain, thus destabilizing non-disulfide dimers of Nkrp1a. Homo-FRET and immunoblotting results suggest that the Nkrp1c1 receptor is expressed predominantly as a dimer on the plasma membrane (Figure 2A and Figure 3B). The natural deletion in the protein sequence of the Nkrp1c2 isoform, which includes cysteine residue corresponding to C88 of the c1 isoform, is also present on the cell surface predominantly as a dimer (Figure 3B). Pursuant to the disulfide bond determination by mass spectrometry (Figure 5), the free stalk cysteine C88 was considered to serve for covalent dimerization of Nkrp1c1. However, natural variant lacking this residue, Nkrp1c2, was found to form high levels of dimers at the surface of living cells what contradicts this thesis. We thus speculate that other stalk residues, specifically C74 or C75, regulates dimerization of Nkrp1c1 and Nkrp1c2. Indeed, our homo-FRET data demonstrate strongly reduced capacity of Nkrp1c1_C74,75S double mutant to form oligomers on the cell surface (Figure 2B). Therefore, cysteine required for Nkrp1c1 oligomerization in live cells is not the unpaired C88 as predicted from dimeric Nkrp1c1ECTO protein refolded in vitro, but residues C74 or C75. From a steric point of view, the disulfide bond between the two adjacent cysteines should be unfavorable. In nature, they are very rare and unique. However, vicinal S-S bonds introducing a strain into a protein structure have been documented [43,44,45].
Our study of Nkrp1 oligomerization displays that all stalk cysteines are more or less relevant in protein dimerization. Similar behavior was observed for oligomerization of a C5a receptor, where C144 displayed the fastest kinetics of dimer formation in comparison to other cysteine residues in the protein sequence. [46]. One can also consider similarity of Nkrp1 receptors to the Ly49 proteins, another mouse C-Type Lectin-like Receptor family. The stalk of Ly49 receptors enables protein dimerization and two distinct receptor conformations [47]. However, despite being structurally and functionally similar to Ly49 receptors of mouse, the stalk region of Nkrp1aECTO does not alter the ligand binding domain [39] as it has been published for the Ly49 receptors [47,48]. Most likely, the shorter stalk of Nkrp1a protein does not favor cis/trans reorientation of the extracellular C-Type Lectin-like Domain (CTLD).
In summary, mouse activating Nkrp1 proteins are expressed on the cell surface as dimers with diverse levels of coexisting monomers. The level of surface dimerization seems to be regulated by the precise positioning of cysteine residues in the stalk region and not exclusively by the presence of putative unpaired cysteines. Coexistence of monomeric and dimeric proteins on the cell surface has been documented for other essential membrane proteins. In the case of CAPRI protein (a member of GTPase-activating proteins), the oligomerization process is controlled by calcium and activates different cellular signaling pathways based on its oligomerization state [49]. In case of Nkrp1 proteins, the function and purpose of such balance between monomers and dimers in the plasma membrane is still unknown. It is believed that signaling through Nkrp1 molecules involves receptor dimers [50]. By contrast, constitutively active covalent Nkrp1 dimers on the cell surface are unlikely from the immunological point of view. It is, therefore, tempting to speculate that the coexistence of monomers and dimers plays a regulatory role for the function of these receptors. The most recent crystal structure of Nkrp1b:m12 complex has revealed the engagement of monomeric Nkrp1b enclosed by the m12 monomer [21], as opposed to previously suggested interaction of a receptor as a dimer [4,5,18]. Contrary to cytomegalovirus-encoded protein m12, the interaction of homodimeric host-encoded ligand Clr-b with Nkrp1b receptor showed that additional avidity of non-classic Nkrp1b dimer is needed [51]. This suggests an avidity driven manner of ligand binding. On the other hand, function of Nkrp1b is to inhibit NK cell activation, not to activate.
Recently, it has been reported that mouse Nkrp1a and Nkrp1c also bind to a mouse cytomegalovirus-encoded protein m12 [21]. The oligomeric state of Nkrp1 proteins on the surface of living cells in the presence and absence of the viral ligand remains unknown.

4. Materials and Methods

4.1. Materials

Oligonucleotide primers were obtained from KRD (Prague, CZ, Czech Republic), Generi Biotech (Hradec Králové, Czech Republic, CZ) and Sigma-Aldrich (St. Louis, MO abbreviation, USA). Superscript III reverse transcriptase and the pCR2.1-TOPO vector were purchased from Thermo Fisher Scientific (Waltham, MA, USA). The Escherichia coli BL-21 (DE3) Gold strain was from Stratagene (La Jolla, CA, USA), and the pET-30a(+) bacterial expression vectors were from Novagene (Madison, WI, USA). The pXJ41 vector was prepared by Xiao et al., 1991 [52]. Restriction endonucleases and other enzymes for DNA cloning were purchased from New England Biolabs (Ipswich, MA, USA) and Thermo Fisher Scientific (Waltham, MA, USA). The chromatographic column Superdex 75 HR 10/300 was obtained from GE Healthcare (Chicago, IL, USA). All chemicals were purchased from Sigma-Aldrich (St. Louis, MO, USA) unless otherwise declared and were of the highest available purity.

4.2. DNA Cloning

A template DNA for cloning manipulations was prepared from a total RNA isolated from spleens of C57BL/6 mice as described in [53]. All primers used for PCR amplification are listed in Table A2, Appendix A. DNA fragments coding mouse Nkrp1 ectodomains were amplified by RT-PCR using primers: NKRP1A STALK FW and MNKR1ARE for Nkrp1aECTO construct (residues S70-H227), NKRP1C STALK FW and MNKR1CRE to generate Nkrp1c1ECTO (residues S70-S223) and Nkrp1c2ECTO (S70-S220; transcriptional variant shortened by DCS sequence compared to isoform c1). Nkrp1f FW and Nkrp1 REV oligonucleotides were used for generation of Nkrp1fECTO sequence (Q67-V217). All constructs were sub-cloned into pCR2.1-TOPO vector according to the manufacturer’s protocol, amplified and then sub-cloned into pET-30a(+) bacterial expression vector between NdeI and HindIII restriction sites.
DNA encoding the full-length Nkrp1a sequence was amplified from cDNA synthetized from the total RNA using oligonucleotides Fw_Nkrp1a_Stop and Rev_Nkrp1a_Stop. Sequences of entire Nkrp1c1 and Nkrp1f were synthesized by Shanghai Generay Biotech Co., Ltd. (Shanghai, China, CN). Primers Nkrp1c1_Bam+Xho_Fw and Nkrp1c1_Bam+Xho_Rev, resp. Fw_Nkrp1f_Stop and Rev_Nkrp1f_Stop, were used to prepareNkrp1c1 gene with BamHI and XhoI restriction sites, respectively. Nkrp1f insert. DNA fragments were then sub-cloned into the BamHI and XhoI restriction sites of pXJ41 vector.
A gene encoding entire Nkrp1c2 isoform was generated by deletion of an ATTGTTCAG nucleic acid sequence of the Nkrp1c1 variant (the resulting c2 isoform lacks the DCS amino acids sequence) using primers mNKRC2Fw2 and mNKRC2Rev1. The Nkrp1c2 was ligated into vector pXJ41 between BamHI and XhoI cloning sites.
The final pXJ41-EGFP-Nkrp1 plasmids were prepared by insertion of EGFP, amplified by PCR (using primers EGFP_Eco+Bam_FW and EGFP_Eco+Bam_REV containing spacer sequence GSGGGS), between EcoRI and BamHI restriction sites on the N-terminus of the Nkrp1 sequence inserted into pXJ41 vector.
Cysteine residues in a stalk region of all Nkrp1 proteins were mutated to serines using mutation primers listed in Table A2. Wild-type sequence of the Nkrp1a in vector pXJ41 was amplified with primers A1_C220S_Fw1 and A1_C220S_Rev1, resp. A1_C262S_Fw2 and A1_C262S_Rev2 to generate pXJ41-Nkrp1a_C74S andpXJ41-Nkrp1a_C88S mutants, respectively. Double cysteine-to-serine mutant named pXJ41-Nkrp1a_C74,88S was prepared by amplification of the pXJ41-Nkrp1a_C88S utilizing primers A1_C220S_Fw1 and A1_C220S_Rev1. pXJ41-Nkrp1c1_C74,75S mutant was generated by amplification of pXJ41-Nkrp1c1 using primers C1_CC220SS_Fw and C1_CC220SS_Rev. A cysteine-to-serine mutation was introduced into pXJ41-Nkrp1f using oligonucleotides F_C220S_Fw and F_C220S_Rev to generate pXJ41-Nkrp1f_C74S version. All mutants were sub-cloned into pXJ41-EGFP plasmid between BamHI and XhoI cloning sites.
To generate a gene cassette for plasma membrane proteins with fluorescent tag in the intracellular space, EGFP constructs were prepared by PCR reaction using forward primer T198 (see Table A2) containing a BamHI restriction site and a spacer (GSGGGS), and reverse primer T199 containing a stop codon and an XhoI site. Fluorescent protein sequence was ligated into pXJ41 vector between BamHI and XhoI [54].
A pXJ41-LAT-EGFP vector was generated by Chum et al., 2016 [54]. The final construct contains sequences of 5′ UTR and leader sequence of human CD148, followed by a myc-tag and the sequence coding LAT protein followed by EGFP.
A CD8α gene was subjected to a silent mutation (residues CTG to CTC) to eliminate EcoRI site within the DNA construct using primers CD8a_288_Fw and CD8a_288_Rev. CD8α was then amplified by PCR utilizing oligonucleotides CD8a_Fw 1 and CD8a_REV. DNA fragment was sub-cloned into the pXJ41-EGFP vector using EcoRI/BamHI restriction sites to generate a pXJ41-CD8α-EGFP plasmid with intracellular fluorescent protein tag.
All cloning sequences were analyzed and confirmed by DNA sequencing.

4.3. Bacterial Recombinant Expression of Activating Nkrp1 Proteins

The Nkrp1aECTO (S70-H227), Nkrp1c1ECTO (S70-S223), Nkrp1c2ECTO (S70-S220) and Nkrp1fECTO (Q67-V217) proteins were produced using bacterial expression system following previously reported protocol [53]. Concisely, the Escherichia coli BL-21 (DE3) Gold cells were transformed with appropriate expression vector, the proteins produced in inclusion bodies were extracted, solubilized and refolded in vitro.

4.4. Protein Refolding and Purification

In vitro protein refolding was performed using modified protocol described in ref. [53]. All Nkrp1 inclusion bodies were solubilized in buffer containing 6 M guanidine-HCl (pH 8.5), 10 mM DTT and 50 mM Tris-HCl (for each 1 g of wet weight cells 8 mL of guanidine-HCl buffer was applied). Protein refolding was performed by rapid dilution method using hundred-fold higher volume of refolding buffer. The refolding buffer for Nkrp1cECTO and Nkrp1fECTO proteins consisted of 50 mM CHES (pH 9 and pH 10), 1 mM CaCl2, 1 M L-arginine, 100 mM NaCl, 9 mM cysteamine, 3 mM cystamine, 1 mM NaN3 and 1 mM PMSF. After 1–2 h of incubation at 4 °C with gentle stirring, the refolding mixtures were dialyzed twice for (4 h and 12 h) at 4 °C against 6 L of 10 mM HEPES (pH 7.4), 100 mM NaCl and 1 mM NaN3. Protein mixtures were then concentrated by ultrafiltration utilizing a cellulose membrane and by centrifugal filter units (MW cut-off 10 kDa, Millipore, Burlington, MA, USA).
Afterward, the Nkrp1ECTO proteins were purified by size-exclusion chromatography method using a calibrated Superdex 75 column. The Nkrp1aECTO was eluted in 150 mM NaCl, 15 mM Tris-HCl (pH 7.5) and 1 mM NaN3. The other proteins were eluted into 10 mM HEPES (pH 7.4), 100 mM NaCl and 1 mM NaN3.
All protein samples were analyzed by SDS-PAGE under reducing and non-reducing conditions and the protein concentration was examined using the Bradford assay (Bio-Rad, Hercules, CA, USA) with BSA standard solution.

4.5. Evaluation of Disulfide Bonds

To determine disulfide bonds arrangement in recombinant Nkrp1 proteins, protein samples were subjected to non-reducing SDS-PAGE in a 4-12% polyacrylamide gradient gel with 200 µM cystamine [26,55]. The in-gel proteolytic reactions were performed using trypsin (Promega, Madison, WI, USA), Asp-N (Roche, Basel, Switzerland) and Glu-C (Roche, Basel, Switzerland) proteinases. After overnight digestion at 37 °C by 5 ng/µl of the proteinases, the digestion mixtures were desalted and analyzed by Liquid Chromatography (LC) coupled to ESI-FT-ICR MS (SolariX, Bruker Daltonics, Billerica, MA, USA). Data were interpreted utilizing software Data Analysis 4 (Bruker Daltonics, Billerica, MA, USA) and LinX.

4.6. Cell Culture and Transfection

COS-7 and Jurkat cells were from the cell bank of the Institute of Molecular Genetics in Prague, Czech Republic. COS-7 cells were cultured in DMEM medium (Sigma-Aldrich), Jurkat T cell line was grown in RPMI 1640 medium (Sigma-Aldrich), both supplemented with 2 mM L-glutamine and 10% fetal calf serum (both Life Technologies, Carlsbad, CA, USA). The cell lines were cultured in an incubator under controlled conditions of 37 °C, 5% CO2, and 95% humidity.
COS-7 cells were grown to 60–70% confluency and transiently transfected with Lipofectamine LTX Reagent (Thermo Scientific, Waltham, MA, USA) following manufacturer’s protocol. DNA-lipid complexes were formed by mixing 250 ng of DNA with 0.5 µL Lipofectamine LTX Reagent in 100 µL Opti-MEM medium (Thermo Scientific, Waltham, MA, USA) and incubated for 30 min at room temperature. COS-7 cells were incubated overnight with the mixture and imaged 18–24 h after transfection.
For western blotting, 2 million COS-7cells were seeded on 100 mm cell culture dish and transfected at >60% confluency. Cells were transfected with reaction mixture consisted of 6–8 µg of DNA, 3 mL Opti-MEM and 21 µL Lipofectamine LTX.
Jurkat cells were transiently transfected using Neon® Transfection System (Life Technologies, Carlsbad, CA, USA) following modified manufacturer’s protocol, using 0.5 µg–1 µg of vector DNA per electroporation shot (3 pulses of 1400 V, each lasting 10 ms) per 200,000 cells. Further experiments were performed 18–24 h after transfection. DNA amount was varied to achieve comparable expression level for all transfected plasmids.

4.7. Live Cell Imaging

Cells were immobilized on poly L-lysine(PLL)-coated coverslips and imaged at 37°C in closed perfusion chamber (FCS3, Bioptech) on a commercial confocal laser scanning microscope unit (FluoView 1000, Olympus, Shinjuku, JP, Japan) equipped with 60x water immersion, NA 1.2 objective (UPlanSApo, Olympus, Shinjuku, JP, Japan). 488 nm steady-state semiconductor laser (Coherent, Santa Clara, CA, USA) was used to excite the EGFP fluorophore and combination of 560 long-pass and 505–525 band-pass filters was selected to collect the fluorescence emission.

4.8. Western Blotting

24 h after transfection, COS-7 cells were gently washed twice with PBS, 50 × 106 cells per 1 mL of lysis buffer (20 mM Tris/HCl (pH 8.2), 100 mM NaCl, 10 mM EDTA, 1% n-decyl-β-D-maltopyranoside (Anatrace, Maumee, OH, USA), 50 mMNaF, 1 mM orthovanadate, protease inhibitor mixture (Serva, Heidelberg, DE, Germany), 40 mM iodoacetamide (Sigma Aldrich, St. Louis, MO, USA), and reducing samples containing 100 mM dithiothreitol (Serva, Heidelberg, DE, Germany) were scraped off, and incubated on ice for 30 min. The insoluble material was removed by centrifugation at 3000 rcf for 3 min at 4°C. 20 µg of the total protein was separated on SDS-PAGE using a 10% polyacrylamide gel and were transferred onto PVDF membrane (Pall Corporation, Port Washington, NYn, USA) using semi-dry blotting apparatus. The transfer was run at 0.80 mA/cm2 for up to 1.5 h. Proteins were detected with polyclonal anti-GFP antibody (Exbio, Vestec, CZ, Czech Republic) according to manufacturer’s recommendations (1:2000 dilutions). For loading control, polyclonal anti-actin antibody (Santa Cruz, Dallas, TX, USA) was used. PVDF membranes were scanned using ChemiDoc XRS+ (Bio-Rad, Hercules, CA, USA).

4.9. Förster Resonance Energy Transfer (Homo-FRET)

For homo-FRET analysis, transfected Jurkat cells were centrifuged for 3 min at 300 rcf at room temperature (Centrifuge 5418K, Eppendorf, Hamburg, DE, Germany), resuspended in color-free medium (RPMI Medium 1640, no phenol red, Sigma Aldrich, St. Louis, MO, USA) and landed for 10 min at 37 °C on PLL-coated 8-well chamber slides (ibidi®, Martinsried, DE, Germany). Cells were subsequently measured for a maximum time of 45 min under atmospheric conditions at 37 °C in the environmental chamber (OkoTouch and T Unit bold line, Okolab, Pozzuoli, IT, Italy).
Time domain anisotropy measurements were done on laser scanning confocal microscope unit (Olympus IX-71 with Microtime 200, PicoQuant, Berlin, DE, Germany) equipped with time-correlated single photon counting (TCSPC) module (PicoHarp300, PicoQuant, Berlin, DE, Germany). Time resolution of the TCSPC was set to 64 ps. 470 nm pulsed diode laser controlled by Sepia II unit (PicoQuant, Berlin, DE, Germany) was used to excite the EGFP fluorophore. Laser repetition rate was set to 20 MHz and the excitation power was modulated between 0.1–1 µW to achieve signal equivalent to 2% of the repetition frequency (i.e., 400,000 counts/s). Band pass filters (HQ525/50M, Chroma, and FF02-525/50-25, Semrock, Rochester, NY, USA) combined with long pass filter (FF01-500/LP-25, Semrock, Rochester, NY, USA) and separation dichroic mirror (Z473/635RDC, Chroma, Bellows Falls, VT, USA) selected EGFP emission. Beam-splitter polarizer cube was used to separate the parallel and perpendicular components onto separate SPAD detectors.
The G-factor correction for the instrument sensitivity ratio towards vertically and horizontally polarized light was determined using 1 µM solution of Atto 488 (Sigma-Aldrich, St. Louis, MO, USA). Emission light was collected via 60x water immersion objective (NA 1.2; UPlanSApo, Olympus, Shinjuku, JP, Japan). Low-concentration solutions of Atto 488 (Sigma-Aldrich, St. Louis, MO, USA) and purified GFP protein (Abcam, Cambridge, UK, United Kingdom) were used to determine the L1 and L2 (Equation (1)) correction factors for fluorescence depolarization caused by the high NA objective [56].
The signal from the plasma membrane was manually selected in the anisotropy images. Each of the membrane pre-selected pixels was subsequently Fourier-transformed onto phasor plot representing a map of fluorescence lifetimes. Phasor plot has been previously used in energy transfer studies [57] to distinguish fluorescent species of different lifetimes. Here, we use it only as a filter—only membrane pixels with similar fluorescence lifetime were kept for further analysis. Cells with poor phasor plots were discarded.
Subsequently, signal from all phasor-filtered pixels was summed to enhance the signal-to-noise ratio. I ( t ) and I ( t ) curves were extracted and steady-state anisotropy (rsteady−state) was calculated for each cell according to
r s t e a d y s t a t e = I ( t ) G I ( t ) ( 1 3 L 2 ) I ( t ) + G ( 2 3 L 1 ) I ( t )
where I ( t ) and I ( t ) are parallel and perpendicular components of anisotropy decay, respectively, G is the correction factor for the instrument sensitivity towards vertically and horizontally polarized light and L1, L2 are correction factors for high NA of the objective computed from Atto 488 and GFP solutions; L1 = 0.071 and L2 = 0.015. Steady-state values obtained in one independent measurement were finally filtered and only data within two standard deviations from the mean were used for further analysis.
To visually illustrate differences between protein oligomerization states, r steady-state values were put into dot plot where each point corresponds to one cell. Additionally, two-tailed unpaired T-test was performed on whole populations to evaluate differences between individual protein variants.

5. Conclusions

This work presents the stoichiometry of mouse activating Nkrp1 receptors on the surface of living cells. Our results suggest that the proteins are present predominantly as dimers in the plasma membrane of mammalian cells, with the exception of the Nkrp1a isoform, which displays a more heterogeneous character. The exact positions of stalk cysteine residues influence creation of protein assembles. Further studies will be required to reveal the function of coexistence of monomeric and dimeric Nkrp1 proteins on the cell surface.

Author Contributions

Conceptualization, P.N., M.C. and D.R.; Methodology, M.C., D.R., L.A., Z.K. (Zuzana Kvíčalová) and D.A.; Validation, D.R., L.A.; Z.K. (Zuzana Kvíčalová), Z.K. (Zdeněk Kukačka), P.N. and M.C.; Formal analysis, Z.K. (Zuzana Kvíčalová); Investigation, L.A., Z.K. (Zuzana Kvíčalová), D.R. and D.A.; Resources, P.N. and M.C.; Writing—original draft preparation, L.A.; Writing—review and editing, P.N. and M.C.; Visualization, L.A., Z.K. and D.A.; Supervision, P.N. and M.C.; Project administration, P.N. and M.C.; Funding acquisition, P.N. and M.C.

Funding

This research was funded by the Czech Science Foundation (grant number 16-24309S), the Ministry of Education of the Czech Republic (projects LH15010, LD15089; programs “NPU II” project LQ1604; LM2015043 CIISB for CMS BIOCEV; LTC17065) and European Regional Development Funds (CZ.1.05/1.1.00/02.0109 BIOCEV), in part by the Czech Academy of Sciences (RVO61388971 and L200201801), the Charles University (grant number 260443, Zuzana Kvíčalová) and the Purkyne Fellowship of the Czech Academy of Sciences (M.C.).

Acknowledgments

We would like to thank Radek Šachl, Jana Humpolíčková for intense discussions on anisotropy data and Peter Kapusta for technical assistance with microscopes.

Conflicts of Interest

The authors declare no conflict of interest.

Abbreviations

ClrC-type lectin-related protein
CTLDC-Type Lectin-like Domain
CTLRC-Type Lectin-like Receptor
EDTAEthylenediaminetetraacetic Acid
EGFPEnhanced Green Fluorescent Protein
ESI-FT-ICR MSElectrospray Ionization Fourier Transform Ion Cyclotron Resonance Mass Spectrometry
FRETFörster Resonance Energy Transfer
ILCInnate Lymphoid Cells
LATLinker of Activated T cells
NKNatural Killer
PVDFPolyvinylidene Difluoride
TCSPCTime-correlated Single Photon Counting
TNFαTumor Necrosis Factor α

Appendix A

Table A1. Steady-state anisotropy of controls (LAT and CD8α) and Nkrp1 protein isoforms. All values were computed from 2-standard-deviations (2SDs)-filtered data.
MedianMeanSD
LAT0.30240.30380.0125
CD8α0.24540.24350.0095
Nkrp1a0.27050.26870.0083
Nkrp1a_C74S0.27240.27260.0084
Nkrp1a_C88S0.26630.26730.0042
Nkrp1a_C74,88S0.28280.28490.0095
Nkrp1c10.24220.24370.0108
Nkrp1c20.24910.24830.0073
Nkrpc1_C74,75S0.27510.27350.0143
Nkrp1f0.25040.24980.0072
Nkrp1f_C74S0.28120.28080.0056
Table A2. List of primers.
NameSequence 5′→ 3′Note
NKRP1A STALK FWGCCATATGTCAATAGAAAAATGCTATGTGNkrp1aECTO for bacterial recombinant expression
MNKR1AREGCAAGCTTATCAGTGTCCATAACCCACATAGTTGCTNkrp1aECTO for bacterial recombinant expression
NKRP1C STALK FWCGCATATGTCAAGAGAAAAATGCTGTGTGNkrp1c1ECTO for bacterial recombinant expression
MNKR1CREGCAAGCTTATCAGGAGTCATTACTCGGGGTNkrp1c1ECTO for bacterial recombinant expression
Nkrp1f FWCGCCATATGCAAAAACCACCAATAGAAAAATGNkrp1fECTO for bacterial recombinant expression
Nkrp1 REVGCAAGCTTTCAGACATGTATCAGGGTCNkrp1fECTO for bacterial recombinant expression
mNKRC2Fw2TGAATAAAACAACAGTTAATTTAGAGTGCCCACDCS sequence deletion in Nkrp1c1 to generate Nkrp1c2
mNKRC2Rev1GTGGGCACTCTAAATTAACTGTTGTTTTATTCAGGTTCDCS sequence deletion in Nkrp1c1 to generate Nkrp1c2
Nkrp1c1_Bam+Xho_FwGGCGGATCCATGGACACAGCAAGNkrp1c1 and -c2 constructs
Nkrp1c1_Bam+Xho_RevCGTCTAGAAGCCTCGAGTTAGGAGTCATTACTCGNkrp1c1 and -c2 constructs
Fw_Nkrp1a_StopAAGGGATCCATGGACACAGCAAGGGTCNkrp1a construct
Rev_Nkrp1a_StopGCCCTCGAGTCAACCGGTGTGTCCATAACCCACATAGTTGNkrp1a construct
Fw_Nkrp1f_StopAAGGGATCCATGGACACATCAAAGGTCCNkrp1f construct
Rev_Nkrp1f_StopGTTCTCGAGTCAACCGGTGACATGTATCAGGGTCTTTTGNkrp1f construct
A1_C220S_Fw1CCATCAATAGAAAAATCTTATGTGCTTATTCAAGAGMissense mutation (TGC→TCT) in Nkrp1a construct, generation of Nkrp1a_C74S mutant
A1_C220S_Rev1CTCTTGAATAAGCACATAAGATTTTTCTATTGATGGMissense mutation (TGC→TCT) in Nkrp1a construct, generation of Nkrp1a_C74S mutant
A1_C262S_Fw2GAATAAAACAACAGACAGTTCAGCTAAGCTAGAGMissense mutation (GATTGT→GACAGT) in Nkrp1a construct, generation of Nkrp1a_C88S mutant
A1_C262S_Rev2CTCTAGCTTAGCTGAACTGTCTGTTGTTTTATTCMissense mutation (GATTGT→GACAGT) in Nkrp1a construct, generation of Nkrp1a_C88S mutant
C1_CC220SS_FwCATCAAGAGAAAAATCATCCGTGTTTATTCAAGAGMissense mutation (TGCTGT→TCATCC) in Nkrp1c1 construct, generation of Nkrp1c1_C74,75S mutant
C1_CC220SS_RevCTCTTGAATAAACACGGATGATTTTTCTCTTGATGMissense mutation (TGCTGT→TCATCC) in Nkrp1c1 construct, generation of Nkrp1c1_C74,75S mutant
F_C220S_FwCACCAATAGAAAAGTCAAGTGTGGCTGCTCMissense mutation (AAATGC→AAGTCA) in Nkrp1f construct, generation of Nkrp1f_C74S mutant
F_C220S_RevGAGCAGCCACACTTGACTTTTCTATTGGTGMissense mutation (TGCTGT→TCATCC) in Nkrp1c1 construct, generation of Nkrp1c1_C74,75S mutant
CD8a_Fw 1TTCGAATTCGCCACCATGGCCTCACCGTTGCD8α construct
CD8a_REVTCCGGATCCCACAATTTTCTCTGAAGGTCTGCD8α construct
CD8a_288_ForCGAGAAGCTCAATTCGTCGAAACTGSilent mutation (CTG→CTC) in CD8α construct
CD8a_288_RevCAGTTTCGACGAATTGAGCTTCTCGSilent mutation (CTG→CTC) in CD8α construct
EGFP_Eco+Bam_FWTTCGAATTCGCGACCATGGTGAGCAAGGGCFluorescent protein (EGFP) construct on the N-terminus of Nkrp1 protein
EGFP_Eco+Bam_REVTAGGATCCGCCACCAGAGCCCTTGTACAGCTCGTCFluorescent protein (EGFP) construct on the N-terminus of Nkrp1 protein, GSGGGS linker
T198 TMD GFP FWDAACGGATCCGGAGGTGGATCTGTGAGCAAGGGCGAGGAGCTGEGFP construct on the C-terminus of the target protein, GSGGGS linker
T199 TMD GFP REVgagaattctcgagTTACTTGTACAGCTCGTCCATGCCGAGEGFP construct on the C-terminus of the target protein, GSGGGS linker
Figure A1. Subcellular localization of cysteine-to-serine mutant forms of EGFP-Nkrp1 fusion proteins. Confocal laser scanning microscopy (CLSM) images of live Jurkat cells transfected with (A) EGFP-Nkrp1a_C74S, (B) EGFP-Nkrp1a_C88S, (C) EGFP-Nkrp1a_C74,88S, (D) EGFP-Nkrp1c1_C74,75S fusion protein. The left picture of each panel shows the EGFP channel scan, and the right half perform the corresponding bright-field image. All EGFP-Nkrp1 cysteine-to-serine mutants were expressed mainly on the plasma membrane of live Jurkat cells. Scale bars in each panel: 5 µm.
Ijms 20 01884 g0a1
Table A3. Rounded p-values for pairwise comparisons of Nkrp1 proteins with controls (LAT and CD8α), resp. wild-type Nkrp1s with cysteine mutants. Two-tailed T-test with unequal variances (Satterthwaite’s approximation) was performed on 2SD-filtered data. Statistical significance of differences is marked with asterisks: p < 0.05 *, p < 0.01 **, p < 0.001 ***, p < 0.0001 ****, ‘n.s.’ not significant.
Protein 1Protein 2p-value
LATNkrp1a1.1e-17 (****)
LATNkrp1c13.3e-26 (****)
LATNkrp1c28.4e-31 (****)
LATNkrp1f6.1e-35 (****)
CD8αNkrp1c19.6e-1 (n.s.)
CD8αNkrp1c22.5e-2 (*)
Protein 1Protein 2p-value
Nkrp1aNkrp1a_C74S1.2e-1 (n.s.)
Nkrp1aNkrp1a_C88S5.2e-1 (n.s.)
Nkrp1aNkrp1a_C74,88S9.7e-7 (****)
Nkrp1c1Nkrp1c21.0e-1 (n.s.)
Nkrp1c1Nkrp1c1_C74,75S3.6e-11 (****)
Nkrp1fNkrp1f_C74S2.4e-26 (****)
Figure A2. Protein sequence alignment of activating Nkrp1 proteins from C57BL/6 mouse. Extracellular cysteine residues are in red boxes and the stalk region is indicated in a blue box. The most different isoform by protein sequence is the Nkrp1f. The Nkrp1a and the Nkrp1c have 87% simillarity.
Ijms 20 01884 g0a2
Figure A3. Nkrp1 purification. Size-exclusion chromatography profile of refolded Nkrp1aECTO, Nkrp1c1ECTO, Nkrp1c2ECTO and Nkrp1fECTO. Proteins were purified on calibrated Superdex 75 column with flow rate 0.4 mL/min. The Nkrp1aECTO was eluted in 150 mM NaCl, 15 mM Tris-HCl (pH 7.5) and 1 mM NaN3. The elution buffer for Nkrp1c1ECTO, Nkrp1c2ECTO and Nkrp1fECTO consisted of 10 mM HEPES (pH 7.4), 100 mM NaCl and 1 mM NaN3.
Ijms 20 01884 g0a3
Table A4. Summary of disulfide mapping of Nkrp1ECTO receptors by LC-MS. Disulfide-linked peptides originated from digestion by trypsin, Asp-N and GluC proteases and their sequences are shown in the third and fourth columns, respectively. The corresponding S-S bonds and their combinations are displayed in the second column. Experimental masses are indicated in the fifth column. The sixth column displays mass errors.
ProteaseC-C Cross-LinkDisulfide-Linked Peptide(s)Sequence(s) of disulfide-Linked PeptidesExperimental [M + H]+Error [ppm]
Nkrp1aECTO
TrypsinC74-C8874-84; 85-91CYVLIQENLNK - TTDCSAK2058.98351.56
Trypsin(C94-C105; C122-C210); (C94-C122; C105-C210) 92-102; 105-125; 208-212LECPQDWLSHR -CFQVSHVSNTWEEGLVDCDGK - WICQK4407.96620.34
TrypsinC189-C202180-196; 197-207ITGDTENDSCAAISGDK - VTFESCNSDNR2965.24221.73
AspN(C74-C88; C94-C105); (C74-C94; C88-C105) 70-79; 87-96; 103-120SIEKCYVLIQ - DCSAKLECPQ - DKCFQVSHVSNTWEEGLV4361.02330.25
AspNC122-C210122-133; 205-227DCDGKGATLMLIQ - DNRWICQKELYHETLSNYVGYGH4186.94190.72
AspNC189-C202187-199; 200-204DSCAAISG - DKVTFESCNS1849.75791.75
GluCC74-C8873-80; 81-93KCYVLIQE - NLNKTTDCSAKLE2429.20511.04
GluCC94-C10594-116CPQDWLSHRDKCFQVSHVSNTWE2800.23550.65
Nkrp1c1ECTO monomer
TrypsinC74-C7574-84CCVFIQENLNK1308.60752.18
Trypsin(C88-cysteamine; C94-C105; C122-C210); (C88-cysteamine; C94-C122; C105-C210); (C94-cysteamine; C88-C105; C122-C210);(C94-cysteamine; C88-C122; C105-C210); (C105-cysteamine;C88-C122; C94-C210); (C105-cysteamine;C88-C210; C94-C122); (C122-cysteamine; C88-C105; C94-C210); (C122-cysteamine; C88-C210; C94-C105)85-102; 105-124; 208-212; cysteamineTTDCSVNLECPQDWLLHR - CFHVSQVSNTWEEGQADCGR - WICQK5129.20914.34
TrypsinC189-C202180-196; 197-207ITGVTENGSCASILGDK - VTPESCASDNR2840.30372.43
AspNC74-C7570-86SREKCCVFIQENLNKTT2010.97362.10
AspN(C88-cysteamine; C94-C105); (C94-cysteamine; C88-C105)87-96; 103-115; cysteamineDCSVNLECPQ - DKCFHVSQVSNTW2730.14153.07
AspNC122-C210121-133; 205-221DCGRKGATLLLIQ - DNRWICQKELNHETPSN3468.71112.16
AspNC189-C202176-194; 195-204DVLKITGVTENGSCASILG - DKVTPESCAS2910.40712.52
GluCC74-C7573-80KCCVFIQE967.43762.25
GluCC88-cysteamine81-93; cysteamineNLNKTTDCSVNLE1525.69852.99
GluCC94-C10594-116CPQDWLSHRDKCFQVSHVSNTWE2826.28752.00
GluC(C122-C202; C189-C210); (C122-C210; C189-C202)118-137; 186-200; 201-213GQADCGRKGATLLLIQDQEE -NGSCASILGDKVTPE - SCASDNRWICQKE5169.36844.58
Nkrp1c1ECTO dimer
TrypsinC74-C7574-84CCVFIQENLNK1308.60752.18
TrypsinC189-C202180-196; 197-207ITGVTENGSCASILGDK - VTPESCASDNR2840.30372.39
AspNC74-C7570-86SREKCCVFIQENLNKTT2010.97362.10
AspNC88-C8887-92; 87-92DCSVNL - DCSVNL1297.53992.63
AspNC122-C210121-133; 205-221DCGRKGATLLLIQ - DNRWICQKELNHETPSN3468.71112.51
AspNC189-C202176-194; 195-204DVLKITGVTENGSCASILG - DKVTPESCAS2910.40710.12
GluCC74-C7573-80KCCVFIQE967.43762.25
GluCC94-C10594-116CPQDWLSHRDKCFQVSHVSNTWE2826.28752.02
GluC(C122-C202; C189-C210); (C122-C210; C189-C202) 118-137; 186-200; 201-213GQADCGRKGATLLLIQDQEE -NGSCASILGDKVTPE - SCASDNRWICQKE5169.37104.20
Nkrp1c2ECTO
TrypsinC74-C7574-84CCVFIQENLNK1308.6075 2.65
Trypsin(C91-C102; C119-C207); (C91-C119; C102-C207) 85-99; 102-121; 205-209TTVNLECPQDWLLHR - CFHVSQVSNTWEEGQADCGR - WICQK4749.14291.26
TrypsinC186-C199177-193; 194-204ITGVTENGSCASILGDK - VTPESCASDNR2840.30372.28
AspN(C74-C75; C91-C102); (C74-C91; C75-C102); (C74-C102; C75-C91)70-93; 100-117SREKCCVFIQENLNKTTVNLECPQ - DKCFHVSQVSNTWEEGQA4856.21710.77
AspNC119-C207118-130; 202-218DCGRKGATLLLIQ - DNRWICQKELNHETPSN3468.71112.02
AspNC186-C199173-191; 192-201DVLKITGVTENGSCASILG - DKVTPESCAS2910.40712.03
GluCC74-C7573-80KCCVFIQE967.43762.94
GluCC91-C10291-113CPQDWLLHRDKCFHVSQVSNTWE2826.28753.70
GluC(C119-C199; C189-C207); (C119-C207; C119-C189)115-134; 183-197; 198-210GQADCGRKGATLLLIQDQEE - NGSCASILGDKVTPE - SCASDNRWICQKE5169.37594.26
Nkrp1fECTO
TrypsinC74-C7474-82; 74-82CSVAAQENR - CSVAAQENR1951.87090.31
TrypsinC94-C10586-96; 105-113SAILECPR – CLFVSQISR1937.99280.6
AspNC122-C210120-125; 205-212DACSME – DNHWICQK1695.65351.2
AspNC189-C202186-204ENSCAIISHTEVFSDSCSS2031.82950.8
Figure A4. Structural models of Nkrp1aECTO and Nkrp1c1ECTO proteins. Ribbon diagrams of Nkrp1aECTO (A) and Nkrp1c1ECTO (C) with the stalk regions indicated in cyan. The molecular surfaces of Nkrp1aECTO (B) and Nkrp1c1ECTO (D) are represented in faint gray, and the stalk regions in cyan. Cysteine residues are shown in red.
Ijms 20 01884 g0a4

References

  1. Vivier, E.; Tomasello, E.; Baratin, M.; Walzer, T.; Ugolini, S. Functions of natural killer cells. Nat. Immunol. 2008, 9, 503–510. [Google Scholar] [CrossRef]
  2. Vivier, E.; Raulet, D.H.; Moretta, A.; Caligiuri, M.A.; Zitvogel, L.; Lanier, L.L.; Yokoyama, W.M.; Ugolini, S. Innate or adaptive immunity? The example of natural killer cells. Science 2011, 331, 44–49. [Google Scholar] [CrossRef] [PubMed]
  3. Lanier, L.L. NK cell receptors. Annu. Rev. Immunol. 1998, 16, 359–393. [Google Scholar] [CrossRef] [PubMed]
  4. Giorda, R.; Trucco, M. Mouse NKR-P1. A family of genes selectively coexpressed in adherent lymphokine-activated killer cells. J. Immunol. 1991, 147, 1701–1708. [Google Scholar]
  5. Giorda, R.; Rudert, W.A.; Vavassori, C.; Chambers, W.H.; Hiserodt, J.C.; Trucco, M. NKR-P1, a signal transduction molecule on natural killer cells. Science 1990, 249, 1298–1300. [Google Scholar] [CrossRef] [PubMed]
  6. Chambers, W.H.; Vujanovic, N.L.; DeLeo, A.B.; Olszowy, M.W.; Herberman, R.B.; Hiserodt, J.C. Monoclonal antibody to a triggering structure expressed on rat natural killer cells and adherent lymphokine-activated killer cells. J. Exp. Med. 1989, 169, 1373–1389. [Google Scholar] [CrossRef] [PubMed] [Green Version]
  7. Ryan, J.C.; Niemi, E.C.; Goldfien, R.D.; Hiserodt, J.C.; Seaman, W.E. NKR-P1, an activating molecule on rat natural killer cells, stimulates phosphoinositide turnover and a rise in intracellular calcium. J. Immunol. 1991, 147, 3244–3250. [Google Scholar]
  8. Yokoyama, W.M.; Ryan, J.C.; Hunter, J.J.; Smith, H.R.; Stark, M.; Seaman, W.E. cDNA cloning of mouse NKR-P1 and genetic linkage with LY-49. Identification of a natural killer cell gene complex on mouse chromosome 6. J. Immunol. 1991, 147, 3229–3236. [Google Scholar] [PubMed]
  9. Kveberg, L.; Dai, K.-Z.; Inngjerdingen, M.; Brooks, C.G.; Fossum, S.; Vaage, J.T. Phylogenetic and functional conservation of the NKR-P1F and NKR-P1G receptors in rat and mouse. Immunogenetics 2011, 63, 429–436. [Google Scholar] [CrossRef] [Green Version]
  10. Kveberg, L.; Dai, K.-Z.; Westgaard, I.H.; Daws, M.R.; Fossum, S.; Naper, C.; Vaage, J.T. Two major groups of rat NKR-P1 receptors can be distinguished based on chromosomal localization, phylogenetic analysis and Clr ligand binding. Eur. J. Immunol. 2009, 39, 541–551. [Google Scholar] [CrossRef] [Green Version]
  11. Plougastel, B.; Matsumoto, K.; Dubbelde, C.; Yokoyama, W.M. Analysis of a 1-Mb BAC contig overlapping the mouse Nkrp1 cluster of genes: Cloning of three new Nkrp1 members, Nkrp1d, Nkrp1e, and Nkrp1f. Immunogenetics 2001, 53, 592–598. [Google Scholar] [CrossRef]
  12. Kung, S.K.; Su, R.C.; Shannon, J.; Miller, R.G. The NKR-P1B gene product is an inhibitory receptor on SJL/J NK cells. J. Immunol. 1999, 162, 5876–5887. [Google Scholar]
  13. Glimcher, L.; Shen, F.W.; Cantor, H. Identification of a cell-surface antigen selectively expressed on the natural killer cell. J. Exp. Med. 1977, 145, 1–9. [Google Scholar] [CrossRef] [Green Version]
  14. Sentman, C.L.; Hacjett, J.; Moore, T.A.; Tutt, M.M.; Bennett, M.; Kumar, V. Pan Natural Killer Cell Monoclonal Antibodies and Their Relationship to the NK1.1 Antigen. Hybridoma 1989, 8, 605–614. [Google Scholar] [CrossRef]
  15. Karlhofer, F.M.; Yokoyama, W.M. Stimulation of murine natural killer (NK) cells by a monoclonal antibody specific for the NK1.1 antigen. IL-2-activated NK cells possess additional specific stimulation pathways. J. Immunol. 1991, 146, 3662–3673. [Google Scholar]
  16. Burton, R.C.; Smart, Y.C.; Koo, G.C.; Winn, H.J. Studies on murine natural killer (NK) cells. V. Genetic analysis of NK cell markers. Cell. Immunol. 1991, 135, 445–453. [Google Scholar] [CrossRef]
  17. Ryan, J.C.; Turck, J.; Niemi, E.C.; Yokoyama, W.M.; Seaman, W.E. Molecular cloning of the NK1.1 antigen, a member of the NKR-P1 family of natural killer cell activation molecules. J. Immunol. 1992, 149, 1631–1635. [Google Scholar]
  18. Iizuka, K.; Naidenko, O.V.; Plougastel, B.F.M.; Fremont, D.H.; Yokoyama, W.M. Genetically linked C-type lectin-related ligands for the NKRP1 family of natural killer cell receptors. Nat. Immunol. 2003, 4, 801–807. [Google Scholar] [CrossRef]
  19. Carlyle, J.R.; Jamieson, A.M.; Gasser, S.; Clingan, C.S.; Arase, H.; Raulet, D.H. Missing self-recognition of Ocil/Clr-b by inhibitory NKR-P1 natural killer cell receptors. Proc. Natl. Acad. Sci. USA 2004, 101, 3527–3532. [Google Scholar] [CrossRef] [Green Version]
  20. Plougastel, B.; Dubbelde, C.; Yokoyama, W.M. Cloning of Clr, a new family of lectin-like genes localized between mouse Nkrp1a and Cd69. Immunogenetics 2001, 53, 209–214. [Google Scholar] [CrossRef]
  21. Aguilar, O.A.; Berry, R.; Rahim, M.M.A.; Reichel, J.J.; Popović, B.; Tanaka, M.; Fu, Z.; Balaji, G.R.; Lau, T.N.H.; Tu, M.M.; et al. A Viral Immunoevasin Controls Innate Immunity by Targeting the Prototypical Natural Killer Cell Receptor Family. Cell 2017, 169, 58–71.e14. [Google Scholar] [CrossRef] [Green Version]
  22. Zelensky, A.N.; Gready, J.E. The C-type lectin-like domain superfamily. FEBS J. 2005, 272, 6179–6217. [Google Scholar] [CrossRef] [PubMed] [Green Version]
  23. Lu, K.; Guidotti, G. Identification of the cysteine residues involved in the class I disulfide bonds of the human insulin receptor: properties of insulin receptor monomers. Mol. Biol. Cell 1996, 7, 679–691. [Google Scholar] [CrossRef] [PubMed]
  24. Zal, T.; Gascoigne, N.R. Using live FRET imaging to reveal early protein–protein interactions during T cell activation. Curr. Opin. Immunol. 2004, 16, 418–427. [Google Scholar] [CrossRef] [PubMed]
  25. Bader, A.N.; Hofman, E.G.; Voortman, J.; van Bergen en Henegouwen, P.M.P.; Gerritsen, H.C. Homo-FRET imaging enables quantification of protein cluster sizes with subcellular resolution. Biophys. J. 2009, 97, 2613–2622. [Google Scholar] [CrossRef] [PubMed]
  26. Pompach, P.; Man, P.; Kavan, D.; Hofbauerová, K.; Kumar, V.; Bezouška, K.; Havlíček, V.; Novák, P. Modified electrophoretic and digestion conditions allow a simplified mass spectrometric evaluation of disulfide bonds. J. Mass Spectrom. 2009, 44, 1571–1578. [Google Scholar] [CrossRef]
  27. Angers, S.; Salahpour, A.; Bouvier, M. Dimerization: an emerging concept for G protein-coupled receptor ontogeny and function. Annu. Rev. Pharmacol. Toxicol. 2002, 42, 409–435. [Google Scholar] [CrossRef]
  28. Gomes, I.; Jordan, B.A.; Gupta, A.; Rios, C.; Trapaidze, N.; Devi, L.A. G protein coupled receptor dimerization: implications in modulating receptor function. J. Mol. Med. 2001, 79, 226–242. [Google Scholar] [CrossRef]
  29. Middleton, R.E.; Pheasant, D.J.; Miller, C. Homodimeric architecture of a CIC-type chloride ion channel. Nature 1996, 383, 337–340. [Google Scholar] [CrossRef]
  30. Ward, C.W.; Menting, J.G.; Lawrence, M.C. The insulin receptor changes conformation in unforeseen ways on ligand binding: Sharpening the picture of insulin receptor activation. BioEssays 2013, 35, 945–954. [Google Scholar] [CrossRef]
  31. Schlessinger, J. Cell Signaling by Receptor Tyrosine Kinases. Cell 2000, 103, 211–225. [Google Scholar] [CrossRef] [Green Version]
  32. Postel-Vinay, M.C.; Finidori, J. Growth hormone receptor: Structure and signal transduction. Eur. J. Endocrinol. 1995, 133, 654–659. [Google Scholar] [CrossRef] [PubMed]
  33. Ward, L.D.; Hammacher, A.; Howlett, G.J.; Matthews, J.M.; Fabri, L.; Moritz, R.L.; Nice, E.C.; Weinstock, J.; Simpson, R.J. Influence of interleukin-6 (IL-6) dimerization on formation of the high affinity hexameric IL-6.receptor complex. J. Biol. Chem. 1996, 271, 20138–20144. [Google Scholar] [CrossRef]
  34. Bochtler, M.; Ditzel, L.; Groll, M.; Hartmann, C.; Huber, R. The proteasome. Annu. Rev. Biophys. Biomol. Struct. 1999, 28, 295–317. [Google Scholar] [CrossRef]
  35. Bentley, G.A.; Lewit-Bentley, A.; Finch, J.T.; Podjarny, A.D.; Roth, M. Crystal structure of the nucleosome core particle at 16 Å resolution. J. Mol. Biol. 1984, 176, 55–75. [Google Scholar] [CrossRef]
  36. Matadeen, R.; Patwardhan, A.; Gowen, B.; Orlova, E.V.; Pape, T.; Cuff, M.; Mueller, F.; Brimacombe, R.; van Heel, M. The Escherichia coli large ribosomal subunit at 7.5 Å resolution. Structure 1999, 7, 1575–1583. [Google Scholar] [CrossRef] [Green Version]
  37. Adámková, L.; Institute of Microbiology, Prague, Czech Republic. Life cell imaging of Nkrp1 proteins at the surface of COS-7, RAW264.7 and HeLa cells. Unpublished work. 2015. [Google Scholar]
  38. Rozbesky, D.; Man, P.; Kavan, D.; Chmelik, J.; Cerny, J.; Bezouska, K.; Novak, P. Chemical cross-linking and H/D exchange for fast refinement of protein crystal structure. Anal. Chem. 2012, 84, 867–870. [Google Scholar] [CrossRef]
  39. Rozbeský, D.; Adámek, D.; Pospíšilová, E.; Novák, P.; Chmelík, J. Solution structure of the lymphocyte receptor Nkrp1a reveals a distinct conformation of the long loop region as compared to in the crystal structure. Proteins 2016, 84, 1304–1311. [Google Scholar] [CrossRef] [PubMed]
  40. Kolenko, P.; Rozbeský, D.; Vaněk, O.; Kopecký, V.; Hofbauerová, K.; Novák, P.; Pompach, P.; Hašek, J.; Skálová, T.; Bezouška, K.; et al. Molecular architecture of mouse activating NKR-P1 receptors. J. Struct. Biol. 2011, 175, 434–441. [Google Scholar] [CrossRef] [PubMed]
  41. Spreu, J.; Kuttruff, S.; Stejfova, V.; Dennehy, K.M.; Schittek, B.; Steinle, A. Interaction of C-type lectin-like receptors NKp65 and KACL facilitates dedicated immune recognition of human keratinocytes. Proc. Natl. Acad. Sci. USA 2010, 107, 5100–5105. [Google Scholar] [CrossRef] [Green Version]
  42. Li, Y.; Mariuzza, R.A. Structural basis for recognition of cellular and viral ligands by NK cell receptors. Front. Immunol. 2014, 5, 1–20. [Google Scholar] [CrossRef]
  43. Luken, B.M.; Winn, L.Y.N.; Emsley, J.; Lane, D.A.; Crawley, J.T.B. The importance of vicinal cysteines, C1669 and C1670, for von Willebrand factor A2 domain function. Blood 2010, 115, 4910–4913. [Google Scholar] [CrossRef] [Green Version]
  44. Miller, S.M.; Moore, M.J.; Massey, V.; Williams, C.H.; Distefano, M.D.; Ballou, D.P.; Walsh, C.T. Evidence for the participation of Cys558 and Cys559 at the active site of mercuric reductase. Biochemistry 1989, 28, 1194–1205. [Google Scholar] [CrossRef]
  45. Blake, C.C.; Ghosh, M.; Harlos, K.; Avezoux, A.; Anthony, C. The active site of methanol dehydrogenase contains a disulphide bridge between adjacent cysteine residues. Nat. Struct. Biol. 1994, 1, 102–105. [Google Scholar] [CrossRef]
  46. Klco, J.M.; Lassere, T.B.; Baranski, T.J. C5a receptor oligomerization. I. Disulfide trapping reveals oligomers and potential contact surfaces in a G protein-coupled receptor. J. Biol. Chem. 2003, 278, 35345–35353. [Google Scholar] [CrossRef]
  47. Back, J.; Malchiodi, E.L.; Cho, S.; Scarpellino, L.; Schneider, P.; Kerzic, M.C.; Mariuzza, R.A.; Held, W. Distinct conformations of Ly49 natural killer cell receptors mediate MHC class I recognition in trans and cis. Immunity 2009, 31, 598–608. [Google Scholar] [CrossRef]
  48. Held, W.; Mariuzza, R.A. Cis interactions of immunoreceptors with MHC and non-MHC ligands. Nat. Rev. Immunol. 2008, 8, 269–278. [Google Scholar] [CrossRef] [Green Version]
  49. Dai, Y.; Walker, S.A.; de Vet, E.; Cook, S.; Welch, H.C.E.; Lockyer, P.J. Ca2+-dependent monomer and dimer formation switches CAPRI Protein between Ras GTPase-activating protein (GAP) and RapGAP activities. J. Biol. Chem. 2011, 286, 19905–19916. [Google Scholar] [CrossRef]
  50. Carlyle, J.R.; Martin, A.; Mehra, A.; Attisano, L.; Tsui, F.W.; Zúñiga-Pflücker, J.C. Mouse NKR-P1B, a novel NK1.1 antigen with inhibitory function. J. Immunol. 1999, 162, 5917–5923. [Google Scholar]
  51. Balaji, G.R.; Aguilar, O.A.; Tanaka, M.; Shingu-Vazquez, M.A.; Fu, Z.; Gully, B.S.; Lanier, L.L.; Carlyle, J.R.; Rossjohn, J.; Berry, R. Recognition of host Clr-b by the inhibitory NKR-P1B receptor provides a basis for missing-self recognition. Nat. Commun. 2018, 9, 4623. [Google Scholar] [CrossRef]
  52. Xiao, J.H.; Davidson, I.; Matthes, H.; Garnier, J.-M.; Chambon, P. Cloning, expression, and transcriptional properties of the human enhancer factor TEF-1. Cell 1991, 65, 551–568. [Google Scholar] [CrossRef]
  53. Rozbeský, D.; Kavan, D.; Chmelík, J.; Novák, P.; Vaněk, O.; Bezouška, K. High-level expression of soluble form of mouse natural killer cell receptor NKR-P1C(B6) in Escherichia coli. Protein Expr. Purif. 2011, 77, 178–184. [Google Scholar] [CrossRef] [PubMed]
  54. Chum, T.; Glatzová, D.; Kvíčalová, Z.; Malínský, J.; Brdička, T.; Cebecauer, M. The role of palmitoylation and transmembrane domain in sorting of transmembrane adaptor proteins. J. Cell Sci. 2016, 129, 95–107. [Google Scholar] [CrossRef] [PubMed]
  55. Hernychová, L.; Mrázek, H.; Ivanova, L.; Kukačka, Z.; Chmelík, J.; Novák, P. Recombinant expression, in vitro refolding and characterizing disulfide bonds of a mouse inhibitory C-type lectin-like receptor Nkrp1b. Physiol. Res. 2015, 64 (Suppl. 1), S85–S93. [Google Scholar]
  56. Koshioka, M.; Sasaki, K.; Masuhara, H. Time-Dependent Fluorescence Depolarization Analysis in Three-Dimensional Microspectroscopy. Appl. Spectrosc. 1995, 49, 224–228. [Google Scholar] [CrossRef]
  57. Digman, M.A.; Caiolfa, V.R.; Zamai, M.; Gratton, E. The phasor approach to fluorescence lifetime imaging analysis. Biophys. J. 2008, 94, L14–L16. [Google Scholar] [CrossRef]
Figure 1. Subcellular localization of EGFP-Nkrp1 fusion proteins in living Jurkat T cells. Confocal laser scanning microscopy (CLSM) images of Jurkat cells transfected with (A) EGFP-Nkrp1a, (B) EGFP-Nkrp1c1, (C) EGFP-Nkrp1c2, and (D) EGFP-Nkrp1f. Left part of each panel shows the image from EGFP channel and right part the corresponding bright-field image. Scale bars: 5 µm.
Ijms 20 01884 g001
Figure 2. Homo-FRET measurements of EGFP-Nkrp1 proteins in living Jurkat cells. (A) Dot plot of steady-state anisotropy, rss, of Nkrp1a, c1, c2 and f isoforms as compared to the monomeric (LAT) and dimeric (CD8α) controls. (B) Assessment of the steady-state anisotropy values of mutants Nkrp1/a_C74S,/a_C88S,/a_C74,88S, Nkrp1c1_C74,75S and Nrkp1f_C74S with their native counterparts. The red line marks median of the whole set and the bottom and top edges of the box indicate the 25th and 75th percentiles, respectively. The whiskers extend to the most extreme data points not considered outliers. Statistical significance of differences is marked with asterisks: p < 0.00 ***, p < 0.0001 ****, ‘n.s.’ not significant. All median steady-state anisotropy and p-values are in the Appendix A Table A2 and Table A3, respectively. (C) Scheme showing cysteine residues in the stalk region and their serine mutants (yellow).
Ijms 20 01884 g002
Figure 3. Analysis of EGFP-Nkrp1 fusion proteins by immunoblotting of reducing and non-reducing SDS-PAGE. (A) Immunoblotting of EGFP-Nkrp1 proteins transiently expressed in COS-7 cells, lysed and separated by SDS-PAGE under reducing conditions (100 mM DTT). All EGFP-Nkrp1 fusion proteins appear as monomers (apparent at 40-60 kDa). (B) Samples as in A were separated by SDS-PAGE under non-reducing conditions. EGFP-Nkrp1 fusion proteins appear as monomers, dimers and higher order oligomers with different ratio between these populations. Molecular markers are to the left of the panels. Regions corresponding to the Nkrp1 monomers and dimers, as well as EGFP only are indicated to the right. The negative control corresponds to untransfected COS-7 cells treated as all other samples. For positive control, EGFP transiently expressed in COS-7 cells was used. (C) Loading control: immunoblotting of β-actin detected by specific antibody at 1:1500 dilution.
Ijms 20 01884 g003
Figure 4. Analysis of purified recombinant Nkrp1ECTO proteins. Fractions from size-exclusion chromatography of the Nkrp1ECTO proteins were analyzed by 15% SDS-PAGE. Proteins appeared homogenous under reducing and non-reducing conditions. Nkrp1c1ECTO and Nkrp1fECTO isoforms have formed a dimer under non-reducing conditions (≈ 35 kDa).
Ijms 20 01884 g004
Figure 5. Cysteine disulfide bonds determined for the recombinant Nkrp1ECTO proteins. Schematic illustration of intramolecular disulfide bonds of murine recombinant Nkrp1ECTO proteins studied by LC-MS. A stalk region is indicated in blue, the extracellular C-Type Lectin-like Domain in gray (predicted by InterProScan tool) and cysteine residues involved in intermolecular bonding are in red boxes.
Ijms 20 01884 g005
Table 1. Monoisotopic masses of intact Nkrp1ECTO proteins measured by ESI-FT-ICR mass spectrometry.
ProteinExperimental [M + H]+, Daltons(error, ppm)
Native FormReduced Form
Nkrp1aECTO18168.5538 (0.03)18176.6566 (2.18)
Nkrp1c1ECTO monomer modified by cysteamine binding17678.3851 (0.01)17611.4335 (0.01)
Nkrp1c1ECTO dimer35204.4478 (7.91)17611.5326 (5.63)
Nkrp1c2ECTO17298.3286 (1.50)17306.4254 (3.47)
Nkrp1fECTO monomer modified by cysteamine binding17713.9178 (2.21)17644.9799 (0.55)
Nkrp1fECTO dimer35274.7974 (1.84)17644.9904 (0.05)

